Embed Size (px)
Citation preview

DRAFT
SAN DIEGO DISTRIBUTED SOLAR PV IMPACT STUDY
B&V PROJECT NO. 176941
PREPARED FOR
UNIVERSITY OF SAN DIEGO
Energy Policy Initiatives Center 9 JULY 2013
®
®
©Bl
ack
& V
eatc
h Ho
ldin
g Co
mpa
ny 2
012.
All
right
s res
erve
d.
Energy Policy Initiatives Center | SAN DIEGO DISTRIBUTED SOLAR PV IMPACT STUDY
BLACK & VEATCH | Legal Notice LN-1
Principal Investigators
Black & Veatch Tim Mason, Project Manager Dan Wilson Fred Jennings Jon Previtali Elizabeth Waldren
Clean Power Research Ben Norris Tom Hoff
Acknowledgements:
Scott Anders, University of San Diego, Energy Policy Initiative Center San Diego Solar Stakeholder Collaboration Group
Aspen Environmental Group B. Chris Brewster, homeowner Baker Electric, Inc Best, Best & Krieger, LLP California Assembly Member Toni Atkins' Office California Center for Sustainable Energy California Energy Commission California Farm Bureau California Public Utilities Commission - Energy Division California Public Utilities Commission Division of Ratepayer Advocate California Senate Member Christine Kehoe's Office (39th District) California Sierra Club California Solar Energy Industries Association Christensen Consulting City of Chula Vista City of San Diego - Mayor's Office CleanTech San Diego Clean Coalition County of San Diego County of San Diego - Chairman Roberts' Office Energy Policy Initiatives Center (EPIC) Goodin, McBride Grid Alternatives Home Energy Systems Independent Energy Solutions Keys, Fox & Wiedman KYOCERA Lemon Grove School District MRW & Associates National Consumer Law Center National Electric Contractors Association NECA San Diego Natural Resources Defense Council Pacific Gas & Electric
Energy Policy Initiatives Center | SAN DIEGO DISTRIBUTED SOLAR PV IMPACT STUDY
BLACK & VEATCH | Legal Notice LN-2
Residential Solar Customer Sacramento Municipal Utility District San Diego Association of Governments (SANDAG) Energy Working Group San Diego County Water Authority San Diego Gas & Electric San Diego International Airport San Diego Regional Chamber of Commerce San Diego Regional Chamber of Commerce San Diego Regional Economic Development Corporation San Diego Unified School District Shell Energy Sierra Club SO County Taxpayers Association SO Solar Coalition Solar Energy Power Association Solar Energy Industries Association Southern California Edison Company Sullivan Solar Power Supervisor Jacobs' Office TelStar Energies The Utility Reform Network The Vote Solar Initiative Union of Concerned Scientists URS Corp US Green Building Council US Green Building Council - San Diego Utility Consumers Action Network Valley Center Water District
Energy Policy Initiatives Center | SAN DIEGO DISTRIBUTED SOLAR PV IMPACT STUDY
BLACK & VEATCH | Legal Notice LN-3
Table of Contents List of Tables ........................................................................................................................................................... 5 List of Figures .......................................................................................................................................................... 6 Legal Notice.............................................................................................................................................................. 7 Glossary of Terms .................................................................................................................................................. 8 1.0 Executive Summary .............................................................................................................................. 10
1.1 Introduction and Background .......................................................................................................... 10 1.2 Methodology ............................................................................................................................................ 11 1.3 Results ........................................................................................................................................................ 12
2.0 Introduction ............................................................................................................................................ 15 2.1 Background and Objectives ............................................................................................................... 16 2.2 Stakeholder Process .............................................................................................................................. 17 2.3 Approach .................................................................................................................................................... 18 2.4 Data and Data Sources ......................................................................................................................... 20 2.5 Relationship to Other Initiatives ..................................................................................................... 21
3.0 Methodology ........................................................................................................................................... 22 3.1 Overview .................................................................................................................................................... 22
3.1.1 Services Provided by the Utility to the PV NEM Customer ................................ 22 3.1.2 Services Provided by the Distributed PV Customer to the Utility .................. 23 3.1.3 Utility Costs Not Included in This Study .................................................................... 23
3.2 PV Fleet Modeling Methodologies and Data ............................................................................... 23 3.2.1 Background ........................................................................................................................... 24 3.2.2 Base Fleet Definition .......................................................................................................... 25 3.2.3 Rating Convention .............................................................................................................. 26 3.2.4 Fleet Production Datasets ............................................................................................... 26 3.2.5 Evaluation of Solar Resource in 2012......................................................................... 27 3.2.6 Effective PV Capacity ......................................................................................................... 28 3.2.7 Resource Adequacy Capacity ......................................................................................... 29 3.2.8 Peak Load Reduction ......................................................................................................... 30 3.2.9 Effective Capacity in Future Years ............................................................................... 31 3.2.10 Fleet Variability ................................................................................................................... 32
3.3 Services ...................................................................................................................................................... 36 3.3.1 Energy ...................................................................................................................................... 36 3.3.2 Resource Adequacy Capacity ......................................................................................... 40 3.3.3 Ancillary Services ................................................................................................................ 42 3.3.4 RPS Procurement ................................................................................................................ 44 3.3.5 Grid Management ................................................................................................................ 46 3.3.6 Transmission Capacity ...................................................................................................... 48 3.3.7 Transmission O&M ............................................................................................................. 49
Energy Policy Initiatives Center | SAN DIEGO DISTRIBUTED SOLAR PV IMPACT STUDY
BLACK & VEATCH | Legal Notice LN-4
3.3.8 Distribution Station Capacity ......................................................................................... 50 3.3.9 Distribution Line Capacity ............................................................................................... 52 3.3.10 Distribution Voltage Regulation and Reactive Supply ......................................... 53 3.3.11 Distribution O&M ................................................................................................................ 55 3.3.12 Interconnection ................................................................................................................... 57 3.3.13 Metering/Billing/Administration/Customer Service .......................................... 62
3.4 Societal Costs and Benefits of Distributed PV ............................................................................ 63 4.0 Results ....................................................................................................................................................... 69
4.1 Cost of Service Results Summary .................................................................................................... 69 4.1.1 Net Cost of Distributed PV Customers........................................................................ 69 4.1.2 Discussion of Results ......................................................................................................... 70
4.2 Detailed Annual Cost of Service Results ....................................................................................... 74 Appendix A. Marginal Loss Methodology .............................................................................................. A-1

Energy Policy Initiatives Center | SAN DIEGO DISTRIBUTED SOLAR PV IMPACT STUDY
BLACK & VEATCH | Legal Notice LN-5
List of Tables Table 1. List of Services ....................................................................................................................................................... 11Table 2. Summary of 2012 Utility Costs and Distributed PV Value by Service ............................................ 14Table 3. Summary of PV Fleet Modeling Methodology and Data Sources ...................................................... 24Table 4. Example System Rating Calculation .................................................................................................................. 26Table 5. HFEM and HFET Datasets ................................................................................................................................. 27Table 6. Future Year Growth Assumptions ................................................................................................................. 32Table 7. Future Year Effective Capacity Values ......................................................................................................... 32Table 8. List of Services ....................................................................................................................................................... 36Table 9. Utility Costs for Energy ...................................................................................................................................... 39Table 10. Utility Avoided Costs for Energy ................................................................................................................. 39Table 11. Net Annual Capacity Cost Calculations ..................................................................................................... 41Table 12. Utility Costs for Resource Adequacy Capacity ....................................................................................... 41Table 13. Utility Avoided Costs for Resource Adequacy Capacity ..................................................................... 42Table 14. Utility Costs for Ancillary Services ............................................................................................................. 44Table 15. Utility Costs for RPS Procurement .............................................................................................................. 45Table 16. Utility Avoided Costs for RPS Procurement ........................................................................................... 46Table 17. Utility Costs for Grid Management ............................................................................................................. 47Table 18. Utility Avoided Costs for Grid Management ........................................................................................... 47Table 19. Utility Costs for Transmission Capacity ................................................................................................... 48Table 20. Utility Avoided Costs for Transmission Capacity ................................................................................. 49Table 21. Utility Costs for Transmission O&M .......................................................................................................... 50Table 22. Utility Costs for Distribution Station Capacity ...................................................................................... 51Table 23. Utility Avoided Costs for Distribution Station Capacity .................................................................... 51Table 24. Utility Costs for Distribution Line Capacity ............................................................................................ 52Table 25. SDG&E Forecast of Distribution Circuits with PV Penetration Greater Than 25
Percent ........................................................................................................................................................ 54Table 26. Utility Costs for Distribution Voltage Regulation and Reactive Supply ...................................... 55Table 27. Utility Costs for Distribution O&M ............................................................................................................. 57Table 28. NEM Interconnection and Administrative Program Cost Categories .......................................... 58Table 29. Fixed and Variable NEM Program and Interconnection Costs ....................................................... 60Table 30. Historical and Forecasted Annual NEM PV Installations .................................................................. 61Table 31. Utility Costs for Interconnection ................................................................................................................. 62Table 32. Utility Costs for Metering/Billing/Administration/Customer Service ....................................... 63Table 33. Societal Benefits of Distributed PV ............................................................................................................. 65Table 34. Societal Costs of Distributed PV .................................................................................................................. 67Table 35 Summary of 2012 Utility Costs and Distributed PV Value by Service .......................................... 69Table 36 Detailed Annual Summary of Utility Costs ............................................................................................... 75Table 37 Detailed Annual Summary of Distributed PV Value ............................................................................. 76Table 38. DLF Sample Data .............................................................................................................................................. A-1

Energy Policy Initiatives Center | SAN DIEGO DISTRIBUTED SOLAR PV IMPACT STUDY
BLACK & VEATCH | Legal Notice LN-6
List of Figures Figure 1.Projected Cumulative Distributed PV Installations and Capacity, 2012-2021 .......................... 10Table 2. Comparison of Utility Cost and Distributed PV Value by Year .......................................................... 14Figure 3. Forecasted SDG&E Distributed PV Fleet Capacity (MW-AC), 2012-2021 ................................... 15Figure 4. Electric Grid Diagram with Utility and PV NEM Customer Services Listed ................................ 19Figure 5. SDG&E Distributed PV Fleet Capacity Over Time ................................................................................. 26Figure 6. Map of Distributed PV Systems and Sample Cities in SDG&E Territory ...................................... 27Figure 7. AC Capacity Factors for 10 Sample PV Systems Through SDG&E Territory (1998-
2012) ........................................................................................................................................................... 28Figure 8. PV Fleet Output Compared to Single Representative System with Different Solar
Resource Datasets and SDG&E Load, Peak Load Day (September 14, 2012) ............... 29Figure 9. Peak Day Load ...................................................................................................................................................... 31Figure 10. 15-minute SDG&E Distributed PV Fleet Power Output in 2012 .................................................. 33Figure 11. Absolute Ramp Rates in MW per Minute, SDG&E Distributed PV Fleet, 2012 ....................... 34Figure 12. Sorted Absolute Ramp Rates in MW per Minute, SDG&E Distributed PV Fleet,
2012 ............................................................................................................................................................. 34Figure 13. One-minute fleet and single system ramp rates, April 4, 2012. ................................................... 35Figure 14. Sample of Hourly Energy Price Data in 2012 from CAISO, with GHG Costs Added .............. 38Figure 15. Sample of Forecasted Hourly Energy Prices in 2013-2021 ........................................................... 38Figure 16. CAISO Grid Management Charge Rates Book Fee Table .................................................................. 47Figure 17Comparison of Utility Cost and Distributed PV Value by Year ........................................................ 70Figure 18 Utility Cost and Distributed PV Value for Resource Adequacy Capacity ($/kW-
year) ............................................................................................................................................................ 71Figure 19 Transmission Capacity Value ($/kW-year) ........................................................................................... 72Figure 20 Distributed Substation Capacity Value ($/kW-year) ......................................................................... 73Figure 21 Annual Interconnection Costs ($/kW-year) .......................................................................................... 74Figure 22. SDG&E Distribution Losses versus Customer Loads (2012) ....................................................... A-2
Energy Policy Initiatives Center | SAN DIEGO DISTRIBUTED SOLAR PV IMPACT STUDY
BLACK & VEATCH | Legal Notice LN-7
Legal Notice This report was prepared for the University of San Diego (USD) Energy Policy Initiative Center (EPIC) by Black & Veatch Corporation (Black & Veatch) and is based on information not within the control of Black & Veatch. In preparing this report, Black & Veatch has assumed that the information, both verbal and written, provided by others is complete and correct without independent verification. Black & Veatch does not guarantee the accuracy of the information, data or opinions contained in this report and does not represent or warrant that the information contained in this report is sufficient or appropriate for any purpose. This report should not be construed as an invitation or inducement to any party to engage or otherwise participate in any transaction, to provide any financing, or to make any investment.
Any information shared with EPIC prior to the release of the report is superseded by the Report. Black & Veatch owes no duty of care to any third party and none is created by this report. Use of this report, or any information contained therein, by a third party shall be at the risk of such party and constitutes a waiver and release of Black & Veatch its directors, officers, partners, employees and agents by such third party from and against all claims and liability, including, but not limited to, claims for breach of contract, breach of warranty, strict liability, negligence, negligent misrepresentation, and/or otherwise, and liability for special, incidental, indirect, or consequential damages, in connection with such use.
Energy Policy Initiatives Center | SAN DIEGO DISTRIBUTED SOLAR PV IMPACT STUDY
BLACK & VEATCH | Glossary of Terms 8
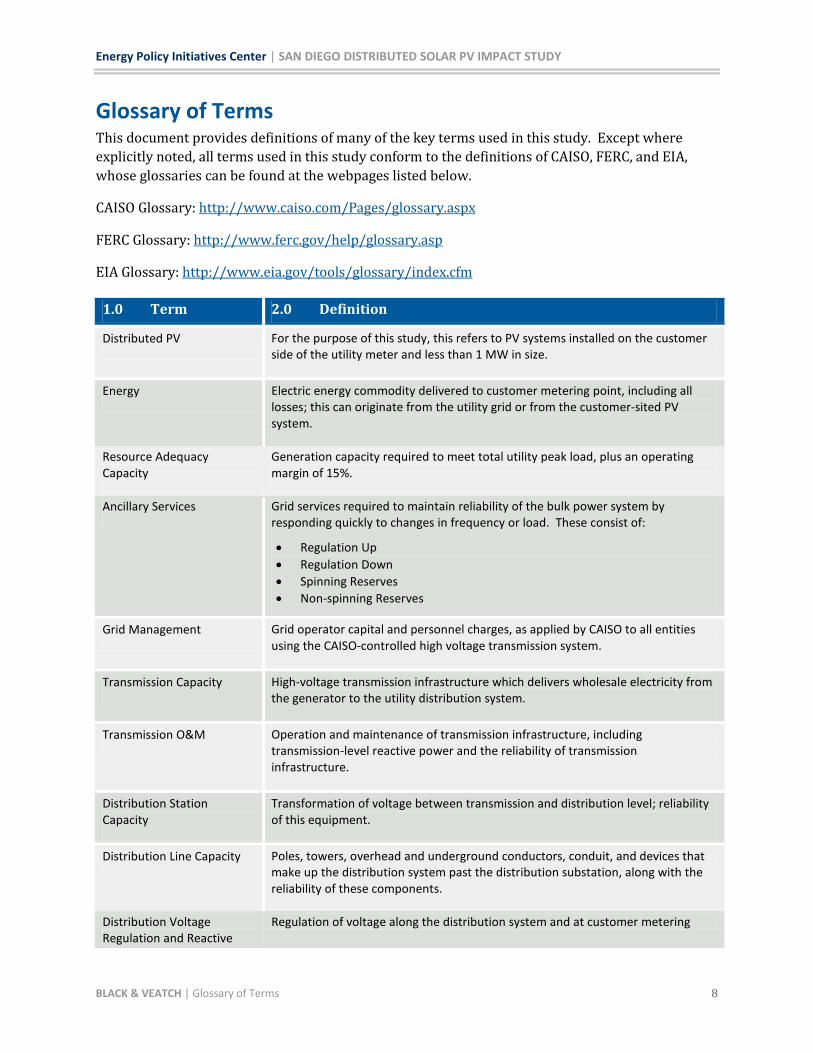
Glossary of Terms This document provides definitions of many of the key terms used in this study. Except where explicitly noted, all terms used in this study conform to the definitions of CAISO, FERC, and EIA, whose glossaries can be found at the webpages listed below.
CAISO Glossary: http://www.caiso.com/Pages/glossary.aspx
FERC Glossary: http://www.ferc.gov/help/glossary.asp
EIA Glossary: http://www.eia.gov/tools/glossary/index.cfm
1.0 Term 2.0 Definition
Distributed PV For the purpose of this study, this refers to PV systems installed on the customer side of the utility meter and less than 1 MW in size.
Energy Electric energy commodity delivered to customer metering point, including all losses; this can originate from the utility grid or from the customer-sited PV system.
Resource Adequacy Capacity
Generation capacity required to meet total utility peak load, plus an operating margin of 15%.
Ancillary Services Grid services required to maintain reliability of the bulk power system by responding quickly to changes in frequency or load. These consist of:
• Regulation Up • Regulation Down • Spinning Reserves • Non-spinning Reserves
Grid Management Grid operator capital and personnel charges, as applied by CAISO to all entities using the CAISO-controlled high voltage transmission system.
Transmission Capacity High-voltage transmission infrastructure which delivers wholesale electricity from the generator to the utility distribution system.
Transmission O&M Operation and maintenance of transmission infrastructure, including transmission-level reactive power and the reliability of transmission infrastructure.
Distribution Station Capacity
Transformation of voltage between transmission and distribution level; reliability of this equipment.
Distribution Line Capacity Poles, towers, overhead and underground conductors, conduit, and devices that make up the distribution system past the distribution substation, along with the reliability of these components.
Distribution Voltage Regulation and Reactive
Regulation of voltage along the distribution system and at customer metering
Energy Policy Initiatives Center | SAN DIEGO DISTRIBUTED SOLAR PV IMPACT STUDY
BLACK & VEATCH | Glossary of Terms 9
1.0 Term 2.0 Definition
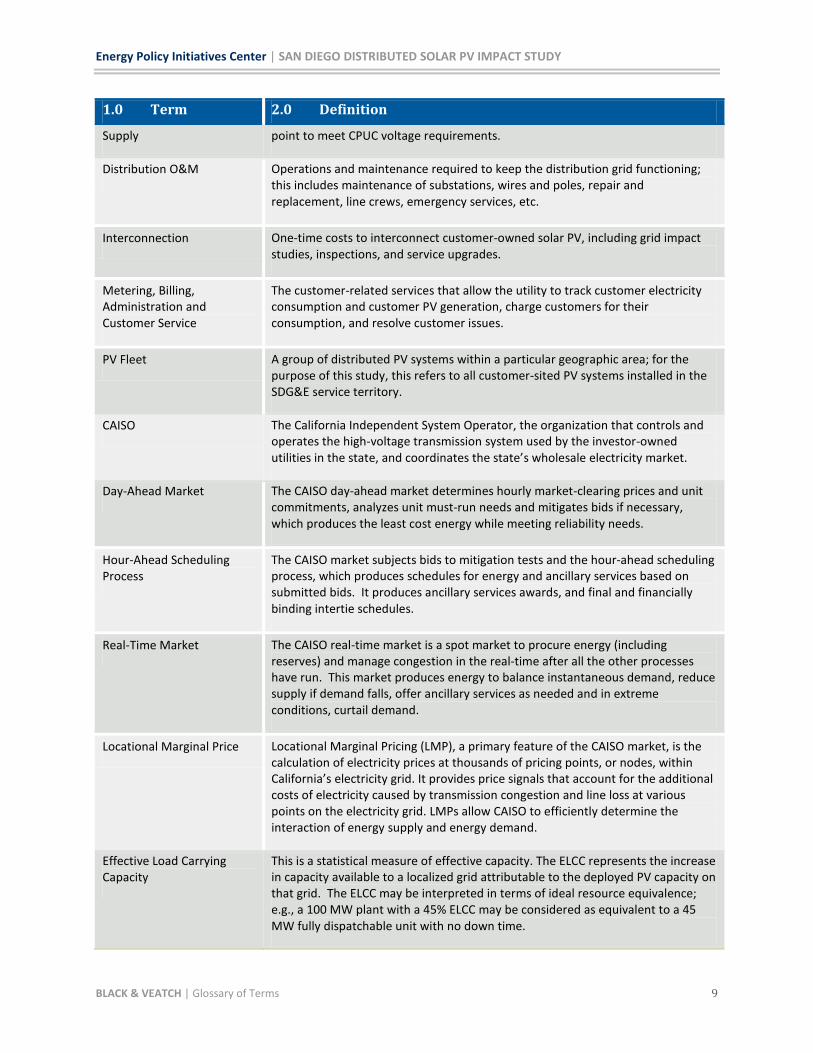
Supply point to meet CPUC voltage requirements.
Distribution O&M Operations and maintenance required to keep the distribution grid functioning; this includes maintenance of substations, wires and poles, repair and replacement, line crews, emergency services, etc.
Interconnection One-time costs to interconnect customer-owned solar PV, including grid impact studies, inspections, and service upgrades.
Metering, Billing, Administration and Customer Service
The customer-related services that allow the utility to track customer electricity consumption and customer PV generation, charge customers for their consumption, and resolve customer issues.
PV Fleet A group of distributed PV systems within a particular geographic area; for the purpose of this study, this refers to all customer-sited PV systems installed in the SDG&E service territory.
CAISO The California Independent System Operator, the organization that controls and operates the high-voltage transmission system used by the investor-owned utilities in the state, and coordinates the state’s wholesale electricity market.
Day-Ahead Market The CAISO day-ahead market determines hourly market-clearing prices and unit commitments, analyzes unit must-run needs and mitigates bids if necessary, which produces the least cost energy while meeting reliability needs.
Hour-Ahead Scheduling Process
The CAISO market subjects bids to mitigation tests and the hour-ahead scheduling process, which produces schedules for energy and ancillary services based on submitted bids. It produces ancillary services awards, and final and financially binding intertie schedules.
Real-Time Market The CAISO real-time market is a spot market to procure energy (including reserves) and manage congestion in the real-time after all the other processes have run. This market produces energy to balance instantaneous demand, reduce supply if demand falls, offer ancillary services as needed and in extreme conditions, curtail demand.
Locational Marginal Price Locational Marginal Pricing (LMP), a primary feature of the CAISO market, is the calculation of electricity prices at thousands of pricing points, or nodes, within California’s electricity grid. It provides price signals that account for the additional costs of electricity caused by transmission congestion and line loss at various points on the electricity grid. LMPs allow CAISO to efficiently determine the interaction of energy supply and energy demand.
Effective Load Carrying Capacity
This is a statistical measure of effective capacity. The ELCC represents the increase in capacity available to a localized grid attributable to the deployed PV capacity on that grid. The ELCC may be interpreted in terms of ideal resource equivalence; e.g., a 100 MW plant with a 45% ELCC may be considered as equivalent to a 45 MW fully dispatchable unit with no down time.

Energy Policy Initiatives Center | SAN DIEGO DISTRIBUTED SOLAR PV IMPACT STUDY
BLACK & VEATCH | Executive Summary 10
1.0 Executive Summary
1.1 INTRODUCTION AND BACKGROUND Black & Veatch Corporation (Black & Veatch) is pleased to provide this San Diego Distributed Solar Photovoltaic (PV) Impact Study Draft Report to the San Diego Solar Stakeholder Collaboration Group (Stakeholder Group). This report represents the culmination of efforts by the Stakeholder Group, the University of San Diego (USD) Energy Policy Initiatives Center (EPIC), Black & Veatch, and Clean Power Research to investigate certain aspects of distributed PV in the San Diego Gas & Electric Company (SDG&E) service territory over the next decade (Years 2012-2021). Specifically, this Draft Report identifies and estimates the annual costs of the services provided by SDG&E to distributed PV customers—i.e. those SDG&E customers who have chosen to install a PV system less than one MW on their property behind the utility meter (whether or not they participate in the SDG&E Net Energy Metering (NEM) tariff). It also identifies and quantifies the annual value of the services provided by the distributed PV customers to SDG&E. This work was performed by Black & Veatch and its subcontractor Clean Power Research (collectively referred to as the Study Team) under contract with USD EPIC.
The study team stresses that this study is limited to identifying the services and costs associated with distributed PV, and is not an assessment of the cost-effectiveness of distributed PV or the NEM tariff. The methodologies used in this analysis are designed specifically for this effort and were vetted by the Stakeholder Group. Further, neither Black & Veatch nor Clean Power Research are proposing, recommending or advocating which parties should pay for or benefit from these costs, nor how the costs could or should be allocated among utility customers. That is the role of utility rate-making, and this is explicitly intended to be a “marginal cost of service” study.
Based on the current installed PV capacity in SDG&E’s service territory and using California Energy Commission (CEC) forecasted growth rates, there will be nearly 50,000 PV NEM systems in the SDG&E service territory by the end of 2021. The installed capacity of distributed PV will grow from 149 MW at the end of 2012 to 334 MW at the end of 2021, with the annual energy generated by distributed PV more than doubling over that time period. Figure 1 depicts the projected growth in installations and capacity through 2021.
Figure 1.Projected Cumulative Distributed PV Installations and Capacity, 2012-2021
-
10,000
20,000
30,000
40,000
50,000
60,000
Distributed PV Systems
Energy Policy Initiatives Center | SAN DIEGO DISTRIBUTED SOLAR PV IMPACT STUDY
BLACK & VEATCH | Executive Summary 11
While the PV installations will primarily offset customer energy requirements, during hours with low load and high PV production there will be energy flowing from the PV systems back through the utility’s distribution system, and potentially to the high voltage transmission system; during other hours there will be low or zero PV production (e.g. at night), hence distributed PV customer requirements will be served with energy provided by SDG&E during these times. The utility’s electric system must be sufficiently robust to accommodate the variable nature of PV production, both to satisfy customer energy demand regardless of PV output and to maintain overall system reliability at all times.
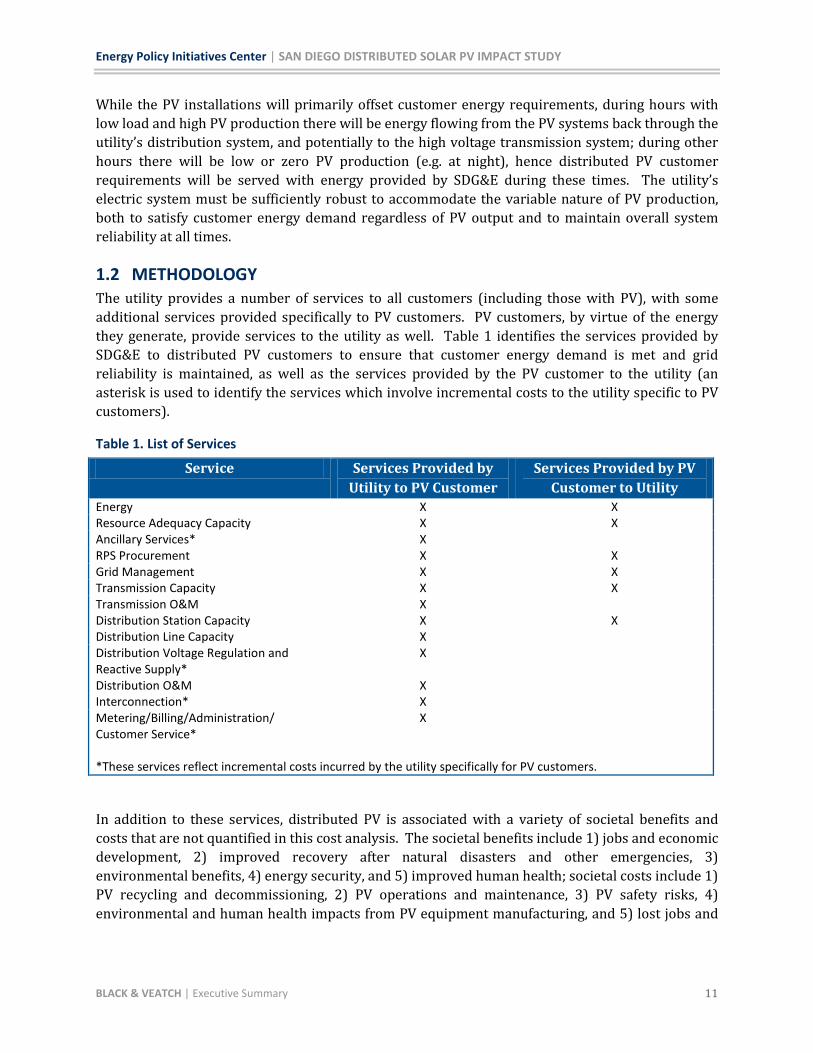
1.2 METHODOLOGY The utility provides a number of services to all customers (including those with PV), with some additional services provided specifically to PV customers. PV customers, by virtue of the energy they generate, provide services to the utility as well. Table 1 identifies the services provided by SDG&E to distributed PV customers to ensure that customer energy demand is met and grid reliability is maintained, as well as the services provided by the PV customer to the utility (an asterisk is used to identify the services which involve incremental costs to the utility specific to PV customers).
Table 1. List of Services
Service Services Provided by Utility to PV Customer
Services Provided by PV Customer to Utility
Energy X X Resource Adequacy Capacity X X Ancillary Services* X RPS Procurement X X Grid Management X X Transmission Capacity X X Transmission O&M X Distribution Station Capacity X X Distribution Line Capacity X Distribution Voltage Regulation and Reactive Supply*
X
Distribution O&M X Interconnection* X Metering/Billing/Administration/ Customer Service*
X
*These services reflect incremental costs incurred by the utility specifically for PV customers.
In addition to these services, distributed PV is associated with a variety of societal benefits and costs that are not quantified in this cost analysis. The societal benefits include 1) jobs and economic development, 2) improved recovery after natural disasters and other emergencies, 3) environmental benefits, 4) energy security, and 5) improved human health; societal costs include 1) PV recycling and decommissioning, 2) PV operations and maintenance, 3) PV safety risks, 4) environmental and human health impacts from PV equipment manufacturing, and 5) lost jobs and

Energy Policy Initiatives Center | SAN DIEGO DISTRIBUTED SOLAR PV IMPACT STUDY
BLACK & VEATCH | Executive Summary 12
tax revenues. While these societal benefits and costs have not been quantified, they are discussed in further detail in Section 3.4.
Once the services were identified, the study team determined the costs associated with the services in each year over the ten-year period 2012-2021. This included the development of methodologies to quantify the current costs in 2012 and to forecast the costs for future years and develop appropriate assumptions for the cost analysis.
The results of this analysis show the marginal cost of services provided by the utility to PV customers and the marginal value of services provided by the distributed PV generation. Thus, all cost results in this study represent the marginal costs or avoided costs to SDG&E of receiving/delivering energy at the time when the PV is delivering energy. This allows for an “apples to apples” comparison of the results for the cost of each service. This is appropriate, since the goal is to isolate the costs to serve the loads that are being served by PV rather than by the utility (the “marginal” customer load), in addition to any incremental costs specific to PV customers. The marginal cost will differ from the average cost to the utility, as the average cost will include historical investments made at different levels of depreciation, costs that are incurred in non-solar hours, and costs incurred for serving non-solar customers.
The study team used actual historical operation and cost data where possible. Where forecasted data was required, publicly vetted data sources were used to the extent possible and practical. The study team relied on SDG&E to provide utility-specific data that is not generally publicly available. This included data on utility hourly retail loads, PV system interconnection costs, distributed PV administrative costs, and projected distributed PV penetration levels on the distribution system (for identifying incremental voltage regulation requirements).
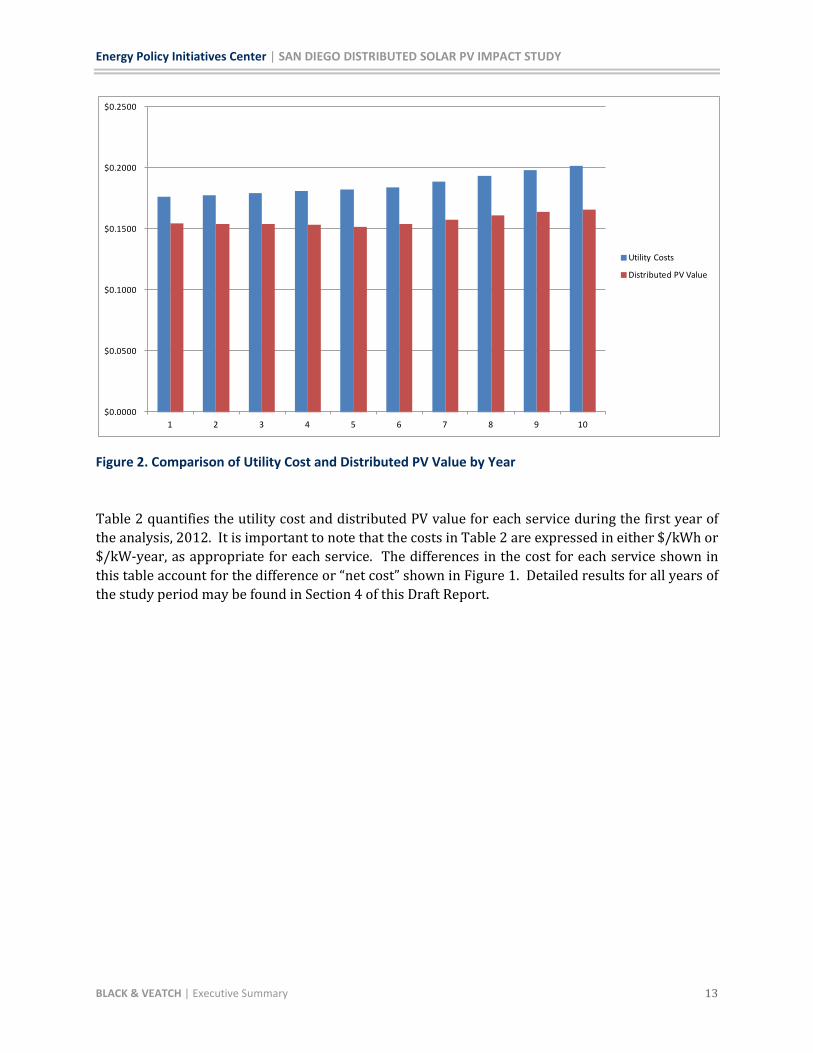
1.3 RESULTS Based on this analysis, the marginal value of distributed PV to the utility is less than the utility cost to serve the marginal load covered by customer PV generation. There are additional factors such as societal benefits discussed in section 3.4 and other utility costs that potentially could be considered in this analysis, but which were not selected for inclusion in this study.
Figure shows the comparison between what the utility costs are to serve the ”marginal” loads served by the distributed PV and the value of the services provided by distributed PV customers to the utility at this time. It represents the total annual utility cost and total annual distributed PV value of the services that are listed in Table 1, expressed on a consistent $/kWh basis. The difference between the two bars in each year is the “net cost” of serving distributed PV customers, which varies between $0.03/kWh and $0.04/kWh throughout the study period.
Energy Policy Initiatives Center | SAN DIEGO DISTRIBUTED SOLAR PV IMPACT STUDY
BLACK & VEATCH | Executive Summary 13
Figure 2. Comparison of Utility Cost and Distributed PV Value by Year
Table 2 quantifies the utility cost and distributed PV value for each service during the first year of the analysis, 2012. It is important to note that the costs in Table 2 are expressed in either $/kWh or $/kW-year, as appropriate for each service. The differences in the cost for each service shown in this table account for the difference or “net cost” shown in Figure 1. Detailed results for all years of the study period may be found in Section 4 of this Draft Report.
$0.0000
$0.0500
$0.1000
$0.1500
$0.2000
$0.2500
1 2 3 4 5 6 7 8 9 10
Utility Costs
Distributed PV Value

Energy Policy Initiatives Center | SAN DIEGO DISTRIBUTED SOLAR PV IMPACT STUDY
BLACK & VEATCH | Executive Summary 14
Table 2. Summary of 2012 Utility Costs and Distributed PV Value by Service Service Unit Utility
Cost Distributed PV
Value Energy $/kWh $0.0531 $0.0531
Resource Adequacy Capacity $/kW-year $218.06 $117.37
Ancillary Services $/kWh $0.0023 $0.00
RPS Procurement $/kWh $0.0087 $0.0087
Grid Management $/kWh $0.0004 $0.0004
Transmission Capacity $/kW-year $102.83 $48.13
Transmission O&M $/kW-year $11.55 $0.00
Distribution Station Capacity $/kW-year $27.85 $13.86
Distribution Line Capacity $/kW-year $74.06 $0.00
Distribution Voltage Regulation and Reactive Supply
$/kW-year $2.33 $0.00
Distribution O&M $/kW-year $31.22 $0.00
Interconnection $/kW-year $42.34 $0.00
Metering/Billing/Customer Service/Administration
$/kW-year $9.01 $0.00

Energy Policy Initiatives Center | SAN DIEGO DISTRIBUTED SOLAR PV IMPACT STUDY
BLACK & VEATCH | Introduction 15
2.0 Introduction In recent years there has been significant growth in the number of solar photovoltaic (PV) installations by retail customers in California on their homes and businesses. The growth in these “behind-the-meter” systems has been the result of a multitude of factors, including (but not limited to) California public policy preferences, cash grants and tax credits and other incentive payments for PV installation, substantial reductions in PV equipment costs, and the development of an industry able to sell, lease, install and maintain residential and commercial PV systems at prices and terms that allow customers to save money on their electric bills. Due to these factors, it is anticipated that PV installations in the state will continue to grow at a strong pace for at least the next ten years. The San Diego area, with generally clear weather and a high-quality solar resource, has seen some of the most dramatic increases in distributed PV (defined here as systems less than one megawatt) capacity in California and in the United States. Based on the current installed PV capacity in SDG&E and using California Energy Commission (CEC) forecasted growth rates, distributed PV installations, defined here as PV installation of less than one megawatt and participating in the San Diego Gas & Electric Company (SDG&E) net energy metering (NEM) program, will grow from 149 MW in 2012 to 334 MW in 2021 (as shown in Figure 3), with the annual energy generated from these systems more than doubling in this same period.
Figure 3. Forecasted SDG&E Distributed PV Fleet Capacity (MW-AC), 2012-2021
Distributed PV systems play a very positive role in California’s electric grid, providing energy during times when California’s load is high, reducing fossil fuel consumption and the correlated pollution and carbon emissions of conventional generators, reducing the need for additional transmission lines, and a variety of other benefits. However, the use of these systems presents challenges to the utility as well, such as an increase in ancillary service costs to integrate this variable energy in real time, additional spending on equipment and operational practices to ensure that PV’s variable output does not cause disturbances to the electric grid, and increased costs to interconnect and administer thousands of small PV generators on the distribution system.
0
50
100
150
200
250
300
350
400
2012 2013 2014 2015 2016 2017 2018 2019 2020 2021
PV F
leet
Cap
acit
y (M
W-A
C)
Energy Policy Initiatives Center | SAN DIEGO DISTRIBUTED SOLAR PV IMPACT STUDY
BLACK & VEATCH | Introduction 16
Black & Veatch, along with our partner Clean Power Research, was retained by the University of San Diego (USD) Energy Policy Initiatives Center (EPIC) on behalf of the San Diego Stakeholder Collaboration Group (Stakeholder Group) to conduct the San Diego Distributed Solar PV Impact Study. This study identifies and quantifies the costs of the energy, capacity, grid and utility services that are required to support the implementation of distributed PV for customers of SDG&E. This “marginal cost of service” study considers both the services provided by the utility to distributed PV customers and the services provided by PV customers to the utility. Within SDG&E’s service territory, nearly all PV systems of this type participate in SDG&E’s NEM tariff. NEM allows PV customers to earn credits for the excess power they send back to the grid, to offset electricity they consume from the grid when their PV system is not generating. In California, incentives are structured so that over the course of the year the PV generation balances out consumption and therefore the customer’s bill is close to zero.
We stress that this study is limited to identifying the service components and costs associated with SDG&E’s PV NEM customers, and is not an assessment of the cost-effectiveness of PV NEM. The methodologies used in this analysis are designed specifically for this effort and were vetted by the Stakeholder Group. Neither Black & Veatch nor Clean Power Research are proposing, recommending or advocating who should pay for or benefit from these costs, nor how the costs could or should be allocated among utility customers. That is the role of utility ratemaking, and this is explicitly intended to be an analysis of costs rather than a ratemaking and utility revenue requirements study.
2.1 BACKGROUND AND OBJECTIVES
SDG&E convened the Stakeholder Group to bring together interested stakeholders to explore how to make distributed solar energy sustainable in the San Diego region. One of the main findings from initial meetings of the Stakeholder Group was the need for a detailed analysis of to identify and estimate the cost of the services associated with customer-owned distributed PV—those provided by the utility to the customer-generator and those provided by the customer-generator to the utility. EPIC managed the study for SDG&E on behalf of the Stakeholders, and engaged Black & Veatch and its subcontractor Clean Power Research as technical consultants to conduct the analysis.
The original scope of the effort was to address the following issues and achieve the following objectives:
1. Develop a transparent methodology to determine and quantify the costs and benefits created by NEM PV to the electric system at different levels of penetration.
2. Determine whether a subsidy or cost shift exists between ratepayers as a result of NEM and the magnitude of the cost.
3. Determine the implications of the impact of NEM on cost of service utility ratemaking.
4. Understand how future policy changes, including changes to the NEM law, the phasing out of AB1X, and changes in grid architecture could affect the analysis.
Energy Policy Initiatives Center | SAN DIEGO DISTRIBUTED SOLAR PV IMPACT STUDY
BLACK & VEATCH | Introduction 17
During the first stakeholder workshop, the initiative was re-scoped by the stakeholder participants. The study goals and objectives were revised to focus not on the cost-effectiveness of NEM on the SDG&E system, but rather to determine the net cost of having distributed PV connected to the electrical system. Specifically, the objectives were redefined as follows:
1. Identify the services that utilities provide distributed solar PV customers (including but not limited to standby, power quality, reliability, import and redelivery).
2. Identify the services that distributed solar PV customers provide to the electrical system (including but not limited to locational, capacity, energy, and environmental (RPS).
3. Develop a transparent methodology determine the cost (both positive and negative) for each of the services identified at different levels of penetration (measured as a percentage of total energy consumption and/or peak demand). For purposes of this study, services should be defined comprehensively to include those with direct costs to the system and to the extent possible those with external, non-energy-related costs (e.g., societal benefits).
4. Determine whether the existing NEM rate structure allows the utility to recover the costs they incur for PV customers.
5. Understand how future scenarios including several PV penetration conditions and Smart Grid infrastructure affect the results of the analysis.
This effort has succeeded in completing the first three objectives, namely the identification of services provided by utilities to distributed PV customers, the services provided by the PV customers to the utility, and estimating the cost and value of these services. Due to time and budget considerations the final two objectives of this analysis—determining whether the existing NEM rate structure allows the utility to recover the costs they incur for PV customers and understanding how future scenarios including several PV penetration conditions and Smart Grid infrastructure affect the results of the analysis—could not be completed.
2.2 STAKEHOLDER PROCESS The Distributed Solar PV Impact Study was completed in conjunction with the San Diego Solar Stakeholder Collaboration Group, a multi-stakeholder group involving a broad range of participants including utilities, governmental entities, solar developers and advocates, public interest and environmental groups, and other entities with a shared interest in the sustainable development of PV in the San Diego region. The study team believes that a collaborative process is essential to ensure that there is wide consensus on the study goals, methodology, and assumptions and support for the resulting conclusions.
The study team led a series of workshops to gather input and feedback from stakeholders during the period from November 2012 through March 2013. Two initial workshops were held in person at the SDG&E Energy Innovation Center in San Diego in November 2012 and January 2013; these focused on the study objectives and scope. Four public webinars were also held in February and March 2013, which focused on the details of the proposed study methodology, data sources, and assumptions. Throughout the process stakeholder comments were encouraged, and numerous comments were received, both verbally during the workshops and in writing. Stakeholder input
Energy Policy Initiatives Center | SAN DIEGO DISTRIBUTED SOLAR PV IMPACT STUDY
BLACK & VEATCH | Introduction 18
was critical in developing the study methodology and settling on key assumptions and data sources. The entire stakeholder group was given the opportunity to comment on all major items.
All meeting materials, including notes, presentations, and stakeholder comments are posted on EPIC website at: http://www.sandiego.edu/epic/research_reports/other.php#NEMStudy.
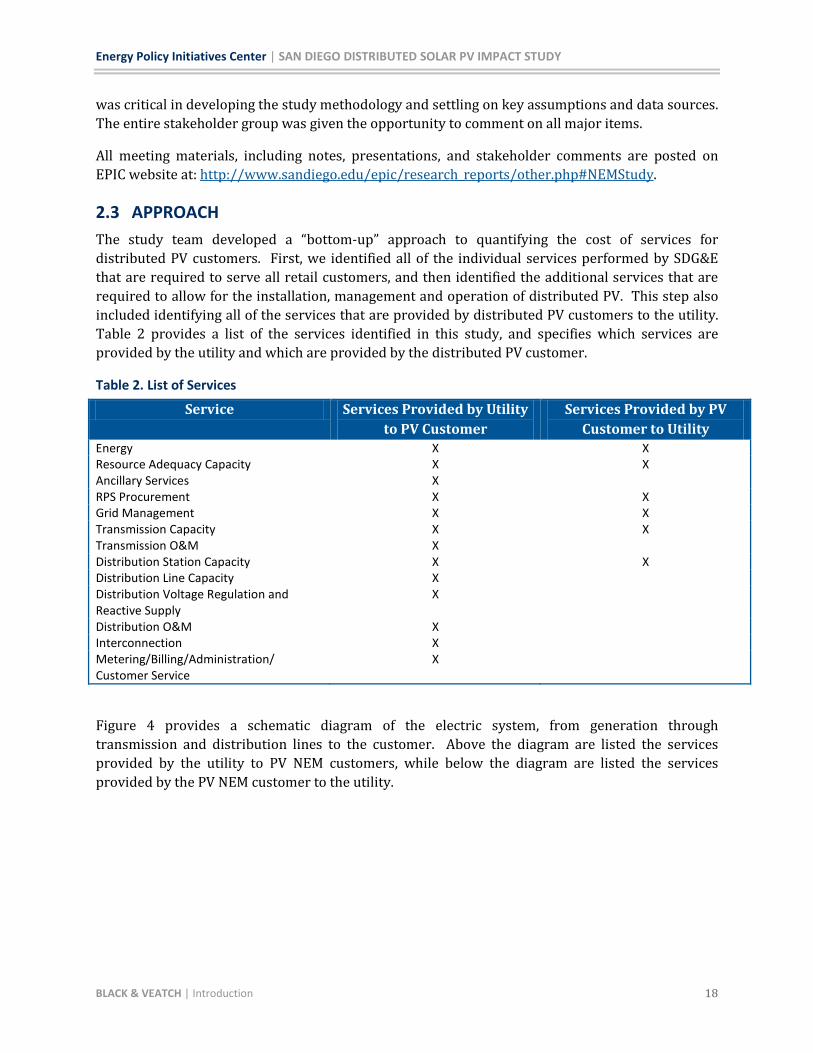
2.3 APPROACH The study team developed a “bottom-up” approach to quantifying the cost of services for distributed PV customers. First, we identified all of the individual services performed by SDG&E that are required to serve all retail customers, and then identified the additional services that are required to allow for the installation, management and operation of distributed PV. This step also included identifying all of the services that are provided by distributed PV customers to the utility. Table 2 provides a list of the services identified in this study, and specifies which services are provided by the utility and which are provided by the distributed PV customer.
Table 2. List of Services
Service Services Provided by Utility to PV Customer
Services Provided by PV Customer to Utility
Energy X X Resource Adequacy Capacity X X Ancillary Services X RPS Procurement X X Grid Management X X Transmission Capacity X X Transmission O&M X Distribution Station Capacity X X Distribution Line Capacity X Distribution Voltage Regulation and Reactive Supply
X
Distribution O&M X Interconnection X Metering/Billing/Administration/ Customer Service
X
Figure 4 provides a schematic diagram of the electric system, from generation through transmission and distribution lines to the customer. Above the diagram are listed the services provided by the utility to PV NEM customers, while below the diagram are listed the services provided by the PV NEM customer to the utility.

Energy Policy Initiatives Center | SAN DIEGO DISTRIBUTED SOLAR PV IMPACT STUDY
BLACK & VEATCH | Introduction 19
Services Provided by Utility to PV Customers
Energy, Resource Adequacy Capacity, Ancillary Services, RPS Procurement
Transmission Capacity and O&M, Grid Management
Distribution Substation Capacity and O&M
Distribution Line Capacity and O&M, Voltage Regulation
Interconnection, Metering/Billing, Administration
Reduced Energy Generation, Resource Adequacy Capacity, and RPS Procurement
Reduced Transmission Capacity and Grid Management Charges
Reduced Distribution Substation Capacity
Services Provided by PV NEM Customers to Utility
Figure 4. Electric Grid Diagram with Utility and PV NEM Customer Services Listed
Once the services were identified, the study team determined the costs associated with the services in each year over the ten-year period 2012-2021. This included the development of methodologies to quantify the current costs in 2012 and to forecast those costs for future years. Once this was completed, the team collected data and developed assumptions required for the cost analysis. The methodologies and data used are described in detail in Section 3 of this report.
A change to the cost calculation methodology was made after the stakeholder meetings. It was initially decided that the study would calculate the cost of services provided by the utility to PV NEM customers on an average basis (while the cost of services provided by the PV customer to the utility would be on a marginal basis). However, it was later decided that these utility costs should be calculated on a marginal basis. Thus, all cost results in this study represent the marginal costs or avoided costs to SDG&E of serving energy at the time when the PV is delivering energy1
1 Technically, the energy served in in proportion to the output of a “typical” PV system defined as the composite output of all distributed PV systems in the service territory.
. This is appropriate, since the goal is to isolate the costs to serve the loads that are being served by PV rather than the utility (the “marginal” customer load), in addition to any incremental costs specific to PV customers. The marginal cost will differ from the average cost to the utility, as the average cost will include historical investments made at different levels of depreciation, costs that are incurred in non-solar hours, and costs incurred for serving non-solar customers. For instance, the

Energy Policy Initiatives Center | SAN DIEGO DISTRIBUTED SOLAR PV IMPACT STUDY
BLACK & VEATCH | Introduction 20
marginal cost of generation capacity represents the long term costs to develop a new, flexible-operation peaking power plant. This will differ substantially from the SDG&E average cost of capacity, which includes a range of capacity resources with different characteristics and of different vintages added in past years to the rate base. It will also differ from the short-term value of capacity, which reflects current market conditions for near-term capacity.
The “average cost” approach proved impractical for two reasons. First, the study team was unable to identify data sources that would appropriately reflect the average costs for certain utility services, such as “resource adequacy capacity”. Secondly, the “average cost” approach made it difficult to compare results for the cost of services provided by the utility to the results of the cost of services provided by the PV customer. The use of marginal costs allows for an “apples to apples” comparison of the results for the costs of each service at the margin without addressing the rate impacts. The results of this analysis now show the marginal cost of services provided by the utility and the marginal cost of services provided by the PV customer.
2.4 DATA AND DATA SOURCES The study team used actual data where possible. Where forecasted data was required, publicly vetted data sources were used to the extent possible and practical. For instance, the SDG&E load forecast and distributed PV installation forecast information is from the California Energy Commission (CEC) Independent Energy Policy Report (IEPR) proceeding, while 2012 energy and ancillary service prices are from the California Independent System Operator (CAISO). Where utility-specific costs were not provided by SDG&E, the team relied on SDG&E’s 2012 General Rate Case filing with the California Public Utilities Commission (CPUC) for cost estimates. The data sources used for each service are described in section 3.3 below.
The study team relied on SDG&E to provide utility-specific data that is not generally publicly available. This included data on utility retail loads, PV system interconnection costs, distributed PV program costs administrative costs and projected marginal distribution system costs for voltage regulation. Black & Veatch prepared and submitted a data request to SDG&E in March 2013, with several subsequent follow-up requests. Over the ensuing several months, SDG&E provided some limited information in the requested format, which the study team incorporated into this analysis where possible and feasible. For instance, Black & Veatch approached the interconnection cost analysis by requesting a detailed breakdown of costs by discrete tasks required for the customer interconnection process and supporting SDG&E activities, however SDG&E provided generally high-level information on organization function and program administration costs. and program administration where the data request sought a detailed breakdown of costs by task for tasks required for customer interconnection and program administration. Similarly, instead of providing forecasted distribution upgrade costs for voltage regulation as SDG&E had initially offered in a stakeholder meeting, they provided a projection of the PV NEM capacity by feeder circuits through 2020. In these cases where the study team did not receive the data it was expecting, we used the information that was provided by SDG&E and developed additional necessary assumptions based on our professional judgment. The result of this is that the study results will not mirror SDG&E costs for these services, nor has the study team validated the SDG&E cost information.
Though some cost information was estimated for the purpose of the analysis, the study team believes the data and assumptions used in this study fairly represent the costs to provide services

Energy Policy Initiatives Center | SAN DIEGO DISTRIBUTED SOLAR PV IMPACT STUDY
BLACK & VEATCH | Introduction 21
to distributed PV customers and the value of services provided by distributed PV customers. The study team has tried to clarify all data sources in this report and where Black & Veatch has made assumptions to develop the data, we have identified how this was completed. However, we believe this analysis could be improved in the future with the use of better, more detailed data than was available for this study.
2.5 RELATIONSHIP TO OTHER INITIATIVES The San Diego Distributed Solar PV Impact Study is designed to consider the costs to SDG&E to serve distributed PV customers and the value of services provided by these customers, as defined by the Stakeholder Group. This effort is occurring in parallel with a CPUC NEM Cost-Effectiveness Evaluation under CPUC Rulemaking 12-11-005. That effort, while similar to this study to the extent that both are attempting to identify the costs and value of PV NEM, are different in several important respects. First, this analysis is focused on the costs associated with distributed PV, and does not assess the cost-effectiveness of the NEM tariff, which would require additional considerations, such as the life-cycle cost and value of PV. Second, this study includes only PV systems, while the CPUC study includes distributed wind generators and other technologies that are eligible for the NEM tariff. Finally, all major assumptions used in this study have been vetted and approved by the Stakeholder Group for use in this analysis. These assumptions were developed independent of the CPUC effort and while they are believed to be similar, they may differ from the NEM Cost-Effectiveness Evaluation initiative.

Energy Policy Initiatives Center | SAN DIEGO DISTRIBUTED SOLAR PV IMPACT STUDY
BLACK & VEATCH | Methodology 22
3.0 Methodology This section describes the methodology used in the study, including an overview of the services quantified and those excluded, a discussion of how the distributed PV fleet modeling was conducted, and a detailed explanation of each individual service. It also describes the societal costs and benefits of distributed PV, which were not quantified as part of this analysis.
3.1 OVERVIEW
3.1.1 Services Provided by the Utility to the PV NEM Customer Services provided by the utility to the distributed PV customer are for usage of electric grid infrastructure, and for energy deliveries when the customer is not generating electricity, or is delivering excess PV generation to the utility. Utilities have developed and maintain infrastructure required to serve customer energy needs, which is necessary whether there is customer energy generation or not. This generally includes the electric generation facilities used to meet customer energy requirements and the transmission and distribution facilities used to deliver energy to customers, as well as other services, such as the procurement of renewable energy to meet the state’s 33% Renewable Portfolio Standard (RPS) requirement. For brevity, these services are often referred to as “utility costs” below.
Additionally, there are four services that involve incremental costs specific to distributed PV customers: incremental ancillary services to balance PV variability, distribution voltage regulation and reactive supply, interconnection, and metering/billing/administration/customer service.
As noted above in section 2.3, a change to the cost calculation methodology was made after the stakeholder meetings. It was initially decided that the study would calculate the cost of services provided by the utility to distributed PV customers on an average basis (while the cost of services provided by the PV customer to the utility would be on a marginal basis). However, it was later decided that these utility costs should be calculated on a marginal basis. Thus, all cost results in this study represent the marginal costs or avoided costs to SDG&E of serving energy at the time when the PV is delivering energy. This is appropriate, since the goal is to isolate the costs to serve the loads that are being served by PV rather than the utility (the “marginal” customer load), in addition to any incremental costs specific to PV customers. The marginal cost will differ from the average cost to the utility, as the average cost will include historical costs as well as marginal costs. For instance, the marginal cost of generation capacity represents the long term costs to develop a new, flexible-operation peaking power plant. This will differ substantially from the SDG&E average cost of capacity, which includes a range of capacity resources with different characteristics and of different vintages. It will also differ from the short-term value of capacity, which reflects current market conditions for near-term capacity.
The “average cost” approach proved impractical for two reasons. First, the study team was unable to identify data sources that would appropriately reflect the average costs for certain utility services, such as “resource adequacy capacity”. Secondly, the “average cost” approach made it difficult to compare results for the cost of services provided by the utility to the results of the cost of services provided by the PV customer. The use of marginal costs allows for an “apples to apples” comparison of the results for the cost of each service. The results of this analysis now show the

Energy Policy Initiatives Center | SAN DIEGO DISTRIBUTED SOLAR PV IMPACT STUDY
BLACK & VEATCH | Methodology 23
marginal cost of services provided by the utility and the marginal cost of services provided by the PV customer.
3.1.2 Services Provided by the Distributed PV Customer to the Utility Just as there is value to the services provided by utilities to customers, customer-owned PV systems provide services to the utility and electric grid that have value. These services include not only the energy produced by the system, but also the reduction in transmission and distribution line losses since that energy does not need to be delivered to the customer. Further, to the extent that the distributed PV fleet as a whole can reduce additional procurement of resource adequacy capacity and renewable energy, and avoid the need for a certain amount of marginal transmission and distribution capacity, these avoided costs are included. The costs of these services are defined by future avoided O&M expenses and future avoided capital costs. For brevity, these costs are often referred to “utility avoided costs” below.
3.1.3 Utility Costs Not Included in This Study There are a number of other costs incurred by utilities on behalf of ratepayers that are included in customer rates which are not included in this study. These other billed costs (Nuclear Decommissioning, Competitive Transition Charge, DWR Bond Charges, and Public Purpose Programs) are not impacted by distributed PV and are therefore excluded from this analysis. The allocation of these costs will be accomplished through the ratemaking process. Furthermore, the societal costs and benefits of distributed PV are described qualitatively in section 3.4, but are not quantified in this study.
3.2 PV FLEET MODELING METHODOLOGIES AND DATA Table 3 summarizes the methodology and data sources used to model the distributed PV fleet in the SDG&E service territory. The subsequent sections describe the details of this modeling, which was performed by Clean Power Research (CPR).

Energy Policy Initiatives Center | SAN DIEGO DISTRIBUTED SOLAR PV IMPACT STUDY
BLACK & VEATCH | Methodology 24
Table 3. Summary of PV Fleet Modeling Methodology and Data Sources
Methodology Data Source
Fleet Modeling Fleet Definition CPR PowerClerk data and other program data
. The “Base Fleet” consists of all behind-the-meter PV systems in SDG&E in service at the end of 2012. This includes all systems installed under CSI, SGIP, MASH, SASH, ERP, and NSHP programs.
Base Fleet Capacity CPR PowerClerk data and other program data
. Calculate Base Fleet capacity in MW-AC. This is defined as MW-DC-STC x loss factor x CEC efficiency as of the end of 2012.
Hourly Fleet Energy at Meter (HFEM) CPR FleetView modeling
. Calculate 2012 hourly production of Base Fleet at the customer meter. The fleet grew between beginning and end of 2012, so this would be a simulation of what the end-of-year fleet would have done for every hour of year had it been installed.
Distribution Loss Factors (DLFs) SDG&E 2012 Hourly Distribution Loss Factors
. Use SDG&E’s reported secondary DLF values for each hour of 2012 to represent marginal distribution losses.
Hourly Fleet Energy at Transmission (HFET) HFEM and Distribution Loss Factors
. Apply the marginal distribution loss factors to the HFEM to obtain hourly energy (MWh) avoided at transmission level.
Effective Load Carrying Capability (ELCC) HFET and SDG&E 2012 Hourly Loads (CEC Data Request)
. Calculate Base Fleet ELCC for 2012 using hourly SDG&E loads and HFET dataset. This is the “effective” kW rating of fleet at the transmission system due to match between PV fleet output and load, including distribution losses.
Fleet Variability CPR FleetView modeling
. Calculate the 15-minute change in fleet output of the Base Fleet for all of 2012, at transmission level (including marginal distribution loss factors).
3.2.1 Background The cost of service calculations required a “typical” PV production time series (i.e. an hourly PV output profile) for evaluation. This time series is used, for example, to calculate the annual energy produced by PV and the match between hourly PV output and hourly utility customer loads.
Rather than assume a single, defined PV system (e.g., a fixed, south-facing system with 30-degree tilt located in downtown San Diego), the actual SDG&E distributed PV fleet was used. The actual fleet, by definition, represents the actual PV resource on the system, and comprises the diversity of geographical location, tracking attributes, and configuration details that would be lost by picking only a single representative system. Furthermore, its production shape represents the best
Energy Policy Initiatives Center | SAN DIEGO DISTRIBUTED SOLAR PV IMPACT STUDY
BLACK & VEATCH | Methodology 25
estimate for the shape of the SDG&E distributed PV fleet in the future, based on the assumption that future systems will be built with similar geographic distributions and configurations as the existing fleet.
Fleet modeling is performed using FleetView™, a fleet simulation tool developed by Clean Power Research. FleetView incorporates as-built PV system attributes from various incentive programs2 and simulates them using SolarAnywhere®. SolarAnywhere includes a database of solar irradiance and other meteorological factors3
2012 was taken as the evaluation year because it was the most recent complete year, incorporating the most recent load, PV systems, CAISO costs, and other factors. The year was shown (as described below in section 3.2.5) to be a typical year in terms of annual PV production.
as well as a PV output simulation engine.
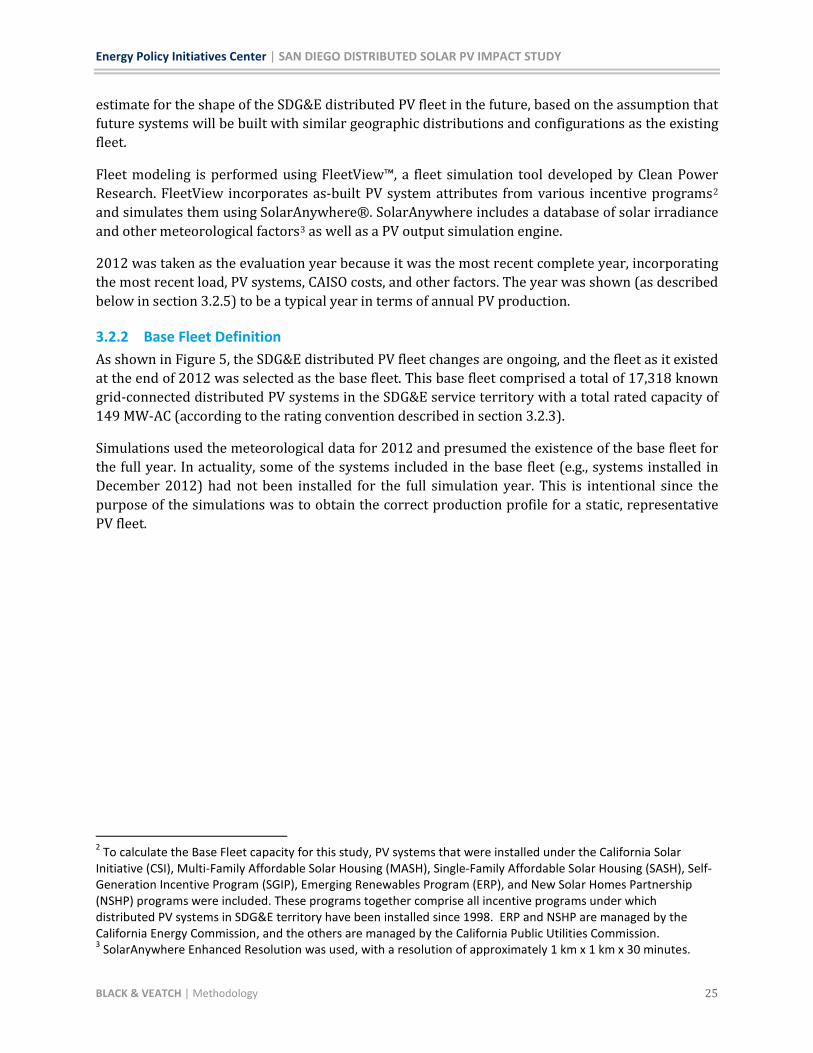
3.2.2 Base Fleet Definition As shown in Figure 5, the SDG&E distributed PV fleet changes are ongoing, and the fleet as it existed at the end of 2012 was selected as the base fleet. This base fleet comprised a total of 17,318 known grid-connected distributed PV systems in the SDG&E service territory with a total rated capacity of 149 MW-AC (according to the rating convention described in section 3.2.3).
Simulations used the meteorological data for 2012 and presumed the existence of the base fleet for the full year. In actuality, some of the systems included in the base fleet (e.g., systems installed in December 2012) had not been installed for the full simulation year. This is intentional since the purpose of the simulations was to obtain the correct production profile for a static, representative PV fleet.
2 To calculate the Base Fleet capacity for this study, PV systems that were installed under the California Solar Initiative (CSI), Multi-Family Affordable Solar Housing (MASH), Single-Family Affordable Solar Housing (SASH), Self-Generation Incentive Program (SGIP), Emerging Renewables Program (ERP), and New Solar Homes Partnership (NSHP) programs were included. These programs together comprise all incentive programs under which distributed PV systems in SDG&E territory have been installed since 1998. ERP and NSHP are managed by the California Energy Commission, and the others are managed by the California Public Utilities Commission. 3 SolarAnywhere Enhanced Resolution was used, with a resolution of approximately 1 km x 1 km x 30 minutes.

Energy Policy Initiatives Center | SAN DIEGO DISTRIBUTED SOLAR PV IMPACT STUDY
BLACK & VEATCH | Methodology 26
Figure 5. SDG&E Distributed PV Fleet Capacity Over Time
3.2.3 Rating Convention All system and fleet ratings use the MW-AC (or kW-AC) rating convention4
An example of the rating method is shown in
. This convention incorporates the module PTC rating, inverter losses, and other systems losses (such as wiring and module mismatch losses).
Table 4 for a sample system. FleetView includes the data necessary to simulate each system. Typically this includes the model specification (make and model), the number of modules, and the inverter specification (make and model). The CEC PTC module ratings and inverter efficiencies are taken from a look-up table. All systems are assumed to have an 85% loss factor (15% losses). The fleet rating is the sum of the individual system ratings.
Table 4. Example System Rating Calculation 100 W-DC DC module rating (PTC)
X 100 Number of modules X 94.2% Inverter load-weighted efficiency X 85.0% Other loss factor
8.01 kW-AC System rating
3.2.4 Fleet Production Datasets Two time series datasets were developed, each of which represents hourly PV fleet energy production as shown in Table 5.
4 This convention is not to be confused with the CEC-AC method for rating, which does not include system losses.
Energy Policy Initiatives Center | SAN DIEGO DISTRIBUTED SOLAR PV IMPACT STUDY
BLACK & VEATCH | Methodology 27
Table 5. HFEM and HFET Datasets Hourly Fleet Energy at Meter (HFEM)
This is the aggregate fleet hourly output for 2012, normalized on a per MW-AC basis. This data represents energy produced by the systems as measured at the system metering point (i.e. at the customer load).
Hourly Fleet Energy at Transmission (HFET)
This is a related data set of hourly fleet power, but it includes the effect of distribution loss savings that result from fleet production. It is equivalent to the reduction of power delivered through the transmission system to the SDG&E distribution system delivery point. This set is also normalized on a per MW-AC basis.
The details of loss calculations used in preparing the HFET dataset are included in Appendix A.
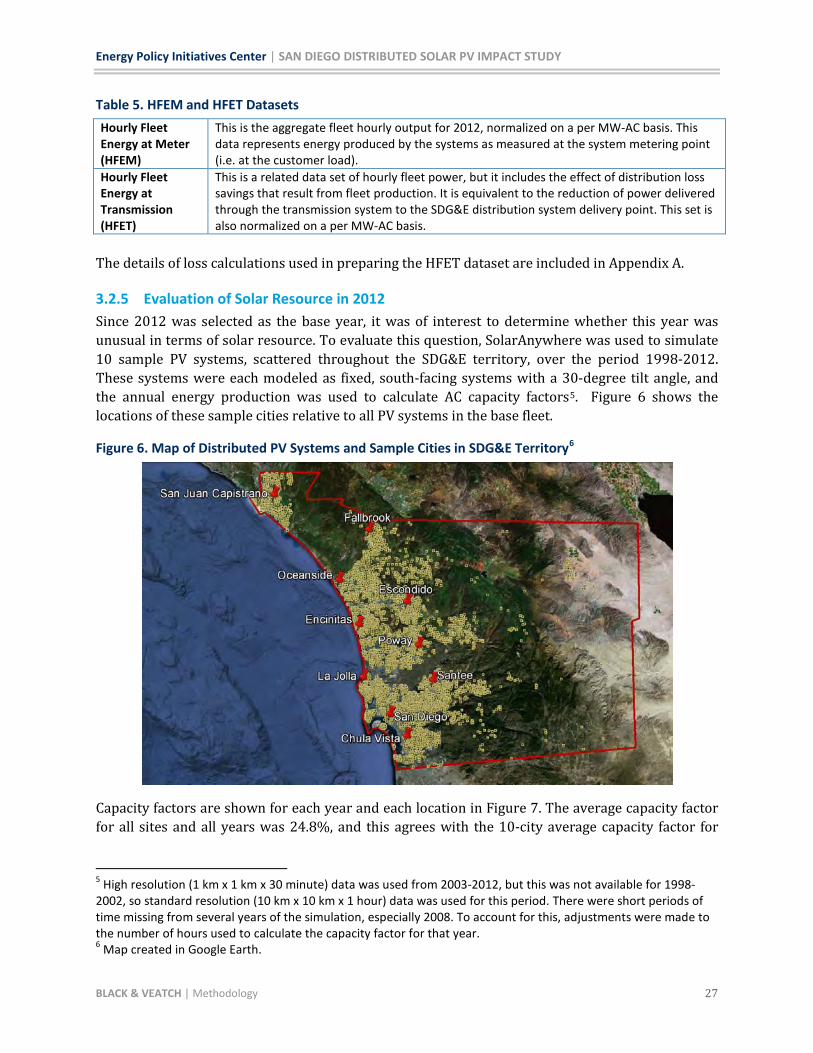
3.2.5 Evaluation of Solar Resource in 2012 Since 2012 was selected as the base year, it was of interest to determine whether this year was unusual in terms of solar resource. To evaluate this question, SolarAnywhere was used to simulate 10 sample PV systems, scattered throughout the SDG&E territory, over the period 1998-2012. These systems were each modeled as fixed, south-facing systems with a 30-degree tilt angle, and the annual energy production was used to calculate AC capacity factors5 Figure 6. shows the locations of these sample cities relative to all PV systems in the base fleet.
Figure 6. Map of Distributed PV Systems and Sample Cities in SDG&E Territory6
Capacity factors are shown for each year and each location in Figure 7. The average capacity factor for all sites and all years was 24.8%, and this agrees with the 10-city average capacity factor for
5 High resolution (1 km x 1 km x 30 minute) data was used from 2003-2012, but this was not available for 1998-2002, so standard resolution (10 km x 10 km x 1 hour) data was used for this period. There were short periods of time missing from several years of the simulation, especially 2008. To account for this, adjustments were made to the number of hours used to calculate the capacity factor for that year. 6 Map created in Google Earth.

Energy Policy Initiatives Center | SAN DIEGO DISTRIBUTED SOLAR PV IMPACT STUDY
BLACK & VEATCH | Methodology 28
2012, also 24.8%. Therefore, we conclude that 2012 may be considered a typical year on an energy basis.
Figure 7. AC Capacity Factors for 10 Sample PV Systems Through SDG&E Territory (1998-2012)
3.2.6 Effective PV Capacity As a non-dispatchable resource, PV system or fleet ratings are not directly comparable to the ratings of dispatchable resources, such as fossil-based thermal resources. To calculate the costs of capacity-related services, then, an equivalent “dependable” or “effective” capacity must be determined.
Two measures of effective capacity are computed in this study, each based on the ability of PV to match load but based on two separate methodologies. The two measures are:
Resource Adequacy Capacity (RAC), used for effective generation capacity (this includes Effective Load Carrying Capability, which is used for effective transmission capacity); and
Peak Load Reduction (PLR), used for effective distribution capacity
Calculating effective PV capacity requires accurate hourly load data. SDG&E provided actual hourly retail load for the year 2012, and this was the basis for all effective PV capacity calculations. In addition, it is important to use PV output that is time-correlated with load data (rather than “typical year” output data), and also to simulate the output of the full PV fleet rather than a single representative PV installation because the profile can different significantly from the representative system profile. This is demonstrated in Figure 8, which shows the differences in the output profile of the full SDG&E PV fleet, a representative south-facing system with SolarAnywhere resource data,

Energy Policy Initiatives Center | SAN DIEGO DISTRIBUTED SOLAR PV IMPACT STUDY
BLACK & VEATCH | Methodology 29
and a representative system with TMY2 resource data, along with SDG&E load on the peak load day in 2012.
Figure 8. PV Fleet Output Compared to Single Representative System with Different Solar Resource
Datasets and SDG&E Load, Peak Load Day (September 14, 2012)
3.2.7 Resource Adequacy Capacity RAC is the sum of the Effective Load Carrying Capability (ELCC) and the reserve margin. ELCC is a statistical measure of capacity in which hourly PV fleet production is compared against utility load with the highest load hours weighted most heavily. The ELCC calculation results in the rating of a baseload plant having the same loss of load probability as the PV fleet on an annual basis. ELCC can be thought of as the contribution of PV towards meeting the peak load.
ELCC is calculated in MW, but may also be expressed as a percentage of system or fleet rating.
The reserve margin (assumed to be 15% of expected peak load) is the additional capacity to meet reliability standards over and above the amount necessary to meet expected peak load. The reserve margin is necessary because of uncertainty in forecasting peak load for planning purposes and to handle unexpected outages of generating resources. Since PV reduces the system peak by the amount of the ELCC, the required capacity for reserve resources is also reduced. Since the assumed reserve is 15% of peak load, and PV is able to reduce the peak load by the ELCC amount, then PV reduces the amount of required reserves by 15% of ELCC.
Energy Policy Initiatives Center | SAN DIEGO DISTRIBUTED SOLAR PV IMPACT STUDY
BLACK & VEATCH | Methodology 30
RAC is the combination of ELCC and reserve margin. For example, if a PV system is rated at 100 kW-AC, the ELCC is determined to be 50% of rated capacity, and the reserve margin is 15%, then the RAC would be calculated as:
RAC = 100 kW x 50% x (1.15) = 57.5 kW
Using these methods, the RAC of the SDG&E distributed PV fleet was calculated to be 53.8% of its rating in 2012.
3.2.8 Peak Load Reduction A separate measure of effective capacity is the PLR. This is calculated as the difference between the peak load (at the peak hour) without PV versus the “net” peak load after PV energy production has been incorporated into the load profile. The net peak may occur at the same hour as the original peak, or it may shift, depending on load shapes and PV production shapes.
PLR may be expressed in MW, or it may be expressed as a percentage of system or fleet rating.
Using these methods, the PLR of the SDG&E distributed PV fleet was calculated to be 49.8% of its capacity rating in 2012.
Figure 9 illustrates PLR by showing the net retail load and total retail load profiles for SDG&E on the peak load day of September 14, 2012, and the 74 MW of peak load reduction (at transmission) attributable to distributed PV during the peak load hour. The retail load and distribution loss factors are used to calculate the load at the transmission level by applying the loss calculations described in the Appendix. This results in the “Net Retail Load” curve. Then, the load that was served directly by PV is added along with the corresponding loss savings. This gives the load that would have been realized at transmission had PV not been present on the system, shown in the figure as “Total Retail Load.”

Energy Policy Initiatives Center | SAN DIEGO DISTRIBUTED SOLAR PV IMPACT STUDY
BLACK & VEATCH | Methodology 31
Figure 9. Peak Day Load
3.2.9 Effective Capacity in Future Years Effective capacity depends upon the hourly profile of the utility load and the PV fleet output. As more PV is installed on the SDG&E distribution system, the net load shape changes, so effective capacity must be re-calculated for future years. Under this study, new load shapes were developed for each year from 2013 through 2021 based on the load profile in 2012. From these, RAC and PLR values were calculated for each year.
Table 6 shows the assumptions used for the analysis. Fleet capacity and load growth rates correspond to data provided by SDG&E, based on forecasts from the CEC as part of the 2013 Integrated Energy Policy Report proceeding. New hourly loads for each year are calculated by starting with the 2012 time series as the base load shape, applying a factor for load growth, and subtracting the expect PV production based on HFEM and the amount of differential PV fleet capacity.

Energy Policy Initiatives Center | SAN DIEGO DISTRIBUTED SOLAR PV IMPACT STUDY
BLACK & VEATCH | Methodology 32
Table 6. Future Year Growth Assumptions
2012 2013 2014 2015 2016 2017 2018 2019 2020 2021 Fleet Capacity Growth Rate
9.1% 12.3% 14.9% 16.4% 2.2% 3.3% 7.0% 10.2% 10.2%
Fleet Capacity (MW-AC)
149 162 182 209 244 249 257 275 303 334
Differential Fleet Cap - 2012 (MW)
0 14 33 61 95 100 109 127 155 186
Inter-year growth rate
0.952 1.012 1.019 1.021 1.022 1.020 1.023 1.022 1.023
Load Scale Factor 1.000 0.952 0.963 0.981 1.002 1.024 1.045 1.068 1.092 1.116
The values of future year effective capacity are shown in Table 7. ELCC, RAC, and PLR are calculated using the methods described above, but using the future year load shapes. Also shown are the peak load and the PV penetration level (defined as the PV fleet capacity as a percentage of SDG&E peak load).
Table 7. Future Year Effective Capacity Values
2012 2013 2014 2015 2016 2017 2018 2019 2020 2021 Peak Load (MW) 4081 3869 3907 3970 4040 4132 4216 4308 4396 4486
Penetration (%) 3.6% 4.2% 4.7% 5.3% 6.0% 6.0% 6.1% 6.4% 6.9% 7.5%
ELCC 46.8% 46.0% 45.3% 44.3% 43.1% 43.1% 42.9% 42.4% 41.5% 40.6%
Margin 7.0% 6.9% 6.8% 6.6% 6.5% 6.5% 6.4% 6.4% 6.2% 6.1%
RAC 53.8% 53.0% 52.1% 51.0% 49.6% 49.5% 49.3% 48.8% 47.8% 46.7%
PLR 49.8% 49.5% 49.6% 49.6% 49.7% 49.8% 49.9% 50.0% 50.1% 50.2%
3.2.10 Fleet Variability Determining the cost of ancillary services (described below in section 3.3.3) requires the simulation of the output of the PV fleet on a 15-minute basis, which represents PV fleet output variability. This PV fleet power dataset was produced as follows.
Cloud motion vectors are calculated at half-hour intervals, and these are used to create interpolated values of clear sky index for each minute in the interval. These clear sky indices are then used in combination with clear sky irradiance (based on values calculated for each minute) to give 1-minute irradiance at ground level for each grid square. To ensure data continuity, this process was done in the forward and backward directions and the results were blended with appropriate weighting factors.
Using this data, the 1-minute power output profile of each PV system can be simulated, and the results summed for every system in the fleet. For the study, only 15-minute data was required, so the 1-minute aggregate fleet data was sampled at 15-minute intervals. The resulting dataset is shown in Figure 10.

Energy Policy Initiatives Center | SAN DIEGO DISTRIBUTED SOLAR PV IMPACT STUDY
BLACK & VEATCH | Methodology 33
Figure 10. 15-minute SDG&E Distributed PV Fleet Power Output in 2012
Ramp rates (in MW per minute) were then determined by calculating the change in fleet power for each interval and dividing by 15 minutes. Upon inspection, the highest ramp rate (and many of the top ramp rates) was found in the hour or so immediately after sunrise, and this was determined to be caused by missing data in the forward motion vector. The problem was that the vectors were not possible to compute without a clear image in daylight hours. These high ramp rates were therefore artificial, and all ramp rates were set to zero during any periods of missing data.
Figure 11 shows the absolute value of ramp rates for the fleet, and these are sorted by magnitude and re-plotted in Figure 12. The maximum ramp rate is 2.04 MW per minute, or 1.3% of system rating per minute. There are a large number of ramp rates of zero, corresponding to night hours. There are also a number of ramp rates between zero and one MW per minute.
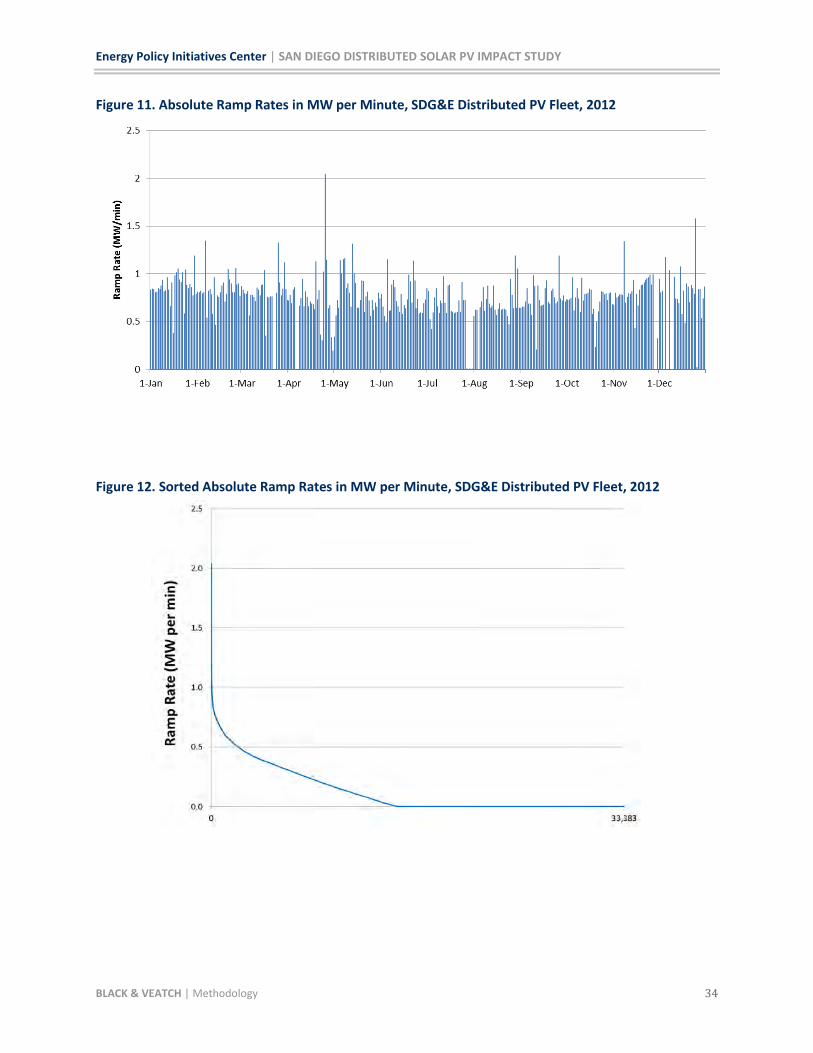
Energy Policy Initiatives Center | SAN DIEGO DISTRIBUTED SOLAR PV IMPACT STUDY
BLACK & VEATCH | Methodology 34
Figure 11. Absolute Ramp Rates in MW per Minute, SDG&E Distributed PV Fleet, 2012
Figure 12. Sorted Absolute Ramp Rates in MW per Minute, SDG&E Distributed PV Fleet, 2012

Energy Policy Initiatives Center | SAN DIEGO DISTRIBUTED SOLAR PV IMPACT STUDY
BLACK & VEATCH | Methodology 35
For comparison purposes, Figure 13 shows one-minute ramp rates for a single system7
versus the entire fleet. The figure is for all daytime hours during the single day in 2012 (April 4) having the largest PV fleet ramping event. Both curves are per unit of rated capacity. This chart illustrates the significant effect of geographic diversification on fleet variability. The highest ramp rate for the single system on that day was -25.7% of rated output per minute, as compared to only -2.8% of rated output for the entire PV fleet.
Figure 13. One-minute fleet and single system ramp rates, April 4, 2012.
7 This system is fixed, south-facing at a 30-degree tilt angle, located at the capacity-weighted fleet centroid (32.96235 deg. latitude, -117.12409 deg. longitude).

Energy Policy Initiatives Center | SAN DIEGO DISTRIBUTED SOLAR PV IMPACT STUDY
BLACK & VEATCH | Methodology 36
3.3 SERVICES Table 8 provides a list of the services identified in this study, and specifies which services are provided by the utility and which by the PV customer. The sections below describe the methodology, data sources, and results for each service, and provide a discussion of the results. It should be noted that the cost of each service was calculated on either an energy ($/kWh) or a capacity ($/kW-year) basis, depending on the nature of the service, and results for each service are presented accordingly.
Table 8. List of Services
Service Services Provided by Utility to PV Customer (Utility Costs)
Services Provided by PV Customer to Utility
(Utility Avoided Costs) Energy X X Resource Adequacy Capacity X X Ancillary Services* X RPS Procurement X X Grid Management X X Transmission Capacity X X Transmission O&M X Distribution Station Capacity X X Distribution Line Capacity X Distribution Voltage Regulation and Reactive Supply*
X
Distribution O&M X Interconnection* X Metering/Billing/Administration/ Customer Service*
X
*These services reflect incremental costs incurred by the utility specifically for PV customers.
3.3.1 Energy This service reflects both the hourly value of energy delivered to the customer and the hourly value of energy provided by the distributed PV fleet ($/MWh at proxy customer location), based on actual 2012 CAISO real-time market prices and CAISO market forecast prices for 2013-2021. This hourly value includes the cost of generation, transmission losses, and congestion on the transmission system. Mission 2 substation is defined as the SDG&E system delivery point. Since the California Air Resources Board (CARB) greenhouse gas (GHG) cap-and-trade system did not take effect until 2013, an approximate GHG cost was added to the hourly energy prices in 2012 prices; prices in 2013-2021 already included GHG costs.
3.3.1.1 Methodology Actual 2012 hourly energy prices were obtained from the CAISO’s Open Access Same-time Information System (OASIS) website.8
8
5-minute locational marginal prices (LMPs) from the real-time market were downloaded for all of 2012 for the Mission 2 substation (the Pnode
http://oasis.caiso.com
Energy Policy Initiatives Center | SAN DIEGO DISTRIBUTED SOLAR PV IMPACT STUDY
BLACK & VEATCH | Methodology 37
“MISSION_2_N035”) and an average price in $/MWh was calculated for each hour of 2012. The annual average of all hourly LMPs in 2012 was $34.66/MWh.
Since these 2012 hourly energy prices did not include GHG costs, the study team estimated CO2 emissions of the marginal unit(s) providing energy in SDG&E’s portion of the CAISO market in 2012. It was assumed this unit was a natural gas-fired GE LMS 100 unit with an average heat rate of 9.2 MBtu/MWh. This heat rate was multiplied by the standard combustion value of natural gas (0.053 metric ton CO2 per MBtu of natural gas) and the GHG emissions allowance clearing price from the CARB February 2013 cap-and-trade market auction ($13.62/metric ton) to obtain the average GHG cost of $6.66/MWh. This value was then added to the hourly CAISO LMPs in 2012 to obtain the total hourly energy price; the average total hourly energy price in 2012 was $41.31/MWh.
In 2012-2013, during CAISO’s Transmission Planning Process (TPP), hourly market price forecasts were prepared for the years 2017 and 2022. (Those are the only years simulated by CAISO). These hourly forecasted prices did include GHG costs. Hourly prices for 2013-2016 were interpolated from the 2012 and 2017 prices, and prices for 2018-2021 were interpolated from the 2017 and 2022. We note that simulated market prices for interim years will likely be impacted by resource additions and retirements, though it is believed interpolated prices represent an appropriate proxy for hourly prices in each intermediate year. Average total hourly energy prices rose from $41.31/MWh in 2012 to $53.92/MWh in 2021.
These hourly energy prices for 2012-2021 were multiplied by hourly PV fleet energy production in each year (HFET, as described above) to obtain the total annual cost in dollars of energy provided by the distributed PV fleet. Utility avoided per-unit cost is calculated by dividing the total annual cost by annual PV fleet generation to obtain $/kWh. These per-unit energy costs were also used as a proxy for the cost of energy delivered from the utility to the customer.
3.3.1.2 Data Data sources for this service were:
1) CAISO 5-minute LMPs for 2012 for Pnode “MISSION_2_N035” from OASIS

Energy Policy Initiatives Center | SAN DIEGO DISTRIBUTED SOLAR PV IMPACT STUDY
BLACK & VEATCH | Methodology 38
Figure 14. Sample of Hourly Energy Price Data in 2012 from CAISO, with GHG Costs Added
2) CAISO 2012-2013 TPP Energy Price Forecast for 2017 and 2022
Figure 15. Sample of Forecasted Hourly Energy Prices in 2013-2021

Energy Policy Initiatives Center | SAN DIEGO DISTRIBUTED SOLAR PV IMPACT STUDY
BLACK & VEATCH | Methodology 39
3) CARB GHG allowance clearing price from February 2013 cap-and-trade market auction
4) Hourly Fleet Energy at Transmission results
3.3.1.3 Results Annual utility costs for this service over the ten-year study period are shown in Table 9.
Table 9. Utility Costs for Energy Year Cost/kWh 2012 $ 0.0531 2013 $ 0.0521 2014 $ 0.0512 2015 $ 0.0503 2016 $ 0.0495 2017 $ 0.0485 2018 $ 0.0498 2019 $ 0.0511 2020 $ 0.0525 2021 $ 0.0536
Annual utility avoided costs for this service over the ten-year study period are shown in Table 10. Utility costs and utility avoided costs are the same for this service because the marginal cost to the utility of delivering energy to the customer is equal to the marginal value of the PV generation during the hours when PV is producing power.
Table 10. Utility Avoided Costs for Energy Year Cost/kWh 2012 $ 0.0531 2013 $ 0.0521 2014 $ 0.0512 2015 $ 0.0503 2016 $ 0.0495 2017 $ 0.0485 2018 $ 0.0498 2019 $ 0.0511 2020 $ 0.0525 2021 $ 0.0536
3.3.1.4 Discussion The energy forecast cost represents the marginal value of generation for energy generated or procured by SDG&E, as well as the market value for renewable energy generation. The CAISO real-time or “spot” market prices are believed to be the most appropriate prices to reflect the value of PV generation. The real-time market prices were selected over the day-ahead market or the hour-ahead market because distributed PV output is variable, and this most accurately reflects the cost of energy at the time of PV generation. We note that the price differences between the three market
Energy Policy Initiatives Center | SAN DIEGO DISTRIBUTED SOLAR PV IMPACT STUDY
BLACK & VEATCH | Methodology 40
timeframes are usually small, and over the course of the year the average prices in each market tend to converge.
GHG costs were added to the CAISO 2012 energy prices to reflect the value of GHG in the energy prices. GHG costs were not added to the 2017 or 2022 market price forecast costs, since it is assumed that the GHG costs are included in the dispatch price of generators in those years.
The estimated value of GHG in 2012 was $6.66/MWh, which is based on assumptions about the operation of the expected marginal unit (GE LMS 100 described in Section 3.3.2 below) and the February 2013 CARB auction market clearing price for GHG permits. We note that a recent report from CAISO (First Quarter 2013 Report on Market Issues and Performance, May 2013)9
3.3.2 Resource Adequacy Capacity
estimated that market prices have increased $6.15-6.21/MWh due to CARB GHG costs, so the study team believes the estimate used in this analysis was reasonable.
Utilities are required to meet customer loads under a range of conditions and circumstances, and California generators are required to maintain available resources to meet CPUC “Resource Adequacy” requirements for generation during times of system peak demand. This service reflects the cost of providing reliable capacity to meet system load.
This study assumes the marginal capacity resource that would be avoided by distributed PV capacity would be a natural gas-fired GE LMS 100 peaking unit. This unit is appropriate since it would typically operated at time of distributed PV generation, but is a flexible resource that could be used to ramp up and down with the variability of the PV output. This is a state-of-the-art generator, and many utilities in the Southwestern United states are currently planning to use these resources to meet marginal energy requirements in the future. This annual net cost is used as a proxy for the utility cost to provide resource adequacy capacity. To represent the capacity value provided by the distributed PV fleet, this annual net cost is multiplied by the RAC factor described above, which captures the extent to which PV fleet output matches the utility load profile.
3.3.2.1 Methodology It was assumed that the resource adequacy capacity value is approximated by the annual net cost of installing and operating a new GE LMS 100 unit. Based on actual project data assembled by Black & Veatch in 2013, the levelized installed cost of a GE LMS 100 unit in California was assumed to be $202.56/kW-year. A fixed operations and maintenance (O&M) cost of $22.33/kW-year in 2012 was added to this levelized installed cost, and the fixed O&M cost was escalated at three percent annually to $29.14/kW-year in 2021. Net revenues earned by the unit in the CAISO energy and ancillary service markets were subtracted in each year (net revenues varied from $3/kW-year to $10/kW-year during the study period depending on market conditions). Projected net revenues are based on the projected dispatch of a similar generating unit located in southern California using regional production simulation modeling of the Western Interconnection. The net annual cost is the levelized installed cost, plus the fixed O&M cost, minus the net revenues; annual values for each
9 Available at http://www.caiso.com/Documents/2013FirstQuarterReport-MarketIssues_Performance-May2013.pdf
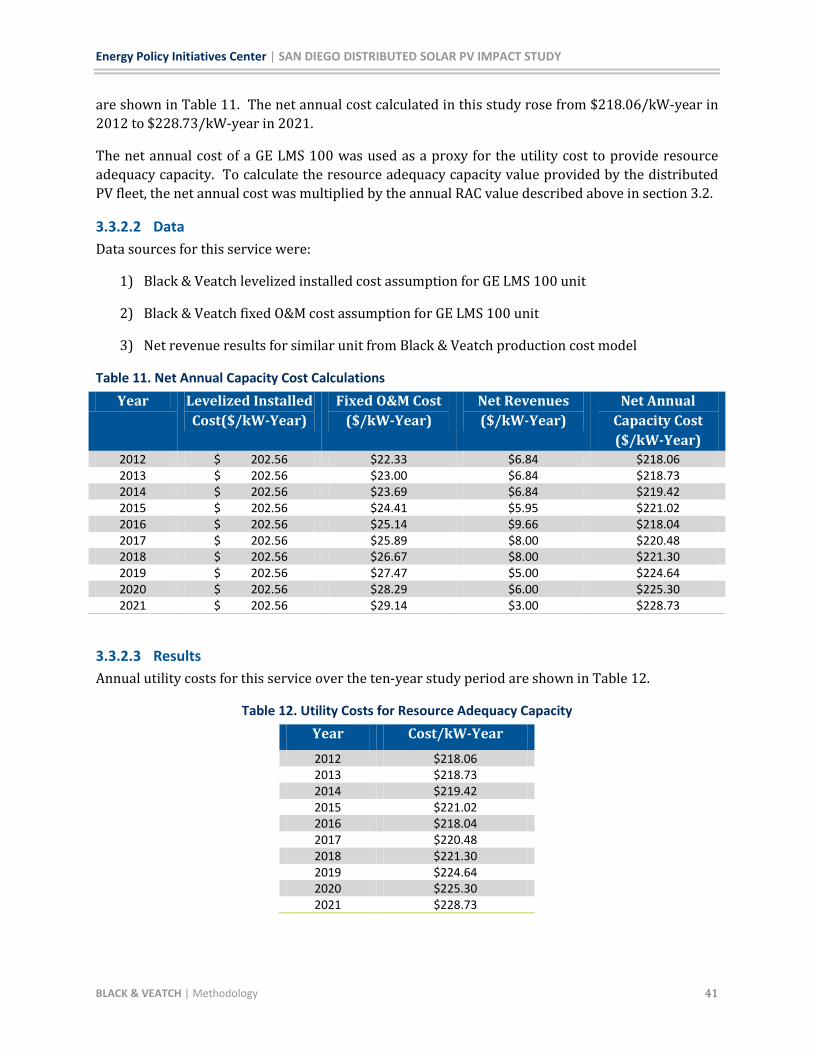
Energy Policy Initiatives Center | SAN DIEGO DISTRIBUTED SOLAR PV IMPACT STUDY
BLACK & VEATCH | Methodology 41
are shown in Table 11. The net annual cost calculated in this study rose from $218.06/kW-year in 2012 to $228.73/kW-year in 2021.
The net annual cost of a GE LMS 100 was used as a proxy for the utility cost to provide resource adequacy capacity. To calculate the resource adequacy capacity value provided by the distributed PV fleet, the net annual cost was multiplied by the annual RAC value described above in section 3.2.
3.3.2.2 Data Data sources for this service were:
1) Black & Veatch levelized installed cost assumption for GE LMS 100 unit
2) Black & Veatch fixed O&M cost assumption for GE LMS 100 unit
3) Net revenue results for similar unit from Black & Veatch production cost model
Table 11. Net Annual Capacity Cost Calculations Year Levelized Installed
Cost($/kW-Year) Fixed O&M Cost
($/kW-Year) Net Revenues ($/kW-Year)
Net Annual Capacity Cost ($/kW-Year)
2012 $ 202.56 $22.33 $6.84 $218.06 2013 $ 202.56 $23.00 $6.84 $218.73 2014 $ 202.56 $23.69 $6.84 $219.42 2015 $ 202.56 $24.41 $5.95 $221.02 2016 $ 202.56 $25.14 $9.66 $218.04 2017 $ 202.56 $25.89 $8.00 $220.48 2018 $ 202.56 $26.67 $8.00 $221.30 2019 $ 202.56 $27.47 $5.00 $224.64 2020 $ 202.56 $28.29 $6.00 $225.30 2021 $ 202.56 $29.14 $3.00 $228.73
3.3.2.3 Results Annual utility costs for this service over the ten-year study period are shown in Table 12.
Table 12. Utility Costs for Resource Adequacy Capacity Year Cost/kW-Year
2012 $218.06 2013 $218.73 2014 $219.42 2015 $221.02 2016 $218.04 2017 $220.48 2018 $221.30 2019 $224.64 2020 $225.30 2021 $228.73

Energy Policy Initiatives Center | SAN DIEGO DISTRIBUTED SOLAR PV IMPACT STUDY
BLACK & VEATCH | Methodology 42
Annual utility avoided costs for this service over the ten-year study period are shown in Table 13. Utility avoided costs for resource adequacy capacity are equal to the utility costs above multiplied by the RAC factor in each year.
Table 13. Utility Avoided Costs for Resource Adequacy Capacity Year Cost/kW-Year 2012 $ 117.37 2013 $ 115.82 2014 $ 114.32 2015 $ 112.67 2016 $ 108.06 2017 $ 109.18 2018 $ 109.19 2019 $ 109.55 2020 $ 107.63 2021 $ 106.80
3.3.2.4 Discussion The resource adequacy capacity costs reflect the “long-term” resource adequacy costs of developing and operating a state-of-the-art generating unit in California. It is important to distinguish between “near-term” and “long-term” capacity costs. There is an active bilateral market for capacity in California, but this market is generally limited to capacity available for the next few years. As there is more generation capacity in California in the next few years than is projected to be required, prices in this market are much lower than the estimated cost for development of long-term resources. When considering the value of new resources, utility resource planners typically use the long-term value of capacity to assess the value of an alternative resource.
The long-term capacity costs developed by Black & Veatch are higher than many other capacity cost estimates for the California market. This cost estimate is based on Black & Veatch’s experience with developing LMS 100 units and our understanding of the cost to build and operate a new peaking resource in California.
3.3.3 Ancillary Services “Ancillary Services” include several services that are provided by the grid operator, in this instance the CAISO, that are necessary to maintain system reliability and meet customer load. These services include providing Operating Reserves (“Regulation Up” and Regulation Down”), which are designed to meet minute-to-minute load variability, and Contingency Reserves (“Spinning Reserves” and “Non-Spinning Reserves”), which are designed to meet load requirements in the event of a system emergency.
A certain amount of Operating Reserves and Contingency Reserves are provided by the utility to all utility customers, while Operating Reserves for incremental variability due to PV are a cost incurred by the utility specifically to serve PV customers. Since PV NEM generation will likely not impact system contingencies, we are only including Operating Reserves in our analysis of incremental ancillary service costs for PV customers. This cost is calculated using 2012 hourly ancillary service
Energy Policy Initiatives Center | SAN DIEGO DISTRIBUTED SOLAR PV IMPACT STUDY
BLACK & VEATCH | Methodology 43
prices from CAISO, and the 15-minute distributed PV fleet output simulated by Clean Power Research. There are no avoided ancillary service costs due to distributed PV.
3.3.3.1 Methodology To calculate ancillary service costs for load variability alone, an estimate was made based on information from the CAISO 2012 Annual Report on Market Issues and Performance.10
Hourly 2012 ancillary service prices (for regulation up and regulation down services) were downloaded from CAISO’s OASIS website for the AS_SP26 region and the AS_CAISO_EXP region in the day-ahead market (DAM). Ancillary services are purchased in the day-ahead, hour-ahead and real-time markets. Prices from the day-ahead market were chosen because procurement in that market is most robust, with minimal procurement in the hour-ahead and real-time markets. Prices from the AS_SP26 and AS_CAISO_EXP regions were both downloaded because the total marginal ancillary service price at a particular location and time is the sum of the AS_SP26 and AS_CAISO_EXP price.
This report showed that total ancillary service costs across CAISO territory in 2012 were approximately one percent of total energy costs. So total SDG&E ancillary service costs for load variability in 2012 were calculated as one percent of the total energy costs listed above in section 3.3.1. This cost in 2012 was escalated through 2021 in proportion to forecasted SDG&E peak load growth.
To calculate the incremental ancillary service costs introduced by the distributed PV fleet, the 15-minute “actual” PV fleet output for 2012 simulated by Clean Power Research was compared to forecasted PV fleet output. Because ancillary services are mostly procured in the day-ahead market on an hourly basis, the forecasted PV fleet output in each hour was set equal to the PV fleet output in that same hour on the previous day (output from the previous day gives a reasonable estimate of output on the current day)11
Utility per-unit cost for the base ancillary service cost is calculated by dividing the total annual cost by annual SDG&E retail load to obtain $/kWh. Utility per-unit cost for incremental ancillary service cost for PV variability is calculated by dividing the total annual cost by annual PV fleet generation to obtain $/kWh.
. In each 15-minute interval, actual output is subtracted from forecasted output. In each hour, the maximum difference between 15-minute forecasted output and 15-minute actual output in the positive direction is defined as the regulation up requirement, and the maximum difference in the negative direction is defined as the regulation down requirement. Hourly regulation up and down prices were multiplied by the hourly requirements and summed for all hours to calculate the annual incremental ancillary service cost for PV fleet variability. The 2012 value was escalated through 2021 in proportion to forecasted PV fleet capacity growth.
3.3.3.2 Data Data sources for this service were:
10 Available at http://www.caiso.com/market/Pages/MarketMonitoring/MarketIssuesPerfomanceReports/Default.aspx. 11 in practice, a more robust forecasting system would be used that incorporates available meteorological data

Energy Policy Initiatives Center | SAN DIEGO DISTRIBUTED SOLAR PV IMPACT STUDY
BLACK & VEATCH | Methodology 44
1) CAISO 2012 DAM 15-minute regulation up and regulation down prices for region AS_SP26 and region AS_CAISO_EXP
2) 15-minute PV fleet output
3.3.3.3 Results Annual utility costs for this service over the ten-year study period are shown in Table 14. As described in the methodology above, incremental ancillary service costs for PV fleet variability were calculated in addition to the base ancillary service costs for load variability. Per-unit costs are greater for PV variability than for load variability because PV fleet output is generally less predictable than total retail load.
Table 14. Utility Costs for Ancillary Services Year Ancillary Service Costs for Load
Variability ($/kWh) Incremental Ancillary Service Costs
for PV Variability ($/kWh) 2012 $0.0005 $0.0018 2013 $0.0005 $0.0018 2014 $0.0005 $0.0018 2015 $0.0005 $0.0018 2016 $0.0005 $0.0018 2017 $0.0005 $0.0018 2018 $0.0005 $0.0018 2019 $0.0005 $0.0018 2020 $0.0005 $0.0018 2021 $0.0005 $0.0018
3.3.3.4 Discussion Ancillary service costs are generally small in comparison to energy and resource adequacy capacity costs, as demonstrated by the results above. Similarly, the incremental variability introduced by the distributed PV fleet increases total SDG&E ancillary service costs by a relatively small proportion—causing a 5.5 percent increase with a fleet of about 150 MW in 2012, and a 10.9 increase with a fleet of over 330 MW in 2021.
This methodology assumes that ancillary service costs increase linearly with respect to SDG&E load and the distributed PV fleet capacity (i.e. the per-unit cost remains constant, as shown in Table 14 above). However, it is possible that ancillary service costs will increase non-linearly in the future as distributed PV penetration grows and the proportion of wholesale energy from utility-scale wind and solar resources rises to meet the state’s RPS requirement.
3.3.4 RPS Procurement All California utilities are required to procure 33 percent of their electricity from renewable sources by 2020 under the current renewable portfolio standard (RPS) law. This service reflects the cost differential between wholesale electricity purchased from the CAISO market and electricity from renewable resources purchased through long-term power purchase agreements (PPAs). This cost differential is referred to as the “renewable premium.” Utility costs for RPS procurement are

Energy Policy Initiatives Center | SAN DIEGO DISTRIBUTED SOLAR PV IMPACT STUDY
BLACK & VEATCH | Methodology 45
approximated using average historical PPA prices, while utility avoided costs are approximated using marginal PPA prices.
3.3.4.1 Methodology Utility costs and utility avoided costs for RPS procurement were both approximated using marginal PPA prices. The study team investigated a number of data sources, including Renewable Auction Mechanism (RAM) contracts and PPAs signed by public utilities in California, but the prices for these contracts are usually confidential. It was publicly reported that the average price from the first RAM auction (which closed in early 2012) was below $89/MWh. In addition, 57 percent of all solar PV project PPAs over 1 MW signed by California investor-owned utilities in 2011 and 2012 were below $89/MWh. In late 2012, the City of Palo Alto signed a solar PV project PPA for $77/MWh. Taking all these into account, the study team estimated a marginal PPA price of approximately $85/MWh. This is assumed to represent the marginal RPS procurement cost for the utility.
To calculate the renewable premium for marginal RPS procurement, the average CAISO total energy price was subtracted from the base price of $85/MWh in each year. The remainder was multiplied by the RPS requirement in each year (which rises from 20 percent in 2012 to 33 percent in 2021). The renewable premium for marginal RPS procurement rises from $8.74/MWh in 2012 to $18.80/MWh in 2021.
3.3.4.2 Data Data sources for this service were:
1) CPUC RPS contract information, RAM filings, and City of Palo Alto Feed-in Tariff information
2) Average annual CAISO energy prices for 2012-2021 (described above in section 3.3.1)
3.3.4.3 Results Annual utility costs for this service over the ten-year study period are shown in Table 15.
Table 15. Utility Costs for RPS Procurement Year Cost/kWh 2012 $ 0.0087 2013 $ 0.0090 2014 $ 0.0101 2015 $ 0.0112 2016 $ 0.0124 2017 $ 0.0138 2018 $ 0.0152 2019 $ 0.0167 2020 $ 0.0183 2021 $ 0.0188
Annual utility avoided costs for this service over the ten-year study period are shown in Table 16. Utility costs and utility avoided costs for this service are the same since both are based on the marginal renewable PPA price.
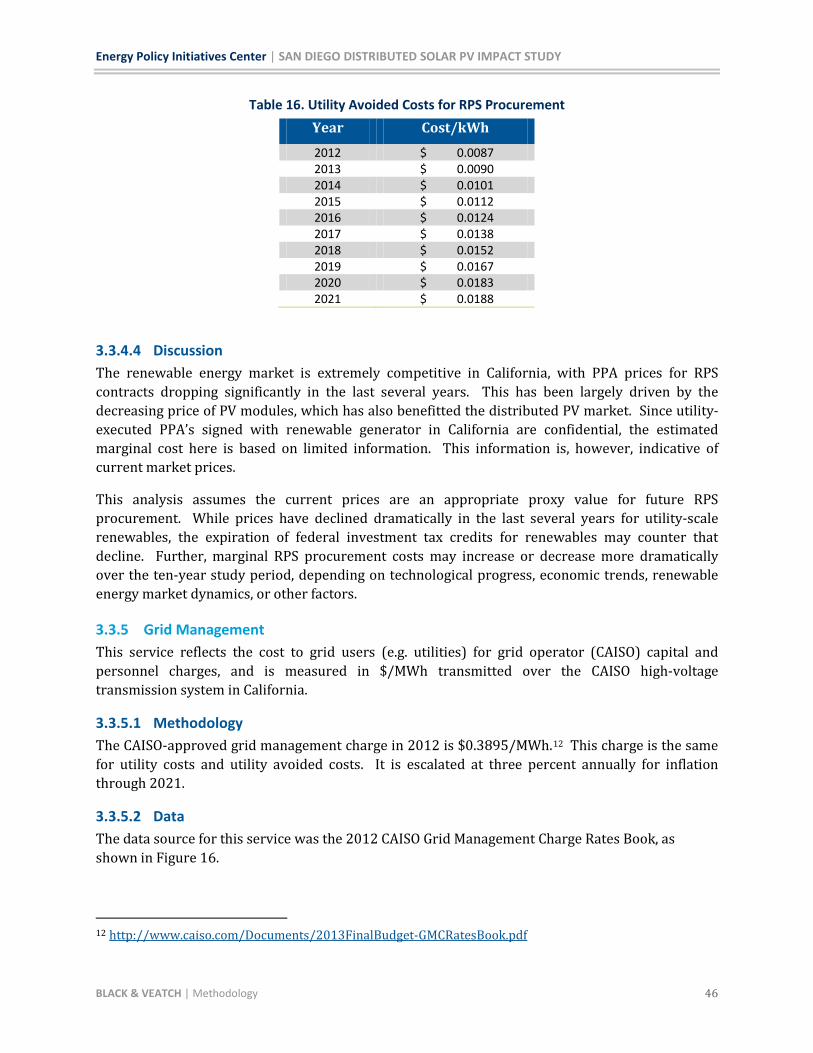
Energy Policy Initiatives Center | SAN DIEGO DISTRIBUTED SOLAR PV IMPACT STUDY
BLACK & VEATCH | Methodology 46
Table 16. Utility Avoided Costs for RPS Procurement Year Cost/kWh 2012 $ 0.0087 2013 $ 0.0090 2014 $ 0.0101 2015 $ 0.0112 2016 $ 0.0124 2017 $ 0.0138 2018 $ 0.0152 2019 $ 0.0167 2020 $ 0.0183 2021 $ 0.0188
3.3.4.4 Discussion The renewable energy market is extremely competitive in California, with PPA prices for RPS contracts dropping significantly in the last several years. This has been largely driven by the decreasing price of PV modules, which has also benefitted the distributed PV market. Since utility-executed PPA’s signed with renewable generator in California are confidential, the estimated marginal cost here is based on limited information. This information is, however, indicative of current market prices.
This analysis assumes the current prices are an appropriate proxy value for future RPS procurement. While prices have declined dramatically in the last several years for utility-scale renewables, the expiration of federal investment tax credits for renewables may counter that decline. Further, marginal RPS procurement costs may increase or decrease more dramatically over the ten-year study period, depending on technological progress, economic trends, renewable energy market dynamics, or other factors.
3.3.5 Grid Management This service reflects the cost to grid users (e.g. utilities) for grid operator (CAISO) capital and personnel charges, and is measured in $/MWh transmitted over the CAISO high-voltage transmission system in California.
3.3.5.1 Methodology The CAISO-approved grid management charge in 2012 is $0.3895/MWh.12
3.3.5.2 Data
This charge is the same for utility costs and utility avoided costs. It is escalated at three percent annually for inflation through 2021.
The data source for this service was the 2012 CAISO Grid Management Charge Rates Book, as shown in Figure 16.
12 http://www.caiso.com/Documents/2013FinalBudget-GMCRatesBook.pdf
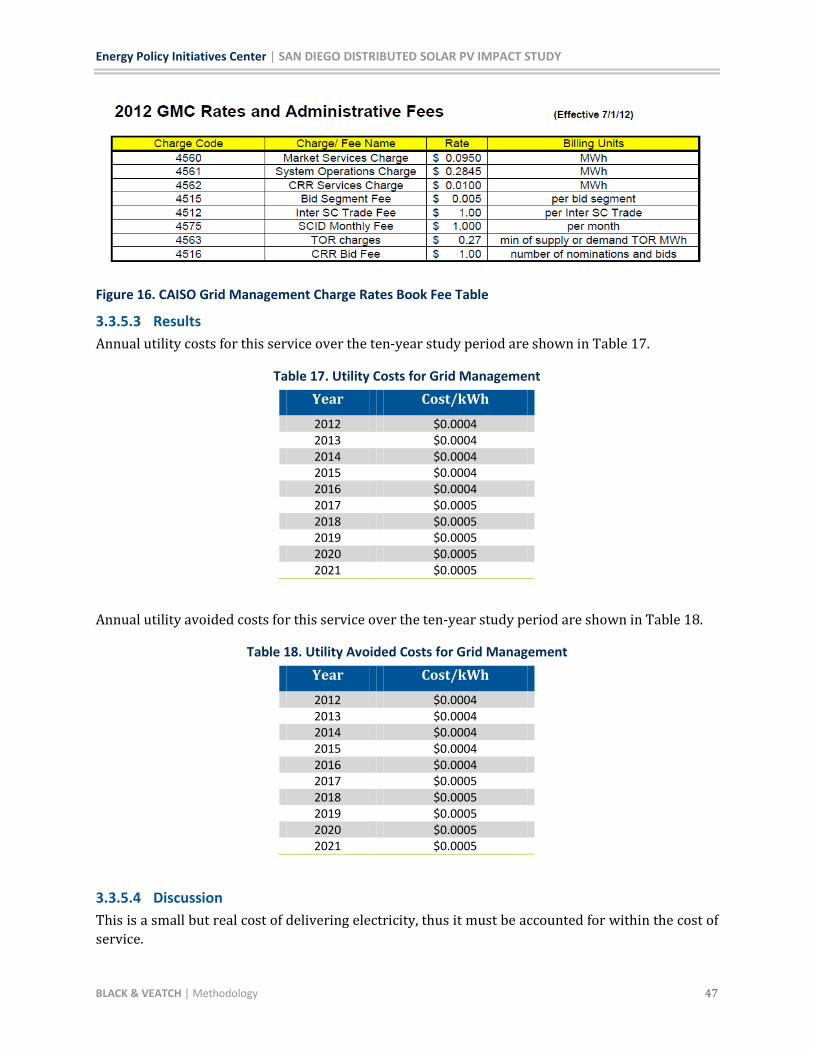
Energy Policy Initiatives Center | SAN DIEGO DISTRIBUTED SOLAR PV IMPACT STUDY
BLACK & VEATCH | Methodology 47
Figure 16. CAISO Grid Management Charge Rates Book Fee Table
3.3.5.3 Results Annual utility costs for this service over the ten-year study period are shown in Table 17.
Table 17. Utility Costs for Grid Management Year Cost/kWh 2012 $0.0004 2013 $0.0004 2014 $0.0004 2015 $0.0004 2016 $0.0004 2017 $0.0005 2018 $0.0005 2019 $0.0005 2020 $0.0005 2021 $0.0005
Annual utility avoided costs for this service over the ten-year study period are shown in Table 18.
Table 18. Utility Avoided Costs for Grid Management
Year Cost/kWh 2012 $0.0004 2013 $0.0004 2014 $0.0004 2015 $0.0004 2016 $0.0004 2017 $0.0005 2018 $0.0005 2019 $0.0005 2020 $0.0005 2021 $0.0005
3.3.5.4 Discussion This is a small but real cost of delivering electricity, thus it must be accounted for within the cost of service.
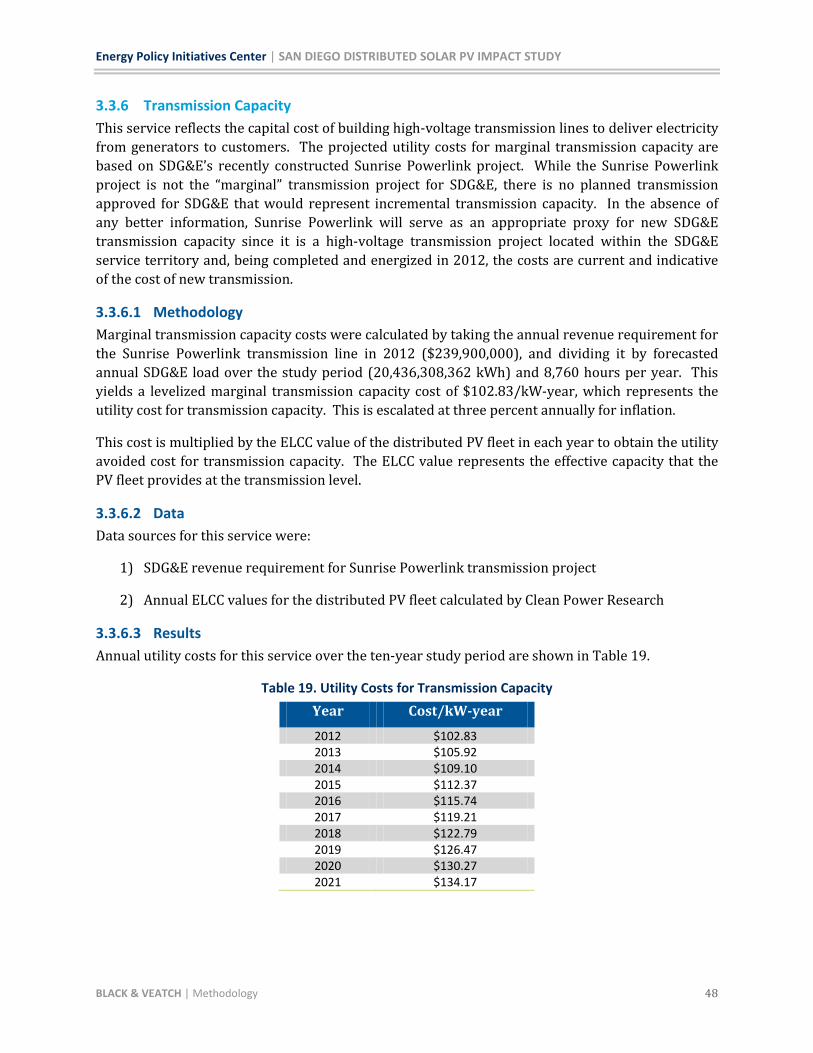
Energy Policy Initiatives Center | SAN DIEGO DISTRIBUTED SOLAR PV IMPACT STUDY
BLACK & VEATCH | Methodology 48
3.3.6 Transmission Capacity This service reflects the capital cost of building high-voltage transmission lines to deliver electricity from generators to customers. The projected utility costs for marginal transmission capacity are based on SDG&E’s recently constructed Sunrise Powerlink project. While the Sunrise Powerlink project is not the “marginal” transmission project for SDG&E, there is no planned transmission approved for SDG&E that would represent incremental transmission capacity. In the absence of any better information, Sunrise Powerlink will serve as an appropriate proxy for new SDG&E transmission capacity since it is a high-voltage transmission project located within the SDG&E service territory and, being completed and energized in 2012, the costs are current and indicative of the cost of new transmission.
3.3.6.1 Methodology Marginal transmission capacity costs were calculated by taking the annual revenue requirement for the Sunrise Powerlink transmission line in 2012 ($239,900,000), and dividing it by forecasted annual SDG&E load over the study period (20,436,308,362 kWh) and 8,760 hours per year. This yields a levelized marginal transmission capacity cost of $102.83/kW-year, which represents the utility cost for transmission capacity. This is escalated at three percent annually for inflation.
This cost is multiplied by the ELCC value of the distributed PV fleet in each year to obtain the utility avoided cost for transmission capacity. The ELCC value represents the effective capacity that the PV fleet provides at the transmission level.
3.3.6.2 Data Data sources for this service were:
1) SDG&E revenue requirement for Sunrise Powerlink transmission project
2) Annual ELCC values for the distributed PV fleet calculated by Clean Power Research
3.3.6.3 Results Annual utility costs for this service over the ten-year study period are shown in Table 19.
Table 19. Utility Costs for Transmission Capacity Year Cost/kW-year
2012 $102.83 2013 $105.92 2014 $109.10 2015 $112.37 2016 $115.74 2017 $119.21 2018 $122.79 2019 $126.47 2020 $130.27 2021 $134.17
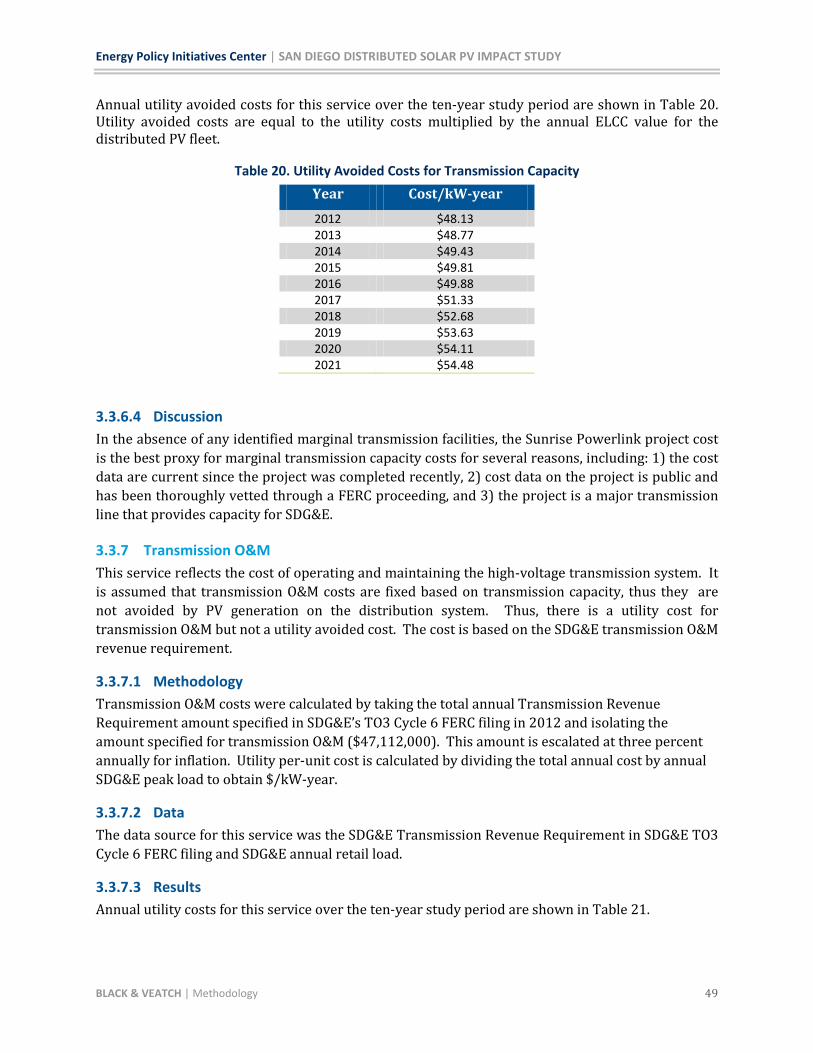
Energy Policy Initiatives Center | SAN DIEGO DISTRIBUTED SOLAR PV IMPACT STUDY
BLACK & VEATCH | Methodology 49
Annual utility avoided costs for this service over the ten-year study period are shown in Table 20. Utility avoided costs are equal to the utility costs multiplied by the annual ELCC value for the distributed PV fleet.
Table 20. Utility Avoided Costs for Transmission Capacity Year Cost/kW-year 2012 $48.13 2013 $48.77 2014 $49.43 2015 $49.81 2016 $49.88 2017 $51.33 2018 $52.68 2019 $53.63 2020 $54.11 2021 $54.48
3.3.6.4 Discussion In the absence of any identified marginal transmission facilities, the Sunrise Powerlink project cost is the best proxy for marginal transmission capacity costs for several reasons, including: 1) the cost data are current since the project was completed recently, 2) cost data on the project is public and has been thoroughly vetted through a FERC proceeding, and 3) the project is a major transmission line that provides capacity for SDG&E.
3.3.7 Transmission O&M This service reflects the cost of operating and maintaining the high-voltage transmission system. It is assumed that transmission O&M costs are fixed based on transmission capacity, thus they are not avoided by PV generation on the distribution system. Thus, there is a utility cost for transmission O&M but not a utility avoided cost. The cost is based on the SDG&E transmission O&M revenue requirement.
3.3.7.1 Methodology Transmission O&M costs were calculated by taking the total annual Transmission Revenue Requirement amount specified in SDG&E’s TO3 Cycle 6 FERC filing in 2012 and isolating the amount specified for transmission O&M ($47,112,000). This amount is escalated at three percent annually for inflation. Utility per-unit cost is calculated by dividing the total annual cost by annual SDG&E peak load to obtain $/kW-year.
3.3.7.2 Data The data source for this service was the SDG&E Transmission Revenue Requirement in SDG&E TO3 Cycle 6 FERC filing and SDG&E annual retail load.
3.3.7.3 Results Annual utility costs for this service over the ten-year study period are shown in Table 21.

Energy Policy Initiatives Center | SAN DIEGO DISTRIBUTED SOLAR PV IMPACT STUDY
BLACK & VEATCH | Methodology 50
Table 21. Utility Costs for Transmission O&M Year Cost/kW-year 2012 $ 11.55 2013 $ 12.56 2014 $ 12.83 2015 $ 13.02 2016 $ 13.19 2017 $ 13.35 2018 $ 13.52 2019 $ 13.66 2020 $ 13.82 2021 $ 13.99
3.3.7.4 Discussion While reviewing the O&M cost data reported in SDG&E’s 2012 Transmission Revenue Requirement FERC filing, essentially all of these costs were deemed to be fixed based on existing transmission capacity, i.e. there were no significant variable cost components The study team found no conclusive studies or evidence that distributed PV will avoid transmission O&M costs for the existing system.
3.3.8 Distribution Station Capacity The addition of distributed PV will reduce demand on the SDG&E system, and it is assumed this will likely reduce the need for some substation capacity. This service reflects the capital cost of building distribution substations in SDG&E territory, including substation land, structures and equipment. Utility costs and utility avoided costs are based on the SDG&E GRC Phase II estimates of marginal distribution substation capacity costs; utility avoided costs include the PLR factor of the distributed PV fleet.
3.3.8.1 Methodology Substations are designed to meet specific requirements and can vary substantially in design from one to the next, hence it is impossible to develop a “generic” cost for distribution substation capacity. To develop a cost to reflect the avoided substation capacity, the study team assumed the marginal cost would approximate the historical costs for substation capacity. The utility cost for distribution substation capacity is based on an estimate in the 2012 SDG&E GRC Phase II Testimony of $27.85/kW-year.13
3.3.8.2 Data
This is escalated at three percent annually for inflation. For the utility avoided cost, it is multiplied by the Peak Load Reduction (PLR) factor described above in section 3.2.
Data sources for this service were:
1) Marginal Distribution Capacity costs in SDG&E 2012 GRC Phase II Testimony
2) Peak Load Reduction factors calculated by Clean Power Research
13 Taken from testimony by Robert Ehlers.
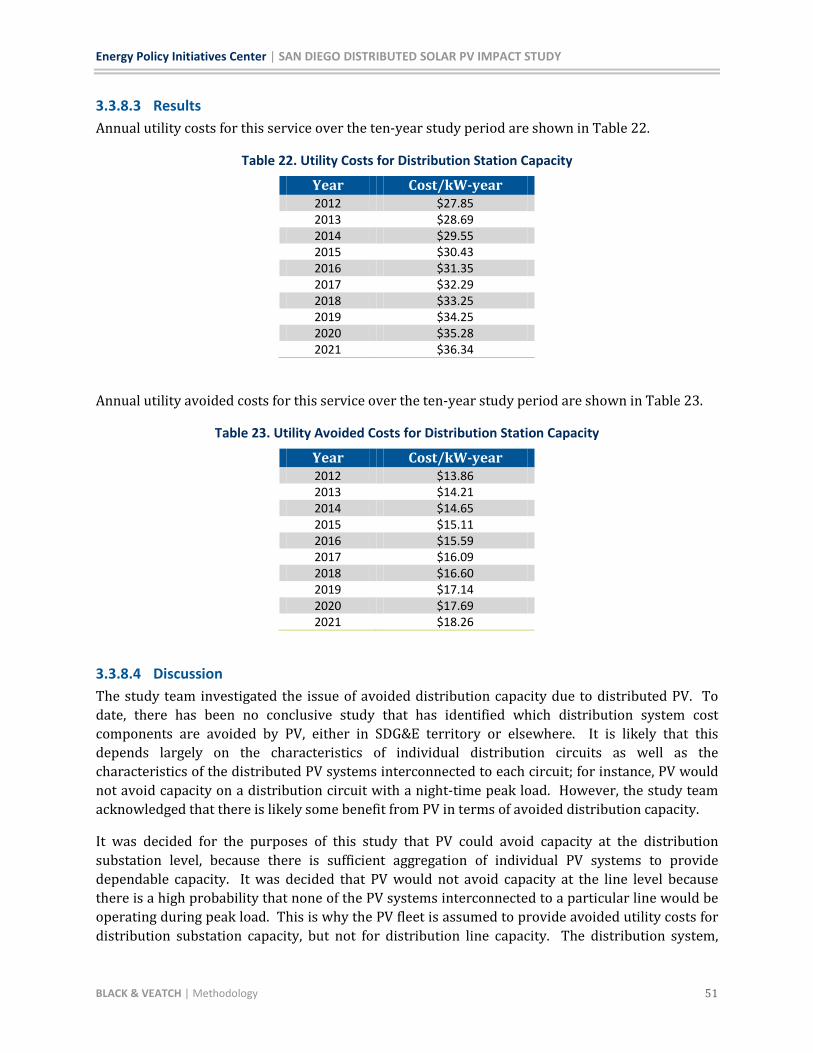
Energy Policy Initiatives Center | SAN DIEGO DISTRIBUTED SOLAR PV IMPACT STUDY
BLACK & VEATCH | Methodology 51
3.3.8.3 Results Annual utility costs for this service over the ten-year study period are shown in Table 22.
Table 22. Utility Costs for Distribution Station Capacity
Year Cost/kW-year 2012 $27.85 2013 $28.69 2014 $29.55 2015 $30.43 2016 $31.35 2017 $32.29 2018 $33.25 2019 $34.25 2020 $35.28 2021 $36.34
Annual utility avoided costs for this service over the ten-year study period are shown in Table 23.
Table 23. Utility Avoided Costs for Distribution Station Capacity
Year Cost/kW-year 2012 $13.86 2013 $14.21 2014 $14.65 2015 $15.11 2016 $15.59 2017 $16.09 2018 $16.60 2019 $17.14 2020 $17.69 2021 $18.26
3.3.8.4 Discussion The study team investigated the issue of avoided distribution capacity due to distributed PV. To date, there has been no conclusive study that has identified which distribution system cost components are avoided by PV, either in SDG&E territory or elsewhere. It is likely that this depends largely on the characteristics of individual distribution circuits as well as the characteristics of the distributed PV systems interconnected to each circuit; for instance, PV would not avoid capacity on a distribution circuit with a night-time peak load. However, the study team acknowledged that there is likely some benefit from PV in terms of avoided distribution capacity.
It was decided for the purposes of this study that PV could avoid capacity at the distribution substation level, because there is sufficient aggregation of individual PV systems to provide dependable capacity. It was decided that PV would not avoid capacity at the line level because there is a high probability that none of the PV systems interconnected to a particular line would be operating during peak load. This is why the PV fleet is assumed to provide avoided utility costs for distribution substation capacity, but not for distribution line capacity. The distribution system,
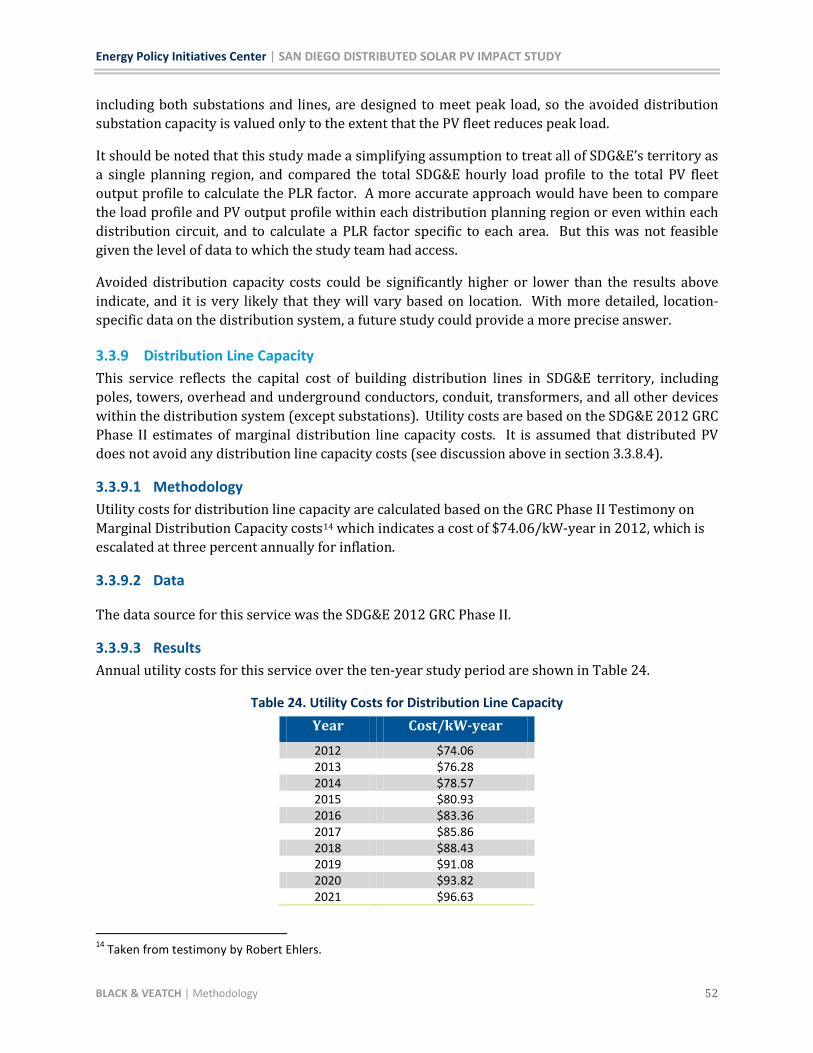
Energy Policy Initiatives Center | SAN DIEGO DISTRIBUTED SOLAR PV IMPACT STUDY
BLACK & VEATCH | Methodology 52
including both substations and lines, are designed to meet peak load, so the avoided distribution substation capacity is valued only to the extent that the PV fleet reduces peak load.
It should be noted that this study made a simplifying assumption to treat all of SDG&E’s territory as a single planning region, and compared the total SDG&E hourly load profile to the total PV fleet output profile to calculate the PLR factor. A more accurate approach would have been to compare the load profile and PV output profile within each distribution planning region or even within each distribution circuit, and to calculate a PLR factor specific to each area. But this was not feasible given the level of data to which the study team had access.
Avoided distribution capacity costs could be significantly higher or lower than the results above indicate, and it is very likely that they will vary based on location. With more detailed, location-specific data on the distribution system, a future study could provide a more precise answer.
3.3.9 Distribution Line Capacity This service reflects the capital cost of building distribution lines in SDG&E territory, including poles, towers, overhead and underground conductors, conduit, transformers, and all other devices within the distribution system (except substations). Utility costs are based on the SDG&E 2012 GRC Phase II estimates of marginal distribution line capacity costs. It is assumed that distributed PV does not avoid any distribution line capacity costs (see discussion above in section 3.3.8.4).
3.3.9.1 Methodology Utility costs for distribution line capacity are calculated based on the GRC Phase II Testimony on Marginal Distribution Capacity costs14
3.3.9.2 Data
which indicates a cost of $74.06/kW-year in 2012, which is escalated at three percent annually for inflation.
The data source for this service was the SDG&E 2012 GRC Phase II.
3.3.9.3 Results Annual utility costs for this service over the ten-year study period are shown in Table 24.
Table 24. Utility Costs for Distribution Line Capacity Year Cost/kW-year 2012 $74.06 2013 $76.28 2014 $78.57 2015 $80.93 2016 $83.36 2017 $85.86 2018 $88.43 2019 $91.08 2020 $93.82 2021 $96.63
14 Taken from testimony by Robert Ehlers.

Energy Policy Initiatives Center | SAN DIEGO DISTRIBUTED SOLAR PV IMPACT STUDY
BLACK & VEATCH | Methodology 53
3.3.9.4 Discussion For a discussion of why distributed PV is assumed not to avoid distribution line capacity, see section 3.3.8.4.
3.3.10 Distribution Voltage Regulation and Reactive Supply A major concern of utilities in integrating customer-sited generation, including distributed PV, is the potential impact of voltage disturbances that can occur when there is a substantial amount of energy from the customer-sited generators flowing into the distribution system (e.g. at noon on a sunny day with low load) and there is a sudden change in generation (e.g. when a cloud passes over and causes a brief dip in PV output). If these voltage fluctuations are large enough to exceed ANSI standard voltage limits on a particular circuit, they can cause a number of impacts, including damage to customer-owned electrical equipment or even power outages. While voltage fluctuation is a very real concern, the potential issues will depend on the loading of individual feeders and circuits, and it is difficult to generalize about when there will be a problem on an individual circuit, or the mitigation measures that will be required to resolve the problem. Historically, the FERC model interconnection procedures established a threshold—once distributed generation exceeds 15 percent of the peak load on a circuit, fast-track interconnection approval is not allowed and additional interconnection studies are required; this was based on an assumption that above 15 percent penetration voltage fluctuations and other stability problems on the distribution system are much more likely to manifest. However, recent experience in California and in Germany (where PV penetration is already very high) suggests that on average individual circuits will begin to experience problems when aggregate PV penetration reaches 20-30 percent of circuit peak load. It is important to note, though, that this is completely dependent on the characteristics of each circuit (load profile, PV output profile, location of PV on the circuit, X/R ratio at the PV location on the circuit, type of circuit, circuit minimum load, and existing voltage regulation equipment).
This service reflects the incremental cost incurred by the utility to install new equipment to ensure proper voltage regulation and reactive power supply on the distribution system due to stability issued caused by distributed PV. This cost is expected to grow over time as the amount of distributed PV installations increases.
3.3.10.1 Methodology To identify potential problems with the distribution system, SDG&E developed a projection of customer solar installations by circuit for the 738 distribution circuits (in year 2020) that make up its distribution system. This is based on the total expected PV capacity forecasted by the CEC in its 2012 demand forecast and SDG&E assumptions about load conditions on each circuit.
Because it is not possible to know exactly what mitigation measures are required without detailed modeling of each circuit (and because it is impossible to determine how the utilization of each circuit will be impacted by changes in load over the study period unrelated to the addition of PV, and how this may impact the need for mitigation) a simplifying assumption was made that once a circuit reaches 25 percent PV penetration, the installation of a Static VAR Compensator (SVC) is required to stabilize voltage fluctuations and maintain reliability on that circuit.
Using the following assumptions as a basis for addition of dynamic voltage support (e.g. SVCs), the study team developed cost assumptions for the installation of SVCs on each circuit:

Energy Policy Initiatives Center | SAN DIEGO DISTRIBUTED SOLAR PV IMPACT STUDY
BLACK & VEATCH | Methodology 54
SVCs systems installed will be sized in the tens of kVARs
Typical costs for these systems of this size are $200/kVAR
SVCs will provide approximately +/- 5 percent voltage support to each affected feeder, using power factor of 0.95 leading/lagging as a proxy
Table 25 shows the SDG&E forecast of distribution circuits in each year which exceed the 25 percent penetration threshold. SDG&E’s forecast did not extend past 2020, so the increase in 2021 is assumed to be equal to 2020.
Table 25. SDG&E Forecast of Distribution Circuits with PV Penetration Greater Than 25 Percent
2012 2013 2014 2015 2016 2017 2018 2019 2020 2021
Cumulative circuits over
25%
49 56 70 93 103 107 109 120 135 150
Annual increase in
circuits over 25%
22 7 14 23 10 4 2 11 15 15
In each year, the number of new circuits exceeding the 25 percent threshold is multiplied by the kVAR of support needed on each circuit and the $200/kVAR cost of an SVC; this yields the annual incremental cost of distribution voltage regulation and reactive supply for distributed PV on SDG&E’s distribution system. Annual incremental costs are divided by the capacity of PV installed in each year to obtain $/kW-year. SDG&E’s forecast did not extend past 2020, so costs in 2021 are assumed to be equal to 2020.
3.3.10.2 Data Data sources for this service were:
1) SDG&E Data Request response of June 6, 2013 2) Black & Veatch Assumption of Static VAR Compensator Cost - $200/kVAR
3.3.10.3 Results Though it is difficult to project exactly when these costs will be required, using the methodology above provides an estimate of the annual utility costs for this service in each year of the study period, as shown in Table 26Error! Reference source not found..
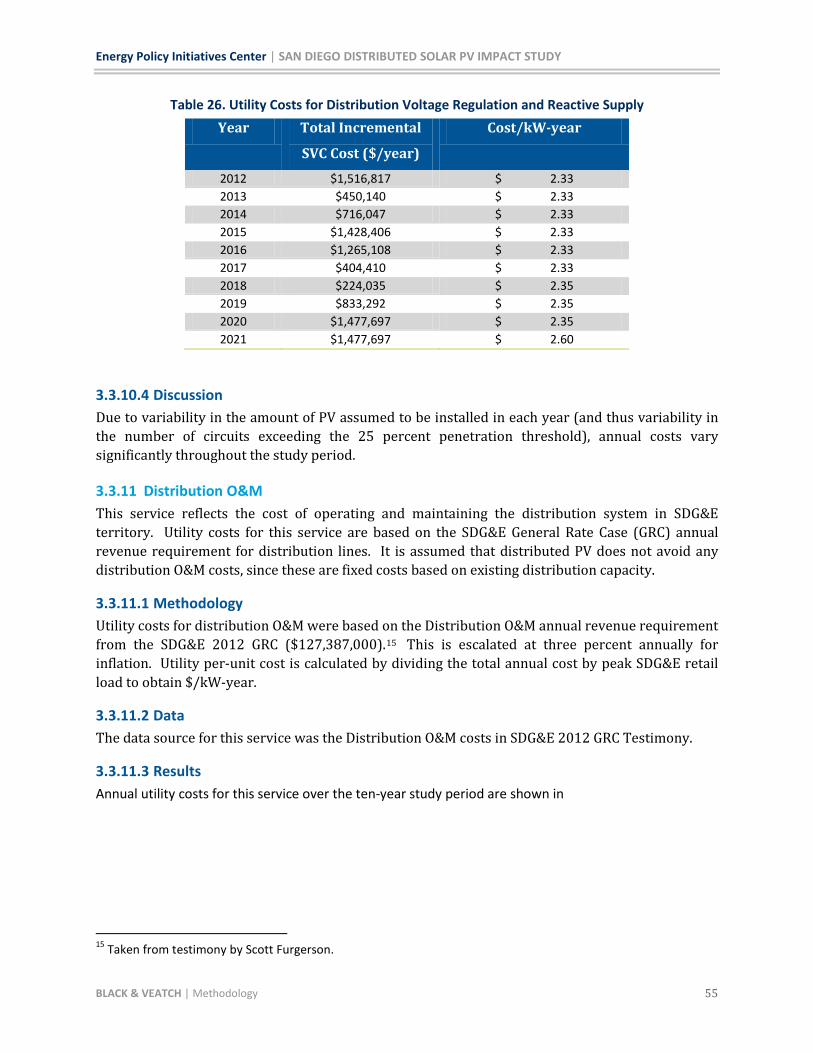
Energy Policy Initiatives Center | SAN DIEGO DISTRIBUTED SOLAR PV IMPACT STUDY
BLACK & VEATCH | Methodology 55
Table 26. Utility Costs for Distribution Voltage Regulation and Reactive Supply Year Total Incremental
SVC Cost ($/year)
Cost/kW-year
2012 $1,516,817 $ 2.33 2013 $450,140 $ 2.33 2014 $716,047 $ 2.33 2015 $1,428,406 $ 2.33 2016 $1,265,108 $ 2.33 2017 $404,410 $ 2.33 2018 $224,035 $ 2.35 2019 $833,292 $ 2.35 2020 $1,477,697 $ 2.35 2021 $1,477,697 $ 2.60
3.3.10.4 Discussion Due to variability in the amount of PV assumed to be installed in each year (and thus variability in the number of circuits exceeding the 25 percent penetration threshold), annual costs vary significantly throughout the study period.
3.3.11 Distribution O&M This service reflects the cost of operating and maintaining the distribution system in SDG&E territory. Utility costs for this service are based on the SDG&E General Rate Case (GRC) annual revenue requirement for distribution lines. It is assumed that distributed PV does not avoid any distribution O&M costs, since these are fixed costs based on existing distribution capacity.
3.3.11.1 Methodology Utility costs for distribution O&M were based on the Distribution O&M annual revenue requirement from the SDG&E 2012 GRC ($127,387,000).15
3.3.11.2 Data
This is escalated at three percent annually for inflation. Utility per-unit cost is calculated by dividing the total annual cost by peak SDG&E retail load to obtain $/kW-year.
The data source for this service was the Distribution O&M costs in SDG&E 2012 GRC Testimony.
3.3.11.3 Results Annual utility costs for this service over the ten-year study period are shown in
15 Taken from testimony by Scott Furgerson.

Energy Policy Initiatives Center | SAN DIEGO DISTRIBUTED SOLAR PV IMPACT STUDY
BLACK & VEATCH | Methodology 56
Table 27.
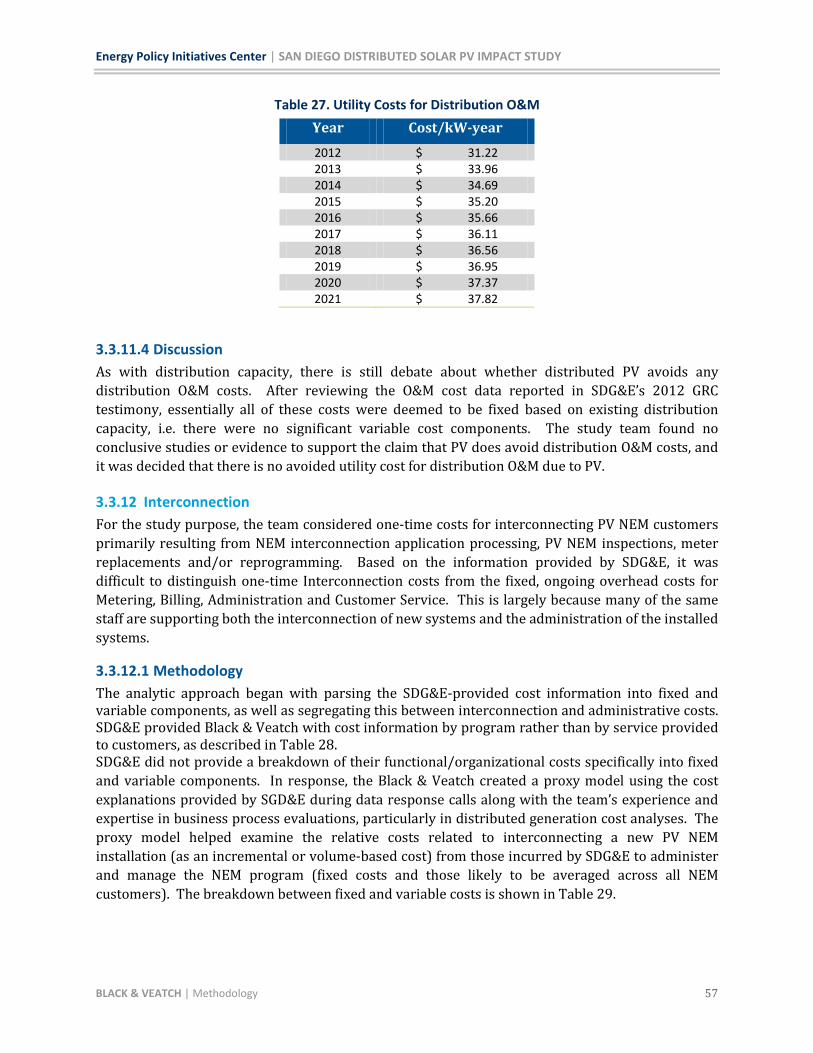
Energy Policy Initiatives Center | SAN DIEGO DISTRIBUTED SOLAR PV IMPACT STUDY
BLACK & VEATCH | Methodology 57
Table 27. Utility Costs for Distribution O&M Year Cost/kW-year 2012 $ 31.22 2013 $ 33.96 2014 $ 34.69 2015 $ 35.20 2016 $ 35.66 2017 $ 36.11 2018 $ 36.56 2019 $ 36.95 2020 $ 37.37 2021 $ 37.82
3.3.11.4 Discussion As with distribution capacity, there is still debate about whether distributed PV avoids any distribution O&M costs. After reviewing the O&M cost data reported in SDG&E’s 2012 GRC testimony, essentially all of these costs were deemed to be fixed based on existing distribution capacity, i.e. there were no significant variable cost components. The study team found no conclusive studies or evidence to support the claim that PV does avoid distribution O&M costs, and it was decided that there is no avoided utility cost for distribution O&M due to PV.
3.3.12 Interconnection For the study purpose, the team considered one-time costs for interconnecting PV NEM customers primarily resulting from NEM interconnection application processing, PV NEM inspections, meter replacements and/or reprogramming. Based on the information provided by SDG&E, it was difficult to distinguish one-time Interconnection costs from the fixed, ongoing overhead costs for Metering, Billing, Administration and Customer Service. This is largely because many of the same staff are supporting both the interconnection of new systems and the administration of the installed systems.
3.3.12.1 Methodology The analytic approach began with parsing the SDG&E-provided cost information into fixed and variable components, as well as segregating this between interconnection and administrative costs. SDG&E provided Black & Veatch with cost information by program rather than by service provided to customers, as described in Table 28. SDG&E did not provide a breakdown of their functional/organizational costs specifically into fixed and variable components. In response, the Black & Veatch created a proxy model using the cost explanations provided by SGD&E during data response calls along with the team’s experience and expertise in business process evaluations, particularly in distributed generation cost analyses. The proxy model helped examine the relative costs related to interconnecting a new PV NEM installation (as an incremental or volume-based cost) from those incurred by SDG&E to administer and manage the NEM program (fixed costs and those likely to be averaged across all NEM customers). The breakdown between fixed and variable costs is shown in Table 29.
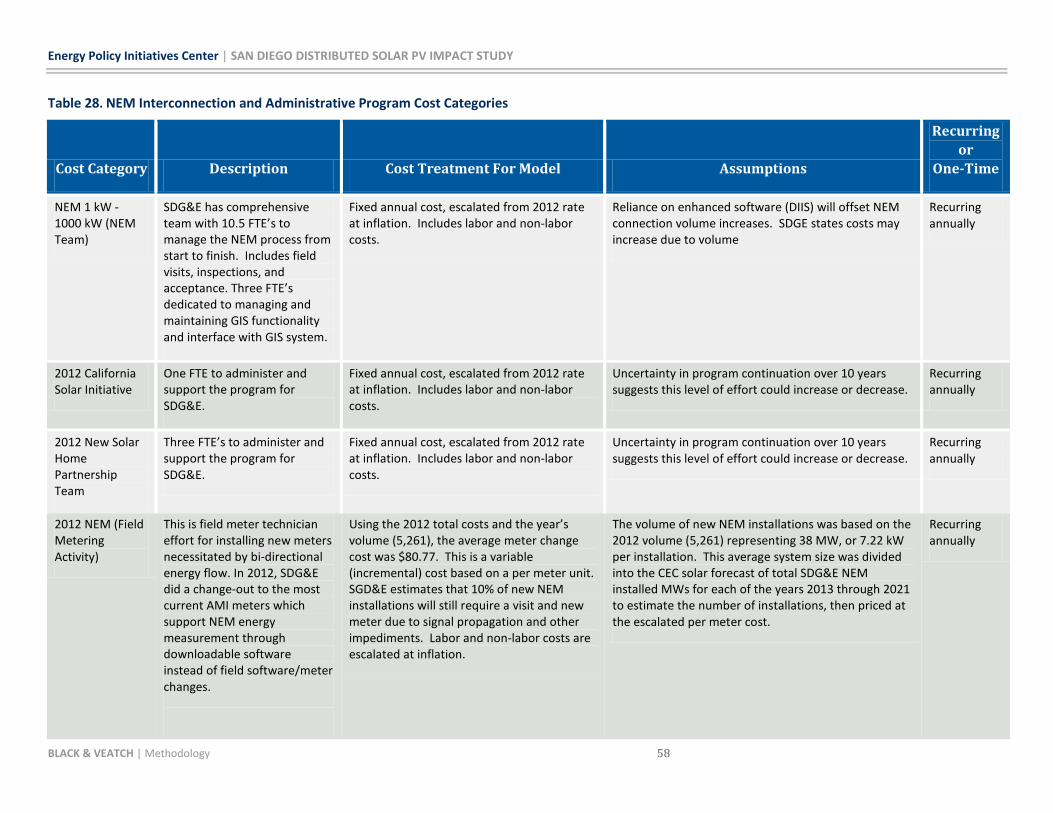
Energy Policy Initiatives Center | SAN DIEGO DISTRIBUTED SOLAR PV IMPACT STUDY
BLACK & VEATCH | Methodology 58
Table 28. NEM Interconnection and Administrative Program Cost Categories
Cost Category Description Cost Treatment For Model Assumptions
Recurring or
One-Time
NEM 1 kW - 1000 kW (NEM Team)
SDG&E has comprehensive team with 10.5 FTE’s to manage the NEM process from start to finish. Includes field visits, inspections, and acceptance. Three FTE’s dedicated to managing and maintaining GIS functionality and interface with GIS system.
Fixed annual cost, escalated from 2012 rate at inflation. Includes labor and non-labor costs.
Reliance on enhanced software (DIIS) will offset NEM connection volume increases. SDGE states costs may increase due to volume
Recurring annually
2012 California Solar Initiative
One FTE to administer and support the program for SDG&E.
Fixed annual cost, escalated from 2012 rate at inflation. Includes labor and non-labor costs.
Uncertainty in program continuation over 10 years suggests this level of effort could increase or decrease.
Recurring annually
2012 New Solar Home Partnership Team
Three FTE’s to administer and support the program for SDG&E.
Fixed annual cost, escalated from 2012 rate at inflation. Includes labor and non-labor costs.
Uncertainty in program continuation over 10 years suggests this level of effort could increase or decrease.
Recurring annually
2012 NEM (Field Metering Activity)
This is field meter technician effort for installing new meters necessitated by bi-directional energy flow. In 2012, SDG&E did a change-out to the most current AMI meters which support NEM energy measurement through downloadable software instead of field software/meter changes.
Using the 2012 total costs and the year’s volume (5,261), the average meter change cost was $80.77. This is a variable (incremental) cost based on a per meter unit. SGD&E estimates that 10% of new NEM installations will still require a visit and new meter due to signal propagation and other impediments. Labor and non-labor costs are escalated at inflation.
The volume of new NEM installations was based on the 2012 volume (5,261) representing 38 MW, or 7.22 kW per installation. This average system size was divided into the CEC solar forecast of total SDG&E NEM installed MWs for each of the years 2013 through 2021 to estimate the number of installations, then priced at the escalated per meter cost.
Recurring annually
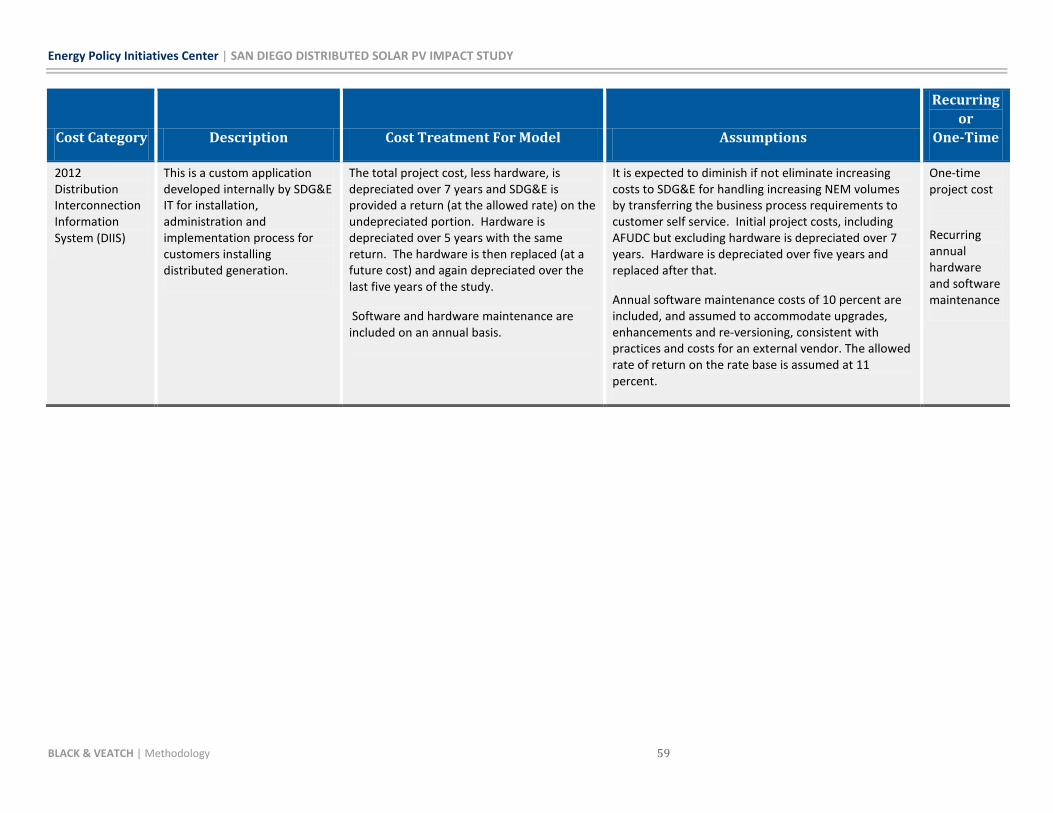
Energy Policy Initiatives Center | SAN DIEGO DISTRIBUTED SOLAR PV IMPACT STUDY
BLACK & VEATCH | Methodology 59
Cost Category Description Cost Treatment For Model Assumptions
Recurring or
One-Time
2012 Distribution Interconnection Information System (DIIS)
This is a custom application developed internally by SDG&E IT for installation, administration and implementation process for customers installing distributed generation.
The total project cost, less hardware, is depreciated over 7 years and SDG&E is provided a return (at the allowed rate) on the undepreciated portion. Hardware is depreciated over 5 years with the same return. The hardware is then replaced (at a future cost) and again depreciated over the last five years of the study.
Software and hardware maintenance are included on an annual basis.
It is expected to diminish if not eliminate increasing costs to SDG&E for handling increasing NEM volumes by transferring the business process requirements to customer self service. Initial project costs, including AFUDC but excluding hardware is depreciated over 7 years. Hardware is depreciated over five years and replaced after that.
Annual software maintenance costs of 10 percent are included, and assumed to accommodate upgrades, enhancements and re-versioning, consistent with practices and costs for an external vendor. The allowed rate of return on the rate base is assumed at 11 percent.
One-time project cost
Recurring annual hardware and software maintenance

Energy Policy Initiatives Center | SAN DIEGO DISTRIBUTED SOLAR PV IMPACT STUDY
BLACK & VEATCH | Methodology 60
Table 29. Fixed and Variable NEM Program and Interconnection Costs
Cost Item # FTE's % Fixed % Variable Application
NEM Team Costs
Labor - GIS 3 100% 0% Fixed costs - applied to all NEM customers, cumulatively.
Variable costs - applied to the annual NEM interconnections
Labor - Non-GIS 7.5 50% 50%
Employee Costs prorated on labor cost
Purchased Labor 10% 90%
Materials 10% 90%
Services 50% 50%
Contributions/Dues 100% 0%
Vehicles 10% 90%
California Solar Initiative
1 100% 0% All NEM customers, cumulatively
New Solar Homes Partnership
3 100% 0% All NEM customers, cumulatively
Metering Field Activity Cost Total
100% Annual NEM interconnections
DIIS - Hardware and Software Maintenance
100% Cumulative total of NEM interconnections beginning in 2012
DIIS - Rate Base Earnings
100% Cumulative total of NEM interconnections beginning in 2012
3.3.12.2 Data Black & Veatch prepared and submitted a data request to SDG&E in March 2013 seeking cost information on business processes associated with receiving, processing and implementing a new NEM customer, based on the application and implementation actions identified on SGD&E’s website for a potential NEM customer to follow. The intent was to identify the resource costs (e.g., labor, materials, fleet, outside services, etc.) required for individual process steps in the workflow from initial receipt of a new NEM interconnection request to acceptance of the final, inspected PV system including records preparation in the Customer Information System and billing system(s). SDG&E provided some limited information in the requested format, but also provided an alternate cost breakdown reflecting a centralized organization within SDG&E to serve NEM customers. After

Energy Policy Initiatives Center | SAN DIEGO DISTRIBUTED SOLAR PV IMPACT STUDY
BLACK & VEATCH | Methodology 61
discussion with SDG&E, the study team elected to use this information. Table 28 details the information provided by SDG&E by SDG&E-defined cost category.
The cost framework provided in Table 29 uses the total annual costs. The initial interpretation of the SDG&E process costs planned to evaluate those costs over the annual NEM installations, thus the forecast of NEM installations was of obvious importance to the study. Black & Veatch received a data response from SDG&E indicating that, in 2012, there were 5,261 customer installations totaling 38 MWac of capacity. This yields an average system size of 7.22 kW per installation. This was used to forecast the quantity of annual NEM installations for future years based on the MW forecast provided by the CEC in 2012. The installation forecast is shown in Table 30.
Table 30. Historical and Forecasted Annual NEM PV Installations
SDG&E PV NEM Installations by Year Cumulative # Installations Year PV kW(ac) Average System
Size (kW) Annual #
Installations
Pre-2012 125,370 7.96 15,741
2012 38,000 7.22 5,261 21,002
2013 15,000 7.22 2,077 23,079
2014 22,000 7.22 3,046 26,125
2015 30,000 7.22 4,153 30,278
2016 38,000 7.22 5,261 35,539
2017 6,000 7.22 831 36,370
2018 9,000 7.22 1,246 37,616
2019 20,000 7.22 2,769 40,385
2020 31,000 7.22 4,292 44,677
2021 31,000 7.22 4,292 48,969
Total 365,370 33,228
Data Sources:
Pre-2012: MW and # Installations from SDG&E Distribution System Interconnection Update, May 14, 2012, average system size = PV MW(ac)/# Installations
2012: MW and # Installations from SDG&E data request response on 6/12/2013, average system size = PV MW(ac)/# Installations

Energy Policy Initiatives Center | SAN DIEGO DISTRIBUTED SOLAR PV IMPACT STUDY
BLACK & VEATCH | Methodology 62
2013-2020: MW forecast from CEC; Average system size same as 2012; # installations = PV MW(ac)*Average System Size (kW)
2021: MW forecast from CEC; Average system size same as 2012; # installations = PV MW(ac)*Average System Size (kW)
3.3.12.3 Results Annual utility costs for this service over the ten-year study period are shown in Table 31.
Table 31. Utility Costs for Interconnection Year Total Cost Cost/Customer Cost/kW-year
2012 $ 1,319,185 $ 251 $34.72
2013 $ 916,152 $ 350 $61.08
2014 $ 929,249 $ 247 $42.24
2015 $ 944,188 $ 187 $31.47
2016 $ 959,873 $ 151 $25.26
2017 $ 933,716 $ 879 $155.62
2018 $ 945,322 $ 608 $105.04
2019 $ 985,202 $ 290 $49.26
2020 $ 1,025,924 $ 197 $33.09
2021 $ 1,055,227 $ 202 $34.04
3.3.12.4 Discussion Due largely to program staffing, SDG&E has a substantial amount of fixed costs associated with PV interconnection. The volatility of the annual forecast of new NEM installations, detailed on Table 30, clearly has a significant impact on the per-customer and per-kW cost. In years where economic incentives are scheduled to be discontinued, the NEM application volume is forecast to drop off substantially and there are simply fewer customers over which to apportion costs.
3.3.13 Metering/Billing/Administration/Customer Service This service reflects the annual cost of metering service and maintenance, billing, program administration and customer service for PV customers.
3.3.13.1 Methodology Discussed in Section 3.3.12 above, the Metering, Billing, Administration and Customer Service costs are co-mingled with the SDG&E Interconnection costs. Using the information in Table 29 and Table 30, Black & Veatch developed an annual estimate for these costs based on the expected level of PV capacity by year.
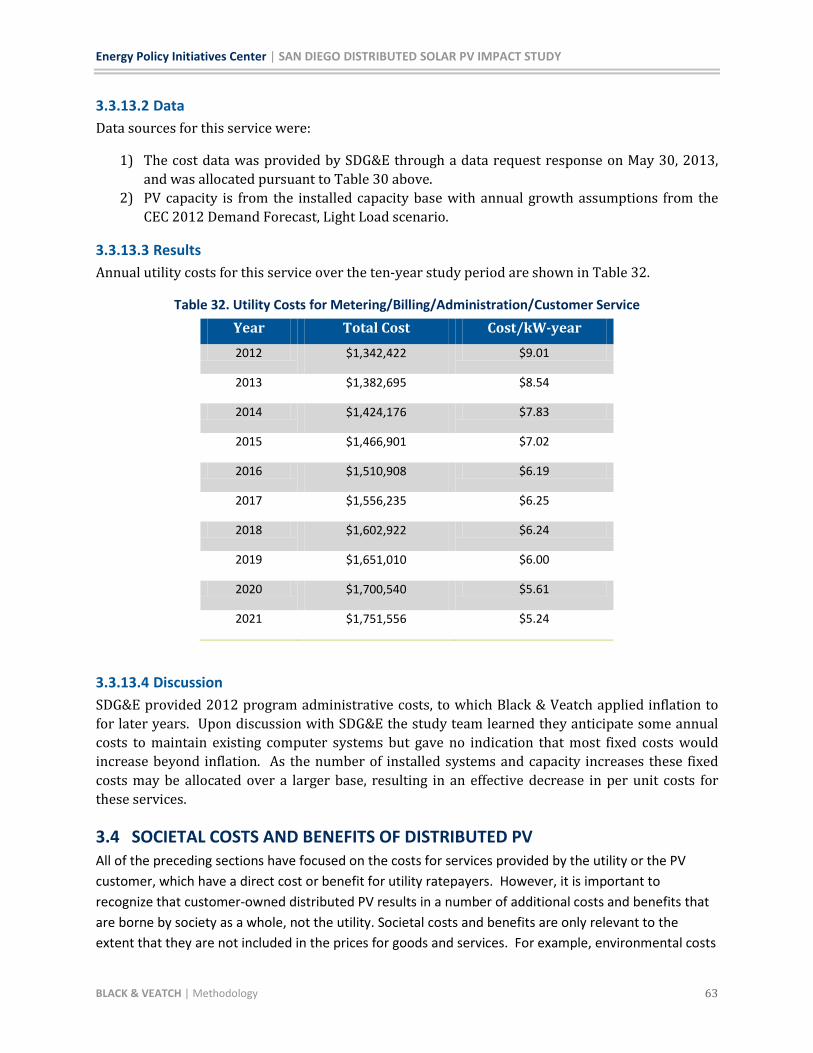
Energy Policy Initiatives Center | SAN DIEGO DISTRIBUTED SOLAR PV IMPACT STUDY
BLACK & VEATCH | Methodology 63
3.3.13.2 Data Data sources for this service were:
1) The cost data was provided by SDG&E through a data request response on May 30, 2013, and was allocated pursuant to Table 30 above.
2) PV capacity is from the installed capacity base with annual growth assumptions from the CEC 2012 Demand Forecast, Light Load scenario.
3.3.13.3 Results Annual utility costs for this service over the ten-year study period are shown in Table 32.
Table 32. Utility Costs for Metering/Billing/Administration/Customer Service
Year Total Cost Cost/kW-year 2012 $1,342,422 $9.01
2013 $1,382,695 $8.54
2014 $1,424,176 $7.83
2015 $1,466,901 $7.02
2016 $1,510,908 $6.19
2017 $1,556,235 $6.25
2018 $1,602,922 $6.24
2019 $1,651,010 $6.00
2020 $1,700,540 $5.61
2021 $1,751,556 $5.24
3.3.13.4 Discussion SDG&E provided 2012 program administrative costs, to which Black & Veatch applied inflation to for later years. Upon discussion with SDG&E the study team learned they anticipate some annual costs to maintain existing computer systems but gave no indication that most fixed costs would increase beyond inflation. As the number of installed systems and capacity increases these fixed costs may be allocated over a larger base, resulting in an effective decrease in per unit costs for these services.
3.4 SOCIETAL COSTS AND BENEFITS OF DISTRIBUTED PV All of the preceding sections have focused on the costs for services provided by the utility or the PV customer, which have a direct cost or benefit for utility ratepayers. However, it is important to recognize that customer-owned distributed PV results in a number of additional costs and benefits that are borne by society as a whole, not the utility. Societal costs and benefits are only relevant to the extent that they are not included in the prices for goods and services. For example, environmental costs

Energy Policy Initiatives Center | SAN DIEGO DISTRIBUTED SOLAR PV IMPACT STUDY
BLACK & VEATCH | Methodology 64
have been included in the avoided costs to the extent that regulations require a market price for CO2 or for other environmental impacts. More than likely, it is the cost such as the implied subsidies for PV that occurs through net metering that represent a societal cost. In particular, there are the effects of intra-class cross subsidies that have a negative impact on society (The societal benefits are widely known and documented, but the societal costs are often not mentioned—this report seeks to give a fair representation of both.) Though these societal costs and benefits do not have a direct impact on the cost of service for PV customers, they are crucial in considerations of whether society as a whole should invest resources in additional distributed PV capacity. Because the cost of service for PV customers is the focus of this study, societal costs and benefits of PV are not quantified here—numerous other studies have examined those issues. Table 33 provides descriptions of the societal benefits of distributed PV, and

Energy Policy Initiatives Center | SAN DIEGO DISTRIBUTED SOLAR PV IMPACT STUDY
BLACK & VEATCH | Methodology 65
Table 34 provides descriptions of the societal costs of distributed PV. These lists of societal costs and benefits are not intended to be comprehensive; rather, they are meant to capture the most important costs and benefits, and to emphasize that there are other factors beyond direct utility costs that should be taken into account when deploying distributed PV.
Table 33. Societal Benefits of Distributed PV
Jobs and Economic Development
The deployment of distributed PV creates jobs directly for PV developers and installers, as well as jobs in PV inspection (often performed by the utility but sometimes by independent contractors), PV equipment manufacturing, PV equipment distribution, PV operations and maintenance, PV decommissioning and recycling, PV project finance, PV technical consulting, and other PV-related activities. Some studies have suggested that 15-30 direct jobs are created for every megawatt of distributed PV installed,16 and the jobs created generally required skilled labor and pay good wages. Distributed PV involves jobs in many areas, including engineering, electrical installation, manufacturing, roofing, sales, administration and accounting, consulting, and finance. These new jobs and additional income from savings on customer electricity bills create indirect jobs in other industries and related economic development benefits, such as greater opportunities in the construction industry, which has been particularly hard hit by job losses in recent years. This economic activity also generates revenue for state and local jurisdictions in the form of increased sales taxes and payroll taxes. Finally, the installation of distributed PV attracts private investment in local jurisdictions that would not otherwise take place, and leverages federal tax benefits (in the form of the Investment Tax Credit) that would otherwise flow to other jurisdictions.17
Improved Recovery After Natural Disasters and Other Emergencies
Natural disasters or other emergencies often disrupt the electric grid and the supply of other fuels in the affected area, and this lack of readily available energy sources can hamper recovery efforts. Distributed PV (either grid-connected or off-grid) can provide an immediate electricity source in any affected area without relying on a functional electric grid or imported fuels for a diesel generator. This can accelerate recovery after the disaster and in some cases even save lives, as well as reduce the economic impact of power outages. In fact, distributed PV is becoming increasingly common as an emergency power source in the wake of major storms such as Hurricane Sandy.
16 Kammen, Daniel, University of California – Berkeley, “Testimony before the US Senate Hearing on Environment and Public Works,” Sept. 25 2007; and Navigant Consulting, Inc., “Economic Impacts of Extending Federal Solar Tax Credits,” Final Report, September 15, 2008. http://seia.org/galleries/pdf/Navigant%20Consulting%20Report%209.15.08.pdf. 17 Petition for Societal Cost-Benefit Evaluation of California’s Net Energy Metering Program, June 6, 2013. http://www.energy.ca.gov/2013_energypolicy/documents/2013-06-06_Petition_for_CEC_to_perform_net_metering_societal_cost-benefit_study_TN-71170.pdf

Energy Policy Initiatives Center | SAN DIEGO DISTRIBUTED SOLAR PV IMPACT STUDY
BLACK & VEATCH | Methodology 66
Environmental Benefits
Conventional fossil fuel plants emit various pollutants besides GHGs, including sulfur oxides, nitrogen oxides, particulates, mercury, and others. While most of these emissions are regulated, many argue that utilities are not paying the full costs for the environmental damage created by these pollutants. The harm caused by the production of fossil and nuclear fuels (coal mining, uranium mining and processing, oil drilling, hydraulic fracturing for natural gas, etc.) and the waste products of the power generation process (coal ash, nuclear waste, etc.) is also not taken into account. By avoiding generation from conventional fossil fuel plants and thereby reducing harmful emissions as well as the need to produce fossil fuels, distributed PV reduces the costs of environmental damage, and this value is not fully captured in the avoided cost of energy. On a per-unit basis, distributed PV also requires less water and other resources to operate and maintain than conventional fossil fuel plants, and this benefit is not usually valued.
Energy Security
Distributed PV also has a known up-front cost, with very low O&M costs and no fuel costs; since it does not depend on volatile and rising fossil fuel prices, and instead relies on an energy source that is free and inexhaustible, it contributes to long-term energy security.
Improved Human Health
The production of fossil and nuclear fuels, the waste products of the power generation process, and the emissions from the fossil fuel plants all have negative impacts on human health. These impacts can take the form of increased asthma rates due to air pollutants, injuries during coal mining accidents, radiation exposure from nuclear fuels and nuclear waste, and a multitude of others. By reducing these impacts, distributed PV generation is creating a societal benefit that is not usually valued in the price of energy.

Energy Policy Initiatives Center | SAN DIEGO DISTRIBUTED SOLAR PV IMPACT STUDY
BLACK & VEATCH | Methodology 67
Table 34. Societal Costs of Distributed PV
Recycling and Decommissioning
Though PV modules are usually guaranteed to last 20-30 years, and may last longer than that, all PV systems have a finite lifetime; at some point, the PV system will need to be decommissioned and the PV equipment will need to be recycled. This represents a real cost that is borne by the PV system owner rather than the utility, so it is included here.
Operations & Maintenance
O&M costs for distributed PV are generally low, but not negligible. They include PV panel washing (which may involve significant water use depending on the system location and technology used), repair or replacement of inverters and other equipment, any system monitoring costs beyond utility metering, owner-scheduled inspections, any additional insurance or administrative costs, and other O&M costs. Again, these costs are borne by the system owner rather than the utility, so they are considered societal costs within the context of this study.
Safety Risks
The installation and operation of distributed PV systems involves well-known safety risks, including installers falling from rooftops, fire hazards from incorrectly installed electrical equipment, and electrocution of installers or system owners who do not follow proper safety precautions. Over time, as the industry has grown and become more mature, these risks have been addressed and today they are considered minimal. However, accidents do still occur and the costs related to these accidents are borne by installers, system owners, and sometimes other parties as well. During an outage, others are exposed to live feeds even when the power is generally out of service unless the installation includes an automatic disconnect from the grid.
Environmental and Human Health Impacts from PV Equipment Manufacturing
Just as there are environmental and human health impacts from the production of fossil and nuclear fuels and the waste products of the power generation process, there are also impacts from the production of raw materials for PV equipment, the manufacturing of PV equipment, and the disposal of PV equipment at the end of its useful life. On a per-unit basis, these are generally smaller than impacts from conventional power generation technologies, but given the large scale of the global PV industry the total impacts of PV materials are significant. In addition, it should be noted that most of this activity now occurs outside the United States, so the costs of these impacts are a global societal cost.
Lost Jobs and Tax Revenue
As noted throughout this report, increasing deployment of distributed PV displaces the utility’s energy purchases, generation capacity, transmission and distribution capacity, and RPS procurement. This displacement could eventually lead to job losses for the utility (at utility-

Energy Policy Initiatives Center | SAN DIEGO DISTRIBUTED SOLAR PV IMPACT STUDY
BLACK & VEATCH | Methodology 68
owned generation plants or in transmission and distribution engineering and O&M), and for independent power producers selling into the market if their plants operate less. In addition, there is likely some lost tax revenue for local communities, because utilities often pay taxes to local jurisdictions based on energy sales.
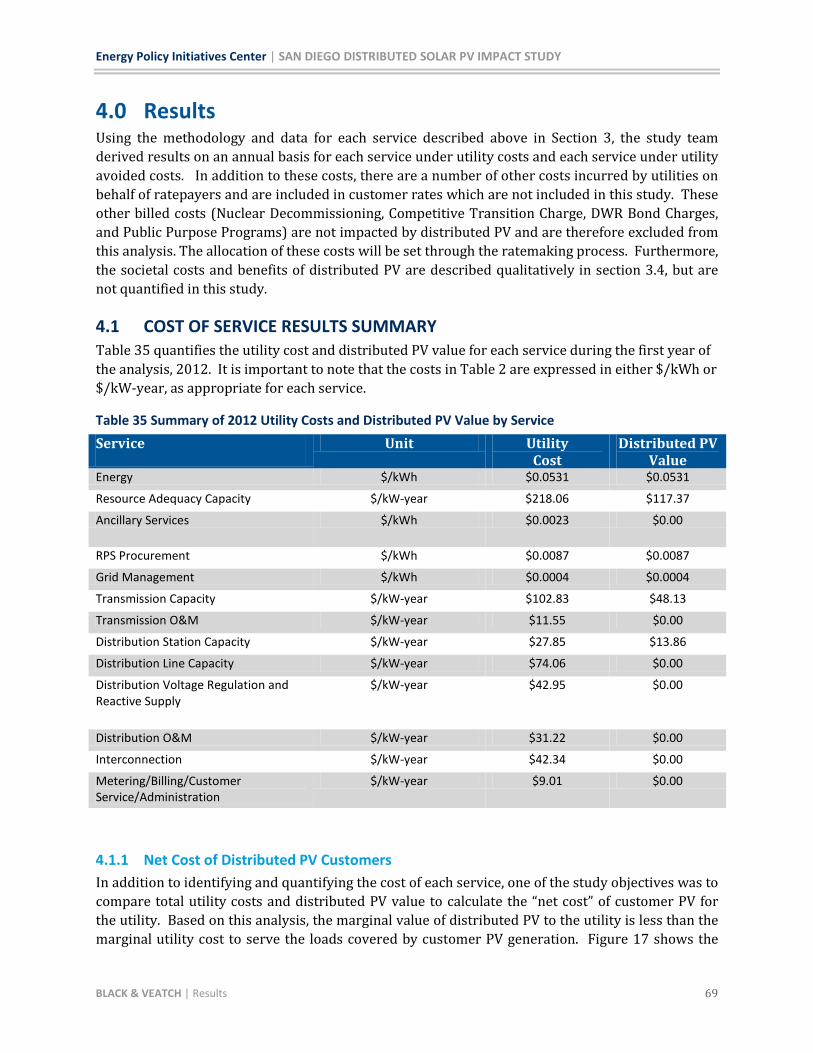
Energy Policy Initiatives Center | SAN DIEGO DISTRIBUTED SOLAR PV IMPACT STUDY
BLACK & VEATCH | Results 69
4.0 Results Using the methodology and data for each service described above in Section 3, the study team derived results on an annual basis for each service under utility costs and each service under utility avoided costs. In addition to these costs, there are a number of other costs incurred by utilities on behalf of ratepayers and are included in customer rates which are not included in this study. These other billed costs (Nuclear Decommissioning, Competitive Transition Charge, DWR Bond Charges, and Public Purpose Programs) are not impacted by distributed PV and are therefore excluded from this analysis. The allocation of these costs will be set through the ratemaking process. Furthermore, the societal costs and benefits of distributed PV are described qualitatively in section 3.4, but are not quantified in this study.
4.1 COST OF SERVICE RESULTS SUMMARY Table 35 quantifies the utility cost and distributed PV value for each service during the first year of the analysis, 2012. It is important to note that the costs in Table 2 are expressed in either $/kWh or $/kW-year, as appropriate for each service.
Table 35 Summary of 2012 Utility Costs and Distributed PV Value by Service
Service Unit Utility Cost
Distributed PV Value
Energy $/kWh $0.0531 $0.0531
Resource Adequacy Capacity $/kW-year $218.06 $117.37
Ancillary Services $/kWh $0.0023 $0.00
RPS Procurement $/kWh $0.0087 $0.0087
Grid Management $/kWh $0.0004 $0.0004
Transmission Capacity $/kW-year $102.83 $48.13
Transmission O&M $/kW-year $11.55 $0.00
Distribution Station Capacity $/kW-year $27.85 $13.86
Distribution Line Capacity $/kW-year $74.06 $0.00
Distribution Voltage Regulation and Reactive Supply
$/kW-year $42.95 $0.00
Distribution O&M $/kW-year $31.22 $0.00
Interconnection $/kW-year $42.34 $0.00
Metering/Billing/Customer Service/Administration
$/kW-year $9.01 $0.00
4.1.1 Net Cost of Distributed PV Customers In addition to identifying and quantifying the cost of each service, one of the study objectives was to compare total utility costs and distributed PV value to calculate the “net cost” of customer PV for the utility. Based on this analysis, the marginal value of distributed PV to the utility is less than the marginal utility cost to serve the loads covered by customer PV generation. Figure 17 shows the
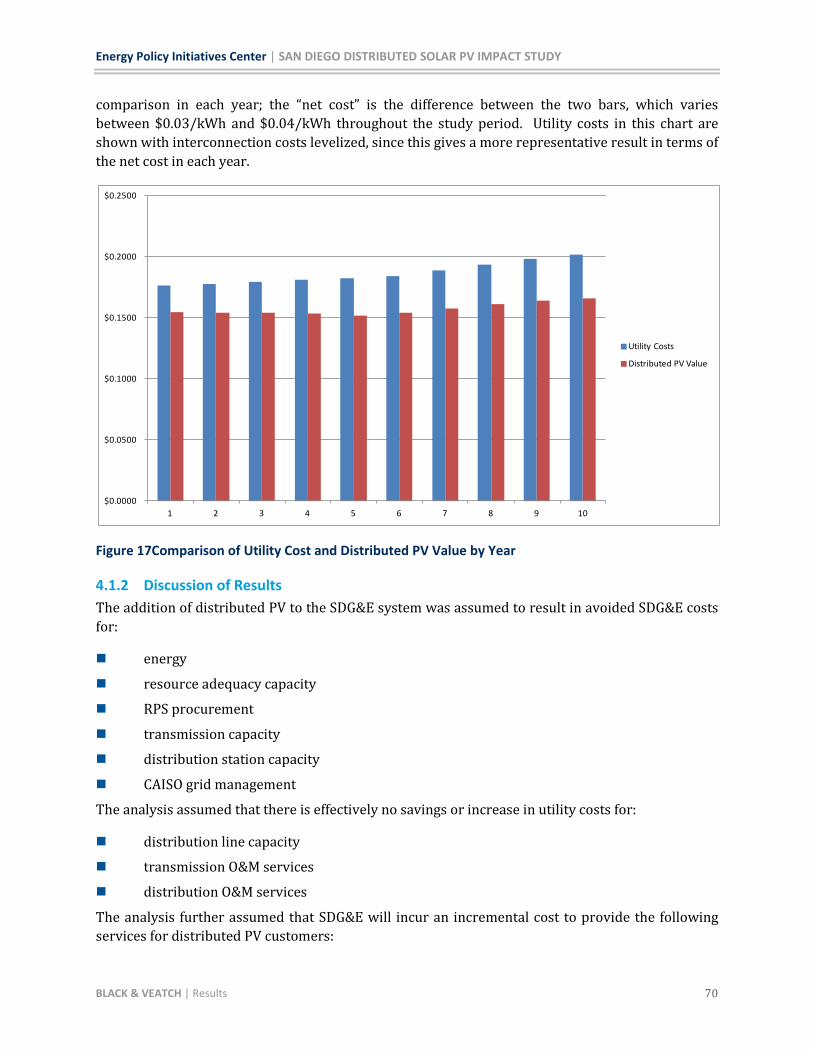
Energy Policy Initiatives Center | SAN DIEGO DISTRIBUTED SOLAR PV IMPACT STUDY
BLACK & VEATCH | Results 70
comparison in each year; the “net cost” is the difference between the two bars, which varies between $0.03/kWh and $0.04/kWh throughout the study period. Utility costs in this chart are shown with interconnection costs levelized, since this gives a more representative result in terms of the net cost in each year.
Figure 17Comparison of Utility Cost and Distributed PV Value by Year
4.1.2 Discussion of Results The addition of distributed PV to the SDG&E system was assumed to result in avoided SDG&E costs for:
energy
resource adequacy capacity
RPS procurement
transmission capacity
distribution station capacity
CAISO grid management
The analysis assumed that there is effectively no savings or increase in utility costs for:
distribution line capacity
transmission O&M services
distribution O&M services
The analysis further assumed that SDG&E will incur an incremental cost to provide the following services for distributed PV customers:
$0.0000
$0.0500
$0.1000
$0.1500
$0.2000
$0.2500
1 2 3 4 5 6 7 8 9 10
Utility Costs
Distributed PV Value
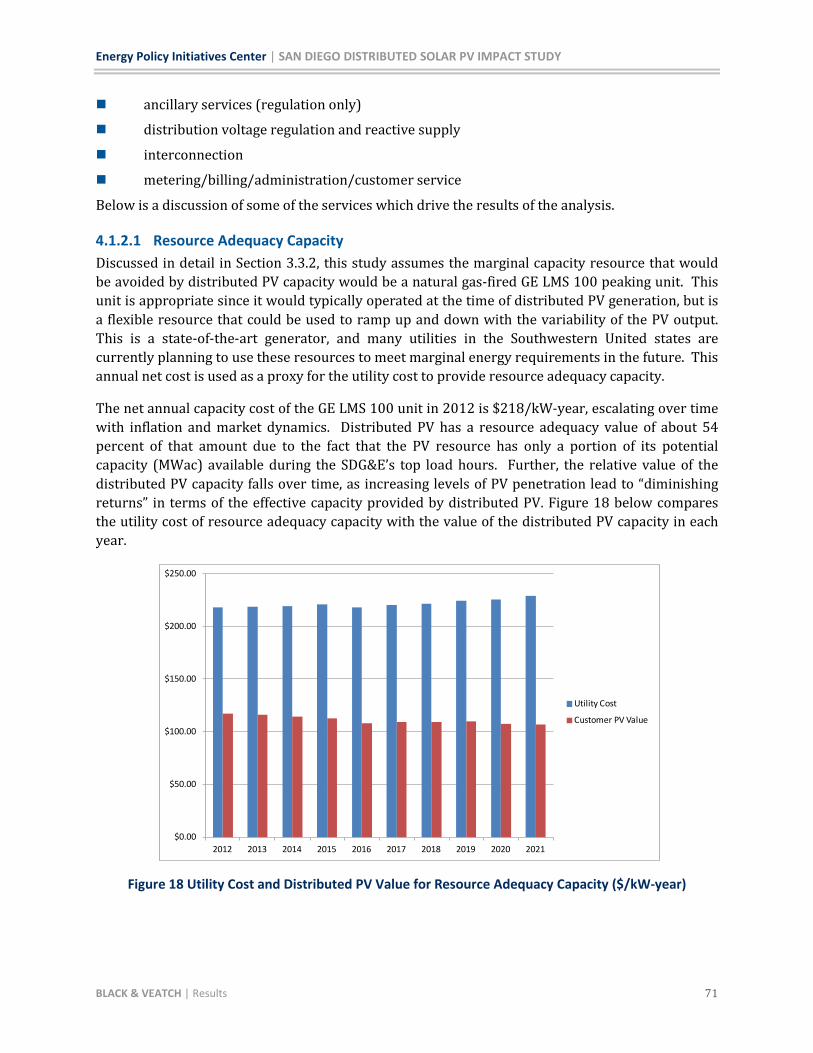
Energy Policy Initiatives Center | SAN DIEGO DISTRIBUTED SOLAR PV IMPACT STUDY
BLACK & VEATCH | Results 71
ancillary services (regulation only)
distribution voltage regulation and reactive supply
interconnection
metering/billing/administration/customer service
Below is a discussion of some of the services which drive the results of the analysis. 4.1.2.1 Resource Adequacy Capacity Discussed in detail in Section 3.3.2, this study assumes the marginal capacity resource that would be avoided by distributed PV capacity would be a natural gas-fired GE LMS 100 peaking unit. This unit is appropriate since it would typically operated at the time of distributed PV generation, but is a flexible resource that could be used to ramp up and down with the variability of the PV output. This is a state-of-the-art generator, and many utilities in the Southwestern United states are currently planning to use these resources to meet marginal energy requirements in the future. This annual net cost is used as a proxy for the utility cost to provide resource adequacy capacity.
The net annual capacity cost of the GE LMS 100 unit in 2012 is $218/kW-year, escalating over time with inflation and market dynamics. Distributed PV has a resource adequacy value of about 54 percent of that amount due to the fact that the PV resource has only a portion of its potential capacity (MWac) available during the SDG&E’s top load hours. Further, the relative value of the distributed PV capacity falls over time, as increasing levels of PV penetration lead to “diminishing returns” in terms of the effective capacity provided by distributed PV. Figure 18 below compares the utility cost of resource adequacy capacity with the value of the distributed PV capacity in each year.
Figure 18 Utility Cost and Distributed PV Value for Resource Adequacy Capacity ($/kW-year)
$0.00
$50.00
$100.00
$150.00
$200.00
$250.00
2012 2013 2014 2015 2016 2017 2018 2019 2020 2021
Utility Cost
Customer PV Value
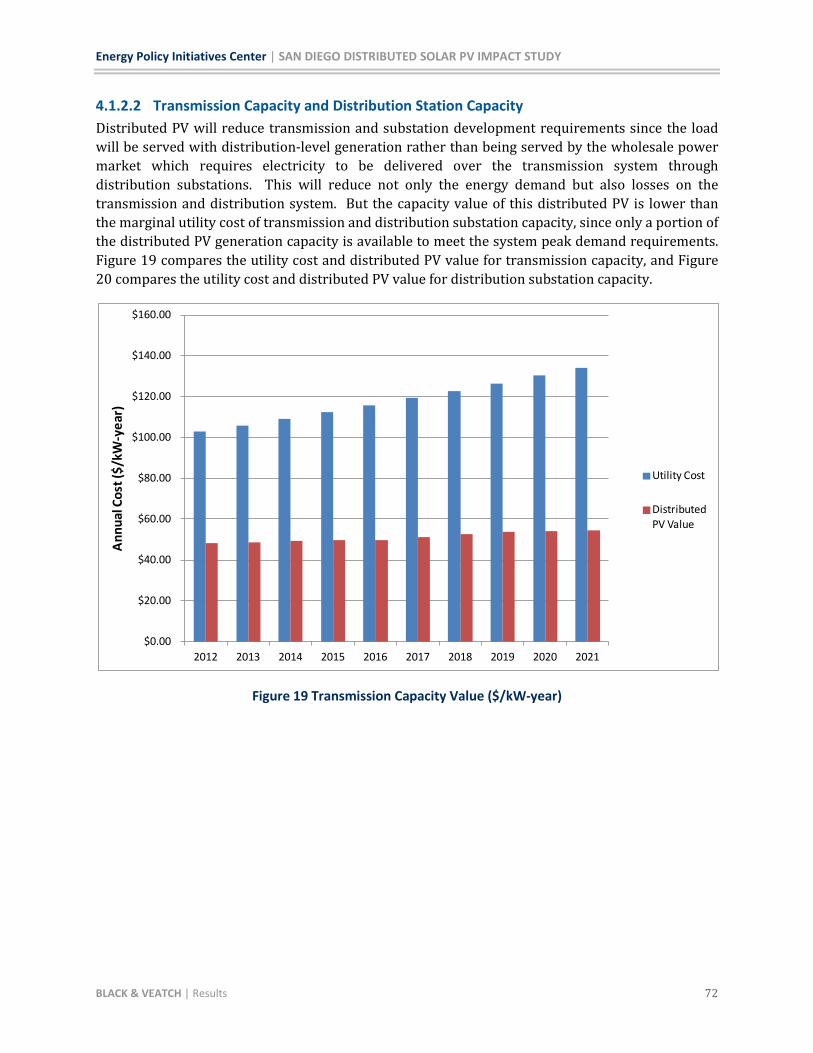
Energy Policy Initiatives Center | SAN DIEGO DISTRIBUTED SOLAR PV IMPACT STUDY
BLACK & VEATCH | Results 72
4.1.2.2 Transmission Capacity and Distribution Station Capacity Distributed PV will reduce transmission and substation development requirements since the load will be served with distribution-level generation rather than being served by the wholesale power market which requires electricity to be delivered over the transmission system through distribution substations. This will reduce not only the energy demand but also losses on the transmission and distribution system. But the capacity value of this distributed PV is lower than the marginal utility cost of transmission and distribution substation capacity, since only a portion of the distributed PV generation capacity is available to meet the system peak demand requirements. Figure 19 compares the utility cost and distributed PV value for transmission capacity, and Figure 20 compares the utility cost and distributed PV value for distribution substation capacity.
Figure 19 Transmission Capacity Value ($/kW-year)
$0.00
$20.00
$40.00
$60.00
$80.00
$100.00
$120.00
$140.00
$160.00
2012 2013 2014 2015 2016 2017 2018 2019 2020 2021
Annu
al C
ost (
$/kW
-yea
r)
Utility Cost
Distributed PV Value

Energy Policy Initiatives Center | SAN DIEGO DISTRIBUTED SOLAR PV IMPACT STUDY
BLACK & VEATCH | Results 73
Figure 20 Distributed Substation Capacity Value ($/kW-year)
4.1.2.3 Distribution System Voltage Regulation and Reactive Supply A concern with adding substantial amounts of distributed PV to the distribution system is that it will cause voltage fluctuations that will require mitigation in order to ensure reliable electric service for all customers. SDG&E created a forecast of the quantity of PV on each distribution circuit over the ten-year study period. The costs presented here are meant to be indicative of potential costs, and are based on Black & Veatch’s estimate of when a typical circuit on average may require mitigation measures (when distributed PV reached 25% penetration) and the potential mitigation costs to stabilize voltage (which are based on the installed cost of a Static VAR Compensator or SVC). However, these are generic assumptions. The true costs for distribution system voltage regulation and reactive supply in SDG&E territory will likely vary from the results of this study, but it is impossible to project how they will vary or when they may be incurred without a more granular forecast of distributed PV penetration and without performing detailed modeling studies for individual circuits.
4.1.2.4 Interconnection SDG&E has developed substantial infrastructure capacity to implement and track interconnections of distributed PV systems, resulting in a high fixed cost for installations. The variable cost component of interconnections, which are largely driven by meter upgrades for a portion of all installations, is relatively small. Since the annual fixed and variable costs are divided by the number of installations per year, which change annually based on CEC distributed PV growth assumptions, the annual interconnection costs appear to be highly variable. Figure 21 depicts the
$0.00
$20.00
$40.00
$60.00
$80.00
$100.00
$120.00
$140.00
$160.00
2012 2013 2014 2015 2016 2017 2018 2019 2020 2021
Ann
ual C
ost (
$/kW
-yea
r)
Utility Cost
Distributed PV Value

Energy Policy Initiatives Center | SAN DIEGO DISTRIBUTED SOLAR PV IMPACT STUDY
BLACK & VEATCH | Results 74
annual interconnection costs per kW installed, based on an allocation of costs over the number of annual installations, compared to the average cost over the study period.
Figure 21 Annual Interconnection Costs ($/kW-year)
4.2 DETAILED ANNUAL COST OF SERVICE RESULTS Table 36 shows a detailed summary of the annual costs of the services provided by the utility to the PV customer, while Table 37 shows a detailed summary of the annual costs of the services provided by the PV customer to the utility. The basis for each service is shown as well as the unit, with some services on a “variable” energy basis ($/kWh) and some on a “fixed” capacity basis ($/kW-year).
$0.00
$20.00
$40.00
$60.00
$80.00
$100.00
$120.00
$140.00
$160.00
$180.00
2012 2013 2014 2015 2016 2017 2018 2019 2020 2021
Annu
al C
ost (
$/kW
-yea
r)
Interconnection Cost ($/kW-installed)
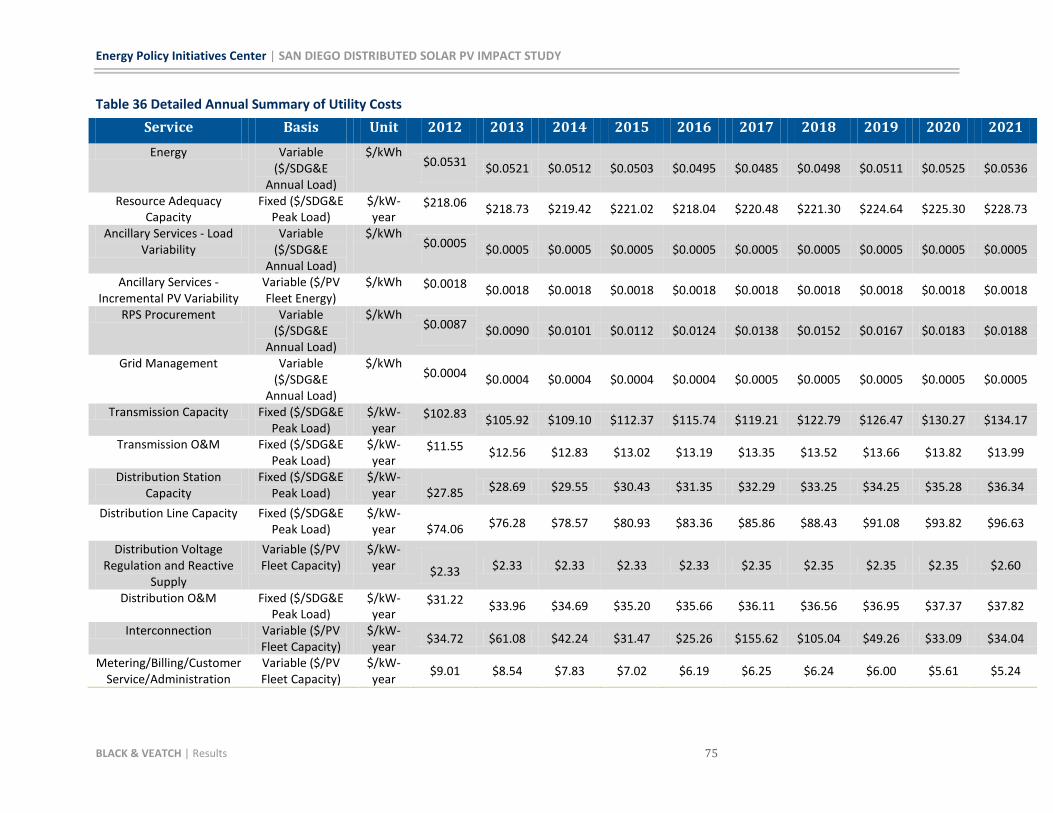
Energy Policy Initiatives Center | SAN DIEGO DISTRIBUTED SOLAR PV IMPACT STUDY
BLACK & VEATCH | Results 75
Table 36 Detailed Annual Summary of Utility Costs Service Basis Unit 2012 2013 2014 2015 2016 2017 2018 2019 2020 2021 Energy Variable
($/SDG&E Annual Load)
$/kWh $0.0531 $0.0521 $0.0512 $0.0503 $0.0495 $0.0485 $0.0498 $0.0511 $0.0525 $0.0536
Resource Adequacy Capacity
Fixed ($/SDG&E Peak Load)
$/kW-year
$218.06 $218.73 $219.42 $221.02 $218.04 $220.48 $221.30 $224.64 $225.30 $228.73
Ancillary Services - Load Variability
Variable ($/SDG&E
Annual Load)
$/kWh $0.0005 $0.0005 $0.0005 $0.0005 $0.0005 $0.0005 $0.0005 $0.0005 $0.0005 $0.0005
Ancillary Services - Incremental PV Variability
Variable ($/PV Fleet Energy)
$/kWh $0.0018 $0.0018 $0.0018 $0.0018 $0.0018 $0.0018 $0.0018 $0.0018 $0.0018 $0.0018
RPS Procurement Variable ($/SDG&E
Annual Load)
$/kWh $0.0087 $0.0090 $0.0101 $0.0112 $0.0124 $0.0138 $0.0152 $0.0167 $0.0183 $0.0188
Grid Management Variable ($/SDG&E
Annual Load)
$/kWh $0.0004 $0.0004 $0.0004 $0.0004 $0.0004 $0.0005 $0.0005 $0.0005 $0.0005 $0.0005
Transmission Capacity Fixed ($/SDG&E Peak Load)
$/kW-year
$102.83 $105.92 $109.10 $112.37 $115.74 $119.21 $122.79 $126.47 $130.27 $134.17
Transmission O&M Fixed ($/SDG&E Peak Load)
$/kW-year
$11.55 $12.56 $12.83 $13.02 $13.19 $13.35 $13.52 $13.66 $13.82 $13.99
Distribution Station Capacity
Fixed ($/SDG&E Peak Load)
$/kW-year $27.85 $28.69 $29.55 $30.43 $31.35 $32.29 $33.25 $34.25 $35.28 $36.34
Distribution Line Capacity Fixed ($/SDG&E Peak Load)
$/kW-year $74.06 $76.28 $78.57 $80.93 $83.36 $85.86 $88.43 $91.08 $93.82 $96.63
Distribution Voltage Regulation and Reactive
Supply
Variable ($/PV Fleet Capacity)
$/kW-year $2.33 $2.33 $2.33 $2.33 $2.33 $2.35 $2.35 $2.35 $2.35 $2.60
Distribution O&M Fixed ($/SDG&E Peak Load)
$/kW-year
$31.22 $33.96 $34.69 $35.20 $35.66 $36.11 $36.56 $36.95 $37.37 $37.82
Interconnection Variable ($/PV Fleet Capacity)
$/kW-year $34.72 $61.08 $42.24 $31.47 $25.26 $155.62 $105.04 $49.26 $33.09 $34.04
Metering/Billing/Customer Service/Administration
Variable ($/PV Fleet Capacity)
$/kW-year $9.01 $8.54 $7.83 $7.02 $6.19 $6.25 $6.24 $6.00 $5.61 $5.24
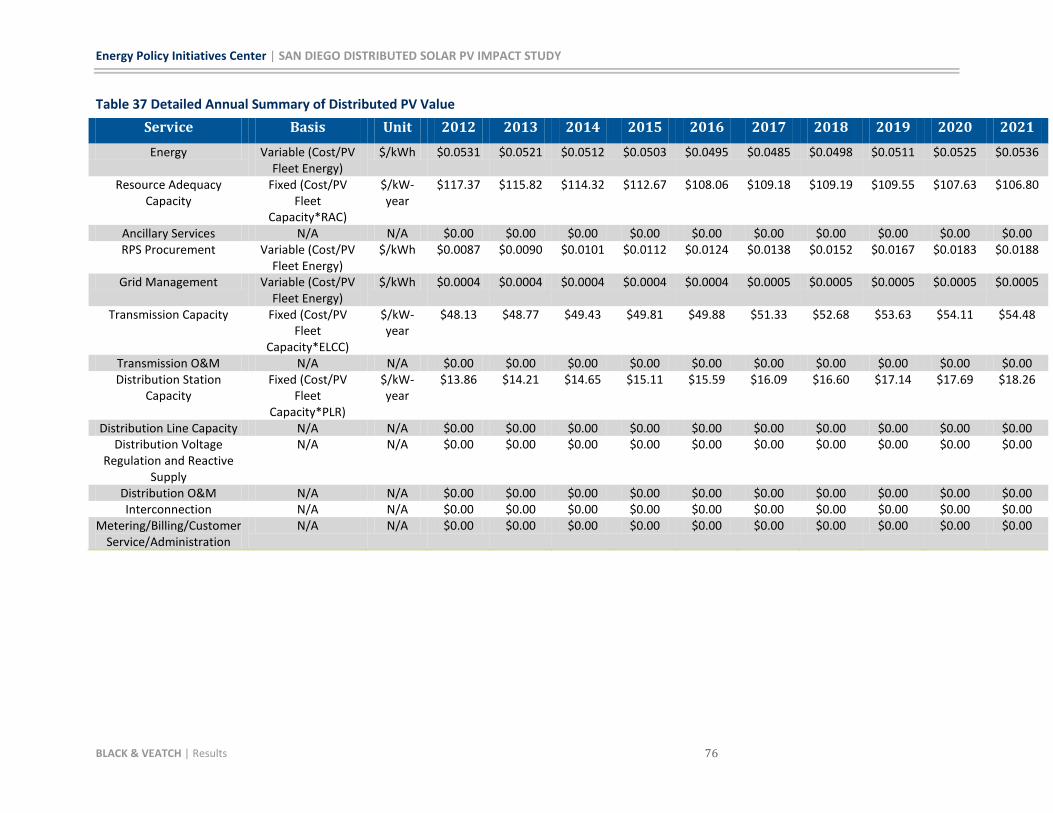
Energy Policy Initiatives Center | SAN DIEGO DISTRIBUTED SOLAR PV IMPACT STUDY
BLACK & VEATCH | Results 76
Table 37 Detailed Annual Summary of Distributed PV Value Service Basis Unit 2012 2013 2014 2015 2016 2017 2018 2019 2020 2021 Energy Variable (Cost/PV
Fleet Energy) $/kWh $0.0531 $0.0521 $0.0512 $0.0503 $0.0495 $0.0485 $0.0498 $0.0511 $0.0525 $0.0536
Resource Adequacy Capacity
Fixed (Cost/PV Fleet
Capacity*RAC)
$/kW-year
$117.37 $115.82 $114.32 $112.67 $108.06 $109.18 $109.19 $109.55 $107.63 $106.80
Ancillary Services N/A N/A $0.00 $0.00 $0.00 $0.00 $0.00 $0.00 $0.00 $0.00 $0.00 $0.00 RPS Procurement Variable (Cost/PV
Fleet Energy) $/kWh $0.0087 $0.0090 $0.0101 $0.0112 $0.0124 $0.0138 $0.0152 $0.0167 $0.0183 $0.0188
Grid Management Variable (Cost/PV Fleet Energy)
$/kWh $0.0004 $0.0004 $0.0004 $0.0004 $0.0004 $0.0005 $0.0005 $0.0005 $0.0005 $0.0005
Transmission Capacity Fixed (Cost/PV Fleet
Capacity*ELCC)
$/kW-year
$48.13 $48.77 $49.43 $49.81 $49.88 $51.33 $52.68 $53.63 $54.11 $54.48
Transmission O&M N/A N/A $0.00 $0.00 $0.00 $0.00 $0.00 $0.00 $0.00 $0.00 $0.00 $0.00 Distribution Station
Capacity Fixed (Cost/PV
Fleet Capacity*PLR)
$/kW-year
$13.86 $14.21 $14.65 $15.11 $15.59 $16.09 $16.60 $17.14 $17.69 $18.26
Distribution Line Capacity N/A N/A $0.00 $0.00 $0.00 $0.00 $0.00 $0.00 $0.00 $0.00 $0.00 $0.00 Distribution Voltage
Regulation and Reactive Supply
N/A N/A $0.00 $0.00 $0.00 $0.00 $0.00 $0.00 $0.00 $0.00 $0.00 $0.00
Distribution O&M N/A N/A $0.00 $0.00 $0.00 $0.00 $0.00 $0.00 $0.00 $0.00 $0.00 $0.00 Interconnection N/A N/A $0.00 $0.00 $0.00 $0.00 $0.00 $0.00 $0.00 $0.00 $0.00 $0.00
Metering/Billing/Customer Service/Administration
N/A N/A $0.00 $0.00 $0.00 $0.00 $0.00 $0.00 $0.00 $0.00 $0.00 $0.00
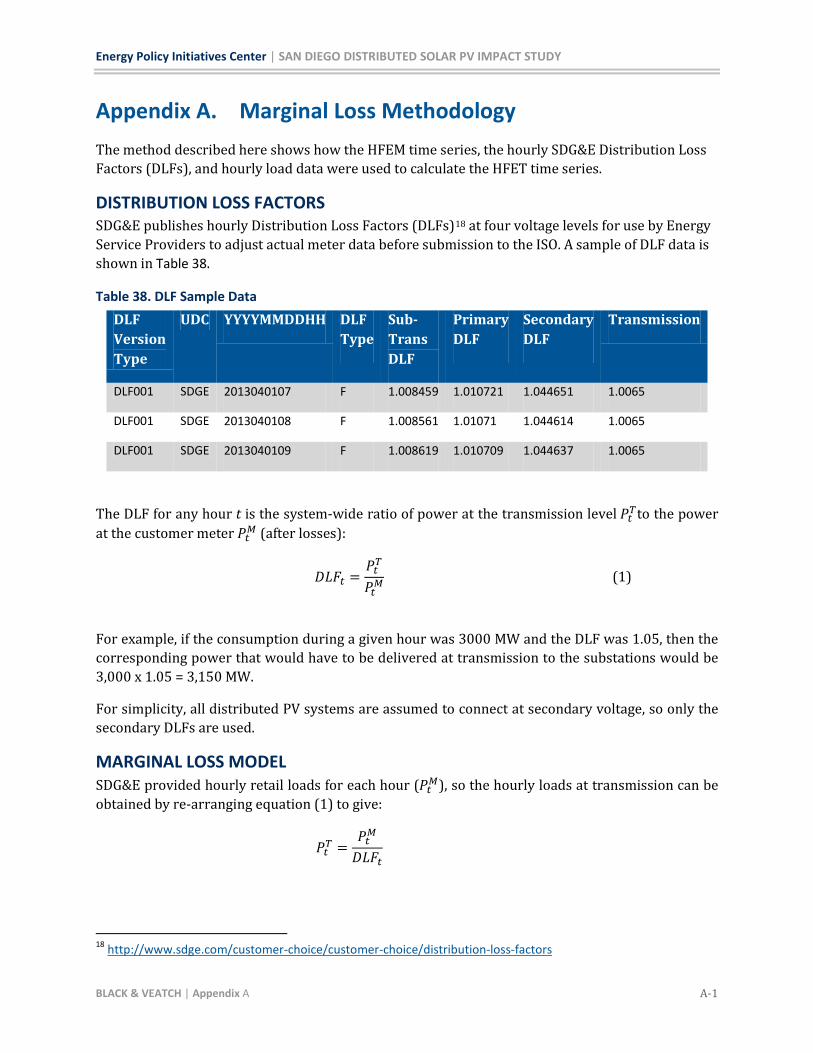
Energy Policy Initiatives Center | SAN DIEGO DISTRIBUTED SOLAR PV IMPACT STUDY
BLACK & VEATCH | Appendix A A-1
Appendix A. Marginal Loss Methodology The method described here shows how the HFEM time series, the hourly SDG&E Distribution Loss Factors (DLFs), and hourly load data were used to calculate the HFET time series.
DISTRIBUTION LOSS FACTORS SDG&E publishes hourly Distribution Loss Factors (DLFs)18
Table 38
at four voltage levels for use by Energy Service Providers to adjust actual meter data before submission to the ISO. A sample of DLF data is shown in .
Table 38. DLF Sample Data
DLF Version Type
UDC YYYYMMDDHH DLF Type
Sub-Trans DLF
Primary DLF
Secondary DLF
Transmission
DLF001 SDGE 2013040107 F 1.008459 1.010721 1.044651 1.0065
DLF001 SDGE 2013040108 F 1.008561 1.01071 1.044614 1.0065
DLF001 SDGE 2013040109 F 1.008619 1.010709 1.044637 1.0065
The DLF for any hour t is the system-wide ratio of power at the transmission level 𝑃𝑡𝑇to the power at the customer meter 𝑃𝑡𝑀 (after losses):
𝐷𝐿𝐹𝑡 =𝑃𝑡𝑇
𝑃𝑡𝑀 (1)
For example, if the consumption during a given hour was 3000 MW and the DLF was 1.05, then the corresponding power that would have to be delivered at transmission to the substations would be 3,000 x 1.05 = 3,150 MW.
For simplicity, all distributed PV systems are assumed to connect at secondary voltage, so only the secondary DLFs are used.
MARGINAL LOSS MODEL SDG&E provided hourly retail loads for each hour (𝑃𝑡𝑀), so the hourly loads at transmission can be obtained by re-arranging equation (1) to give:
𝑃𝑡𝑇 =𝑃𝑡𝑀
𝐷𝐿𝐹𝑡
18 http://www.sdge.com/customer-choice/customer-choice/distribution-loss-factors

Energy Policy Initiatives Center | SAN DIEGO DISTRIBUTED SOLAR PV IMPACT STUDY
BLACK & VEATCH | Appendix A A-2
Losses 𝑃𝑡𝐿can then be calculated as follows:
𝑃𝑡𝐿 = 𝑃𝑡𝑇 − 𝑃𝑡𝑀
Figure 22 shows hourly losses plotted against customer loads for each hour of 2012 using these relationships.
Figure 22. SDG&E Distribution Losses versus Customer Loads (2012)
The solid red curve is a best-fit quadratic loss model of the form F(X) = A + BX2 with coefficients selected to minimize RMS error19
The values for A and B are determined to be approximately 34.8 MW and 1.44 x 10⁻⁵ MW-1. In other words, there is a fixed loss of 34.8 MW regardless of load, and this loss is not affected by the presence of PV on the system. However, PV does effect the second term of the model by reducing the load, and the resultant loss savings is illustrated in the chart identified as “Reduced Distribution Losses” that correspond to the “Load Reduction from PV.”
. The model form represents the physical case of a constant loss at zero power plus a loss component that is the square of power (i.e., the square of the current when voltage is kept relatively constant).
19 In other words, values for A and B are selected to minimize:
𝑅𝑀𝑆 𝐸𝑟𝑟𝑜𝑟 = �∑ [𝐹(𝑋)𝑡 − 𝑃𝑡𝐿]2𝑁𝑡=1
𝑁
Load Reduction from PV
Reduced Distribution
Losses
Average Loss Model
Marginal Loss Model
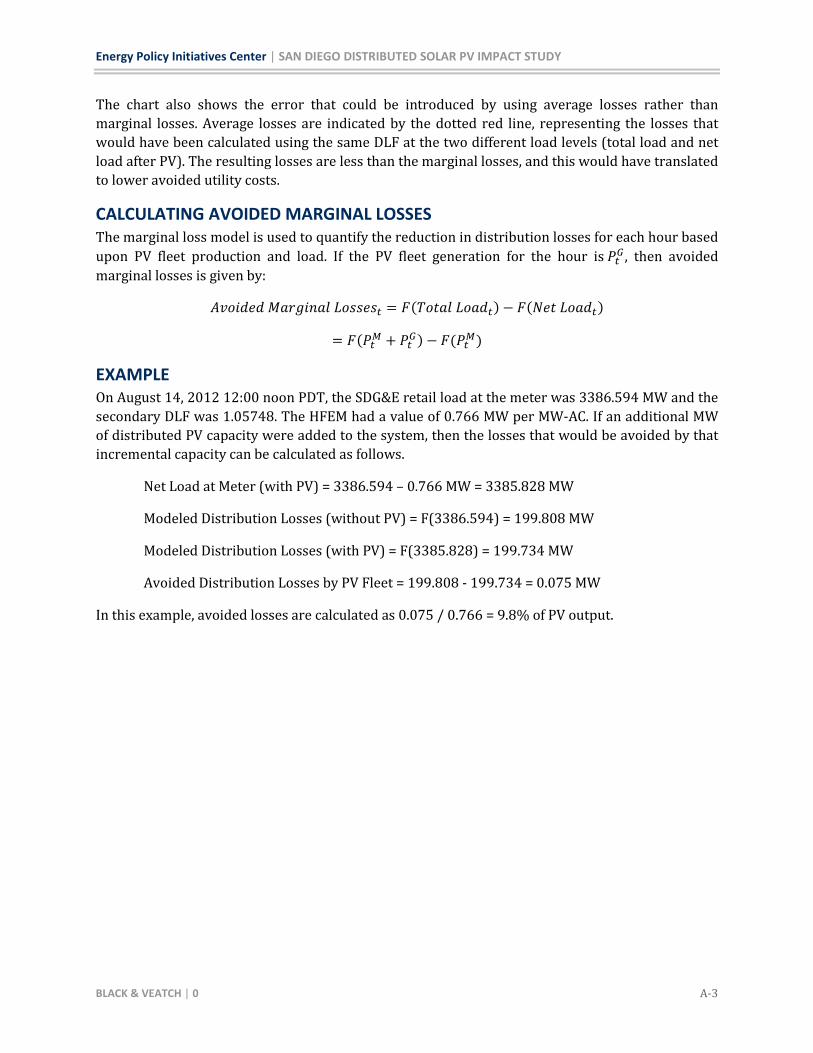
Energy Policy Initiatives Center | SAN DIEGO DISTRIBUTED SOLAR PV IMPACT STUDY
BLACK & VEATCH | 0 A-3
The chart also shows the error that could be introduced by using average losses rather than marginal losses. Average losses are indicated by the dotted red line, representing the losses that would have been calculated using the same DLF at the two different load levels (total load and net load after PV). The resulting losses are less than the marginal losses, and this would have translated to lower avoided utility costs.
CALCULATING AVOIDED MARGINAL LOSSES The marginal loss model is used to quantify the reduction in distribution losses for each hour based upon PV fleet production and load. If the PV fleet generation for the hour is 𝑃𝑡𝐺 , then avoided marginal losses is given by:
𝐴𝑣𝑜𝑖𝑑𝑒𝑑 𝑀𝑎𝑟𝑔𝑖𝑛𝑎𝑙 𝐿𝑜𝑠𝑠𝑒𝑠𝑡 = 𝐹(𝑇𝑜𝑡𝑎𝑙 𝐿𝑜𝑎𝑑𝑡) − 𝐹(𝑁𝑒𝑡 𝐿𝑜𝑎𝑑𝑡)
= 𝐹(𝑃𝑡𝑀 + 𝑃𝑡𝐺) − 𝐹(𝑃𝑡𝑀)
EXAMPLE On August 14, 2012 12:00 noon PDT, the SDG&E retail load at the meter was 3386.594 MW and the secondary DLF was 1.05748. The HFEM had a value of 0.766 MW per MW-AC. If an additional MW of distributed PV capacity were added to the system, then the losses that would be avoided by that incremental capacity can be calculated as follows.
Net Load at Meter (with PV) = 3386.594 – 0.766 MW = 3385.828 MW
Modeled Distribution Losses (without PV) = F(3386.594) = 199.808 MW
Modeled Distribution Losses (with PV) = F(3385.828) = 199.734 MW
Avoided Distribution Losses by PV Fleet = 199.808 - 199.734 = 0.075 MW
In this example, avoided losses are calculated as 0.075 / 0.766 = 9.8% of PV output.