Embed Size (px)
Citation preview
Prepared By:Prepared For:
Socioeconomic & Market Overview
February 2017
DRAFT
NEVADA LONG RANGE TRANSPORTATION PLAN UPDATE: SOCIO-
ECONOMIC & MARKET OVERVIEW
i
I. Introduction ...................................................................................................................... I-1
II. Population Trends ............................................................................................................ II-1
III. Geographic Setting ....................................................................................................... III-1
IV. Economic Trends ............................................................................................................ IV-1
V. Commuting Patterns & Income/Spending Trends ........................................................ V-1
A. Commuting Patterns .................................................................................................. V-1
B. Income/Spending Patterns ............................................................................................ V-3
VI. Commercial Real Estate Market Dynamics ................................................................. VI-1
VII. Economic Development Potential ............................................................................... VII-1
VIII . Summary of Growth Patterns, Trends & Forces ........................................................ VIII-1
IX. Overall Population & Employment Forecast: 2015-35 ................................................. IX-1
A. Population Forecast ...................................................................................................IX-1
B. Employment Forecast .................................................................................................... IX-2
List of Tables
Table V-1: Nevada & Metros Employment Profile & Commuting Patterns: 2014 ............. V-2
Table V-2: Nevada & Metros Household Income Profile: 2016–2021 ................................. V-3
Table V-3: Nevada & Metros Household Consumer Spending Profile: 2016 – 2021 ......... V-5
List of Figures
Figure II-1: Nevada & Metros Population: 1995-2015 ............................................................. II-2
Figure III-1: Nevada State Map ................................................................................................ III-2
Figure III-2: Nevada Elevation Map ......................................................................................... III-3
Figure III-3: United States Average Precipitation Map: 1971-2000 ...................................... III-4
Figure III-4: Nevada Average Precipitation Map: 1961-1990............................................... III-5
Figure IV-1: Nevada & Metros 12MMA Unemployment Rate: Oct-06 to Oct-16 ............. IV-1
Figure IV-2: Nevada U-6 Unemployment Rate: Q3/11 to Q3/16 ........................................ IV-2
NEVADA LONG RANGE TRANSPORTATION PLAN UPDATE: SOCIO-
ECONOMIC & MARKET OVERVIEW
ii
Figure IV-3: NV & Metros 12MMA Total Non-Farm Employment: Oct-06 to Oct-16 ........ IV-3
Figure IV-4: NV & Metros 12MMA Real Average Weekly Earnings: Oct-06 to Oct-16 ..... IV-4
Figure IV-5: Nevada & Metros 12MMA Average Weekly Hours: Oct-06 to Oct-16 ......... IV-5
Figure IV-6: Nevada, Clark & Washoe Counties 12MMA Taxable Retail Sales: Sep-06 to
Sep-16......................................................................................................................................... IV-6
Figure IV-7: Nevada and Clark & Washoe Counties 12MMA Gross Gaming Revenues net
Baccarat: Oct-06 to Oct-16 .................................................................................................... IV-7
Figure IV-8: Nevada & Metros 12MMA Visitor Volume: Jun-06 to Jun-16 ......................... IV-8
Figure IV-9: Nevada &Las Vegas Valley 12MMA Convention Attendance:
Jun-06 to Jun-16 ........................................................................................................................ IV-9
Figure IV-10: Las Vegas & Reno-Sparks MSA 12MMA Home Resales:
Oct-06 to Oct-16 ..................................................................................................................... IV-10
Figure IV-11: Las Vegas & Reno-Sparks MSA 12MMA Median Resale Price:
Oct-06 to Oct-16 ..................................................................................................................... IV-11
Figure IV-12: United States & Metros 4QMA Housing Opportunity Index:
Q3/06-Q3/16II .......................................................................................................................... IV-12
Figure VI-1: Las Vegas Valley 4QMA Commercial Vacancy Rates: Q2/06 to Q2/16 ..... VI-2
Figure VI-2: Reno-Sparks MSA 4QMA Commercial Vacancy Rates: Q2/06 to Q2/16 .... VI-3
Figure VII-1: Nevada Location Quotients: Oct-2016 ........................................................... VII-2
Figure VII-2: Las Vegas MSA Location Quotients: Oct-2016 .............................................. VII-3
Figure VII-3: Reno-Sparks MSA Location Quotients: Oct-2016 ........................................... VII-4
Figure VIII-1: Nevada Shift-Share: Oct-1996, 2006 and 2016 ............................................. VIII-2
Figure VIII-2: Las Vegas MSA Shift-Share: Oct-1996, 2006 and 2016 ................................ VIII-3
Figure VIII-3: Reno-Sparks MSA Shift-Share: Oct-1996, 2006 and 2016 ............................. VIII-4
Figure IX-1: Nevada & Metros Population Forecast: 2005-2035 ......................................... IX-2
Figure IX-2: Nevada & Metros Employment Forecast: 2005-2035 ...................................... IX-3
NEVADA LONG RANGE TRANSPORTATION PLAN UPDATE: SOCIO-ECONOMIC & MARKET OVERVIEW
I-1
I. Introduction
s part of the Nevada Long Range Transportation Plan (“LRTP”) update, RCG Economics (“RCG”), in
association with Wood Rodgers (“WR”), has developed an analysis that presents high-level economic,
demographic and land use overviews (“the Study”) of the State of Nevada to illustrate existing and future
socio-economic scenarios, as well as commercial development activity that will potentially affect growth
outcomes.
The intent of the LRTP is to strategically guide decision-making for future investments that will improve
Nevada’s multimodal transportation system. The LRTP will include an overarching vision that defines
agency and system goals, objectives and performance measures that reflect input from state leadership,
Nevada’s stakeholders and planning partners.
The LRTP will be consistent with the message of the Unified Transportation Investment Plan Preview, the
Moving Nevada Forward: A Plan for Excellence in Economic Development 2012-2014—published by the
Governor’s Office of Economic Development—and other statewide and regional transportation and related
plans.
The Study is not designed to be a comprehensive evaluation of the market support for explicit development
projects, highest and best use analyses of individual parcels or sets of parcels or economic development
recommendations for the state. Instead, it is designed as a high-level collection of indicators that will be
used as a check against travel demand and other forecasting datasets to ensure outcomes are reasonable
and consistent across methodologies.
RCG provides a series of trends and forecasts regarding the economy, geography, demography, commuting
patterns, income/spending, commercial real estate market and economic development in Nevada and its
two major urban centers - Las Vegas Metropolitan Statistical Area (“MSA”) and the Reno-Sparks MSA (the
“Metros”)1, which jointly account for almost 90 percent of the state’s population.
1 According to the U.S. Census Bureau, the Las Vegas MSA is defined as Clark County. The Reno-Sparks MSA is defined as Washoe and Storey counties.
A
NEVADA LONG RANGE TRANSPORTATION PLAN UPDATE: SOCIO-ECONOMIC & MARKET OVERVIEW
II-1
II. Population Trends
evada had been one of the nation’s fastest growing state for decades. However, it underwent a period
of particularly rapid expansion during the 1990s and 2000s. The state’s main population centers are
the Las Vegas MSA and Reno-Sparks MSA. The Las Vegas MSA is defined as Clark County by the U.S. Census
Bureau, which is the southernmost county in the state, bordering California to the southwest, Arizona to the
south and southeast, Utah to the east and other Nevada counties to the north and northwest. The Reno-
Sparks MSA is defined as Washoe and Storey counties, which are located in the northwestern part of
Nevada. Washoe County borders California to the west, Oregon to the north and other Nevada counties on
every other side. Storey County is completely surrounded by Nevada.
Nevada’s growth has mainly been due to the population explosion in the Las Vegas MSA. In fact, in the 20
years between 1988 and 2008 (start of the Great Recession), the Las Vegas area’s population grew nearly
200 percent from 661,700 to 1,898,100, a change of 1,236,400 persons. In that same period, the state’s
population grew from 1,096,100 to 2,641,100 (+141 percent), a change of 1,545,000 persons. However,
looking at Nevada’s population growth minus that of Las Vegas and Reno-Sparks MSAs, the state’s
population grew from 187,400 to 329,000 (+76 percent) between 1988 and 2008.
However, after the onset of the Great Recession, population growth in Nevada dropped dramatically. In the
20 years prior to the recession, average annual population growth in Nevada was 4.5 percent. Afterward,
between 2008 and 2015, the annual growth rate shrank to 1.3 percent, bottoming out at 0.6 percent in
2011. Since then, though, the state’s population growth rate has increased, up to 1.9 percent in 2015.
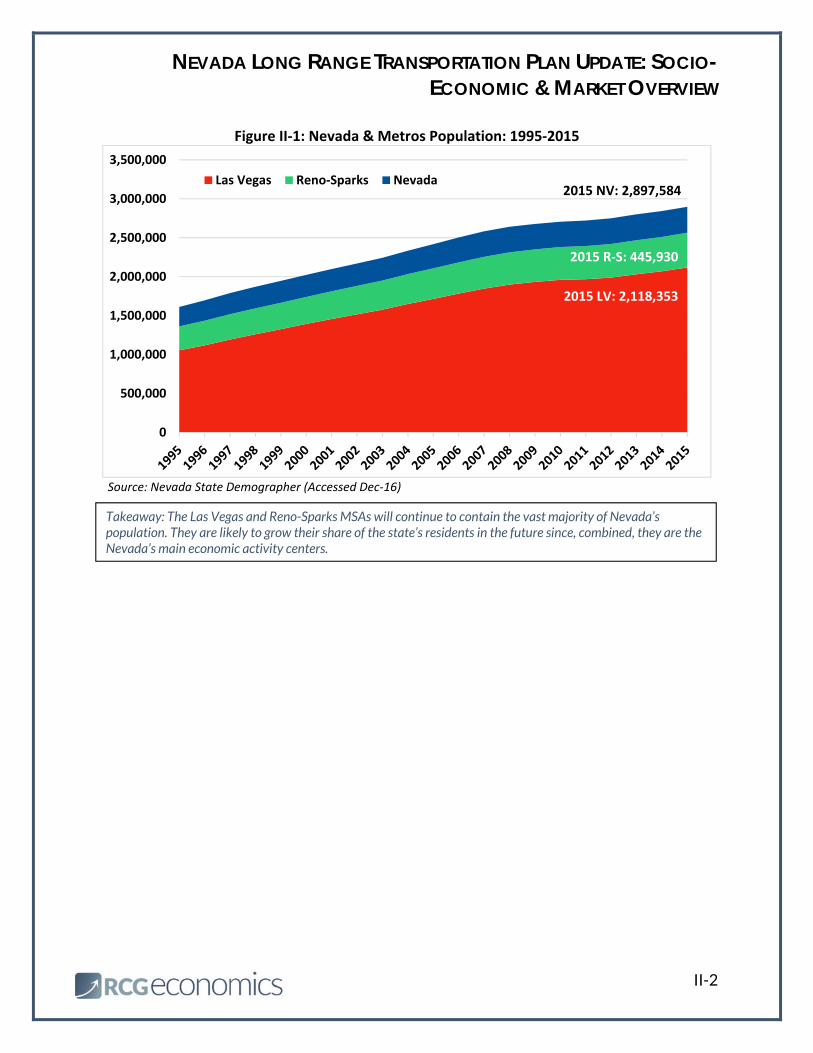
The Las Vegas MSA has made up a majority of the state’s population for over half a century, but in recent
years, it has gained an ever greater share. In 2015, Nevada’s population reached 2,897,600, with 2,118,400
in the Las Vegas MSA alone (73 percent of total). The Reno-Sparks MSA has shown significant growth, as
well. Between 1988 and 2008, this metro area grew from 247,000 to 414,000 (+68 percent). In 2015, the
Reno-Sparks population reached 445,930. Together, the state’s two urban centers account for 88.5 percent
of Nevada’s residents (see Figure II-1). Contrary to the romanticized perception that many outsiders have
about Nevada as a “Wild West” wilderness, it is a highly urbanized state in terms of the share of the
population living in urban centers. Due to the large percentage of federally-protected lands, Nevada’s
standing as an urban state with sparse expanses of rural land is unlikely to change.
N
NEVADA LONG RANGE TRANSPORTATION PLAN UPDATE: SOCIO-ECONOMIC & MARKET OVERVIEW
II-2
Figure II‐1: Nevada & Metros Population: 1995‐2015
Source: Nevada State Demographer (Accessed Dec‐16)
0
500,000
1,000,000
1,500,000
2,000,000
2,500,000
3,000,000
3,500,000
Las Vegas Reno‐Sparks Nevada
2015 LV: 2,118,353
2015 R‐S: 445,930
2015 NV: 2,897,584
Takeaway: The Las Vegas and Reno-Sparks MSAs will continue to contain the vast majority of Nevada’s population. They are likely to grow their share of the state’s residents in the future since, combined, they are the Nevada’s main economic activity centers.
NEVADA LONG RANGE TRANSPORTATION PLAN UPDATE: SOCIO-ECONOMIC & MARKET OVERVIEW
III-1
III. Geographic Setting
s previously discussed, Nevada’s population can generally be found in the Las Vegas and Reno-Sparks
MSAs. With close to 90 percent of the state’s population located in two of its 17 counties, Nevada is a
highly urbanized state. As such, the state has vast tracts of empty or sparsely populated lands. In fact,
Nevada is the seventh largest state in the nation by area. However, according to the Congressional Research
Service, about 85 percent of land in Nevada is owned and administered by the federal government,
particularly the Bureau of Land Management. This situation affords Nevada and municipalities little control
over much of the land in the state.
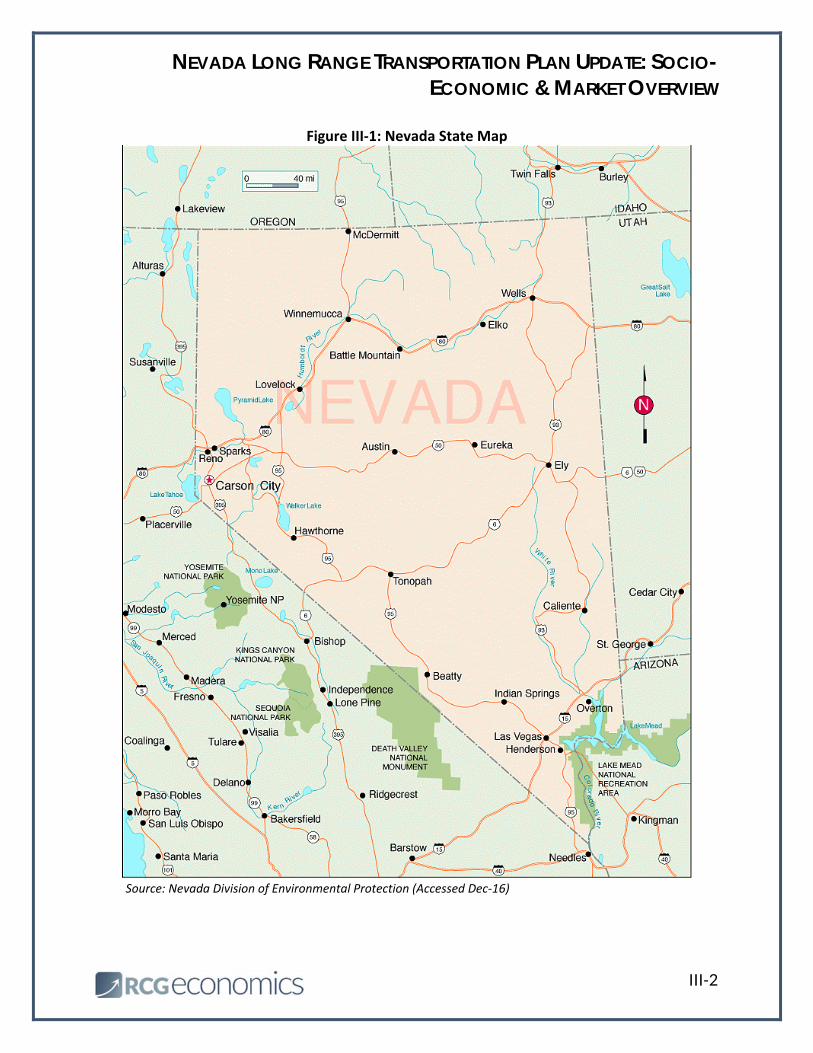
Figure III-1 provides a map of Nevada and its cities and towns. After the two main metro areas, the next
most populous area is the Carson City MSA, the capital of Nevada, adjacent to the Reno-Sparks MSA to its
south. After Carson City, Nevada is a collection of small rural cities and towns, with Fernley (Lyon County)
and Elko (Elko County) being the only other communities of notable size. Both counties have populations of
less than 60,000, according to the Nevada State Demographer.
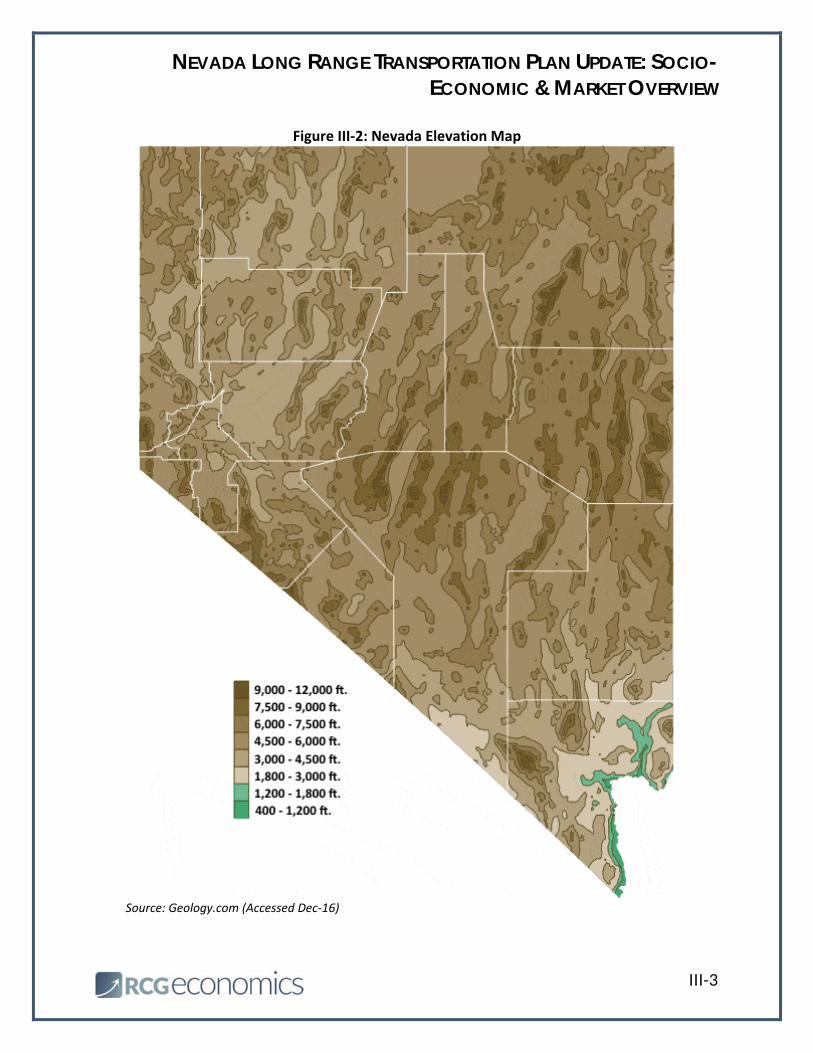
Nevada is a mountainous state (see Figure III-2). According to the Nevada 150 Foundation, it contains the
greatest number of mountain ranges in the nation. With all those mountains lying atop the Great Basin,
Nevada ranks as the state with the fifth highest average elevation in the country (5,500 ft.).
Nevada is covered by two deserts: the Great Basin Desert and the Mojave Desert. The Mojave Desert is the
smaller of the two and covers parts of southern Nevada and is home to the Las Vegas MSA. The vast
majority of Nevada lies in the Great Basin Desert, which is also the coldest desert in North America. As the
state is nearly completely covered in desert, one might expect it to be a dry state.
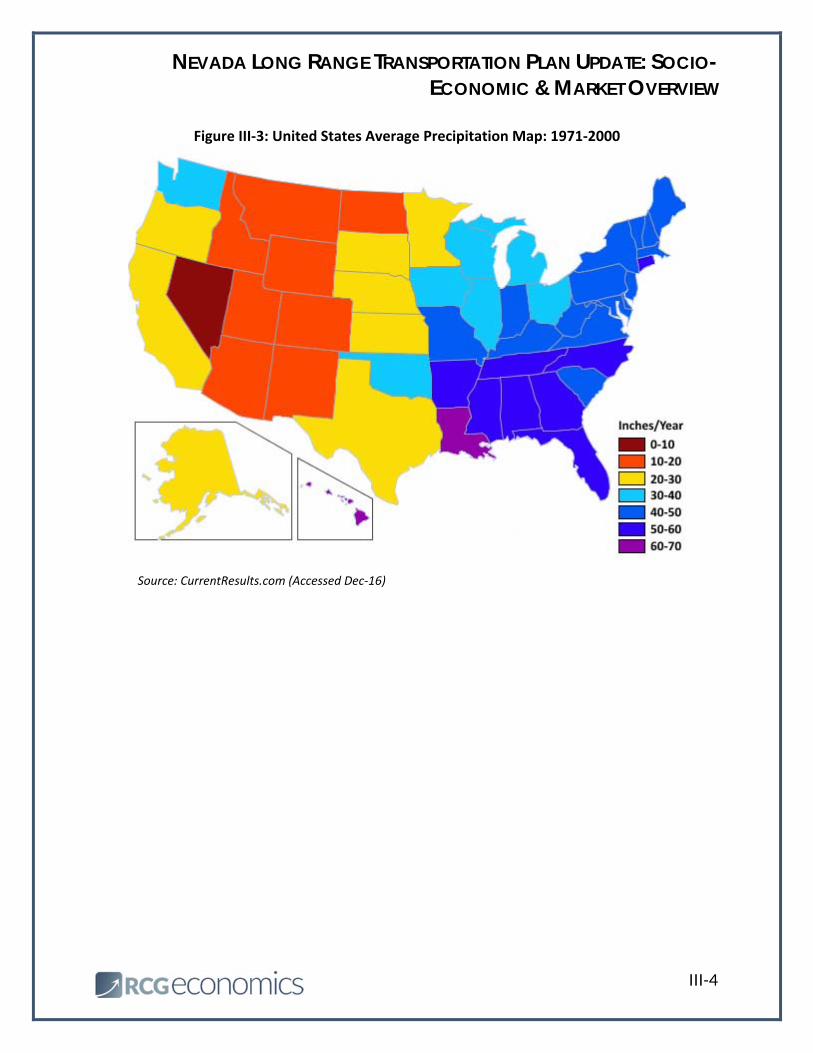
Figure III-3 shows the average precipitation for every state in the United States. Nevada has the least
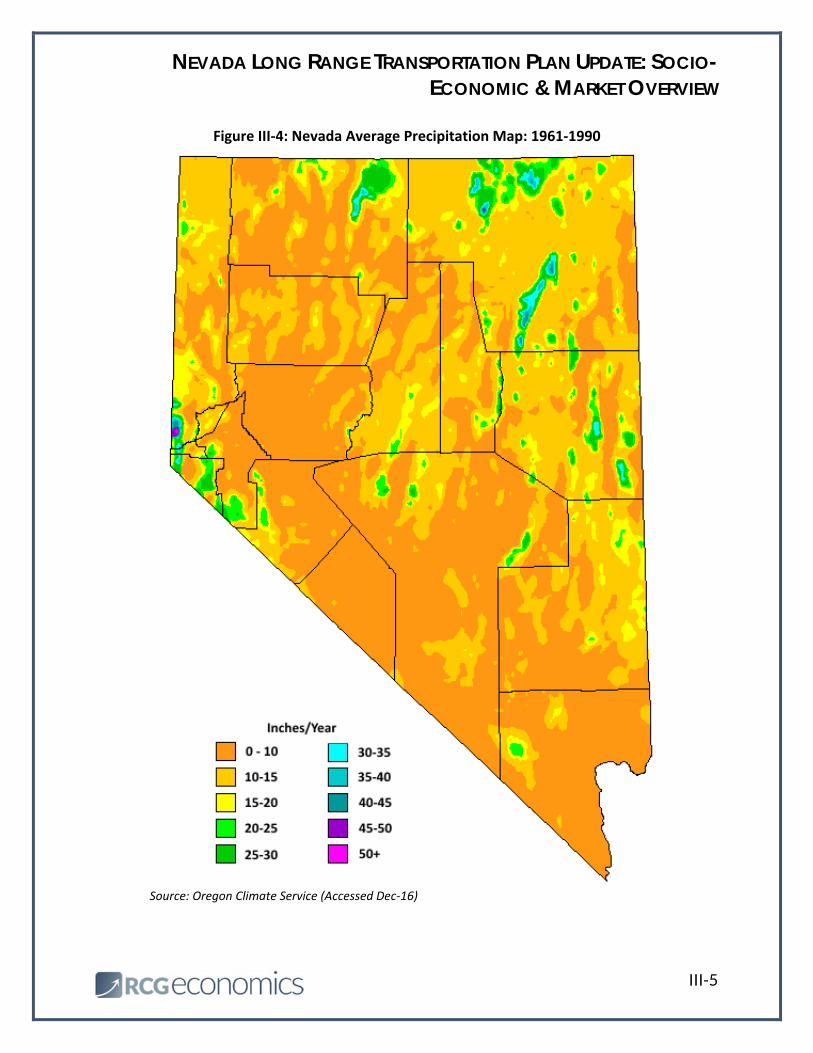
precipitation out of all the states in the nation, making it the country’s driest state. Figure III-4 shows
precipitation throughout the state. As the figure shows, the state is extremely dry all over, with the
exception of part of the state’s northeast and the western edge of the state near the Reno-Sparks MSA.
A
NEVADA LONG RANGE TRANSPORTATION PLAN UPDATE: SOCIO-ECONOMIC & MARKET OVERVIEW
III-2
Figure III‐1: Nevada State Map
Source: Nevada Division of Environmental Protection (Accessed Dec‐16)
NEVADA LONG RANGE TRANSPORTATION PLAN UPDATE: SOCIO-ECONOMIC & MARKET OVERVIEW
III-3
Figure III‐2: Nevada Elevation Map
Source: Geology.com (Accessed Dec‐16)
NEVADA LONG RANGE TRANSPORTATION PLAN UPDATE: SOCIO-ECONOMIC & MARKET OVERVIEW
III-4
Figure III‐3: United States Average Precipitation Map: 1971‐2000
Source: CurrentResults.com (Accessed Dec‐16)
NEVADA LONG RANGE TRANSPORTATION PLAN UPDATE: SOCIO-ECONOMIC & MARKET OVERVIEW
III-5
Figure III‐4: Nevada Average Precipitation Map: 1961‐1990
Source: Oregon Climate Service (Accessed Dec‐16)
NEVADA LONG RANGE TRANSPORTATION PLAN UPDATE: SOCIO-ECONOMIC & MARKET OVERVIEW
IV-1
IV. Economic Trends
n this section, RCG describes macroeconomic conditions of the State of Nevada, as well as the Las Vegas
MSA and Reno-Sparks MSA. These indicators are meant to help illustrate the economic climate in the
state and its two metro areas since they account for approximately 90 percent of the state’s economic
activity.
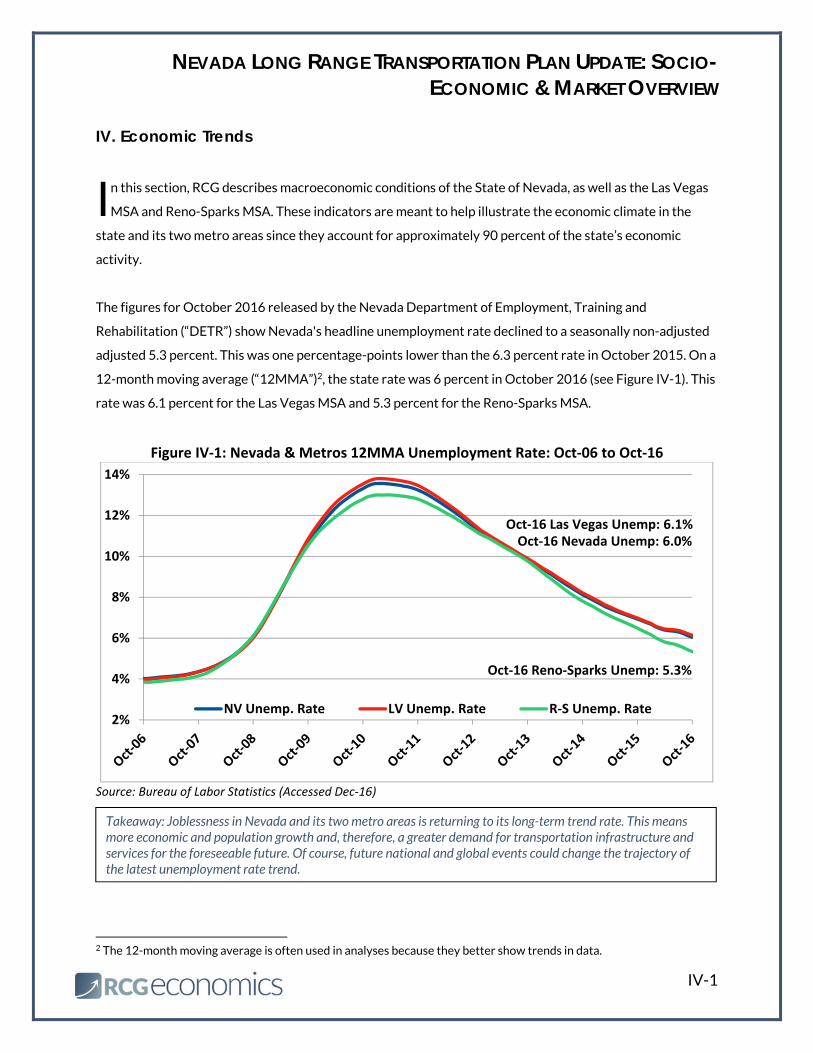
The figures for October 2016 released by the Nevada Department of Employment, Training and
Rehabilitation (“DETR”) show Nevada's headline unemployment rate declined to a seasonally non-adjusted
adjusted 5.3 percent. This was one percentage-points lower than the 6.3 percent rate in October 2015. On a
12-month moving average (“12MMA”)2, the state rate was 6 percent in October 2016 (see Figure IV-1). This
rate was 6.1 percent for the Las Vegas MSA and 5.3 percent for the Reno-Sparks MSA.
Figure IV‐1: Nevada & Metros 12MMA Unemployment Rate: Oct‐06 to Oct‐16
Source: Bureau of Labor Statistics (Accessed Dec‐16)
2 The 12-month moving average is often used in analyses because they better show trends in data.
2%
4%
6%
8%
10%
12%
14%
NV Unemp. Rate LV Unemp. Rate R‐S Unemp. Rate
Oct‐16 Las Vegas Unemp: 6.1%
Oct‐16 Reno‐Sparks Unemp: 5.3%
Oct‐16 Nevada Unemp: 6.0%
I
Takeaway: Joblessness in Nevada and its two metro areas is returning to its long-term trend rate. This means more economic and population growth and, therefore, a greater demand for transportation infrastructure and services for the foreseeable future. Of course, future national and global events could change the trajectory of the latest unemployment rate trend.
NEVADA LONG RANGE TRANSPORTATION PLAN UPDATE: SOCIO-ECONOMIC & MARKET OVERVIEW
IV-2
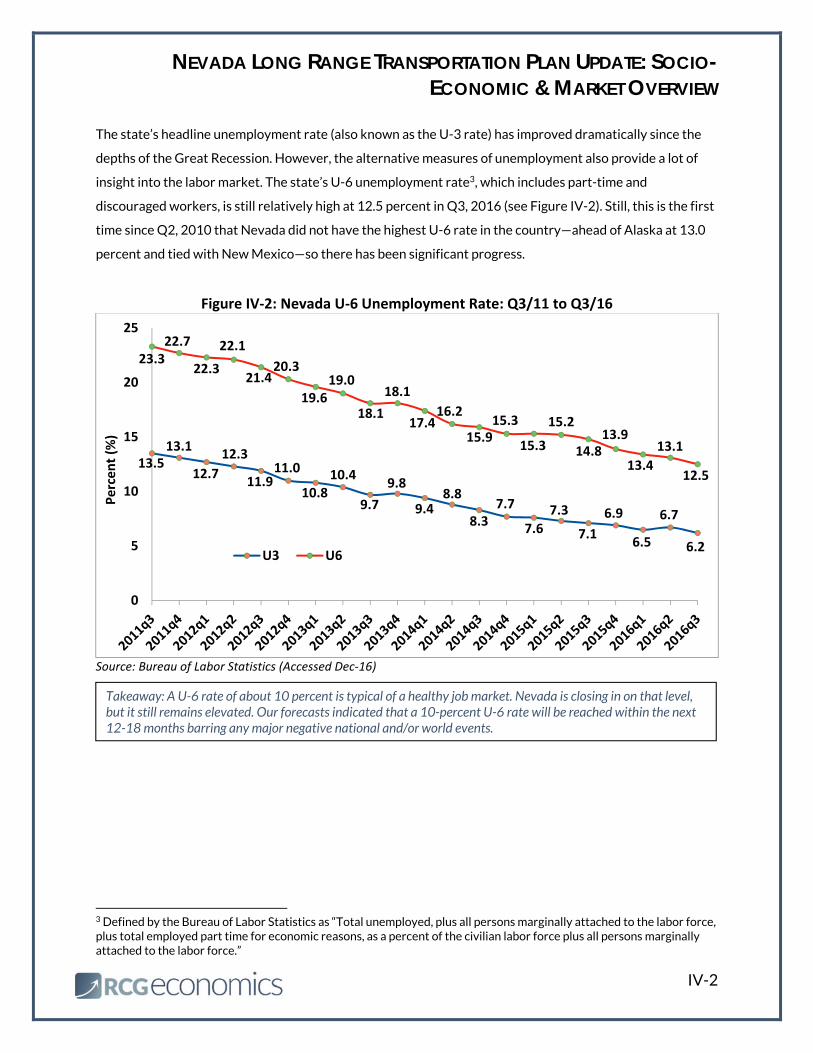
The state’s headline unemployment rate (also known as the U-3 rate) has improved dramatically since the
depths of the Great Recession. However, the alternative measures of unemployment also provide a lot of
insight into the labor market. The state’s U-6 unemployment rate3, which includes part-time and
discouraged workers, is still relatively high at 12.5 percent in Q3, 2016 (see Figure IV-2). Still, this is the first
time since Q2, 2010 that Nevada did not have the highest U-6 rate in the country—ahead of Alaska at 13.0
percent and tied with New Mexico—so there has been significant progress.
Figure IV‐2: Nevada U‐6 Unemployment Rate: Q3/11 to Q3/16
Source: Bureau of Labor Statistics (Accessed Dec‐16)
3 Defined by the Bureau of Labor Statistics as “Total unemployed, plus all persons marginally attached to the labor force, plus total employed part time for economic reasons, as a percent of the civilian labor force plus all persons marginally attached to the labor force.”
13.513.1
12.7
12.3
11.911.0
10.810.4
9.7
9.8
9.48.8
8.37.7
7.6
7.3
7.1
6.9
6.5
6.7
6.2
23.322.7
22.3
22.1
21.420.3
19.619.0
18.1
18.1
17.416.2
15.915.3
15.3
15.2
14.813.9
13.4
13.1
12.5
0
5
10
15
20
25
Percent (%
)
U3 U6
Takeaway: A U-6 rate of about 10 percent is typical of a healthy job market. Nevada is closing in on that level, but it still remains elevated. Our forecasts indicated that a 10-percent U-6 rate will be reached within the next 12-18 months barring any major negative national and/or world events.
NEVADA LONG RANGE TRANSPORTATION PLAN UPDATE: SOCIO-ECONOMIC & MARKET OVERVIEW
IV-3
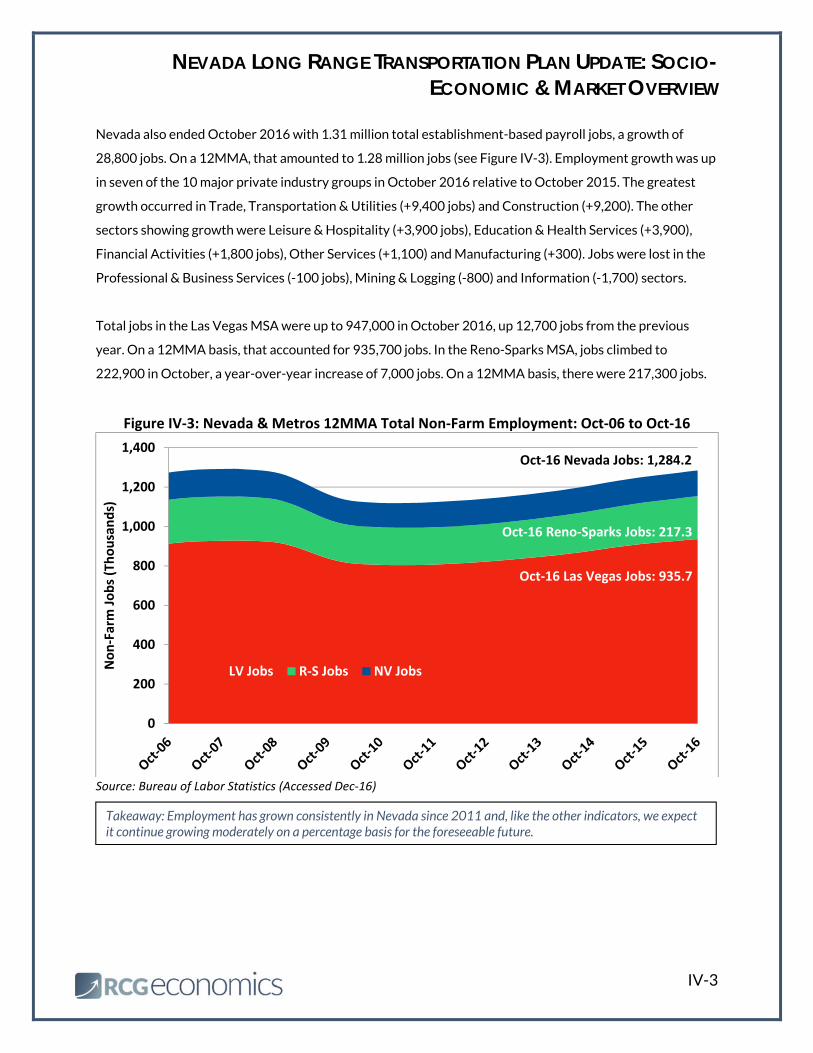
Nevada also ended October 2016 with 1.31 million total establishment-based payroll jobs, a growth of
28,800 jobs. On a 12MMA, that amounted to 1.28 million jobs (see Figure IV-3). Employment growth was up
in seven of the 10 major private industry groups in October 2016 relative to October 2015. The greatest
growth occurred in Trade, Transportation & Utilities (+9,400 jobs) and Construction (+9,200). The other
sectors showing growth were Leisure & Hospitality (+3,900 jobs), Education & Health Services (+3,900),
Financial Activities (+1,800 jobs), Other Services (+1,100) and Manufacturing (+300). Jobs were lost in the
Professional & Business Services (-100 jobs), Mining & Logging (-800) and Information (-1,700) sectors.
Total jobs in the Las Vegas MSA were up to 947,000 in October 2016, up 12,700 jobs from the previous
year. On a 12MMA basis, that accounted for 935,700 jobs. In the Reno-Sparks MSA, jobs climbed to
222,900 in October, a year-over-year increase of 7,000 jobs. On a 12MMA basis, there were 217,300 jobs.
Figure IV‐3: Nevada & Metros 12MMA Total Non‐Farm Employment: Oct‐06 to Oct‐16
Source: Bureau of Labor Statistics (Accessed Dec‐16)
0
200
400
600
800
1,000
1,200
1,400
Non‐Farm Jobs (Thousands)
LV Jobs R‐S Jobs NV Jobs
Oct‐16 Las Vegas Jobs: 935.7
Oct‐16 Reno‐Sparks Jobs: 217.3
Oct‐16 Nevada Jobs: 1,284.2
Takeaway: Employment has grown consistently in Nevada since 2011 and, like the other indicators, we expect it continue growing moderately on a percentage basis for the foreseeable future.
NEVADA LONG RANGE TRANSPORTATION PLAN UPDATE: SOCIO-ECONOMIC & MARKET OVERVIEW
IV-4
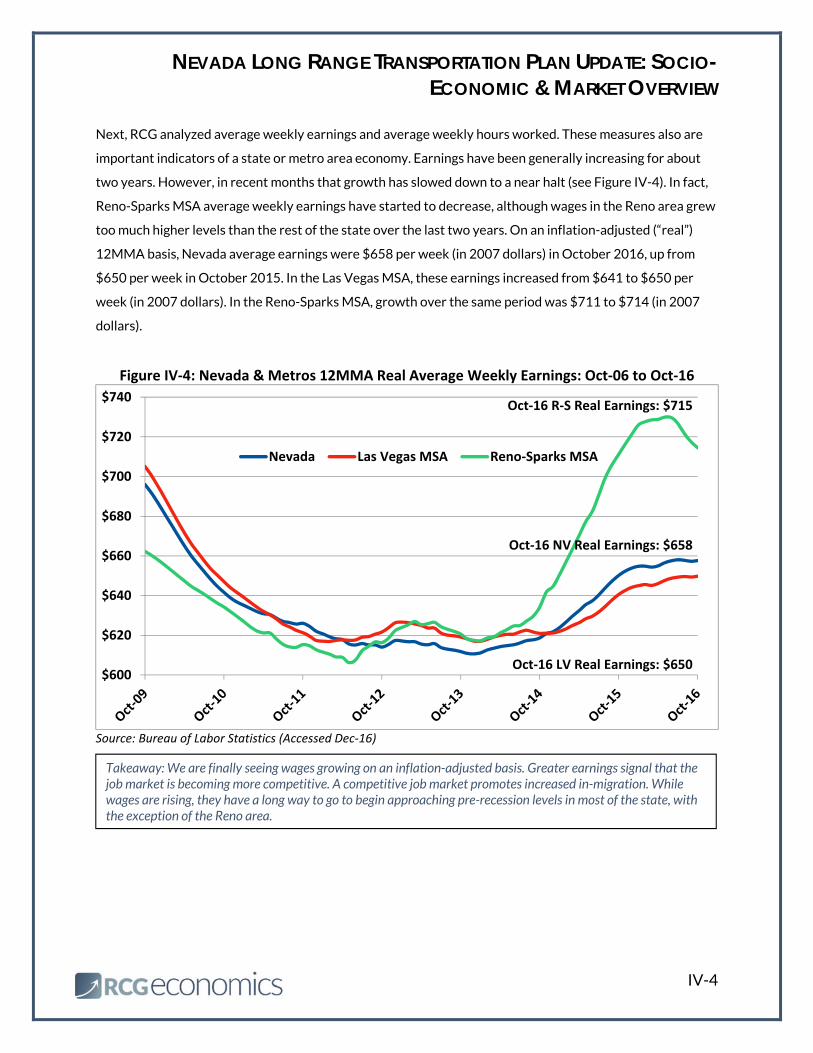
Next, RCG analyzed average weekly earnings and average weekly hours worked. These measures also are
important indicators of a state or metro area economy. Earnings have been generally increasing for about
two years. However, in recent months that growth has slowed down to a near halt (see Figure IV-4). In fact,
Reno-Sparks MSA average weekly earnings have started to decrease, although wages in the Reno area grew
too much higher levels than the rest of the state over the last two years. On an inflation-adjusted (“real”)
12MMA basis, Nevada average earnings were $658 per week (in 2007 dollars) in October 2016, up from
$650 per week in October 2015. In the Las Vegas MSA, these earnings increased from $641 to $650 per
week (in 2007 dollars). In the Reno-Sparks MSA, growth over the same period was $711 to $714 (in 2007
dollars).
Figure IV‐4: Nevada & Metros 12MMA Real Average Weekly Earnings: Oct‐06 to Oct‐16
Source: Bureau of Labor Statistics (Accessed Dec‐16)
$600
$620
$640
$660
$680
$700
$720
$740
Nevada Las Vegas MSA Reno‐Sparks MSA
Oct‐16 NV Real Earnings: $658
Oct‐16 LV Real Earnings: $650
Oct‐16 R‐S Real Earnings: $715
Takeaway: We are finally seeing wages growing on an inflation-adjusted basis. Greater earnings signal that the job market is becoming more competitive. A competitive job market promotes increased in-migration. While wages are rising, they have a long way to go to begin approaching pre-recession levels in most of the state, with the exception of the Reno area.
NEVADA LONG RANGE TRANSPORTATION PLAN UPDATE: SOCIO-ECONOMIC & MARKET OVERVIEW
IV-5
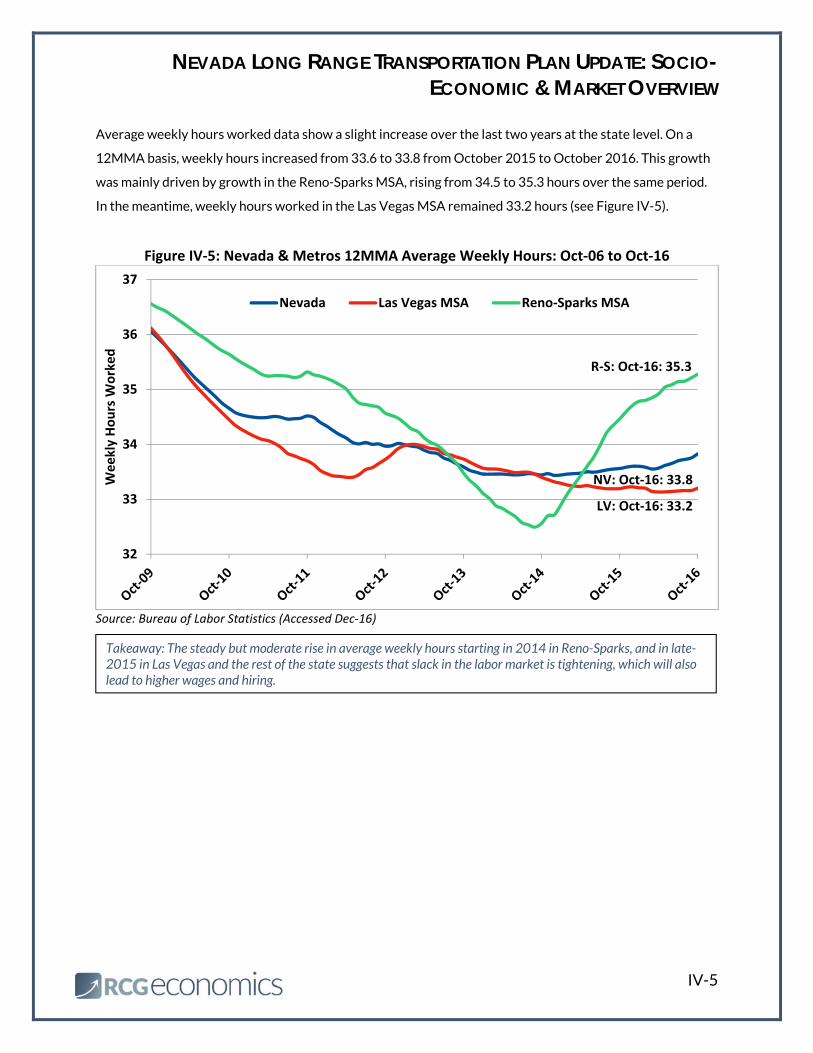
Average weekly hours worked data show a slight increase over the last two years at the state level. On a
12MMA basis, weekly hours increased from 33.6 to 33.8 from October 2015 to October 2016. This growth
was mainly driven by growth in the Reno-Sparks MSA, rising from 34.5 to 35.3 hours over the same period.
In the meantime, weekly hours worked in the Las Vegas MSA remained 33.2 hours (see Figure IV-5).
Figure IV‐5: Nevada & Metros 12MMA Average Weekly Hours: Oct‐06 to Oct‐16
Source: Bureau of Labor Statistics (Accessed Dec‐16)
32
33
34
35
36
37
Weekly Hours W
orked
Nevada Las Vegas MSA Reno‐Sparks MSA
LV: Oct‐16: 33.2
NV: Oct‐16: 33.8
R‐S: Oct‐16: 35.3
Takeaway: The steady but moderate rise in average weekly hours starting in 2014 in Reno-Sparks, and in late-2015 in Las Vegas and the rest of the state suggests that slack in the labor market is tightening, which will also lead to higher wages and hiring.
NEVADA LONG RANGE TRANSPORTATION PLAN UPDATE: SOCIO-ECONOMIC & MARKET OVERVIEW
IV-6
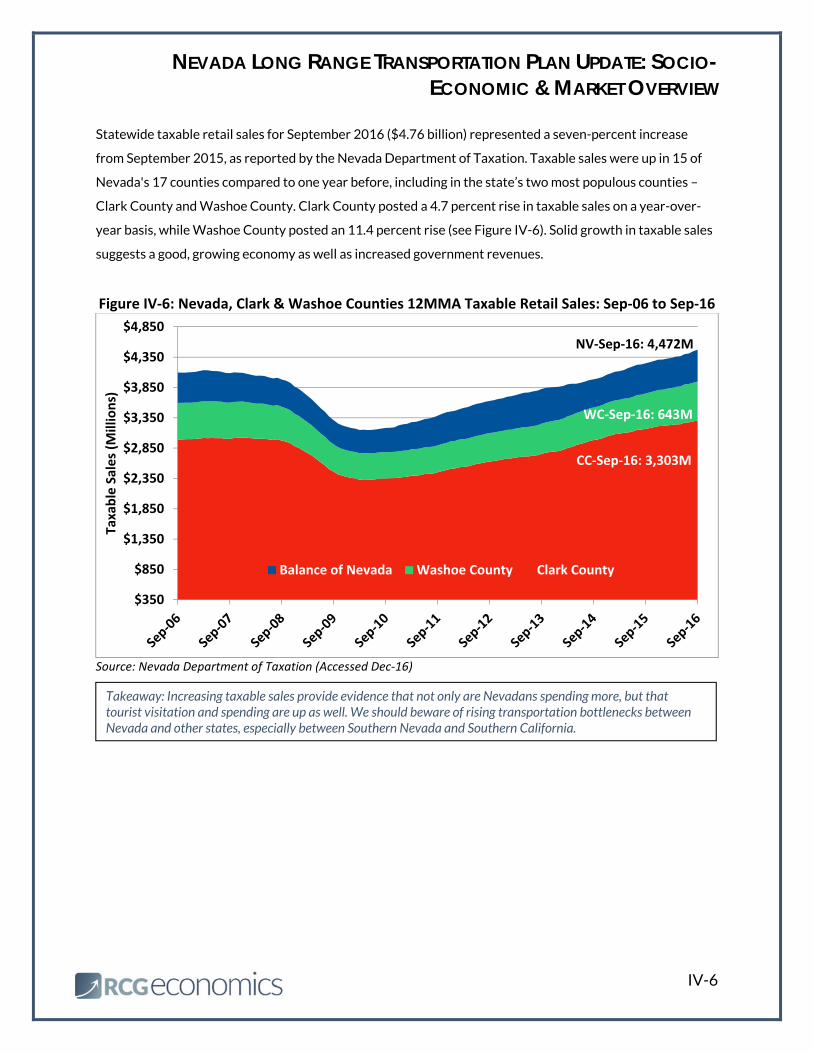
Statewide taxable retail sales for September 2016 ($4.76 billion) represented a seven-percent increase
from September 2015, as reported by the Nevada Department of Taxation. Taxable sales were up in 15 of
Nevada's 17 counties compared to one year before, including in the state’s two most populous counties –
Clark County and Washoe County. Clark County posted a 4.7 percent rise in taxable sales on a year-over-
year basis, while Washoe County posted an 11.4 percent rise (see Figure IV-6). Solid growth in taxable sales
suggests a good, growing economy as well as increased government revenues.
Figure IV‐6: Nevada, Clark & Washoe Counties 12MMA Taxable Retail Sales: Sep‐06 to Sep‐16
Source: Nevada Department of Taxation (Accessed Dec‐16)
$350
$850
$1,350
$1,850
$2,350
$2,850
$3,350
$3,850
$4,350
$4,850
Taxable Sales (M
illions)
Balance of Nevada Washoe County Clark County
CC‐Sep‐16: 3,303M
NV‐Sep‐16: 4,472M
WC‐Sep‐16: 643M
Takeaway: Increasing taxable sales provide evidence that not only are Nevadans spending more, but that tourist visitation and spending are up as well. We should beware of rising transportation bottlenecks between Nevada and other states, especially between Southern Nevada and Southern California.
NEVADA LONG RANGE TRANSPORTATION PLAN UPDATE: SOCIO-ECONOMIC & MARKET OVERVIEW
IV-7
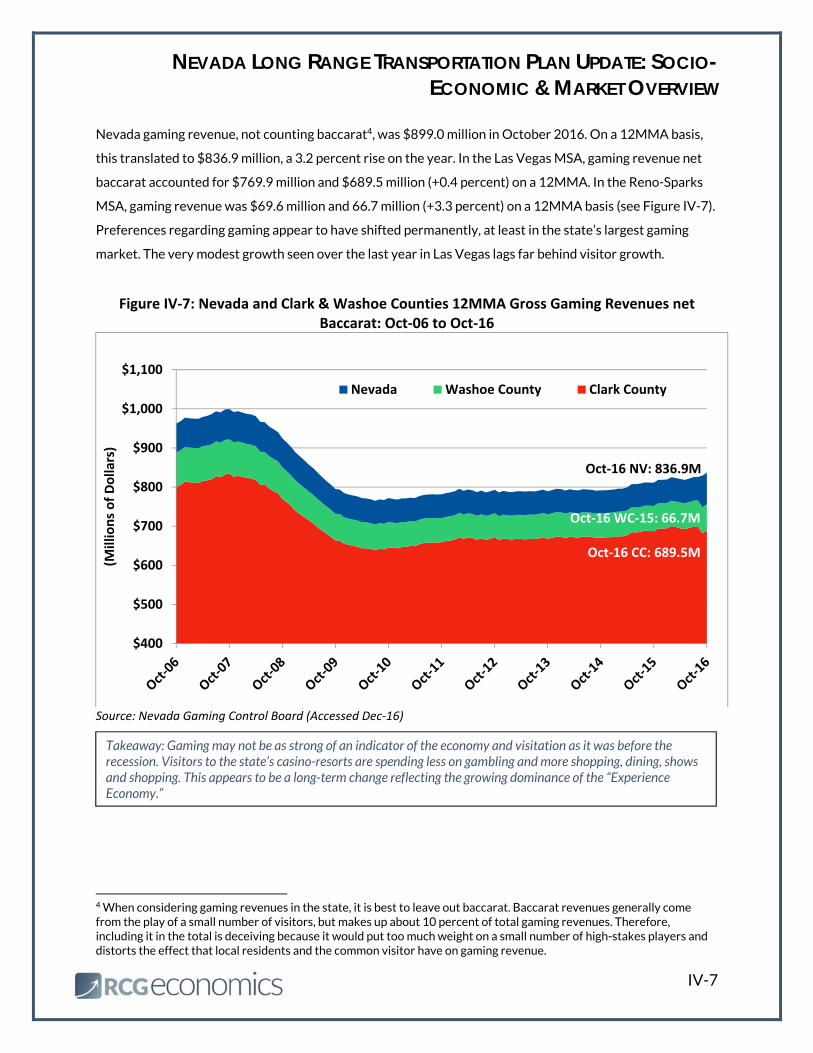
Nevada gaming revenue, not counting baccarat4, was $899.0 million in October 2016. On a 12MMA basis,
this translated to $836.9 million, a 3.2 percent rise on the year. In the Las Vegas MSA, gaming revenue net
baccarat accounted for $769.9 million and $689.5 million (+0.4 percent) on a 12MMA. In the Reno-Sparks
MSA, gaming revenue was $69.6 million and 66.7 million (+3.3 percent) on a 12MMA basis (see Figure IV-7).
Preferences regarding gaming appear to have shifted permanently, at least in the state’s largest gaming
market. The very modest growth seen over the last year in Las Vegas lags far behind visitor growth.
Figure IV‐7: Nevada and Clark & Washoe Counties 12MMA Gross Gaming Revenues net Baccarat: Oct‐06 to Oct‐16
Source: Nevada Gaming Control Board (Accessed Dec‐16)
4 When considering gaming revenues in the state, it is best to leave out baccarat. Baccarat revenues generally come from the play of a small number of visitors, but makes up about 10 percent of total gaming revenues. Therefore, including it in the total is deceiving because it would put too much weight on a small number of high-stakes players and distorts the effect that local residents and the common visitor have on gaming revenue.
$400
$500
$600
$700
$800
$900
$1,000
$1,100
(Millions of Dollars)
Nevada Washoe County Clark County
Oct‐16 WC‐15: 66.7M
Oct‐16 CC: 689.5M
Oct‐16 NV: 836.9M
Takeaway: Gaming may not be as strong of an indicator of the economy and visitation as it was before the recession. Visitors to the state’s casino-resorts are spending less on gambling and more shopping, dining, shows and shopping. This appears to be a long-term change reflecting the growing dominance of the “Experience Economy.”
NEVADA LONG RANGE TRANSPORTATION PLAN UPDATE: SOCIO-ECONOMIC & MARKET OVERVIEW
IV-8
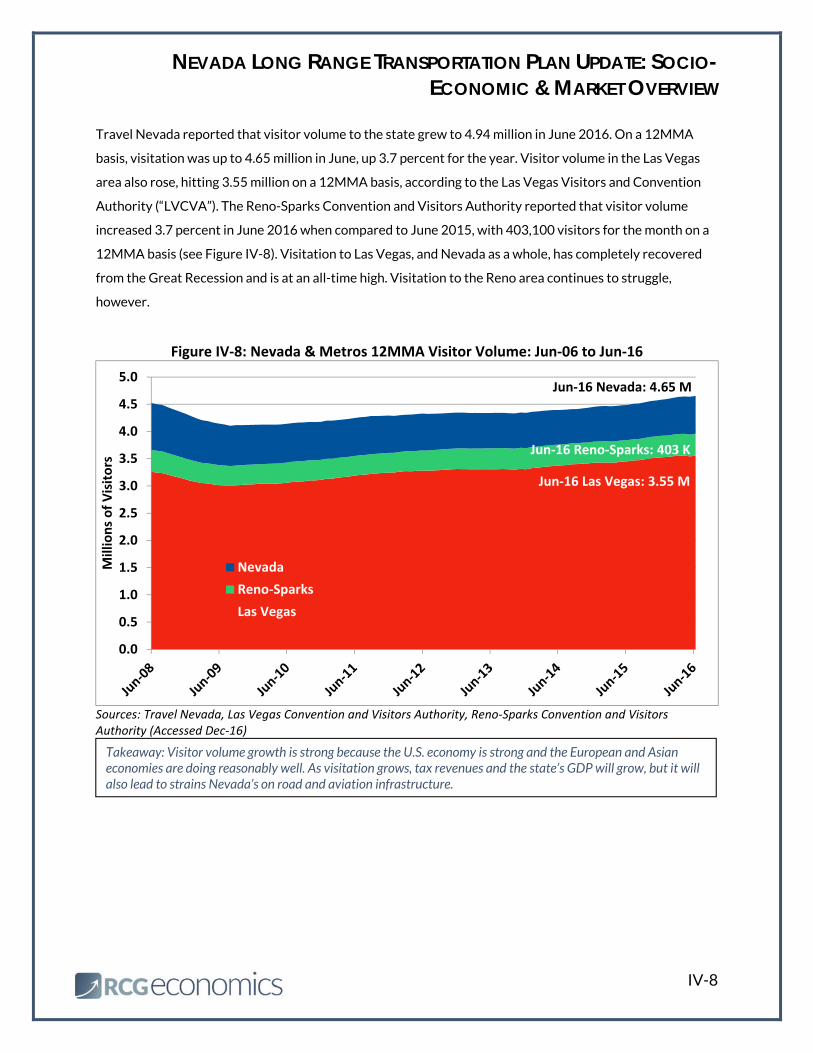
Travel Nevada reported that visitor volume to the state grew to 4.94 million in June 2016. On a 12MMA
basis, visitation was up to 4.65 million in June, up 3.7 percent for the year. Visitor volume in the Las Vegas
area also rose, hitting 3.55 million on a 12MMA basis, according to the Las Vegas Visitors and Convention
Authority (“LVCVA”). The Reno-Sparks Convention and Visitors Authority reported that visitor volume
increased 3.7 percent in June 2016 when compared to June 2015, with 403,100 visitors for the month on a
12MMA basis (see Figure IV-8). Visitation to Las Vegas, and Nevada as a whole, has completely recovered
from the Great Recession and is at an all-time high. Visitation to the Reno area continues to struggle,
however.
Figure IV‐8: Nevada & Metros 12MMA Visitor Volume: Jun‐06 to Jun‐16
Sources: Travel Nevada, Las Vegas Convention and Visitors Authority, Reno‐Sparks Convention and Visitors Authority (Accessed Dec‐16)
0.0
0.5
1.0
1.5
2.0
2.5
3.0
3.5
4.0
4.5
5.0
Millions of Visitors
Nevada
Reno‐Sparks
Las Vegas
Jun‐16 Las Vegas: 3.55 M
Jun‐16 Reno‐Sparks: 403 K
Jun‐16 Nevada: 4.65 M
Takeaway: Visitor volume growth is strong because the U.S. economy is strong and the European and Asian economies are doing reasonably well. As visitation grows, tax revenues and the state’s GDP will grow, but it will also lead to strains Nevada’s on road and aviation infrastructure.
NEVADA LONG RANGE TRANSPORTATION PLAN UPDATE: SOCIO-ECONOMIC & MARKET OVERVIEW
IV-9
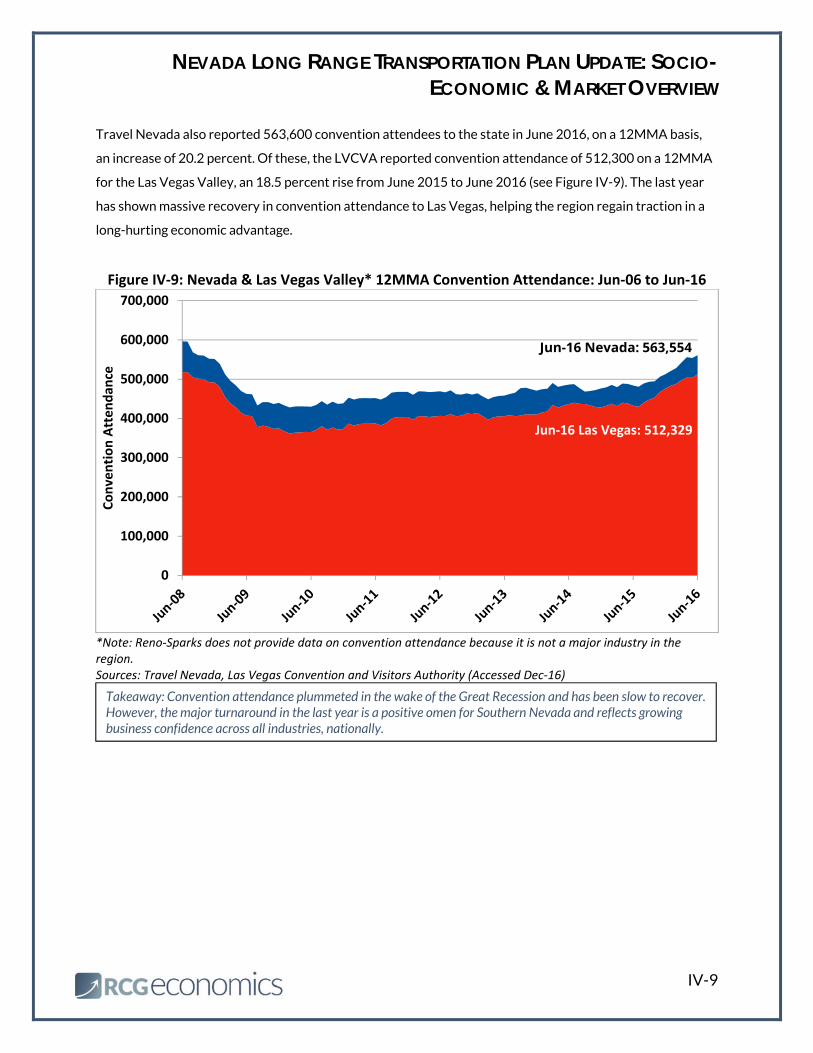
Travel Nevada also reported 563,600 convention attendees to the state in June 2016, on a 12MMA basis,
an increase of 20.2 percent. Of these, the LVCVA reported convention attendance of 512,300 on a 12MMA
for the Las Vegas Valley, an 18.5 percent rise from June 2015 to June 2016 (see Figure IV-9). The last year
has shown massive recovery in convention attendance to Las Vegas, helping the region regain traction in a
long-hurting economic advantage.
Figure IV‐9: Nevada & Las Vegas Valley* 12MMA Convention Attendance: Jun‐06 to Jun‐16
*Note: Reno‐Sparks does not provide data on convention attendance because it is not a major industry in the region. Sources: Travel Nevada, Las Vegas Convention and Visitors Authority (Accessed Dec‐16)
0
100,000
200,000
300,000
400,000
500,000
600,000
700,000
Convention Attendan
ce
Jun‐16 Las Vegas: 512,329
Jun-16 Nevada: 563,554
Takeaway: Convention attendance plummeted in the wake of the Great Recession and has been slow to recover. However, the major turnaround in the last year is a positive omen for Southern Nevada and reflects growing business confidence across all industries, nationally.
NEVADA LONG RANGE TRANSPORTATION PLAN UPDATE: SOCIO-ECONOMIC & MARKET OVERVIEW
IV-10
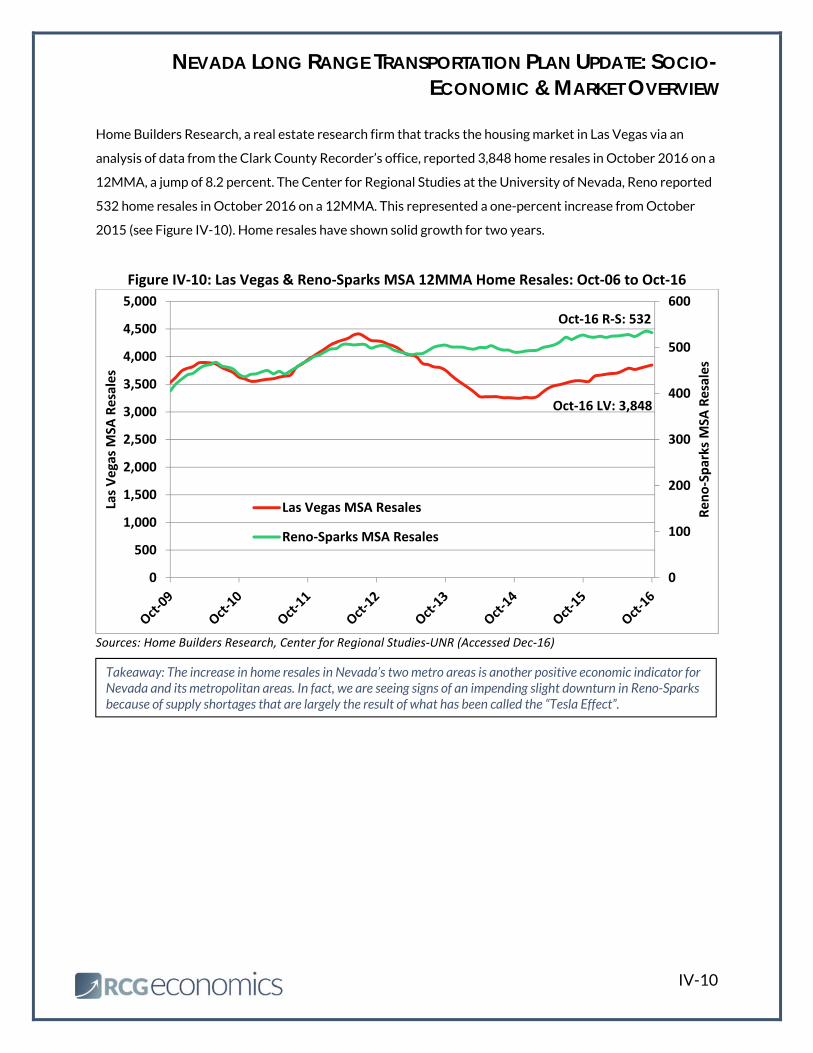
Home Builders Research, a real estate research firm that tracks the housing market in Las Vegas via an
analysis of data from the Clark County Recorder’s office, reported 3,848 home resales in October 2016 on a
12MMA, a jump of 8.2 percent. The Center for Regional Studies at the University of Nevada, Reno reported
532 home resales in October 2016 on a 12MMA. This represented a one-percent increase from October
2015 (see Figure IV-10). Home resales have shown solid growth for two years.
Figure IV‐10: Las Vegas & Reno‐Sparks MSA 12MMA Home Resales: Oct‐06 to Oct‐16
Sources: Home Builders Research, Center for Regional Studies‐UNR (Accessed Dec‐16)
0
100
200
300
400
500
600
0
500
1,000
1,500
2,000
2,500
3,000
3,500
4,000
4,500
5,000
Reno‐Sparks M
SA Resales
Las Vegas MSA
Resales
Las Vegas MSA Resales
Reno‐Sparks MSA Resales
Oct‐16 LV: 3,848
Oct‐16 R‐S: 532
Takeaway: The increase in home resales in Nevada’s two metro areas is another positive economic indicator for Nevada and its metropolitan areas. In fact, we are seeing signs of an impending slight downturn in Reno-Sparks because of supply shortages that are largely the result of what has been called the “Tesla Effect”.
NEVADA LONG RANGE TRANSPORTATION PLAN UPDATE: SOCIO-ECONOMIC & MARKET OVERVIEW
IV-11
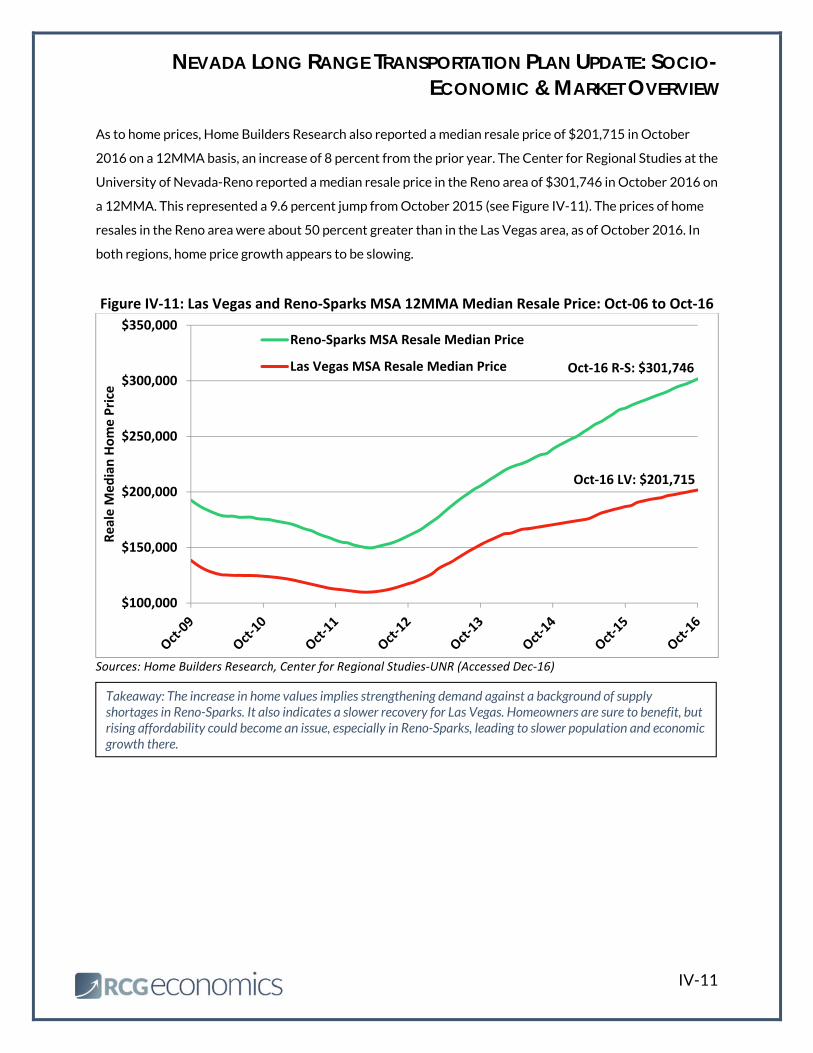
As to home prices, Home Builders Research also reported a median resale price of $201,715 in October
2016 on a 12MMA basis, an increase of 8 percent from the prior year. The Center for Regional Studies at the
University of Nevada-Reno reported a median resale price in the Reno area of $301,746 in October 2016 on
a 12MMA. This represented a 9.6 percent jump from October 2015 (see Figure IV-11). The prices of home
resales in the Reno area were about 50 percent greater than in the Las Vegas area, as of October 2016. In
both regions, home price growth appears to be slowing.
Figure IV‐11: Las Vegas and Reno‐Sparks MSA 12MMA Median Resale Price: Oct‐06 to Oct‐16
Sources: Home Builders Research, Center for Regional Studies‐UNR (Accessed Dec‐16)
$100,000
$150,000
$200,000
$250,000
$300,000
$350,000
Reale M
edian Home Price
Reno‐Sparks MSA Resale Median Price
Las Vegas MSA Resale Median Price
Oct‐16 LV: $201,715
Oct‐16 R‐S: $301,746
Takeaway: The increase in home values implies strengthening demand against a background of supply shortages in Reno-Sparks. It also indicates a slower recovery for Las Vegas. Homeowners are sure to benefit, but rising affordability could become an issue, especially in Reno-Sparks, leading to slower population and economic growth there.
NEVADA LONG RANGE TRANSPORTATION PLAN UPDATE: SOCIO-ECONOMIC & MARKET OVERVIEW
IV-12
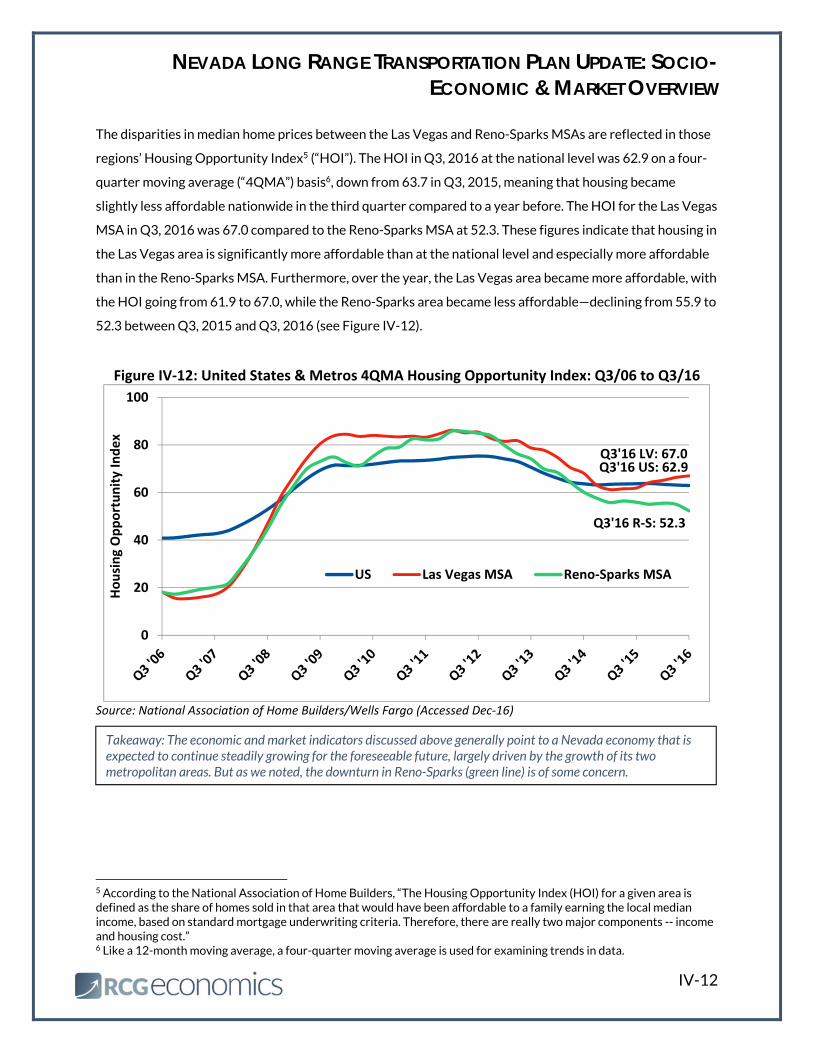
The disparities in median home prices between the Las Vegas and Reno-Sparks MSAs are reflected in those
regions’ Housing Opportunity Index5 (“HOI”). The HOI in Q3, 2016 at the national level was 62.9 on a four-
quarter moving average (“4QMA”) basis6, down from 63.7 in Q3, 2015, meaning that housing became
slightly less affordable nationwide in the third quarter compared to a year before. The HOI for the Las Vegas
MSA in Q3, 2016 was 67.0 compared to the Reno-Sparks MSA at 52.3. These figures indicate that housing in
the Las Vegas area is significantly more affordable than at the national level and especially more affordable
than in the Reno-Sparks MSA. Furthermore, over the year, the Las Vegas area became more affordable, with
the HOI going from 61.9 to 67.0, while the Reno-Sparks area became less affordable—declining from 55.9 to
52.3 between Q3, 2015 and Q3, 2016 (see Figure IV-12).
Figure IV‐12: United States & Metros 4QMA Housing Opportunity Index: Q3/06 to Q3/16
Source: National Association of Home Builders/Wells Fargo (Accessed Dec‐16)
5 According to the National Association of Home Builders, “The Housing Opportunity Index (HOI) for a given area is defined as the share of homes sold in that area that would have been affordable to a family earning the local median income, based on standard mortgage underwriting criteria. Therefore, there are really two major components -- income and housing cost.” 6 Like a 12-month moving average, a four-quarter moving average is used for examining trends in data.
0
20
40
60
80
100
Housing Opportunity Index
US Las Vegas MSA Reno‐Sparks MSA
Q3'16 US: 62.9Q3'16 LV: 67.0
Q3'16 R‐S: 52.3
Takeaway: The economic and market indicators discussed above generally point to a Nevada economy that is expected to continue steadily growing for the foreseeable future, largely driven by the growth of its two metropolitan areas. But as we noted, the downturn in Reno-Sparks (green line) is of some concern.
NEVADA LONG RANGE TRANSPORTATION PLAN UPDATE: SOCIO-ECONOMIC & MARKET OVERVIEW
V-1
V. Commuting Patterns & Income/Spending Trends
A. Commuting Patterns
s part of updating the Nevada LRTP, RCG presents employment and commuting data to shed light on
the type of movement happening within and without the state and its two major metros. According to
the most current 2014 U.S. Census Bureau data, Nevada has nearly 1.2 million jobs and 99 percent of those
are held by state residents. The Las Vegas MSA is home to 874,600 jobs, while the Reno-Sparks MSA
contains 199,200 jobs. That leaves 118,500 jobs around the rest of the state. Most commuting, therefore,
happens in and around the two main metros.
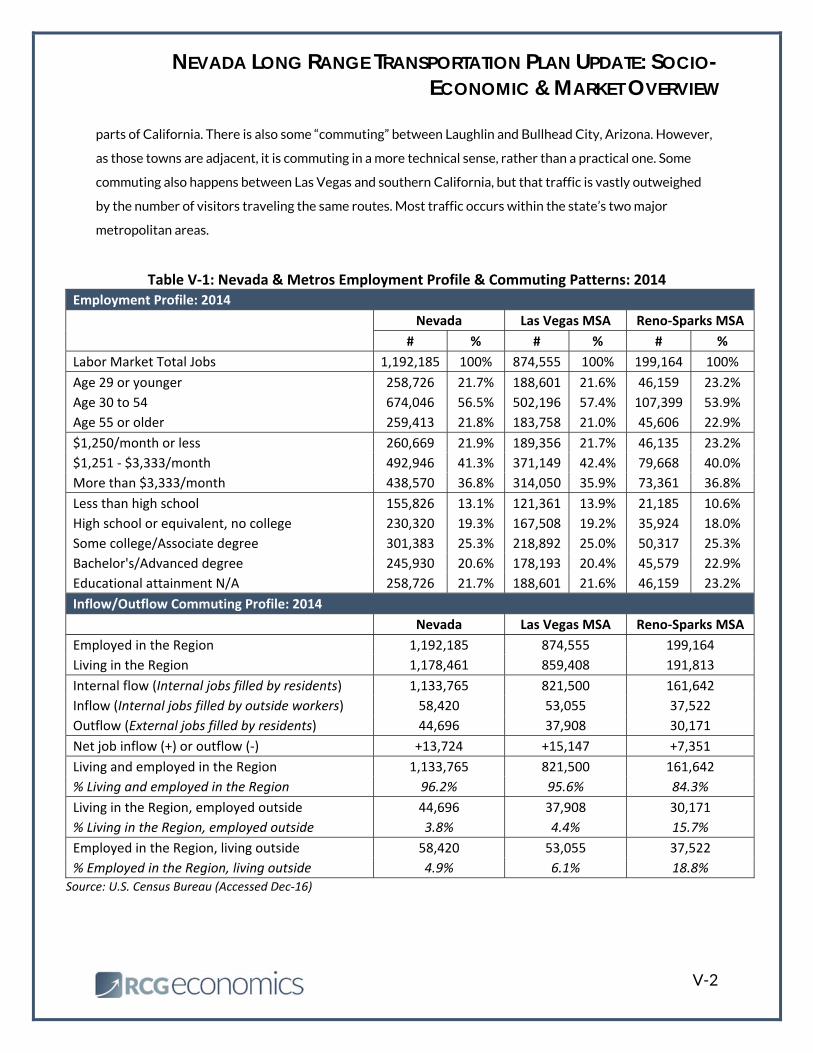
As the data show (see Table V-1), of workers that live in the Las Vegas MSA, 95.6 percent of workers both
live and work in the region. The remaining 4.4 percent of workers live in the Las Vegas MSA, but work
elsewhere. These workers use various means to commute, but the majority drive to and from work at least
once a week, according to the U.S. Census Bureau. Of the workers employed in the region, 6.1 percent live
outside of the Las Vegas area and commute to work at least once a week.
The Nevada state results look much like the Las Vegas MSA, as one would expect as Las Vegas accounts for
nearly three-quarters of jobs in the state. Of workers living in the state, 96.2 percent work in Nevada as
well. Approximately 3.8 percent of residents leave Nevada for work. Of people working in the state, 4.9
percent of them commute in to Nevada at least once a week.
The Reno-Sparks MSA is less insulated from neighboring communities than Las Vegas. These neighboring
communities include Carson City and other towns (or “micropolitan” areas) in Nevada, but they also include
communities in California. This because the core residential and employment areas in the Reno-Sparks MSA
are located near the border and California communities close to the border. This differs from the case of the
Las Vegas MSA, in which the residential and employment core are located much farther from the state’s
border and any significant California communities. For this reason, the Reno-Sparks MSA has higher
commuting rates. Of area residents, only 84.3 percent stay in the Reno area to work, while 15.7 percent
work elsewhere. Additionally, 18.8 percent of workers in the Reno-Sparks MSA come from outside of the
area.
According to the U.S. Census, most commuting into and out of the two metros is in-state. However, there is
some minor level of out-of-state commuting. Most of this is between the Reno-Sparks MSA and nearby
A
NEVADA LONG RANGE TRANSPORTATION PLAN UPDATE: SOCIO-ECONOMIC & MARKET OVERVIEW
V-2
parts of California. There is also some “commuting” between Laughlin and Bullhead City, Arizona. However,
as those towns are adjacent, it is commuting in a more technical sense, rather than a practical one. Some
commuting also happens between Las Vegas and southern California, but that traffic is vastly outweighed
by the number of visitors traveling the same routes. Most traffic occurs within the state’s two major
metropolitan areas.
Table V‐1: Nevada & Metros Employment Profile & Commuting Patterns: 2014 Employment Profile: 2014
Nevada Las Vegas MSA Reno‐Sparks MSA
# % # % # %
Labor Market Total Jobs 1,192,185 100% 874,555 100% 199,164 100%
Age 29 or younger 258,726 21.7% 188,601 21.6% 46,159 23.2%
Age 30 to 54 674,046 56.5% 502,196 57.4% 107,399 53.9%
Age 55 or older 259,413 21.8% 183,758 21.0% 45,606 22.9%
$1,250/month or less 260,669 21.9% 189,356 21.7% 46,135 23.2%
$1,251 ‐ $3,333/month 492,946 41.3% 371,149 42.4% 79,668 40.0%
More than $3,333/month 438,570 36.8% 314,050 35.9% 73,361 36.8%
Less than high school 155,826 13.1% 121,361 13.9% 21,185 10.6%
High school or equivalent, no college 230,320 19.3% 167,508 19.2% 35,924 18.0%
Some college/Associate degree 301,383 25.3% 218,892 25.0% 50,317 25.3%
Bachelor's/Advanced degree 245,930 20.6% 178,193 20.4% 45,579 22.9%
Educational attainment N/A 258,726 21.7% 188,601 21.6% 46,159 23.2%
Inflow/Outflow Commuting Profile: 2014
Nevada Las Vegas MSA Reno‐Sparks MSA
Employed in the Region 1,192,185 874,555 199,164
Living in the Region 1,178,461 859,408 191,813
Internal flow (Internal jobs filled by residents) 1,133,765 821,500 161,642
Inflow (Internal jobs filled by outside workers) 58,420 53,055 37,522
Outflow (External jobs filled by residents) 44,696 37,908 30,171
Net job inflow (+) or outflow (‐) +13,724 +15,147 +7,351
Living and employed in the Region 1,133,765 821,500 161,642
% Living and employed in the Region 96.2% 95.6% 84.3%
Living in the Region, employed outside 44,696 37,908 30,171
% Living in the Region, employed outside 3.8% 4.4% 15.7%
Employed in the Region, living outside 58,420 53,055 37,522
% Employed in the Region, living outside 4.9% 6.1% 18.8%
Source: U.S. Census Bureau (Accessed Dec‐16)
NEVADA LONG RANGE TRANSPORTATION PLAN UPDATE: SOCIO-ECONOMIC & MARKET OVERVIEW
V-3
B. Income/Spending Patterns
Income and spending data for Nevada and its two main metro areas came from Environmental Systems
Research Institute (“ESRI”)7, the widely used and industry-leading geographic information systems (“GIS”)
software maker.
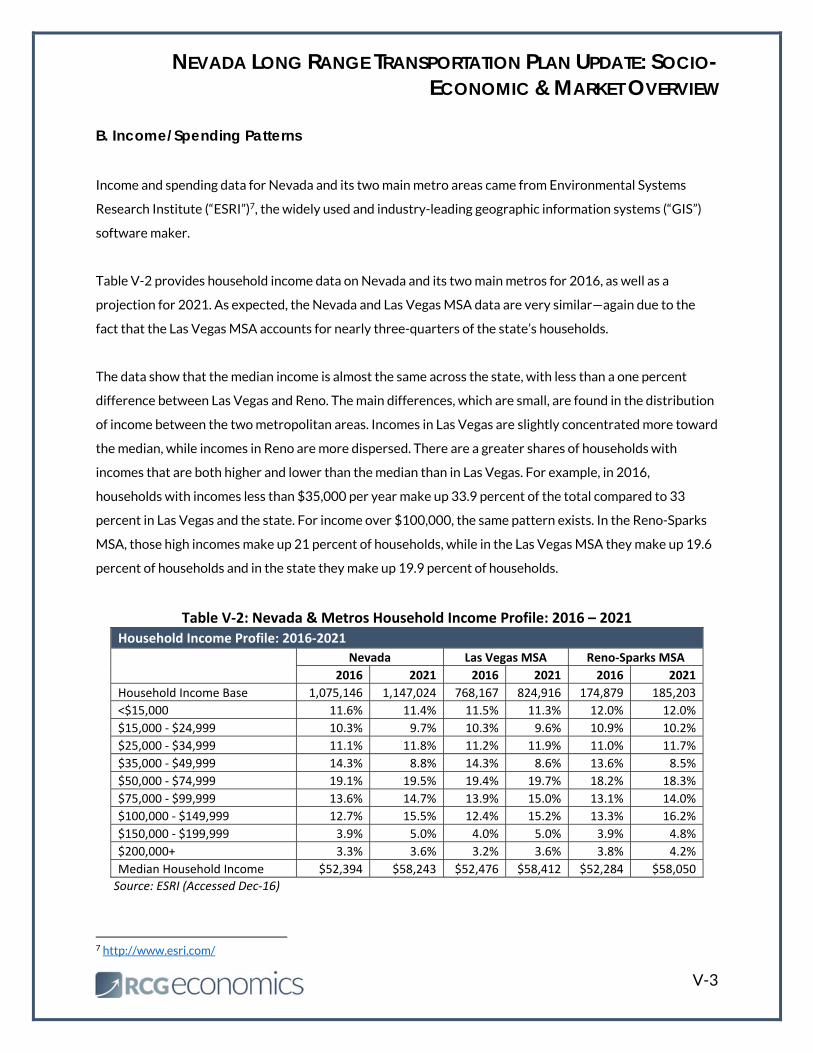
Table V-2 provides household income data on Nevada and its two main metros for 2016, as well as a
projection for 2021. As expected, the Nevada and Las Vegas MSA data are very similar—again due to the
fact that the Las Vegas MSA accounts for nearly three-quarters of the state’s households.
The data show that the median income is almost the same across the state, with less than a one percent
difference between Las Vegas and Reno. The main differences, which are small, are found in the distribution
of income between the two metropolitan areas. Incomes in Las Vegas are slightly concentrated more toward
the median, while incomes in Reno are more dispersed. There are a greater shares of households with
incomes that are both higher and lower than the median than in Las Vegas. For example, in 2016,
households with incomes less than $35,000 per year make up 33.9 percent of the total compared to 33
percent in Las Vegas and the state. For income over $100,000, the same pattern exists. In the Reno-Sparks
MSA, those high incomes make up 21 percent of households, while in the Las Vegas MSA they make up 19.6
percent of households and in the state they make up 19.9 percent of households.
Table V‐2: Nevada & Metros Household Income Profile: 2016 – 2021 Household Income Profile: 2016‐2021
Nevada Las Vegas MSA Reno‐Sparks MSA
2016 2021 2016 2021 2016 2021
Household Income Base 1,075,146 1,147,024 768,167 824,916 174,879 185,203
<$15,000 11.6% 11.4% 11.5% 11.3% 12.0% 12.0%
$15,000 ‐ $24,999 10.3% 9.7% 10.3% 9.6% 10.9% 10.2%
$25,000 ‐ $34,999 11.1% 11.8% 11.2% 11.9% 11.0% 11.7%
$35,000 ‐ $49,999 14.3% 8.8% 14.3% 8.6% 13.6% 8.5%
$50,000 ‐ $74,999 19.1% 19.5% 19.4% 19.7% 18.2% 18.3%
$75,000 ‐ $99,999 13.6% 14.7% 13.9% 15.0% 13.1% 14.0%
$100,000 ‐ $149,999 12.7% 15.5% 12.4% 15.2% 13.3% 16.2%
$150,000 ‐ $199,999 3.9% 5.0% 4.0% 5.0% 3.9% 4.8%
$200,000+ 3.3% 3.6% 3.2% 3.6% 3.8% 4.2%
Median Household Income $52,394 $58,243 $52,476 $58,412 $52,284 $58,050
Source: ESRI (Accessed Dec‐16)
7 http://www.esri.com/
NEVADA LONG RANGE TRANSPORTATION PLAN UPDATE: SOCIO-ECONOMIC & MARKET OVERVIEW
V-4
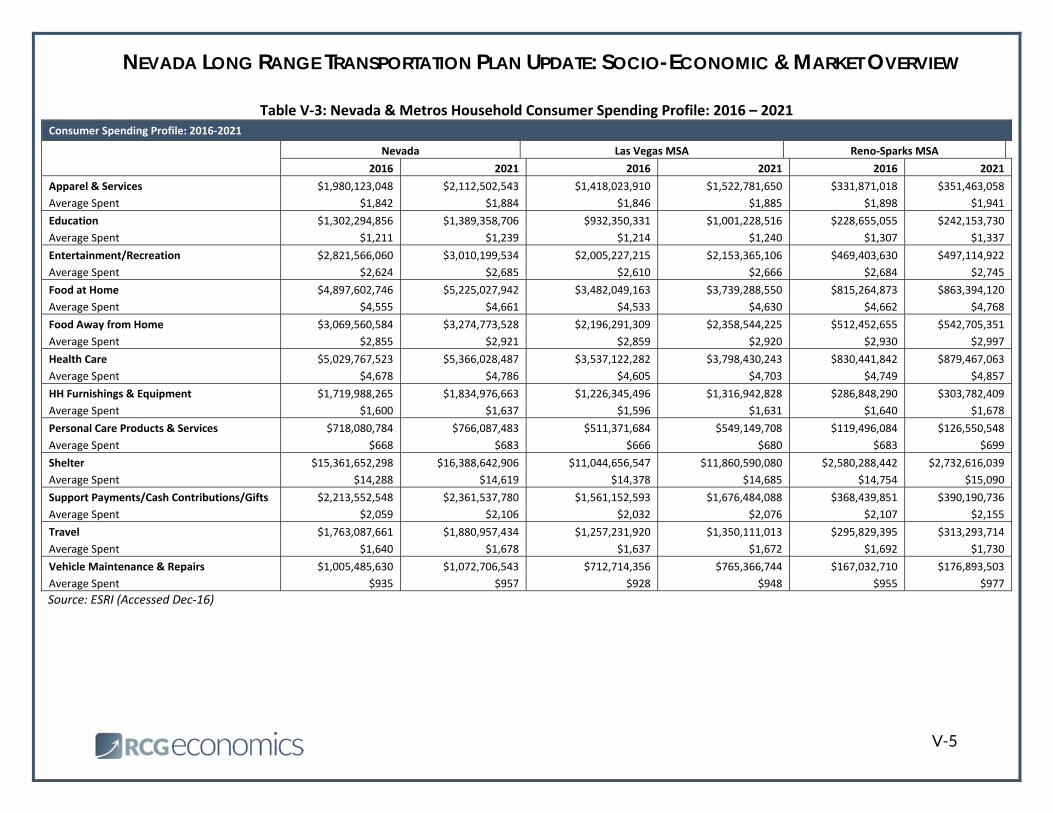
Table V-3 provides a consumer spending profile for households in Nevada and the two major metros. We
discuss only 2016 figures, but 2021 figures are shown in the table as well. As expected, shelter is the
greatest burden for Nevada households. Shelter includes mortgage, rent and associated costs. It comes out
to $14,300 per year for the state, $14,400 for the Las Vegas MSA and slightly higher still for the Reno-
Sparks MSA at $14,800. After shelter, food is the next greatest expense—both food at home and out. For
the state, households spent $7,400 per year on food, both at home and away from home. In the Las Vegas
area, they also spent $7,400 per year. In Reno, it was $7,600 per year. The third major area of expenses for
Nevada households is healthcare. In Nevada, households spent $4,700 per year in 2016. In Las Vegas that
amount was $4,600 per year and in Reno it was $4,700 per year.
Shelter, food and healthcare are the three major expenses for households throughout Nevada. Some other
areas of expense for Nevada households include entertainment/recreation ($2,600 per year), support
payments/cash contributions/gifts ($2,100 per year) and apparel and services ($1,800 per year). Household
spending was very similar for the state and its two major metros.
NEVADA LONG RANGE TRANSPORTATION PLAN UPDATE: SOCIO-ECONOMIC & MARKET OVERVIEW
V-5
Table V‐3: Nevada & Metros Household Consumer Spending Profile: 2016 – 2021
Source: ESRI (Accessed Dec‐16)
Consumer Spending Profile: 2016‐2021
Nevada Las Vegas MSA Reno‐Sparks MSA
2016 2021 2016 2021 2016 2021
Apparel & Services $1,980,123,048 $2,112,502,543 $1,418,023,910 $1,522,781,650 $331,871,018 $351,463,058
Average Spent $1,842 $1,884 $1,846 $1,885 $1,898 $1,941
Education $1,302,294,856 $1,389,358,706 $932,350,331 $1,001,228,516 $228,655,055 $242,153,730
Average Spent $1,211 $1,239 $1,214 $1,240 $1,307 $1,337
Entertainment/Recreation $2,821,566,060 $3,010,199,534 $2,005,227,215 $2,153,365,106 $469,403,630 $497,114,922
Average Spent $2,624 $2,685 $2,610 $2,666 $2,684 $2,745
Food at Home $4,897,602,746 $5,225,027,942 $3,482,049,163 $3,739,288,550 $815,264,873 $863,394,120
Average Spent $4,555 $4,661 $4,533 $4,630 $4,662 $4,768
Food Away from Home $3,069,560,584 $3,274,773,528 $2,196,291,309 $2,358,544,225 $512,452,655 $542,705,351
Average Spent $2,855 $2,921 $2,859 $2,920 $2,930 $2,997
Health Care $5,029,767,523 $5,366,028,487 $3,537,122,282 $3,798,430,243 $830,441,842 $879,467,063
Average Spent $4,678 $4,786 $4,605 $4,703 $4,749 $4,857
HH Furnishings & Equipment $1,719,988,265 $1,834,976,663 $1,226,345,496 $1,316,942,828 $286,848,290 $303,782,409
Average Spent $1,600 $1,637 $1,596 $1,631 $1,640 $1,678
Personal Care Products & Services $718,080,784 $766,087,483 $511,371,684 $549,149,708 $119,496,084 $126,550,548
Average Spent $668 $683 $666 $680 $683 $699
Shelter $15,361,652,298 $16,388,642,906 $11,044,656,547 $11,860,590,080 $2,580,288,442 $2,732,616,039
Average Spent $14,288 $14,619 $14,378 $14,685 $14,754 $15,090
Support Payments/Cash Contributions/Gifts $2,213,552,548 $2,361,537,780 $1,561,152,593 $1,676,484,088 $368,439,851 $390,190,736
Average Spent $2,059 $2,106 $2,032 $2,076 $2,107 $2,155
Travel $1,763,087,661 $1,880,957,434 $1,257,231,920 $1,350,111,013 $295,829,395 $313,293,714
Average Spent $1,640 $1,678 $1,637 $1,672 $1,692 $1,730
Vehicle Maintenance & Repairs $1,005,485,630 $1,072,706,543 $712,714,356 $765,366,744 $167,032,710 $176,893,503
Average Spent $935 $957 $928 $948 $955 $977
NEVADA LONG RANGE TRANSPORTATION PLAN UPDATE: SOCIO-ECONOMIC & MARKET OVERVIEW
VI-1
VI. Commercial Real Estate Market Dynamics
nother important metric to consider is commercial real estate vacancy. This metric is important
because commercial real estate provides a strong measure of economic activity, as well as real estate
demand, along being a driver of regional industries like construction. Data for the entire state is not readily
available; however, these data do exist for the two major metro areas. In the Las Vegas area, RCG has been
tracking the Industrial, Speculative (i.e., multi-tenant, for-lease space) Office8 and Anchored Retail markets
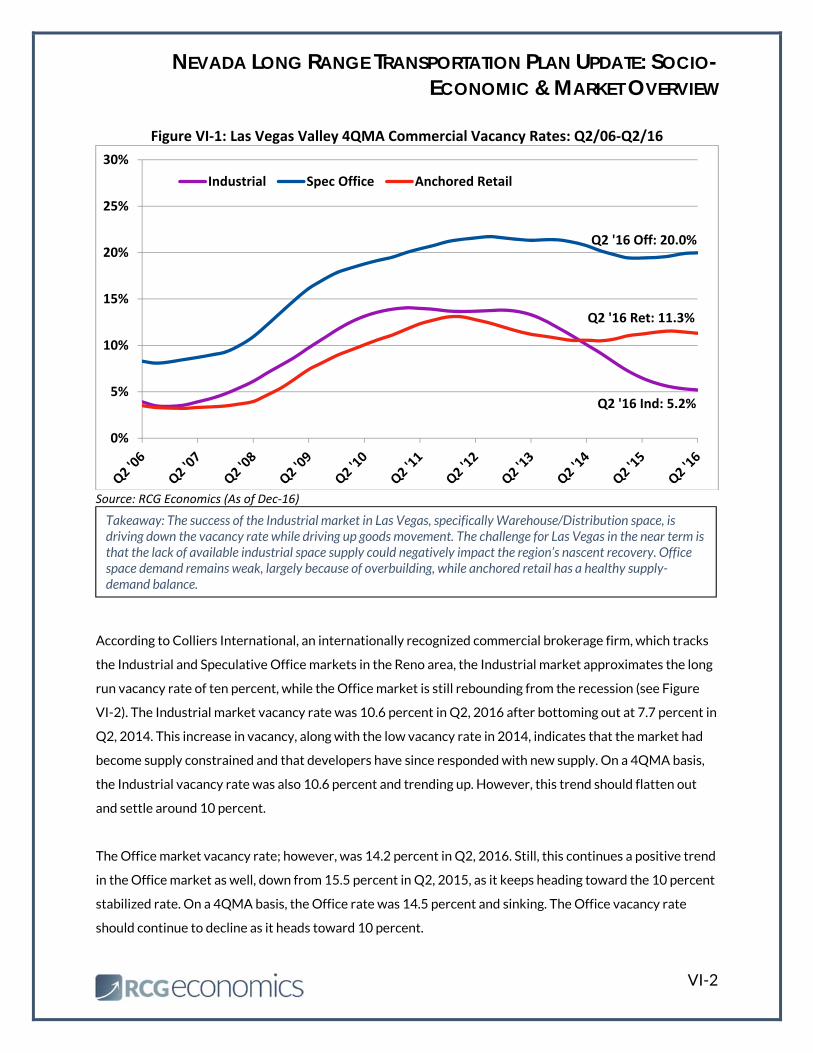
for over 25 years (see Figure VI-1). In Q2, 2016, the Industrial market had a 5.2 percent vacancy rate, down
from 5.7 percent in Q2, 2015. This is well below what is consider the long-term stabilized rate of 10 percent.
On a 4QMA basis, the Industrial vacancy rate was also 5.2 percent. The trend shows that the Industrial
market vacancy is flattening out at around five percent as new supply begins to catch up with demand.
The Office vacancy rate in the Las Vegas area was still quite high at 20.2 percent in Q2, 2016, up from 19.9
percent from the same time in the prior year. This small increase is possibly due to a combination of new
space having come to market as well as a slowdown in professional office jobs in the region. There was a glut
of new Office space built during the pre-Great Recession boom and now, without the growth that was
expected to come, much of the market’s space sits vacant, leading to the high vacancy rate. On a 4QMA
basis, the vacancy rate in Q2 was 20 percent and stalling. The number of vacancies should begin to decline
again. However, we do not expect vacancies to reach the 10 percent stabilized rate until early in the next
decade. For now, the high teens is the new normal.
The Retail vacancy rate in Q2, 2016 was 11 percent compared to 11.6 percent in Q2, 2015. Progress in
Anchored Retail has generally halted. The vacancy rate has fluctuated between 10 and 12 percent since Q2,
2012—three full years. On a 4QMA basis, the Retail vacancy rate was 11.3 percent in Q3, 2016 and looking
fairly flat. Part of this has been a quality issue, as low quality locations have gone unused. However, the main
problem affecting Retail is internet retail sales. Growth in online retail has severely limited growth in
traditional retail. “Big Box” retailers still continue to shut down their brick and mortar locations as online
retailers, led by Amazon, continue to increase revenues and market share. In the place of Anchored Retail,
Industrial Warehouse/Distribution has emerged as a substitute, as warehouses are used to store consumer
goods until they are purchased. For this reason, new space in the Retail sector has been slow to come to
market.
8 RCG does not track owner-occupied (built-to-suit) or government offices, because those buildings do not accurately reflect the state of the open multi-tenant Office market. Both built-to-suit and government offices are constructed as needed for a specific user and are not directly correlated with the economic health of a community.
A
NEVADA LONG RANGE TRANSPORTATION PLAN UPDATE: SOCIO-ECONOMIC & MARKET OVERVIEW
VI-2
Figure VI‐1: Las Vegas Valley 4QMA Commercial Vacancy Rates: Q2/06‐Q2/16
Source: RCG Economics (As of Dec‐16)
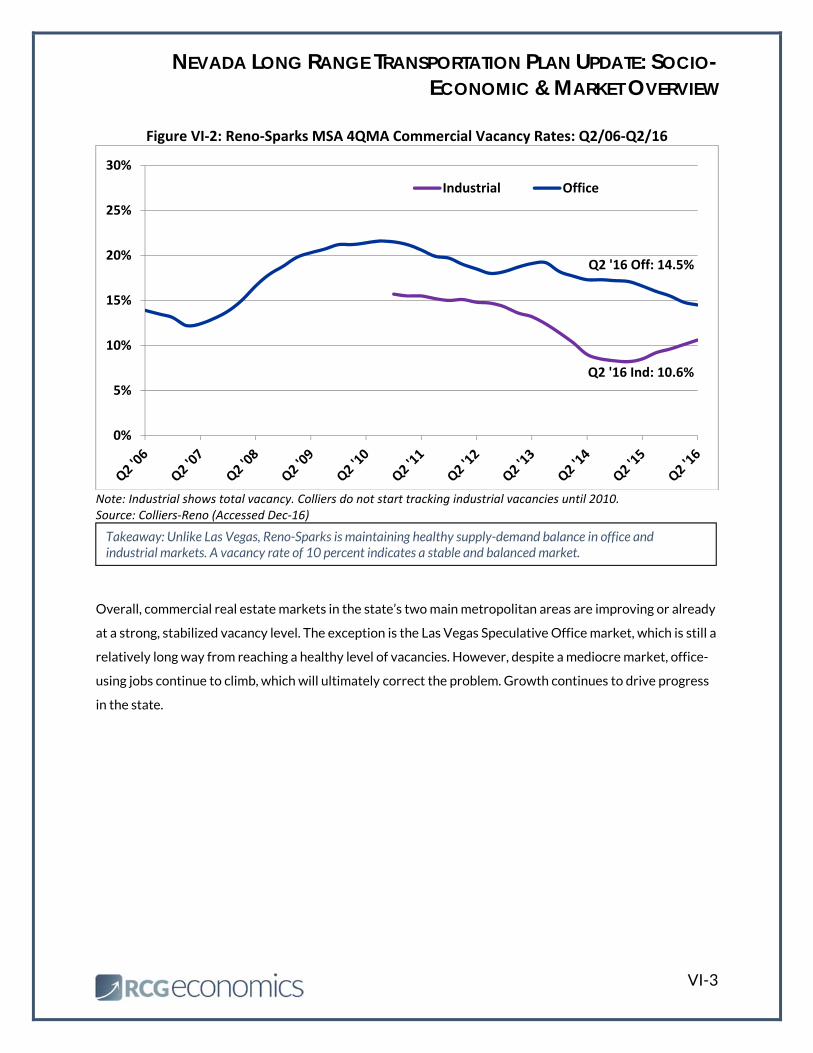
According to Colliers International, an internationally recognized commercial brokerage firm, which tracks
the Industrial and Speculative Office markets in the Reno area, the Industrial market approximates the long
run vacancy rate of ten percent, while the Office market is still rebounding from the recession (see Figure
VI-2). The Industrial market vacancy rate was 10.6 percent in Q2, 2016 after bottoming out at 7.7 percent in
Q2, 2014. This increase in vacancy, along with the low vacancy rate in 2014, indicates that the market had
become supply constrained and that developers have since responded with new supply. On a 4QMA basis,
the Industrial vacancy rate was also 10.6 percent and trending up. However, this trend should flatten out
and settle around 10 percent.
The Office market vacancy rate; however, was 14.2 percent in Q2, 2016. Still, this continues a positive trend
in the Office market as well, down from 15.5 percent in Q2, 2015, as it keeps heading toward the 10 percent
stabilized rate. On a 4QMA basis, the Office rate was 14.5 percent and sinking. The Office vacancy rate
should continue to decline as it heads toward 10 percent.
0%
5%
10%
15%
20%
25%
30%
Industrial Spec Office Anchored Retail
Q2 '16 Off: 20.0%
Q2 '16 Ind: 5.2%
Q2 '16 Ret: 11.3%
Takeaway: The success of the Industrial market in Las Vegas, specifically Warehouse/Distribution space, is driving down the vacancy rate while driving up goods movement. The challenge for Las Vegas in the near term is that the lack of available industrial space supply could negatively impact the region’s nascent recovery. Office space demand remains weak, largely because of overbuilding, while anchored retail has a healthy supply-demand balance.
NEVADA LONG RANGE TRANSPORTATION PLAN UPDATE: SOCIO-ECONOMIC & MARKET OVERVIEW
VI-3
Figure VI‐2: Reno‐Sparks MSA 4QMA Commercial Vacancy Rates: Q2/06‐Q2/16
Note: Industrial shows total vacancy. Colliers do not start tracking industrial vacancies until 2010. Source: Colliers‐Reno (Accessed Dec‐16)
Overall, commercial real estate markets in the state’s two main metropolitan areas are improving or already
at a strong, stabilized vacancy level. The exception is the Las Vegas Speculative Office market, which is still a
relatively long way from reaching a healthy level of vacancies. However, despite a mediocre market, office-
using jobs continue to climb, which will ultimately correct the problem. Growth continues to drive progress
in the state.
0%
5%
10%
15%
20%
25%
30%
Industrial Office
Q2 '16 Off: 14.5%
Q2 '16 Ind: 10.6%
Takeaway: Unlike Las Vegas, Reno-Sparks is maintaining healthy supply-demand balance in office and industrial markets. A vacancy rate of 10 percent indicates a stable and balanced market.
NEVADA LONG RANGE TRANSPORTATION PLAN UPDATE: SOCIO-ECONOMIC & MARKET OVERVIEW
VII-1
VII. Economic Development Potential
his section provides a breakdown of historical jobs by industry called location quotients9 (“LQ”). An LQ
identifies the strong and weak industries in an economy relative to the national economy. Higher LQs
typically point to regional comparative advantages. They can also tell us whether an economy lacks diversity
by being too focused on a small group of industries. Generally, one would want most industries to be
clustered around an LQ of one, with an industry or two somewhat higher and lower than one. This would
indicate a diverse economy that includes some modicum of specialization.
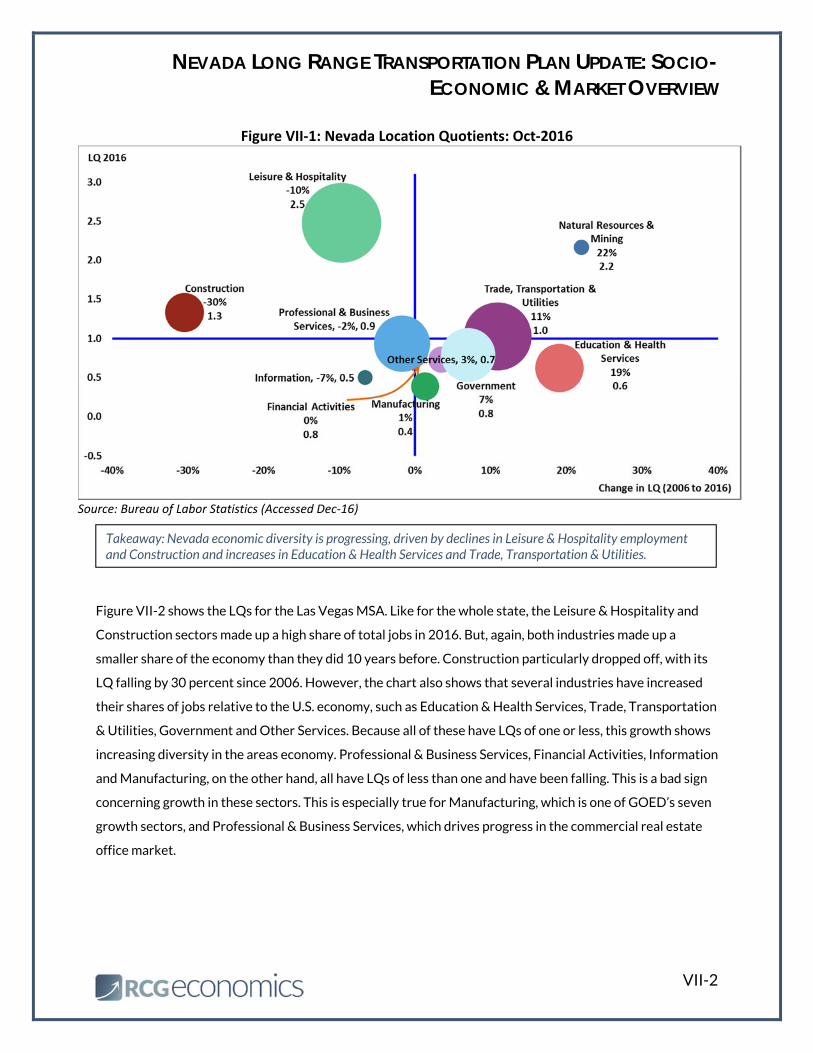
Below, we provide the LQs for the major industrial sectors in Nevada and the two major metros. For the
state, we see that the Leisure & Hospitality and Construction sectors made up a high share of total jobs in
2016 (see Figure VII-1)10. However, both industries made up a smaller share of the economy than they did
10 years before. The Leisure & Hospitality LQ has shrunk 10 percent, while the Construction LQ declined
30 percent. Natural Resources & Mining also makes up a disproportionately large share of the economy in
Nevada and that share continues to increase. This is mainly due to continuing high prices for gold and silver.
The chart on the next page also shows that several industries have increased their shares of jobs, such as
Government, Trade, Transportation & Utilities, Education & Health Services as well as Manufacturing.
Trade, Transportation & Utilities, with an LQ of 1, has caught up with the rest of the nation and now
accounts for its fair share of the jobs at the state level. Manufacturing, on the other hand, has an LQ of 0.4,
so it makes up a relatively small share of the economy. The Information and Other Services sectors make up
disproportionately small shares of the economy. The major growth appears to be happening in Natural
Resources & Mining, Education & Health Services, Trade, Transportation & Utilities and Government.
9 According to the Bureau of Economic Analysis, “a location quotient is an analytical statistic that measures a region’s industrial specialization relative to a larger geographic unit (usually the nation). An LQ is computed as an industry’s share of a regional total for some economic statistic divided by the industry’s share of the national total for the same statistic. 10 The vertical axis (y-axis) of this chart shows the current (2016) LQ. Higher up means that the local economy has a higher share of jobs in a certain sector than the national economy. The horizontal axis (x-axis) provides the percent change in LQ between the two time periods (2006 and 2016). Farther right means that an industry has grown its share of employment over the last 10 years, while farther left means an industry has declined in share of total jobs. The size of the dot shows the absolute size of the number of jobs in an industry, so industries with larger circles have more workers.
T
NEVADA LONG RANGE TRANSPORTATION PLAN UPDATE: SOCIO-ECONOMIC & MARKET OVERVIEW
VII-2
Figure VII‐1: Nevada Location Quotients: Oct‐2016
Source: Bureau of Labor Statistics (Accessed Dec‐16)
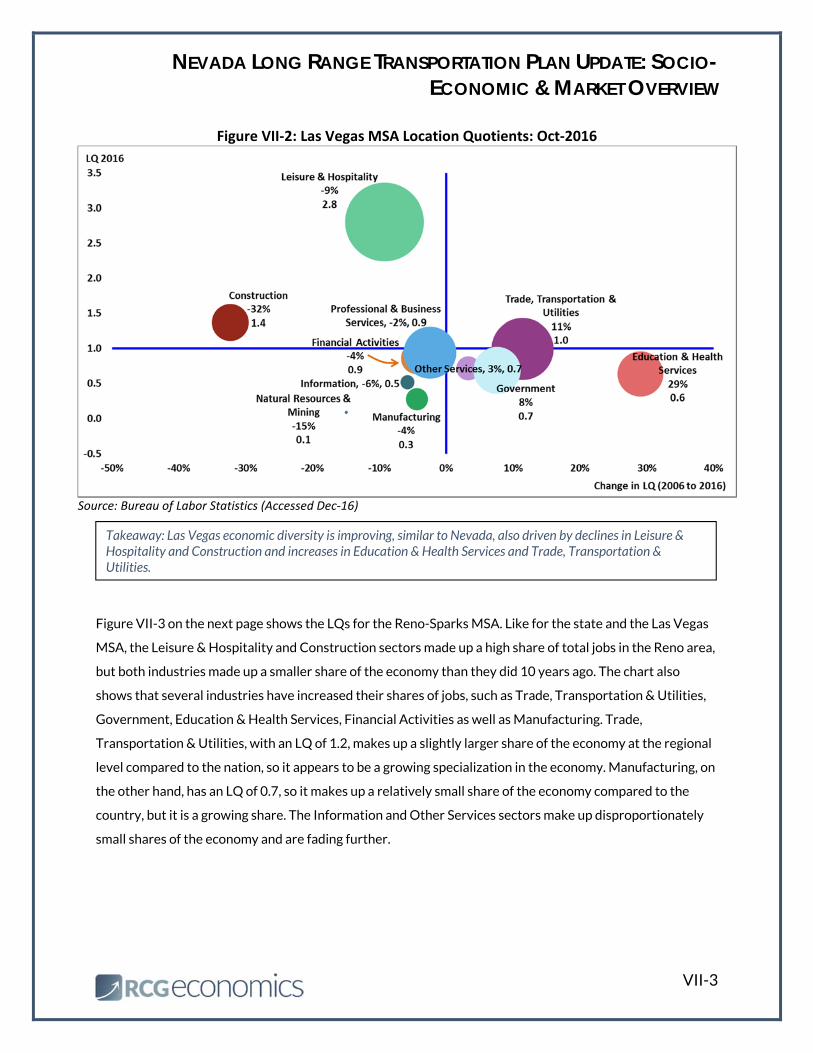
Figure VII-2 shows the LQs for the Las Vegas MSA. Like for the whole state, the Leisure & Hospitality and
Construction sectors made up a high share of total jobs in 2016. But, again, both industries made up a
smaller share of the economy than they did 10 years before. Construction particularly dropped off, with its
LQ falling by 30 percent since 2006. However, the chart also shows that several industries have increased
their shares of jobs relative to the U.S. economy, such as Education & Health Services, Trade, Transportation
& Utilities, Government and Other Services. Because all of these have LQs of one or less, this growth shows
increasing diversity in the areas economy. Professional & Business Services, Financial Activities, Information
and Manufacturing, on the other hand, all have LQs of less than one and have been falling. This is a bad sign
concerning growth in these sectors. This is especially true for Manufacturing, which is one of GOED’s seven
growth sectors, and Professional & Business Services, which drives progress in the commercial real estate
office market.
Takeaway: Nevada economic diversity is progressing, driven by declines in Leisure & Hospitality employment and Construction and increases in Education & Health Services and Trade, Transportation & Utilities.
NEVADA LONG RANGE TRANSPORTATION PLAN UPDATE: SOCIO-ECONOMIC & MARKET OVERVIEW
VII-3
Figure VII‐2: Las Vegas MSA Location Quotients: Oct‐2016
Source: Bureau of Labor Statistics (Accessed Dec‐16)
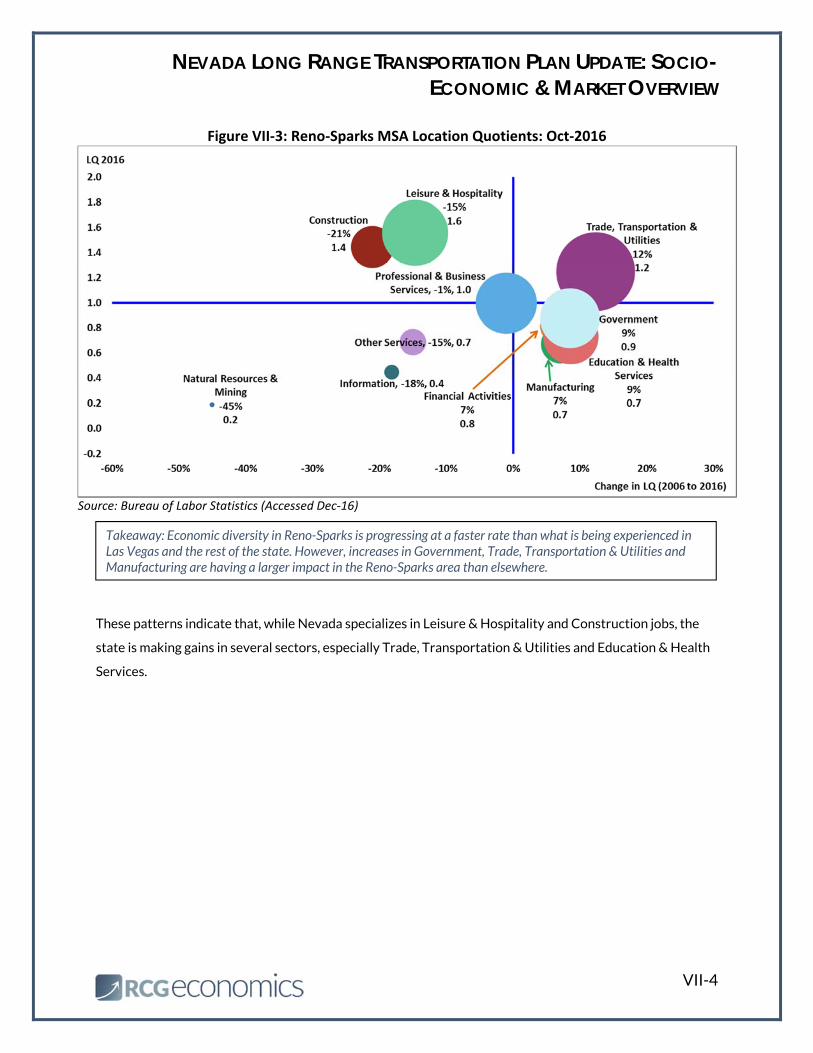
Figure VII-3 on the next page shows the LQs for the Reno-Sparks MSA. Like for the state and the Las Vegas
MSA, the Leisure & Hospitality and Construction sectors made up a high share of total jobs in the Reno area,
but both industries made up a smaller share of the economy than they did 10 years ago. The chart also
shows that several industries have increased their shares of jobs, such as Trade, Transportation & Utilities,
Government, Education & Health Services, Financial Activities as well as Manufacturing. Trade,
Transportation & Utilities, with an LQ of 1.2, makes up a slightly larger share of the economy at the regional
level compared to the nation, so it appears to be a growing specialization in the economy. Manufacturing, on
the other hand, has an LQ of 0.7, so it makes up a relatively small share of the economy compared to the
country, but it is a growing share. The Information and Other Services sectors make up disproportionately
small shares of the economy and are fading further.
Takeaway: Las Vegas economic diversity is improving, similar to Nevada, also driven by declines in Leisure & Hospitality and Construction and increases in Education & Health Services and Trade, Transportation & Utilities.
NEVADA LONG RANGE TRANSPORTATION PLAN UPDATE: SOCIO-ECONOMIC & MARKET OVERVIEW
VII-4
Figure VII‐3: Reno‐Sparks MSA Location Quotients: Oct‐2016
Source: Bureau of Labor Statistics (Accessed Dec‐16)
These patterns indicate that, while Nevada specializes in Leisure & Hospitality and Construction jobs, the
state is making gains in several sectors, especially Trade, Transportation & Utilities and Education & Health
Services.
Takeaway: Economic diversity in Reno-Sparks is progressing at a faster rate than what is being experienced in Las Vegas and the rest of the state. However, increases in Government, Trade, Transportation & Utilities and Manufacturing are having a larger impact in the Reno-Sparks area than elsewhere.
NEVADA LONG RANGE TRANSPORTATION PLAN UPDATE: SOCIO-ECONOMIC & MARKET OVERVIEW
VIII-1
VIII. Summary of Growth Patterns, Trends & Forces
n this section, changes in employment are discussed, specifically the change in share by industry. This is
known as the “shift-share.” Shift-share explores the direction that an economy is trending and its
employment situation. As in, which industries are new jobs appearing and where are they disappearing. This
differs from LQ in that shift-share does not compare job shares to the national level. It looks at only the area
in question.
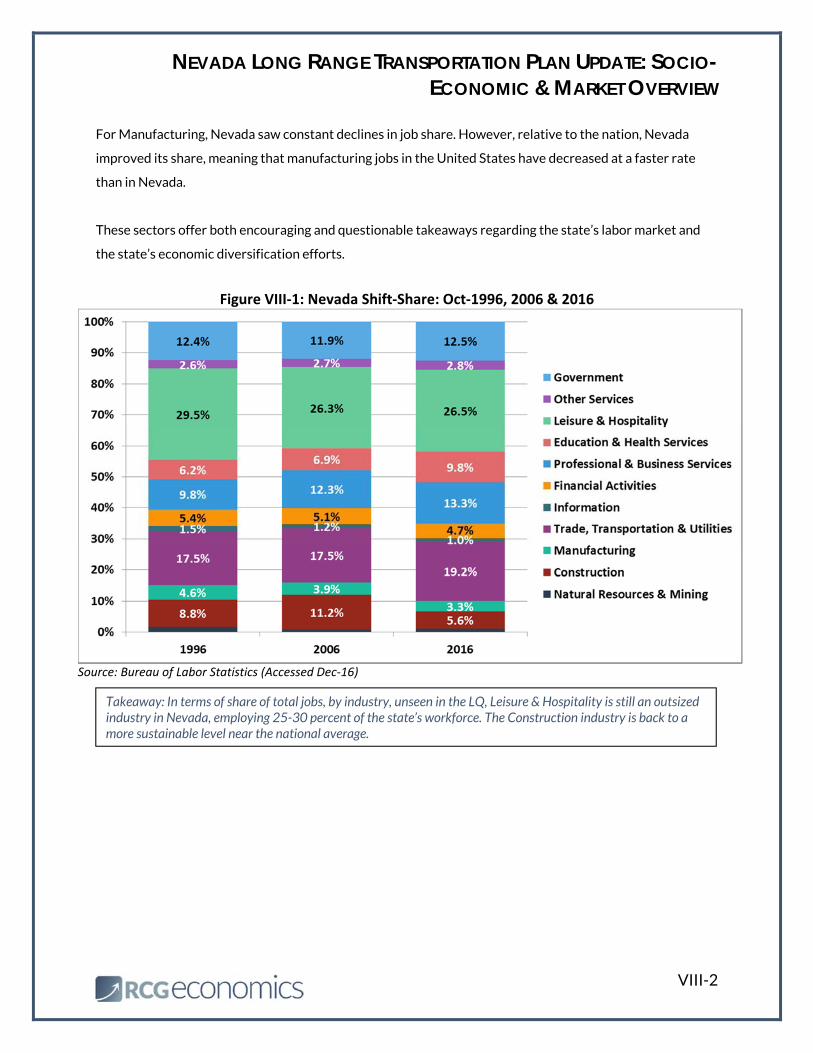
Figure VIII-1 shows the share of jobs in the various industries for the State of Nevada in 1996, 2006 and
2016. A few sectors stand out. For example, there has been a lot of movement in the Leisure & Hospitality
industry. It dropped off significantly as a share of total jobs between 1996 and 2006 from 29.5 percent to
26.3 percent. By 2016, it had ticked up slightly to 26.5 percent. Conversely, Education & Health Services
increased its share over just the last 10 years from 6.9 percent in 2006 to 9.8 percent in 2016. Professional
& Business Services underwent an increase in share between 1996 and 2006, from 9.8 percent to 12.3
percent, and reached 13.3 percent in 2016. Trade, Transportation & Utilities has also seen significant
change in a short time. In both 1996 and 2006, its share of jobs was 17.5 percent, but in the last 10 years
that share jumped to 19.2 percent.
Construction, meanwhile, experienced a large increase during the boom years in Nevada, going from 8.8
percent of jobs in 1996 to 11.2 percent in 2006, but then plummeted to 5.6 percent of jobs by 2016. The
share of manufacturing jobs has also steadily declined in the state from 4.6 percent in 1996 to 3.9 percent in
2006 and down still to 3.3 percent by 2016. Lastly, while Natural Resources & Mining makes up a large share
of jobs in Nevada relative to the rest of the country, it is still just a very small share of total jobs in the state.
Comparing shift-share for the state with the LQ, we can make some observations about job dynamics in
Nevada against the rest of the nation. For example, the shift share of jobs in Nevada in Professional &
Business Services increased by one percentage-point in the last 10 years. However, in that same time, the
LQ for the state in that sector decreased slightly. This suggests that Professional & Business Services is a
fast-growing sector nationwide and that Nevada did not keep up with growth as much as it should have.
In terms of Leisure & Hospitality jobs, the shift-share in Nevada was nearly unchanged. However, the LQ for
this sector in Nevada dropped substantially. This means that Leisure & Hospitality jobs increased
throughout the nation. Tourism and recreation appear to be growing nationwide.
I
NEVADA LONG RANGE TRANSPORTATION PLAN UPDATE: SOCIO-ECONOMIC & MARKET OVERVIEW
VIII-2
For Manufacturing, Nevada saw constant declines in job share. However, relative to the nation, Nevada
improved its share, meaning that manufacturing jobs in the United States have decreased at a faster rate
than in Nevada.
These sectors offer both encouraging and questionable takeaways regarding the state’s labor market and
the state’s economic diversification efforts.
Figure VIII‐1: Nevada Shift‐Share: Oct‐1996, 2006 & 2016
Source: Bureau of Labor Statistics (Accessed Dec‐16)
Takeaway: In terms of share of total jobs, by industry, unseen in the LQ, Leisure & Hospitality is still an outsized industry in Nevada, employing 25-30 percent of the state’s workforce. The Construction industry is back to a more sustainable level near the national average.
NEVADA LONG RANGE TRANSPORTATION PLAN UPDATE: SOCIO-ECONOMIC & MARKET OVERVIEW
VIII-3
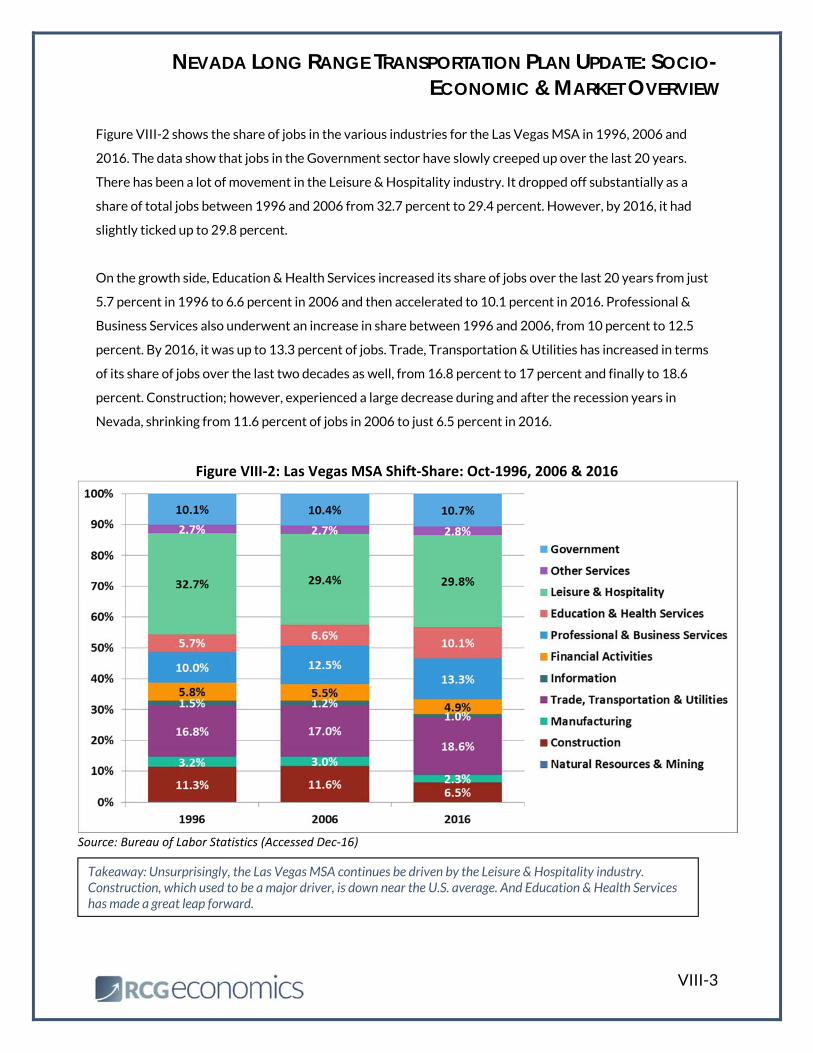
Figure VIII-2 shows the share of jobs in the various industries for the Las Vegas MSA in 1996, 2006 and
2016. The data show that jobs in the Government sector have slowly creeped up over the last 20 years.
There has been a lot of movement in the Leisure & Hospitality industry. It dropped off substantially as a
share of total jobs between 1996 and 2006 from 32.7 percent to 29.4 percent. However, by 2016, it had
slightly ticked up to 29.8 percent.
On the growth side, Education & Health Services increased its share of jobs over the last 20 years from just
5.7 percent in 1996 to 6.6 percent in 2006 and then accelerated to 10.1 percent in 2016. Professional &
Business Services also underwent an increase in share between 1996 and 2006, from 10 percent to 12.5
percent. By 2016, it was up to 13.3 percent of jobs. Trade, Transportation & Utilities has increased in terms
of its share of jobs over the last two decades as well, from 16.8 percent to 17 percent and finally to 18.6
percent. Construction; however, experienced a large decrease during and after the recession years in
Nevada, shrinking from 11.6 percent of jobs in 2006 to just 6.5 percent in 2016.
Figure VIII‐2: Las Vegas MSA Shift‐Share: Oct‐1996, 2006 & 2016
Source: Bureau of Labor Statistics (Accessed Dec‐16)
Takeaway: Unsurprisingly, the Las Vegas MSA continues be driven by the Leisure & Hospitality industry. Construction, which used to be a major driver, is down near the U.S. average. And Education & Health Services has made a great leap forward.
NEVADA LONG RANGE TRANSPORTATION PLAN UPDATE: SOCIO-ECONOMIC & MARKET OVERVIEW
VIII-4
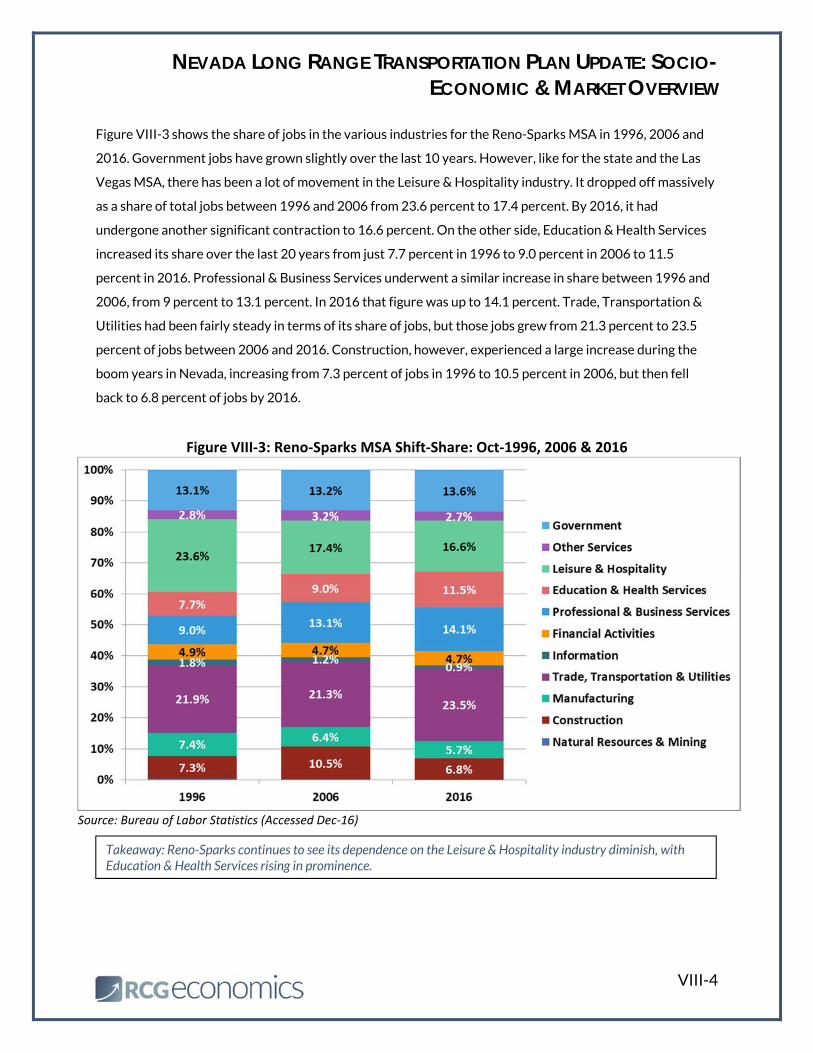
Figure VIII-3 shows the share of jobs in the various industries for the Reno-Sparks MSA in 1996, 2006 and
2016. Government jobs have grown slightly over the last 10 years. However, like for the state and the Las
Vegas MSA, there has been a lot of movement in the Leisure & Hospitality industry. It dropped off massively
as a share of total jobs between 1996 and 2006 from 23.6 percent to 17.4 percent. By 2016, it had
undergone another significant contraction to 16.6 percent. On the other side, Education & Health Services
increased its share over the last 20 years from just 7.7 percent in 1996 to 9.0 percent in 2006 to 11.5
percent in 2016. Professional & Business Services underwent a similar increase in share between 1996 and
2006, from 9 percent to 13.1 percent. In 2016 that figure was up to 14.1 percent. Trade, Transportation &
Utilities had been fairly steady in terms of its share of jobs, but those jobs grew from 21.3 percent to 23.5
percent of jobs between 2006 and 2016. Construction, however, experienced a large increase during the
boom years in Nevada, increasing from 7.3 percent of jobs in 1996 to 10.5 percent in 2006, but then fell
back to 6.8 percent of jobs by 2016.
Figure VIII‐3: Reno‐Sparks MSA Shift‐Share: Oct‐1996, 2006 & 2016
Source: Bureau of Labor Statistics (Accessed Dec‐16)
Takeaway: Reno-Sparks continues to see its dependence on the Leisure & Hospitality industry diminish, with Education & Health Services rising in prominence.
NEVADA LONG RANGE TRANSPORTATION PLAN UPDATE: SOCIO-ECONOMIC & MARKET OVERVIEW
IX-1
IX. Overall Population & Employment Forecast: 2015-35
A. Population Forecast
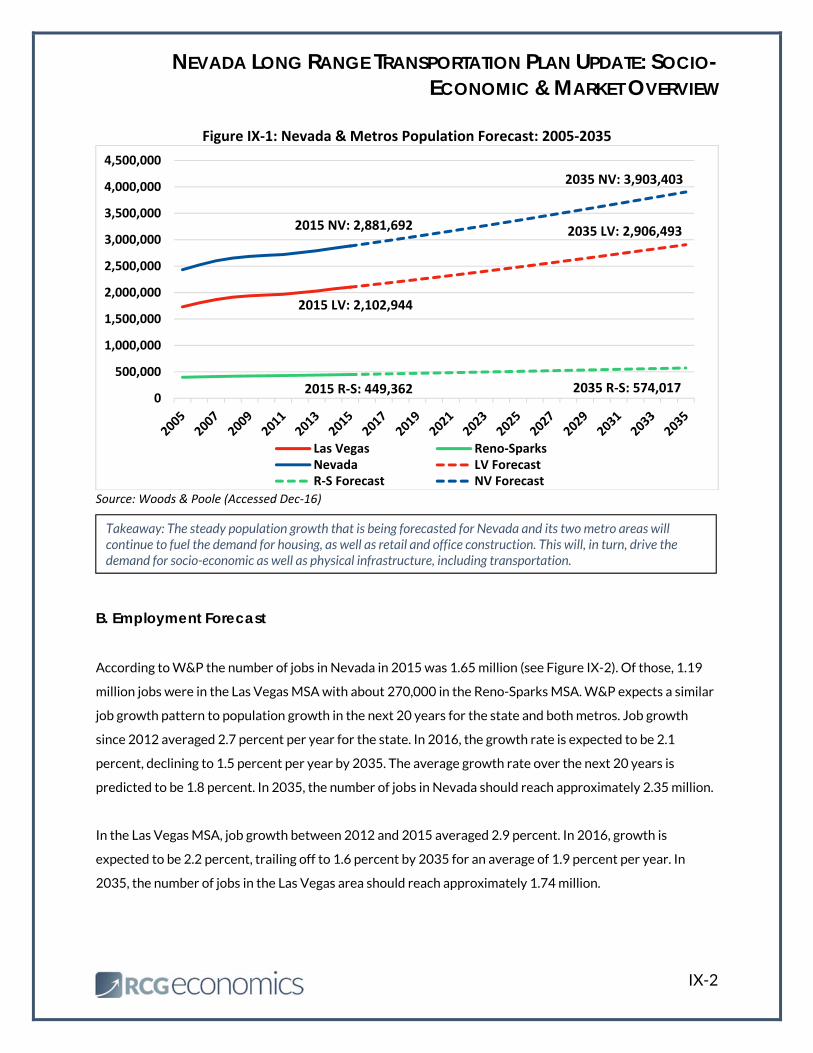
ccording to Woods & Poole (“W&P”)11, the population of Nevada in 2015 was 2.88 million persons (see
Figure IX-1). Of those, 2.10 million lived in the Las Vegas MSA and approximately 449,000 lived in the
Reno-Sparks MSA. These figures match very closely with other sources, such as the U.S. Census Bureau and
the Nevada State Demographer.
W&P projects moderate and slowing growth in the next 20 years for the state and both metros. A
conservative estimate, expected growth should continue at slightly below the current rate of growth and
then taper off. Growth since 2012 averaged 1.5 percent per year for the state. In 2016, the growth rate is
forecasted to be 1.6 percent, then slowly decline to 1.4 percent per year by 2035. We have compared
current and future growth to 2012, because that was the first year when population and employment
growth appeared to have returned to long-term historical rates, rather than still being in recovery from the
Great Recession. The average growth rate over the next 20 years is expected to be 1.5 percent. In 2035, the
population of Nevada should reach approximately 3.9 million.
For the Las Vegas MSA, growth since 2012 has averaged 1.7 percent—slightly greater than the state growth
rate. The same is true of its projection. In 2016, growth is expected to be 1.7 percent and it trails off to 1.5
percent by 2035 for an average of 1.6 percent per year. In 2035, the population of the Las Vegas MSA is
projected to reach approximately 2.91 million.
For the Reno-Sparks MSA, growth since 2012 has averaged only 1.2 percent—less than Nevada’s and Las
Vegas’ growth rates. The W&P projection for Reno-Sparks is also less than for the state and Las Vegas. In
2016, growth is expected to be 1.3 percent, declining to 1.1 percent by 2035 with an average of 1.2 percent
growth per year. In 2035, the population of the Reno area should reach approximately 574,000.
Projections from the Nevada State Demographer show similar trends—that the Las Vegas area will grow at
a faster pace than the Reno area in the next 20 years.
11 Woods & Poole is an economics and demographic data forecasting firm in Washington, D.C. They are widely used in economic analyses by a wide-variety of private and public organizations. http://www.woodsandpoole.com/
A
NEVADA LONG RANGE TRANSPORTATION PLAN UPDATE: SOCIO-ECONOMIC & MARKET OVERVIEW
IX-2
Figure IX‐1: Nevada & Metros Population Forecast: 2005‐2035
Source: Woods & Poole (Accessed Dec‐16)
B. Employment Forecast
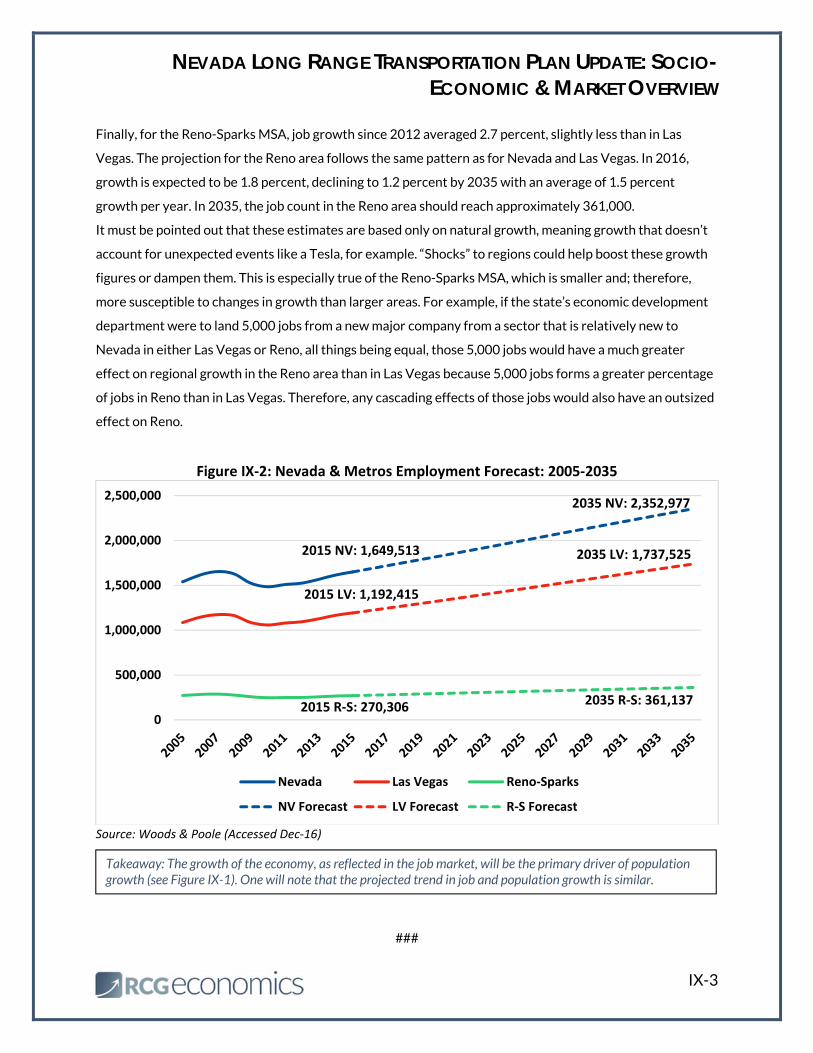
According to W&P the number of jobs in Nevada in 2015 was 1.65 million (see Figure IX-2). Of those, 1.19
million jobs were in the Las Vegas MSA with about 270,000 in the Reno-Sparks MSA. W&P expects a similar
job growth pattern to population growth in the next 20 years for the state and both metros. Job growth
since 2012 averaged 2.7 percent per year for the state. In 2016, the growth rate is expected to be 2.1
percent, declining to 1.5 percent per year by 2035. The average growth rate over the next 20 years is
predicted to be 1.8 percent. In 2035, the number of jobs in Nevada should reach approximately 2.35 million.
In the Las Vegas MSA, job growth between 2012 and 2015 averaged 2.9 percent. In 2016, growth is
expected to be 2.2 percent, trailing off to 1.6 percent by 2035 for an average of 1.9 percent per year. In
2035, the number of jobs in the Las Vegas area should reach approximately 1.74 million.
0
500,000
1,000,000
1,500,000
2,000,000
2,500,000
3,000,000
3,500,000
4,000,000
4,500,000
Las Vegas Reno‐SparksNevada LV ForecastR‐S Forecast NV Forecast
2035 LV: 2,906,493
2035 R‐S: 574,017
2035 NV: 3,903,403
2015 LV: 2,102,944
2015 R‐S: 449,362
2015 NV: 2,881,692
Takeaway: The steady population growth that is being forecasted for Nevada and its two metro areas will continue to fuel the demand for housing, as well as retail and office construction. This will, in turn, drive the demand for socio-economic as well as physical infrastructure, including transportation.
NEVADA LONG RANGE TRANSPORTATION PLAN UPDATE: SOCIO-ECONOMIC & MARKET OVERVIEW
IX-3
Finally, for the Reno-Sparks MSA, job growth since 2012 averaged 2.7 percent, slightly less than in Las
Vegas. The projection for the Reno area follows the same pattern as for Nevada and Las Vegas. In 2016,
growth is expected to be 1.8 percent, declining to 1.2 percent by 2035 with an average of 1.5 percent
growth per year. In 2035, the job count in the Reno area should reach approximately 361,000.
It must be pointed out that these estimates are based only on natural growth, meaning growth that doesn’t
account for unexpected events like a Tesla, for example. “Shocks” to regions could help boost these growth
figures or dampen them. This is especially true of the Reno-Sparks MSA, which is smaller and; therefore,
more susceptible to changes in growth than larger areas. For example, if the state’s economic development
department were to land 5,000 jobs from a new major company from a sector that is relatively new to
Nevada in either Las Vegas or Reno, all things being equal, those 5,000 jobs would have a much greater
effect on regional growth in the Reno area than in Las Vegas because 5,000 jobs forms a greater percentage
of jobs in Reno than in Las Vegas. Therefore, any cascading effects of those jobs would also have an outsized
effect on Reno.
Figure IX‐2: Nevada & Metros Employment Forecast: 2005‐2035
Source: Woods & Poole (Accessed Dec‐16)
###
0
500,000
1,000,000
1,500,000
2,000,000
2,500,000
Nevada Las Vegas Reno‐Sparks
NV Forecast LV Forecast R‐S Forecast
2035 LV: 1,737,525
2035 R‐S: 361,137
2035 NV: 2,352,977
2015 LV: 1,192,415
2015 R‐S: 270,306
2015 NV: 1,649,513
Takeaway: The growth of the economy, as reflected in the job market, will be the primary driver of population growth (see Figure IX-1). One will note that the projected trend in job and population growth is similar.