Embed Size (px)
Citation preview

DRAFT
USE OF SHORE-SIDE POWER FOR
OCEAN-GOING VESSELS
WHITE PAPER
Prepared by
Tetra Tech, Inc.
May 1, 2007

TABLE OF CONTENTS I. INTRODUCTION................................................................................................................................ 1 1. Background.................................................................................................................................. 1 2. Overview of the White Paper....................................................................................................... 3 II. SHORE-POWER OR COLD-IRONING AND HOTELLING ............................................................ 4 1. Shore-power, Alternative Maritime Power (AMPTM) or Cold-Ironing........................................ 5 2. The Use of Ship Auxiliary Engines Versus Shore-Power While Hotelling at the Berth.............. 5 III. PHYSICAL REQUIREMENTS FOR SHORE-POWER ................................................................ 5 1. Shore-Side Electrical and Infrastructure Requirements............................................................... 5 2. Cable Management System ......................................................................................................... 6 3. Ship-Side Electrical System ........................................................................................................ 7 IV. AIR EMISSION REDUCTION BENEFITS ................................................................................... 7 V. SHORE-POWER CASE STUDIES..................................................................................................... 9 1. Princess Cruise............................................................................................................................. 9 2. Port of Los Angeles Alternative Maritime Power (AMPTM).......................................................11 3. Port of Long Beach.................................................................................................................... 13 4. European Experience: Göteborg: Stena and Ro-Ro Ferries in 2000.......................................... 14 VI. FEASIBILITY STUDIES .............................................................................................................. 16 VII. SHORE-POWER CHALLENGES ................................................................................................ 21 1. Legal Challenges ....................................................................................................................... 21 2. Engineering Challenges ............................................................................................................. 22 3. Capital Investment Cost Challenges .......................................................................................... 23 4. Operational Challenges – Cost-Effectiveness............................................................................ 23 5. Other Concerns .......................................................................................................................... 24 VIII. ALTERNATIVES FOR VESSEL HOTELLING EMISSION REDUCTION............................... 25 1. Cleaner Fuel............................................................................................................................... 25 2. Water-Based Fuel Treatment...................................................................................................... 26 3. Clean Engine.............................................................................................................................. 26 4. After Combustion Treatment ..................................................................................................... 27 IX. RECENT DEVELOPMENTS ....................................................................................................... 29 1. Regulatory Development in California...................................................................................... 29 2. International Standards for Shore-Power................................................................................... 30 X. CONCLUSIONS................................................................................................................................ 32
1
This White Paper is not intended to be an endorsement of the use of shore-power. Shore-power
represents one of a number of technologies that can be applied to the reduction of ship emissions and
decision on which technology best applied to a particular location or operation.
This White Paper was prepared by the Harbors, Navigation and Environment Committee of the American Association of Port Authorities (AAPA) to provide members with information on the use of
shore-power or cold-ironing to reduce auxiliary engine emissions of ocean-going vessels while at berth.
More specifically, this White Paper is intended to be a synopsis of available information on the
application of shore power including physical requirements, feasibility and case studies, regulatory requirements, costs, and implementation benefits and issues.
I. INTRODUCTION
1. Background
Recent rapid growth of international trade has resulted in significant increase in ship transport and this trend is expected to continue in the future. According to the AAPA’s statistics1, the container traffic in
North, Central and South America has experienced strong growth from 2000 to 2004 and this growth
trend is expected to continue in the future.
It is expected that with anticipated growth in world trade that the number of container vessels calling ports in the region, i.e., Canada, United States (U.S.), Mexico, Central and South America, will increase
significantly. The U.S. Department of Transportation, Maritime Administration (MARAD) data2
indicates an increase in vessel calls at U.S. ports by tankers (petroleum and chemical), containerships
and liquefied natural gas/liquefied petroleum gas [LNG/LPG] carriers. Of all vessel calls at U.S. ports, greater than 80 percent are foreign-flag vessels. This is
assumed to be the case for other countries in North
America also.
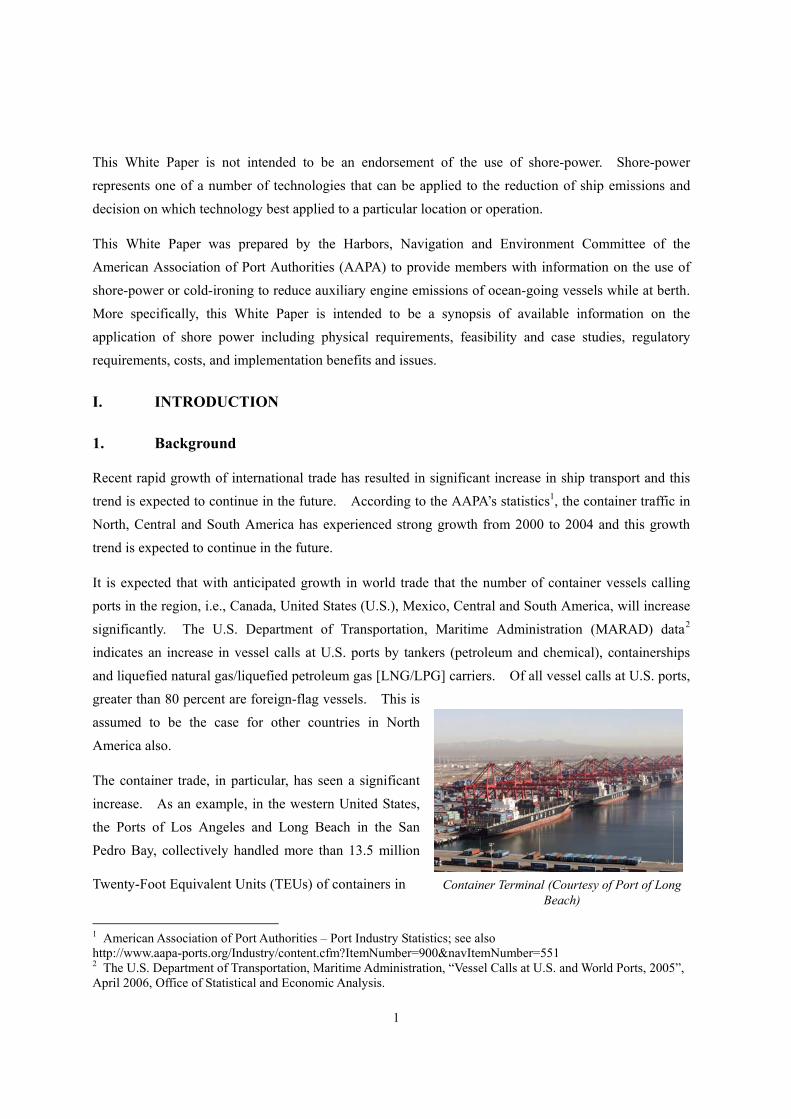
The container trade, in particular, has seen a significant
increase. As an example, in the western United States,
the Ports of Los Angeles and Long Beach in the San
Pedro Bay, collectively handled more than 13.5 million
Twenty-Foot Equivalent Units (TEUs) of containers in
1 American Association of Port Authorities – Port Industry Statistics; see also http://www.aapa-ports.org/Industry/content.cfm?ItemNumber=900&navItemNumber=551 2 The U.S. Department of Transportation, Maritime Administration, “Vessel Calls at U.S. and World Ports, 2005”, April 2006, Office of Statistical and Economic Analysis.
Container Terminal (Courtesy of Port of Long Beach)

2
2006, and this is expected to triple in the next ten to fifteen years.
Additionally, the growth of cruise industry is significant in recent years. The “2006 Overview”3
prepared by the Cruise Lines International Association indicates that from 1980 to 2005 the average worldwide growth rate of cruise industry, in terms of total passenger number, is 7.6%. The cruise
industry’s growth is demonstrated in its expanding guest capacity. Nearly 40 new ships were built in
the 1980s and nearly 80 new ships debuted during the 1990s. Currently, there are a total of
approximately 150 cruise ships in service.
While ocean-going vessels represent a very efficient mode of goods movement, they also are major
sources of air emissions due to lack of emission controls and the quantity and quality of fuel they utilize.
Air emission inventories being carried out at ports have identified ocean-going vessels as a major port source of pollutants such as nitrogen oxides (NOx), sulfur dioxide (SO2) and particulate matter (PM).
These pollutants impact visibility, air quality, and human health. By comparison, emissions of these
pollutants from major stationary sources and on-road mobile sources have been drastically reduced in
many countries in the last two decades by implementing more stringent emission standards, use of clean fuel, and the installation of air pollution control devices. As a result interest has grown world-wide to
find ways to reduce emissions from ocean-going vessels.
U.S. EPA designated the South Coast Air Basin (SCAB) as being in non-attainment of the National Ambient Air Quality Standards for fine particulate matter (PM2.5) and ozone4. Air emissions from
ship’s auxiliary engines directly contribute to local ambient fine particulate concentrations, and
indirectly increase secondary air pollutant concentrations such as ozone and particulate (secondary
aerosol) concentrations in the U.S. This is of special concern in areas of non-attainment for these pollutants.
A number of technologies are emerging as tools in the reduction of emissions from ocean-going vessels.
Some of these include application of new engine technologies (e.g., electronic controls, slide valves),
post combustion treatments (e.g., sea water scrubbing, selective catalytic reduction) and fuel improvements (e.g., low sulfur fuels, fuel emulsion). Use of shore supplied power is a technology
being utilized or considered by a number of ports/operators to reduce the emissions from auxiliary
engines of ocean-going vessels while at-berth.
The potential health impacts of air emissions from port activities have become a major public concern in
3 Cruise Lines International Association, “The 2006 Overview”. See also http://www.cruising.org/press/overview%202006/ind_overview.cfm 4 U.S. EPA, “Fine Particle Designation” and “8-hour Ground Level Ozone Designations. See also: http://www.epa.gov/pmdesignations/regions/region9desig.htm, and http://www.epa.gov/ozonedesignations/regions/region9desig.htm
3
recent years. A recent port-related diesel PM health assessment study5 conducted in California by the ARB showed that emissions from ocean-going vessels auxiliary engines at-berth account for about 20%
of the total diesel PM emissions from the ports. It is estimated that these emissions are responsible for
about 34% of the port emissions related risk in the modeling receptor domain based on the
population-weighted average risk. These emissions represented potential cancer risk levels of greater than 200 in a million in the nearby communities.
In 1998, the California Air Resources Board (ARB) identified diesel exhaust PM as a toxic air
contaminant in 1998, based on its potential adverse effects to human health. Emissions from diesel engines also contribute to California fine PM air quality problem.6
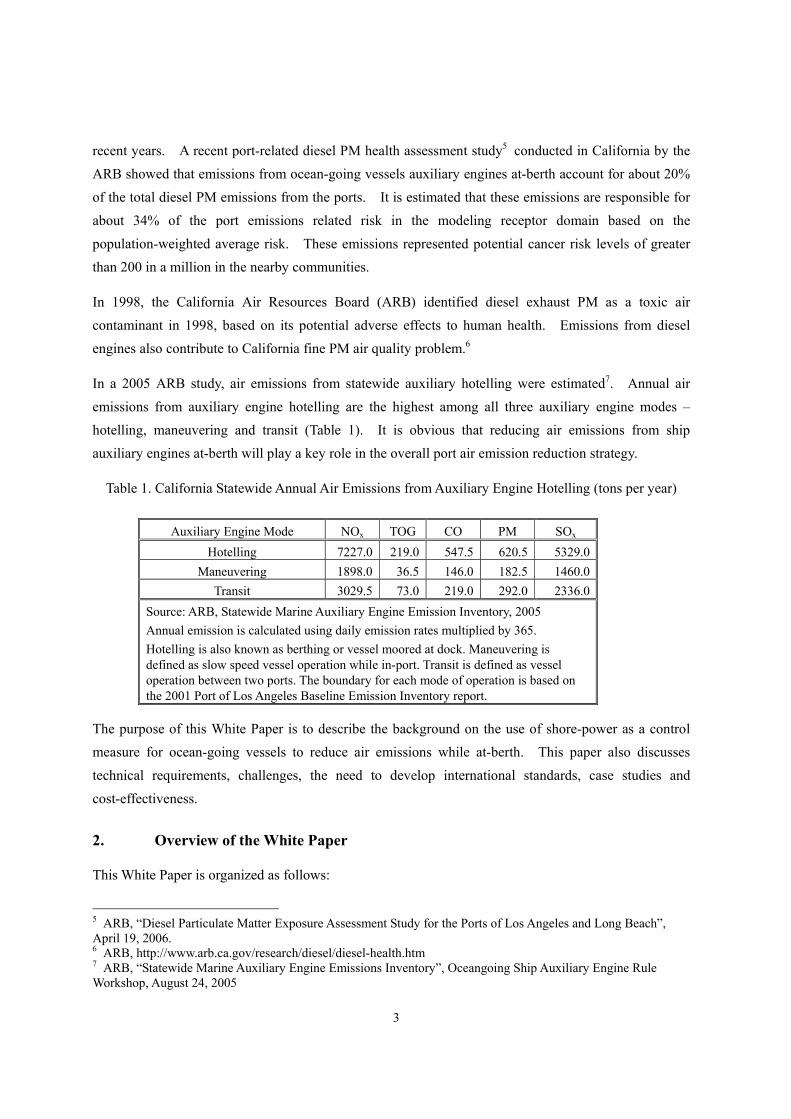
In a 2005 ARB study, air emissions from statewide auxiliary hotelling were estimated7. Annual air
emissions from auxiliary engine hotelling are the highest among all three auxiliary engine modes –
hotelling, maneuvering and transit (Table 1). It is obvious that reducing air emissions from ship auxiliary engines at-berth will play a key role in the overall port air emission reduction strategy.
Table 1. California Statewide Annual Air Emissions from Auxiliary Engine Hotelling (tons per year)
Auxiliary Engine Mode NOx TOG CO PM SOx Hotelling 7227.0 219.0 547.5 620.5 5329.0
Maneuvering 1898.0 36.5 146.0 182.5 1460.0 Transit 3029.5 73.0 219.0 292.0 2336.0
Source: ARB, Statewide Marine Auxiliary Engine Emission Inventory, 2005 Annual emission is calculated using daily emission rates multiplied by 365. Hotelling is also known as berthing or vessel moored at dock. Maneuvering is defined as slow speed vessel operation while in-port. Transit is defined as vessel operation between two ports. The boundary for each mode of operation is based on the 2001 Port of Los Angeles Baseline Emission Inventory report.
The purpose of this White Paper is to describe the background on the use of shore-power as a control measure for ocean-going vessels to reduce air emissions while at-berth. This paper also discusses
technical requirements, challenges, the need to develop international standards, case studies and
cost-effectiveness.
2. Overview of the White Paper
This White Paper is organized as follows:
5 ARB, “Diesel Particulate Matter Exposure Assessment Study for the Ports of Los Angeles and Long Beach”, April 19, 2006. 6 ARB, http://www.arb.ca.gov/research/diesel/diesel-health.htm 7 ARB, “Statewide Marine Auxiliary Engine Emissions Inventory”, Oceangoing Ship Auxiliary Engine Rule Workshop, August 24, 2005
4
INTRODUCTION – Provides background information on marine ship air emissions and shore-power.
SHORE-POWER OR COLD-IRONING AND HOTELLING – Discusses what constitutes shore-power
electrification and the air emissions from the use of auxiliary power while at-berth.
PHYSICAL REQUIREMENTS FOR SHORE-POWER – Provides general information on major components required to operate shore-power – shore-side, cable and on-board systems.
AIR EMISSION REDUCTION BENEFITS – Discusses vessel air emission reduction benefits from
using shore-power versus cleaner fuel.
CASE STUDY – Provides general overview of successful shore-power programs at various ports and
their use by the shipping industry, including both U.S. and European experiences.
FEASIBILITY STUDIES – Provides a summary of feasibility studies conducted by various ports in the U.S., Europe, and China.
COLD-IRONING CHALLENGES – Discusses challenges encountered in the implementation of a
shore-power program, including legal, engineering, investment and operational costs, and other
concerns.
ALTERNATIVES FOR VESSEL HOTELLING EMISSION REDUCTION – Discusses various
alternative technologies for vessel emission reduction including clean fuel, water-based fuel-treatment,
clean engine, after-combustion treatment, and improved operational efficiency.
RECENT DEVELOPMENTS – Discusses regulatory development in California and recent
developments in a shore-power program including the push for international standardization of
shore-power connections.
CONCLUSION – Presents conclusions and additional considerations in implementing shore-power
program.
II. SHORE-POWER OR COLD-IRONING AND HOTELLING
Shore-power or “cold-ironing” enables ships at dock or in dry dock, to use shore-side electricity
(normally from a local power grid through a substation at the port) to power electronic systems
including fuel systems; loading and unloading activities; and to discontinue the use of its auxiliary engines. This switchover of electricity source eliminates air emissions associated with the use of
auxiliary engines and shifts the air emission burden to power generation facilities in the local grid. The
assumption is that electric generation facilities have more diversified energy sources including green
power sources such as solar, hydro-, biomass and wind power, and have better emission controls for NOx,
5
SO2 and PM.
1. Shore-Power, Alternative Maritime Power (AMPTM) or Cold-Ironing
Shore-power or ship electrification, is by simple definition, using electrical power provided by shore-side sources to operate a ship’s critical equipment while a ship is at dock. This practice is also
called “cold-ironing” or Alternative Maritime Power (AMPTM ). The term cold-ironing originated for
ships in dry dock where all on-board combustion sources are shut down, and the vessel is going “cold”.
AMPTM is a term trademarked by the Port of Los Angeles for their applications of shore power.
It should be noted that the term “shore-power” is used throughout this document to represent AMPTM,
cold-ironing and ship electrification.
2. The Use of Ship Auxiliary Engines Versus Shore-Power While Hotelling at Berth
Shore-power is only used when a ship is at berth or “hotelling”. When a ship is hotelling, the main
propulsion engine is turned off while the auxiliary engines and boilers continue to operate. Electricity produced by the auxiliary engines along with steam from boilers are required to operate critical
equipment such as fuel heating, lighting, ventilation, refrigeration, pumps, communications and other
critical on-board equipment, to maintain essential function and safety of the ship. Depending on the
type and size of cargo and ship, hotelling time can range from several hours to several days. It should be noted that the use of shore-power does not completely eliminate the air emissions because steam
generated by the on-board boiler is still needed for ship’s operation at berth. Air emissions are
generated from operation of the on-board boiler. However, the use of shore-side power does eliminate
the need to run the auxiliary engines and eliminates air emissions associated with the burning of marine fuels at berth. The actual emissions reduced depend on the type of engine and engine technology, and
the type of fuel that is being burned.
III. PHYSICAL REQUIREMENTS FOR SHORE-POWER
A shore-power system for ocean-going vessels while hotelling consists of three basic components: (a)
shore-side electrical system and infrastructure; (b) cable management system; and (c) ship-side electrical
system.
1. Shore-Side Electrical and Infrastructure Requirements
A land-based power source, transmission system, and related infrastructure are required to provide electricity to a hotelling marine ship. The shore-side electrical and infrastructure requirements include
an industrial substation to receive power transmitted from the local grid, normally at 34.5 kV (kilovolts);
a transformer to bring the voltage down to be compatible with the ship’s electrical specifications (i.e.,
6
6.6 kV or 11.0 kV 3-phase, 60 hertz [Hz]) The capacity for container ship shore-power connection is 7.5 MVA and for the cruise ship is 15 MVA per ship; and on-shore infrastructure included but not limited
to distribution swtichgear, circuit breakers, safety grounding, underground cable conduits, electrical
vaults, and power and communications receptacles and plugs. For an existing berth, modification will
be required for the installation of shore-power cables and accessories. For the construction of a new berth, technical requirements, and specifications of shore-side electrical and infrastructure will be
included during the design phase.
The major capital investment for shore-power is the on-shore power supply system. Although actual capital cost is site-specific, the average estimate of the infrastructure modification is expected to be in
the range of three to ten million dollars per terminal. In addition, the extra load of shore-power
electrification to the local grid should be taken into consideration in the planning of shore-side
infrastructure modifications or improvements. Table 2 summarizes average power requirements for various types of marine vessels at berth.
Table 2. Comparison of Power Requirements for Various Types of Marine Vessels at Berth Type of Marine Vessels Average Power Requirement at Berth
Container Ships 1-4 MWe Cruise Ships 7 MWe
Reefers 2 MWe Ro-Ros 700 kWe Tankers 5-6 MW
Bulk/Cargo Ships 300 kWe-1 MWe
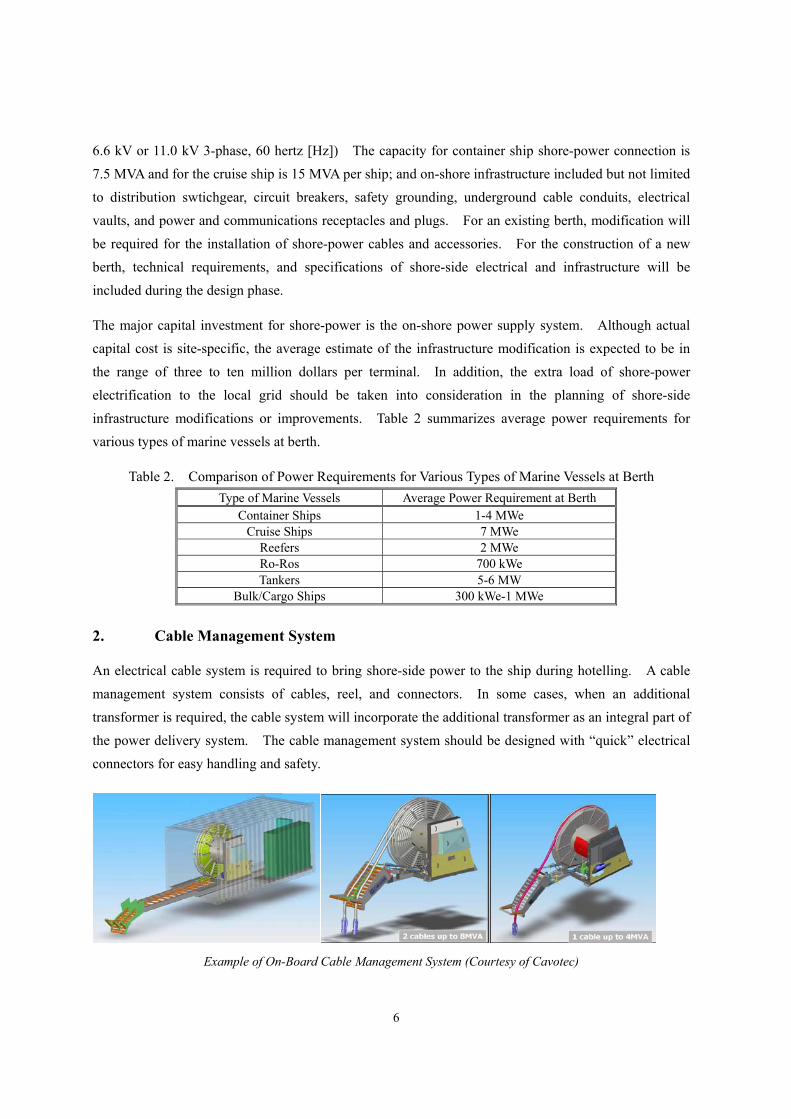
2. Cable Management System
An electrical cable system is required to bring shore-side power to the ship during hotelling. A cable
management system consists of cables, reel, and connectors. In some cases, when an additional
transformer is required, the cable system will incorporate the additional transformer as an integral part of
the power delivery system. The cable management system should be designed with “quick” electrical connectors for easy handling and safety.
Example of On-Board Cable Management System (Courtesy of Cavotec)

7
Normally, these cables are reeled in when not in use and are stored either aboard the ship or at the dock,
or, on a barge such as the one used at the China Shipping Terminal at the Port of Los Angeles8. Some
newer ships have a shore-power system installed, with or without a transformer depending on the ship’s on-board electrical requirements. There are over 100 ships already built or retrofitted to accommodate
the cable management system on-board. Normal and desired condition for the 6.6 kV ships is to have
the cable management system on-board the vessel. Additionally, some 400 V ship users are
considering installing the cable management system including the transformer in a container on board the vessel. The Port of Los Angeles’ standard available voltage at the dock with shore-power capability
is 6.6 kV, 3-phase; 440 V is not available, and 11 kV is available only for the cruise ship terminals.
3. Ship-Side Electrical System
Ships participating in a shore-power electrification program will require the installation of shore-power
cable receptacles and an associated electrical management system. For ships already in service without
shore-power capabilities, retrofitting of the current system is necessary. In-service retrofit of the existing on-board electrical system is possible. For newbuilds, the ship owner can request an on-board
shore-power ready system be included as part of the ship’s electrical system design.
An on-board shore-power system consists of receptacle
panels, voltage switching board, circuit breakers, and control and monitoring system. Depending on the
frequency and voltage of a shore-power supply and a
ship’s electrical systems, a second transformer to bring
voltage further down from the shore-side power system and/or an electrical frequency (i.e., 50 Hz vs. 60 Hz)
converter may be needed.
Power switchover can be performed either by manually switching from on-board power to shore-power, or it can
be achieved by a computerized, automatic synchronization and power transfer system.
IV. AIR EMISSION REDUCTION BENEFITS
As presented earlier, both shore-power and alternative control technologies can reduce air emissions
related to ocean-going vessel hotelling in port. Although many alternative control technologies are
8 Port of Los Angeles, 2006, “Alternative Maritime Power at the Port of Los Angeles – A Technical Guidance Document.”
On-board Cable Connection (Courtesy of China Shipping)
8
available, their effectiveness of emission control for marine vessel application is yet to be proven. The following discussion uses cleaner fuels (i.e., lower sulfur content) versus shore-power as an example to
demonstrate effective air emission reduction by using shore-power.
Using the Port of Los Angeles 2005 port-wide auxiliary engine hotelling emissions for all ocean-going vessels and a 2005 low sulfur marine fuel survey study9, air emission reductions by using cleaner fuels
and shore-power are: • An approximately 10% reduction for NOx; 18%-65% for PM10 and 45-96% for SO2,
depending on types of low sulfur fuel used • Almost no hotelling air emissions when a ship uses shore-power (assuming only 95% of
hotelling time uses shore-power, therefore, 95% reduction efficiency for all air pollutants is used for the comparison).
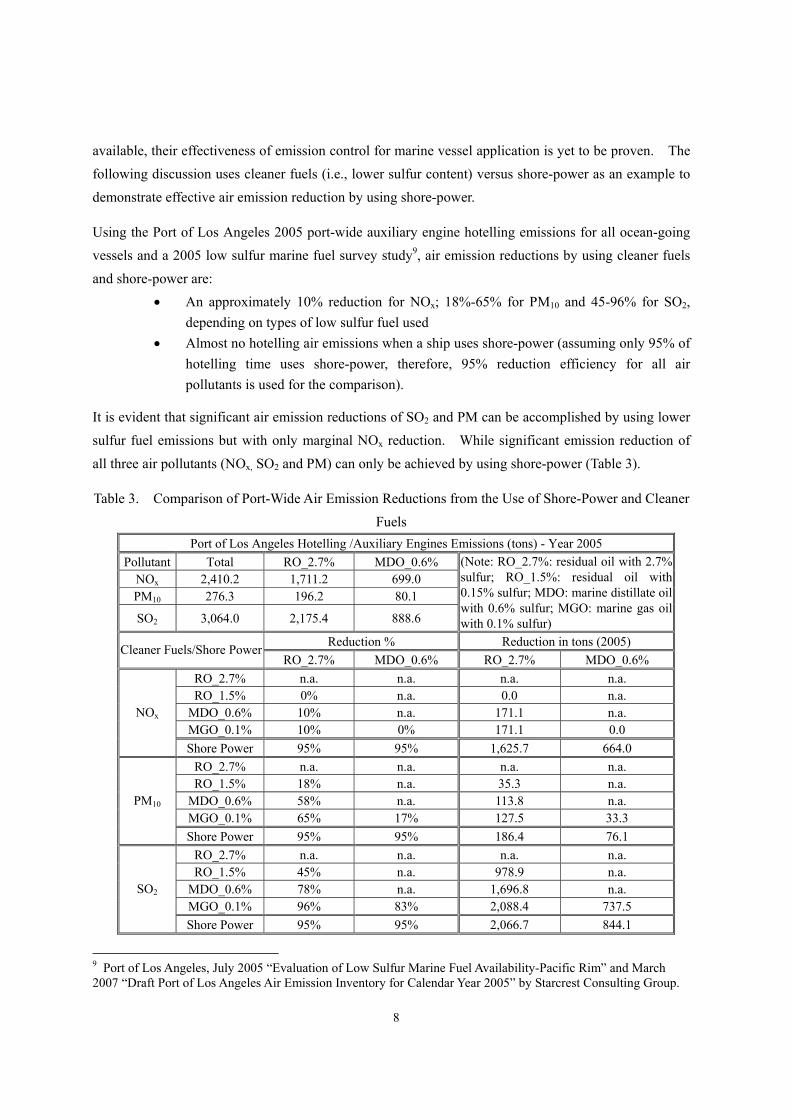
It is evident that significant air emission reductions of SO2 and PM can be accomplished by using lower
sulfur fuel emissions but with only marginal NOx reduction. While significant emission reduction of
all three air pollutants (NOx, SO2 and PM) can only be achieved by using shore-power (Table 3).
Table 3. Comparison of Port-Wide Air Emission Reductions from the Use of Shore-Power and Cleaner
Fuels Port of Los Angeles Hotelling /Auxiliary Engines Emissions (tons) - Year 2005
Pollutant Total RO_2.7% MDO_0.6% NOx 2,410.2 1,711.2 699.0 PM10 276.3 196.2 80.1
SO2 3,064.0 2,175.4 888.6
(Note: RO_2.7%: residual oil with 2.7% sulfur; RO_1.5%: residual oil with 0.15% sulfur; MDO: marine distillate oil with 0.6% sulfur; MGO: marine gas oil with 0.1% sulfur)
Reduction % Reduction in tons (2005) Cleaner Fuels/Shore Power RO_2.7% MDO_0.6% RO_2.7% MDO_0.6%
RO_2.7% n.a. n.a. n.a. n.a. RO_1.5% 0% n.a. 0.0 n.a.
MDO_0.6% 10% n.a. 171.1 n.a. MGO_0.1% 10% 0% 171.1 0.0
NOx
Shore Power 95% 95% 1,625.7 664.0 RO_2.7% n.a. n.a. n.a. n.a. RO_1.5% 18% n.a. 35.3 n.a.
MDO_0.6% 58% n.a. 113.8 n.a. MGO_0.1% 65% 17% 127.5 33.3
PM10
Shore Power 95% 95% 186.4 76.1 RO_2.7% n.a. n.a. n.a. n.a. RO_1.5% 45% n.a. 978.9 n.a.
MDO_0.6% 78% n.a. 1,696.8 n.a. MGO_0.1% 96% 83% 2,088.4 737.5
SO2
Shore Power 95% 95% 2,066.7 844.1
9 Port of Los Angeles, July 2005 “Evaluation of Low Sulfur Marine Fuel Availability-Pacific Rim” and March 2007 “Draft Port of Los Angeles Air Emission Inventory for Calendar Year 2005” by Starcrest Consulting Group.
9
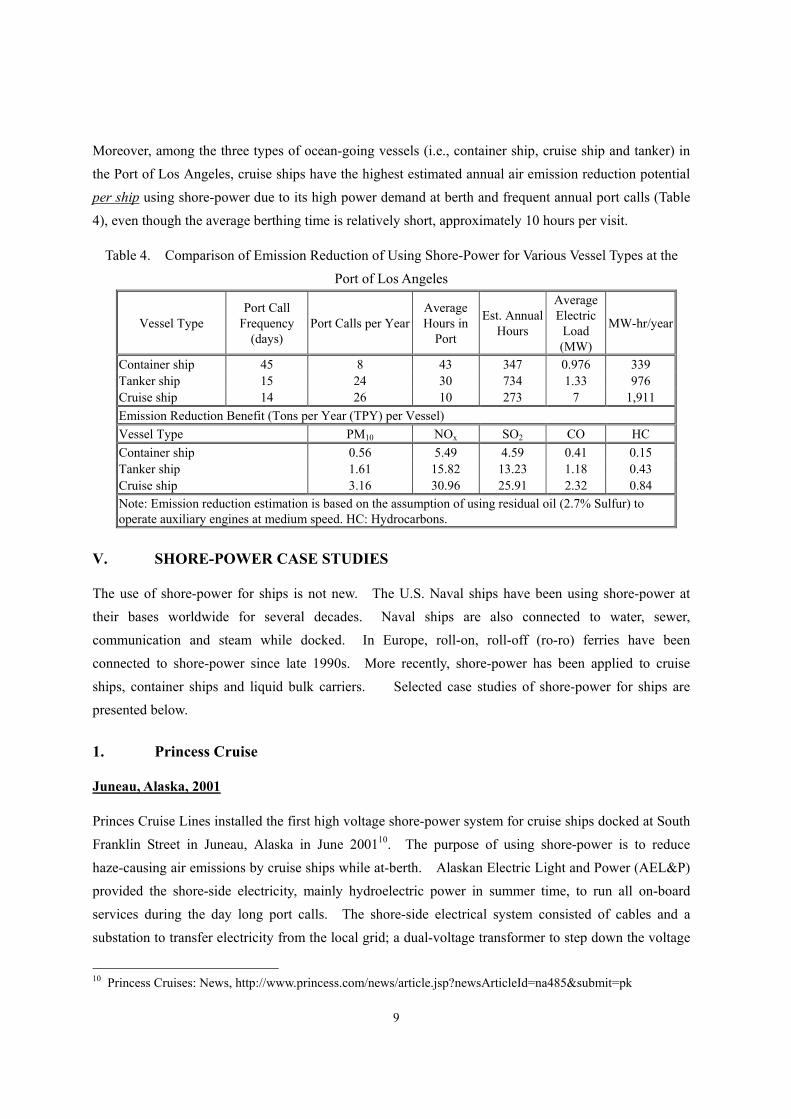
Moreover, among the three types of ocean-going vessels (i.e., container ship, cruise ship and tanker) in the Port of Los Angeles, cruise ships have the highest estimated annual air emission reduction potential
per ship using shore-power due to its high power demand at berth and frequent annual port calls (Table
4), even though the average berthing time is relatively short, approximately 10 hours per visit.
Table 4. Comparison of Emission Reduction of Using Shore-Power for Various Vessel Types at the
Port of Los Angeles
Vessel Type Port Call
Frequency (days)
Port Calls per YearAverage Hours in
Port
Est. Annual Hours
Average Electric
Load (MW)
MW-hr/year
Container ship 45 8 43 347 0.976 339 Tanker ship 15 24 30 734 1.33 976 Cruise ship 14 26 10 273 7 1,911 Emission Reduction Benefit (Tons per Year (TPY) per Vessel) Vessel Type PM10 NOx SO2 CO HC Container ship 0.56 5.49 4.59 0.41 0.15 Tanker ship 1.61 15.82 13.23 1.18 0.43 Cruise ship 3.16 30.96 25.91 2.32 0.84 Note: Emission reduction estimation is based on the assumption of using residual oil (2.7% Sulfur) to operate auxiliary engines at medium speed. HC: Hydrocarbons.
V. SHORE-POWER CASE STUDIES
The use of shore-power for ships is not new. The U.S. Naval ships have been using shore-power at their bases worldwide for several decades. Naval ships are also connected to water, sewer,
communication and steam while docked. In Europe, roll-on, roll-off (ro-ro) ferries have been
connected to shore-power since late 1990s. More recently, shore-power has been applied to cruise
ships, container ships and liquid bulk carriers. Selected case studies of shore-power for ships are presented below.
1. Princess Cruise
Juneau, Alaska, 2001
Princes Cruise Lines installed the first high voltage shore-power system for cruise ships docked at South
Franklin Street in Juneau, Alaska in June 200110. The purpose of using shore-power is to reduce
haze-causing air emissions by cruise ships while at-berth. Alaskan Electric Light and Power (AEL&P) provided the shore-side electricity, mainly hydroelectric power in summer time, to run all on-board
services during the day long port calls. The shore-side electrical system consisted of cables and a
substation to transfer electricity from the local grid; a dual-voltage transformer to step down the voltage
10 Princess Cruises: News, http://www.princess.com/news/article.jsp?newsArticleId=na485&submit=pk
10
from local power grid to 6.6 kV or 11 kV to accommodate different classes of ships; and, a specially designed dock-side gantry cable system for connection to accommodate 20 feet of tidal fluctuations.
Four, 3½-inch cables were used for electrical connection. In addition, the on-board steam boiler was
turned off and was connected to land-side steam provided by an electric boiler. Currently, there are
seven of nine cruise ships equipped with shore-power connection capabilities.
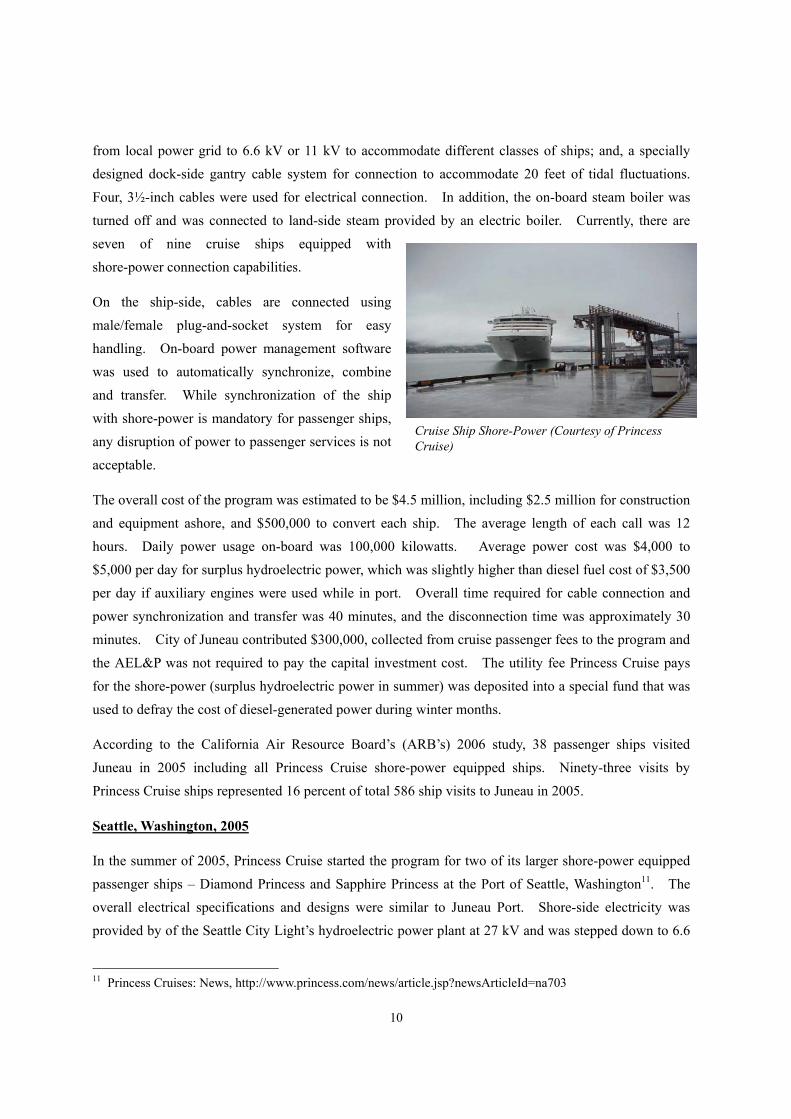
On the ship-side, cables are connected using
male/female plug-and-socket system for easy handling. On-board power management software
was used to automatically synchronize, combine
and transfer. While synchronization of the ship
with shore-power is mandatory for passenger ships, any disruption of power to passenger services is not
acceptable.
The overall cost of the program was estimated to be $4.5 million, including $2.5 million for construction
and equipment ashore, and $500,000 to convert each ship. The average length of each call was 12 hours. Daily power usage on-board was 100,000 kilowatts. Average power cost was $4,000 to
$5,000 per day for surplus hydroelectric power, which was slightly higher than diesel fuel cost of $3,500
per day if auxiliary engines were used while in port. Overall time required for cable connection and
power synchronization and transfer was 40 minutes, and the disconnection time was approximately 30 minutes. City of Juneau contributed $300,000, collected from cruise passenger fees to the program and
the AEL&P was not required to pay the capital investment cost. The utility fee Princess Cruise pays
for the shore-power (surplus hydroelectric power in summer) was deposited into a special fund that was
used to defray the cost of diesel-generated power during winter months.
According to the California Air Resource Board’s (ARB’s) 2006 study, 38 passenger ships visited
Juneau in 2005 including all Princess Cruise shore-power equipped ships. Ninety-three visits by
Princess Cruise ships represented 16 percent of total 586 ship visits to Juneau in 2005.
Seattle, Washington, 2005
In the summer of 2005, Princess Cruise started the program for two of its larger shore-power equipped
passenger ships – Diamond Princess and Sapphire Princess at the Port of Seattle, Washington11. The overall electrical specifications and designs were similar to Juneau Port. Shore-side electricity was
provided by of the Seattle City Light’s hydroelectric power plant at 27 kV and was stepped down to 6.6
11 Princess Cruises: News, http://www.princess.com/news/article.jsp?newsArticleId=na703
Cruise Ship Shore-Power (Courtesy of Princess Cruise)
11
kV and 11 kV by a dual voltage transformer. Shore-side cables were stored within a cable trench at the edge of the wharf. When a ship was at dock, cables were hoisted to the ship-side and connected to the
on-board electrical receptacle and outlets at the wharf.
According to the ARB’s 2006 study, 193 ship visits by 13 vessels were scheduled. Forty of these ship visits or 21 percent will be made by the two smaller Princess Cruise shore-power equipped ships –
Dawn Princess and Sun Princess.
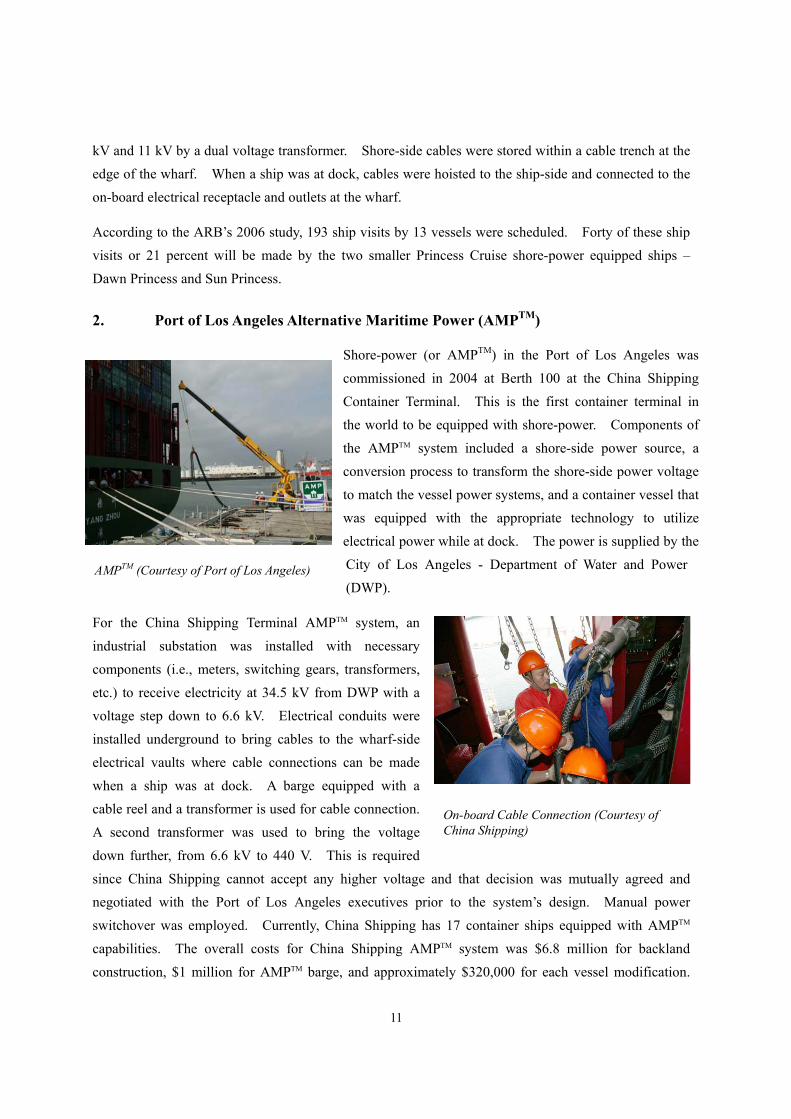
2. Port of Los Angeles Alternative Maritime Power (AMPTM)
Shore-power (or AMPTM) in the Port of Los Angeles was
commissioned in 2004 at Berth 100 at the China Shipping
Container Terminal. This is the first container terminal in the world to be equipped with shore-power. Components of
the AMPTM system included a shore-side power source, a
conversion process to transform the shore-side power voltage
to match the vessel power systems, and a container vessel that was equipped with the appropriate technology to utilize
electrical power while at dock. The power is supplied by the
City of Los Angeles - Department of Water and Power
(DWP).
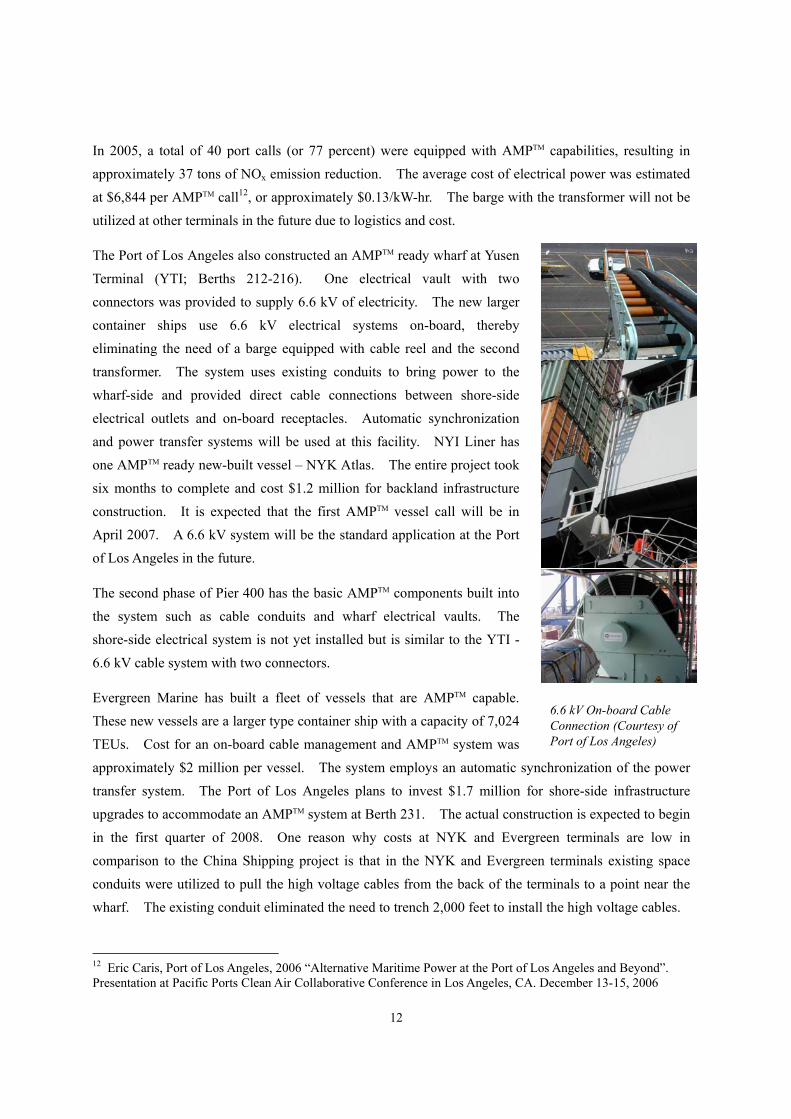
For the China Shipping Terminal AMPTM system, an
industrial substation was installed with necessary
components (i.e., meters, switching gears, transformers,
etc.) to receive electricity at 34.5 kV from DWP with a voltage step down to 6.6 kV. Electrical conduits were
installed underground to bring cables to the wharf-side
electrical vaults where cable connections can be made
when a ship was at dock. A barge equipped with a cable reel and a transformer is used for cable connection.
A second transformer was used to bring the voltage
down further, from 6.6 kV to 440 V. This is required
since China Shipping cannot accept any higher voltage and that decision was mutually agreed and negotiated with the Port of Los Angeles executives prior to the system’s design. Manual power
switchover was employed. Currently, China Shipping has 17 container ships equipped with AMPTM
capabilities. The overall costs for China Shipping AMPTM system was $6.8 million for backland
construction, $1 million for AMPTM barge, and approximately $320,000 for each vessel modification.
On-board Cable Connection (Courtesy of China Shipping)
AMPTM (Courtesy of Port of Los Angeles)
12
In 2005, a total of 40 port calls (or 77 percent) were equipped with AMPTM capabilities, resulting in approximately 37 tons of NOx emission reduction. The average cost of electrical power was estimated
at $6,844 per AMPTM call12, or approximately $0.13/kW-hr. The barge with the transformer will not be
utilized at other terminals in the future due to logistics and cost.
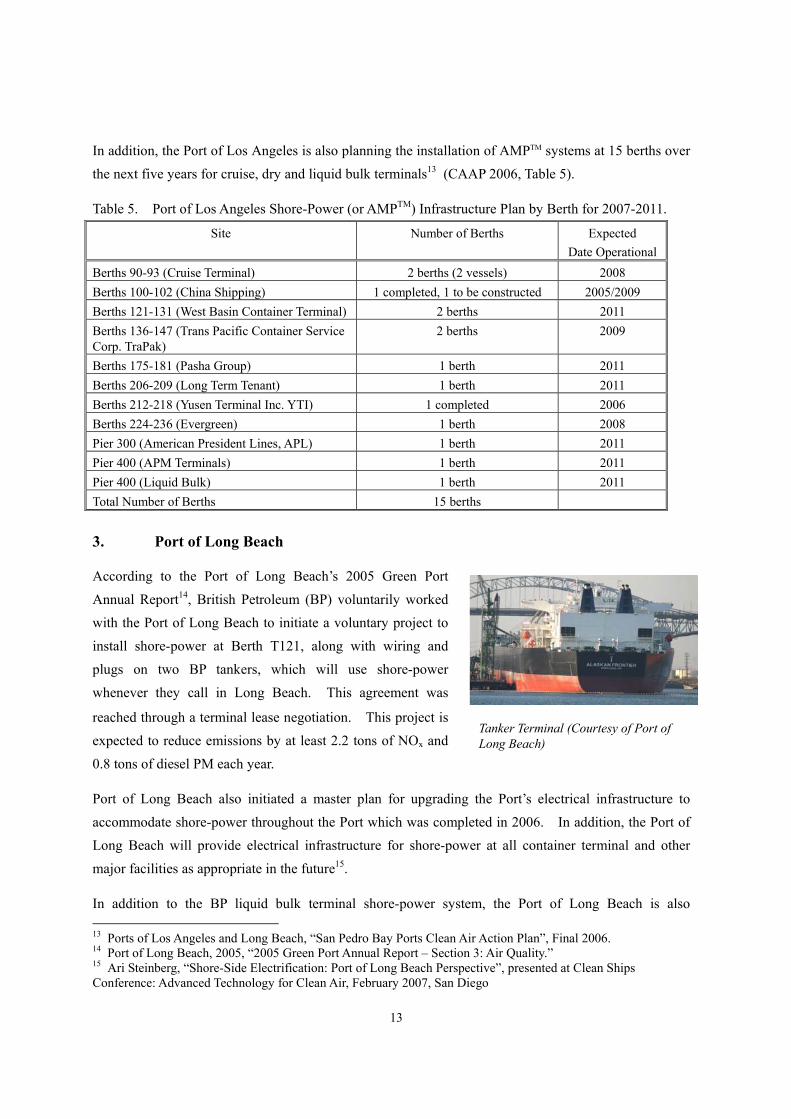
The Port of Los Angeles also constructed an AMPTM ready wharf at Yusen
Terminal (YTI; Berths 212-216). One electrical vault with two
connectors was provided to supply 6.6 kV of electricity. The new larger
container ships use 6.6 kV electrical systems on-board, thereby eliminating the need of a barge equipped with cable reel and the second
transformer. The system uses existing conduits to bring power to the
wharf-side and provided direct cable connections between shore-side
electrical outlets and on-board receptacles. Automatic synchronization and power transfer systems will be used at this facility. NYI Liner has
one AMPTM ready new-built vessel – NYK Atlas. The entire project took
six months to complete and cost $1.2 million for backland infrastructure
construction. It is expected that the first AMPTM vessel call will be in April 2007. A 6.6 kV system will be the standard application at the Port
of Los Angeles in the future.
The second phase of Pier 400 has the basic AMPTM components built into
the system such as cable conduits and wharf electrical vaults. The shore-side electrical system is not yet installed but is similar to the YTI -
6.6 kV cable system with two connectors.
Evergreen Marine has built a fleet of vessels that are AMPTM capable. These new vessels are a larger type container ship with a capacity of 7,024
TEUs. Cost for an on-board cable management and AMPTM system was
approximately $2 million per vessel. The system employs an automatic synchronization of the power
transfer system. The Port of Los Angeles plans to invest $1.7 million for shore-side infrastructure upgrades to accommodate an AMPTM system at Berth 231. The actual construction is expected to begin
in the first quarter of 2008. One reason why costs at NYK and Evergreen terminals are low in
comparison to the China Shipping project is that in the NYK and Evergreen terminals existing space
conduits were utilized to pull the high voltage cables from the back of the terminals to a point near the wharf. The existing conduit eliminated the need to trench 2,000 feet to install the high voltage cables.
12 Eric Caris, Port of Los Angeles, 2006 “Alternative Maritime Power at the Port of Los Angeles and Beyond”. Presentation at Pacific Ports Clean Air Collaborative Conference in Los Angeles, CA. December 13-15, 2006
6.6 kV On-board Cable Connection (Courtesy of Port of Los Angeles)
13
In addition, the Port of Los Angeles is also planning the installation of AMPTM systems at 15 berths over the next five years for cruise, dry and liquid bulk terminals13 (CAAP 2006, Table 5).
Table 5. Port of Los Angeles Shore-Power (or AMPTM) Infrastructure Plan by Berth for 2007-2011.
Site Number of Berths Expected Date Operational
Berths 90-93 (Cruise Terminal) 2 berths (2 vessels) 2008 Berths 100-102 (China Shipping) 1 completed, 1 to be constructed 2005/2009 Berths 121-131 (West Basin Container Terminal) 2 berths 2011 Berths 136-147 (Trans Pacific Container Service Corp. TraPak)
2 berths 2009
Berths 175-181 (Pasha Group) 1 berth 2011 Berths 206-209 (Long Term Tenant) 1 berth 2011 Berths 212-218 (Yusen Terminal Inc. YTI) 1 completed 2006 Berths 224-236 (Evergreen) 1 berth 2008 Pier 300 (American President Lines, APL) 1 berth 2011 Pier 400 (APM Terminals) 1 berth 2011 Pier 400 (Liquid Bulk) 1 berth 2011 Total Number of Berths 15 berths
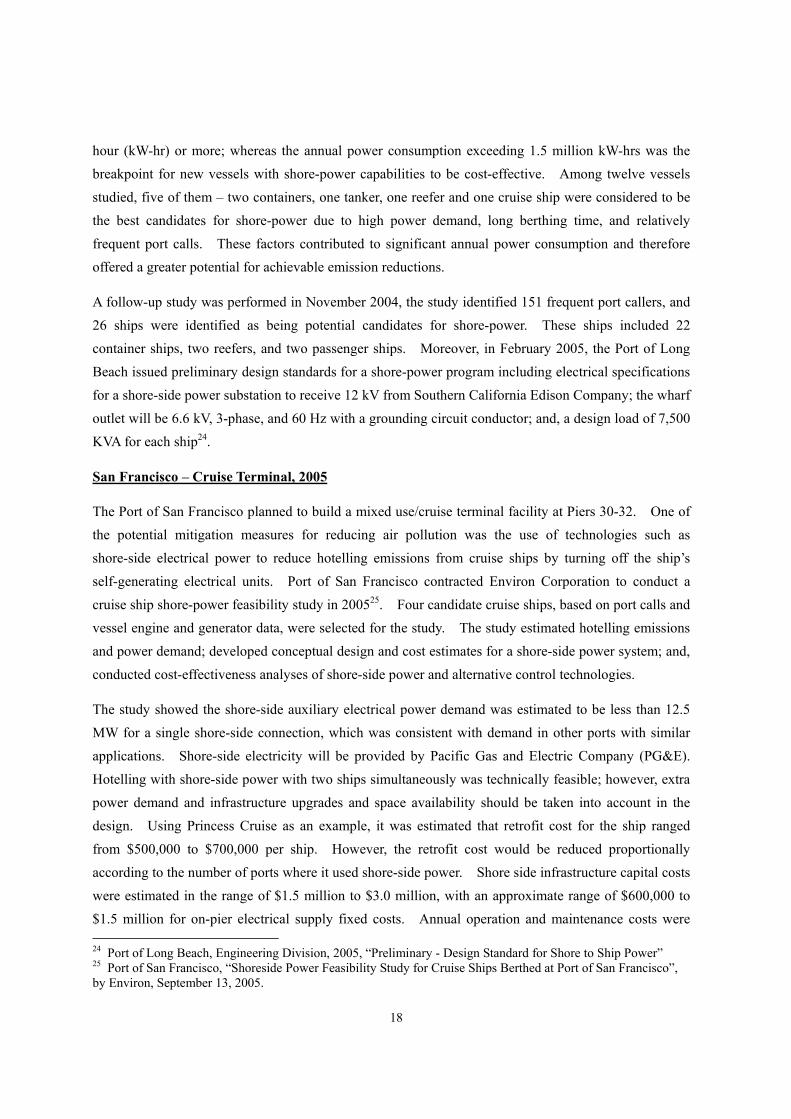
3. Port of Long Beach
According to the Port of Long Beach’s 2005 Green Port
Annual Report14, British Petroleum (BP) voluntarily worked with the Port of Long Beach to initiate a voluntary project to
install shore-power at Berth T121, along with wiring and
plugs on two BP tankers, which will use shore-power
whenever they call in Long Beach. This agreement was
reached through a terminal lease negotiation. This project is
expected to reduce emissions by at least 2.2 tons of NOx and 0.8 tons of diesel PM each year.
Port of Long Beach also initiated a master plan for upgrading the Port’s electrical infrastructure to
accommodate shore-power throughout the Port which was completed in 2006. In addition, the Port of Long Beach will provide electrical infrastructure for shore-power at all container terminal and other
major facilities as appropriate in the future15.
In addition to the BP liquid bulk terminal shore-power system, the Port of Long Beach is also 13 Ports of Los Angeles and Long Beach, “San Pedro Bay Ports Clean Air Action Plan”, Final 2006. 14 Port of Long Beach, 2005, “2005 Green Port Annual Report – Section 3: Air Quality.” 15 Ari Steinberg, “Shore-Side Electrification: Port of Long Beach Perspective”, presented at Clean Ships Conference: Advanced Technology for Clean Air, February 2007, San Diego
Tanker Terminal (Courtesy of Port of Long Beach)

14
considering the installation of nine container berths with shore power over the next five years. Moreover, the Port will be undergoing a massive electrical infrastructure improvement program to
construct an additional 6.6 kV sub-transmission line to serve the Harbor District, and complete
infrastructure improvements for the remaining container terminals, electric dredge plug-ins. (CAAP
2006, Table 6). The Port is committed to provide shore-power infrastructure at one crude oil and all container terminals within the next ten years.
Table 6. Port of Long Beach Shore-Power Infrastructure Plan for 2007-2016.
Site Number of Berths Expected Date Operational
Pier C (Matson) 2 berths 2011 Piers D, E, F (Middle Harbor) 1 berth 2011 Pier G (ITS) 3 berths 2011 Pier S 3 berths 2011 Pier T, Berth T121 (BP) 1 berth 4th Quarter of
2007 Total Number of Berths 10 berths Pier A (SSA) 1 berth 2011-2016 Pier H (Carnival) 1 berth 2011-2016
Pier J (SSA) 1 berth 2011-2016
Navy Mole (Sea-Launch) 2 berths 2011-2016
Pier T (TTI) 1 berth 2011-2016 Total Number of Berths 6 berths Source: San Pedro Bay Ports Clean Air Action Plan, 2006
In addition to the Berth T121 BP shore-power project, the Port of Long Beach is currently undertaking a
study to demonstrate the use of the Advanced Cleanup Technologies Inc.’s (ATCI) Advanced Maritime
Emission Control System (AMECS) at a bulk facility as an emission control alternative for
non-containership ocean-going vessels at-berth and for terminals that are not suited for shore-power infrastructure construction16.
4. European Experience: Göteborg: Stena and Ro-Ro Ferries in 2000
Shore-power for ships has been implemented in Europe since 2000. However, shore-power
applications were concentrated on ro-ro (roll-on/roll-off) ferries that carry passengers and vehicles.
One key difference in shore-power among container ships, cargo ships, cruise lines and ro-ro ferries is
the power demand at dock. Container and cargo ships require power, ranging from 1 to 4 mega watts (MW), for loading and unloading goods and operating other critical equipment. Cruise ships require
16 Port of Long Beach, “Port of Long Beach: Southeast Basin Vessel Emission Control Project” prepared by Environ Corporation. August 2006
15
much higher power demand, averaging at 7 MW, to provide passenger comfort. A ro-ro ferry require less power, ranging from 1 to 1.5 MW while at dock.
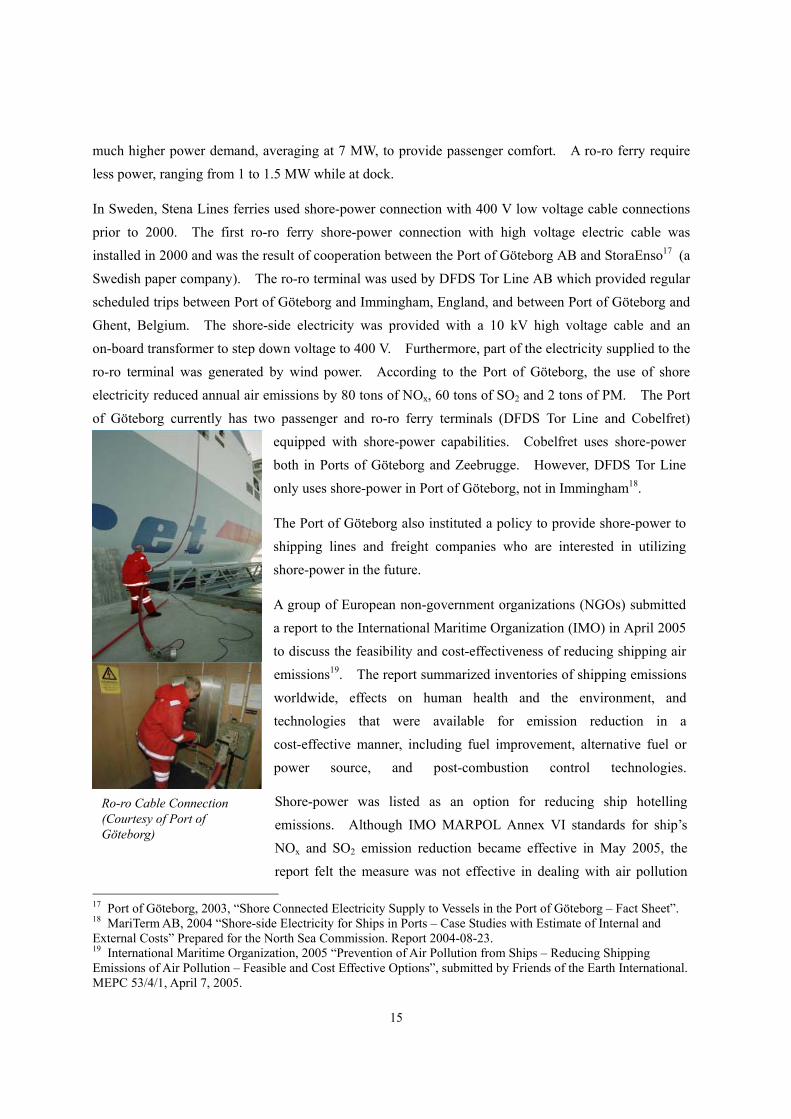
In Sweden, Stena Lines ferries used shore-power connection with 400 V low voltage cable connections
prior to 2000. The first ro-ro ferry shore-power connection with high voltage electric cable was installed in 2000 and was the result of cooperation between the Port of Göteborg AB and StoraEnso17 (a
Swedish paper company). The ro-ro terminal was used by DFDS Tor Line AB which provided regular
scheduled trips between Port of Göteborg and Immingham, England, and between Port of Göteborg and
Ghent, Belgium. The shore-side electricity was provided with a 10 kV high voltage cable and an on-board transformer to step down voltage to 400 V. Furthermore, part of the electricity supplied to the
ro-ro terminal was generated by wind power. According to the Port of Göteborg, the use of shore
electricity reduced annual air emissions by 80 tons of NOx, 60 tons of SO2 and 2 tons of PM. The Port
of Göteborg currently has two passenger and ro-ro ferry terminals (DFDS Tor Line and Cobelfret) equipped with shore-power capabilities. Cobelfret uses shore-power
both in Ports of Göteborg and Zeebrugge. However, DFDS Tor Line
only uses shore-power in Port of Göteborg, not in Immingham18.
The Port of Göteborg also instituted a policy to provide shore-power to shipping lines and freight companies who are interested in utilizing
shore-power in the future.
A group of European non-government organizations (NGOs) submitted a report to the International Maritime Organization (IMO) in April 2005
to discuss the feasibility and cost-effectiveness of reducing shipping air
emissions19. The report summarized inventories of shipping emissions
worldwide, effects on human health and the environment, and technologies that were available for emission reduction in a
cost-effective manner, including fuel improvement, alternative fuel or
power source, and post-combustion control technologies.
Shore-power was listed as an option for reducing ship hotelling
emissions. Although IMO MARPOL Annex VI standards for ship’s NOx and SO2 emission reduction became effective in May 2005, the
report felt the measure was not effective in dealing with air pollution 17 Port of Göteborg, 2003, “Shore Connected Electricity Supply to Vessels in the Port of Göteborg – Fact Sheet”. 18 MariTerm AB, 2004 “Shore-side Electricity for Ships in Ports – Case Studies with Estimate of Internal and External Costs” Prepared for the North Sea Commission. Report 2004-08-23. 19 International Maritime Organization, 2005 “Prevention of Air Pollution from Ships – Reducing Shipping Emissions of Air Pollution – Feasible and Cost Effective Options”, submitted by Friends of the Earth International. MEPC 53/4/1, April 7, 2005.
Ro-ro Cable Connection (Courtesy of Port of Göteborg)

16
associated with increasing international shipping trade, and therefore, requested IMO to take proper action.
At the 2005 Helsinki Commission Maritime Group Fourth Meeting in Klaipeda, Lithuania, Germany
and Sweden submitted a paper discussing the reduction of emissions from ships in ports by using an on-shore-power supply20. The report listed disadvantages of using shore-power, including: (1) the
relatively high cost of shore-side electricity to the fuel for on-board power generation; (2) increase of
carbon dioxide emissions if the shore-side electricity was generated by coal-fired power plant; (3) lack
of international standards for on-board and shore-side electricity (voltage and frequency compatibility); (4) difficulty of cable connection; potential harm to sensitive on-board electronic equipment during
power switchover; (5) power demand at-berth could be significant; and (6) difficulties in
cost-effectiveness analysis since each ship and terminal was unique and also site-specific. The two
countries suggested that a thorough evaluation of the transport systems’ potential to reduce their environmental impacts by using shore-side electricity connections, and likewise comparison of the cost
of shore-side electricity with best available technology for emission reduction of on-board power
generation should be conducted before the decision to introduce the shore-side power supply was made.
In May 2006, the Swedish government encouraged ship owners to use shore-side electricity with a tax exemption as an incentive to reduce ships’ air emissions while in port. Later, the European
Commission issued a non-binding recommendation to the member states to offer economic incentives,
including electricity tax reductions, to port operators using shore-side power. It recommended ports,
where air quality was not meeting local standards, noise of port operation became a public concern, or berths were situated near residential areas, to consider the use of shore-power for ships. The
commission also called for the development of international standards for shore-power systems.21 The
recommendation also provided information on typical shore-side electrical configurations and technical
requirements, emission reduction benefits, and capital and operating costs.
VI. FEASIBILITY STUDIES
Port of Houston
The Port of Houston conducted a shore-power feasibility for ocean-going vessels in the
Houston-Galveston port area in 200422. The Houston-Galveston area includes the Port of Houston, the
20 Helsinki Commission, Maritime Group Fourth Meeting, Agenda Item 6 – “Emission from Ships”, Submitted by Germany and Sweden – “An Information Paper on the Reduction of Emissions from Ships in Ports by Using On-shore Power Supply (Cold-Ironing)”. October 11-13, 2005 21 Official Journal of the European Union, “Commission Recommendation of 8 May 2006 on the Promotion of Shore-side Electricity for Use by Ships at Berth in Community Ports”, 2006/329/EC. 22 Dana Blume, Port of Houston, “Issue Paper: Cold-ironing Ocean-Going Vessels in the Houston-Galveston Port Area”, 9/7/04 Draft
17
Port of Texas City, the Port of Galveston, and the Port of Freeport. A total of 6,435 vessels called in the Port of Houston in 1997. The majority (over 40%) were tankers. However, only 17% of ships
calling the Port of Houston in 2000 called more than five times in that year. According to the air
emission projections by Texas Commission on Environmental Quality (TCEQ), vessel emissions
accounted for approximately 5% of total NOx emission in the Houston-Galveston area in 2007. Of this 5%, approximately half of the NOx emissions are from vessels at-berth.
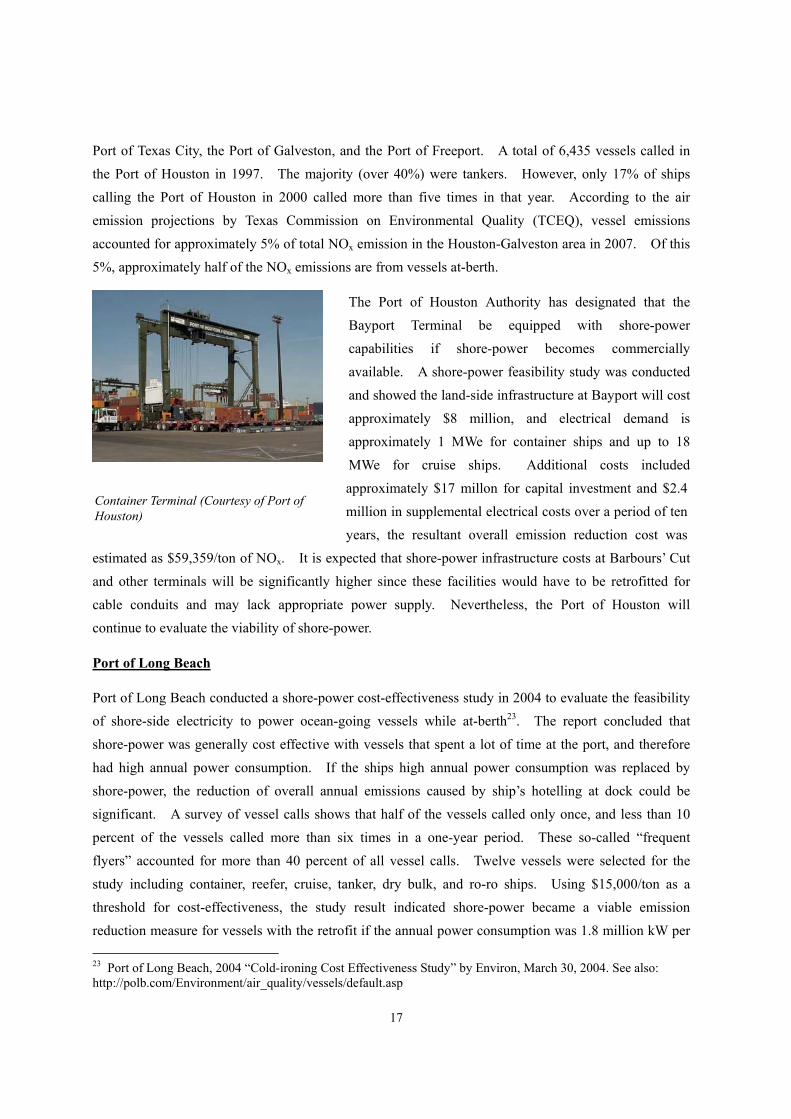
The Port of Houston Authority has designated that the
Bayport Terminal be equipped with shore-power capabilities if shore-power becomes commercially
available. A shore-power feasibility study was conducted
and showed the land-side infrastructure at Bayport will cost
approximately $8 million, and electrical demand is approximately 1 MWe for container ships and up to 18
MWe for cruise ships. Additional costs included
approximately $17 millon for capital investment and $2.4
million in supplemental electrical costs over a period of ten years, the resultant overall emission reduction cost was
estimated as $59,359/ton of NOx. It is expected that shore-power infrastructure costs at Barbours’ Cut
and other terminals will be significantly higher since these facilities would have to be retrofitted for
cable conduits and may lack appropriate power supply. Nevertheless, the Port of Houston will continue to evaluate the viability of shore-power.
Port of Long Beach
Port of Long Beach conducted a shore-power cost-effectiveness study in 2004 to evaluate the feasibility of shore-side electricity to power ocean-going vessels while at-berth23. The report concluded that
shore-power was generally cost effective with vessels that spent a lot of time at the port, and therefore
had high annual power consumption. If the ships high annual power consumption was replaced by
shore-power, the reduction of overall annual emissions caused by ship’s hotelling at dock could be significant. A survey of vessel calls shows that half of the vessels called only once, and less than 10
percent of the vessels called more than six times in a one-year period. These so-called “frequent
flyers” accounted for more than 40 percent of all vessel calls. Twelve vessels were selected for the
study including container, reefer, cruise, tanker, dry bulk, and ro-ro ships. Using $15,000/ton as a threshold for cost-effectiveness, the study result indicated shore-power became a viable emission
reduction measure for vessels with the retrofit if the annual power consumption was 1.8 million kW per 23 Port of Long Beach, 2004 “Cold-ironing Cost Effectiveness Study” by Environ, March 30, 2004. See also: http://polb.com/Environment/air_quality/vessels/default.asp
Container Terminal (Courtesy of Port of Houston)
18
hour (kW-hr) or more; whereas the annual power consumption exceeding 1.5 million kW-hrs was the breakpoint for new vessels with shore-power capabilities to be cost-effective. Among twelve vessels
studied, five of them – two containers, one tanker, one reefer and one cruise ship were considered to be
the best candidates for shore-power due to high power demand, long berthing time, and relatively
frequent port calls. These factors contributed to significant annual power consumption and therefore offered a greater potential for achievable emission reductions.
A follow-up study was performed in November 2004, the study identified 151 frequent port callers, and
26 ships were identified as being potential candidates for shore-power. These ships included 22 container ships, two reefers, and two passenger ships. Moreover, in February 2005, the Port of Long
Beach issued preliminary design standards for a shore-power program including electrical specifications
for a shore-side power substation to receive 12 kV from Southern California Edison Company; the wharf
outlet will be 6.6 kV, 3-phase, and 60 Hz with a grounding circuit conductor; and, a design load of 7,500 KVA for each ship24.
San Francisco – Cruise Terminal, 2005
The Port of San Francisco planned to build a mixed use/cruise terminal facility at Piers 30-32. One of the potential mitigation measures for reducing air pollution was the use of technologies such as
shore-side electrical power to reduce hotelling emissions from cruise ships by turning off the ship’s
self-generating electrical units. Port of San Francisco contracted Environ Corporation to conduct a
cruise ship shore-power feasibility study in 200525. Four candidate cruise ships, based on port calls and vessel engine and generator data, were selected for the study. The study estimated hotelling emissions
and power demand; developed conceptual design and cost estimates for a shore-side power system; and,
conducted cost-effectiveness analyses of shore-side power and alternative control technologies.
The study showed the shore-side auxiliary electrical power demand was estimated to be less than 12.5 MW for a single shore-side connection, which was consistent with demand in other ports with similar
applications. Shore-side electricity will be provided by Pacific Gas and Electric Company (PG&E).
Hotelling with shore-side power with two ships simultaneously was technically feasible; however, extra
power demand and infrastructure upgrades and space availability should be taken into account in the design. Using Princess Cruise as an example, it was estimated that retrofit cost for the ship ranged
from $500,000 to $700,000 per ship. However, the retrofit cost would be reduced proportionally
according to the number of ports where it used shore-side power. Shore side infrastructure capital costs
were estimated in the range of $1.5 million to $3.0 million, with an approximate range of $600,000 to $1.5 million for on-pier electrical supply fixed costs. Annual operation and maintenance costs were 24 Port of Long Beach, Engineering Division, 2005, “Preliminary - Design Standard for Shore to Ship Power” 25 Port of San Francisco, “Shoreside Power Feasibility Study for Cruise Ships Berthed at Port of San Francisco”, by Environ, September 13, 2005.
19
estimated to be approximately $140,000. The reason for increased cost for cruise ships was the shore-side electricity fee, which ranged from two to three times more than self-generating electrical
costs, depending on ship size and frequency of visits. Actual cost increase from using shore-side
electricity ($150,000 to $300,000) and savings from fuel costs ($35,000 to $70,000) resulted in a net
increase of $115,000 to $230,000 in operating cost. The breakeven electrical cost was estimated in the range of $0.05 – 0.10/kW-hr. Nominal electrical rates of $0.141/kW-hr and $0.220/kW-hr provided by
PG&E were used in the study. Other ports with shore-power capabilities have a substantially lower
rate of $0.03 to $0.085/kW-hr, which were made possible by a financial subsidy.
Emission reduction benefits were estimated as 8 to 20 tons per year of NOx, 0.05 to 1.3 tons of PM and
0.5 to 15 tons of SO2 per vessel. If all four candidate ships participated in the shore-power program,
the cost-effectiveness values ranged from $5,500 to $7,000/ton as compared to acceptable reduction cost
of $14,000/ton used in the Carl Moyer program. However, if less than four ships participated in the program; it becomes less cost effective. The key to the program success is the frequency of ship calls
to the port.
Rotterdam Port – Container Terminal
Port of Rotterdam plans to construct a new terminal – Euromax container terminal (jointly owned by
Europe Container Terminal and Maersk) on the existing Maasvlakte I Terminal area and conducted a
feasibility study on incorporating a shore-side electricity infrastructure into the terminal design26. The
Port of Rotterdam conducted a survey of 53 container ships for their electrical system characteristics, power requirements, fuel consumption, and capability for shore-power connection while in port. Only
one of 53 ships studied was equipped with shore-power connection capability. The survey showed ship
voltage ranged from 380 V to 6.6 kV, where the majority of the larger vessels used 440 V. 6.6 kV was
only found on vessels built after 2001. The frequency was either 50 Hz or 60 Hz. The majority of deep water container vessel used 60 Hz, and feed vessels used 50 Hz. Voltage conversion could be
achieved using a transformer and was rather straightforward. Since most of the land-side electricity in
Europe is 50 Hz, therefore, frequency conversion to 60 Hz at shore-side will require additional
equipment and capital costs. For deep water container vessels, the average power consumption in port varied widely, ranging from 250 kW to 2,000 kW, depending on ship size. A majority of the container
vessels used heavy fuel oil with a sulfur content of 1.5% that could be as high as 4.5%.
The study concluded that Rotterdam shore connection for container vessels had the following
characteristics: • Average power consumption for a deep sea container vessel: 2 MW
26 Port of Rotterdam Authority, 2006, “Alternative Maritime Power in the Port of Rotterdam – A feasibility Study into the Use of Shore-side Electricity for Containerships Moored at the Euromax Terminal in Rotterdam”.
20
• Peak power consumption for a deep sea container vessel: 7 MW • Average power consumption for a feeder: 200 kW • Peak power consumption for a feeder: 1 MW • Voltage and frequency for deep sea container vessels: 6.6 kV/60 Hz • Voltage and frequency for feeders: 6.3 kV/50 Hz and 6.6 kV/60 Hz
A ship-side cable management system was preferred to expedite the connection process. Again, the
main concern was the frequency conversion from land-side 50 Hz to ship-side 60 Hz. A preliminary conceptual design of shore-side electrical system for the Euromax Terminal was prepared. Land-side
electricity will be provided by the European Union grid at 380 kV/50 Hz, stepped down to 150 kV/50
Hz at the regional grid, and further stepped down to 25 kV/50 Hz at the Euromax Terminal. A power
station of 40 MVA/25kV/50 Hz will be installed at the terminal and a frequency converter will be required to convert the frequency from 50 Hz to 60 Hz. Two transformers, 25 kV-6.3 kV and 25 kV –
6.6 kV, will be installed for voltage conversion. A power substation and electrical outlets will be
installed at the dock-side to provide shore-power to ships.
The capital investment and annual operating costs were estimated as €28.5 million and €3.25 million,
respectively. The baseline electricity rate (for 50 Hz) was €0.05/kW-hr. Assuming only 20% of
vessel calls will utilize shore-power connections; the average electricity rate was estimated as
€0.82/kW-hr. The average electricity rate will be reduced to €0.17/kW-hr if all vessel calls utilized shore-power.
Although it is technically feasible to equip the Euromax Terminal with shore-power, considering the
future marine ship fuel regulations; minimal air emissions impacts in nearby urban areas; lack of
international standards for shore-power systems; and, significant investment costs, the Port of Rotterdam did not recommend the Euromax container terminal design include shore-power. Nevertheless, the
Port of Rotterdam did encourage other vessels – inland barges, ro-ro/passenger vessels to consider the
use of shore-power. Furthermore, it is expected that when the Maasvlakte II Terminal is ready for
construction, the international standards for shore-side electricity will be finalized and adopted by the international communities, by then, shore-power should be included in the future terminal design.
Shanghai Port – Container Terminal
Shanghai Port is one of the largest ports in the world in terms of cargo volume handled. Due to its unique coast line, many terminals are located near residential areas. As a result, port-related air
pollution becomes a pressing issue for the port authority, regulatory agencies and local communities.
Shanghai Port conducted shore-power feasibility studies for Chang-hua-bin terminal and Wai-guo-chiao
container terminals 27 . The focus was on the engineering aspect of electrical connections.
27 Shanghai Port, 2006, “Study of Shore-power Technology for Ships” (in Chinese).
21
Shore-power was an AC 380V, 50 Hz system and the majority of ships used AC 440 V, 60 Hz system. In order to utilize shore-power, power voltage transformers and frequency converters will be required.
Ideally, a shore-power system would be able to accommodate both low voltage systems: 440 V, 380 V
and 220 V, and medium voltage system: 6.6 kV and 10 kV. Currently, Shanghai Port has Class II
electrical load and utilizes a 50 Hz AC double circuit system. In the port area, power for the supply system has three voltages: 10 kV, 400 V and 220 V. At Wai-gou-chiao terminal, the total capacity is
13,072 kW, maximum load for each crane was 300 kW/crane, and the total normal operating load was
8,204 kW, therefore, there was a surplus of 4,868 kW which can be used for hotelling ships. However,
the existing terminal infrastructure did not have power distribution, transmission, frequency conversion and cable connection facilities. Therefore, the key issue was the improvement of the terminal
infrastructure to enable ships to use the shore-side electrical system. Emission reduction benefits were
estimated at 92% reduction for NOx, PM and SO2 per vessel.
The study concluded that shore-power for ships at the Shanghai Port were technically feasible. The
study also recommended vessel speed reduction to reduce emissions from ships in port. Duct works
and trenches for cable conduits were put in place at the new terminals. However, there is no actual
construction of shore-power infrastructure at this time.
VII. SHORE-POWER CHALLENGES
1. Legal Challenges
IMO is the primary regulatory agency tasked with developing regulations for the control of pollution
from international shipping activities. IMO regulations, once approved are implemented and enforced
by the member states. For international shipping businesses, where the vessel is registered and whose flag the vessel flies, the flag state government is responsible for oversight and enforcement of safety,
security and environmental compliance. In many instances, flag state governments rely on independent
organizations such as classification societies for technical expertise and guidance on these
responsibilities. These organizations will operate on behalf of a flag state to exercise regulatory authority.
In the U.S., the EPA has the authority to set marine engine emissions standards but they are only
applicable to vessels registered under the U.S. flag. As discussed in earlier section, the majority of vessel calls at U.S. ports are foreign flagged. The U.S. EPA has no judicial authority over the majority
(approximately 65%) of international merchant vessels which are foreign flagged. This could pose a
serious legal challenge in enforcing the shore-power requirements even if U.S. EPA and state
governments are to adopt such regulation.
22
2. Engineering Challenges
Shore-Side Infrastructure Requirements
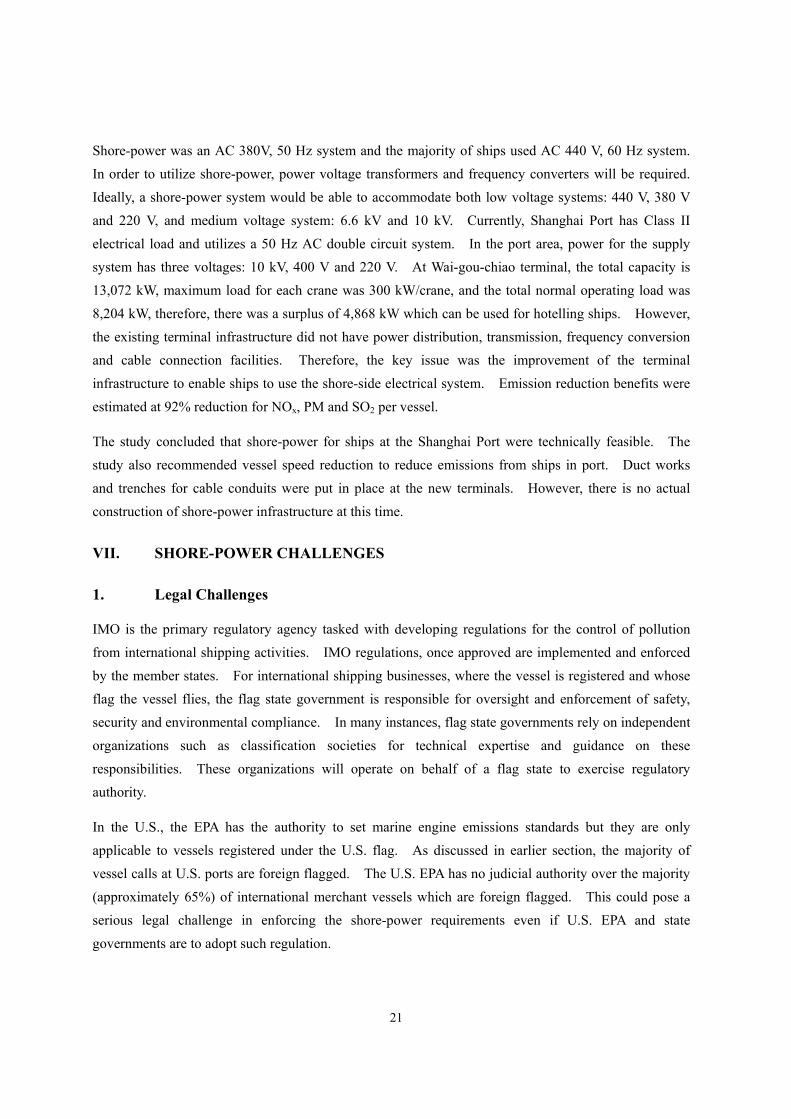
A shore-power system requires industrial substations and
power transmission lines to bring power from a local grid to the port. At the terminal, the berth requires installing
electrical cables and conduits, wharf-side electrical vault and
connectors for ship connection. For a new terminal to be
designed with shore-power capabilities it is likely to be less cost-intensive and the engineering can be included in the
terminal design and hence be an integral part of the design.
However, for an existing terminal, it does pose significant
financial and engineering challenge, as major improvements or modifications of the existing terminal and its operation
require disruption prevention schemes.
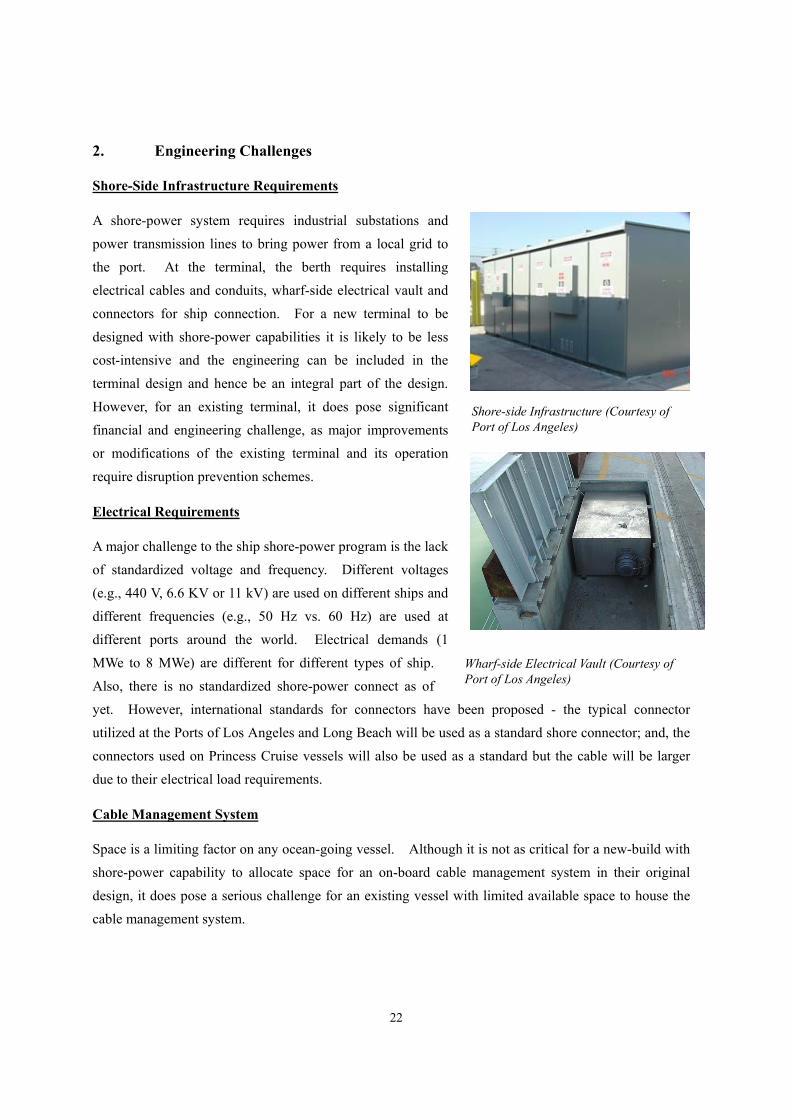
Electrical Requirements
A major challenge to the ship shore-power program is the lack
of standardized voltage and frequency. Different voltages
(e.g., 440 V, 6.6 KV or 11 kV) are used on different ships and
different frequencies (e.g., 50 Hz vs. 60 Hz) are used at different ports around the world. Electrical demands (1
MWe to 8 MWe) are different for different types of ship.
Also, there is no standardized shore-power connect as of
yet. However, international standards for connectors have been proposed - the typical connector utilized at the Ports of Los Angeles and Long Beach will be used as a standard shore connector; and, the
connectors used on Princess Cruise vessels will also be used as a standard but the cable will be larger
due to their electrical load requirements.
Cable Management System
Space is a limiting factor on any ocean-going vessel. Although it is not as critical for a new-build with
shore-power capability to allocate space for an on-board cable management system in their original
design, it does pose a serious challenge for an existing vessel with limited available space to house the cable management system.
Shore-side Infrastructure (Courtesy of Port of Los Angeles)
Wharf-side Electrical Vault (Courtesy of Port of Los Angeles)
23
3. Capital Investment Cost Challenges
Each port has its own unique history, layout, business climate, types of ship calls, operations, local air
quality concerns and surrounding communities. Therefore, costs involved in constructing shore-power
ready terminals will vary significantly. The major concern centers on the enormous costs involved in the shore-side power infrastructure. The cost to bring electricity from a local grid to the terminal will
be in the range of $1 million to $3 million dollars depending on port location, type of ships, power
demand and electricity (i.e., voltage and frequency). If multiple facilities are to be equipped with
shore-power capability, the overall construction cost may come down, but equipment cost will be higher. In addition to capital costs for shore-side improvement, the equipment necessary to connect shore-power
and protect on-board equipment must be installed in the ship. Costs for ship-side modification can
range from $300,000 to $2 million depending on the application. In some cases, direct connection
between shore-power and ship is not feasible and an intermediate facility such as a barge is used to bring the cable to the ship. All these are considered potential additional costs to ship owners and port
authorities. However, if the ship is a frequent caller to a certain port equipped with shore-power, it will
be considered more cost-effective. Furthermore, both the International Standard Organization (ISO)
and International Electrotechnical Commission (IEC) are working on a standardization program. Once international standards are developed and adopted on a global scale, the shore-power equipped vessels
can take full advantage of the program to use shore-power at various ports of call and consequently,
lowering the overall costs.
4. Operational Challenges – Cost-Effectiveness
In the ARB’s 2006 “Evaluation of Cold-Ironing Ocean-Going Vessels at California Ports”, six categories
of ship were studied for associated costs of using shore-power including: container, passenger, reefer, tankers, bulk and cargo, and vehicle carrier ships. Cost-effectiveness analysis included the following:
• Ship categories: different ship categories have different power (i.e., low and high voltage) requirements
• Capital costs: ship retrofits and shore-side infrastructure • Operating costs: energy costs, labor costs and routine maintenance costs.
The result of this cost-effectiveness study and results from Ports of Los Angeles, Long Beach and Houston using NOx reductions are summarized in Table 7. These values are higher than the acceptable
reduction cost $14,000/ton used in the Carl Moyer program.
24
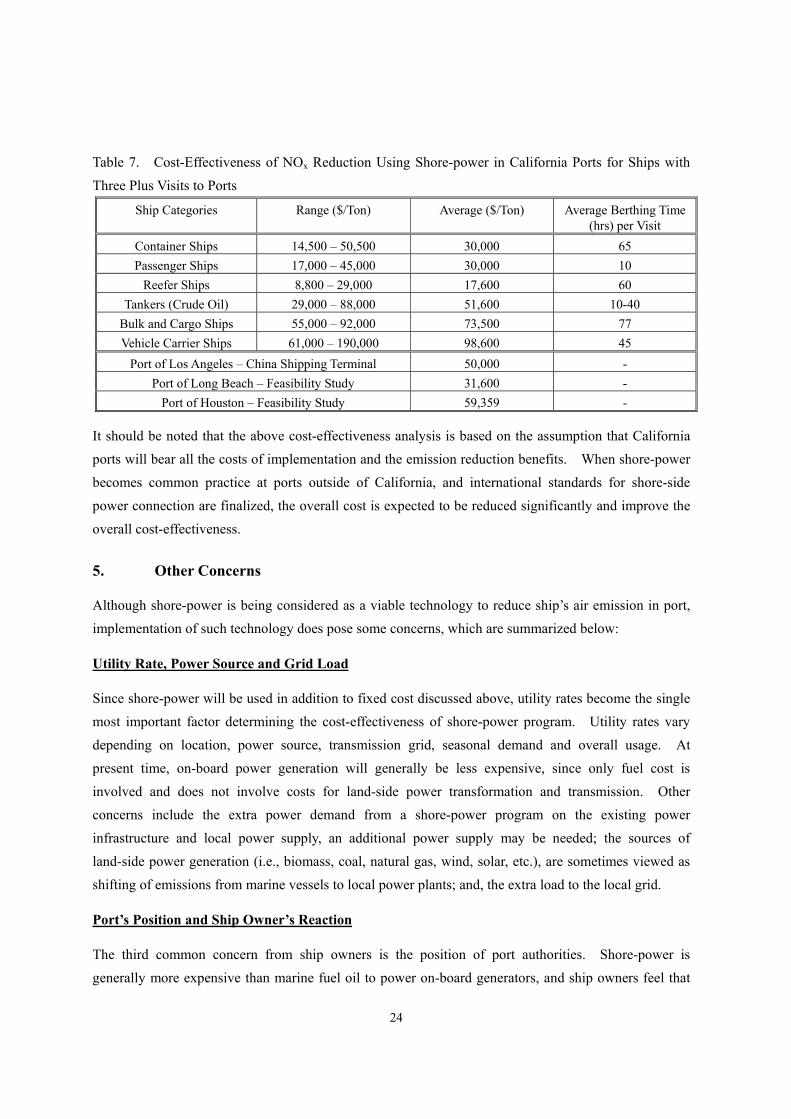
Table 7. Cost-Effectiveness of NOx Reduction Using Shore-power in California Ports for Ships with
Three Plus Visits to Ports
Ship Categories Range ($/Ton) Average ($/Ton) Average Berthing Time (hrs) per Visit
Container Ships 14,500 – 50,500 30,000 65 Passenger Ships 17,000 – 45,000 30,000 10
Reefer Ships 8,800 – 29,000 17,600 60 Tankers (Crude Oil) 29,000 – 88,000 51,600 10-40
Bulk and Cargo Ships 55,000 – 92,000 73,500 77 Vehicle Carrier Ships 61,000 – 190,000 98,600 45
Port of Los Angeles – China Shipping Terminal 50,000 - Port of Long Beach – Feasibility Study 31,600 -
Port of Houston – Feasibility Study 59,359 -
It should be noted that the above cost-effectiveness analysis is based on the assumption that California ports will bear all the costs of implementation and the emission reduction benefits. When shore-power
becomes common practice at ports outside of California, and international standards for shore-side
power connection are finalized, the overall cost is expected to be reduced significantly and improve the
overall cost-effectiveness.
5. Other Concerns
Although shore-power is being considered as a viable technology to reduce ship’s air emission in port, implementation of such technology does pose some concerns, which are summarized below:
Utility Rate, Power Source and Grid Load
Since shore-power will be used in addition to fixed cost discussed above, utility rates become the single most important factor determining the cost-effectiveness of shore-power program. Utility rates vary
depending on location, power source, transmission grid, seasonal demand and overall usage. At
present time, on-board power generation will generally be less expensive, since only fuel cost is
involved and does not involve costs for land-side power transformation and transmission. Other concerns include the extra power demand from a shore-power program on the existing power
infrastructure and local power supply, an additional power supply may be needed; the sources of
land-side power generation (i.e., biomass, coal, natural gas, wind, solar, etc.), are sometimes viewed as
shifting of emissions from marine vessels to local power plants; and, the extra load to the local grid.
Port’s Position and Ship Owner’s Reaction
The third common concern from ship owners is the position of port authorities. Shore-power is
generally more expensive than marine fuel oil to power on-board generators, and ship owners feel that

25
port authorities may be in the position to gain financially by providing shore-power to ships in port. However, the State of California is requiring ship owners operating their vessels in California ports or
near the coast to use distillate oil (0.1% sulfur) instead of bunker oil by 2010. The average price for
distillate oil is approximately 2.5 times of the price of bunker oil ($500/metric ton vs. $200/metric ton).
With this price difference, a ship owner’s concern about port’s position and possible financial gain will eventually diminish.
Business Competitiveness
If shore-power becomes a mandatory requirement for certain U.S. ports, it could potentially reduce the competitiveness of the affected ports, unless these ports are located with an unrivaled geographic
advantage. Cargo and goods may be simply shipped to other ports with less air quality concerns. If
cargo and goods are diverted to other ports without air quality concerns, it may increase land-based
traffic (rail or truck) bringing goods to the intended destinations and burden the existing transportation infrastructure, while simply reapportioning air emission impacts.
On the other hand, shore-power is cost effective for frequent callers. Furthermore, the port has a
mandate requiring vessels to use shore-power and the port’s capacity is limited for ship arrival, therefore ships with shore-power equipment will be granted priority to use terminal. If the ship owners have
foresight and install shore-power equipment on their vessels, they will have a competitive advantage.
VIII. ALTERNATIVES FOR VESSEL HOTELLING EMISSION REDUCTION
There are alternative technologies that would significantly reduce emissions of one or more air
pollutants28 , 29 generated from ships hotelling at-berth. These technologies could be taken into
consideration for ports that are not ready or not physically suited for shore-power.
1. Cleaner Fuel
IMO MARPOL Annex VI addresses marine vessel NOx emission limits and fuel sulfur content. Annex VI also allows nations to establish Sulfur Oxide Emission Control Areas (SECAs). Currently, Baltic
Sea Area and North Sea Area are designated SECAs and the sulfur content in fuels used by vessels in
these areas is limited to 1.5% (w/w) or utilizing after-treatment technology to bring SOx emission in the
ship’s flue gas down to 6 g/kW-hr or less. It is expected that by switching fuels from residual (or
28 Anthony Fournier, February 2006, “Controlling Air Emissions from Marine Vessels: Problems and Opportunities”, University of California-Santa Barbara, Donald Bren School of Environmental Science and Management.. 29 Entec UK Limited, 2005 “European Commission Directorate General – Environment, Service Contracts on Ship Emissions: Assignment, Abatement and Market-based Instruments, Task 2: General Report; Task 2a – Shore-side Electricity; Task 2b – NOx abatement; and, Task 2c – SO2 Abatement”. See also: http://ec.europa.eu/environment/air/transport.htm.
26
bunker fuel with 2.7 % [w/w] in sulfur content) to distillate fuel (1.5% or lower in sulfur content) when vessel is near land or in port, vessels can achieve reductions of 18% PM and 44% SO2, or 20% PM and
81% SO2 reductions by switching fuels from 2.7% to 0.5% in sulfur content. The fuel with 0.5 % in
sulfur content will be replaced by 0.05% in 2007 in the U.S. Also, diesel fuel with 0.0015% in sulfur
content or ultra-low sulfur diesel (ULSD) has been made available since 2006. No major vessel modification is required for fuel switching except for addition of a separate fuel tank and fuel switching
mechanism. Other issues of concern include fuel cost differentials, less lubricity of low sulfur fuel,
increased engine wear, and no reduction of NOx emissions.
2. Water-Based Fuel Treatment
Water can be used in diesel fuels to reduce peak combustion temperature resulting to reduced NOx
emissions. This can be achieved by: • Using a humid air motor to saturate heated intake air with water vapor by the
evaporation of seawater with waste engine heat. • Using emulsified diesel fuel. • Using direct water injection.
Depending on the type of water introduction system selected, additional equipment, space, and engine modifications are needed.
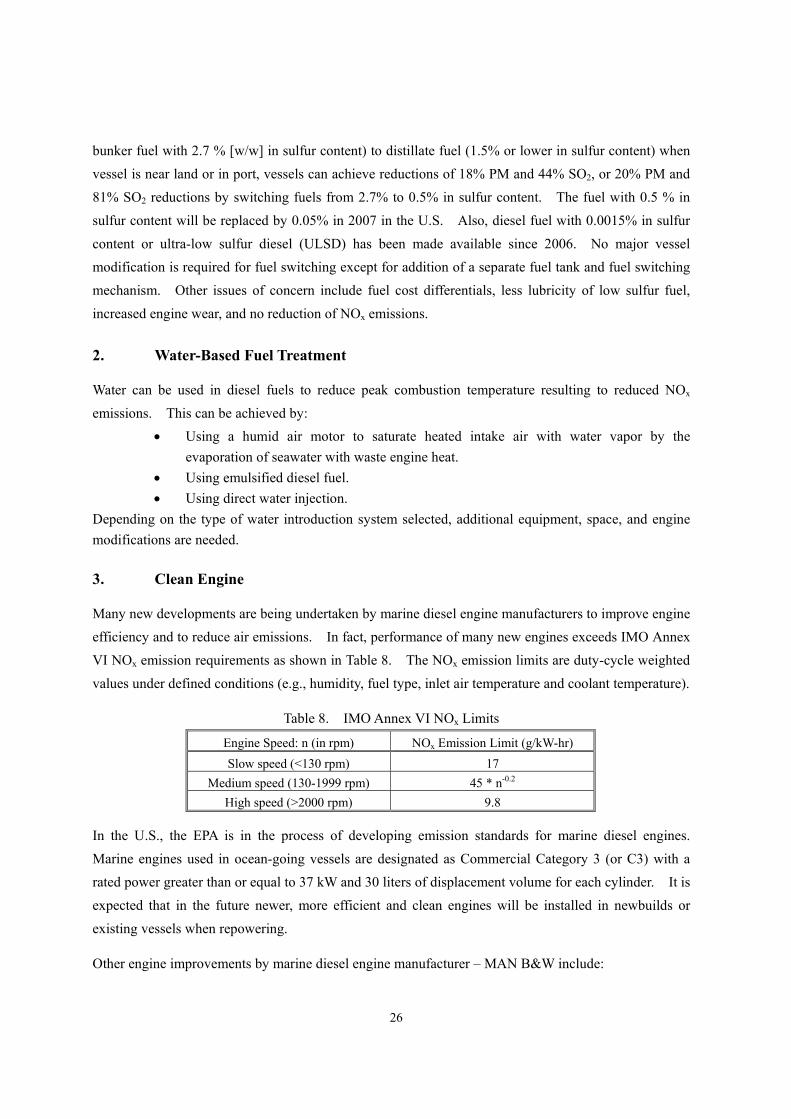
3. Clean Engine
Many new developments are being undertaken by marine diesel engine manufacturers to improve engine efficiency and to reduce air emissions. In fact, performance of many new engines exceeds IMO Annex
VI NOx emission requirements as shown in Table 8. The NOx emission limits are duty-cycle weighted
values under defined conditions (e.g., humidity, fuel type, inlet air temperature and coolant temperature).
Table 8. IMO Annex VI NOx Limits
Engine Speed: n (in rpm) NOx Emission Limit (g/kW-hr) Slow speed (<130 rpm) 17
Medium speed (130-1999 rpm) 45 * n-0.2 High speed (>2000 rpm) 9.8
In the U.S., the EPA is in the process of developing emission standards for marine diesel engines.
Marine engines used in ocean-going vessels are designated as Commercial Category 3 (or C3) with a rated power greater than or equal to 37 kW and 30 liters of displacement volume for each cylinder. It is
expected that in the future newer, more efficient and clean engines will be installed in newbuilds or
existing vessels when repowering.
Other engine improvements by marine diesel engine manufacturer – MAN B&W include:

27
• The use of a slide-valve to reduce sac volume inside the fuel injector and reduce emissions of NOx, PM, and VOCs.
• Delay engine timing to reduce NOx emissions by lowering combustion temperature.
4. After Combustion Treatment
Seawater Scrubbers
A seawater scrubber utilizes the natural alkalinity (e.g. carbonate) of seawater to remove SO2 and wet
scrubbing to remove PM, the scrubbing solution is then returned back to the ocean. This technology
allows the continuous use of residual diesel fuel and is considered as an alternative to the use of cleaner
fuel for vessels traveling in SECA areas. There are costs involved in the initial capital investment and routine operational and maintenance; and, additional space is required. However, the additional costs
needed may be offset by the cost differential between residual oil and low sulfur fuel.
Selective Catalytic Reduction (SCR)
SCR is primarily used for reducing NOx emissions. Ammonia or urea is injected into the exhaust gas
stream which then goes through a reduction catalyst to convert NOx to nitrogen gas and water. This
technology requires significant amount of space and adds additional weight due to the need for tanks to
storing chemicals and catalysts, therefore, it is more suited for new-builds. Additionally, the catalyst is only active when the exhaust gas temperature is at or above 270 degrees Celsius, and it would be more
effective if used on smaller four-stroke diesel engines. Other considerations include the use of low
sulfur fuel to prevent catalysts from poisoning by constituents in exhaust gas (i.e., soot, alkaline metal
oxides, phosphorus oxide, and sulfur compounds) from burning residual oil.
Advanced Maritime Emission Control System (AMECS)
AMECS is a shore or barge-based multi-stage emission control system to
remove NOx, SO2 and PM from vessel exhaust gas. It is considered a viable alternative for terminals which are not suited for shore-power.
AMECS is comprised of a barge- or wharf-based crane and bonnet system,
an exhaust gas transfer line, and a transportable air emissions treatment
unit. When ship is at dock, the bonnet is raised by the crane and lowered to shroud the exit of the ship stack using a laser-guided navigation system.
Exhaust from the ship stack is transferred, by negative pressure, through a
transfer line down to a shore-side or barge-based treatment system. The
exhaust gas treatment system utilizes a SO2 removal unit using sodium
hydroxide, a cloud chamber scrubber to remove PM and a selected AMECS (Courtesy of ACTI)
28
catalytic converter using urea to remove NOx. The system is currently being used to treat locomotive emissions at Union Pacific Railroad’s Roseville Yard, near Sacramento, but the exhaust collection
system is different from the marine vessel application.
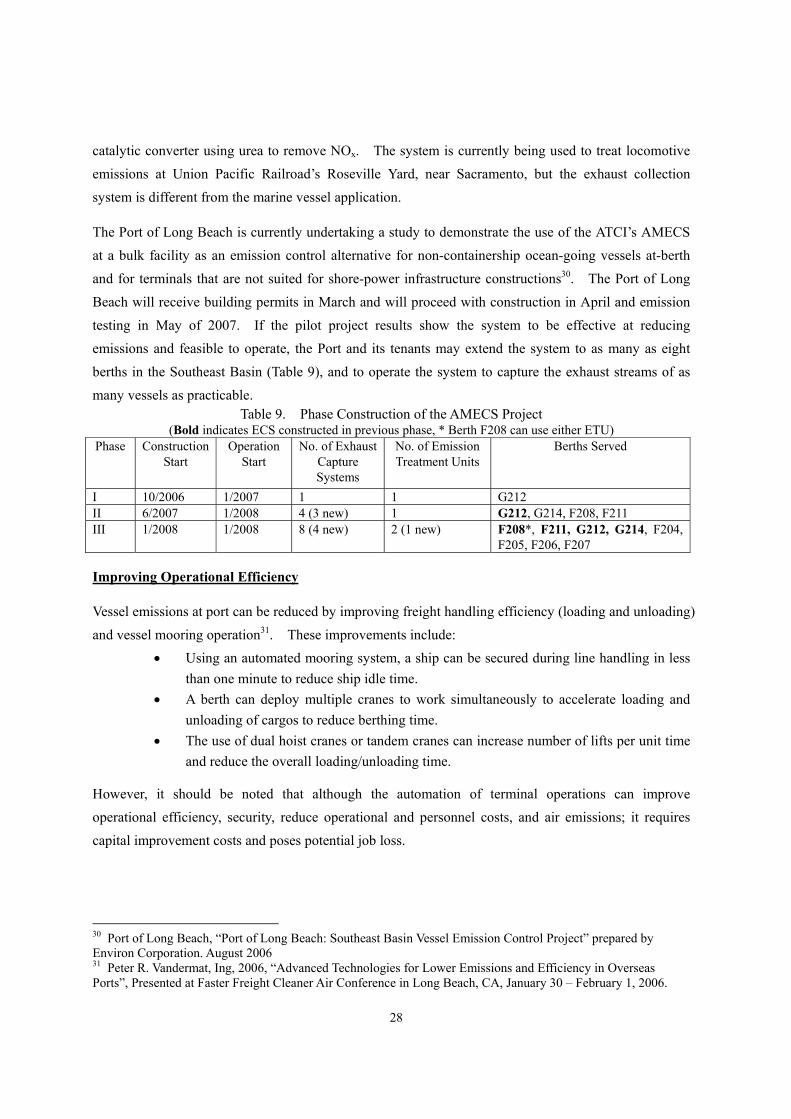
The Port of Long Beach is currently undertaking a study to demonstrate the use of the ATCI’s AMECS at a bulk facility as an emission control alternative for non-containership ocean-going vessels at-berth
and for terminals that are not suited for shore-power infrastructure constructions30. The Port of Long
Beach will receive building permits in March and will proceed with construction in April and emission
testing in May of 2007. If the pilot project results show the system to be effective at reducing emissions and feasible to operate, the Port and its tenants may extend the system to as many as eight
berths in the Southeast Basin (Table 9), and to operate the system to capture the exhaust streams of as
many vessels as practicable. Table 9. Phase Construction of the AMECS Project
(Bold indicates ECS constructed in previous phase, * Berth F208 can use either ETU) Phase Construction
Start Operation
Start No. of Exhaust
Capture Systems
No. of Emission Treatment Units
Berths Served
I 10/2006 1/2007 1 1 G212 II 6/2007 1/2008 4 (3 new) 1 G212, G214, F208, F211 III 1/2008 1/2008 8 (4 new) 2 (1 new) F208*, F211, G212, G214, F204,
F205, F206, F207
Improving Operational Efficiency
Vessel emissions at port can be reduced by improving freight handling efficiency (loading and unloading)
and vessel mooring operation31. These improvements include: • Using an automated mooring system, a ship can be secured during line handling in less
than one minute to reduce ship idle time. • A berth can deploy multiple cranes to work simultaneously to accelerate loading and
unloading of cargos to reduce berthing time. • The use of dual hoist cranes or tandem cranes can increase number of lifts per unit time
and reduce the overall loading/unloading time.
However, it should be noted that although the automation of terminal operations can improve operational efficiency, security, reduce operational and personnel costs, and air emissions; it requires
capital improvement costs and poses potential job loss.
30 Port of Long Beach, “Port of Long Beach: Southeast Basin Vessel Emission Control Project” prepared by Environ Corporation. August 2006 31 Peter R. Vandermat, Ing, 2006, “Advanced Technologies for Lower Emissions and Efficiency in Overseas Ports”, Presented at Faster Freight Cleaner Air Conference in Long Beach, CA, January 30 – February 1, 2006.

29
IX. RECENT DEVELOPMENTS
1. Regulatory Development in California
In March 2006, ARB released a report – “Evaluation of Cold-Ironing Ocean-Going Vessels at California Ports”32, which presented an analysis of the feasibility and cost-effectiveness of using shore-power for
ships at California ports. The report concluded that the most attractive vessel candidates for
shore-power are container, refrigerated cargo (reefer), and passenger ships. The most likely locations
for shore-power in California are the Ports of Los Angeles, Long Beach, Oakland, San Diego, San Francisco, and Hueneme.
In April 2006, ARB approved the Goods Movement Emission Reduction Plan33 (GMERP), which
identifies strategies for reducing emissions created from the movement of goods throughout the State. Shore-power was a strategy identified for reducing hotelling emissions, with a goal of 20% emission
reductions from shore-power or an equivalent reduction strategy by 2010, 60% reductions by 2015, and
80% reductions by 2020.
South Coast Air Quality Management District has prepared the 2007 Draft Air Quality Management Plan (2007 AQMP)34, which focuses on ozone and fine PM. Both GMERP and AQMP identify
“shore-based electric power” as a control measure to reduce marine ship auxiliary engine hotelling
emissions.
In December 2006, ARB adopted a new rule titled “Emission Limits and Requirements for Auxiliary
Diesel Engine and Diesel-Electric Engines Operated on Ocean-Going Vessels Within California Waters
and 24 Nautical Miles of the California Baseline”35 (California Code of Regulations, Title 13, Section
2299.1), which became effective January 1, 2007. This rule requires ship operators to ensure their auxiliary engines operating in the regulated California waters meet the first set of emission limits. One
way to meet this requirement is to use marine diesel oil (MDO) with a maximum of 0.5% sulfur by
weight or use marine gas oil (MGO). Starting on January 1, 2010, vessel operators will need to ensure
that their auxiliary engines operating in regulated California waters meet the second set of emission limits; one way to do this would be to use MGO with 0.1 %t sulfur by weight. The vessel operators are
required to retain and maintain proper records of fuel and vessel location information for three years.
32 ARB, March 2006, “Draft Report – Evaluation of Cold-Ironing Ocean-Going Vessels at California Ports.” See also: http://www.arb.ca.gov/ports/shorepower/shorepower.htm#Documents 33 ARB, 2006 “Proposed Emission Reduction Plan for Ports and Goods Movement in California”. See also: http://www.arb.gov.ca/planning/gmerp/march21plan/march22plan.doc 34 SCAQMD, “2007 Air Quality Management Plan”. See also: http://www.aqmd.gov/aqmp/07aqmp/07AQMP.html 35 California Cod of Regulation, Title 13, Section 2299.1 “Emission Limits and Requirements for Auxiliary Diesel Engines and Diesel-Electric Engines Operated on Ocean-Going Vessels Within California Waters and 24 Nautical Miles of the California Baseline”.
30
The rule also provides flexibilities of the “Alternative Compliance Plan (ACP)” for vessel owners and operators to meet the requirements by permitting alternative emission control strategies. The ACP
provision allows ship owners and operators to implement alternative emission control strategies in lieu
of complying with the emission limits. Under the ACP36, vessel owners or operators would be required
to achieve and demonstrate equivalent or greater emission reductions over a calendar year than that which would have been achieved with direct compliance with the emission limits. Alternative
emission control strategies include the use of shore-side electrical power, engine modifications, exhaust
treatment devices (e.g., diesel oxidation catalysts), and the use of alternative fuels or fuel additives.
The ARB staff is currently developing a shore-power regulation for ocean-going vessels to be presented
to the Board in late 2007.
2. International Standards for Shore-Power
As discussed earlier, aside from the shore-power costs, many ports will consider implementing a
shore-power system if an international standard for shore-power is available.
Germany and Sweden, supported by a number of delegates, submitted to the Marine Environmental Protection Commission (MEPC 54) of IMO in March 2006, a proposal to initiate a standardization
process for on-shore-power supply37. The proposal called upon the Committee to consider and invite
International Standard Organization (ISO) to initiate a process of international standardization for shore
connecting systems that were used for connecting ship to shore-power supplies. In response to the request, MEPC 54 instructed the Secretariat to liaise with other organizations and report back to MEPC
55 in October 2006. The Committee agreed that standardized power supply connection could benefit
the industry but further studies were needed before any decision could be made. The ISO Technical
Committee (TC) 8 and Sub-Committee (SC) 3 also have agreed to provide an environment and work platform to allow the Ports to take a leadership role in developing a shore-to-ship power standard. The
MEPC Secretariat noted "At the request of International Association of Ports and Harbors (IAPH) and
the International Chamber of Shipping (ICS), ISO would initiate a working group under its Technical
Committee 8, Ships and Marine Technology, with active participation from IAPH, ICS, International Electrotechnical Commission (IEC), other industry groups and several ports. The working group
would convene its first meeting in the early autumn of 2006. ISO/TC8 has committed to keep the
Committee informed of its progress."
According to International Association of Classification Societies (IACS) rules and regulations, 36 ARB, December 2006, “Implementation Guidance: Alternative Compliance Plan for Cargo Handling Equipment and Alternative Control of Emission for Ship Auxiliary Engines”. See also: http://www.arb.ca.gov/msprog/offroad/marinevess/documents/guidance1206.pdf 37 IMO MEPC 54/4/3, 2006 “Proposal to Initiate a Standardization Process for On-shore Power Supply.” Submitted by Germany and Sweden.
31
shore-side electrification only dealt with low voltage power supply during repair or maintenance, not shore-power. Shore-side power quality, installation and operation were regulated by national law and
possibly by special requirements of the power utility companies, port authorities and terminal operators;
whereas the on-board electrical systems were regulated by rules and regulation of the relevant
classification society. Many existing shore-side power systems used different standards. International communities need to work out international standards for shore-side electrification and on-board
electrical systems, if shore-power is to become a viable and cost-effective solution for reducing ship’s
air emissions in port.
The IACS has created a working group to discuss shore connections for systems with voltage above 1
kV to 15 kV. Det Norske Veritas (DNV), the American Bureau of Shipping (ABS, a ship classification
society), Bureau Veritas (BV) and Germanischer Lloyd (GL) have delegated experts to this working
group. It is anticipated that in late 2007, the working group will complete the study38.
In addition, ship owners, system and component suppliers, port operators and classification societies
formed a working grouping in 2005 to study the electrical requirements. The working group will
present a draft technical paper by early 2007 to the technical committee of IEC.
The ISO TC 8 Chairman called a working group meeting in Washington, DC, on September 14-15, 2006.
Mr. Fer Van De Laar of the IAPH was instrumental in gaining the Port of Los Angeles' support in
nominating Mr. Eric Caris for the convening of the working group. The development of an
international standard will involve close cooperation between industry, industry associations, and the Ports. The Port of Los Angeles, Port of Long Beach, and the Port of Rotterdam agreed to take a
leading role in this effort. The meeting was attended by 33 industry representatives from around the
world notably Norway, Denmark, Japan, Canada, Germany, Italy, and U.S. as well as the Port of Los
Angeles, Port of Long Beach, Port of Corpus Christi, and Port of Rotterdam. Representatives from the EPA were also present. The purpose for this meeting was to develop a scope and action plan as the first
step to standardizing shore-power system.
Key components in the proposed standardization include: • On-shore installation voltage, frequency and grounding – to deal with different system
frequencies, i.e., 50 Hz vs. 60 Hz, voltage level of 11 kV, lightning protection, short circuit limitation to 16 kA/sec, and interlocking with grounding switch.
• Interconnection systems such as connector and cable specifications – to standardize the plug-and-socket, cable, cable handling system, communication cable, plug-and-socket, communication protocol and interlocking and staff safety issues.
• Easy operation – one person operation.
38 Thomas Hartmann, 2006, “Standardization of Shore Connection System”, presented at the First Pacific Port Clean Air Collaborative International Conference, Los Angeles, CA. December 2006.
32
• On-board installation – protection of the ship’s electrical network. • Covers all categories of ocean-going vessels – container, ro-ro, tanker, bulk, cruise and
ferry ships. • Type and routine tests – type of tests include plug-and-socket, shore connection cable,
and cable handling device, and, routine tests include workshop tests, dock trial and commissioning test for each new port of call.
The ISO TC8/SC3 work group has prepared the preliminary draft including standards such as 60 Hz
frequency; 6.6 kV and 11 kV; and minimum 7.5 MVA, but it does not cover all ship types. The work
group will release pubic available specifications (PAS) in 2007, which represents an agreement between
technical experts in case of urgent market requirements. The next work group meeting will be held in April 2007 at Port of Gothenburg, Sweden.
X. CONCLUSIONS
Generally ocean-going vessels hotelling using shore-power is considered a technically feasible and a
viable solution for some ports, but this technology is relatively capital intensive and operational costs are
high as compared to conventional air emission abatement technologies. With the recent efforts to
develop the international standards for a shore-power system and the potential for providing energy tax incentives, the shore-power program will eventually become an integral part of clean air policy in any
port to reduce overall port-related air emissions. Although shore-power still faces many challenges,
many port authorities and shipping communities have recognized the needs to adopt such programs and
some of them has already implemented them voluntarily. However, it is imperative for ports to adopt a site-specific vessel shore-power program, unless the program is physically and technically not feasible
to implement, then alternative control technologies could be considered. It is also recommended that
the following factors should be carefully reviewed, in addition to technical requirements discussed
earlier, in the selection of shore-power as a vessel air emission control strategy.
Proximity to Local Communities
The ultimate goal for reducing port-related air emissions is to improve local air quality, protect the
environment, and reduce health risks to the adjacent communities. The geographical location of each port is unique, and the distances between a port’s boundary and the local communities vary. For a port
such as the Port of Los Angeles or the Port of Long Beach, where there is no buffer zone between the
local community and the port, risk of health impacts from air emissions from port operations can be high
and, therefore, drastic control measures may be required. In other ports, such as the Port of Rotterdam, implementing shore-power in the near term is not feasible because of concerns of high capital costs; and
the other fact is that the nearby community is located outside of the immediate region of air impact.
33
Geographical Location and Goods Movement Transportation Network
San Pedro Bay Ports are strategically located at the gateway of the western U.S. and have a complete
land-based network to serve as a key import/export center for goods transported in the region. This
provides an incentive for shipping lines to do business with these ports. Therefore, these port authorities are in an advantageous position in discussing with shipping lines the implementation of
cold-ironing programs through their lease negotiations and the ship owners are more inclined to comply.
Other ports in the country may not have such advantage.
Distributions of Vessels Types and Frequency of Vessel Calls
Each port has its unique operation, distribution of marine vessel types, and frequency of vessel calls.
As discussed earlier, the Ports of Los Angeles and Long Beach handle mostly containerized goods;
while the Port of Houston handles a wide variety of goods - general cargo, petroleum and chemical products, and liquefied natural and petroleum gas. Furthermore, frequency of port calls by certain
types of marine vessel should also be carefully analyzed, since there is a direct relationship between
overall cost-effectiveness of a shore-power program and the frequency of vessel calls.
Local Power Supply and Extra Electrical Loads
Abundant local power supply and favorable utility rates are critical to the success of any shore-power
program. Implementation of a shore-power program will add an extra electrical load to a local grid.
In the case of the Port of Los Angeles, the power supply is readily provided by another city proprietary department (DWP). However, other ports may not have similar arrangements and have to rely on a
local commercial power supplier. With the extra electrical load required for a shore-power program,
any port considering implementation of a shore-power program should consult with the local utility
company to analyze potential impacts of the extra loads to the local grid. In some cases, additional generation units and related equipment upgrades may be required to meet the needs.
Costs
Costs involved in the shore-power program can vary widely among ports. Detailed financial and economic analysis of a shore-power program should be conducted to determine a program’s potential
cost-effectiveness. From an air emission reduction perspective, shore-power is many times more
expensive than conventional emission control due to high capital costs required for shore-side and
ship-side infrastructure improvements. Additionally, operational costs should be carefully analyzed to determine whether the cost differences between the use of electrical power and fuel and other emission
control technologies become prohibitive for ship owners. Solutions include financial incentive
programs such as an energy tax waiver or a discount proposed and adopted by European ports to counter
additional operational costs.