Embed Size (px)
Citation preview
Drainage, Hydrology, and Water Quality Analysis Report
for the California Renewable Carbon Williams Production Facility
Colusa County, California
Prepared For:
California Renewable Carbon, LLC
Prepared By:
2525 Warren Drive Rocklin, California 95677
July 2021
Appendix "G"

Drainage, Hydrology, and Water Quality Analysis Report
ECORP Consulting, Inc. California Renewable Carbon Williams Production Facility
ii July 2021
2021-047.01
TABLE OF CONTENTS
1.0 INTRODUCTION ................................................................................................................................................................... 1
2.0 ENVIRONMENTAL SETTING............................................................................................................................................. 4
2.1 Climate .................................................................................................................................................................... 4
2.2 Surface Water ....................................................................................................................................................... 6
2.2.1 Regional Conditions .......................................................................................................................... 6
2.2.2 Site-Specific Conditions ................................................................................................................... 7
2.2.3 Existing Surface Water Quality ................................................................................................... 10
2.3 Groundwater ...................................................................................................................................................... 11
2.3.1 Regional Conditions ....................................................................................................................... 11
2.3.2 Site-Specific Conditions ................................................................................................................ 14
2.3.3 Groundwater Quality ...................................................................................................................... 17
3.0 ANTICIPATED PROJECT CONDITIONS ...................................................................................................................... 19
3.1 Surface Water .................................................................................................................................................... 19
3.2 Groundwater ...................................................................................................................................................... 20
3.3 Project Permit Needs ...................................................................................................................................... 22
3.3.1 Stormwater Management ............................................................................................................ 22
3.3.2 Well Permit ......................................................................................................................................... 23
3.3.3 WDRs and Groundwater Monitoring ....................................................................................... 23
3.3.4 Potable Water System Permit ..................................................................................................... 23
4.0 CEQA EVALUATION CRITERIA...................................................................................................................................... 23
5.0 EVALUATION OF POTENTIAL IMPACTS ................................................................................................................... 24
6.0 CONCLUSION ..................................................................................................................................................................... 27
7.0 REFERENCES CITED .......................................................................................................................................................... 29
LIST OF FIGURES
Figure 1-1. Project Location and Vicinity .................................................................................................................................... 2
Figure 2-1. Annual Rainfall by Water Year Index ..................................................................................................................... 5
Figure 2-2. Mean Daily Discharge on the Sacramento River at Colusa, October 1, 1985 through May 23, 2021........................................................................................................................................................................................... 7
Figure 2-3. FEMA Floodplain Map (FEMA 2021) ...................................................................................................................... 8
Figure 2-4. Colusa Subbasin .......................................................................................................................................................... 12
Figure 2-5. Hydrograph showing effects of drought and non-drought conditions on groundwater levels in the Colusa Subbasin ........................................................................................................................................................ 14
Appendix "G"
Drainage, Hydrology, and Water Quality Analysis Report
ECORP Consulting, Inc. California Renewable Carbon Williams Production Facility
iii July 2021
2021-047.01
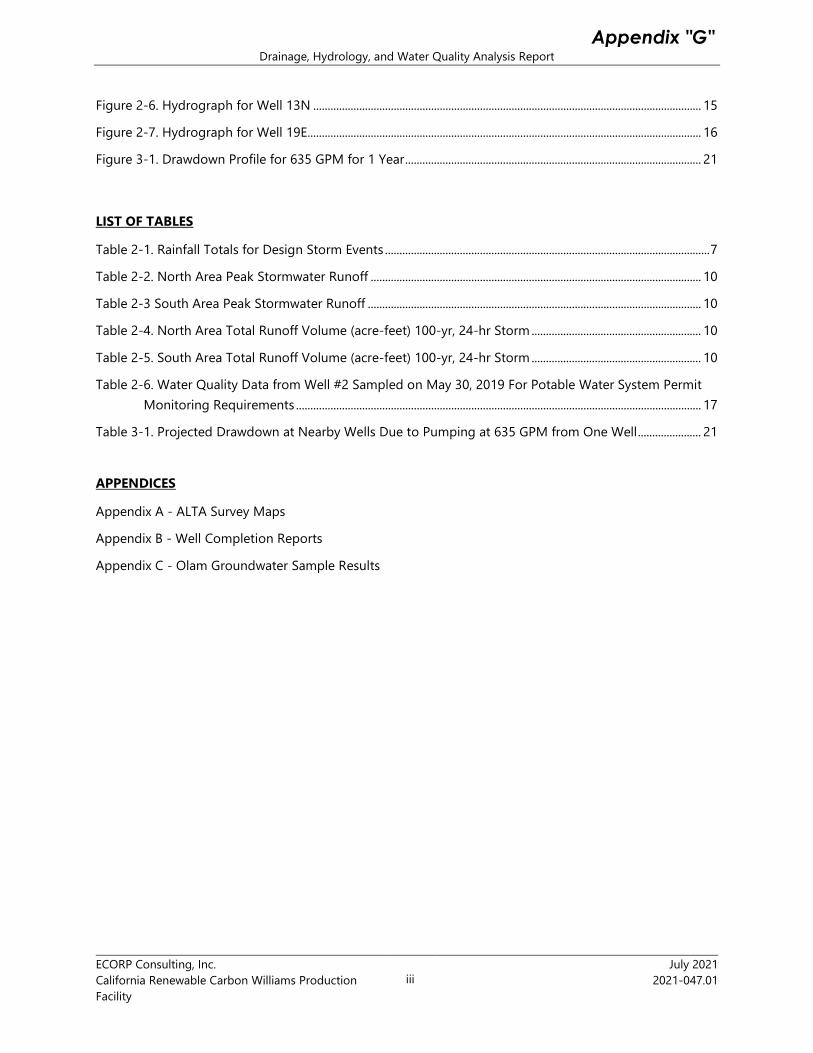
Figure 2-6. Hydrograph for Well 13N ....................................................................................................................................... 15
Figure 2-7. Hydrograph for Well 19E......................................................................................................................................... 16
Figure 3-1. Drawdown Profile for 635 GPM for 1 Year ....................................................................................................... 21
LIST OF TABLES
Table 2-1. Rainfall Totals for Design Storm Events ................................................................................................................. 7
Table 2-2. North Area Peak Stormwater Runoff ................................................................................................................... 10
Table 2-3 South Area Peak Stormwater Runoff .................................................................................................................... 10
Table 2-4. North Area Total Runoff Volume (acre-feet) 100-yr, 24-hr Storm ........................................................... 10
Table 2-5. South Area Total Runoff Volume (acre-feet) 100-yr, 24-hr Storm ........................................................... 10
Table 2-6. Water Quality Data from Well #2 Sampled on May 30, 2019 For Potable Water System Permit Monitoring Requirements ............................................................................................................................................. 17
Table 3-1. Projected Drawdown at Nearby Wells Due to Pumping at 635 GPM from One Well ...................... 21
APPENDICES
Appendix A - ALTA Survey Maps
Appendix B - Well Completion Reports
Appendix C - Olam Groundwater Sample Results
Appendix "G"

Drainage, Hydrology, and Water Quality Analysis Report
ECORP Consulting, Inc. California Renewable Carbon Williams Production Facility
1 July 2021
2021-047.01
1.0 INTRODUCTION
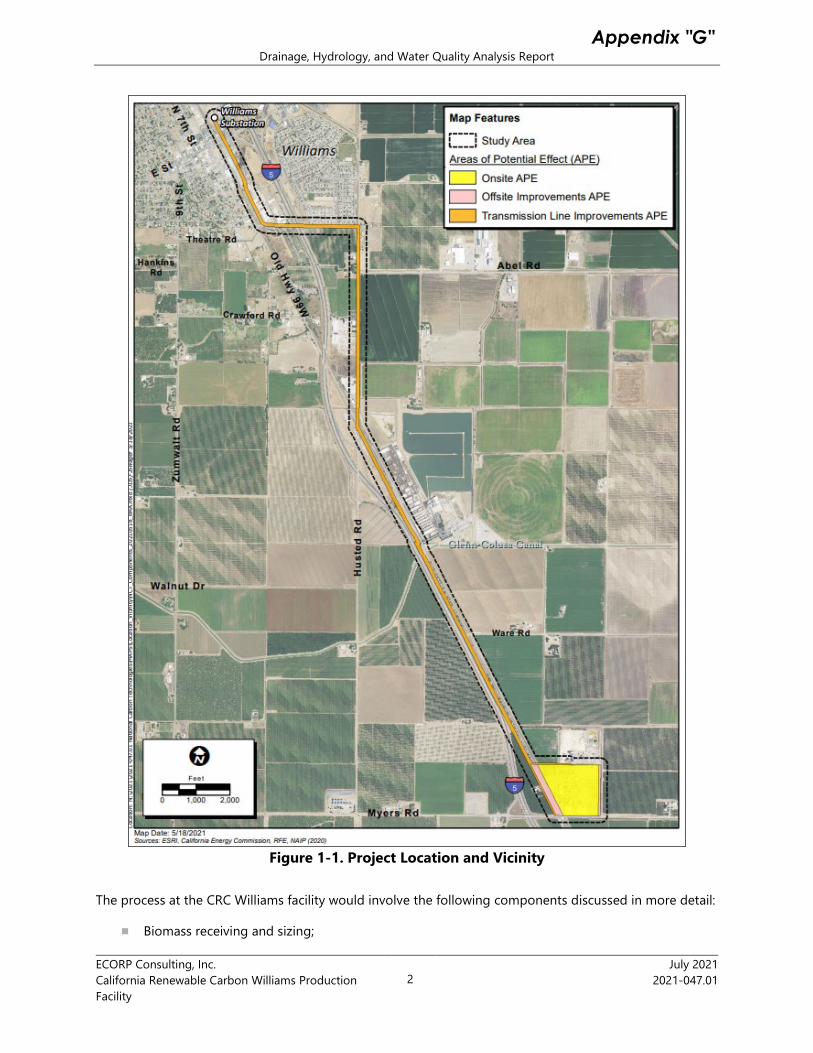
This Drainage, Hydrology and Water Quality Assessment Report has been prepared for California Renewable Carbon, LLC (CRC) for the proposed Williams Production Facility (the “Project”) in Colusa County, California (Figure 1-1). The overall Project entails the installation and operation of a biocarbon production facility using renewable biomass on an existing approximately 49-acre industrial site at 6229 Myers Road in Williams, California.
CRC is a leader in environmental technology with more than 185 issued and pending patents around processes and products engineered to improve the environment. CRC proposes to repurpose an existing facility in Colusa County to construct a new renewable biocarbon production facility. The new facility will use CRC's patented non combustion technology to convert sustainably sourced biomass into renewable biocarbon products. The new facility will use self-generated renewable biogas for process energy as well as generate and export renewable electricity to the grid. The new biocarbon process will be net water positive and carbon negative on a lifecycle basis. The facility also will significantly reduce regional air emissions by thousands of tons per year by converting locally sourced biomass such as orchard rotations and trimmings, that otherwise undergo open burning or land disposal, into renewable biocarbon products. CRC's products will be used to displace fossil-based products and reduce environmental impacts from metals production, energy generation, and crop production, and to purify the air and water. CRC will create more than 65 direct clean-tech jobs working toward environmental improvement.
The Project Site is in unincorporated Colusa County, approximately 1.4 miles south of Williams, California (see Figure 1-1). The site at the northeast corner of the intersection of Myers Road and Frontage Road would be the location of the CRC Williams facility. The site currently accommodates the existing Olam Tomato Processing facility, comprising approximately 161,000 square feet of existing buildings, an existing rail spur, and two existing water wells, as shown on the Site Plan for the Project dated June 30, 2021. The site is bound by the Wadham Energy Company facility just north of the Project Site with agricultural lands north of the Wadham facility, and agricultural land and residences to the east and south. The Union Pacific Railroad (UPRR) tracks and Frontage Road run west of the site then Interstate-5 (I-5) further west. Orchard land with a single-family residence on a parcel zoned for Heavy Industrial (M-2) is located between Frontage Road and I-5 approximately 150 feet from the western boundary of the site. The site is located approximately 1,000 feet (0.3 mile) from I-5.
The purpose of the Project is to use renewable biomass, primarily in the form of orchard rotations and trimmings, to produce a biocarbon product using a net water positive, non-combustion process involving thermal conversion of biomass. The process will use self-generated biogas for process energy and will provide net electric power for export sale to Pacific Gas and Electric (PG&E) through interconnection to either a PG&E 12 kilovolt (kV) distribution line or PG&E’s Wadham 60 kV power line to PG&E’s Williams Generating Station. The project will also include improvements to, and extension of, an existing rail spur system on the property which interconnects with the Union Pacific Railroad tracks adjacent to the property.
Appendix "G"
Drainage, Hydrology, and Water Quality Analysis Report
ECORP Consulting, Inc. California Renewable Carbon Williams Production Facility
2 July 2021
2021-047.01
Figure 1-1. Project Location and Vicinity
The process at the CRC Williams facility would involve the following components discussed in more detail:
Biomass receiving and sizing;
Appendix "G"
Drainage, Hydrology, and Water Quality Analysis Report
ECORP Consulting, Inc. California Renewable Carbon Williams Production Facility
3 July 2021
2021-047.01
Biomass drying;
Non-combustion thermal conversion;
Pelletizing;
Pellet finishing and shipping; and
Cogeneration.
CRC would utilize all existing buildings onsite and would construct several smaller support structures for the process. A new paved access road into the northeast corner of the facility would be constructed as well as a new drainage basin and other drainage improvements. New process equipment, tanks, pipe bridges, and conveyor belts would be installed outdoors in the central portion of the site in and around existing buildings.
The Project would involve improvements to, and extension of, an existing rail spur system on the property that interconnects to the UPRR tracks that run adjacent to the Project Site and along I-5. Improvements to the existing rail spur may involve improvements to the rail spur track (i.e., new ballast, ties, rail), signal improvements, and/or improvements to utility lines along the rail spur (electrical lines, fiber optic lines, etc.). Improvements to the UPRR tracks may be requested by UPRR, including potentially new ballast, ties, rail, and/or signal or utility line improvements on or near the UPRR tracks. Extension of the rail spur is also proposed along the eastern boundary of the CRC Williams facility property. New track, signal facilities, and utility lines will be installed in this area in support of the rail spur. Finally, a new rail spur loadout area would be constructed adjacent to the new rail spur.
Biogas from the process would be used in a new cogeneration system for generation of electricity. The process would provide net electric power for export sale to PG&E through interconnection to either PG&E’s Williams 1101 12 kV distribution line or PG&E’s Wadham 60 kV power line to PG&E’s Williams Generating Station. Both existing lines are located on the same power poles along Frontage Road running north to the PG&E Williams Generating Station in Williams. It is assumed that PG&E will require reconductoring along this route and may require replacement of some or all of the power poles along this route. For interconnection to the 12 kV distribution line, a new transformer or circuit breaker may be required at the PG&E Williams Generating Station (within the station facility). Alternatively, for interconnection to the Wadham 60 kV power line, a new 60 kV gentie line would be required on the CRC Williams facility that would interconnect with the Wadham 60 kV line with a new three-breaker ring bus that would be located on the northwest corner of the CRC Williams facility. Improvements at the Williams Generation Station are not anticipated for interconnection to the 60 kV power line.
Grading would be required for new foundations, for paving of the new internal access roads, and drainage improvements on the CRC Williams facility. Construction at the CRC Williams facility, including offsite improvements required for the interconnection to PG&E’s electrical system and any improvements to the interconnection to the UPRR tracks, is expected to take 14 months to complete using approximately 42 construction workers.
The CRC Williams facility can process up to 750,000 gross wet tons of renewable feedstock per year. The source locations for renewable feedstock would primarily comprise orchards in the region, and primarily
Appendix "G"
Drainage, Hydrology, and Water Quality Analysis Report
ECORP Consulting, Inc. California Renewable Carbon Williams Production Facility
4 July 2021
2021-047.01
within Colusa County. Approximately 125 heavy truck trips per day would be utilized to deliver renewable feedstock to the CRC Williams facility. Source locations for the renewable feedstock are expected to be primarily within 75 miles of the CRC Williams facility. Heavy trucks would utilize local area roadways to access I-5, to travel either north or south along I-5 to the CRC Williams facility. Heavy trucks would either utilize the I-5/Husted Road interchange to then travel southbound on the two-lane Frontage Road to the facility or utilize the I-5/Hahn Road interchange to travel northbound on the two-lane Frontage Road to the facility.
Rail cars would be loaded with biocarbon product at the proposed rail car loadout area. A new electric switching locomotive would be utilized on the property to move cars along the rail spur system. Approximately 50 rail cars per week would be utilized to transport biocarbon product on UPRR tracks to one or more major ports in California and/or Oregon for ultimate transport of the biocarbon product via Handymax class vessels.
2.0 ENVIRONMENTAL SETTING
The evaluations presented in this report are consistent with the California Environmental Quality Act (CEQA) Guidelines, Appendix G, as modified on December 28, 2018. The environmental setting consists of the existing hydrologic conditions in the region and at the Project site. Existing conditions are described below for both surface water and groundwater, and for water quality. The existing conditions define the baseline for the evaluation of potential environmental impacts. In Section 5.0, the identified baseline conditions are compared with the anticipated Project effects discussed in Section 3.0 to assess the level of significance of any potential impacts.
2.1 Climate
The Project site is in the western part of the Sacramento Valley. The Sacramento Valley has a Mediterranean climate with cool, wet winters and hot, dry summers. Regionally, temperature and precipitation vary with elevation, with the lower temperatures and higher precipitation typically occurring at higher elevations.
The nearest meteorological station to the Project site from which long-term precipitation data are available is the Colusa 2SSW station, located 7.5 miles to the northeast. This location is also designated as Station 041948 as part of the National Weather Service Cooperative Network (WRCC 2021). The average annual high temperature is 75 degrees Fahrenheit (deg F) but monthly average high temperatures can range from 54 deg F in January to 95 deg F in July. The average annual low temperature is 48 deg F, with monthly average low temperatures ranging from 37 degrees in January and December to 59 degrees in July.
Rainfall data are available from October 1948 through April 2021 from the Colusa 2SSW station. In the discussions in this report, the rainfall data are presented for a water year. A water year in this region of California begins on October 1 and extends through September 30 of the subsequent calendar year. A water year better represents rainfall and hydrologic patterns than a calendar year does. In the discussions
Appendix "G"

Drainage, Hydrology, and Water Quality Analysis Report
ECORP Consulting, Inc. California Renewable Carbon Williams Production Facility
5 July 2021
2021-047.01
below, water years are designated by the year in which they end. For example, the 2019 water year began on October 1, 2018 and ended on September 30, 2019.
The average annual rainfall from 1949 to 2021 is 15.58 inches. Figure 2-1 presents the annual water year rainfall based on the Sacramento Valley Water Year Hydrologic Classification Index (DWR 2021b). This index was developed based on total discharge through the Sacramento River system. However, for this analysis, it has been applied specifically to the water year rainfall (see ECORP 2021 for additional details).
As shown on Figure 2-1, the two wettest years on record were 1995 and 1998, with 32.78 inches and 32.75 inches of rain, respectively. The driest complete water year was 1976, with 5.51 inches of rain. While the 2021 water year is not yet complete, the total rainfall through April 30 has been 5.31 inches. If no significant additional precipitation occurs this water year, then 2021 will be the driest year on record. As can be seen on Figure 2-1, multi-year periods of below normal rainfall occurred from 1987 through 1991, 2007 through 2009, 2012 through 20161, and 2020 through 2021. In contrast, wet periods with three or more successive years of above normal rainfall only occurred twice since 1949, from 1982 to 1984 and from 2002 to 2006.
Figure 2-1. Annual Rainfall by Water Year Index
1 While insufficient data are available from the Colusa 2SSW station for 2012 and 2013, data from other sources confirms that these were below normal years.
0
5
10
15
20
25
30
35
1949
1952
1955
1958
1961
1964
1967
1970
1973
1976
1979
1982
1985
1988
1991
1994
1997
2000
2003
2006
2009
2012
2015
2018
2021
Wat
er Y
ear R
ainf
all (
inch
es)
Wet Above Normal Below Normal Dry Critical Average
Appendix "G"
Drainage, Hydrology, and Water Quality Analysis Report
ECORP Consulting, Inc. California Renewable Carbon Williams Production Facility
6 July 2021
2021-047.01
2.2 Surface Water
This section describes the environmental setting, or existing conditions, related to surface water, including both surface water occurrence and surface water quality.
2.2.1 Regional Conditions
The Project site is located in the western part of the Sacramento Valley (referred to below as the “valley”). There are two primary natural waterways that affect the hydrology of the western part of the valley, the Sacramento River and Stony Creek. Many smaller intermittent streams drain the foothills that abut the Coast Ranges west of the Sacramento Valley.
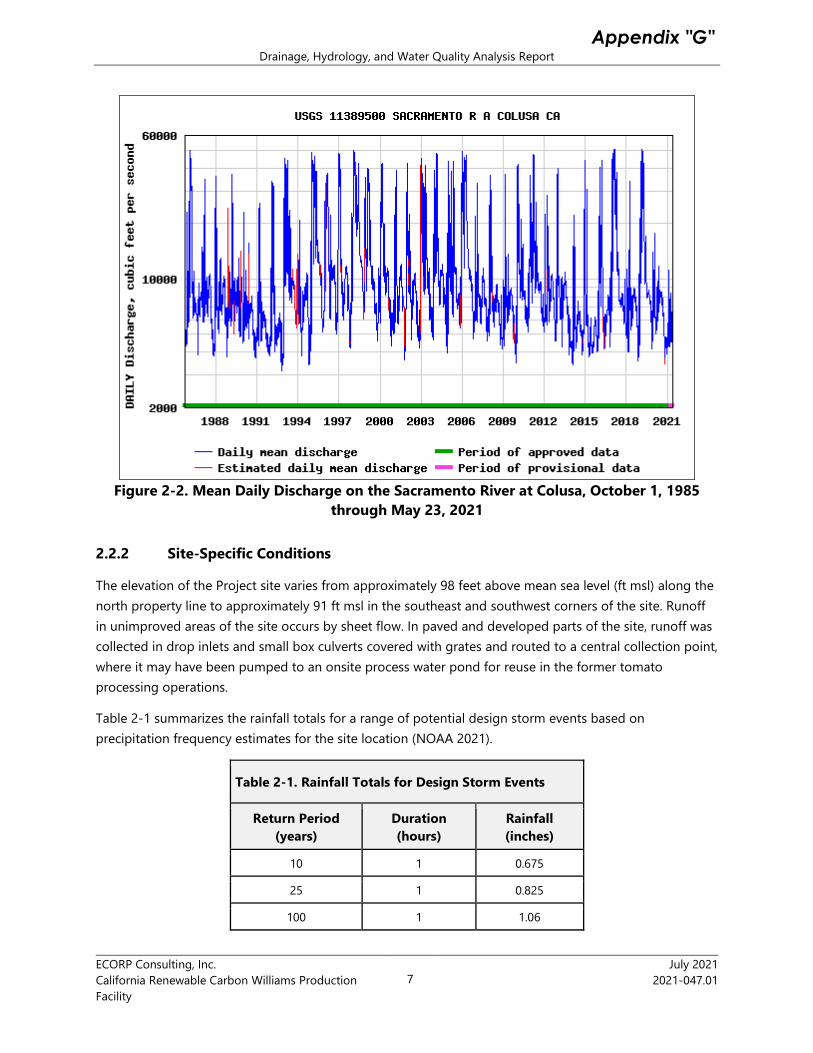
The Sacramento River flows north to south along the center of the valley. The Sacramento River provides approximately 80 percent of the inflow to the Sacramento-San Joaquin Delta and is the largest and most important riverine ecosystem in the State of California (DWR 2009). The Sacramento River is also the primary surface water source for irrigation water suppliers on the west side of the valley. Mean daily stream flows on the Sacramento River at Colusa have ranged from less than 4,000 cfs to over 50,000 cfs since 1985, as depicted on Figure 2-2 (USGS 2021). Flows on the Sacramento River also generally vary consistent with the wet and dry climatic periods described in Section 2.1, above. The total drainage area of the Sacramento River above Colusa is over 12,000 square miles.
The Upper Stony Creek watershed drains an approximately 770 square mile area of the Coast Range, foothills, and uplands, most of which is west of the Sacramento Valley.
There are also several major water conveyance features that deliver water to and remove excess drainage from agricultural lands in the western part of the valley, referred to as the Tehama-Colusa Canal, the Glenn-Colusa Canal, and the Colusa Basin Drainage Canal system, otherwise known as the Colusa Basin Drain. Smaller canal and channel systems transport water between the natural waterways and conveyance structures.
Appendix "G"
Drainage, Hydrology, and Water Quality Analysis Report
ECORP Consulting, Inc. California Renewable Carbon Williams Production Facility
7 July 2021
2021-047.01
Figure 2-2. Mean Daily Discharge on the Sacramento River at Colusa, October 1, 1985
through May 23, 2021
2.2.2 Site-Specific Conditions
The elevation of the Project site varies from approximately 98 feet above mean sea level (ft msl) along the north property line to approximately 91 ft msl in the southeast and southwest corners of the site. Runoff in unimproved areas of the site occurs by sheet flow. In paved and developed parts of the site, runoff was collected in drop inlets and small box culverts covered with grates and routed to a central collection point, where it may have been pumped to an onsite process water pond for reuse in the former tomato processing operations.
Table 2-1 summarizes the rainfall totals for a range of potential design storm events based on precipitation frequency estimates for the site location (NOAA 2021).
Table 2-1. Rainfall Totals for Design Storm Events
Return Period (years)
Duration (hours)
Rainfall (inches)
10 1 0.675
25 1 0.825
100 1 1.06
Appendix "G"
Drainage, Hydrology, and Water Quality Analysis Report
ECORP Consulting, Inc. California Renewable Carbon Williams Production Facility
8 July 2021
2021-047.01
10 24 2.97
25 24 3.56
100 24 4.48
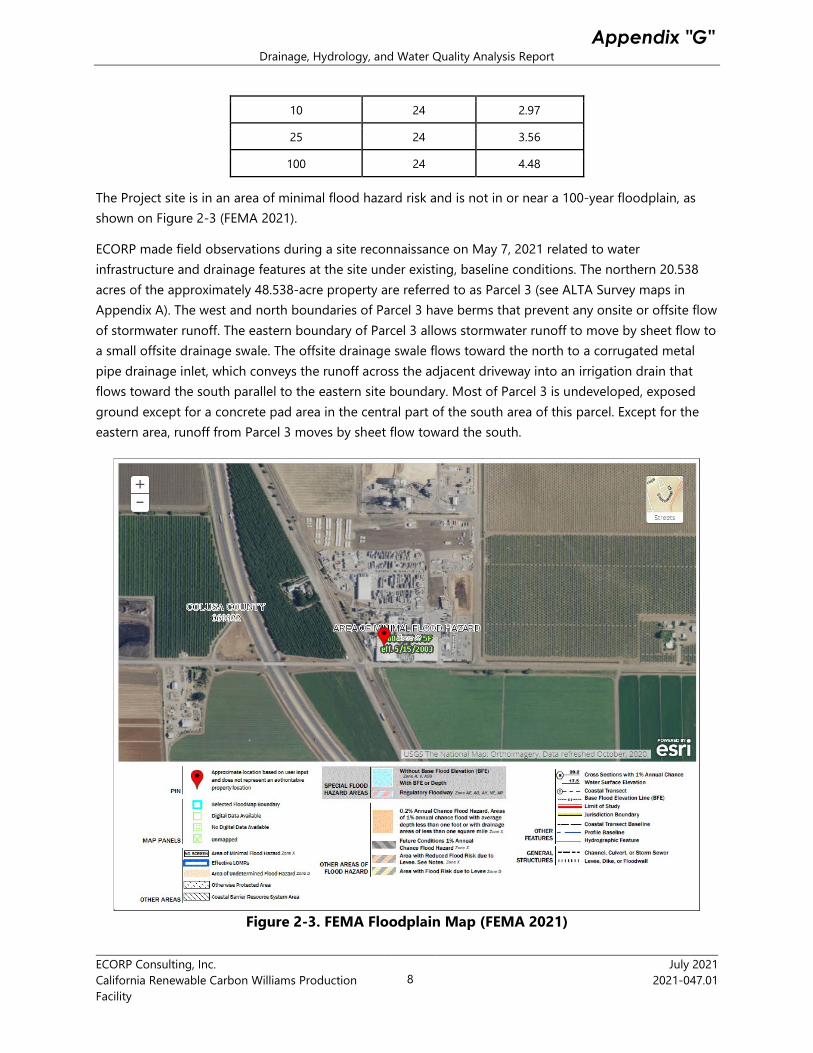
The Project site is in an area of minimal flood hazard risk and is not in or near a 100-year floodplain, as shown on Figure 2-3 (FEMA 2021).
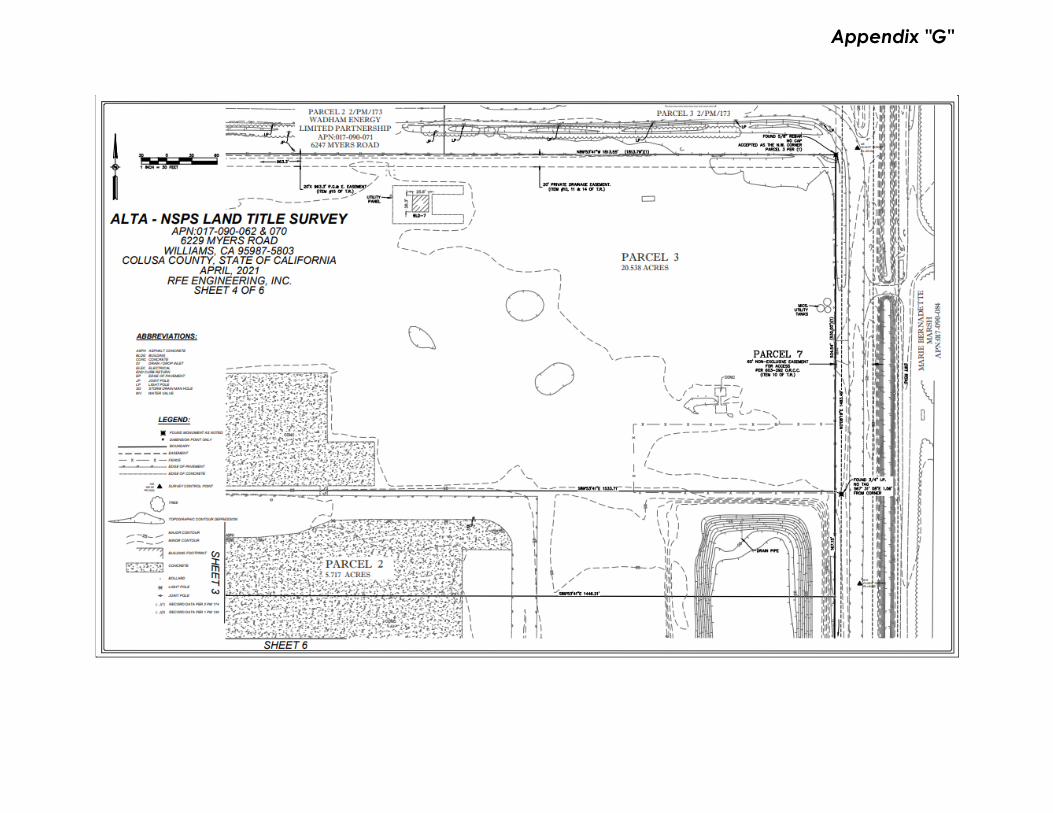
ECORP made field observations during a site reconnaissance on May 7, 2021 related to water infrastructure and drainage features at the site under existing, baseline conditions. The northern 20.538 acres of the approximately 48.538-acre property are referred to as Parcel 3 (see ALTA Survey maps in Appendix A). The west and north boundaries of Parcel 3 have berms that prevent any onsite or offsite flow of stormwater runoff. The eastern boundary of Parcel 3 allows stormwater runoff to move by sheet flow to a small offsite drainage swale. The offsite drainage swale flows toward the north to a corrugated metal pipe drainage inlet, which conveys the runoff across the adjacent driveway into an irrigation drain that flows toward the south parallel to the eastern site boundary. Most of Parcel 3 is undeveloped, exposed ground except for a concrete pad area in the central part of the south area of this parcel. Except for the eastern area, runoff from Parcel 3 moves by sheet flow toward the south.
Figure 2-3. FEMA Floodplain Map (FEMA 2021)
Appendix "G"
Drainage, Hydrology, and Water Quality Analysis Report
ECORP Consulting, Inc. California Renewable Carbon Williams Production Facility
9 July 2021
2021-047.01
The central 5.717 acres of the property are referred to as Parcel 2. A berm is present along the western boundary of Parcel 2, which prevents onsite or offsite flow of stormwater runoff. The eastern boundary of Parcel 2 includes the northern part of a wastewater pond. The berms for the wastewater pond extend approximately five feet above the natural grade. Runoff from the east berm of the pond flows into the shallow drainage swale that directs stormwater to the north toward the drainage inlet described above. The central part of Parcel 2 includes concrete pads and a large warehouse building. There are several drainage inlets and drainage culverts associated with the concrete pads and building that are reported to convey stormwater to a sump in the eastern part of Parcel 1 (RWQCB 2018). Stormwater from undeveloped areas of Parcel 2 flows by sheet flow primarily to the south.
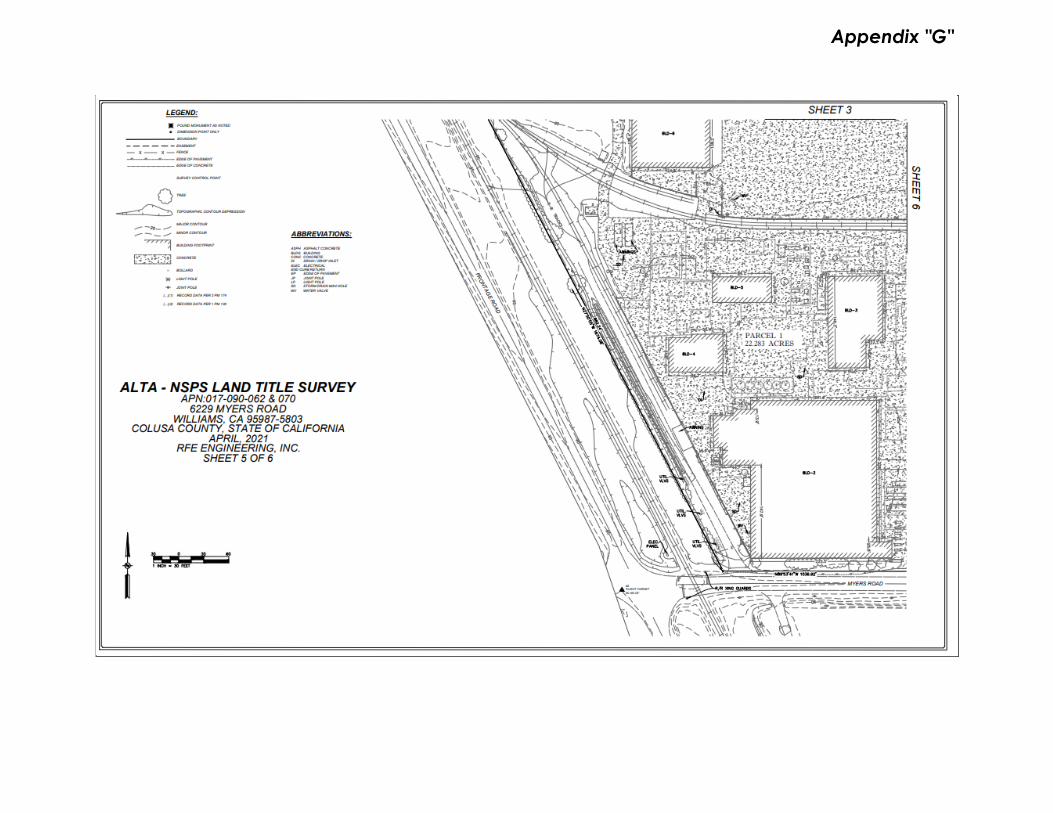
The southern 22.283 acres of the property are referred to as Parcel 1. The western two-thirds of this parcel consists of the former tomato processing plant equipment, a rail spur, and related facilities. This part of Parcel 1 is paved and contains numerous buildings. Stormwater is collected in several drainage inlets and culverts that reportedly convey the runoff to a sump in the eastern part of the parcel (RWQCB 2018). Runoff from the paved plant area along the south boundary of the site flows offsite onto Myers Road. The eastern part of Parcel 1 includes the southern part of the former wastewater sump and a gravel parking lot that overlies a septic leach field. Runoff from the east berm of the pond and the gravel parking lot is conveyed by sheet flow to a shallow drainage swale just east of the property boundary that flows south along a paved driveway to Myers Road. There was no apparent drainage inlet or other collection or conveyance feature observed at the south end of this shallow drainage swale.
According to RWQCB (2018), the former wastewater pond has a 12-inch low-permeability liner constructed from a 50 percent mixture of imported clay and native onsite soil. With two feet of freeboard, the pond has a reported capacity of 2.7 million gallons (approximately 8.25 acre-feet). The freeboard space has an additional volume capacity of approximately 3.1 acre-feet. An inactive pumping station and pipelines to discharge water to and pump water from the wastewater pond are present at the site. As described above, the berm surrounding the pond is approximately five feet higher than the surrounding native ground elevation. The bottom of the pond is approximately six feet below the surrounding native ground elevation.
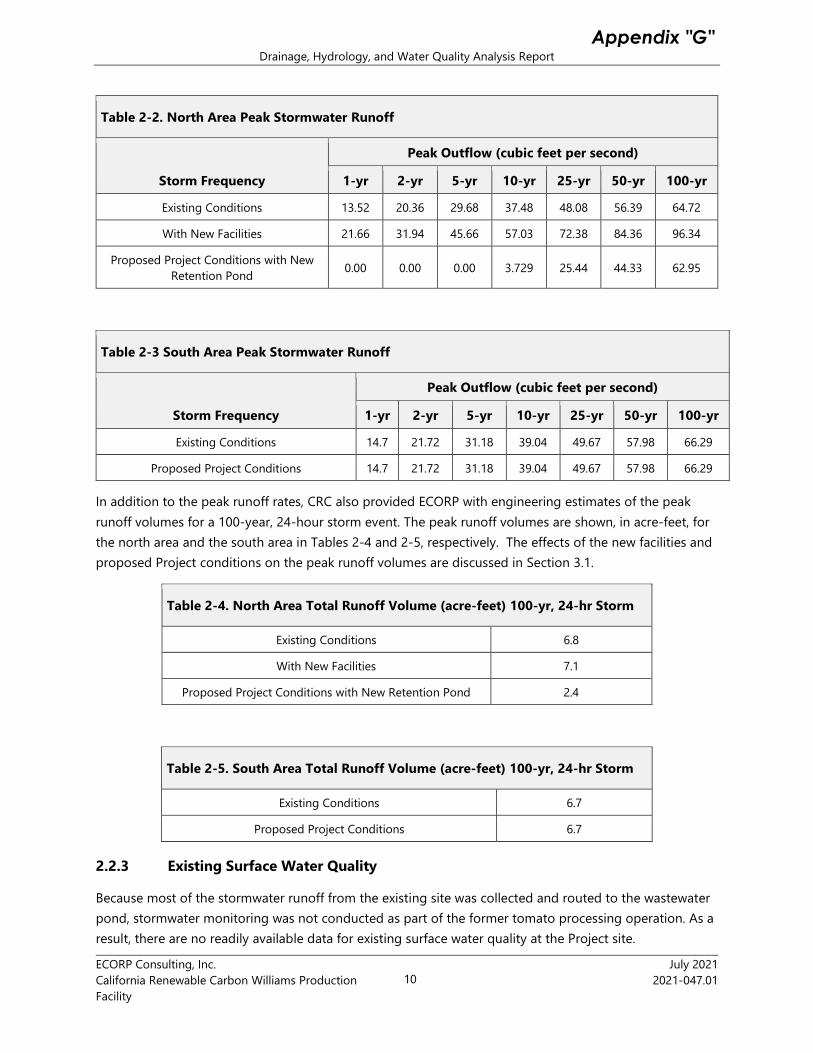
The facilities to be installed as part of the Project would combine the Parcel 2 and Parcel 3 areas into the north area of the site while Parcel 1 would constitute the south area of the site with respect to stormwater runoff. CRC has provided ECORP with estimates prepared by an engineering consultant for peak stormwater flows for various design storm events and the runoff volume for a 100-year, 24-hour storm event. Table -2-2 summarizes the peak runoff rates, in cubic feet per second, provided by CRC for the north part of the Project site. Table 2-3 summarizes the peak runoff rates, in cubic feet per second, for the south part of the site. In general, the peak runoff for a 100-year storm is twice that for the 10-year event for each parcel.
The effects of the new facilities and proposed Project conditions on the peak runoff rates are discussed in Section 3.1.
Appendix "G"
Drainage, Hydrology, and Water Quality Analysis Report
ECORP Consulting, Inc. California Renewable Carbon Williams Production Facility
10 July 2021
2021-047.01
Table 2-2. North Area Peak Stormwater Runoff
Storm Frequency
Peak Outflow (cubic feet per second)
1-yr 2-yr 5-yr 10-yr 25-yr 50-yr 100-yr
Existing Conditions 13.52 20.36 29.68 37.48 48.08 56.39 64.72
With New Facilities 21.66 31.94 45.66 57.03 72.38 84.36 96.34
Proposed Project Conditions with New Retention Pond 0.00 0.00 0.00 3.729 25.44 44.33 62.95
Table 2-3 South Area Peak Stormwater Runoff
Storm Frequency
Peak Outflow (cubic feet per second)
1-yr 2-yr 5-yr 10-yr 25-yr 50-yr 100-yr
Existing Conditions 14.7 21.72 31.18 39.04 49.67 57.98 66.29
Proposed Project Conditions 14.7 21.72 31.18 39.04 49.67 57.98 66.29
In addition to the peak runoff rates, CRC also provided ECORP with engineering estimates of the peak runoff volumes for a 100-year, 24-hour storm event. The peak runoff volumes are shown, in acre-feet, for the north area and the south area in Tables 2-4 and 2-5, respectively. The effects of the new facilities and proposed Project conditions on the peak runoff volumes are discussed in Section 3.1.
Table 2-4. North Area Total Runoff Volume (acre-feet) 100-yr, 24-hr Storm
Existing Conditions 6.8
With New Facilities 7.1
Proposed Project Conditions with New Retention Pond 2.4
Table 2-5. South Area Total Runoff Volume (acre-feet) 100-yr, 24-hr Storm
Existing Conditions 6.7
Proposed Project Conditions 6.7
2.2.3 Existing Surface Water Quality
Because most of the stormwater runoff from the existing site was collected and routed to the wastewater pond, stormwater monitoring was not conducted as part of the former tomato processing operation. As a result, there are no readily available data for existing surface water quality at the Project site.
Appendix "G"
Drainage, Hydrology, and Water Quality Analysis Report
ECORP Consulting, Inc. California Renewable Carbon Williams Production Facility
11 July 2021
2021-047.01
2.3 Groundwater
This section describes the environmental setting, or existing conditions, related to groundwater, including both groundwater occurrence and groundwater quality.
2.3.1 Regional Conditions
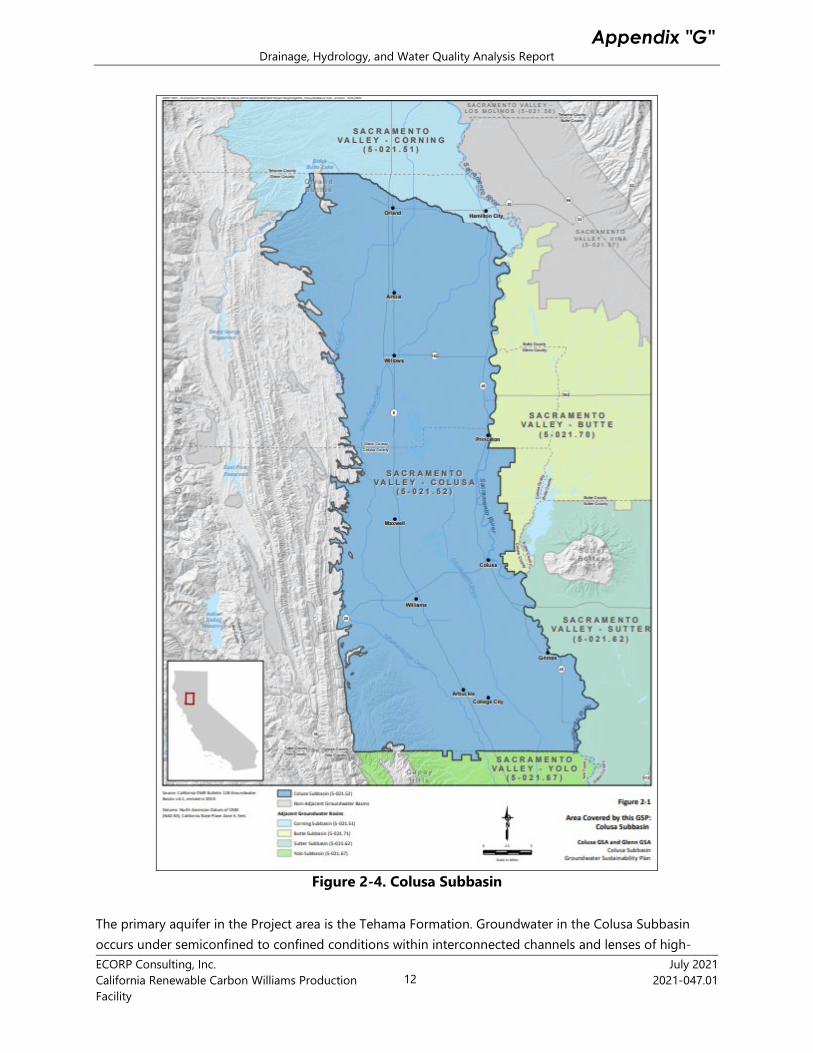
The proposed CRC Williams Facility is located within the Colusa Subbasin within the larger Sacramento Valley Groundwater Basin. The Colusa Subbasin is designated as basin number 5-021.52 by the California Department of Water Resources (DWR 2006). The subbasin area is shown on Figure 2-4. The basin encompasses most of Colusa and Glenn Counties east of the Coast Ranges and west of the Sacramento River, with an area of approximately 1,131 square miles, or 723,823 acres (Colusa GSA and Glenn GSA 2021). The bottom of the subbasin is defined either by crystalline bedrock or the base of freshwater, below which saline water is present in the porous sediments that make up the groundwater aquifers.
Appendix "G"
Drainage, Hydrology, and Water Quality Analysis Report
ECORP Consulting, Inc. California Renewable Carbon Williams Production Facility
12 July 2021
2021-047.01
Figure 2-4. Colusa Subbasin
The primary aquifer in the Project area is the Tehama Formation. Groundwater in the Colusa Subbasin occurs under semiconfined to confined conditions within interconnected channels and lenses of high-
Appendix "G"
Drainage, Hydrology, and Water Quality Analysis Report
ECORP Consulting, Inc. California Renewable Carbon Williams Production Facility
13 July 2021
2021-047.01
permeability sand and gravel interbedded with thick low-permeability sediments such as silts and clays (Colusa GSA and Glenn GSA 2021). While there are no defined continuous aquitard units within the subbasin, the fine-grained sediments tend to impede vertical movement of groundwater and may limit deep recharge of the channels and lenses of coarser sediments that comprise the water-bearing aquifer deposits.
Based on groundwater contour maps provided in the draft Groundwater Sustainability Plan (GSP) (Appendix 3B in Colusa GSA and Glenn GSA 2021), groundwater in the subbasin generally flows eastward from the edge of the Coast Ranges on the west toward the Sacramento River on the east, and from north to south parallel to the Sacramento River.
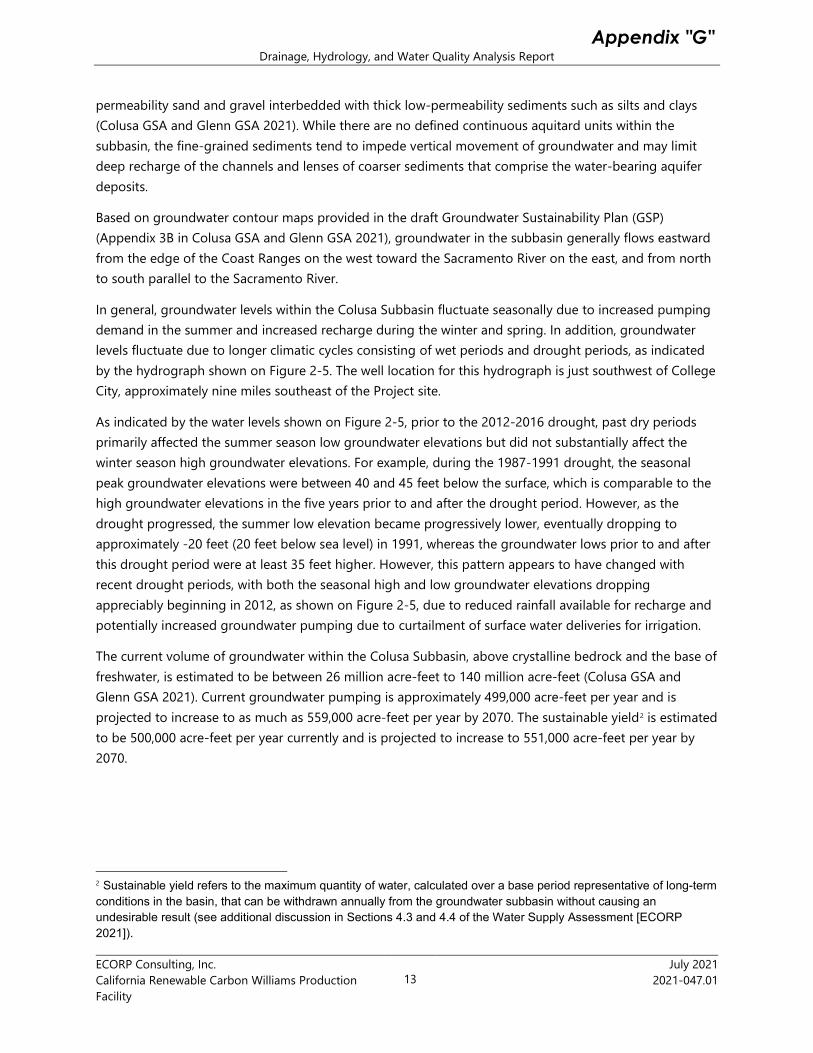
In general, groundwater levels within the Colusa Subbasin fluctuate seasonally due to increased pumping demand in the summer and increased recharge during the winter and spring. In addition, groundwater levels fluctuate due to longer climatic cycles consisting of wet periods and drought periods, as indicated by the hydrograph shown on Figure 2-5. The well location for this hydrograph is just southwest of College City, approximately nine miles southeast of the Project site.
As indicated by the water levels shown on Figure 2-5, prior to the 2012-2016 drought, past dry periods primarily affected the summer season low groundwater elevations but did not substantially affect the winter season high groundwater elevations. For example, during the 1987-1991 drought, the seasonal peak groundwater elevations were between 40 and 45 feet below the surface, which is comparable to the high groundwater elevations in the five years prior to and after the drought period. However, as the drought progressed, the summer low elevation became progressively lower, eventually dropping to approximately -20 feet (20 feet below sea level) in 1991, whereas the groundwater lows prior to and after this drought period were at least 35 feet higher. However, this pattern appears to have changed with recent drought periods, with both the seasonal high and low groundwater elevations dropping appreciably beginning in 2012, as shown on Figure 2-5, due to reduced rainfall available for recharge and potentially increased groundwater pumping due to curtailment of surface water deliveries for irrigation.
The current volume of groundwater within the Colusa Subbasin, above crystalline bedrock and the base of freshwater, is estimated to be between 26 million acre-feet to 140 million acre-feet (Colusa GSA and Glenn GSA 2021). Current groundwater pumping is approximately 499,000 acre-feet per year and is projected to increase to as much as 559,000 acre-feet per year by 2070. The sustainable yield2 is estimated to be 500,000 acre-feet per year currently and is projected to increase to 551,000 acre-feet per year by 2070.
2 Sustainable yield refers to the maximum quantity of water, calculated over a base period representative of long-term conditions in the basin, that can be withdrawn annually from the groundwater subbasin without causing an undesirable result (see additional discussion in Sections 4.3 and 4.4 of the Water Supply Assessment [ECORP 2021]).
Appendix "G"
Drainage, Hydrology, and Water Quality Analysis Report
ECORP Consulting, Inc. California Renewable Carbon Williams Production Facility
14 July 2021
2021-047.01
Figure 2-5. Hydrograph showing effects of drought and non-drought conditions on
groundwater levels in the Colusa Subbasin
2.3.2 Site-Specific Conditions
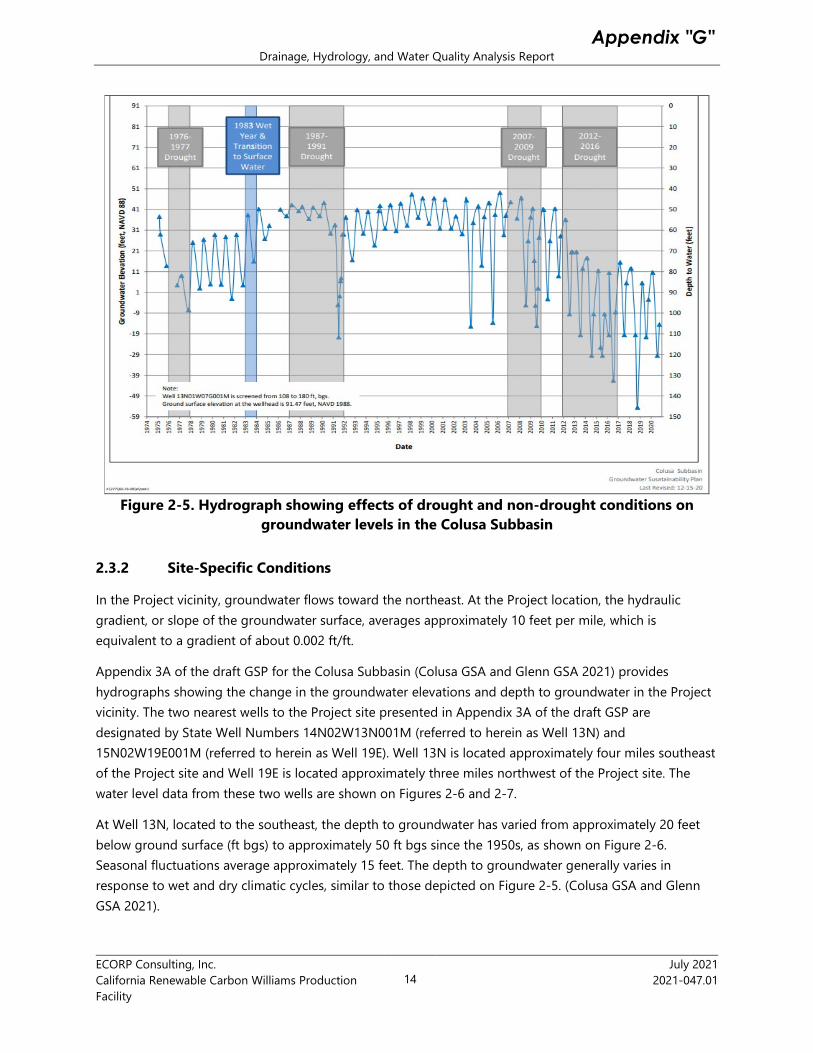
In the Project vicinity, groundwater flows toward the northeast. At the Project location, the hydraulic gradient, or slope of the groundwater surface, averages approximately 10 feet per mile, which is equivalent to a gradient of about 0.002 ft/ft.
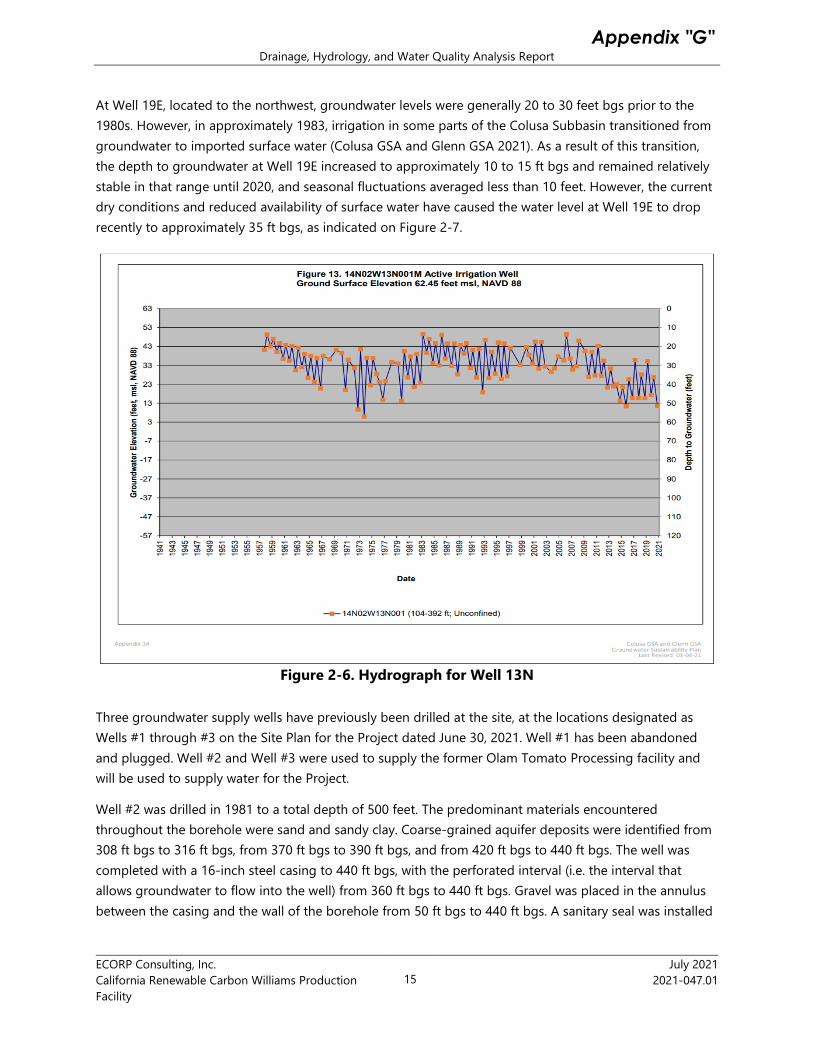
Appendix 3A of the draft GSP for the Colusa Subbasin (Colusa GSA and Glenn GSA 2021) provides hydrographs showing the change in the groundwater elevations and depth to groundwater in the Project vicinity. The two nearest wells to the Project site presented in Appendix 3A of the draft GSP are designated by State Well Numbers 14N02W13N001M (referred to herein as Well 13N) and 15N02W19E001M (referred to herein as Well 19E). Well 13N is located approximately four miles southeast of the Project site and Well 19E is located approximately three miles northwest of the Project site. The water level data from these two wells are shown on Figures 2-6 and 2-7.
At Well 13N, located to the southeast, the depth to groundwater has varied from approximately 20 feet below ground surface (ft bgs) to approximately 50 ft bgs since the 1950s, as shown on Figure 2-6. Seasonal fluctuations average approximately 15 feet. The depth to groundwater generally varies in response to wet and dry climatic cycles, similar to those depicted on Figure 2-5. (Colusa GSA and Glenn GSA 2021).
Appendix "G"
Drainage, Hydrology, and Water Quality Analysis Report
ECORP Consulting, Inc. California Renewable Carbon Williams Production Facility
15 July 2021
2021-047.01
At Well 19E, located to the northwest, groundwater levels were generally 20 to 30 feet bgs prior to the 1980s. However, in approximately 1983, irrigation in some parts of the Colusa Subbasin transitioned from groundwater to imported surface water (Colusa GSA and Glenn GSA 2021). As a result of this transition, the depth to groundwater at Well 19E increased to approximately 10 to 15 ft bgs and remained relatively stable in that range until 2020, and seasonal fluctuations averaged less than 10 feet. However, the current dry conditions and reduced availability of surface water have caused the water level at Well 19E to drop recently to approximately 35 ft bgs, as indicated on Figure 2-7.
Figure 2-6. Hydrograph for Well 13N
Three groundwater supply wells have previously been drilled at the site, at the locations designated as Wells #1 through #3 on the Site Plan for the Project dated June 30, 2021. Well #1 has been abandoned and plugged. Well #2 and Well #3 were used to supply the former Olam Tomato Processing facility and will be used to supply water for the Project.
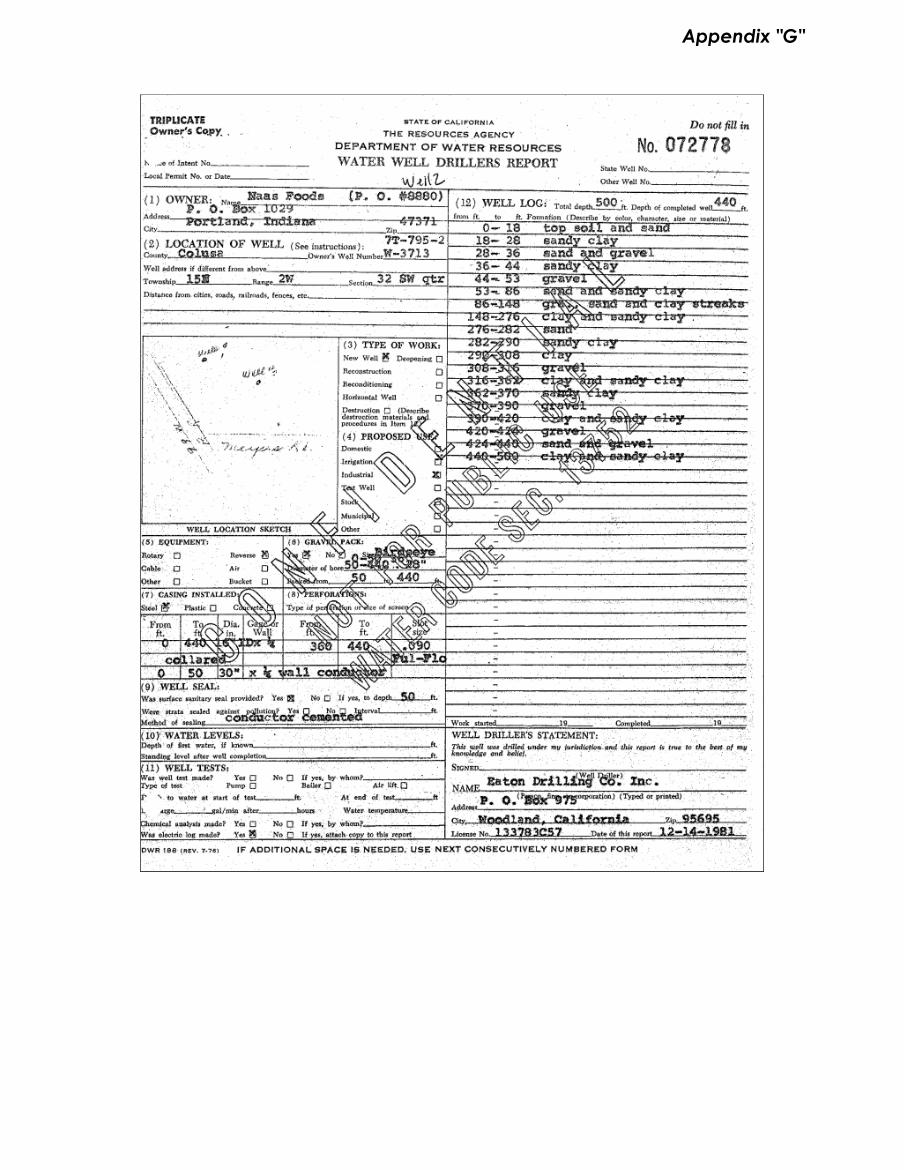
Well #2 was drilled in 1981 to a total depth of 500 feet. The predominant materials encountered throughout the borehole were sand and sandy clay. Coarse-grained aquifer deposits were identified from 308 ft bgs to 316 ft bgs, from 370 ft bgs to 390 ft bgs, and from 420 ft bgs to 440 ft bgs. The well was completed with a 16-inch steel casing to 440 ft bgs, with the perforated interval (i.e. the interval that allows groundwater to flow into the well) from 360 ft bgs to 440 ft bgs. Gravel was placed in the annulus between the casing and the wall of the borehole from 50 ft bgs to 440 ft bgs. A sanitary seal was installed
Appendix "G"

Drainage, Hydrology, and Water Quality Analysis Report
ECORP Consulting, Inc. California Renewable Carbon Williams Production Facility
16 July 2021
2021-047.01
to a depth of 50 ft bgs. The depth to water and the production capacity of Well #2 were not reported at the time the well was drilled. The Well Completion Report for Well #2 is provided in Appendix B.
Figure 2-7. Hydrograph for Well 19E
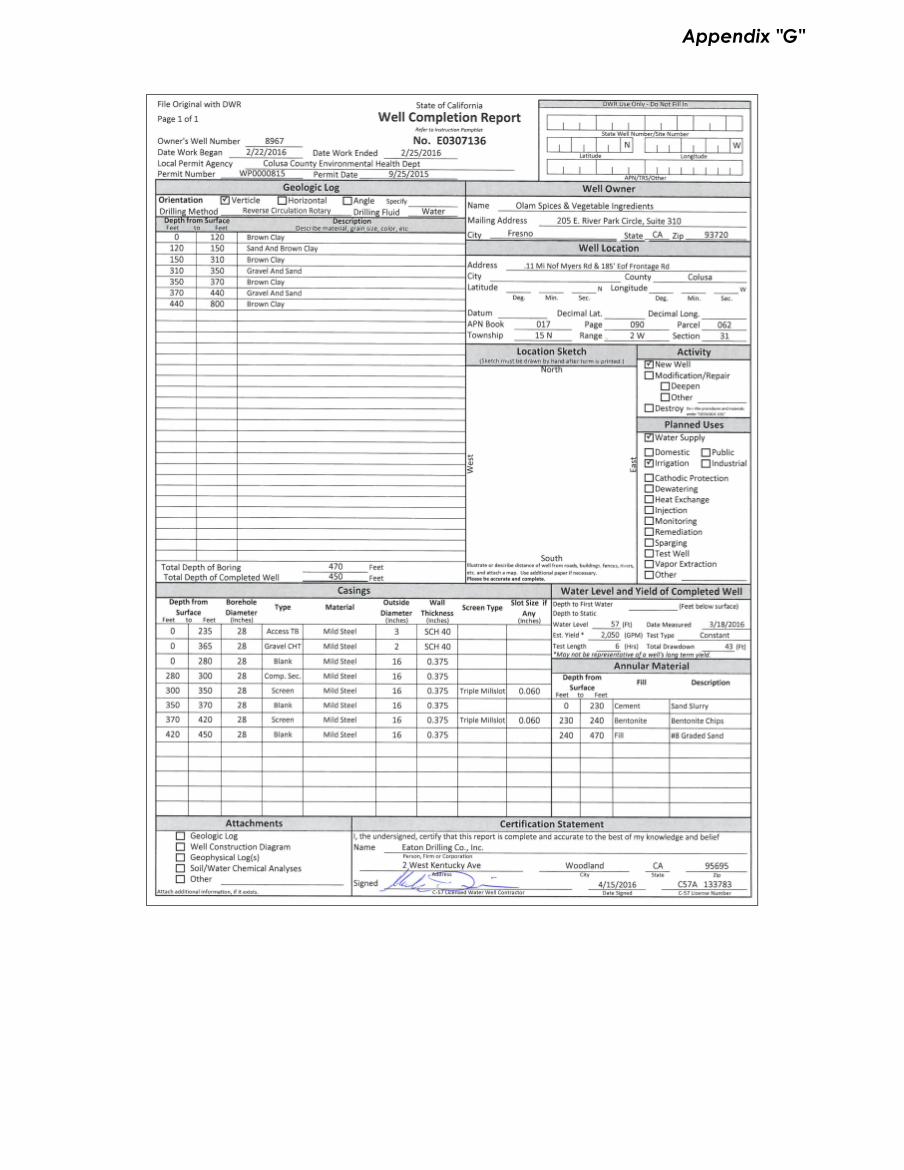
Well #3 was drilled in 2016 to a total depth of 800 feet. The predominant material encountered throughout the borehole was a brown clay. Coarse-grained aquifer deposits were identified from 310 ft bgs to 350 ft bgs and from 370 ft bgs to 440 ft bgs. The well was backfilled to 470 feet and completed with a 16-inch steel casing to that depth, with perforated intervals from 300 ft bgs to 350 ft bgs and from 370 ft bgs to 420 ft bgs. The gravel pack was placed in the annulus between the casing and the wall of the borehole from 240 ft bgs to 470 ft bgs, with a 10-foot bentonite seal above the gravel pack. A sanitary seal was installed to a depth of 230 ft bgs. The depth to water at the time the well was installed was reported to be 57 ft bgs. During a six-hour production test, Well #3 was reported to yield 2,050 gallons per minute (gpm) with a drawdown of 43 feet, yielding a specific capacity of 47.7 gpm/ft. Based on the specific capacity and the screened interval, the aquifer at the Well #3 location may have a transmissivity of 11,000 ft2/day and a hydraulic conductivity of 110 ft/day (equivalent to 4 X 10⁻² cm/sec) (Thomasson et al., 1960). The Well Completion Report for Well #3 is provided in Appendix B.
According to information provided to CRC from Olam, the two existing onsite wells are set up to pump 900 gpm each. For 2019, approximately 29 million gallons of groundwater were produced each month during the summer tomato processing season while during the off-season, approximately 5 million gallons of groundwater were produced each month. The total groundwater production in 2019 is reported to have been 179 million gallons, or approximately 550 acre-feet. From 2012 through 2016, total
Appendix "G"

Drainage, Hydrology, and Water Quality Analysis Report
ECORP Consulting, Inc. California Renewable Carbon Williams Production Facility
17 July 2021
2021-047.01
groundwater production is reported to have ranged from 166 million gallons (509 acre-feet) to 222 million gallons (681 acre-feet) (RWQCB 2018).
2.3.3 Groundwater Quality
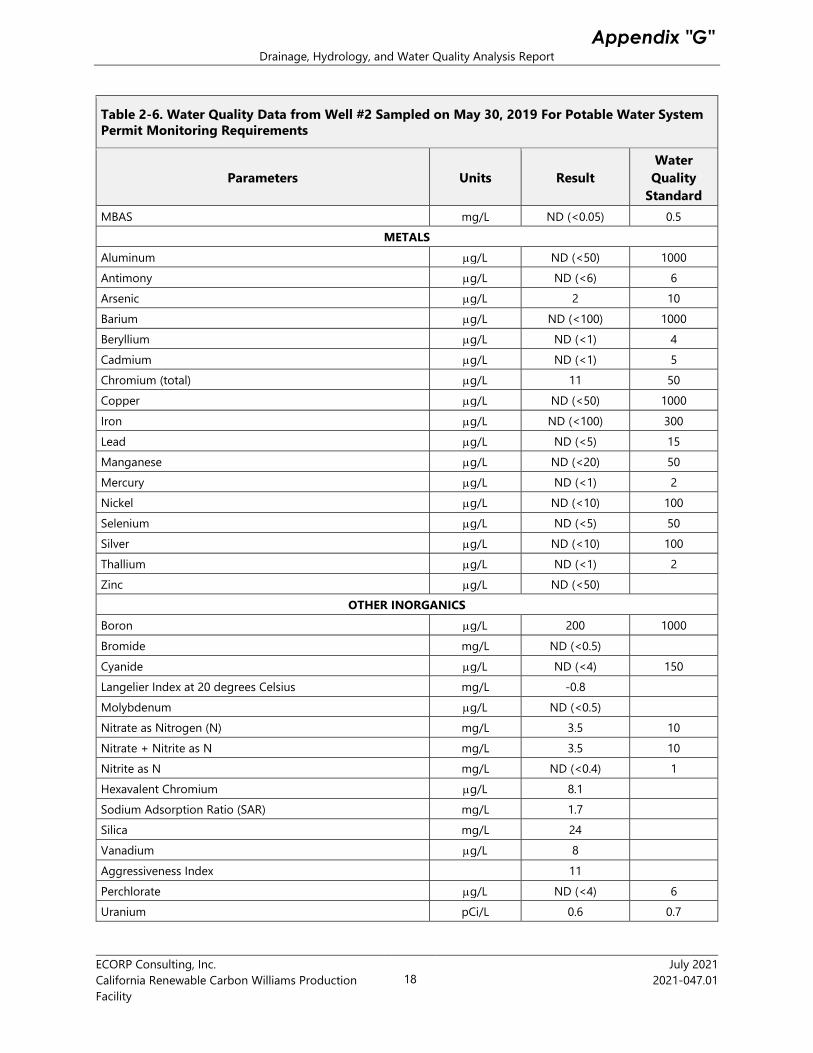
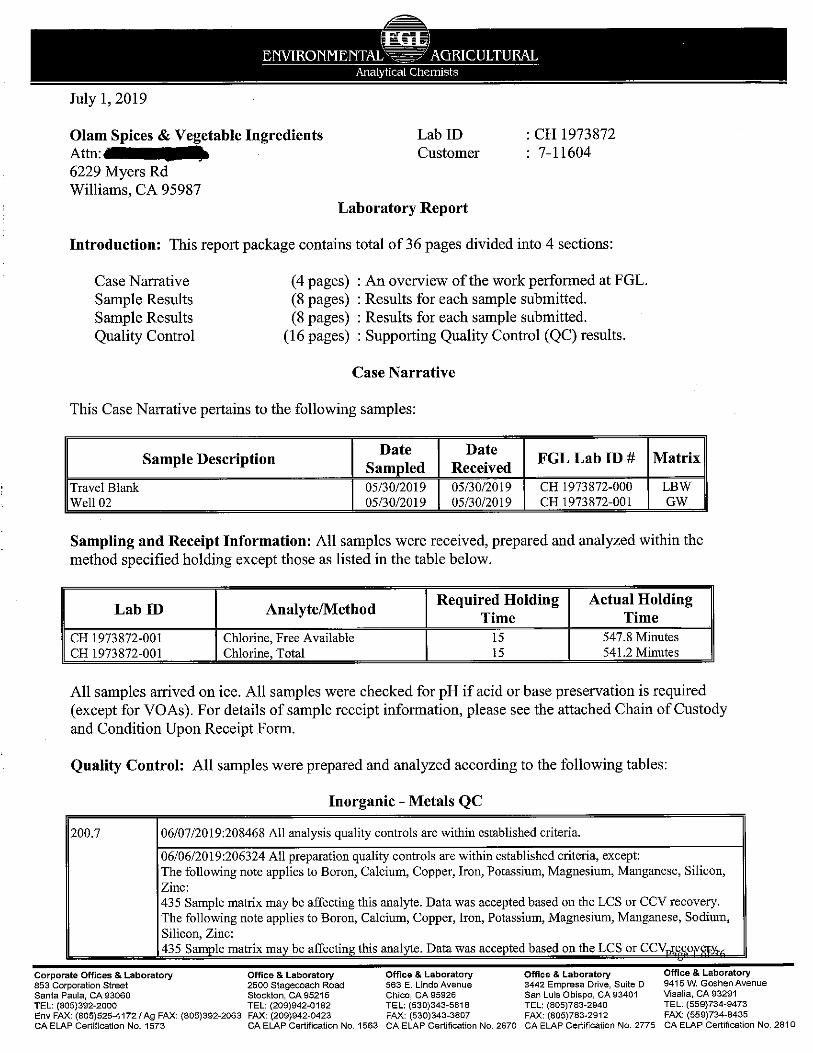
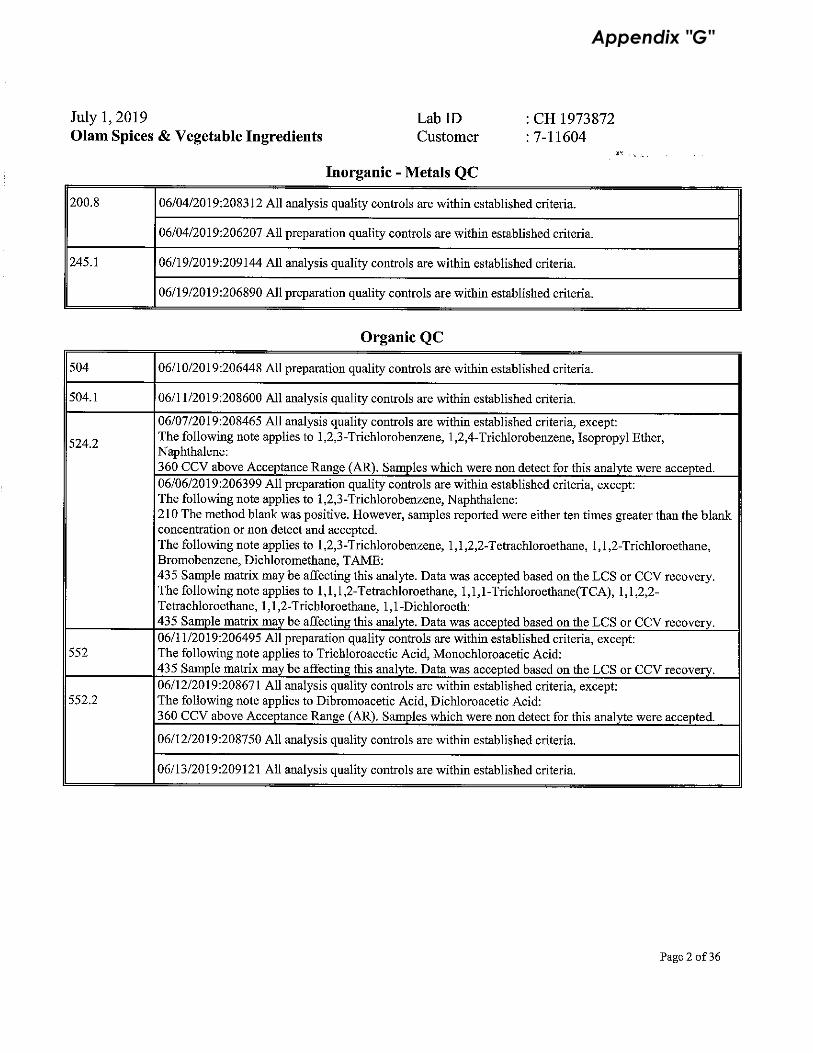
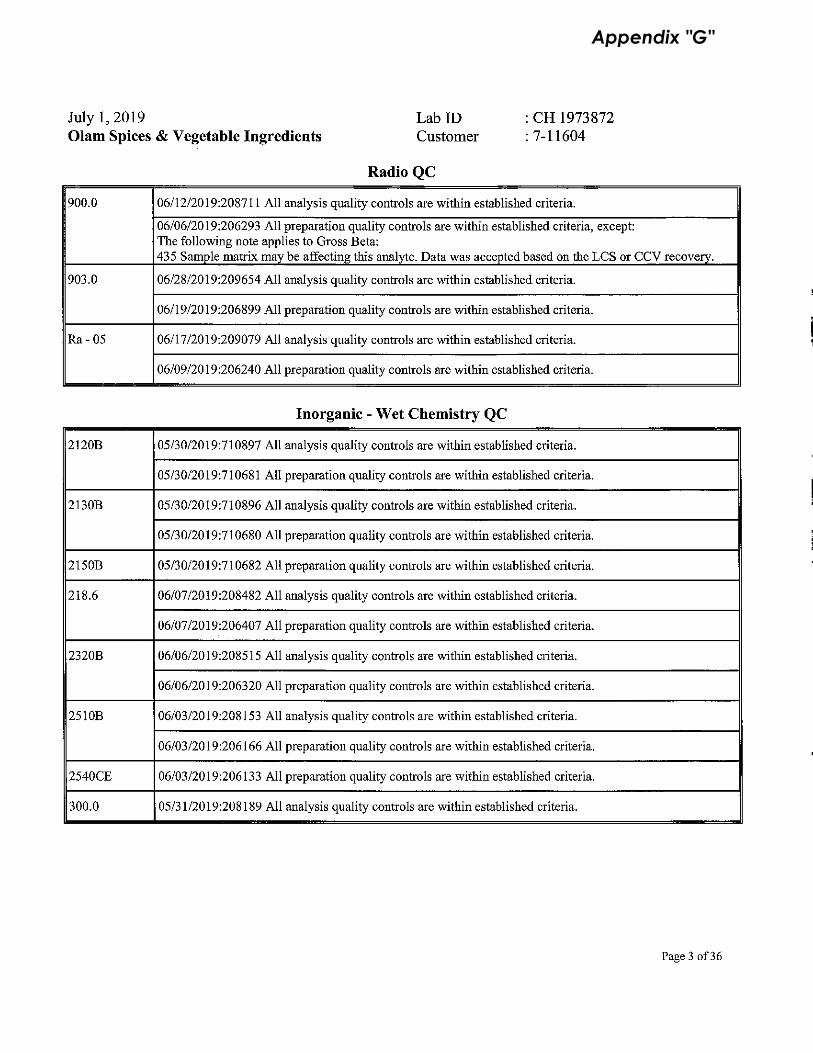
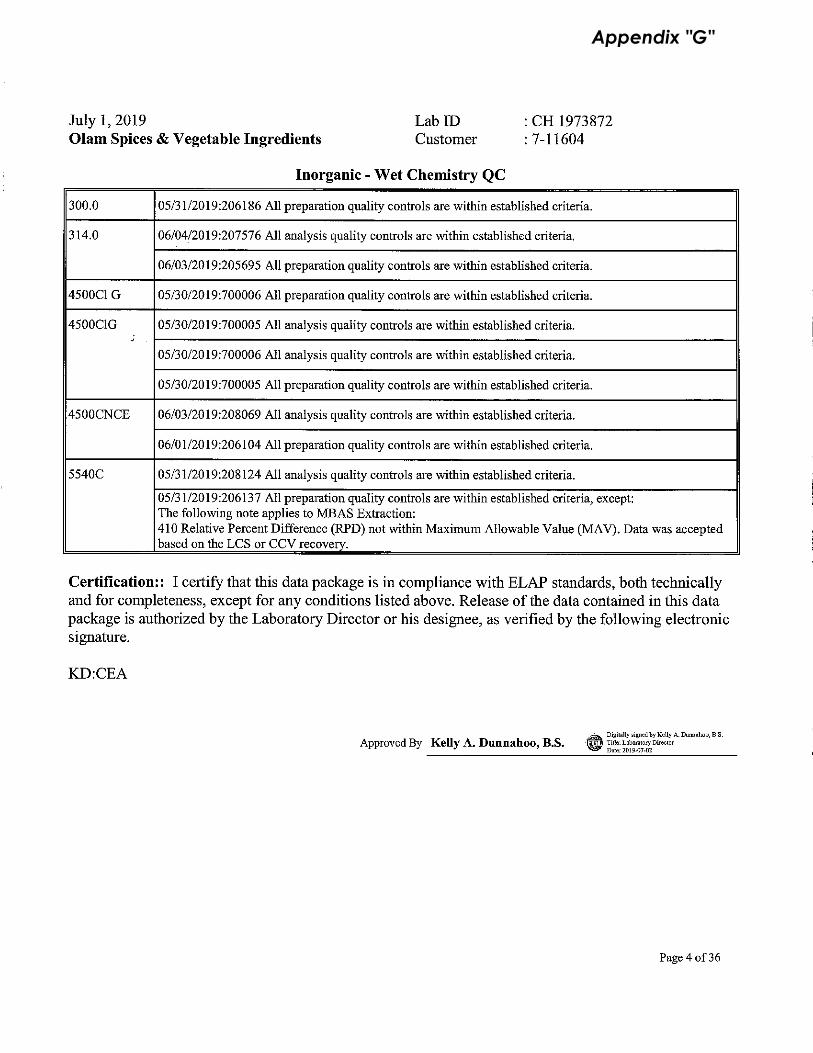
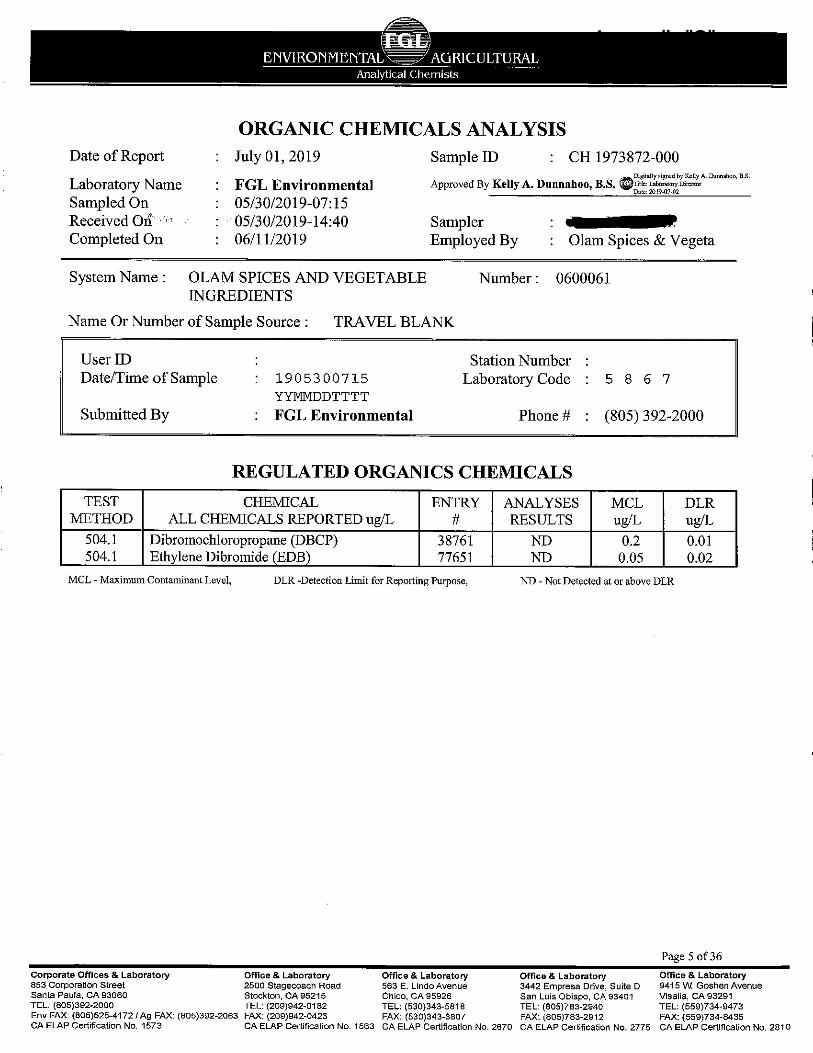
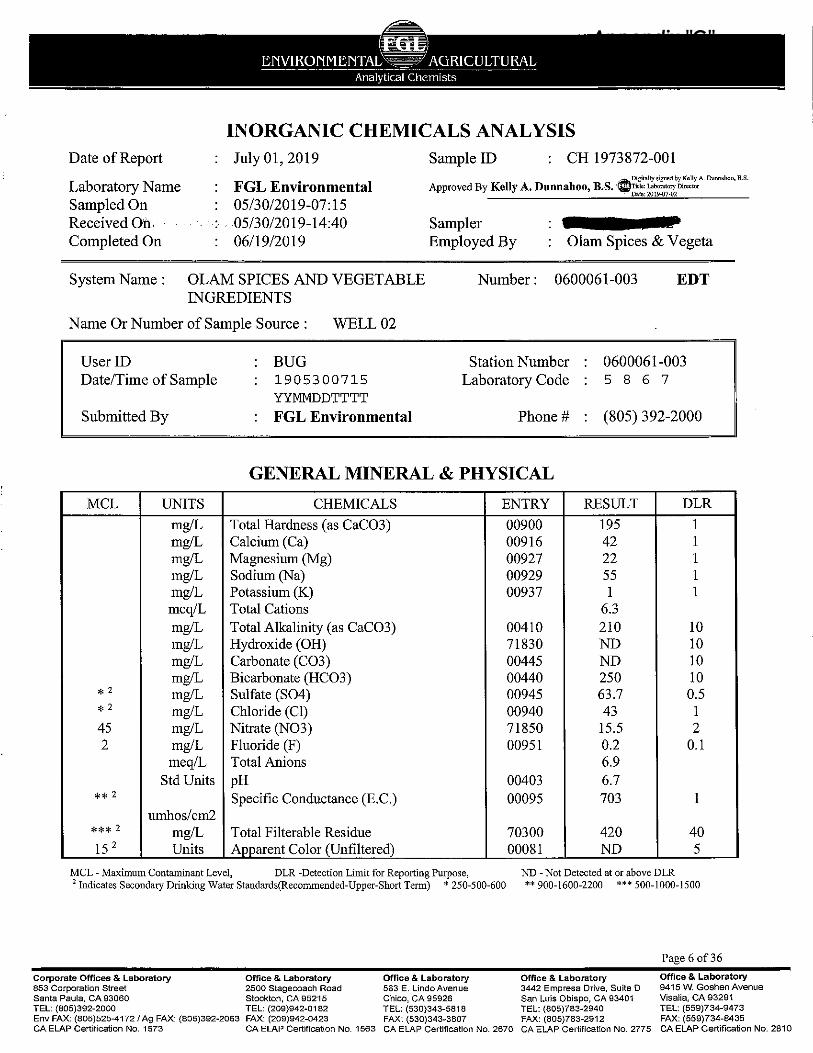
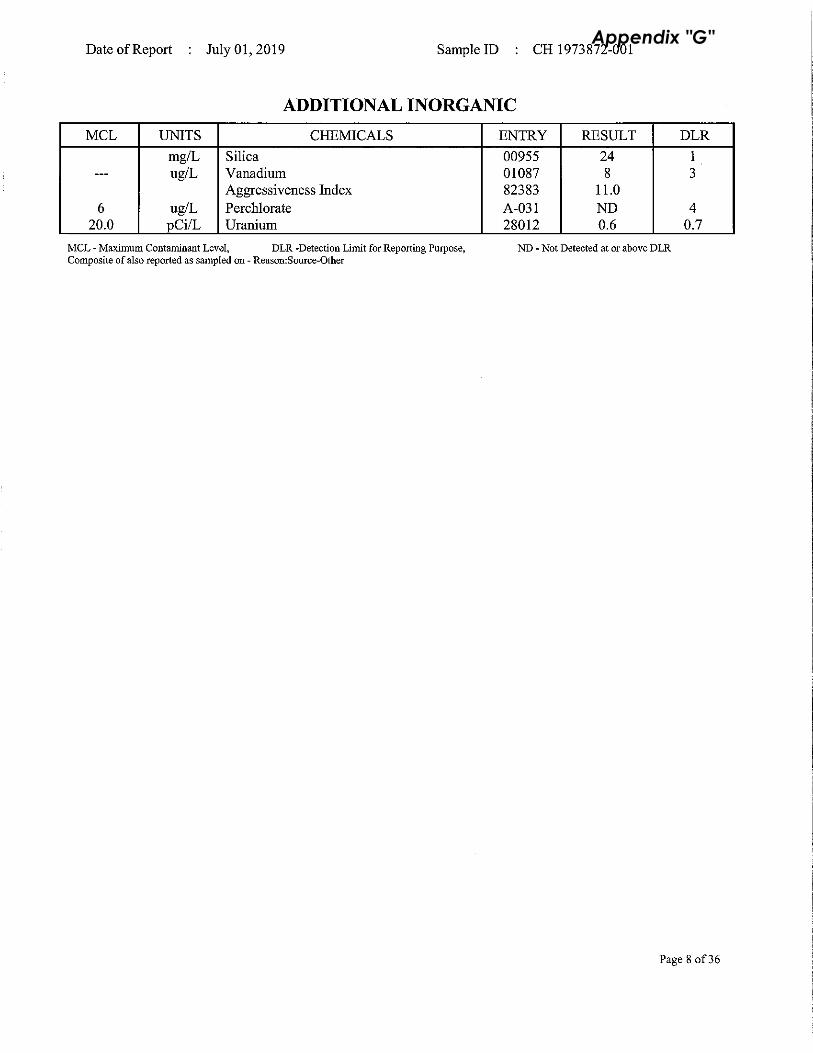
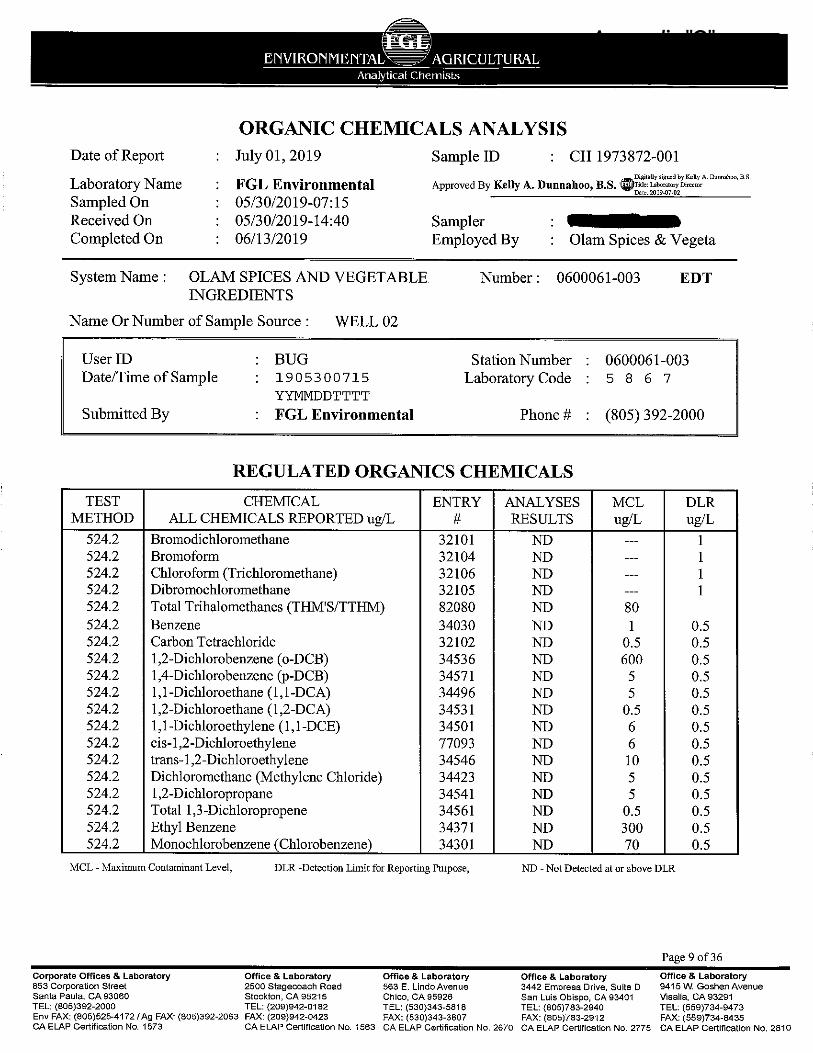
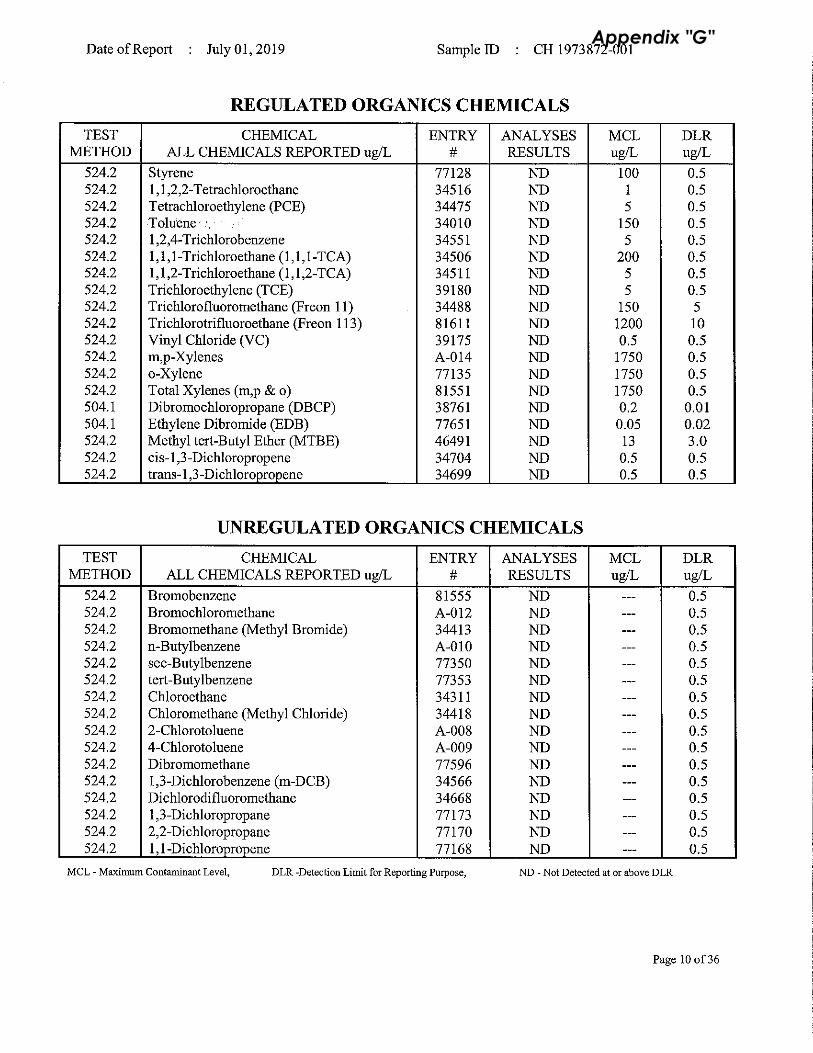
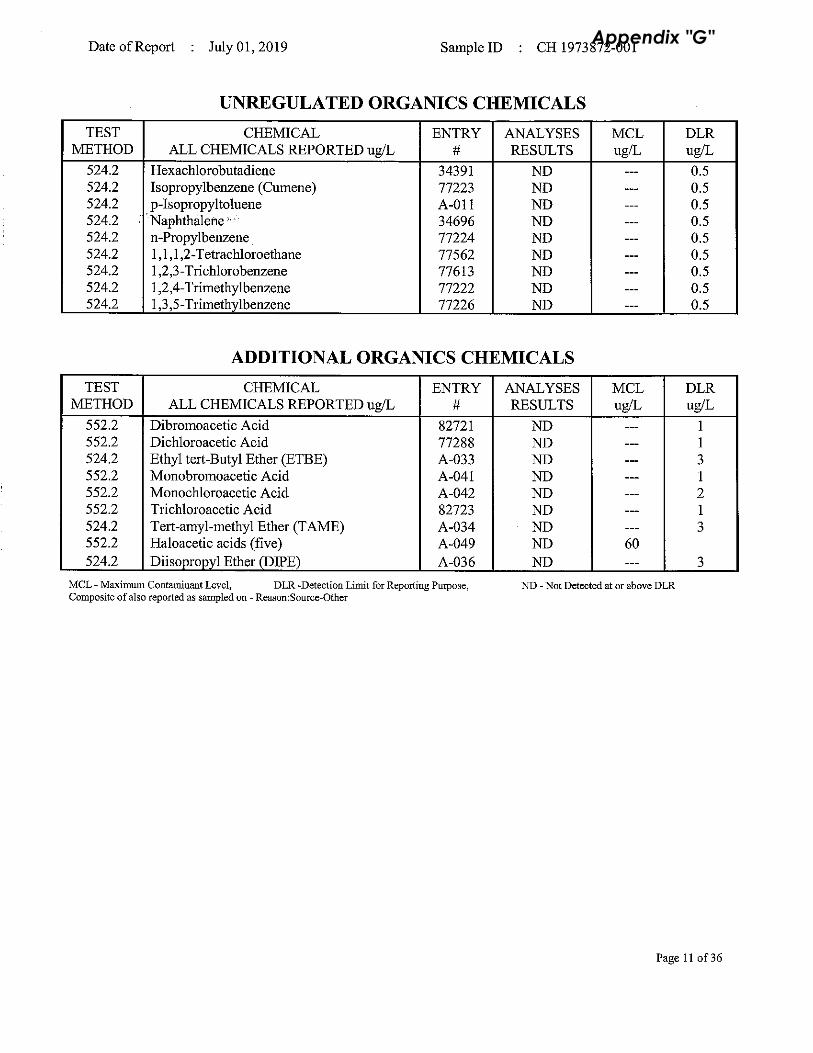
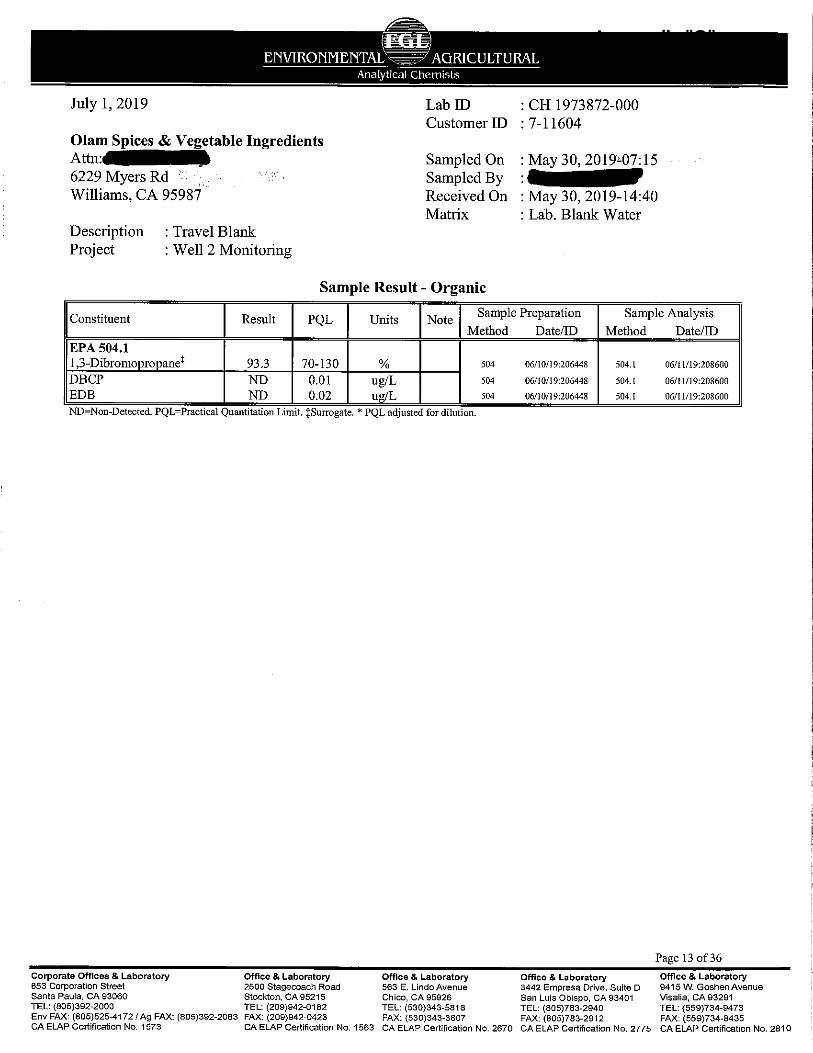
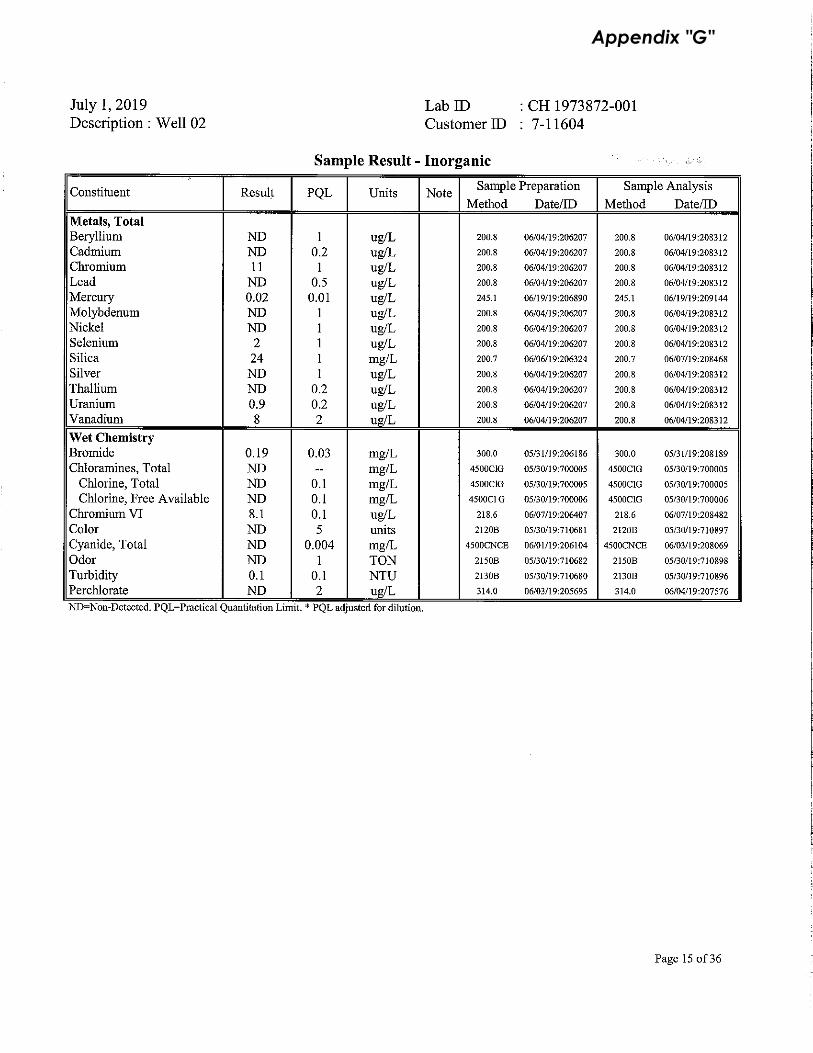
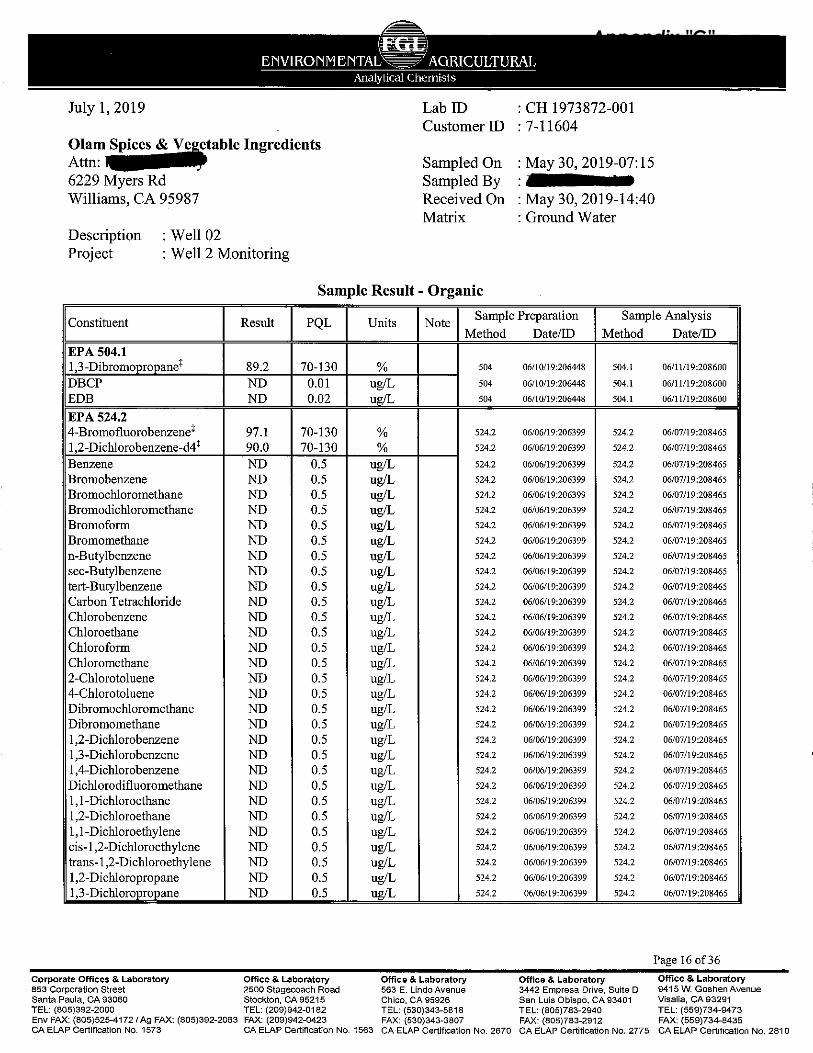
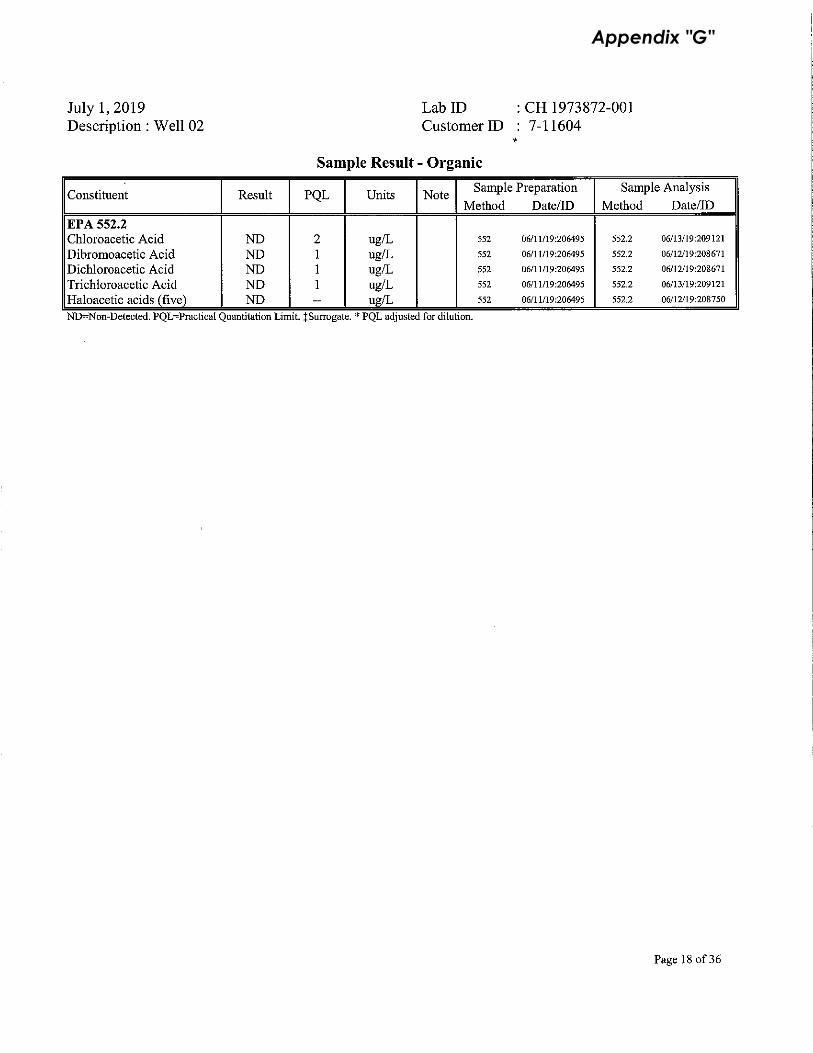
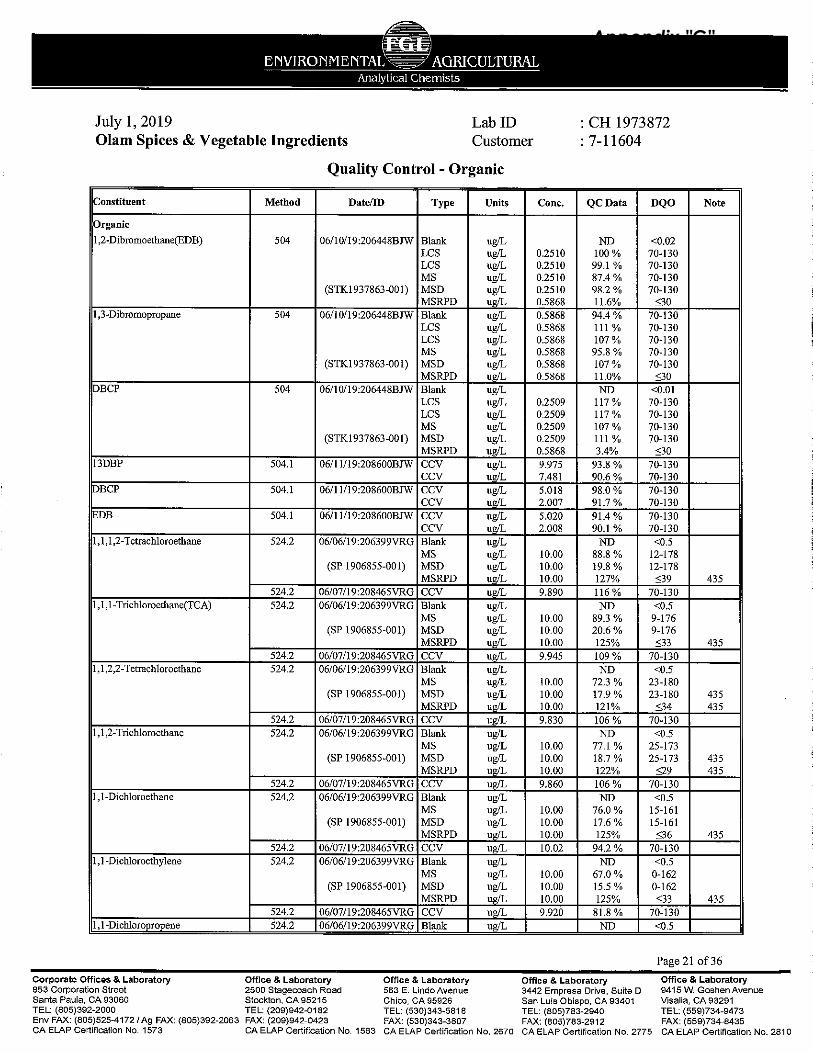
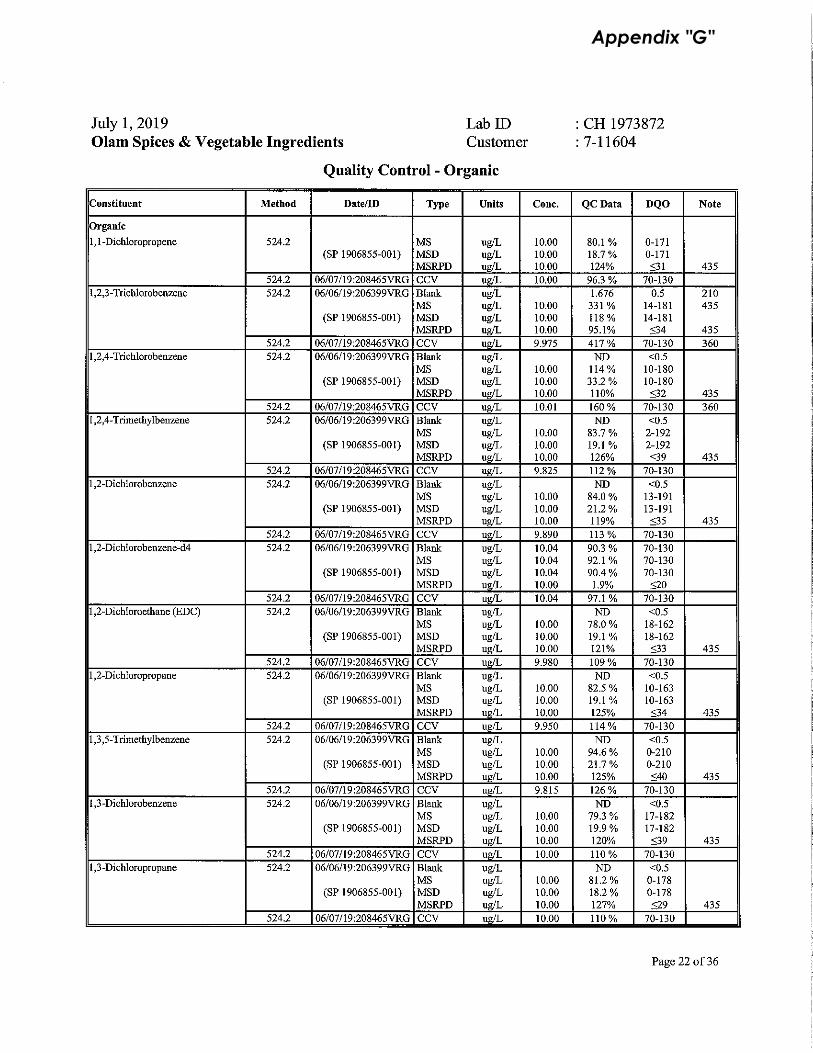
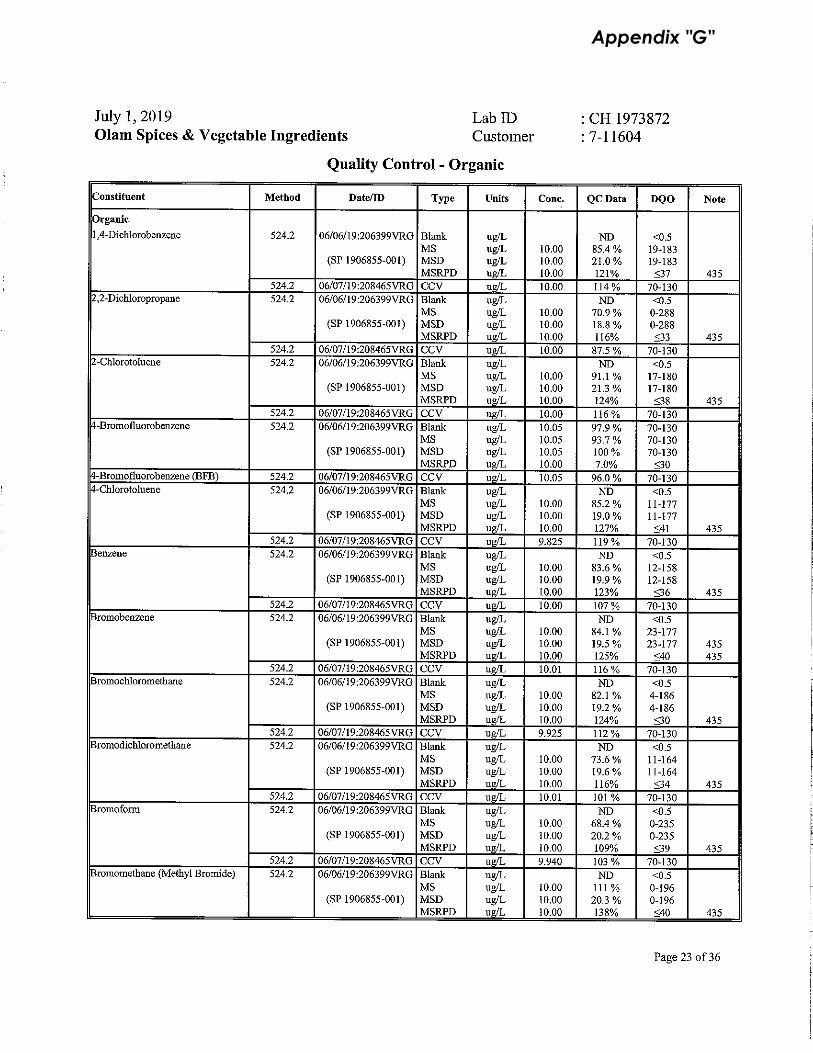
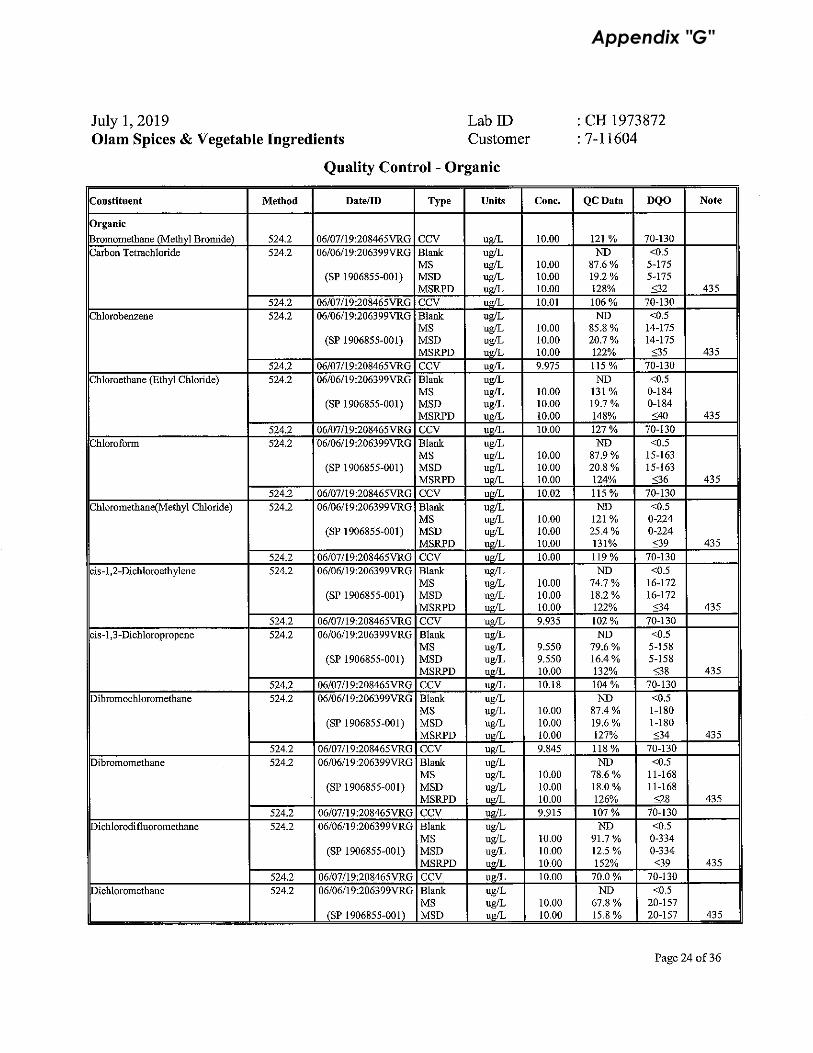
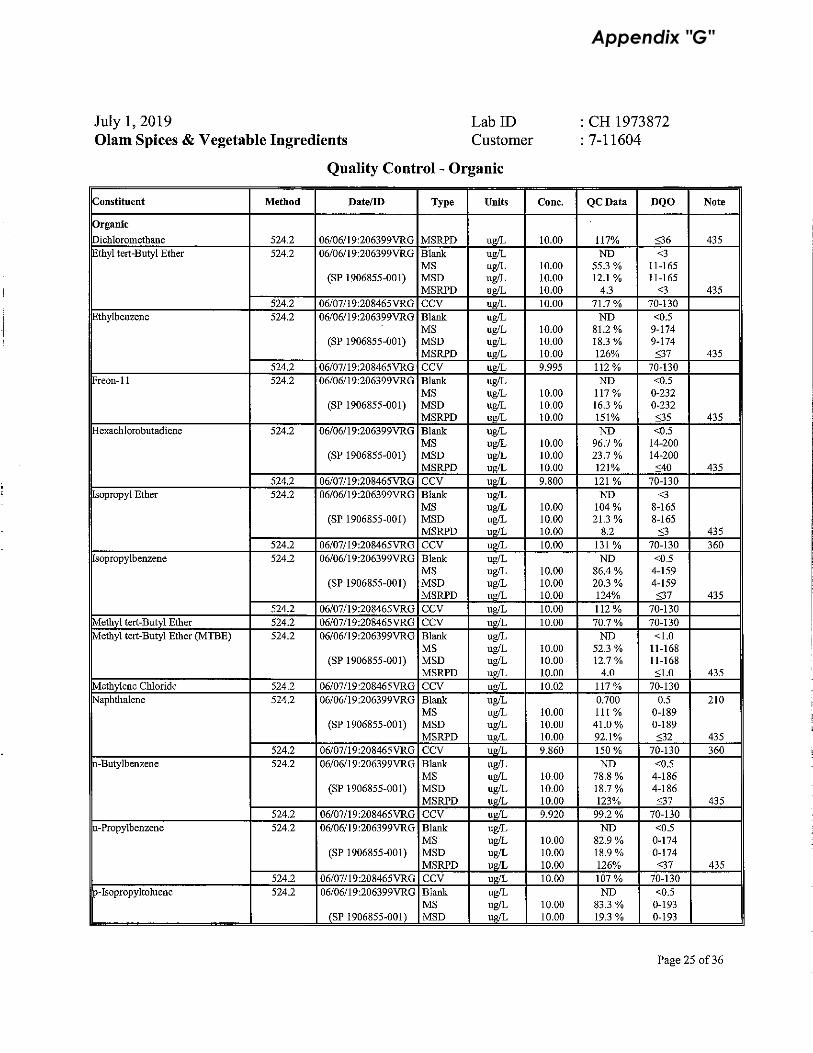
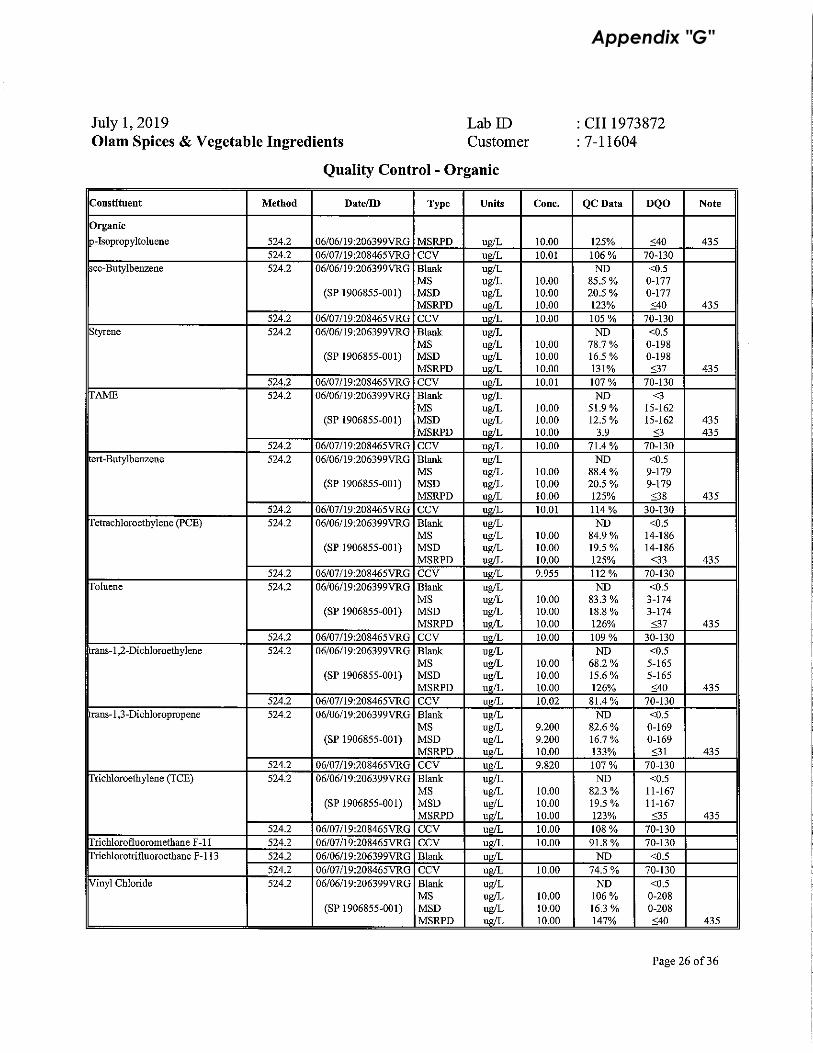
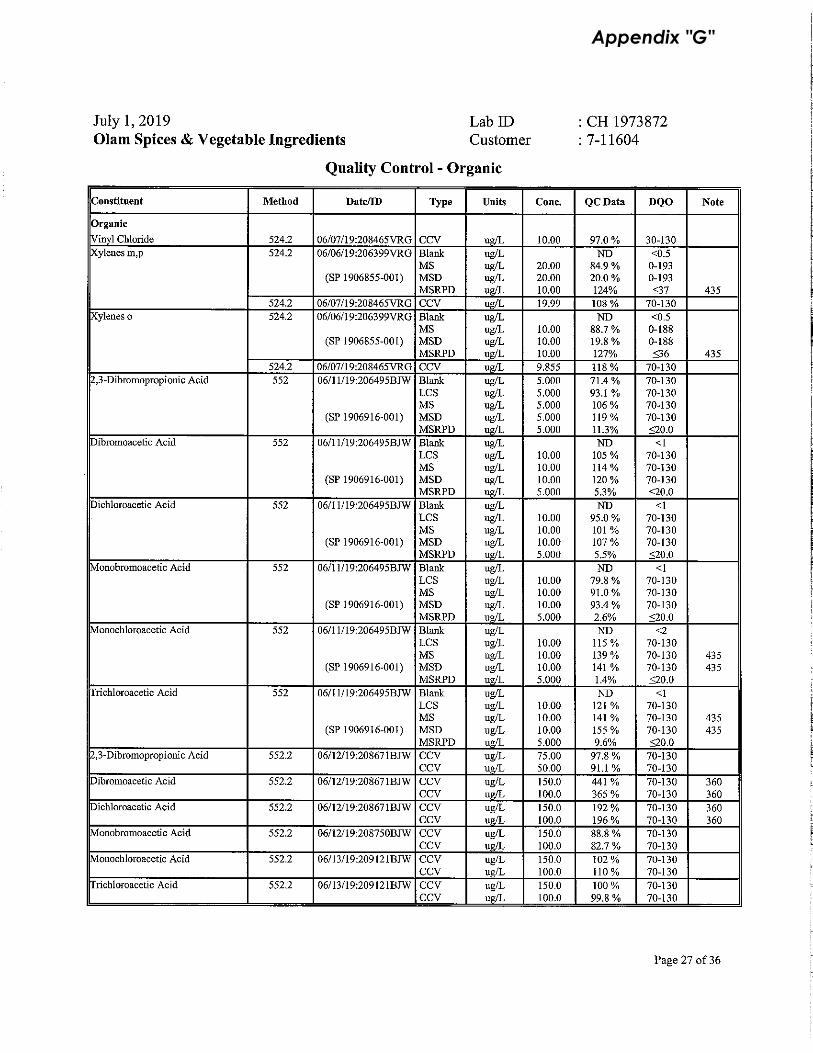
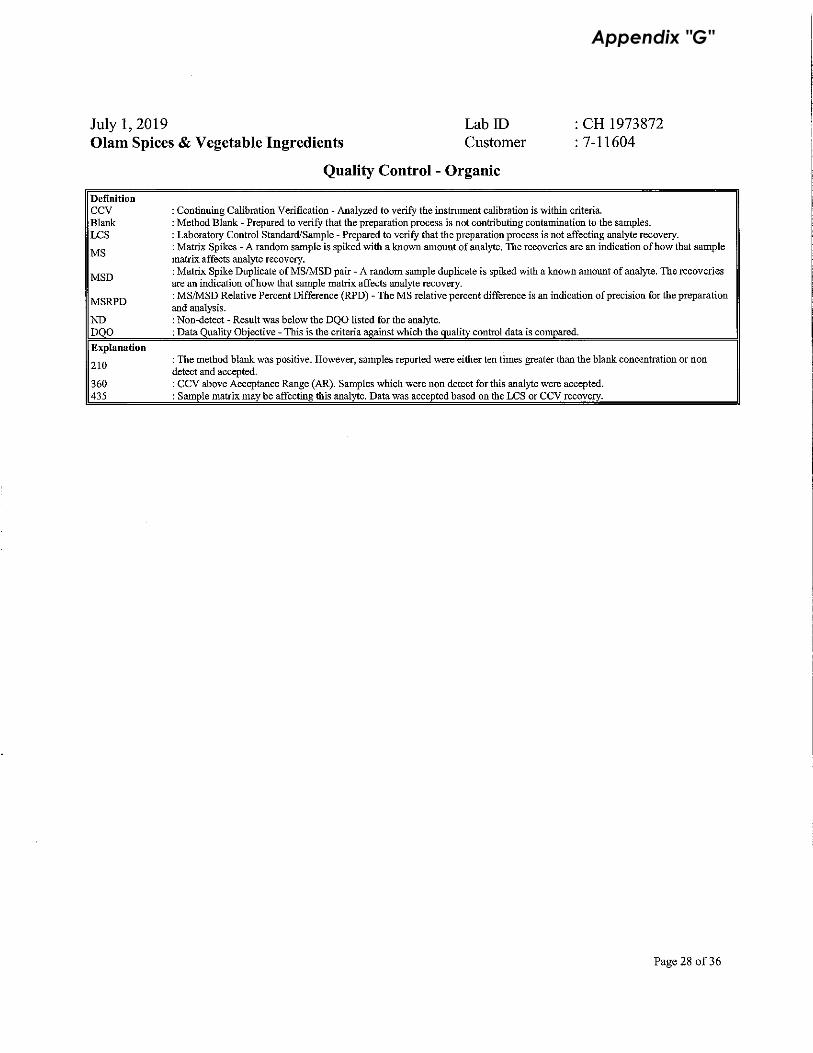
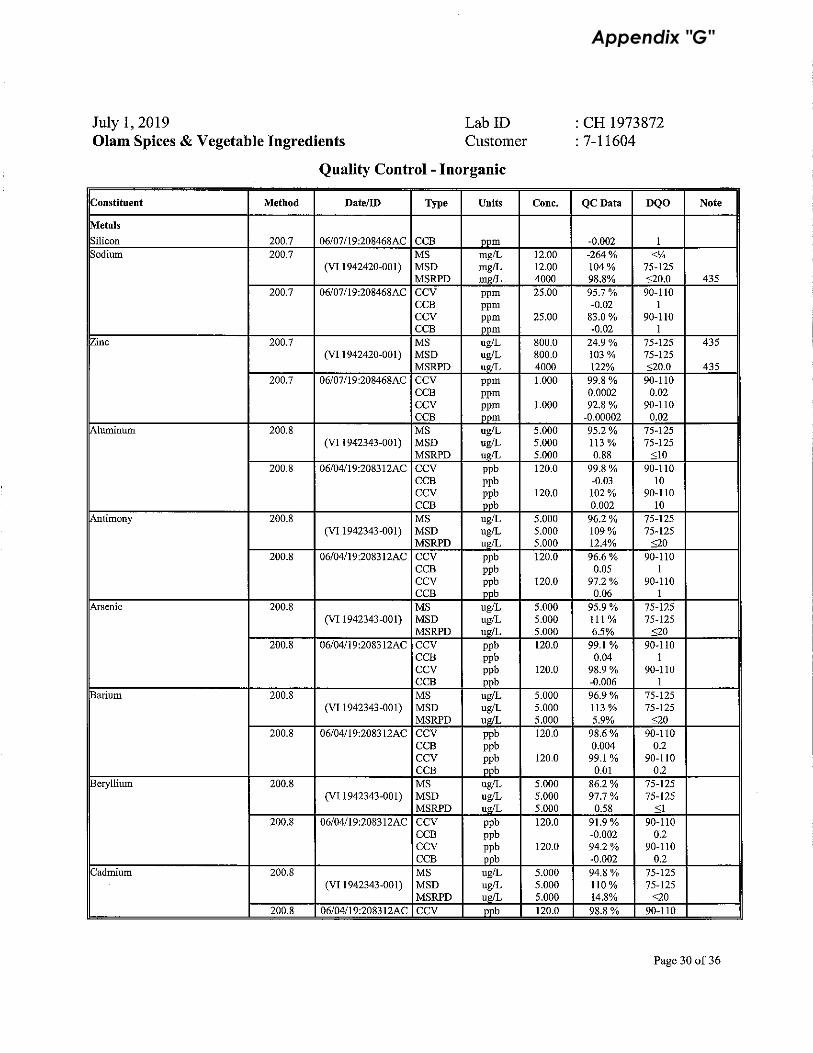
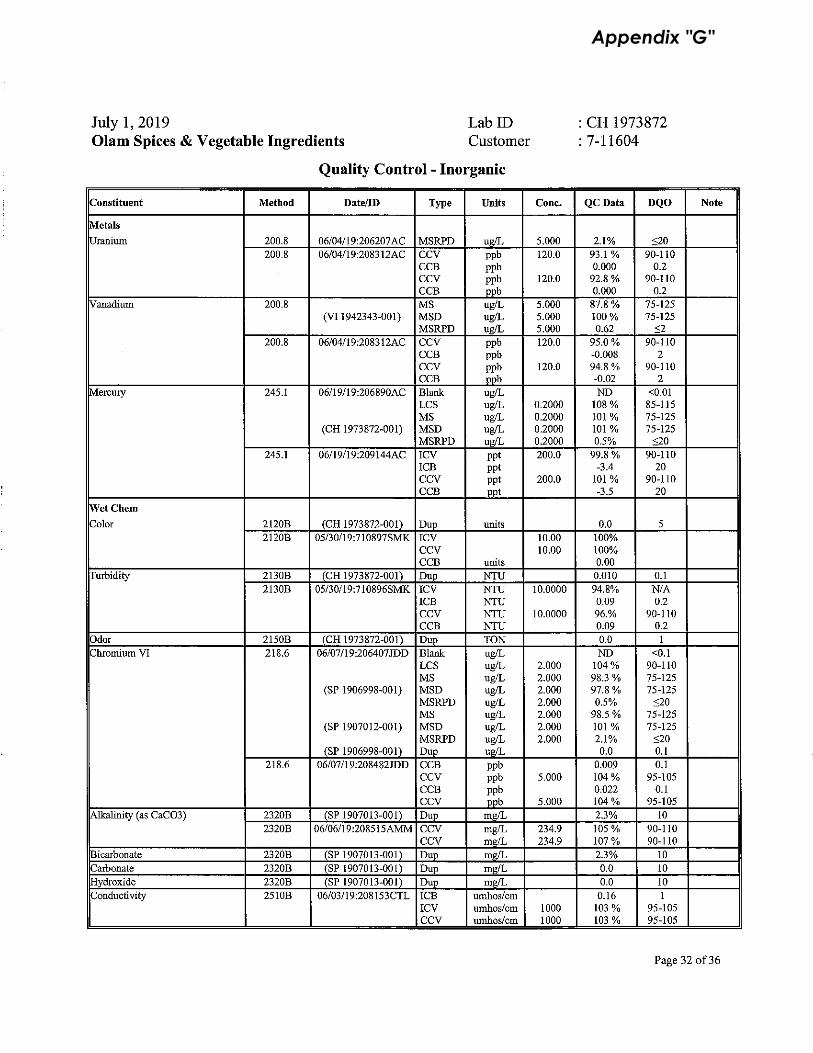
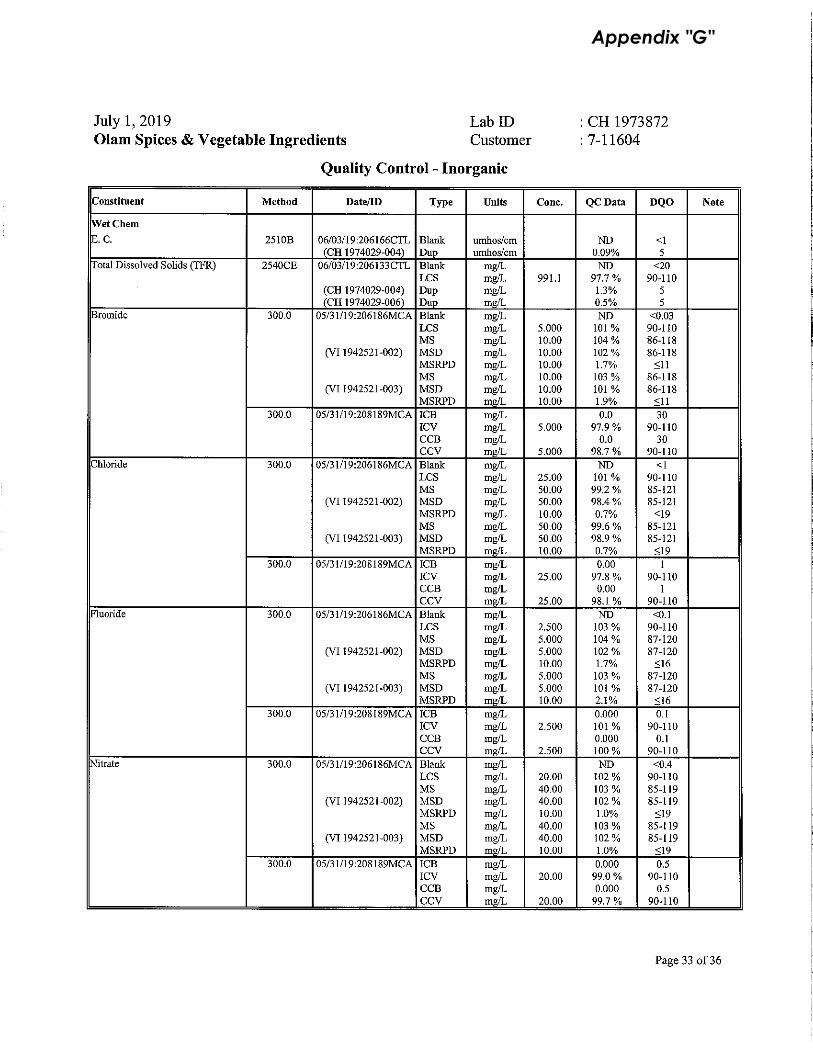
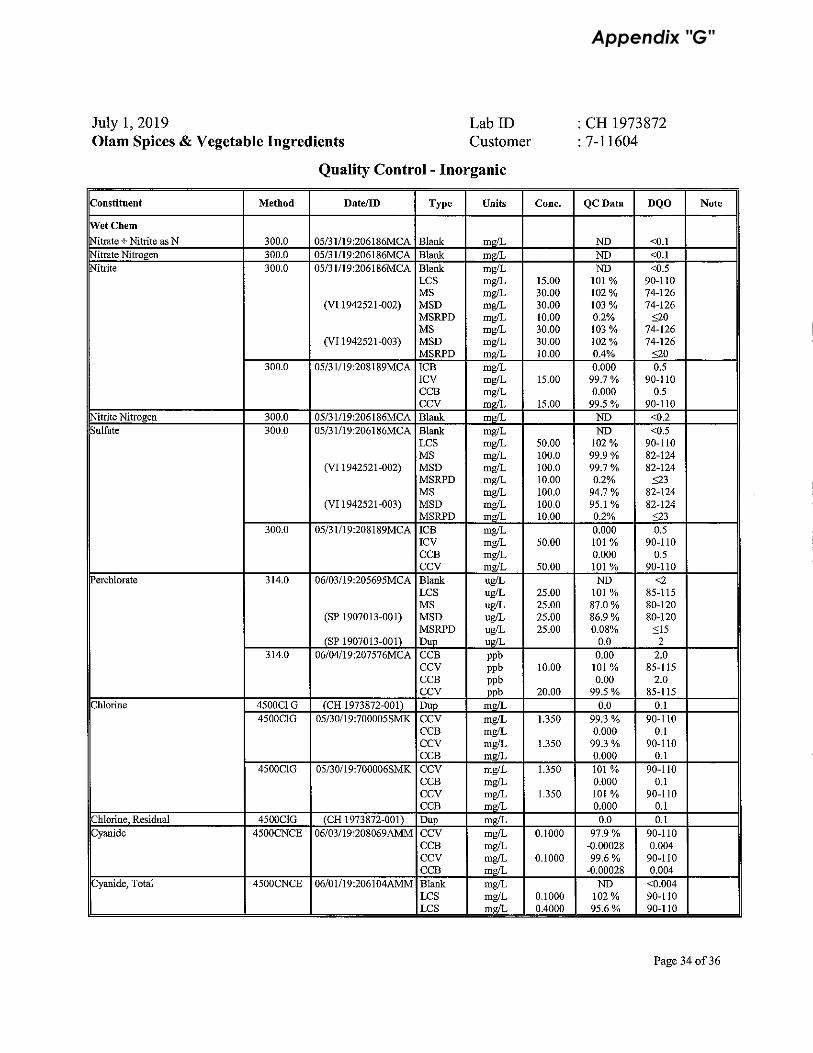
Table 2-6 provides the data from Well #2 for samples collected in May 2019 as part of the monitoring requirements for Olam’s potable water system permit along with typical water quality standards. Olam’s groundwater sample results are also contained in Appendix C. These standards consist of primary and secondary drinking water maximum contaminant levels and Regional Water Quality Control Board Basin Plan limits for discharge to surface waters. Based on the information presented in Table 2-6, the existing baseline groundwater quality meets water quality standards.
Table 2-6. Water Quality Data from Well #2 Sampled on May 30, 2019 For Potable Water System Permit Monitoring Requirements
Parameters Units Result Water
Quality Standard
ORGANIC COMPOUNDS Volatile Organics by EPA Method 524.2 µg/L All ND Varies Dibromochloropropane by EPA Method 504.1 µg/L ND (>0.01) 0.2 Ethylene Dibromide by EPA Method 504.1 µg/L ND (>0.02) 0.05 Additional Organics by EPA Method 552.2 µg/L All ND Varies
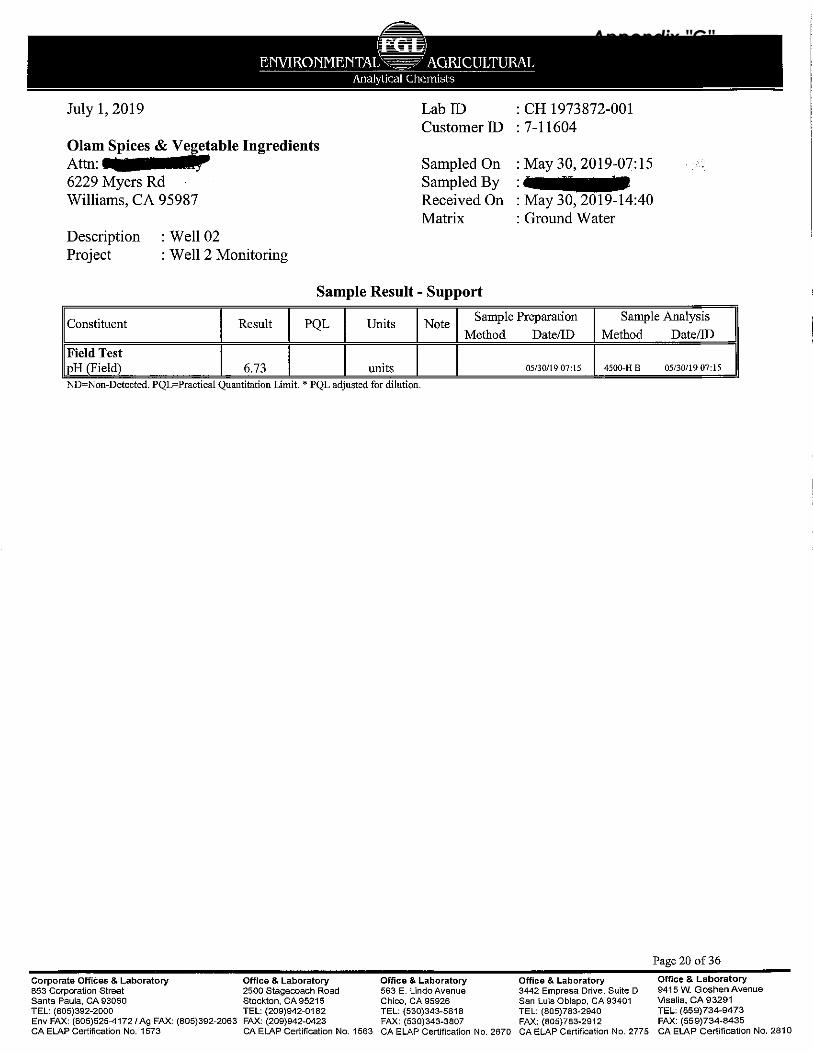
GENERAL MINERAL AND PHYSICAL PARAMETERS Total Hardness as Calcium Carbonate (CaCO3) mg/L 195 Calcium mg/L 42 Magnesium mg/L 22 Sodium mg/L 55 Potassium mg/L 1 Total Alkalinity as CaCO3 mg/L 210 Hydroxide mg/L ND (<10) Carbonate mg/L ND (<10) Bicarbonate mg/L 250 Sulfate mg/L 63.7 250 Chloride mg/L 43 250 Nitrate as NO3 mg/L 15.5 45 Fluoride mg/L 0.2 2 pH standard units 6.7 Specific Conductance µmhos/cm 703 900 Total Dissolved Solids mg/L 420 500 Apparent Color color units ND (<5) 15 Odor Threshold TON ND (<1) 3 Turbidity (lab) NTU 0.1 5
Appendix "G"
Drainage, Hydrology, and Water Quality Analysis Report
ECORP Consulting, Inc. California Renewable Carbon Williams Production Facility
18 July 2021
2021-047.01
Table 2-6. Water Quality Data from Well #2 Sampled on May 30, 2019 For Potable Water System Permit Monitoring Requirements
Parameters Units Result Water
Quality Standard
MBAS mg/L ND (<0.05) 0.5 METALS
Aluminum µg/L ND (<50) 1000 Antimony µg/L ND (<6) 6 Arsenic µg/L 2 10 Barium µg/L ND (<100) 1000 Beryllium µg/L ND (<1) 4 Cadmium µg/L ND (<1) 5 Chromium (total) µg/L 11 50 Copper µg/L ND (<50) 1000 Iron µg/L ND (<100) 300 Lead µg/L ND (<5) 15 Manganese µg/L ND (<20) 50 Mercury µg/L ND (<1) 2 Nickel µg/L ND (<10) 100 Selenium µg/L ND (<5) 50 Silver µg/L ND (<10) 100 Thallium µg/L ND (<1) 2 Zinc µg/L ND (<50)
OTHER INORGANICS Boron µg/L 200 1000 Bromide mg/L ND (<0.5) Cyanide µg/L ND (<4) 150 Langelier Index at 20 degrees Celsius mg/L -0.8 Molybdenum µg/L ND (<0.5) Nitrate as Nitrogen (N) mg/L 3.5 10 Nitrate + Nitrite as N mg/L 3.5 10 Nitrite as N mg/L ND (<0.4) 1 Hexavalent Chromium µg/L 8.1 Sodium Adsorption Ratio (SAR) mg/L 1.7 Silica mg/L 24 Vanadium µg/L 8 Aggressiveness Index 11 Perchlorate µg/L ND (<4) 6 Uranium pCi/L 0.6 0.7
Appendix "G"

Drainage, Hydrology, and Water Quality Analysis Report
ECORP Consulting, Inc. California Renewable Carbon Williams Production Facility
19 July 2021
2021-047.01
Table 2-6. Water Quality Data from Well #2 Sampled on May 30, 2019 For Potable Water System Permit Monitoring Requirements
Parameters Units Result Water
Quality Standard
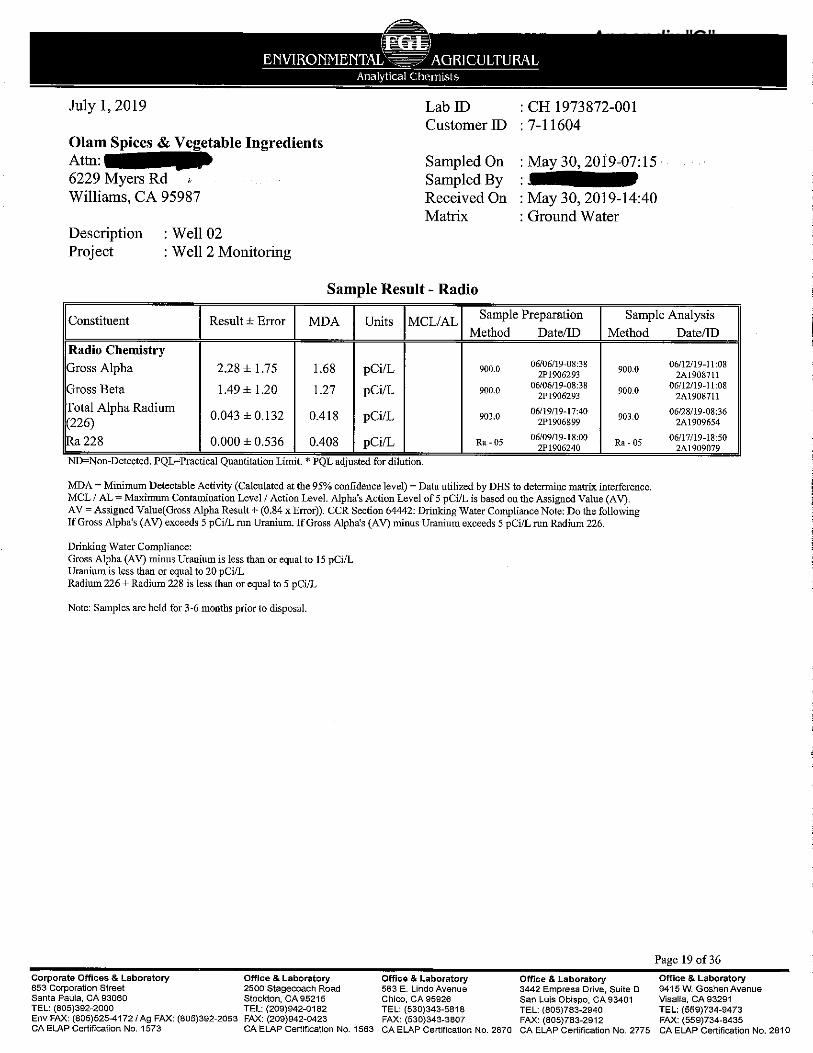
RADIOLOGICAL Gross Alpha pCi/L 2.28 +/-1.75 15 Gross Beta pCi/L 1.49 +/-1.20 Total Alpha (Radium 226) pCi/L 0.043 +/-0.132 5 Radium 228 pCi/L 0.000 +/-0.536 5 Notes: µmhos/cm microohms per centimeter µg/L micrograms per liter mg/L milligrams per liter MBAS methylene blue active substances ND not detected; number in parentheses indicates the detection limit NTU Nephelometric Turbidity Unit pCi/L picocuries per liter TON threshold odor number
3.0 ANTICIPATED PROJECT CONDITIONS
The Project will result in various changes to the existing environmental setting. From the perspective of drainage, hydrology, and water quality, these effects include changes in runoff patterns and stormwater management practices, changes in the amount of groundwater used, and other potential changes. The discussion below identifies the likely changes and disturbances and, where possible, provides some quantification of the magnitude of the effects.
3.1 Surface Water
Construction activities are anticipated to include modification of the existing rail spur and construction of additional rail spurs, building modifications, and the installation of paved areas and processing equipment in the currently undeveloped parts of Parcel 3. These construction and soil disturbance activities would need to be conducted in accordance with the requirements of a construction stormwater pollution prevention plan (C-SWPPP). CRC would need to file a Notice of Intent (NOI) to comply with the construction general permit. The C-SWPPP would identify potential locations and operations where construction activities could pollute storm water runoff. Best Management Practices (BMPs) and appropriate monitoring requirements would also be described in the C-SWPPP.
In the north part of the site, a stormwater retention basin will be added to capture part of the peak stormwater flows. The basin will include an overflow weir that will allow flows that exceed the basin volume to discharge from the east side of the site in a manner similar to current conditions. As indicated in Table 2-4, the basin will completely capture the runoff from small storm events (1-year, 2-year, and 5-year storms) and will attenuate the peak runoff from larger events so that the peak flow rates would be less than under existing conditions. Table 2-4 shows that the retention pond will appreciably reduce the
Appendix "G"
Drainage, Hydrology, and Water Quality Analysis Report
ECORP Consulting, Inc. California Renewable Carbon Williams Production Facility
20 July 2021
2021-047.01
volume of stormwater that would be discharged from the site. The retained stormwater would either be used as process water, offsetting the need to pump an equivalent amount of groundwater, or would be allowed to percolate to the subsurface, recharging the groundwater aquifer. CRC would need to file a Notice of Intent (NOI) to comply with the industrial general stormwater permit and prepare an industrial SWPPP (I-SWPPP). The I-SWPPP would identify potential locations and operations where operational activities could pollute storm water runoff. Best Management Practices (BMPs) and appropriate monitoring requirements would also be described in the I-SWPPP.
As indicated in Tables 2-3 and 2-5, above, peak runoff rates and runoff volumes from the south area would not change as a result of the Project.
3.2 Groundwater
The primary source of water for the Project would be the two existing supply wells, Well #2 and Well #3. Project water demand includes water used in the process for cooling, pellet mixing, and boiler feedwater for the cogeneration system. CRC estimates that net annual industrial process water demand for the cogeneration system will be approximately 1,004 acre-feet. Additional process water demand will be met by water recovered and recycled from the biomass drying process. The anticipated potable demand for employees is anticipated to be 1,000 gallons per day, which is about one acre-foot per year. Approximately 17 acre-feet per year will be used for dust control in the raw material storage areas on the north part of the site. Annual fire water storage and maintenance will be approximately three acre-feet per year. Thus, the annual water demand is anticipated to be 1,025 acre-feet per year. Further details regarding the water demand are available in the Water Supply Assessment (ECORP 2021).
It is anticipated that the facility will operate continuously throughout the year. Thus, the 1,025 acre-foot annual water demand is equivalent to a groundwater pumping rate of approximately 635 gpm. As noted in Section 2.3.2, above, each well at the site is currently set up to pump at up to 900 gpm, while the full capacity of each well may be more than 2,000 gpm. Thus, the existing wells have more than adequate capacity to meet the project water demand.
During the May 7, 2021 field reconnaissance, offsite groundwater supply wells were noted just southeast of the intersection of Frontage Road and Myers Road, to the east of the property on the west side of the orchard located east of the Project site, and at a residence located west of Frontage Road near the rail spur location. Table 3-1 shows the distances from these wells to onsite Wells #2 and #3.
For this analysis, ECORP prepared an analytical model to simulate the drawdown that would occur due to pumping of the supply wells for the Project. The analytical model is based on the Theis equation (Domenico and Schwartz 1990). Verification of the analytical model was conducted using the Thiem equation (Domenico and Schwartz 1990). If the aquifer properties (transmissivity and storativity) are known, along with the pumping rate, then the Theis Equation can provide the total drawdown at any distance from the pumping source at any time during the simulation period. This allows the actual drawdown cone to be identified. In contrast, for the same known parameters and pumping rate, the Thiem Equation provides the difference between the drawdowns at any two specified locations away from the pumping source once equilibrium is reached.
Appendix "G"
Drainage, Hydrology, and Water Quality Analysis Report
ECORP Consulting, Inc. California Renewable Carbon Williams Production Facility
21 July 2021
2021-047.01
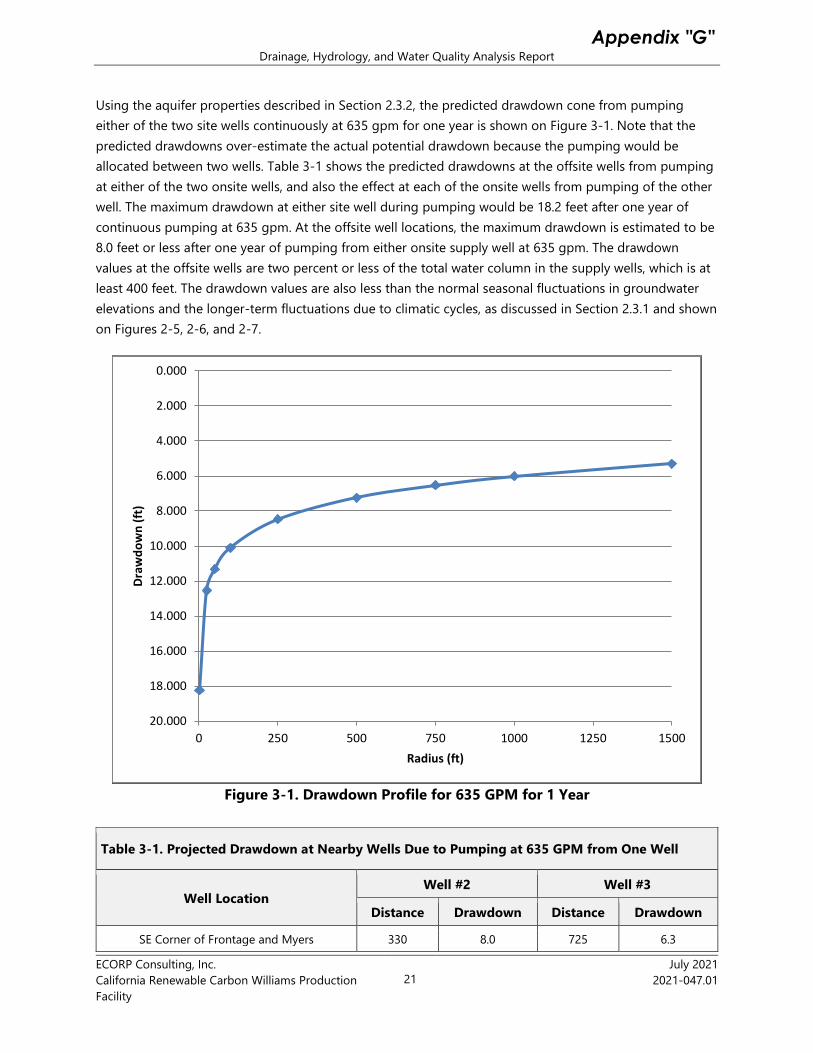
Using the aquifer properties described in Section 2.3.2, the predicted drawdown cone from pumping either of the two site wells continuously at 635 gpm for one year is shown on Figure 3-1. Note that the predicted drawdowns over-estimate the actual potential drawdown because the pumping would be allocated between two wells. Table 3-1 shows the predicted drawdowns at the offsite wells from pumping at either of the two onsite wells, and also the effect at each of the onsite wells from pumping of the other well. The maximum drawdown at either site well during pumping would be 18.2 feet after one year of continuous pumping at 635 gpm. At the offsite well locations, the maximum drawdown is estimated to be 8.0 feet or less after one year of pumping from either onsite supply well at 635 gpm. The drawdown values at the offsite wells are two percent or less of the total water column in the supply wells, which is at least 400 feet. The drawdown values are also less than the normal seasonal fluctuations in groundwater elevations and the longer-term fluctuations due to climatic cycles, as discussed in Section 2.3.1 and shown on Figures 2-5, 2-6, and 2-7.
Figure 3-1. Drawdown Profile for 635 GPM for 1 Year
Table 3-1. Projected Drawdown at Nearby Wells Due to Pumping at 635 GPM from One Well
Well Location Well #2 Well #3
Distance Drawdown Distance Drawdown
SE Corner of Frontage and Myers 330 8.0 725 6.3
0.000
2.000
4.000
6.000
8.000
10.000
12.000
14.000
16.000
18.000
20.0000 250 500 750 1000 1250 1500
Draw
dow
n (ft
)
Radius (ft)
Appendix "G"

Drainage, Hydrology, and Water Quality Analysis Report
ECORP Consulting, Inc. California Renewable Carbon Williams Production Facility
22 July 2021
2021-047.01
Orchard to East 1350 5.5 1535 5.3
Residence to West 1100 5.9 450 7.4
Well #2 0 18.2 640 6.8
Well #3 640 6.8 0 18.2
All values shown are in feet
As noted above, the Thiem equation was used to verify the results of the Theis simulations. The Theis drawdown curve indicates that the drawdown after pumping at 635 gpm for one year would be 18.2 feet at the well location while the drawdown at a point 100 feet from the well location would be 10.1 feet, resulting in a difference of 8.1 feet. The Thiem equation predicts that the difference between the drawdown at these two points at equilibrium for a pumping rate of 635 gpm would be 8.2 feet. The Theis analysis indicates that the drawdown after pumping at 635 gpm for one year would be 10.1 feet at a distance of 100 feet from the well location while the drawdown at a point 1,000 feet from the well location would be 6.0 feet, resulting in a difference of 4.1 feet. The Thiem equation predicts that the difference between the drawdown at these two points at equilibrium for a pumping rate of 625 gpm would be 4.1 feet. Thus, these two different methods for estimating drawdown due to pumping yield identical results. Based on this verification, the estimated drawdowns are considered to be appropriately accurate for the empirically-estimated aquifer properties.
ECORP also estimated the capture zone and appropriate wellhead protection area around the supply wells using a volumetric flow calculation developed by the U.S. Environmental Protection Agency (USEPA 1987). Based on a pumping rate of 635 gpm for one year, the calculated capture zone would extend 690 feet from the well. For both wells, most of this zone would exist under the Project site. For Well #2, the southern extent of this zone would reach beyond Myers Road and extend beneath the agricultural field to the south. For Well #3, the western extent of this zone would reach beyond Frontage Road and extend beneath the orchard and residence to the west of the road.
It is anticipated that the water used for industrial and potable uses would be treated prior to use to meet process specifications and drinking water criteria. Potential treatment methods include reverse osmosis (RO) and granular activated carbon (GAC). Potential waste streams, including RO reject and spent GAC, would be contained onsite prior to transport to appropriate offsite facilities for treatment, disposal, or regeneration.
3.3 Project Permit Needs
In addition to the County use permit and related construction permits, the following additional permit requirements related to hydrology and water quality are anticipated to apply to the Project.
3.3.1 Stormwater Management
Prior to commencing any disturbance, a NOI to comply with the construction general stormwater permit would need to be filed with the State Water Resources Control Board and the Regional Water Quality Control Board and a C-SWPPP would need to be prepared.
Appendix "G"
Drainage, Hydrology, and Water Quality Analysis Report
ECORP Consulting, Inc. California Renewable Carbon Williams Production Facility
23 July 2021
2021-047.01
For on-going operations after construction is completed, a NOI to comply with the industrial general stormwater permit would need to be filed with the State Water Resources Control Board and the Regional Water Quality Control Board and an I-SWPPP would need to be prepared.
The NOIs, and SWPPPs would need to be filed through the State’s Storm Water Multiple Application and Report Tracking System (SMARTS) web portal: (https://smarts.waterboards.ca.gov/smarts/faces/SwSmartsLogin.xhtml).
3.3.2 Well Permit
If any modifications are made to the existing onsite supply wells, if either well is to be abandoned, or if any new wells are to be drilled, then a permit would be required from the Colusa County Environmental Health Division within the Community Development Department. Well permits are ministerial in Colusa County, not discretionary, so they do not require CEQA review.
3.3.3 WDRs and Groundwater Monitoring
If process water is to be stored or discharged to the land surface, then Waste Discharge Requirements permit (WDRs) would need to be obtained from the California Regional Water Quality Control Board, Central Valley Region (RWQCB). To obtain WDRs, a Report of Waste Discharge (ROWD) would need to be submitted to RWQCB. The ROWD would include a completed Form 200 and a Technical Report providing appropriate information about the onsite process, waste characterization, and site-specific conditions.
The WDRs would also include a Monitoring and Reporting Program (MRP) to verify that groundwater quality would not be degraded. To ensure timely processing, the ROWD should be submitted at least six to nine months prior to the initiation of any planned discharge of process water to the land surface, whether in the existing pond or at an alternate location.
3.3.4 Potable Water System Permit
Since there will be more than 25 employees at the facility, a permit for a non-community non-transient water system will need to be obtained from the State Water Resources Control Board Division of Drinking Water after receiving the use permit from Colusa County but before operations can begin. It may be possible to transfer the existing potable water system permit to the new facility owner.
This permit requirement applies exclusively to the domestic supply for employee use (restrooms, kitchen facilities, eye wash and other safety station water needs). It does not apply to the industrial process use.
4.0 CEQA EVALUATION CRITERIA
Section 5.0 of this report evaluates the proposed Project based on the CEQA evaluation criteria for Hydrology and Water Quality. The CEQA Guidelines (CCR Title 14, Division 6, Chapter 3) list five criteria related to Hydrology and Water Quality. These criteria address whether a Project would:
a) Violate any water quality standards or waste discharge requirements or otherwise substantially degrade surface or ground water quality.
Appendix "G"
Drainage, Hydrology, and Water Quality Analysis Report
ECORP Consulting, Inc. California Renewable Carbon Williams Production Facility
24 July 2021
2021-047.01
b) Substantially decrease groundwater supplies or interfere substantially with groundwater recharge such that the project may impede sustainable groundwater management of the basin.
c) Substantially alter the existing drainage patterns of the site or area, including through the alteration of the course of a stream or river or through the addition of impervious surfaces, in a manner which would:
i. Result in substantial erosion or siltation on- or off-site;
ii. Substantially increase the rate or amount of surface runoff in a manner which would result in flooding on-or off-site;
iii. Create or contribute runoff water which would exceed the capacity of existing or planned stormwater drainage systems or provide substantial additional sources of polluted runoff; or
iv. Impede or redirect flood flows.
d) In flood hazard, tsunami, or seiche zones, risk release of pollutants due to project inundation.
e) Conflict with or obstruct implementation of a water quality control plan or sustainable groundwater management plan.
5.0 EVALUATION OF POTENTIAL IMPACTS
Evaluation of the potential impacts of the proposed Project is presented below based on the five CEQA evaluation criteria for Hydrology and Water Quality.
a) Would the Project violate any water quality standards or waste discharge requirements or otherwise substantially degrade surface or ground water quality?
The proposed Project is a new use on an existing industrial site. Prior to conducting any demolition, grading, or construction activities, CRC would need to file a NOI to comply with the construction general stormwater permit with the State Water Resources Control Board and the Regional Water Quality Control Board and a C-SWPPP would need to be prepared.
The total disturbance area on the Project site would not change but additional paved areas, processing equipment, and buildings would be added to the site. However, installation of a stormwater retention basin would reduce the peak runoff rate and volume of stormwater from the site due to the project to levels that would be less than under current conditions. A NOI to comply with the industrial general stormwater permit would need to be filed with the State Water Resources Control Board and the Regional Water Quality Control Board and an I-SWPPP would need to be prepared.
Implementation of the measures identified in the NOIs and SWPPPs would preclude polluted runoff from leaving the site, preventing any violation of water quality standards and related degradation of surface
Appendix "G"

Drainage, Hydrology, and Water Quality Analysis Report
ECORP Consulting, Inc. California Renewable Carbon Williams Production Facility
25 July 2021
2021-047.01
water. Since the volume of runoff would be less than under current conditions and water quality would be protected, there would not be any potentially significant impacts related to water quality from stormwater. Thus, mitigation measures would be inapplicable but as part of the County permitting process, preparation and submittal of the relevant documents could be addressed through Conditions of Approval as part of the County’s discretionary approval of the use permit application.
Groundwater would be used for industrial process water and for employee potable supply needs. As noted in Table 2-6, the groundwater meets water quality standards. Pumped groundwater may be treated prior to use as process water or potable supply for employees. Treatment residuals such as RO reject or spent GAC would need to be contained onsite before transport offsite for treatment or disposal.
It is unknown at this time whether the industrial processes used at the site would alter the water quality, resulting in any exceedances of water quality standards. However, any process water that is not retained within tanks or vessels and that would potentially be discharged to the ground or stored in ponds (both lined and unlined) would require submittal of a ROWD for a WDR permit. The WDRs would include discharge limitations to prevent degradation of both surface water and groundwater quality, along with a MRP to verify that water quality standards would not be exceeded.
Preparation and submittal of the ROWD and compliance with the requirements of the WDRs, including the MRP, would prevent violations of water quality standards and related degradation of surface water and groundwater. Submittal of the relevant documents could be addressed through mitigation measures in the CEQA document or could be made Conditions of Approval as part of the County’s discretionary approval process for the use permit application.
Implementation of the measures described above related to stormwater management and WDRs would result in any potential impacts related to water quality standards, waste discharge requirements, or water quality degradation being less than significant.
b) Would the Project substantially decrease groundwater supplies or interfere substantially with groundwater recharge such that the project may impede sustainable groundwater management of the basin?
Groundwater use at the site in the past has ranged from 509 acre-feet per year to 681 acre-feet per year from 2012 through 2016 and was 550 acre-feet per year in 2019. Groundwater demand for the Project is estimated to be 1,025 acre-feet per year. For comparison, the volume of groundwater in storage in the Colusa Subbasin is estimated to be between 26 million acre-feet and 140 million acre-feet. Current groundwater pumping in the subbasin is approximately 499,000 acre-feet per year and is projected to increase to 559,000 acre-feet per year by 2070. The sustainable yield of the Colusa Subbasin is estimated to be 500,000 acre-feet per year currently and is projected to increase to 551,000 acre-feet per year by 2070. While the 2070 estimated groundwater pumping slightly exceeds the projected sustainable yield, the Colusa GSA and Glenn GSA (2021) indicate that future management actions and programs are anticipated to maintain sustainable management of the Colusa Subbasin.
Overall, the Project water demand represents an extremely small percentage of the volume of groundwater in storage, the current and future annual groundwater pumping, and the current and future
Appendix "G"

Drainage, Hydrology, and Water Quality Analysis Report
ECORP Consulting, Inc. California Renewable Carbon Williams Production Facility
26 July 2021
2021-047.01
sustainable yield. For example, the 1,025 acre-foot per year Project demand is approximately 0.2 percent of the current and future sustainable yield estimates of 500,000 acre-feet per year and 551,000 acre-feet per year for the Colusa Subbasin (ECORP 2021).
Estimates of the drawdown caused by pumping of the onsite supply wells to meet the Project demand indicate that water levels in the nearest offsite wells would decline by no more than 8 feet after one year of continuous pumping. In comparison, seasonal fluctuations in groundwater levels in this part of the Colusa Subbasin range from 10 feet to 15 feet per year while longer-term fluctuations due to climatic cycles are in the range of 30 feet. The estimated drawdown in the nearest offsite wells is also a very small fraction (2 percent) of the 400-foot total water column in the local aquifer, as indicated by the data from the onsite supply wells.
While additional pavement and buildings may be added to the site as part of the Project, it is anticipated that stormwater would be retained onsite and either be used to supplement the process water supply or be allowed to percolate and recharge the groundwater aquifer. Thus, the Project would not interfere with groundwater recharge but would instead enhance the volume of recharge or offset groundwater pumping by an equivalent amount.
Overall, the Project would not cause any measurable decrease in groundwater supplies and would not interfere with or reduce groundwater recharge. In fact, the Project could enhance recharge through conjunctive use of stormwater, or by allowing the retained stormwater to percolate into the subsurface. The Project would not impede sustainable management of the groundwater basin. Therefore, there would be no impacts from the Project related to groundwater supplies, groundwater recharge, or sustainable groundwater management.
c) Would the Project substantially alter the existing drainage patterns of the site or area, including through the alteration of the course of a stream or river or through the addition of impervious surfaces, in a manner which would:
i. Result in substantial erosion or siltation on- or off-site;
ii. Substantially increase the rate or amount of surface runoff in a manner which would result in flooding on-or off-site;
iii. Create or contribute runoff water which would exceed the capacity of existing or planned stormwater drainage systems or provide substantial additional sources of polluted runoff; or
iv. Impede or redirect flood flows?
The Project would result in only minor changes to the ground surface, by adding additional pavement and buildings. However, the site is already intensely developed and contains large areas of existing impervious surfaces. Drainage patterns would only be altered in very minor ways.
The current and proposed stormwater management systems prevent any substantial erosion. Use of a retention basin would reduce the peak runoff rates and the total runoff volume to values that are less than existing baseline conditions. Onsite retention of stormwater would also minimize any contribution
Appendix "G"
Drainage, Hydrology, and Water Quality Analysis Report
ECORP Consulting, Inc. California Renewable Carbon Williams Production Facility
27 July 2021
2021-047.01
from the site to existing or planned stormwater drainage systems. The Project site does not exist in an area prone to flooding.
Preparation and implementation of the appropriate NOIs and SWPPPs, as discussed above, would minimize or avoid any potential impacts related to drainage, erosion, and runoff. As previously stated, submittal of the relevant documents could be addressed through Conditions of Approval as part of the County’s discretionary approval process for the use permit application. Implementation of those measures would either eliminate any impacts related to drainage, erosion, and runoff, or would make them less than significant.
d) In flood hazard, tsunami, or seiche zones, would the Project risk release of pollutants due to project inundation?
The Project site is not located within a flood hazard, tsunami, or seiche zone. Thus, there would be no potential impact related to this criterion.
e) Conflict with or obstruct implementation of a water quality control plan or sustainable groundwater management plan?
The purpose of WDRs is to support the applicable water quality control plan for the basin in which a site is located. Thus, the WDRs that would be issued for the Project would be consistent with and developed to support implementation of the Water Quality Control Plan for the Sacramento and San Joaquin River Basins. Thus, the Project would be consistent with and not conflict with or obstruct implementation of a water quality control plan.
The proposed groundwater use for the project is extremely small compared to the available groundwater supply and existing groundwater uses in the Colusa Subbasin. Groundwater demand would be further reduced by retention of stormwater, which would either be used to supplement process water to reduce groundwater demand or would be allowed to percolate to the subsurface to recharge the aquifer. Thus, the Project would not conflict with or obstruct sustainable groundwater management in the subbasin.
Since the Project would be consistent with applicable water quality control and sustainable groundwater management plans, there would be no potential impact related to this criterion.
6.0 CONCLUSION
The proposed CRC Project would be developed at an existing industrial facility with significant ground disturbance already present. The Project is designed to minimize or avoid any potential future impacts related to drainage, hydrology, and water quality. Use of a stormwater retention basin would reduce peak runoff rates and runoff volumes to values less than current conditions. Thus, while additional impervious surfaces would be added to parts of the site, these would not contribute to any offsite drainage. As a result, any impacts related to stormwater quality, drainage, and erosion would be avoided or eliminated.
Groundwater demand for the Project is a small fraction of the total groundwater usage in the groundwater subbasin. Percolation of the retained stormwater, or its use in the process water supply, would further reduce the net demand for groundwater from the Colusa Subbasin. The anticipated
Appendix "G"
Drainage, Hydrology, and Water Quality Analysis Report
ECORP Consulting, Inc. California Renewable Carbon Williams Production Facility
28 July 2021
2021-047.01
groundwater pumping rates would have no measurable effect on the available groundwater supply at the nearest offsite supply well locations. Therefore, the Project would have no impacts related to depletion of groundwater or interference with groundwater recharge and would be consistent with sustainable management of the groundwater subbasin.
Any water treatment residuals would be transported offsite for appropriate disposal or regeneration. If storage of process water occurs in ponds or any other discharge to the land surface is possible, then WDRs would be obtained to determine the measures necessary to protect water quality and prevent violations of water quality standards. The WDRs would be consistent with, and assist in implementation of, the applicable water quality control plan.
By submitting applications for the appropriate stormwater and WDR permits and implementing those programs as part of the Project, any impacts related to drainage, hydrology, and water quality would be avoided or reduced to less than significant.
Appendix "G"
Drainage, Hydrology, and Water Quality Analysis Report
ECORP Consulting, Inc. California Renewable Carbon Williams Production Facility
29 July 2021
2021-047.01
7.0 REFERENCES CITED
Colusa Groundwater Sustainability Agency (GSA) and Glenn GSA. 2021, Groundwater Sustainability Plan, Draft Report, April 2021, https://colusagroundwater.org/projects/groundwater-sustainability-plan/, accessed May 18, 2021.
California Department of Water Resources (DWR). 2021a, SGMA Basin Prioritization Dashboard, https://gis.water.ca.gov/app/bp2018-dashboard/p1/, accessed May 20, 2021.
_____. 2021b, Water Year Hydrologic Classification Indices, Sacramento and San Joaquin Valleys, https://cdec.water.ca.gov/reportapp/javareports?name=WSIHIST, accessed May 21, 2021.
_____. 2019, California Data Exchange Center, www.cdec.water.ca.gov, accessed February 21, 2019
_____. 2009, California Water Plan Update 2009 Sacramento River Integrated Water Management, Bulletin 160-09, Volume 3.
_____. 2006, California’s Groundwater, Bulletin 118, Sacramento Valley Groundwater Basin, Colusa Subbasin.
Domenico, Patrick A. and Franklin W. Schwartz. 1990, Physical and Chemical Hydrogeology, John Wiley and Sons, New York.
ECORP Consulting, Inc. 2021. Water Supply Assessment for the California Renewable Carbon Williams Production Facility, Colusa County, California.
Federal Emergency Management Agency (FEMA). 2021, https://msc.fema.gov/portal/search?AddressQuery=6229%20Myers%20Street%2C%20Williams%2C%20CA#searchresultsanchor, accessed May 24, 2021.
National Oceanic and Atmospheric Administration (NOAA). 2021, Atlas 14 Point Precipitation Frequency Estimates, https://hdsc.nws.noaa.gov/hdsc/pfds/pfds_map_cont.html?bkmrk=ca, accessed May 14, 2021.
Natural Resources Conservation Service (NRCS), U.S. Department of Agriculture. 1986, Urban Hydrology for Small Watersheds, Technical Release (TR) 55, available at https://www.nrcs.usda.gov/Internet/FSE_DOCUMENTS/stelprdb1083019.pdf
Natural Resources Conservation Service (NRCS). 2021, Hydrology Training Series, Module 206D, Peak Discharges, https://www.nrcs.usda.gov/Internet/FSE_DOCUMENTS/stelprdb1083019.pdf, accessed May 25, 2021.
Regional Water Quality Control Board, Central Valley Region (RWQCB). 2018, Waste Discharge Requirements for Olam West Coast, Inc. and T&P Farms, Olam West Coast Williams Facility, Colusa County, Order R5-2018-0006.
Appendix "G"
Drainage, Hydrology, and Water Quality Analysis Report
ECORP Consulting, Inc. California Renewable Carbon Williams Production Facility
30 July 2021
2021-047.01
Thomasson, H.G., Jr., Olmsted, F.H., and LeRoux, E.F. 1960, Geology, Water Resources and Usable Groundwater Storage Capacity of Part of Solano County, California. U.S. Geological Survey Water Supply Paper 1464.
United Stated Environmental Protection Agency (USEPA). 1987, Guidelines for the delineation of wellhead protection areas: Office of Ground-Water Protection, U.S. Environmental Protection Agency 203 p.
United States Geological Survey (USGS). 2021, National Water Information System, Mean Daily Discharge, Sacramento River at Colusa, https://waterdata.usgs.gov/nwis/dv?cb_00060=on&format=gif_default&site_no=11389500&referred_module=sw&period=&begin_date=1985-10-01&end_date=2021-05-23, accessed May 24, 2021.
Western Regional Climate Center (WRCC). 2021, Colusa 2 SSW, California meteorological data, https://wrcc.dri.edu/cgi-bin/cliMAIN.pl?ca1948, accessed May 14, 2021.
Appendix "G"

LIST OF APPENDICES
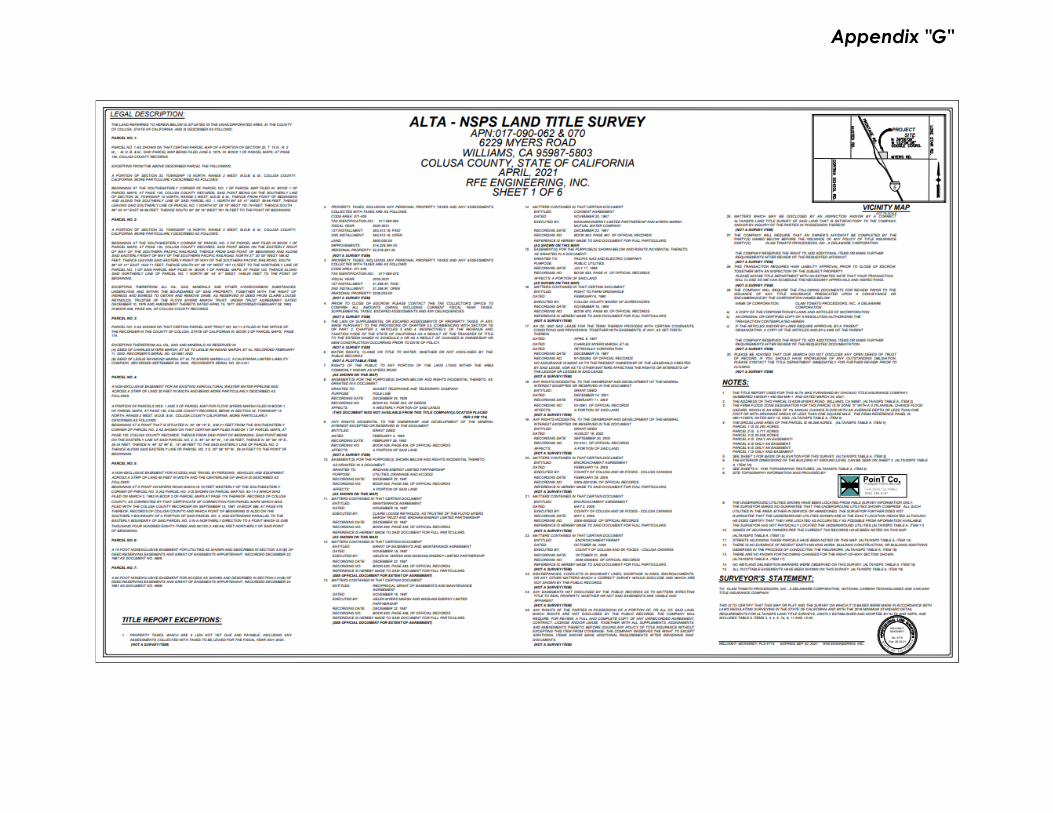
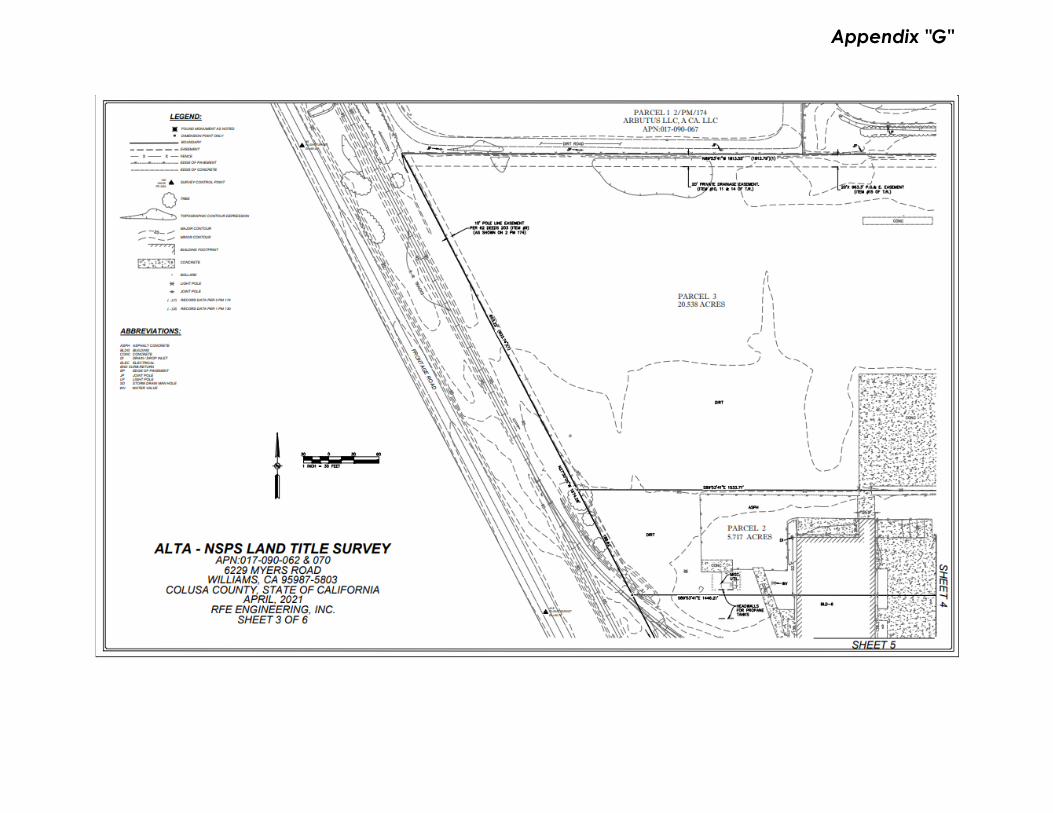
Appendix A - ALTA Survey Maps
Appendix B - Well Completion Reports
Appendix C - Olam Groundwater Sample Results
Appendix "G"

APPENDIX A.
Alta Survey Maps
Appendix "G"
Appendix "G"

Appendix "G"
Appendix "G"
Appendix "G"
Appendix "G"

Appendix "G"

APPENDIX B
Well Completion Reports or Well #2 and Well #3
Appendix "G"
Appendix "G"
Appendix "G"

APPENDIX C
Olam Groundwater Sample Results
Appendix "G"
Appendix "G"
Appendix "G"
Appendix "G"
Appendix "G"
Appendix "G"
Appendix "G"

Appendix "G"
Appendix "G"
Appendix "G"
Appendix "G"
Appendix "G"

Appendix "G"
Appendix "G"

Appendix "G"
Appendix "G"
Appendix "G"

Appendix "G"
Appendix "G"
Appendix "G"
Appendix "G"
Appendix "G"
Appendix "G"
Appendix "G"
Appendix "G"
Appendix "G"
Appendix "G"
Appendix "G"
Appendix "G"

Appendix "G"
Appendix "G"

Appendix "G"
Appendix "G"
Appendix "G"
Appendix "G"

Appendix "G"
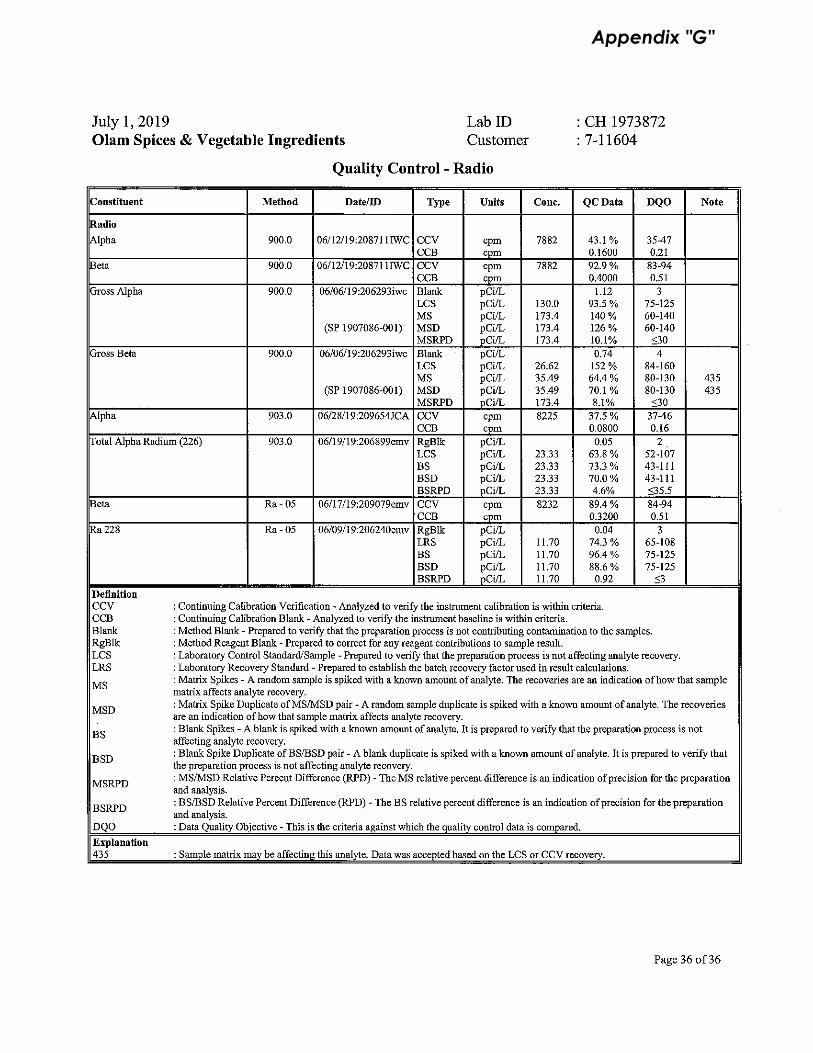
Appendix "G"