Embed Size (px)
Citation preview
PLACER VINEYARDS
PLACER COUNTY, CA
MASTER PROJECT DRAINAGE STUDY
Revised August 23, 2005 Revised January 26, 2006 Revised February 26, 2006
Revised March 28, 2006 Revised August 7, 2006 Amended May 5, 2014
Prepared By:
CIVIL ENGINEERING SOLUTIONS, INC.
590 E Street Lincoln, CA 95648
(916) 645-5700
JOB # 2013.10
14
Placer Vineyards - Master Project Drainage Study Page 2 of 160 TABLE OF CONTENTS : TABLE OF CONTENTS : ............................................................................................................................................1 TABLE OF CONTENTS : ............................................................................................................................................2 List of Appendices.........................................................................................................................................................2 List of Tables.................................................................................................................................................................3 List of Figures................................................................................................................................................................4 I. Introduction: ......................................................................................................................................................6 II. Hydrology:.........................................................................................................................................................8
II.1 Standards: ..................................................................................................................................................8 II.2 Soils: ..........................................................................................................................................................8 II.3 Land Use:.................................................................................................................................................11 II.4 Other Factors: ..........................................................................................................................................11 II.5 Watershed Delineation:............................................................................................................................11
II.A Pre-Project Model:...................................................................................................................................13 II.A Pre-Project Model:...................................................................................................................................13
II.A.1 Site Area Model ...................................................................................................................................13 II.B Post-Project Model: .....................................................................................................................................20 II.C Post-Project Mitigated Model:.....................................................................................................................24 II.D Future Fully Developed Unmitigated Model:..............................................................................................28 II.E Proposed Attenuation at Curry Creek Tributaries: ......................................................................................31 II.F Proposed Attenuation at Dry Creek Tributaries:..........................................................................................32
II.F.1 Dry Creek Analysis:.............................................................................................................................32 II.G Proposed Attenuation at Steelhead Creek Tributaries : ...............................................................................34 II.H Proposed Attenuation at Steelhead Creek (NEMDC) Tributaries : .............................................................35
III. Hydraulics:.......................................................................................................................................................42 III.A Flood Plain Analysis:...............................................................................................................................42
III.A.1 Pre-Project Flowrates:..........................................................................................................................42 III.A.2 Post-Project Mitigated Flowrates:........................................................................................................45 III.A.3 Post-Project Offsite Unmitigated Flowrates: .......................................................................................45
III.B Proposed Culvert Sizing: .........................................................................................................................46 III.C Proposed Channels and Attenuation Facilities: .......................................................................................48 III.D Trunk Storm Drain Facilities: ..................................................................................................................59 III.E Special Structures for Avoidance Areas: .................................................................................................59 III.F State Legislative Requirements (SB5): ....................................................................................................63
III.F.1 Applicability to Placer Vineyards:.......................................................................................................64 IV. Water Quality: .............................................................................................................................................67
IV.A LOW IMPACT DEVELOPMENT MEASURES:...................................................................................73 IV.B HYDROGRAPH MODIFICATION: ......................................................................................................74
V. Volumetric Impacts at Curry Creek:................................................................................................................84 A. Hydrologic Storm Parameters......................................................................................................................84 B Retention Storage Quantities: ..........................................................................................................................86 C Proposed Mitigation.........................................................................................................................................88
List of Appendices A. HEC-1 Pre-Project PDP Input Files B HEC-1 Post-Project PDP Input Files C HEC-RAS Pre-project Summary Tables D HEC-RAS Post-project Summary Tables E Detailed Pre-project Watershed Parameters F Detailed Post-project Watershed Parameters G Detailed Pre-project Computed Peak Flows H Detailed Post-project Computed Peak Flows
Placer Vineyards - Master Project Drainage Study Page 3 of 160 I Trunk Storm Drain Calculations J Project Photos K Steelhead Creek Hydrographs Comparisons L Project Disk M Oversized Exhibits SH-1, SH-2, SOIL-1, FP-1(A&B), FP-2(A&B), FP-
3(A&B), SF-1(A&B), SD-1(A&B), AT-1(A&B), RET-1(A&B), UL-1(A&B), UL-2 and UL-3
List of Tables TABLE IIA2 - Hydrologic Soil Parameters: .................................................................................................................9 TABLE IIA1 - Pre-Project Hydrologic Factors...........................................................................................................14 TABLE IIA1 - Pre-Project Hydrologic Factors...........................................................................................................14 TABLE IIA2 - Pre-Project Hydrologic Factors (cont) ................................................................................................15 TABLE IIA3 - Pre-Project Hydrologic Factors (cont) ................................................................................................16 TABLE IIA4a - PRE-PROJECT PEAK FLOW RATES ............................................................................................18 TABLE IIA4b - PRE-PROJECT PEAK FLOW RATES............................................................................................19 TABLE IIB1 – Post Project Hydrologic Factors .........................................................................................................21 TABLE IIB2 – Post Project Hydrologic Factors (Cont)..............................................................................................22 TABLE IIB3 – Post Project Hydrologic Factors (Cont)..............................................................................................23 TABLE IIC1a - ESTIMATED POST-PROJECT MITIGATED PEAK FLOW RATES ...........................................25 TABLE IIC1b - ESTIMATED POST-PROJECT MITIGATED PEAK FLOW RATES ...........................................26 TABLE IIC2 – DOWNSTREAM MITIGATION FLOWS ........................................................................................27 TABLE IID1a - ESTIMATED POST-PROJECT OFFSITE UNMITIGATED PEAK FLOW RATES.....................29 TABLE IID1b - ESTIMATED POST-PROJECT OFSITE UNMITIGATED PEAK FLOW RATES.......................30 TABLE IIE1 - PROPOSED ATTENUATION FACILITY SUMMARY DATA.......................................................31 TABLE IIG1 - PROPOSED ATTENUATION FACILITY SUMMARY DATA ......................................................34 TABLE IIH4 – Water Surface Comparison at Steelhead Creek (NEMDC)................................................................39 FIGURE IIIA3 – Comparison of Pre- and Post-project water levels at Project Boundaries .......................................45 TABLE IIIB1 - Culvert Sizing ....................................................................................................................................46 TABLE III.F.1 – ULOP APPLICABILITY QUESTIONAIRRE ...............................................................................65 TABLE IVA1 – PRELIMINARY REGIONAL SWQ BASIN SIZING .....................................................................71 TABLE IV.A.1: Proposed LID % Impervious Reductions: ........................................................................................74 TABLE IVB1 – LID Included Post Project Hydrologic Factors .................................................................................76 TABLE IVB2 – LID Included Post Project Hydrologic Factors (Cont)......................................................................77 TABLE IVB3 – LID Included Post Project Hydrologic Factors (Cont)......................................................................78 TABLE VA1 - 1986 8-Day Rainfall Totals.................................................................................................................84 TABLE VA2 - Adjusted Rainfall Depths for Elevation ..............................................................................................85 TABLE VB1 - VOLUMETRIC IMPACTS SUMMARY TABLE.............................................................................86 TABLE VB2 - VOLUMETRIC IMPACTS COMPUTATIONS ................................................................................87 TABLE VB3 – PROPOSED RETENTION LOCATIONS.........................................................................................88
Placer Vineyards - Master Project Drainage Study Page 4 of 160
Civil Engineering Solutions, Inc. MAY 2014
List of Figures FIGURE I.1 - LOCATION MAP ..................................................................................................................................5 FIGURE IIA2 – WATERSHED SOILS DELINEATIONS........................................................................................10 FIGURE IIF1A – DRY CREEK WATERSHEDS......................................................................................................32 FIGURE IIIA1 - FIRM MAP 475F .............................................................................................................................43 FIGURE IIIA2 - FIRM MAP 458F .............................................................................................................................44 FIGURE IIIC1 – PROJECT SCHEMATIC ................................................................................................................49 FIGURE IIIC2 – SECTIONS A-C ..............................................................................................................................50 FIGURE IIIC3 – SECTIONS D-F...............................................................................................................................51 FIGURE IIIC4 – SECTIONS G-I................................................................................................................................52 FIGURE IIIC5 – SECTIONS J-L................................................................................................................................53 FIGURE IIIC6 – SECTIONS M-O .............................................................................................................................54 FIGURE IIIC7 – SECTIONS P-R...............................................................................................................................55 FIGURE IIIC8 – SECTIONS S-U...............................................................................................................................56 FIGURE IIIC9 – SECTIONS V-X ..............................................................................................................................57 FIGURE IIIC10 – SECTIONS Y-Z ............................................................................................................................58 FIGURE IIIE1 – DIVERSION STRUCTURE SCHEMATIC...................................................................................61 FIGURE IIIE2 – DRAINAGE SYSTEM SCHEMATIC...........................................................................................62 FIGURE IVA1 – STORMWATER QUALITY EXHIBIT .........................................................................................69 FIGURE IVA2 – TREATED AND UNTREATED WATERS...................................................................................70 (Oversized) Exhibit SH-1 - Pre-Project HEC-1 Shed Map Exhibit SH-2 - Post-Project HEC-1 Shed Map Exhibit SOIL-1 - Project Area Hydrologic Soil Types Exhibit FP-1A & FP-1B - Pre-Project Flood Map for 10-year and 100-year Exhibit FP-2A & FP-2B - Pre-Project Extreme Event Flood Maps (500-200) Exhibit FP-3A & FP-3B - Post-Project FFDU Flood Maps (10yr & 100yr) Exhibit FP-4A & FP-4B - Post-Project FFDU Extreme Event (500-200) Exhibit SD-1A & SD-1B - Trunk Storm Drainage System Maps Exhibit SF-1A & SF-1B - Special Facilities Exhibit Exhibit SWQ-1A & SWQ-1B- Stormwater Quality Exhibit Exhibit AT-1A & AT-1B - Attenuation Exhibit for 100-year Event Exhibit RET-1A & RET-1B - Volumtric Mitigation Exhibit Exhibit UL-1A & UL-1B - Regional ULOP Applicability by Stream Exhibit UL-2 - Project Area Finding of Fact Areas Exhibit UL-3 - Dry Creek Finding of Fact Areas
Placer Vineyards - Master Project Drainage Study Page 5 of 160
Civil Engineering Solutions, Inc. MAY 2014
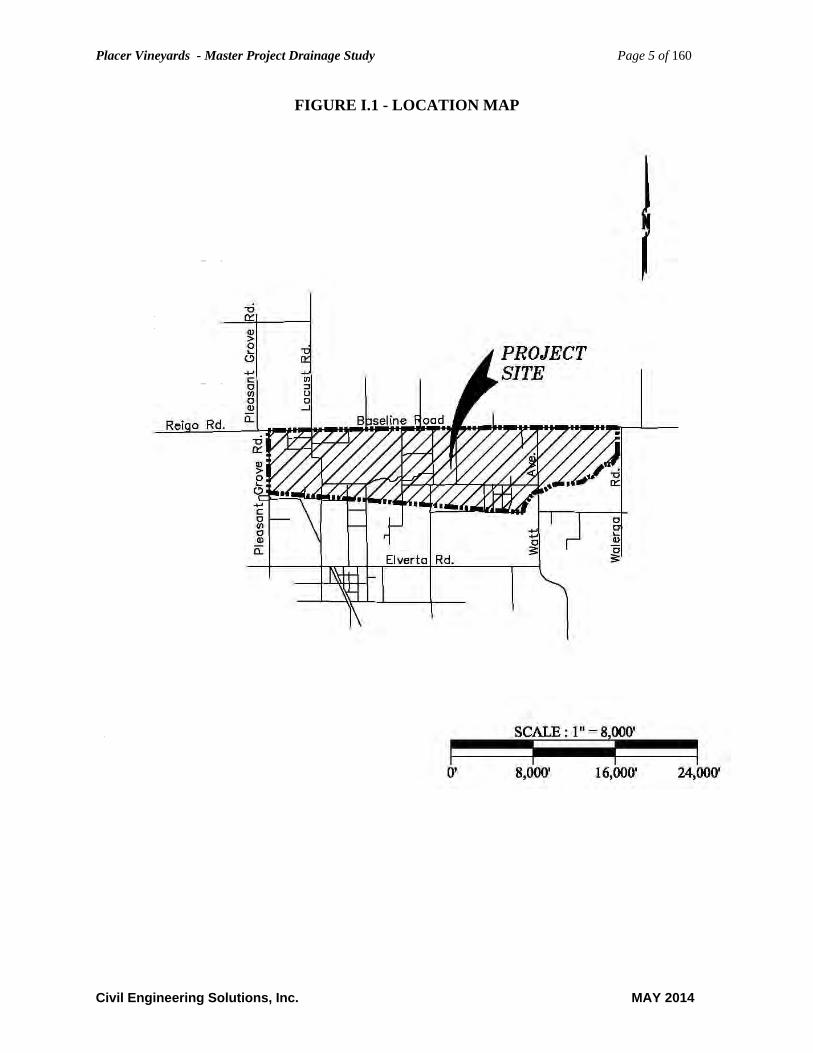
FIGURE I.1 - LOCATION MAP
Placer Vineyards - Master Project Drainage Study Page 6 of 160
Civil Engineering Solutions, Inc. MAY 2014
I. Introduction: The proposed Placer Vineyards development includes roughly 5200 acres of proposed mixed use development. The project development would include mixed zoning for residential, commercial, business professional, light industrial, commercial, schools, parks and open space. The project is located in the extreme western portion of Placer County near the Sutter County border and adjacent to Sacramento County along the southern project boundary. Similar but smaller developments are occurring adjacent to the eastern project boundary with the Morgan Creek and Doyle Ranch subdivisions. The project is tributary to three (3) regional watersheds. The southeastern area of the project drains directly to the Dry Creek floodplain which bounds the project at this location. The northeast area of the project drains to Curry Creek which is ultimately tributary to the Natomas Cross Canal north of the project. The remainder of the project drains through tributaries of the Steelhead Creek, formerly known(and referenced in the calculations and in this study) as the Natomas East Main Drainage Canal (NEMDC) which flows north to south, west of the project conveying flows to the American River. Mitigation of impacts to peak flow rates, resulting from the additional impervious surfaces and proposed drainage systems, would be provided within the project by providing additional attenuation at the following facilities : existing floodplain, flood control channels, upstream of proposed culvert facilities, detention basins and water quality treatment basins. The hydrology analysis included with this project provides analysis of 13.2 square miles of tributary area of the previously mentioned watershed areas surrounding the project. A detailed hydraulic analysis of the onsite creeks, swales and channels was performed for the pre-project and post-project conditions for this project. Floodplains are delineated on the included exhibits. In November of 2013, the hydrology analysis was updated. For Dry Creek, the hydrology analysis was updated to use the base analysis data provided with the “Update to the Dry Creek Watershed Plan” (2010) provided by the Placer County Flood Control and Water Conservation District. The hydrology basis for the Curry Creek areas was also updated to be consistent with the studies performed with the 2011 FEMA CTP MAS #1, which created new FEMA basis studies for Curry Creek. All calculations and analysis included in this study were prepared in accordance with the “Preliminary Plan” requirements of the “Stormwater Management Manual (SWMM)” dated September 1, 1990 and the SWMM Addendum 1, dated October 1997. HEC-1 files were generated using the Placer County Pre-processor utility and the PDP precipitation generation software. November 2013 updates, used PDP version 2 which corrects some of the raingall distribution amounts (identified in the Dry Creek Watershed Pan Update) and adds flexibility in process control. This study was revised in August of 2005 for an updated Land Use Plan developed by EDAW in June of 2005. Additionally, the system of flood control facilities were revised to preserve “avoidance” areas, where sensitive facilities exist pre-project, such as wetlands, or critical habitat. In addition to avoiding impact to these facilities from the construction of the flood
Placer Vineyards - Master Project Drainage Study Page 7 of 160
Civil Engineering Solutions, Inc. MAY 2014
control facilities directly, the revised plan includes provisions to maintain the hydrology of these features, by preserving the mean annual and peak annual flow rates through them. In January of 2006, this study was revised again in response to comments from the County, and a consistency review performed by WRIME. More onsite attenuation was added to the project to mitigate offsite impacts in peak flow rates and water surface elevations. Also, the Steelhead Creek impacts analysis was also incorporated into the plan. In August of 2006, this study was revised in response to comments from Sacramento County Department of Water Resources. The comments from Sacramento County requested that the project watershed delineations for the Placer Vineyards project offsite, match the Elverta Specific Plan, and that the Elverta Specific Plan offsite sheds match the Placer Vineyards Project areas. We obtained digital shed maps and topographic maps for the Elverta Plan area, and modified the Placer Vineyards Hydrology for the corrected offsite watershed delineations. The most significant change occurs at the EMGS24B shed area which was found to be tributary to Dry Creek via the Gibson Park Lake. The changes also affect the analysis of Steelhead Creek Flood elevations and flowrates. The changes of this revision did not modify the relative impact of the project at Steelhead Creek and Curry Creek. The EMGS24B watershed change is modifies the Dry Creek hydrology and is discussed in the Dry Creek section of this document. In November of 2013, this study was amended to include information that was requested by Placer County, and the Placer County Flood Control and Water Conservation District. Additional information was requested regarding the design and operation of several of the special flow separation structures identified in this study. In addition, it was requested that the report be ammended to include the necessary information for evaluation under post 2015 SB-5 and MS4 permit criteria. For SB-5, this means that the Urban Levee Design Criteria (ULDC) and the Urban Level of Flood Protection (ULOP) criteria needs to be evaluated for the project. For the MS4 permit (stormwater quality), a new MS4 permit was implemented in July of 2013 which phases in several new permit criteria, including mandatory Low Impact Development, and Hydrograph Modification criteria which goes into effect in July of 2015. This Study was finalized in May of 2014 to include final analysis of the NEMDC impacts and recommended mitigation of 25 AF of retention storage for that impact.
Placer Vineyards - Master Project Drainage Study Page 8 of 160
Civil Engineering Solutions, Inc. MAY 2014
II. Hydrology: The Army Corps HEC-1 software was utilized to develop the included hydrologic models for the proposed Placer Vineyards project. II.1 Standards: The Placer County PDP software was utilized to determine precipitation rates for the design events 2-year, 10-year, 100-year, 200-year and 500-year. Elevation data for each watershed centroid was input into the “DAT” file. The “.DAT file was fed into the PDP2 program to generate the HEC-1 input (.in) file for each event. Storm centering was not utilized in this analysis. II.2 Soils:
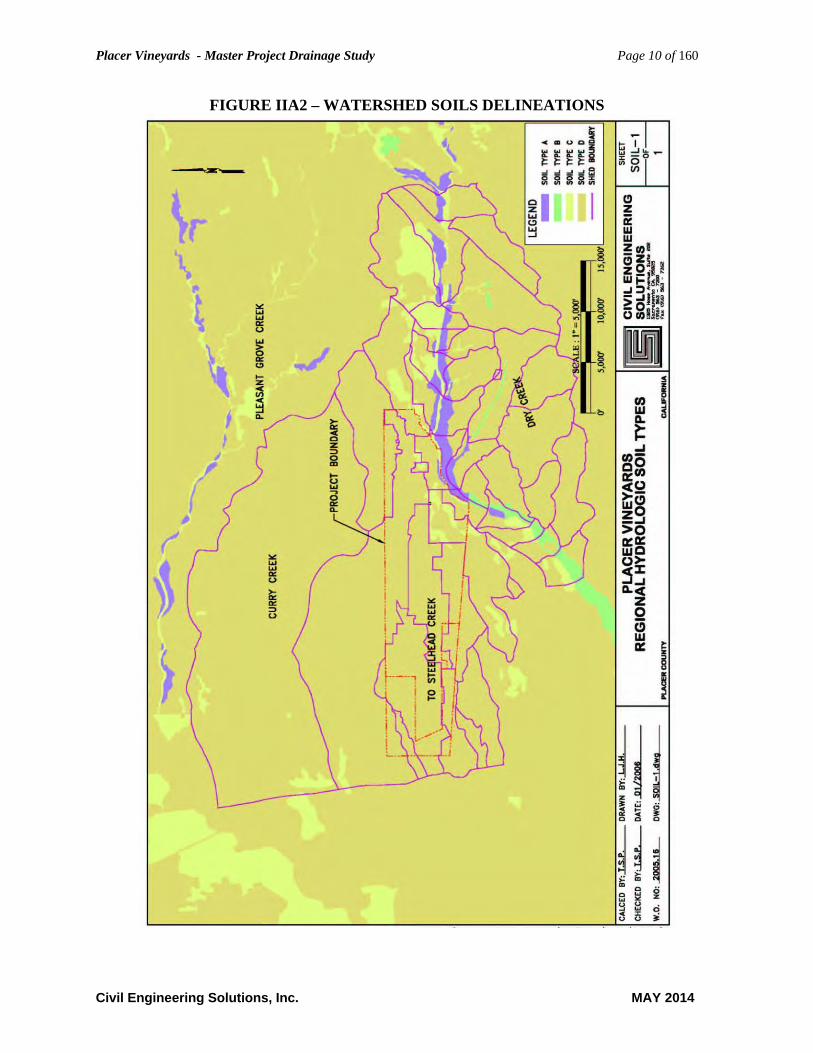
Figure IIA2 shows the hydrologic soils delineation for the project watershed areas. The
soil type delineation was obtained from the “Soil Survey of Placer County, California Western Part”. The delineation is shown on the attached shed maps.
The analysis included with this study shows that three hydrologic soil types exist within
the limits of the project boundary. Soils are classified into four hydrologic Categories:
GROUP A : Consist of soils that have a high infiltration rate when thoroughly wet. These soils have a high rate of water transmission and low runoff potential. They area deep, well drained or excessively drained, and consist chiefly of sand, gravel, or both. No soils in this project are in Group A.
GROUP B : Consist of soils having a moderate infiltration rate when thoroughly wet. These soils have a moderate runoff potential. They are moderately deep, well drained, and area medium in texture to moderately course in texture.
GROUP C : Consist of soils having a slow infiltration rate when thoroughly wet. These soils have a slow rate of water transmission and high runoff potential. The have soil layers which impede downward movement of water and have a slow infiltration rate.
GROUP D : Consist of soils having a slow infiltration rate when thoroughly wet. The rate of water transmission is very slow, and runoff potential is very high. This group includes:
a. clay soils that have high shrink-swell potential b. soils that have a permanent high water table c. soils that have a clay pan or clay layer at or near the surface and d. soils that are shallow over nearly impervious material
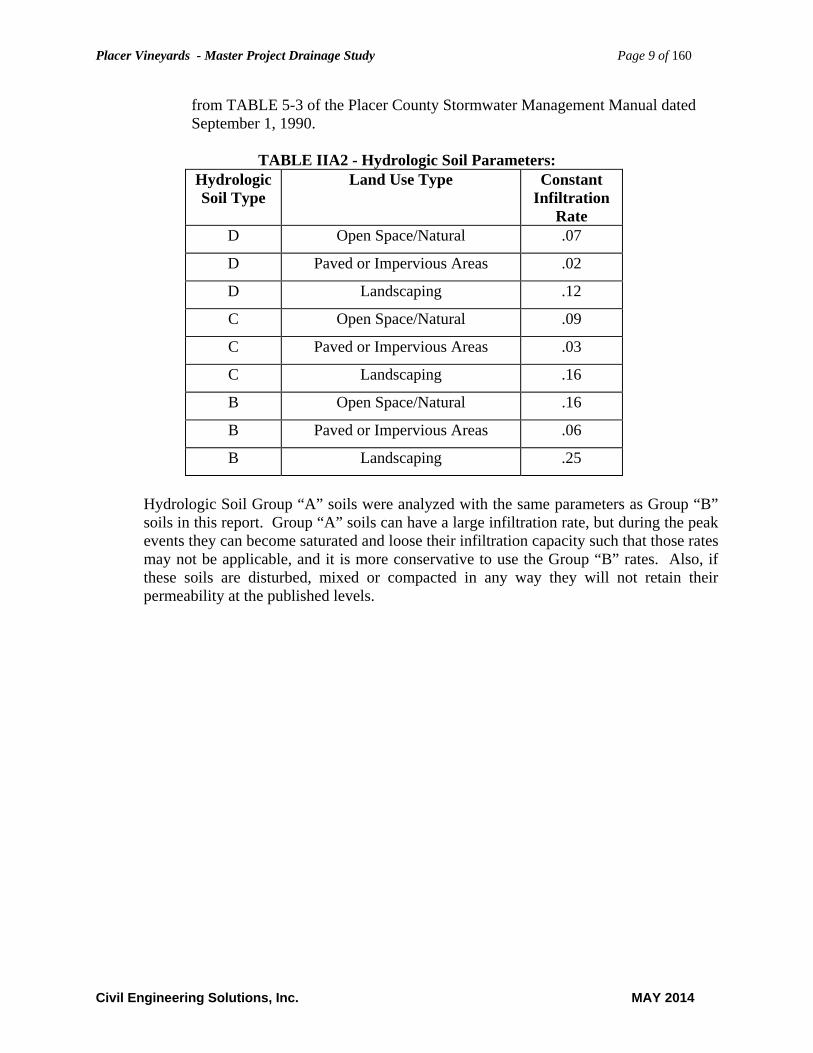
The constant soil infiltration rates listed on the following table, by land use are
Placer Vineyards - Master Project Drainage Study Page 9 of 160
Civil Engineering Solutions, Inc. MAY 2014
from TABLE 5-3 of the Placer County Stormwater Management Manual dated September 1, 1990.
TABLE IIA2 - Hydrologic Soil Parameters:
Hydrologic Soil Type
Land Use Type Constant Infiltration
Rate D Open Space/Natural .07
D Paved or Impervious Areas .02
D Landscaping .12
C Open Space/Natural .09
C Paved or Impervious Areas .03
C Landscaping .16
B Open Space/Natural .16
B Paved or Impervious Areas .06
B Landscaping .25
Hydrologic Soil Group “A” soils were analyzed with the same parameters as Group “B” soils in this report. Group “A” soils can have a large infiltration rate, but during the peak events they can become saturated and loose their infiltration capacity such that those rates may not be applicable, and it is more conservative to use the Group “B” rates. Also, if these soils are disturbed, mixed or compacted in any way they will not retain their permeability at the published levels.
Placer Vineyards - Master Project Drainage Study Page 10 of 160
Civil Engineering Solutions, Inc. MAY 2014
FIGURE IIA2 – WATERSHED SOILS DELINEATIONS
Placer Vineyards - Master Project Drainage Study Page 11 of 160
Civil Engineering Solutions, Inc. MAY 2014
II.3 Land Use:
Civil Solutions was provided with a proposed land use map for the project areas. The post-project land uses are shown on exhibit SH-2. The shed areas in the HEC-1 file were subdivided into a sufficient number of sub-sheds such that each amount of soil type and land use could be specified independently. The individual factors are presented in Tables IIA1-3 and IIB1-3 of this report.
Updated Land Use was provided in July 2013 for the purposes of this ammendment. The
main changes of this updated land use map designated previously identified development areas as open space per changes made while the project was being reviewed for regulatory permitting. The updated land use is represented in the figures included with this amended version of the report.
II.4 Other Factors:
Precipitation rates for the 100-foot elevation were utilized throughout this analysis. For the Natomas East Main Drainage Canal (NEMDC – also known as Steelhead Creek) and Curry Creek, storm centering was not utilized in this analysis. While an overall study area of 13.2 square miles does generally require the use of Storm Centering analysis, the individual tributaries studied in this analysis were not of sufficient size to their exit points from the project that Storm Centering would have any effect. Storm Centering was used in the evaluations of Dry Creek and Dry Creek tributaries.
Overland flow Manning’s ‘n’ values were estimated using Table 5-5 of the SWMM and range from 0.11 for roadways and pavement areas to 0.4 to 0.6 for open space and wooded areas. A value of 0.24 was utilized for future landscaped areas including single family residences. In general the included models were developed with a pervious areas shed element and a directly connected impervious areas shed element.
II.5 Watershed Delineation:
The lands of the proposed project are divided between three major watersheds: Dry Creek, Curry Creek and Steelhead Creek (NEMDC). For the post-project analysis, watershed boundaries were adjusted to conform to the estimated development requirements. Total tributary to each watershed closely matches the pre-project parameters but minor adjustments were made for the above mentioned purpose. In addition, some minor areas of the watersheds were diverted to pass through project detention facilities rather than release un-detained flows into an existing tributary.
For the pre-project analysis. the project site area was divided into watersheds utilizing the
project topography maps (1 and 2 foot contours), which we supplemented with USGS topography maps and CVFED Task Order 13 LiDAR information for areas beyond the project boundary. Flow paths through and off the site for both the pre-project and post project conditions were identified (see shed maps SH-1 and SH-2). Existing drainage
Placer Vineyards - Master Project Drainage Study Page 12 of 160
Civil Engineering Solutions, Inc. MAY 2014
paths and culverts were identified using the topographic information and field survey information. For the post project condition, the sub-watersheds were further subdivided to account for the proposed site alterations including: changes in infiltration rate due to grading, changes in impermeability due to roofs and paving, and changes in sub-watershed boundary locations due to the proposed piping and grading.
In November of 2013. the project analysis was updated to be consistent with Dry Creek
Watershed Plan Update (PCFCWCD) and the FEMA Placer Streams CTP study for Curry Creek (PCFCWCD). The Dry Creek portion of the study also utilizes HEC-1 and HEC-HMS to generate DSS files for the inflow hydrographs used in the Dry Creek HEC-RAS Hydraulic Routing Model. The Dry Creek Desktop software toolbox is used to convert HEC-1 input with an ELTROID.DAT file to an HEC-HMS file structure for the final hydrology computations.
Placer Vineyards - Master Project Drainage Study Page 13 of 160
Civil Engineering Solutions, Inc. MAY 2014
II.A Pre-Project Model: II.A.1 Site Area Model
A site specific model has been created. The model includes only drainage areas of the project and in the local area of the project. All three required model types (pre-project, post-project unmitigated and post-project mitigated) were developed. This model was used for computing required detention basin volumes and impacts at the project boundary. The HEC-1 and HEC-HMS files for these models are included on the CDROM provided with this document within the “HEC-1" directory. (Due to the size, the Dry Creek files are provided separately requiring several DVD’s to deliver)
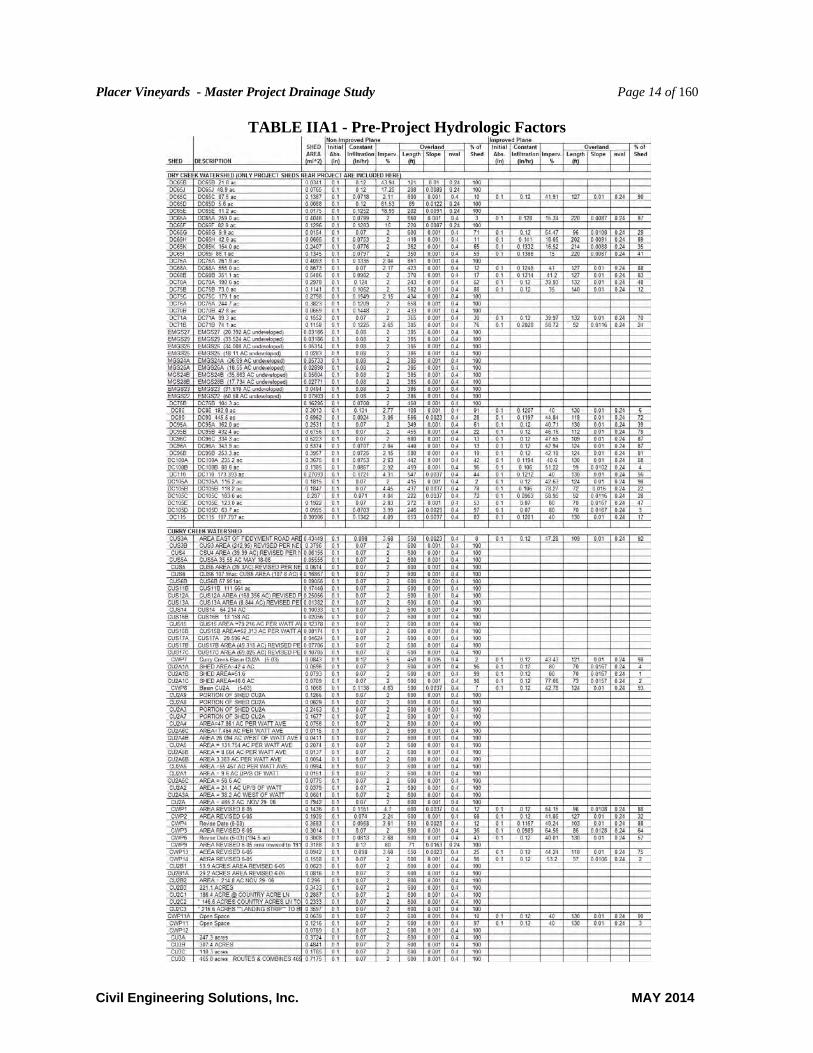
The Pre-project watershed factors were applied in the HEC-1 analysis as summarized in
TABLE IIA1 through TABLE IIA3.
Placer Vineyards - Master Project Drainage Study Page 14 of 160
Civil Engineering Solutions, Inc. MAY 2014
TABLE IIA1 - Pre-Project Hydrologic Factors
Placer Vineyards - Master Project Drainage Study Page 15 of 160
Civil Engineering Solutions, Inc. MAY 2014
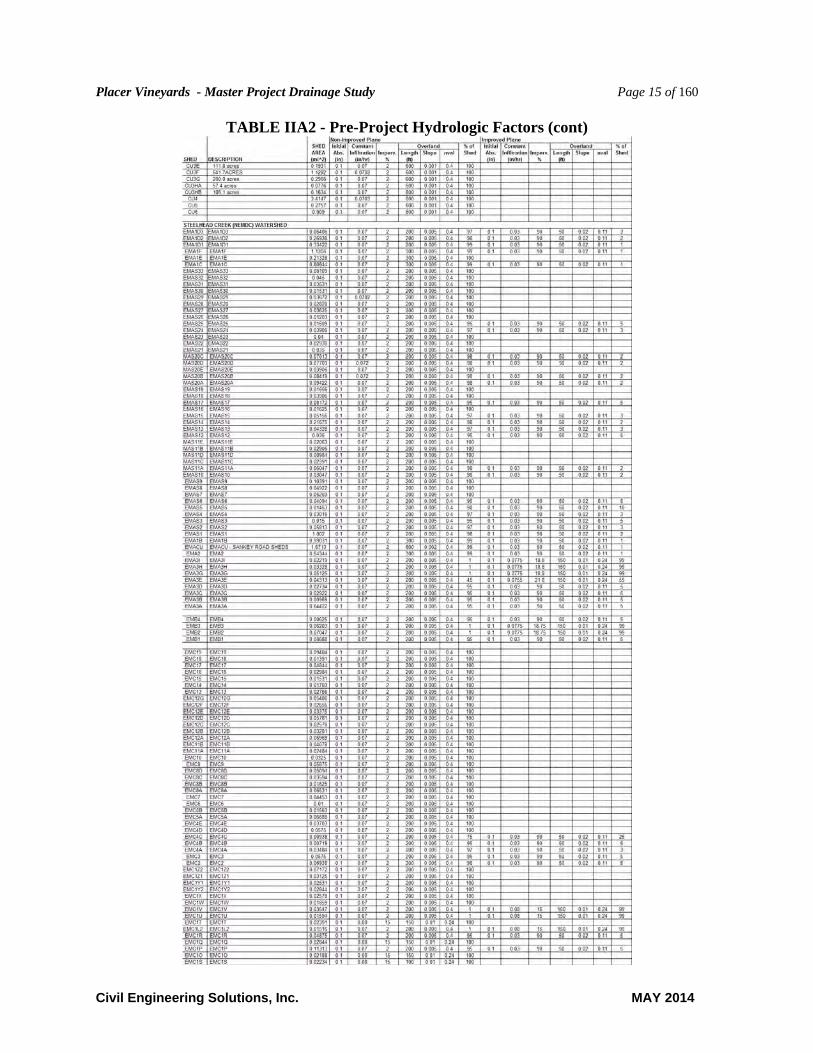
TABLE IIA2 - Pre-Project Hydrologic Factors (cont)
Placer Vineyards - Master Project Drainage Study Page 16 of 160
Civil Engineering Solutions, Inc. MAY 2014
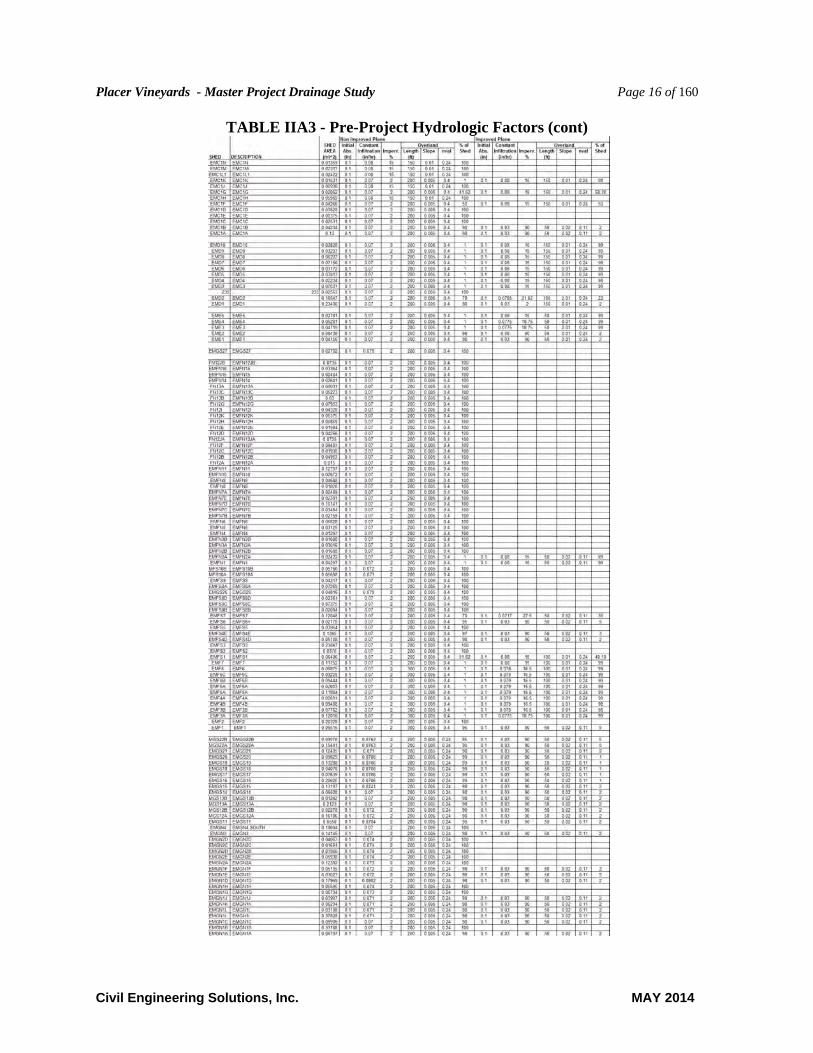
TABLE IIA3 - Pre-Project Hydrologic Factors (cont)
Placer Vineyards - Master Project Drainage Study Page 17 of 160
Civil Engineering Solutions, Inc. MAY 2014
In November 2013, the project hydrology analysis was supplemented with hydraulic
routing capaibilities using HEC-RAS unsteady state modeling. This was a substantial element of the Dry Creek Update Plan, and it was further incorporated into the Curry Creek and NEMDC watersheds for this project plan update due ot the need for a basis of comparison in the hydrograph modification analysis. Hydraulic Routing utilizes the hydraulic analysis of the main floodplains to pass the inflow hydrographs (developed in the HEC-1 hydrology analysis), through the model area. This provides an improved(better than PULS routing method) basis of evaluation of the detention and floodplain storage volume’s effect on the peak flow and overall runoff of the project based on the existing and proposed conditons. This was performed for all storm events and land use conditions studied in this report. The results of this type of analysis, permit the comparison of the complete flow hyrographs for particular events rather then just the peak flows such as those listed in Tables IIA3A and IIA4b. Unfortunately, this methodology makes it more difficult to summarize the peak flow conditions data that is provided in these tables as they must be obtained from the HEC-RAS output data and DSS files rather then from simple text formatted HEC-1 output data.
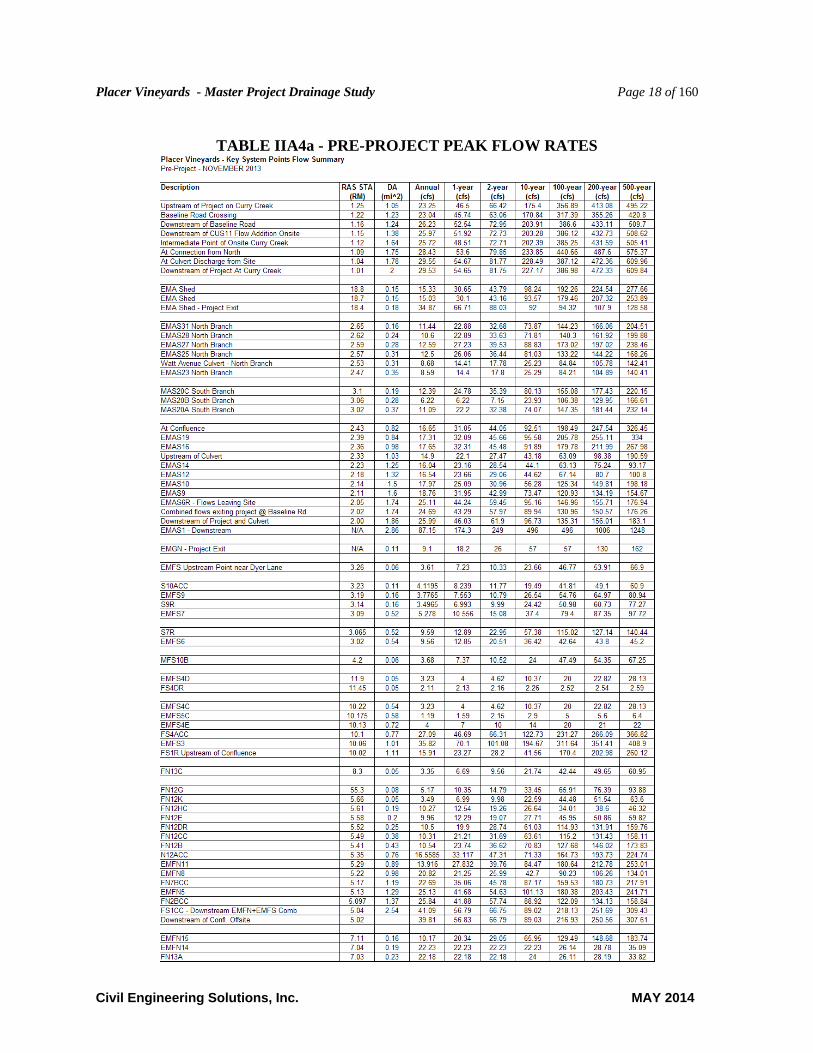
Table IIA4a and IIA4b lists the computed Pre-project peak flow rates for the 2-year
through the 500-year events, at project flow exit points. The base HEC-1 file for PDP2 input for the pre-project conditions is shown in Appendix A. Detailed in-project flow rates are provided in Section III of this report.
For the November 2013 amendment, the revised methodologies above do not permit the
direct the solution for the “Mean Annual” and “1-year” event previously documented in the study, because the PDP2 software must be used for the generation of the precipitation cards in the semi-automated process. Instead to derive these event flows, they were estimated based on the 2-year event. It is estimated that the mean annual event can be generated by using the 2-year event hydrographs reduced to 35% of the 2-year flow rates. For the 1-year event, it was estimated that this event can be produced by using 70% of the 2-year inflow rates. To generate these events, multipliers were used on the 2-year event inflow hydrographs to the HEC-RAS hydraulic routing models. Executing runs with very small inflows can result in intabilities in the HEC-RAS hydraulic routing models. Therefore, minimum allowable flow rates are specified in the models to maintain stability. For these small events, the specification of minimum flow rate can exceed the computed flow rates at certain points in the system and the reported flow rates can be artificially inflated by the minimum flow rate specifications.
Placer Vineyards - Master Project Drainage Study Page 18 of 160
Civil Engineering Solutions, Inc. MAY 2014
TABLE IIA4a - PRE-PROJECT PEAK FLOW RATES

Placer Vineyards - Master Project Drainage Study Page 19 of 160
Civil Engineering Solutions, Inc. MAY 2014
TABLE IIA4b - PRE-PROJECT PEAK FLOW RATES

Placer Vineyards - Master Project Drainage Study Page 20 of 160
Civil Engineering Solutions, Inc. MAY 2014
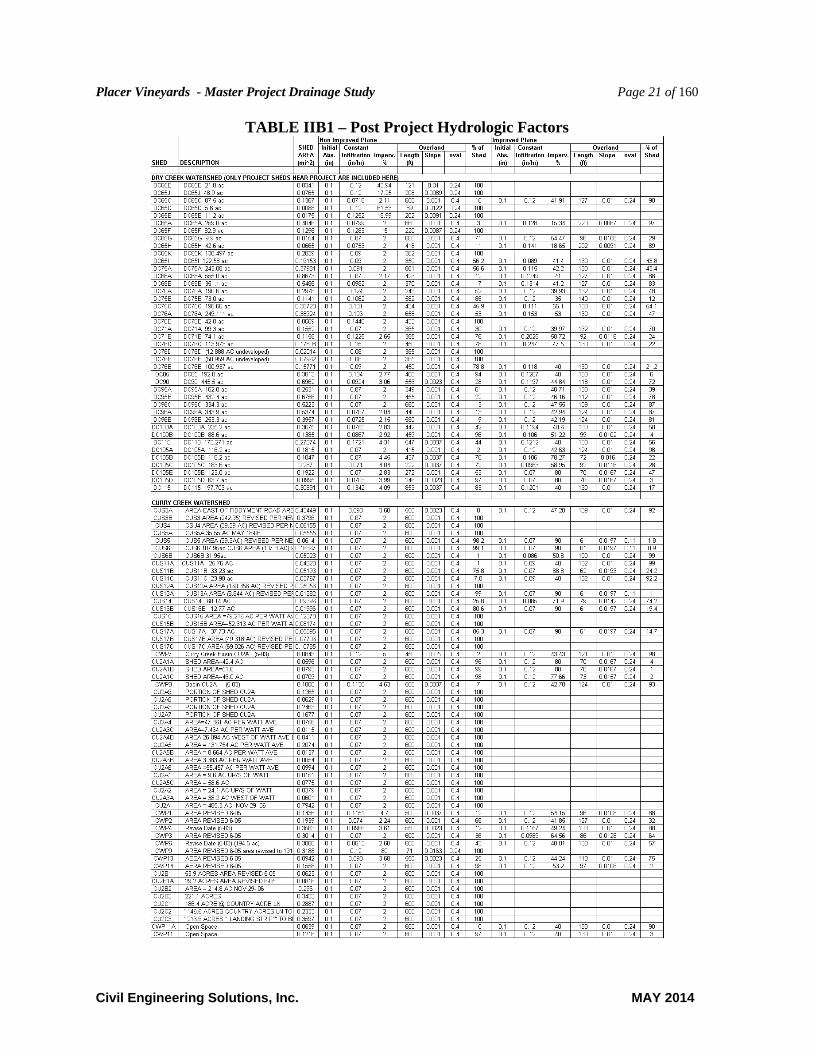
II.B Post-Project Model: Civil Solutions prepared a modified post project hydrologic model based on the proposed
project land use information and the soils delineation boundaries. This study is based on the updated plan information shown on Exhibits SH-2. Tables IIB1, IIB2, and IIB3 identify the watershed factors utilized in the analysis.
Placer Vineyards - Master Project Drainage Study Page 21 of 160
Civil Engineering Solutions, Inc. MAY 2014
TABLE IIB1 – Post Project Hydrologic Factors
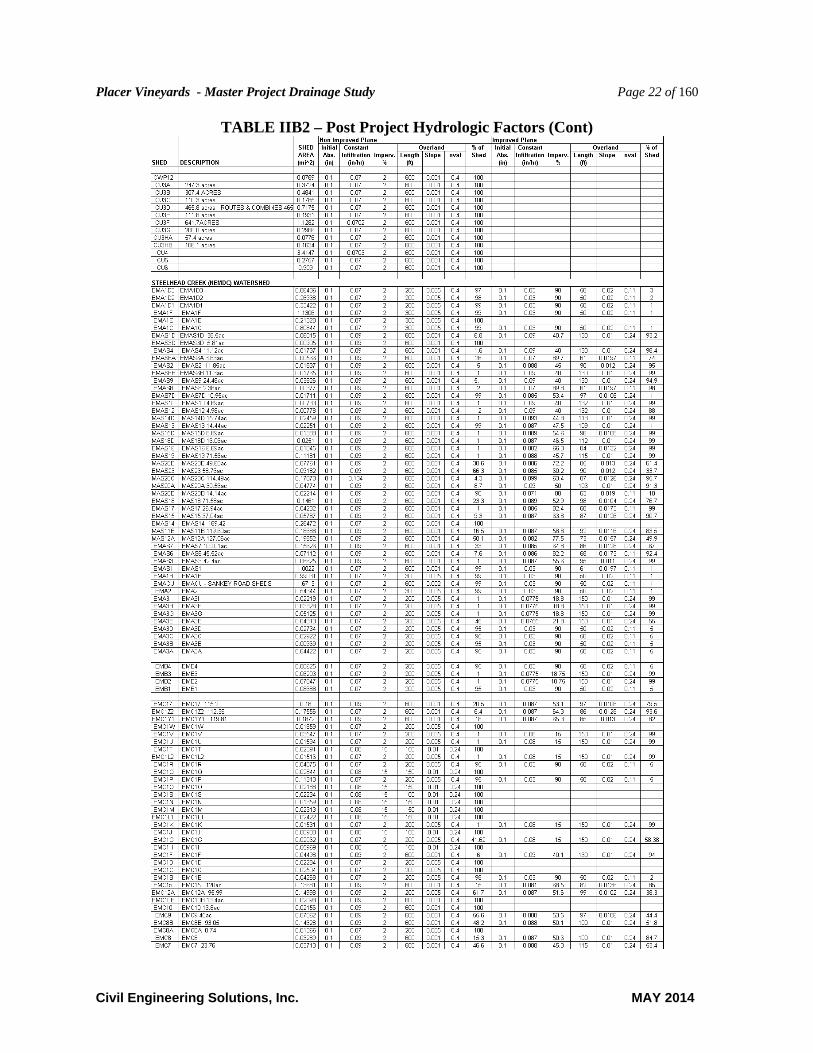
Placer Vineyards - Master Project Drainage Study Page 22 of 160
Civil Engineering Solutions, Inc. MAY 2014
TABLE IIB2 – Post Project Hydrologic Factors (Cont)

Placer Vineyards - Master Project Drainage Study Page 23 of 160
Civil Engineering Solutions, Inc. MAY 2014
TABLE IIB3 – Post Project Hydrologic Factors (Cont)

Placer Vineyards - Master Project Drainage Study Page 24 of 160
Civil Engineering Solutions, Inc. MAY 2014
Exhibit SH-2 shows the shed boundaries for the post-project analysis. With the updated analysis for the November 2013 submittal, the inclusion of a Hydraulic Routing model, means that the post project routing conditions are inherently included in all post project conditions analysis. This makes it non-feasible to provide a unmitigated analysis for the post-proejct conditions that would be comparable to the other scenarios, as the routing characteristics cannot be easily removed from the model. The input PDP file for the post-project mitigated solution is provided in Appendix B.
II.C Post-Project Mitigated Model:
A Post-project Mitigated model was developed to represent the post-project hydrologic conditions of the Placer Vineyards project development area. The mitigated model includes attenuation parameters for the proposed detention facilities, proposed water quality facilities, proposed lakes and proposed wetland areas. The Base HEC-1 PDP input file is included in Appendix B.
Attenuation for mitigation of peak flow rate increases is provided within the project at
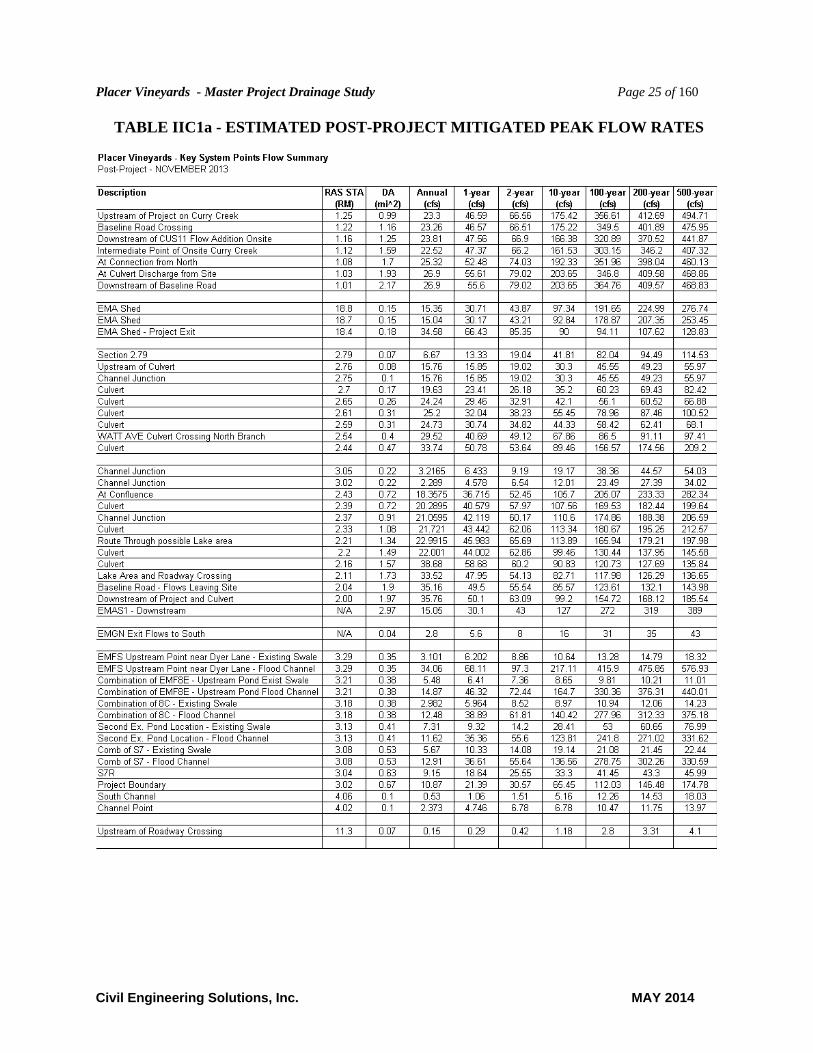
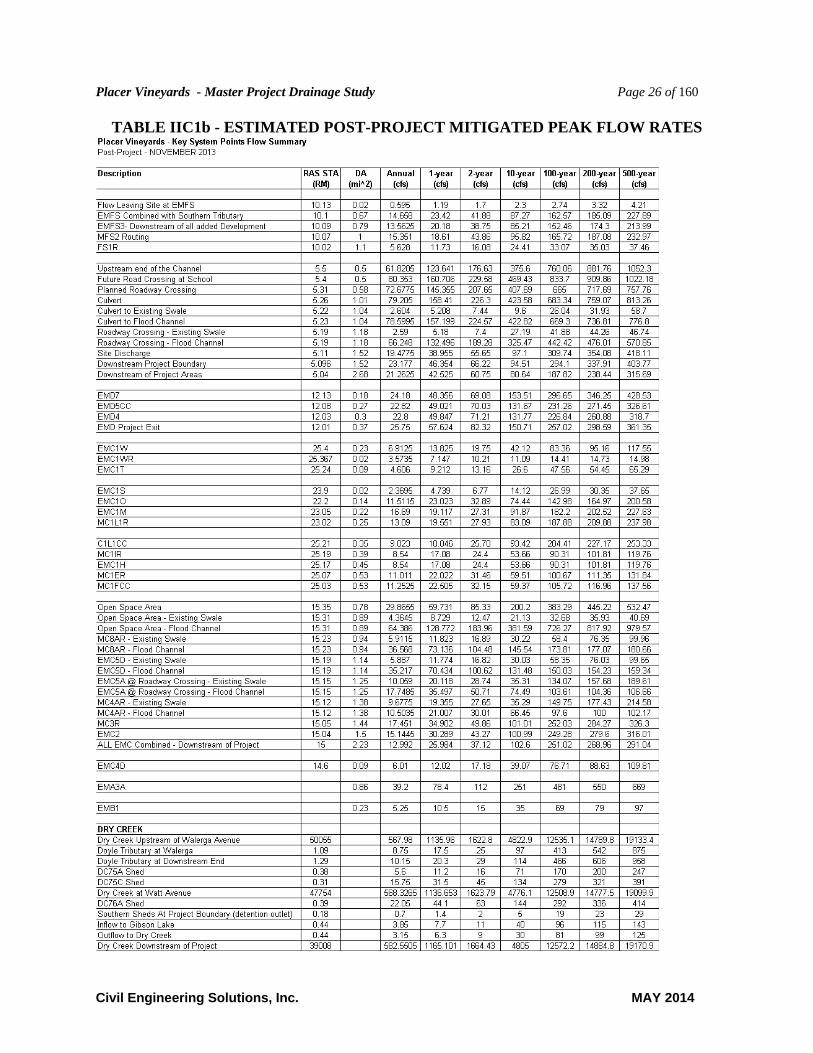
proposed attenuation and lake storage locations. Storage and flow rate values determined in the HEC-RAS unsteady state hydraulic routing analysis. At the proposed detention and water quality facilities inflow/outflow/storage rating curve information was developed from the proposed grading parameters and design outflow pipe sizes. The estimated peak flow rates for the post-project conditions are shown in TABLES IIC1a and IIC1b.
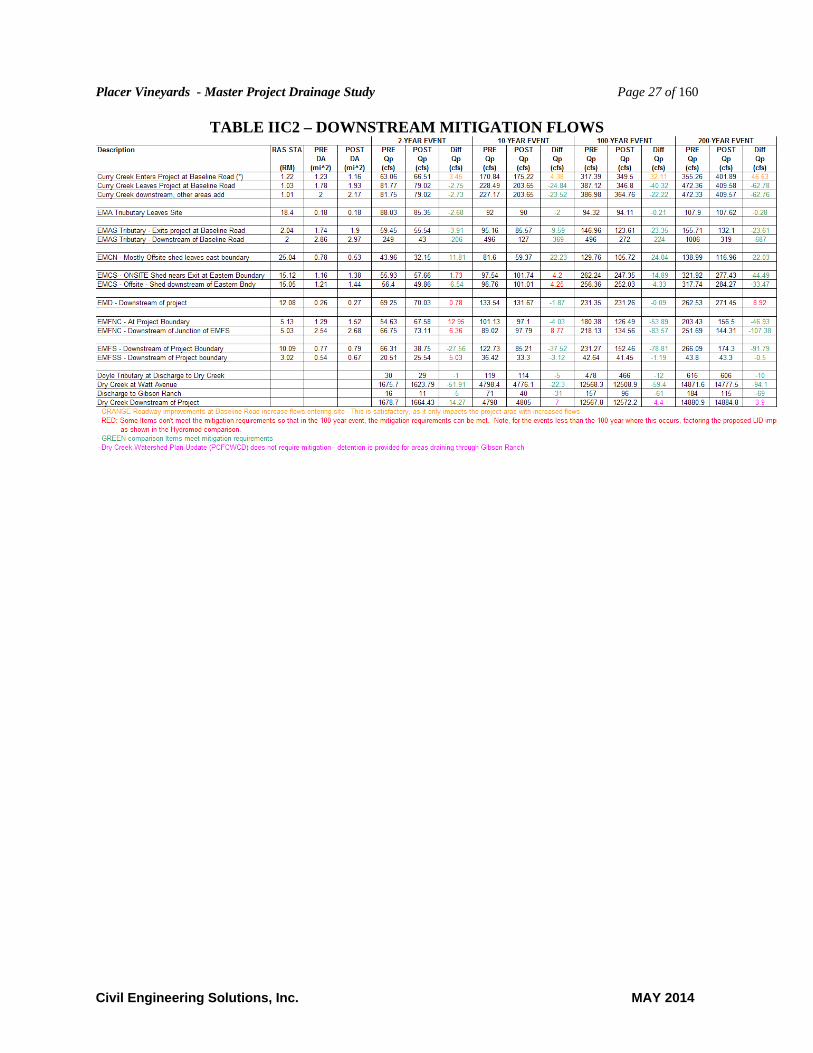
TABLE IIC2 demonstrates that the mitigation objectives per section VII of the
Stormwater Management Manual are achieved downstream of the project contribution areas.
Each phase of the development will be required, at a minimum, to mitigate the volumetric impacts of that phase at the time of development. Mitigation beyond a phase's individual impacts may be required by the County in order to construct, or complete construction, of Permanent Drainage Facilities per the requirements of the Development Agreement.
Placer Vineyards - Master Project Drainage Study Page 25 of 160
Civil Engineering Solutions, Inc. MAY 2014
TABLE IIC1a - ESTIMATED POST-PROJECT MITIGATED PEAK FLOW RATES
Placer Vineyards - Master Project Drainage Study Page 26 of 160
Civil Engineering Solutions, Inc. MAY 2014
TABLE IIC1b - ESTIMATED POST-PROJECT MITIGATED PEAK FLOW RATES
Placer Vineyards - Master Project Drainage Study Page 27 of 160
Civil Engineering Solutions, Inc. MAY 2014
TABLE IIC2 – DOWNSTREAM MITIGATION FLOWS

Placer Vineyards - Master Project Drainage Study Page 28 of 160
Civil Engineering Solutions, Inc. MAY 2014
II.D Future Fully Developed Unmitigated Model:
A Post-project model was developed to represent the post-project hydrologic conditions of the Placer Vineyards project development area, which includes the offsite fully developed and unmitigated conditions for all upstream areas. This analysis is used in the final hydraulics analysis as a special case “what if” scenario for verifying that these flow rates can pass through the project without resulting in damages within the project areas. The Offsite Unmitigated model includes attenuation parameters for the proposed detention facilities, proposed water quality facilities, proposed lakes and proposed wetland areas. The Base HEC-1 PDP input file is included in Appendix B.
The estimated peak flow rates for the post-project conditions are shown in TABLES
IID1a and IID1b.

Placer Vineyards - Master Project Drainage Study Page 29 of 160
Civil Engineering Solutions, Inc. MAY 2014
TABLE IID1a - ESTIMATED POST-PROJECT OFFSITE UNMITIGATED PEAK FLOW RATES

Placer Vineyards - Master Project Drainage Study Page 30 of 160
Civil Engineering Solutions, Inc. MAY 2014
TABLE IID1b - ESTIMATED POST-PROJECT OFSITE UNMITIGATED PEAK FLOW RATES
Placer Vineyards - Master Project Drainage Study Page 31 of 160
Civil Engineering Solutions, Inc. MAY 2014
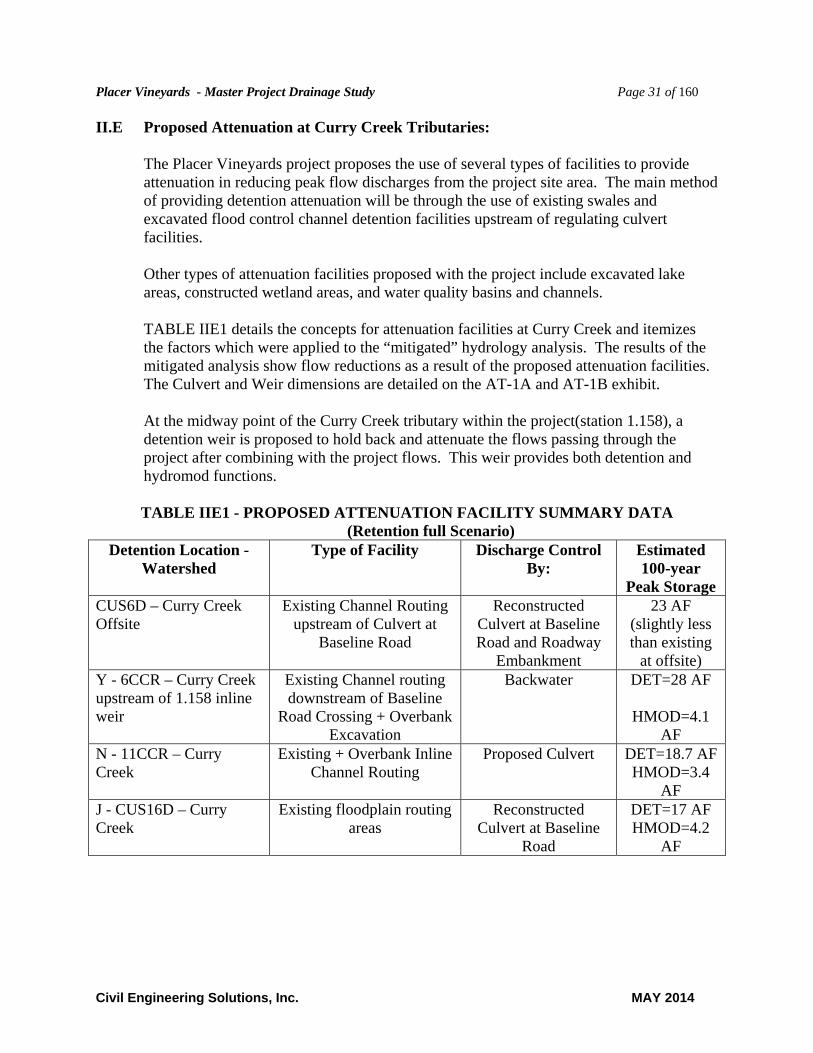
II.E Proposed Attenuation at Curry Creek Tributaries: The Placer Vineyards project proposes the use of several types of facilities to provide
attenuation in reducing peak flow discharges from the project site area. The main method of providing detention attenuation will be through the use of existing swales and excavated flood control channel detention facilities upstream of regulating culvert facilities.
Other types of attenuation facilities proposed with the project include excavated lake
areas, constructed wetland areas, and water quality basins and channels.
TABLE IIE1 details the concepts for attenuation facilities at Curry Creek and itemizes the factors which were applied to the “mitigated” hydrology analysis. The results of the mitigated analysis show flow reductions as a result of the proposed attenuation facilities. The Culvert and Weir dimensions are detailed on the AT-1A and AT-1B exhibit. At the midway point of the Curry Creek tributary within the project(station 1.158), a detention weir is proposed to hold back and attenuate the flows passing through the project after combining with the project flows. This weir provides both detention and hydromod functions. TABLE IIE1 - PROPOSED ATTENUATION FACILITY SUMMARY DATA
(Retention full Scenario) Detention Location -
Watershed Type of Facility Discharge Control
By: Estimated 100-year
Peak Storage CUS6D – Curry Creek Offsite
Existing Channel Routing upstream of Culvert at
Baseline Road
Reconstructed Culvert at Baseline Road and Roadway
Embankment
23 AF (slightly less than existing
at offsite) Y - 6CCR – Curry Creek upstream of 1.158 inline weir
Existing Channel routing downstream of Baseline
Road Crossing + Overbank Excavation
Backwater DET=28 AF
HMOD=4.1 AF
N - 11CCR – Curry Creek
Existing + Overbank Inline Channel Routing
Proposed Culvert DET=18.7 AF HMOD=3.4
AF J - CUS16D – Curry Creek
Existing floodplain routing areas
Reconstructed Culvert at Baseline
Road
DET=17 AF HMOD=4.2
AF
Placer Vineyards - Master Project Drainage Study Page 32 of 160
Civil Engineering Solutions, Inc. MAY 2014
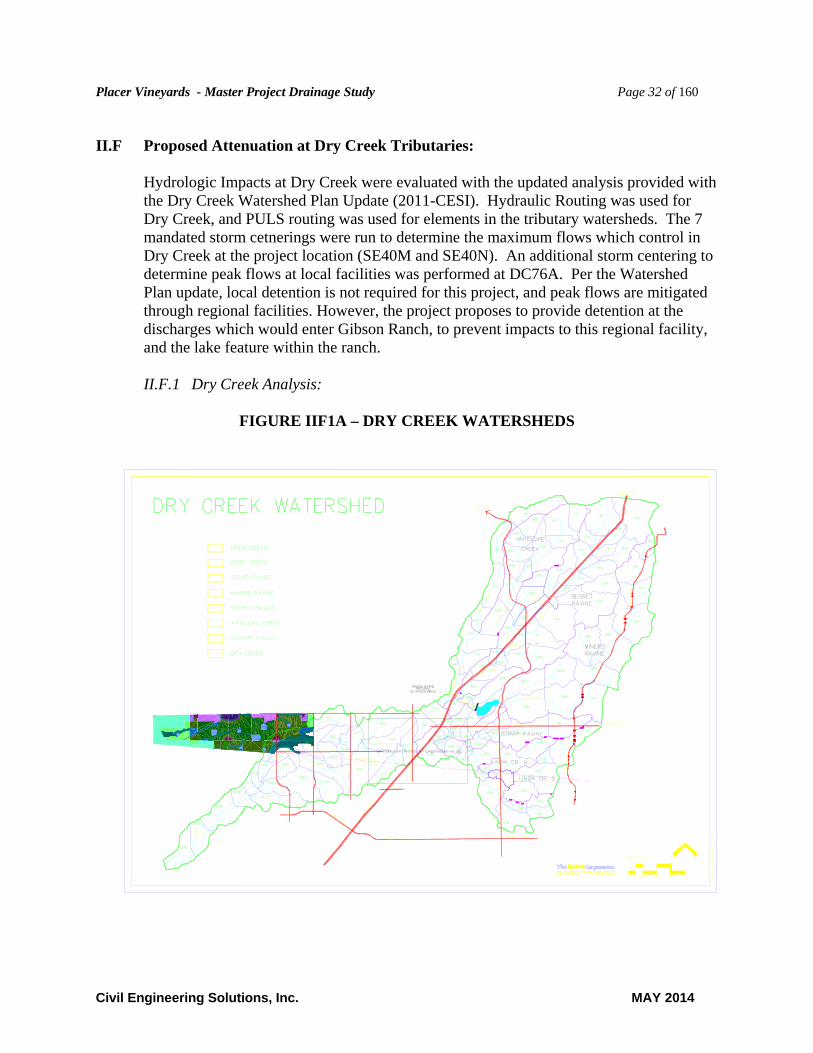
II.F Proposed Attenuation at Dry Creek Tributaries:
Hydrologic Impacts at Dry Creek were evaluated with the updated analysis provided with the Dry Creek Watershed Plan Update (2011-CESI). Hydraulic Routing was used for Dry Creek, and PULS routing was used for elements in the tributary watersheds. The 7 mandated storm cetnerings were run to determine the maximum flows which control in Dry Creek at the project location (SE40M and SE40N). An additional storm centering to determine peak flows at local facilities was performed at DC76A. Per the Watershed Plan update, local detention is not required for this project, and peak flows are mitigated through regional facilities. However, the project proposes to provide detention at the discharges which would enter Gibson Ranch, to prevent impacts to this regional facility, and the lake feature within the ranch.
II.F.1 Dry Creek Analysis:
FIGURE IIF1A – DRY CREEK WATERSHEDS

Placer Vineyards - Master Project Drainage Study Page 33 of 160
Civil Engineering Solutions, Inc. MAY 2014
We have performed an analysis of potential impacts to the Dry Creek peak flow rates resulting from this project. We have performed calculations using the base models for the “2010-Current” Conditions and the Future Fully Developed without Mitigation Conditions. We have modified the land uses in these models for the post-project alternatives to be consistent with the proposed plan, and we modified watershed boundaries to match the project determined (from detailed topography) boundaries for the NEMDC and Curry Creek watersheds. Four hydrology models wer developed: Modified 2010-Current to represent the existing conditions, and pre-project model (“PRE-2010” directory). “POST-PV” contains the 2010-Current model modified for the project’s improvements and land uses. The POST-PV_LID incorporates the estimated benefits of the projects plans to use Low Impact Development Measures for stormwater quality and hydrograph modification mitigation purposes. The “FFDU” includes the update Plans Future Fully Developed without Mitigation plan alternative, modified for the projects improvements and land uses. The detention basin proposed within the project upstream of Gibson Ranch is not included in this model. Figure IIF1A and Exhibits SH-2, AT-1A and AT-1B document the proposed land use areas within the Dry Creek watersheds. The affected watershed are DC65K, DC65I, DC75A, DC75C, DC76A, DC76C. For the post-project model, the imperviousness of DC-65, DC-75 and DC76 were adjusted as shown in tables IIB1, IIB2 and IIB3. For the 100-year event, the resulting outflows for the dry creek watershed are summarized in TABLES IIC1b and IIC2. For the Mitigated Analysis a 60 AF detention basin was placed at DC76C upstream of the discharge to the Gibson Ranch property. This basin will be used for both detention and hydrograph modification matching purposes.

Placer Vineyards - Master Project Drainage Study Page 34 of 160
Civil Engineering Solutions, Inc. MAY 2014
II.G Proposed Attenuation at Steelhead Creek Tributaries :
The proposed onsite attenuation facilities and 100-year capacities which are to be built in the tributaries to Steelhead Creek (NEMDC) are shown in Table IIG1 and exhibits AT-1A and AT-1B. Much of the attenuation storage proposed will serve dual use for both peak flow mitigation and hydrograph modification purposes as detailed in Table IIG1. TABLE IIG1 - PROPOSED ATTENUATION FACILITY SUMMARY DATA
Detention Location – Watershed
Type of Facility Discharge Control By: Estimated 100-year Peak Storage
EMA WATERSHED S1 - S25E – EMA Existing + overbank excavated
channel routing Backwater/Culvert (36”
pipe) DET=3AF
HMOD=0.2 AF L1- MAS28R - EMA Existing + overbank excavated
channel routing Channel Flow DET=1.4 AF
HMOD=0.7 AF Q - MAS23R – EMA Existing + overbank excavated
channel routing Channel Flow DET=1.4 AF
HMOD=0.7 AF T1 - EMA Existing + overbank excavated
channel routing Channel Flow DET=4.0 AF
HMOD=3.6 AF OP - EMA Existing + overbank excavated
channel routing Channel Flow and
Downstream Culvert (42” pipe)
DET=7.0 AF HMOD=2.5 AF
UV - MAS21R – EMA Existing + overbank excavated channel routing
Backwater/Culvert (42” pipe)
DET=7.0 AF HMOD=2.5 AF
D5D - AS21RR – EMA New excavated channel routing Backwater and Downstream Culvert
(42” pipe)
DET=6.8 AF HMOD=1.8 AF
D5C - S25D – EMA New Excavated Channel routing Backwater and Proposed Culvert (48” pipe)
DET=6.1 AF HMOD=1.8 AF
D4D3 - 20CD – EMA New Excavated Channel Channel flow and backwater at Proposed Culvert (1/12’wx4.2’h
arch)
DET=36.4 AF HMOD=14.8 AF
D3S1 - AS20AR – EMA Excavated Overbank and existing swale
Channel Flow DET=6.3 AF HMOD=2.8 AF
D3S3 - AS20AR – EMA Excavated Overbank and existing swale
Channel Flow DET=7.4 AF HMOD=1.9 AF
D3H - 20BCR – EMA Proposed New Excavated Channel
Channel Flow DET=9.0 AF HMOD=2.4 AF
D3S3 - MAS15R – EMA Proposed Lake or Meadow Backwater and Downstream Culvert (2-
48” pipe)
LAKE=85 AF DET=65.6 AF
HMOD=12.0 AF D3D2 - MAS13R – EMA Proposed New Excavated
Channel Channel Flow and
Culvert (2-48” pipe) DET=12.2 AF
HMOD=3.7 AF D3L - MAS12R – EMA Proposed Lake or Meadow Proposed Culvert LAKE=70 AF
DET=37.7 AF HMOD=10.0AF
D3F - S12D – EMA Proposed New Excavated Channel
Channel Flow + Proposed Culvert @ Baseline Road (2-
7’wx3.2’h CM Arch) + HMOD/DET Control
DET=29.1 AF HMOD=9.7AF

Placer Vineyards - Master Project Drainage Study Page 35 of 160
Civil Engineering Solutions, Inc. MAY 2014
Weir at 2.065 = 36”pipe+WEIR @ Elev-
70.0
EMFN WATERSHED D2Z2 - FN12RR – EMFN Proposed New Excavated
Channel Proposed Culvert (2-
10’w x 5’h BOX) DET=8.3 AF
HMOD=2.8AF D2U - FN8BRR – EMFN Proposed New Excavated
Channel Proposed Culvert (2-
10’w x 5’h BOX) DET=9.5 AF
HMOD=4.0AF D2U1 - FN9RR – EMFN Proposed New Excavated
Channel Proposed Culvert (2-
10’w x 5’h BOX) DET=14.8 AF HMOD=4.7AF
D2X - FN10CR –EMFN Proposed New Excavated Channel
Proposed Culvert (2-12’w x 6’h BOX)
DET=23.8 AF HMOD=9.2AF
D2Y - FN8R – EMFN Existing and Proposed New Excavated Flood Channel
Control Weir 20’@ Elev=58.5
Culvert (2-16’w x 5’h CM Arch + 1-18” pipe)
DET=15.0 AF HMOD=9.0AF
D2R - FN7AR Existing and Proposed New Excavated Flood Channel
Proposed Culvert (1-16’w x 5’h CM Arch +
1-24” pipe)
DET=23.4 AF HMOD=8.1AF
D2R2 - MFN4CR – EMFN Existing and Proposed New Excavated Flood Channel
Proposed Detention Weir( 24” pipe+42” pipe + 100’ weir elev=58.5)
DET=31.1 AF HMOD=11.0AF
D2S1 - EMFN Proposed New Excavated Channel
Proposed Culvert (1-30” pipe)
DET=4.2 AF HMOD=2.2AF
EMFS WATERSHED
D3DL - S9R – EMFS Existing and Proposed New Excavated Flood Channel
Proposed Culvert (1-24” pipe+1/18” pipe+1-5’w x 1’h box for high flow
release)
DET=37.4 AF HMOD=15.0AF
D4DC - EMFS Proposed New Excavated Channel
Drainage to existing flow path
DET=5.8 AF HMOD=2.4AF
EMC WATERSHED
D1R - EMC9R – EMC Existing and Proposed New Excavated Flood Channel
Proposed Culvert (2-7’w x 3.5’h CM Arch)
DET=35.55 AF HMOD=12.0AF
MC8AR – EMC Existing and Proposed New Excavated Flood Channel
3 – Detention Control Weirs.
30’Weir at El 40.9 with 36” pipe
30’Weir at El 38.9 with 30” pipe
20’Weir at El 37.0 with 24” pipe
DET=60.7 AF HMOD=27.3AF
II.H Proposed Attenuation at Steelhead Creek (NEMDC) Tributaries : A meeting was held July 11, 2005 at the Placer County Flood Control and Water Conservation District Offices to discuss potential project impacts at the Steelhead Creek tributaries, and so that the project team could gain a better understanding of how the Steelhead Creek system is operated. Attending the meeting were George Booth from Sacramento County Municipal
Placer Vineyards - Master Project Drainage Study Page 36 of 160
Civil Engineering Solutions, Inc. MAY 2014
Services Agency, John Basset from SAFCA, Andrew Darrow and Brian Keating from the Placer County Flood Control and Water Conservation District, Jim Ray from Mackay and Somps, Wes Zicker from Placer County Public Works, and Thomas Plummer from CESI. Key discussion topics of the meeting:
Sacramento County would like to increase the pumping capacity of the D15 NEMDC (Steelhead Creek) pumping plant at some future time, and collect a fee from tributary areas for those improvements.
Increase Pumping alone may not address the impacts of the project. Placer Vineyards will need to assess the potential impacts of the project to the NEMDC
system. SAFCA to release NEMDC model to CESI via MBK. CESI to perform the analysis.
Following the meeting, CESI received computer file models from MBK as follows:
DSS files containing inflow hydrographs Sankey Spill DSS File for 10-year, 100-year and 200-year Event timed to occur May 4, 1994, with peak precipitation at 1200 hours. PDF file of supporting documentation of the UNET models (shed map included in
report). UNET files containing 4 scenarios:
o 200-fut94-2pump: SAFCA NEMDC UNET Model for 200-year Future Land Use 2 PUMP model.
o 100-fut94-2pump: SAFCA NEMDC UNET Model for 100-year Future Land Use 2 PUMP model.
o 200-exist94-2pump: SAFCA NEMDC UNET Model for 200-year Existing Land Use 2 PUMP model.
o 100-exist94-pump: SAFCA NEMDC UNET Model for 100-year Existing Land Use 2 PUMP model.
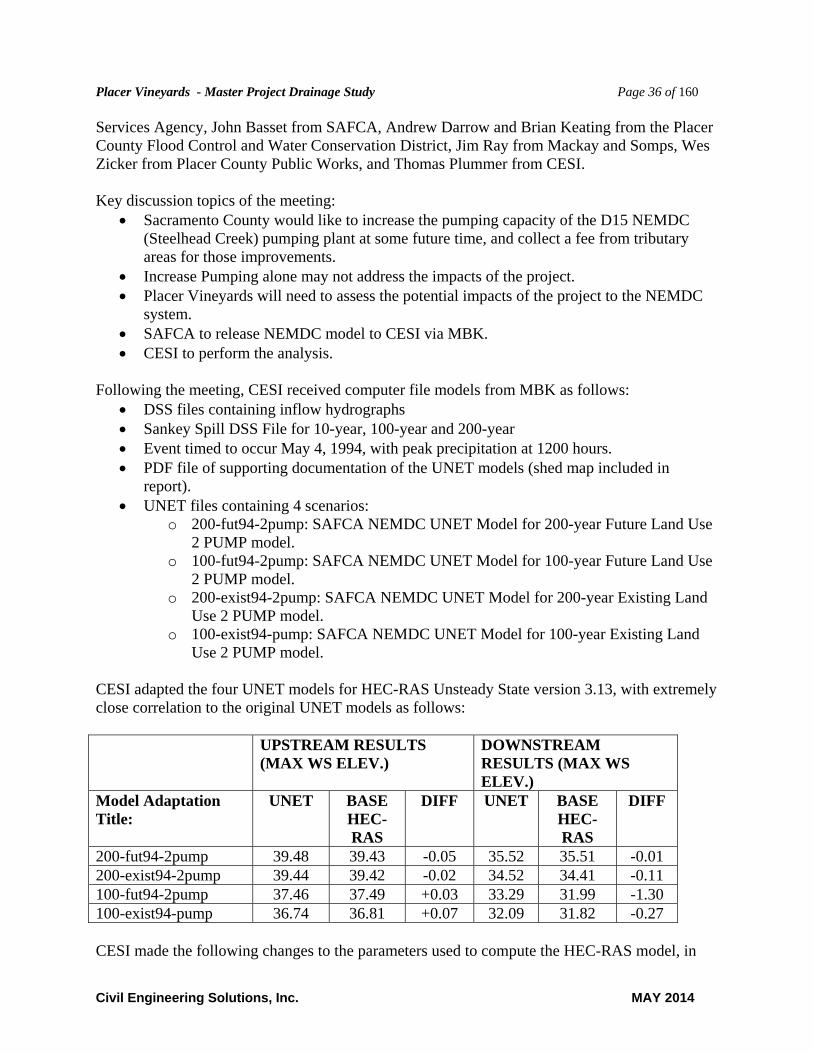
CESI adapted the four UNET models for HEC-RAS Unsteady State version 3.13, with extremely close correlation to the original UNET models as follows: UPSTREAM RESULTS
(MAX WS ELEV.) DOWNSTREAM RESULTS (MAX WS ELEV.)
Model Adaptation Title:
UNET BASE HEC-RAS
DIFF UNET BASE HEC-RAS
DIFF
200-fut94-2pump 39.48 39.43 -0.05 35.52 35.51 -0.01 200-exist94-2pump 39.44 39.42 -0.02 34.52 34.41 -0.11 100-fut94-2pump 37.46 37.49 +0.03 33.29 31.99 -1.30 100-exist94-pump 36.74 36.81 +0.07 32.09 31.82 -0.27 CESI made the following changes to the parameters used to compute the HEC-RAS model, in
Placer Vineyards - Master Project Drainage Study Page 37 of 160
Civil Engineering Solutions, Inc. MAY 2014
order to obtain the above results: o Computational interval of 30 seconds was used instead of the 1 minute specified in the
UNET – smooth out some of the results. o 20 warm up time steps were added with an interval of 0.01 hours. o Convert Energy method bridges to Cross sections with Lids
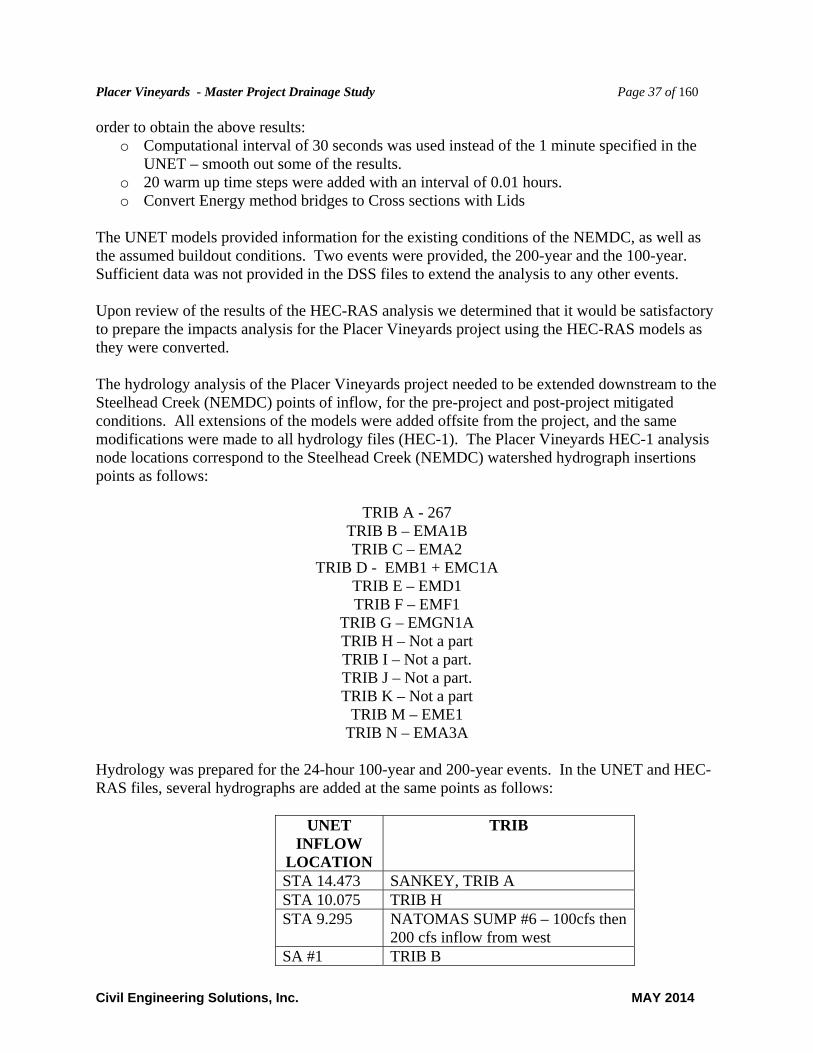
The UNET models provided information for the existing conditions of the NEMDC, as well as the assumed buildout conditions. Two events were provided, the 200-year and the 100-year. Sufficient data was not provided in the DSS files to extend the analysis to any other events. Upon review of the results of the HEC-RAS analysis we determined that it would be satisfactory to prepare the impacts analysis for the Placer Vineyards project using the HEC-RAS models as they were converted. The hydrology analysis of the Placer Vineyards project needed to be extended downstream to the Steelhead Creek (NEMDC) points of inflow, for the pre-project and post-project mitigated conditions. All extensions of the models were added offsite from the project, and the same modifications were made to all hydrology files (HEC-1). The Placer Vineyards HEC-1 analysis node locations correspond to the Steelhead Creek (NEMDC) watershed hydrograph insertions points as follows:
TRIB A - 267 TRIB B – EMA1B TRIB C – EMA2
TRIB D - EMB1 + EMC1A TRIB E – EMD1 TRIB F – EMF1
TRIB G – EMGN1A TRIB H – Not a part TRIB I – Not a part. TRIB J – Not a part. TRIB K – Not a part
TRIB M – EME1 TRIB N – EMA3A
Hydrology was prepared for the 24-hour 100-year and 200-year events. In the UNET and HEC-RAS files, several hydrographs are added at the same points as follows:
UNET INFLOW
LOCATION
TRIB
STA 14.473 SANKEY, TRIB A STA 10.075 TRIB H STA 9.295 NATOMAS SUMP #6 – 100cfs then
200 cfs inflow from west SA #1 TRIB B
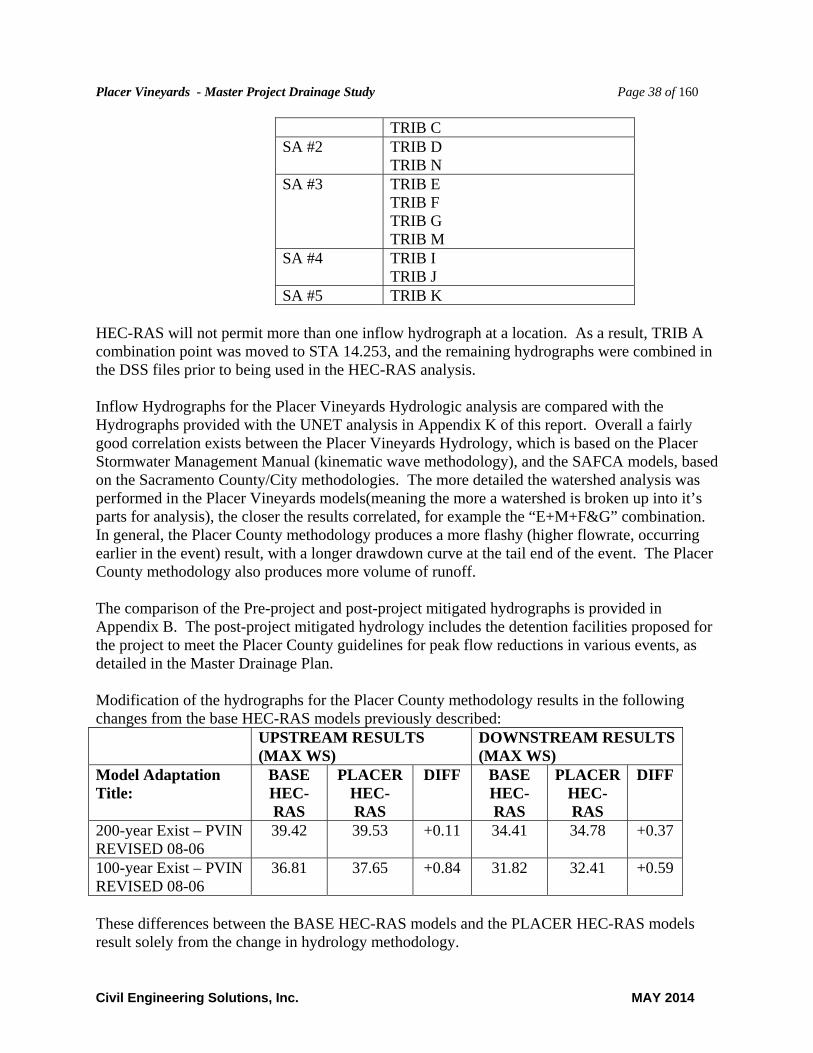
Placer Vineyards - Master Project Drainage Study Page 38 of 160
Civil Engineering Solutions, Inc. MAY 2014
TRIB C SA #2 TRIB D
TRIB N SA #3 TRIB E
TRIB F TRIB G TRIB M
SA #4 TRIB I TRIB J
SA #5 TRIB K HEC-RAS will not permit more than one inflow hydrograph at a location. As a result, TRIB A combination point was moved to STA 14.253, and the remaining hydrographs were combined in the DSS files prior to being used in the HEC-RAS analysis. Inflow Hydrographs for the Placer Vineyards Hydrologic analysis are compared with the Hydrographs provided with the UNET analysis in Appendix K of this report. Overall a fairly good correlation exists between the Placer Vineyards Hydrology, which is based on the Placer Stormwater Management Manual (kinematic wave methodology), and the SAFCA models, based on the Sacramento County/City methodologies. The more detailed the watershed analysis was performed in the Placer Vineyards models(meaning the more a watershed is broken up into it’s parts for analysis), the closer the results correlated, for example the “E+M+F&G” combination. In general, the Placer County methodology produces a more flashy (higher flowrate, occurring earlier in the event) result, with a longer drawdown curve at the tail end of the event. The Placer County methodology also produces more volume of runoff. The comparison of the Pre-project and post-project mitigated hydrographs is provided in Appendix B. The post-project mitigated hydrology includes the detention facilities proposed for the project to meet the Placer County guidelines for peak flow reductions in various events, as detailed in the Master Drainage Plan. Modification of the hydrographs for the Placer County methodology results in the following changes from the base HEC-RAS models previously described: UPSTREAM RESULTS
(MAX WS) DOWNSTREAM RESULTS (MAX WS)
Model Adaptation Title:
BASE HEC-RAS
PLACER HEC-RAS
DIFF BASE HEC-RAS
PLACER HEC-RAS
DIFF
200-year Exist – PVIN REVISED 08-06
39.42 39.53 +0.11 34.41 34.78 +0.37
100-year Exist – PVIN REVISED 08-06
36.81 37.65 +0.84 31.82 32.41 +0.59
These differences between the BASE HEC-RAS models and the PLACER HEC-RAS models result solely from the change in hydrology methodology.
Placer Vineyards - Master Project Drainage Study Page 39 of 160
Civil Engineering Solutions, Inc. MAY 2014
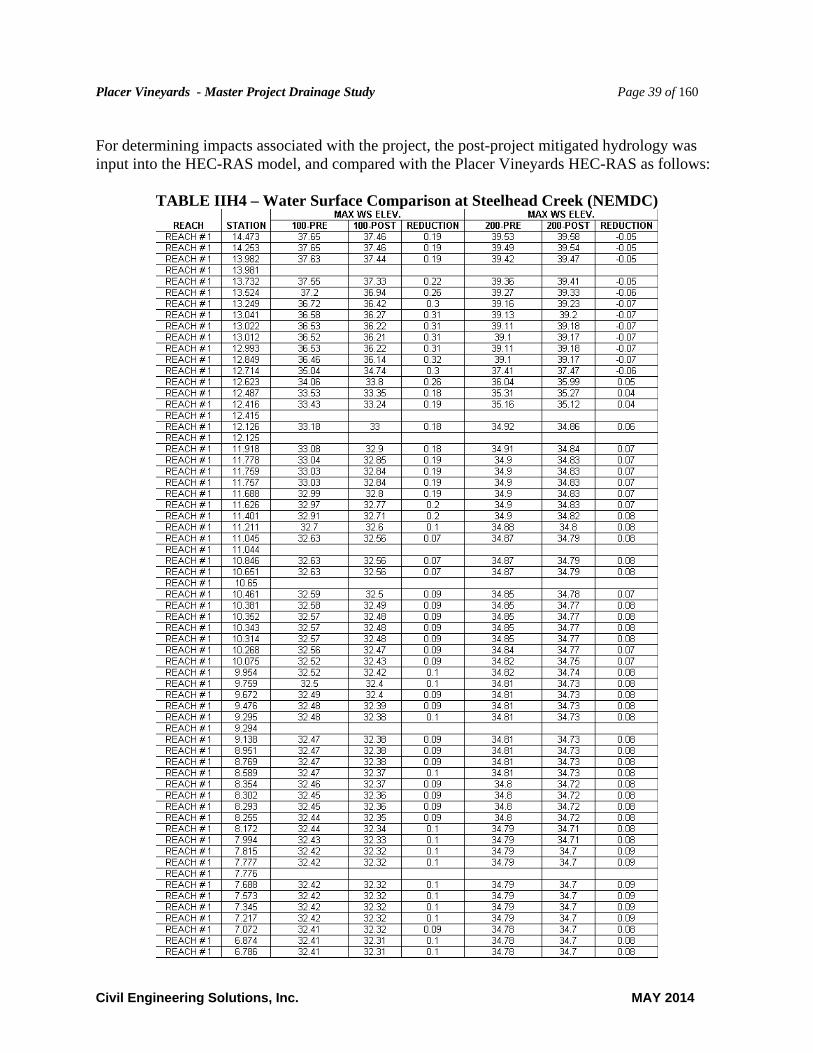
For determining impacts associated with the project, the post-project mitigated hydrology was input into the HEC-RAS model, and compared with the Placer Vineyards HEC-RAS as follows:
TABLE IIH4 – Water Surface Comparison at Steelhead Creek (NEMDC)
Placer Vineyards - Master Project Drainage Study Page 40 of 160
Civil Engineering Solutions, Inc. MAY 2014
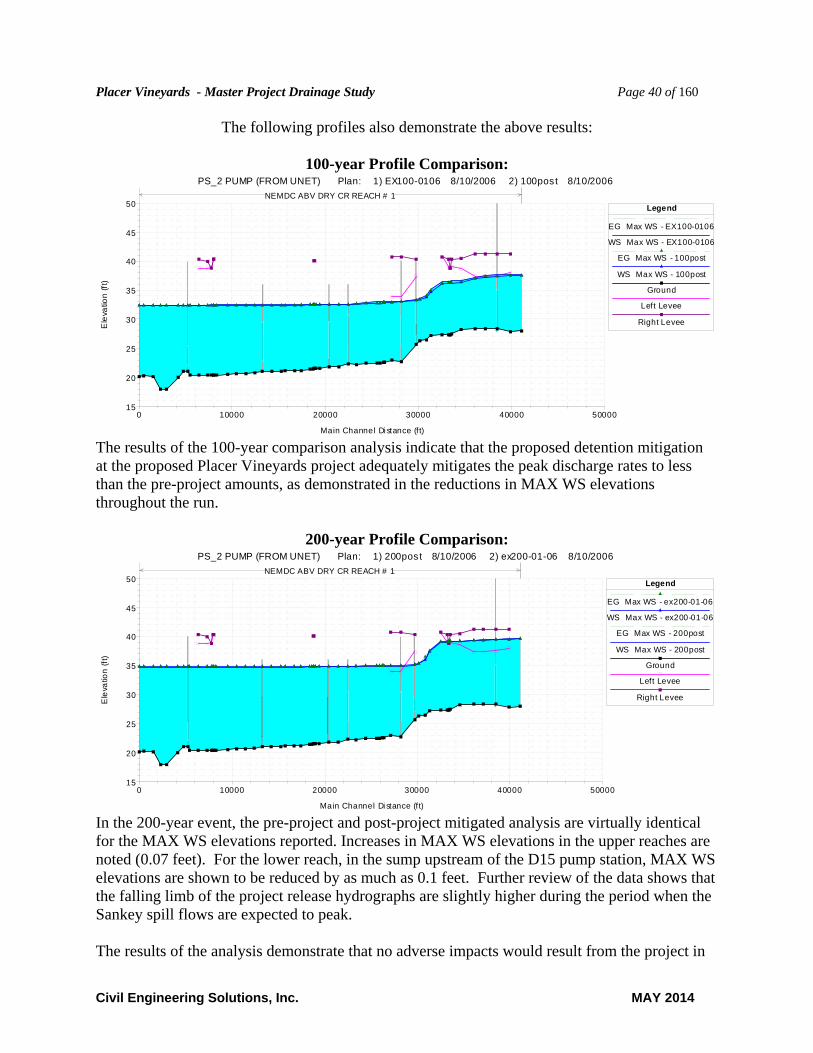
The following profiles also demonstrate the above results:
100-year Profile Comparison:
0 10000 20000 30000 40000 5000015
20
25
30
35
40
45
50
PS_2 PUMP (FROM UNET) Plan: 1) EX100-0106 8/10/2006 2) 100post 8/10/2006
Main Channel Di stance (ft)
Ele
vatio
n (f
t)
Legend
EG Max WS - EX100-0106
WS Max WS - EX100-0106
EG Max WS - 100post
WS Max WS - 100post
Ground
Left Levee
Right Levee
NEMDC ABV DRY CR REACH # 1
The results of the 100-year comparison analysis indicate that the proposed detention mitigation at the proposed Placer Vineyards project adequately mitigates the peak discharge rates to less than the pre-project amounts, as demonstrated in the reductions in MAX WS elevations throughout the run.
200-year Profile Comparison:
0 10000 20000 30000 40000 5000015
20
25
30
35
40
45
50
PS_2 PUMP (FROM UNET) Plan: 1) 200post 8/10/2006 2) ex200-01-06 8/10/2006
Main Channel Di stance (ft)
Ele
vatio
n (f
t)
Legend
EG Max WS - ex200-01-06
WS Max WS - ex200-01-06
EG Max WS - 200post
WS Max WS - 200post
Ground
Left Levee
Right Levee
NEMDC ABV DRY CR REACH # 1
In the 200-year event, the pre-project and post-project mitigated analysis are virtually identical for the MAX WS elevations reported. Increases in MAX WS elevations in the upper reaches are noted (0.07 feet). For the lower reach, in the sump upstream of the D15 pump station, MAX WS elevations are shown to be reduced by as much as 0.1 feet. Further review of the data shows that the falling limb of the project release hydrographs are slightly higher during the period when the Sankey spill flows are expected to peak. The results of the analysis demonstrate that no adverse impacts would result from the project in

Placer Vineyards - Master Project Drainage Study Page 41 of 160
Civil Engineering Solutions, Inc. MAY 2014
the D15 sump area, however, a negligible impact is reported in the areas between the project and the D15 sump resulting from increase volumes being discharged during the timing of peak flow from the Sankey spill. Additional pumping at the D15 station will not reduce this impact. The impact would not appear to be significant because it only occurs if the Sankey spill is occurring. However, this impact could be reduced by modifying the proposed control structures on some of the Steelhead Creek tributary detention structures within the project, and by monitoring the Sankey gap spill occurrences. The gates could be installed when the Sankey spill’s occur, reducing project runoff volumes during thee period. RET-1A and RET-1B identify the planned volumetric storage locations volumes in several of these reaches. The impact analysis was re-run using the full HEC-RAS unsteady state project modeling to quantify the onsite detention benefits from the proposed facilities intended for peak flow and hydrograph modification purposes. The net change in volumetric impacts was reduced from 174 AF to 25 acre feet for the 100-year event in this analysis.
Modify design facilities at: D1 to be able to store 10 AF of volumetric mitigation D1R to be able to store 5 AF of Volumetric Mitigation D3L to be able to store 5 AF of Volumetric Mitigation D3S3 to be able to store 5 AF of volumetric Mitigation These facilities would be operated to store runoff volumes while Sankey Spills are occurring and water levels from the Pleasant Grove Canal are spilling to Steelhead Creek(NEMDC).
The Sankey spill is a special event, which is known to be possible, where, flows in the Natomas Cross Canal could overtop Sankey Road and spill into the Natomas and Steelhead Creek basins.

Placer Vineyards - Master Project Drainage Study Page 42 of 160
Civil Engineering Solutions, Inc. MAY 2014
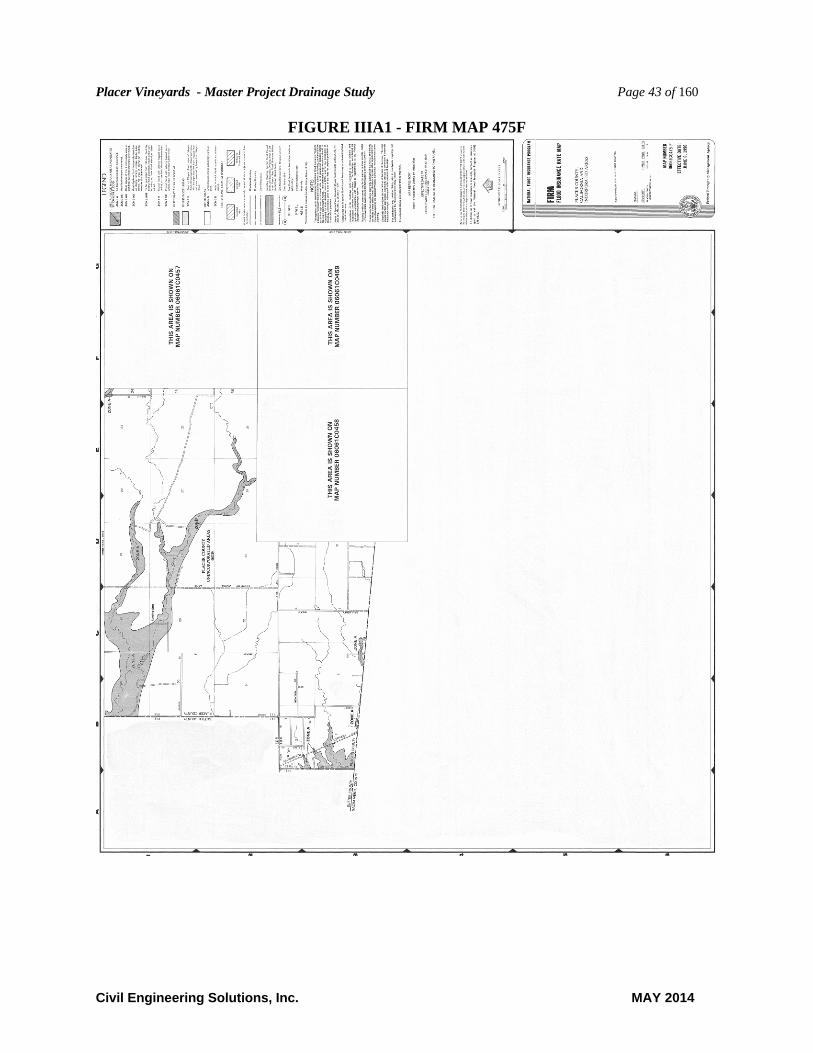
III. Hydraulics: III.A Flood Plain Analysis: The existing project site includes FEMA delineated flood hazard areas at Dry Creek.
Also west of the project, Zone A areas are delineated adjacent to Steelhead Creek. The project area is shown on the Placer County FIRM maps 475F and 458F, included as Figures IIIA1 and IIIA2. The project would be required to submit CLOMR and LOMR documents to FEMA for proposed Base Flood Elevation data where changes are proposed.
The Army Corps HEC-RAS software was utilized to develop the included hydraulic
models for the proposed Placer Vineyards project area. Flood Plain elevations were determined for the 10-year and 100-year events, for the pre-project and post-project conditions, and for the post-project mitigated conditions events. The Base Flood Elevations established with this study are shown on Exhibit FP-1A and FP-1B . The proposed post-project flood elevations and limits are shown on Figure FP-3A and FP-3B.
Added in this amendment (November 2013), FP-2A and FP-2B, and FP-4A and FP-4B show the flood extents and flood elevations for the extreme event 200-year and 500-year floods for the pre-project and post-project respectively.
The hydraulic evaluation was performed for all the events of the hydrologic model
including: mean annual, peak annual, 2-year, 10-year, 100-year, 200-year and 500-year. The HEC-RAS summary tables for all events are provided in Appendices C, and D for the pre-project and post-project mitigated events respectively.
III.A.1 Pre-Project Flowrates:
Pre-project flowrates for all locations of the hydraulic evaluation were developed in the hydrologic analysis (Chapter II). Tables IIIA4a and IIA4b summarize the computed flowrates used in the hydraulic evaluation.
Placer Vineyards - Master Project Drainage Study Page 43 of 160
Civil Engineering Solutions, Inc. MAY 2014
FIGURE IIIA1 - FIRM MAP 475F

Placer Vineyards - Master Project Drainage Study Page 44 of 160
Civil Engineering Solutions, Inc. MAY 2014
FIGURE IIIA2 - FIRM MAP 458F

Placer Vineyards - Master Project Drainage Study Page 45 of 160
Civil Engineering Solutions, Inc. MAY 2014
III.A.2 Post-Project Mitigated Flowrates:
Post-project mitigated flowrates for all locations of the hydraulic evaluation were developed in the hydrologic analysis (Chapter II). Tables IIC1a and IIC1b summarize the computed flowrates used in the hydraulic evaluation.
FIGURE IIIA3 – Comparison of Pre- and Post-project water levels at Project Boundaries
LOCATION
HEC-RAS HEC-RAS STATION DescriptionRIVER REACH (RM) PRE- POST-MIT Reduction PRE- POST-MIT Reduction
Curry Creek CUR-1 1.22 North Boundary - Curry Creek - Enters Site 102.14 99.16 2.98 103 101.62 1.38Curry Creek CUR-1 1.02 North Boundary - Curry Creek - Leaves Site 88.77 88.64 0.13 89.56 88.97 0.59
EMAS EMAS2 2.02 North Boundary - EMAS NEMDC - Leaves Site 65.49 65.23 0.26 66.64 66.29 0.35EMCS EMCS9 15.08 West Boundary EMC Sheds Leaving Project 34.48 34.31 0.17 35 34.47 0.53EMCN EMCN9 25.03 West Boundary EMC North Sheds Leave Proj. 34.86 34.58 0.28 35.15 34.83 0.32EMD EMD1 12.03 West Boundary EMD Sheds Leaving Site 38.68 38.66 0.02 39.08 39.02 0.06EMF EMFN1 5.1 South Boundary - EMFN Leaves Project 54.3 54.15 0.15 54.6 54.36 0.24EMF EMF1 5.01 NEMDC - EMF Downstream of all PROJ. Trib. 47.65 47.51 0.14 49.27 48.05 1.22EMF EMFSS3 3.01 EMFS - East trib of South branch Leaves Project 62.22 62.18 0.04 62.35 62.23 0.12EMF EMFS3 10.1 South Boundary - EMFS Leaves Project Comb. 53.9 53.14 0.76 54.36 53.65 0.71EMF EMFS3 10.08 NEMDC - EMFS Downstream of all PROJ. Trib. 52.9 52.33 0.57 53.2 52.72 0.48EMG N/A N/A South Boundary - EMG Leaves Project
Dry Creek N/A N/A Dry Creek Analysis reports no measurable change in WS Elevation along creek frontage.
10-YEAR EVENT 100-YEAR EVENTWATER SURFACE ELEVTIONS (FT)
No water levels established for this release. Flow reduction.
III.A.3 Post-Project Offsite Unmitigated Flowrates:
Post-project offsite unmitigated flowrates for all locations of the hydraulic evaluation were developed in the hydrologic analysis (Chapter II). Tables IID1a and IID1b summarize the computed flowrates used in the hydraulic evaluation. The resulting computed water surface elevations and floodplain are shown on Exhibit FP-3.
Placer Vineyards - Master Project Drainage Study Page 46 of 160
Civil Engineering Solutions, Inc. MAY 2014
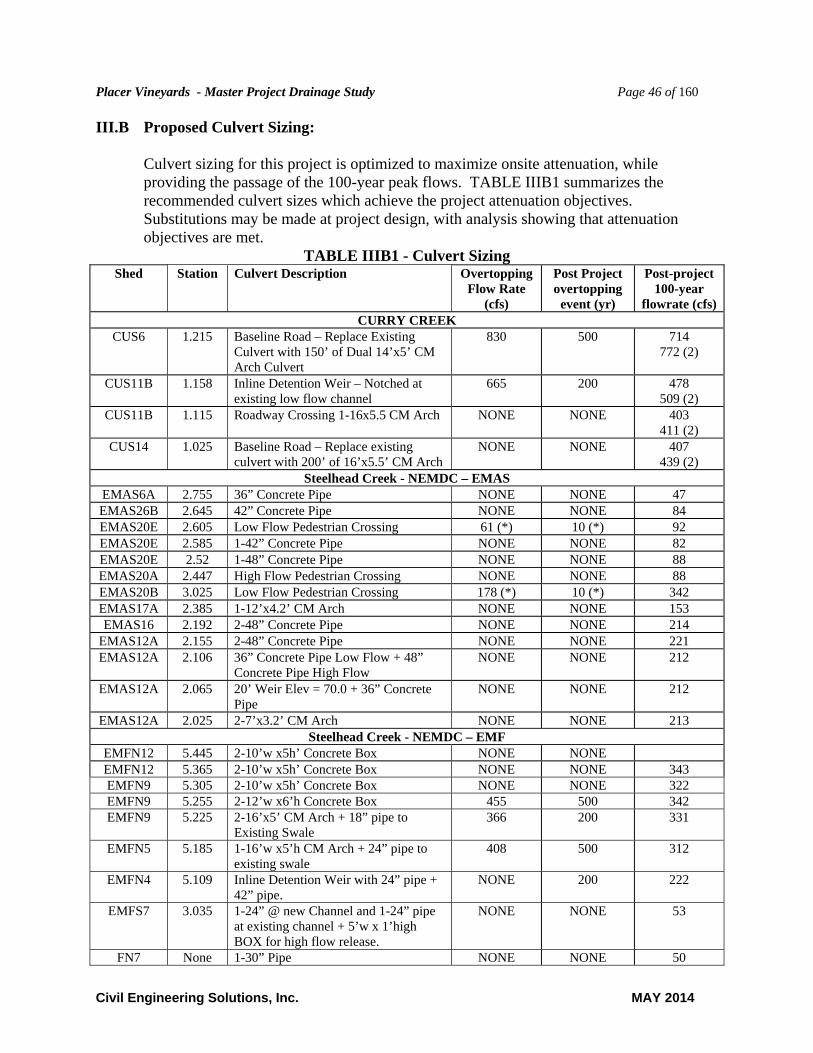
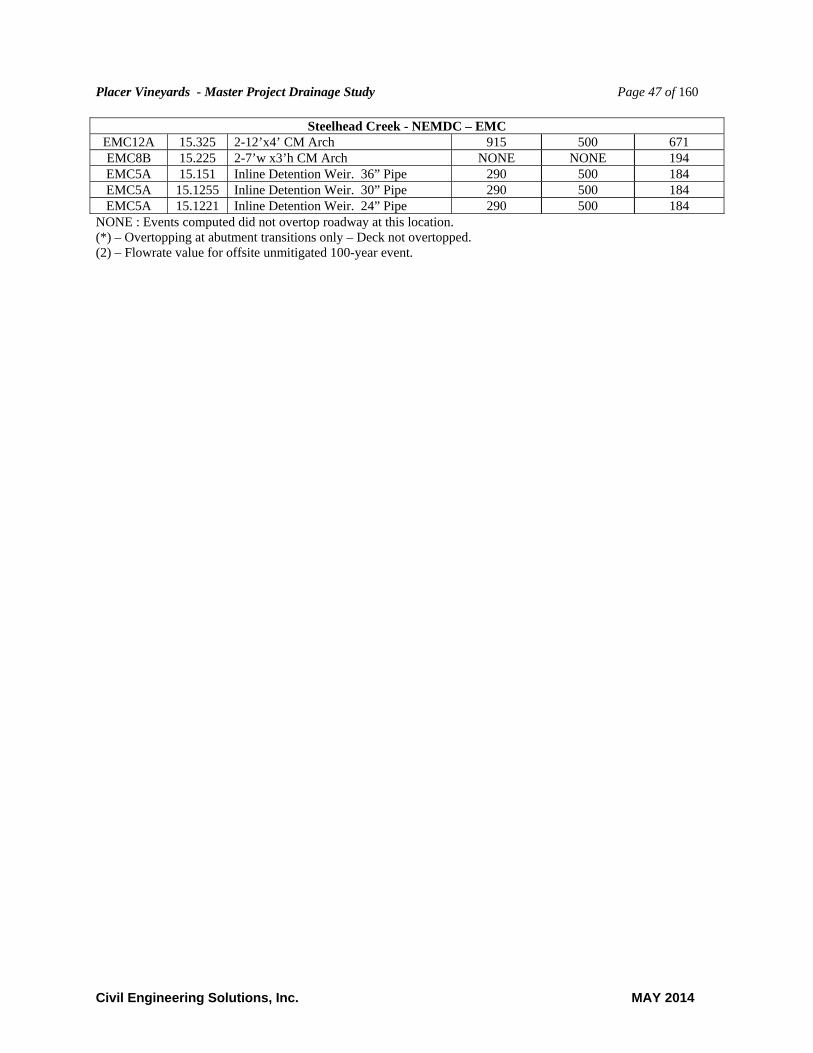
III.B Proposed Culvert Sizing: Culvert sizing for this project is optimized to maximize onsite attenuation, while
providing the passage of the 100-year peak flows. TABLE IIIB1 summarizes the recommended culvert sizes which achieve the project attenuation objectives. Substitutions may be made at project design, with analysis showing that attenuation objectives are met.
TABLE IIIB1 - Culvert Sizing Shed Station Culvert Description Overtopping
Flow Rate (cfs)
Post Project overtopping
event (yr)
Post-project 100-year
flowrate (cfs)CURRY CREEK
CUS6 1.215 Baseline Road – Replace Existing Culvert with 150’ of Dual 14’x5’ CM Arch Culvert
830 500 714 772 (2)
CUS11B 1.158 Inline Detention Weir – Notched at existing low flow channel
665 200 478 509 (2)
CUS11B 1.115 Roadway Crossing 1-16x5.5 CM Arch NONE NONE 403 411 (2)
CUS14 1.025 Baseline Road – Replace existing culvert with 200’ of 16’x5.5’ CM Arch
NONE NONE 407 439 (2)
Steelhead Creek - NEMDC – EMAS EMAS6A 2.755 36” Concrete Pipe NONE NONE 47 EMAS26B 2.645 42” Concrete Pipe NONE NONE 84 EMAS20E 2.605 Low Flow Pedestrian Crossing 61 (*) 10 (*) 92 EMAS20E 2.585 1-42” Concrete Pipe NONE NONE 82 EMAS20E 2.52 1-48” Concrete Pipe NONE NONE 88 EMAS20A 2.447 High Flow Pedestrian Crossing NONE NONE 88 EMAS20B 3.025 Low Flow Pedestrian Crossing 178 (*) 10 (*) 342 EMAS17A 2.385 1-12’x4.2’ CM Arch NONE NONE 153 EMAS16 2.192 2-48” Concrete Pipe NONE NONE 214
EMAS12A 2.155 2-48” Concrete Pipe NONE NONE 221 EMAS12A 2.106 36” Concrete Pipe Low Flow + 48”
Concrete Pipe High Flow NONE NONE 212
EMAS12A 2.065 20’ Weir Elev = 70.0 + 36” Concrete Pipe
NONE NONE 212
EMAS12A 2.025 2-7’x3.2’ CM Arch NONE NONE 213 Steelhead Creek - NEMDC – EMF
EMFN12 5.445 2-10’w x5h’ Concrete Box NONE NONE EMFN12 5.365 2-10’w x5h’ Concrete Box NONE NONE 343 EMFN9 5.305 2-10’w x5h’ Concrete Box NONE NONE 322 EMFN9 5.255 2-12’w x6’h Concrete Box 455 500 342 EMFN9 5.225 2-16’x5’ CM Arch + 18” pipe to
Existing Swale 366 200 331
EMFN5 5.185 1-16’w x5’h CM Arch + 24” pipe to existing swale
408 500 312
EMFN4 5.109 Inline Detention Weir with 24” pipe + 42” pipe.
NONE 200 222
EMFS7 3.035 1-24” @ new Channel and 1-24” pipe at existing channel + 5’w x 1’high BOX for high flow release.
NONE NONE 53
FN7 None 1-30” Pipe NONE NONE 50
Placer Vineyards - Master Project Drainage Study Page 47 of 160
Civil Engineering Solutions, Inc. MAY 2014
Steelhead Creek - NEMDC – EMC EMC12A 15.325 2-12’x4’ CM Arch 915 500 671 EMC8B 15.225 2-7’w x3’h CM Arch NONE NONE 194 EMC5A 15.151 Inline Detention Weir. 36” Pipe 290 500 184 EMC5A 15.1255 Inline Detention Weir. 30” Pipe 290 500 184 EMC5A 15.1221 Inline Detention Weir. 24” Pipe 290 500 184
NONE : Events computed did not overtop roadway at this location. (*) – Overtopping at abutment transitions only – Deck not overtopped. (2) – Flowrate value for offsite unmitigated 100-year event.

Placer Vineyards - Master Project Drainage Study Page 48 of 160
Civil Engineering Solutions, Inc. MAY 2014
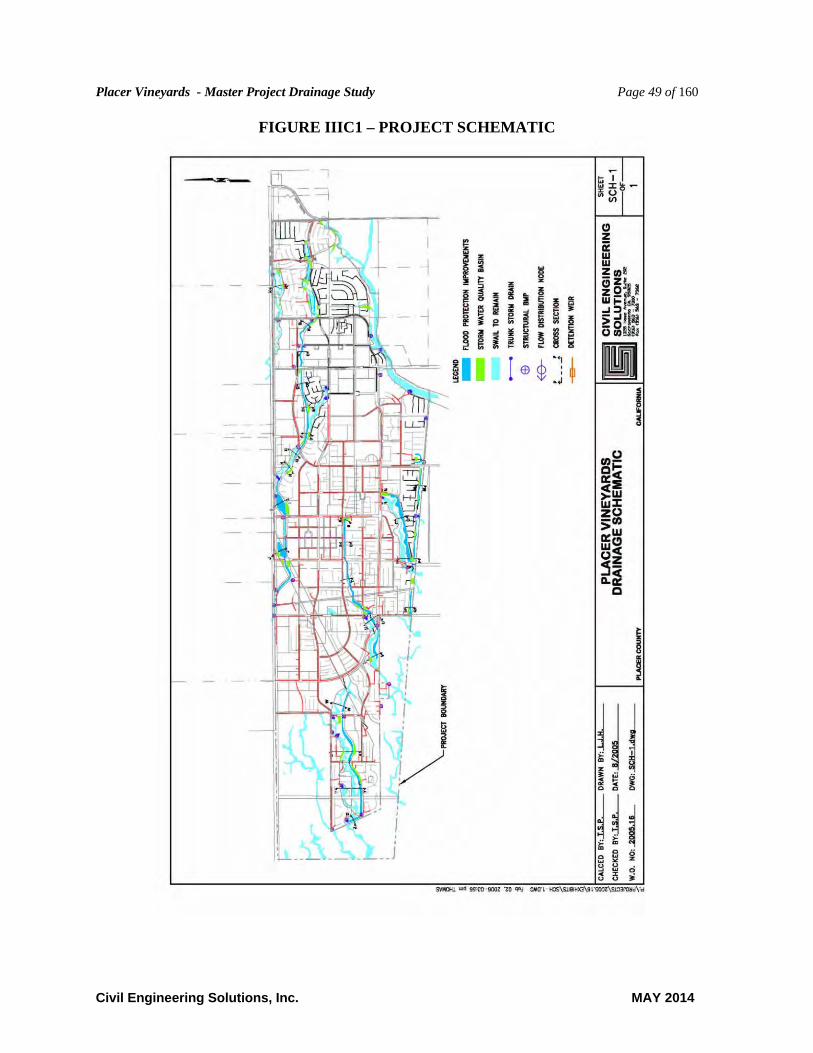
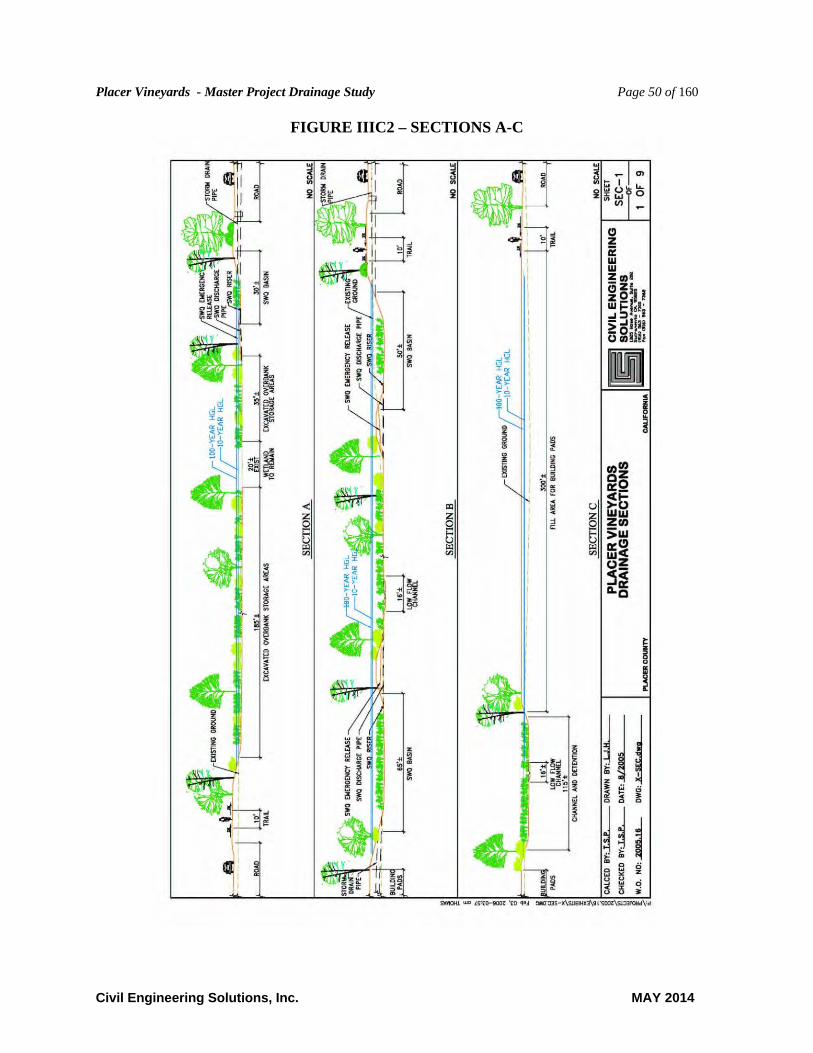
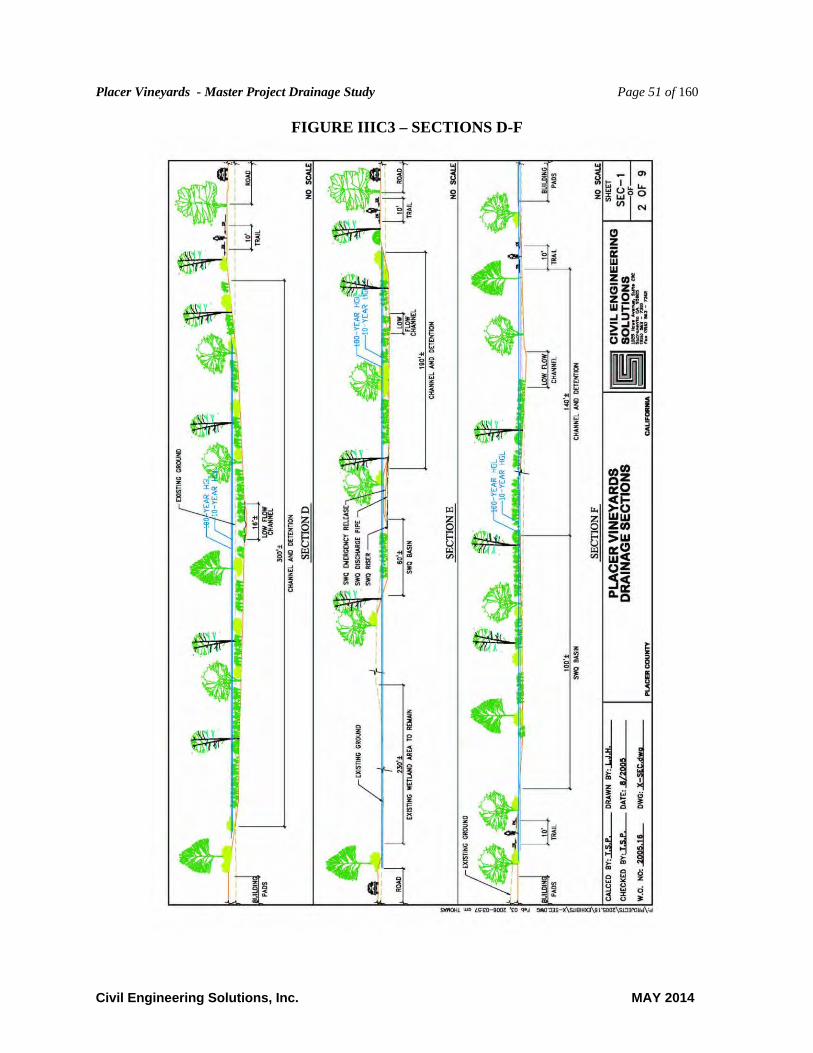
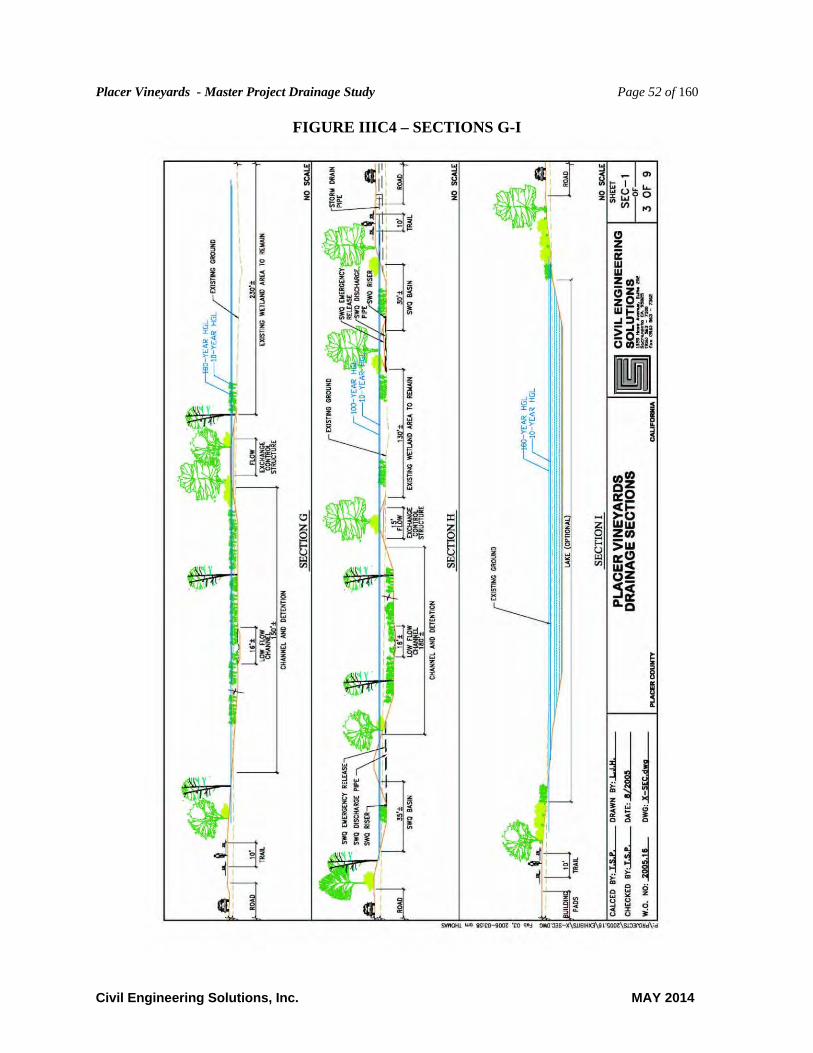
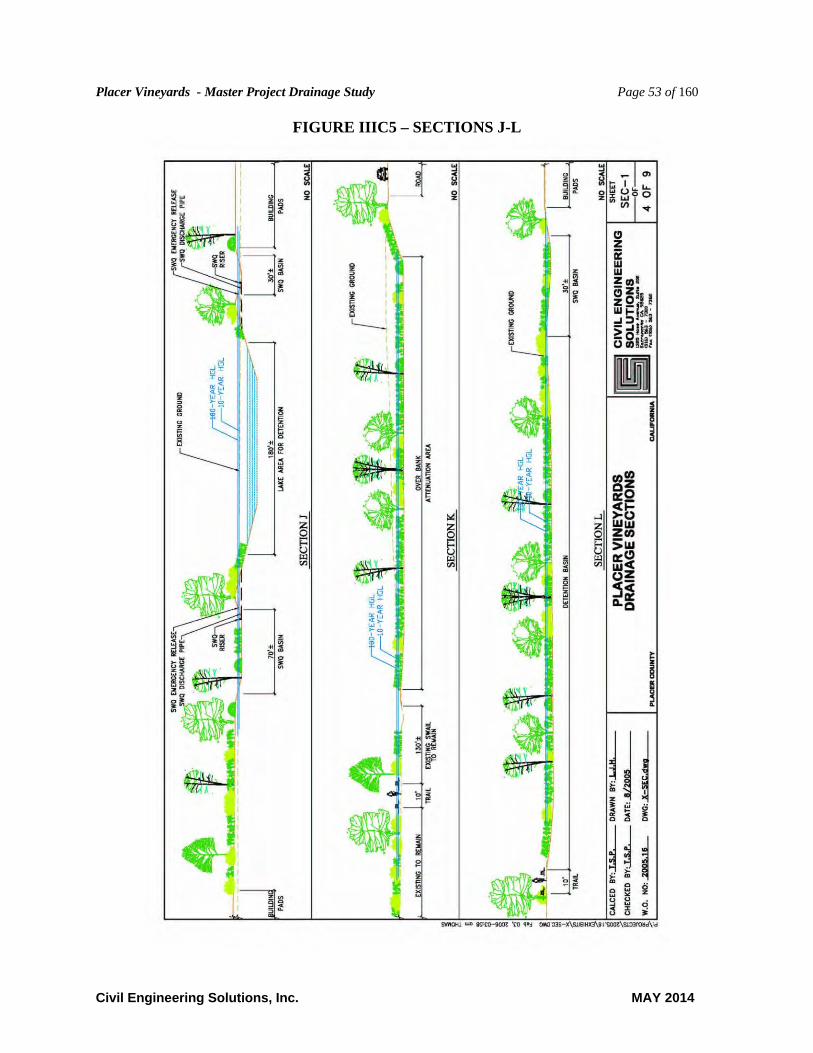
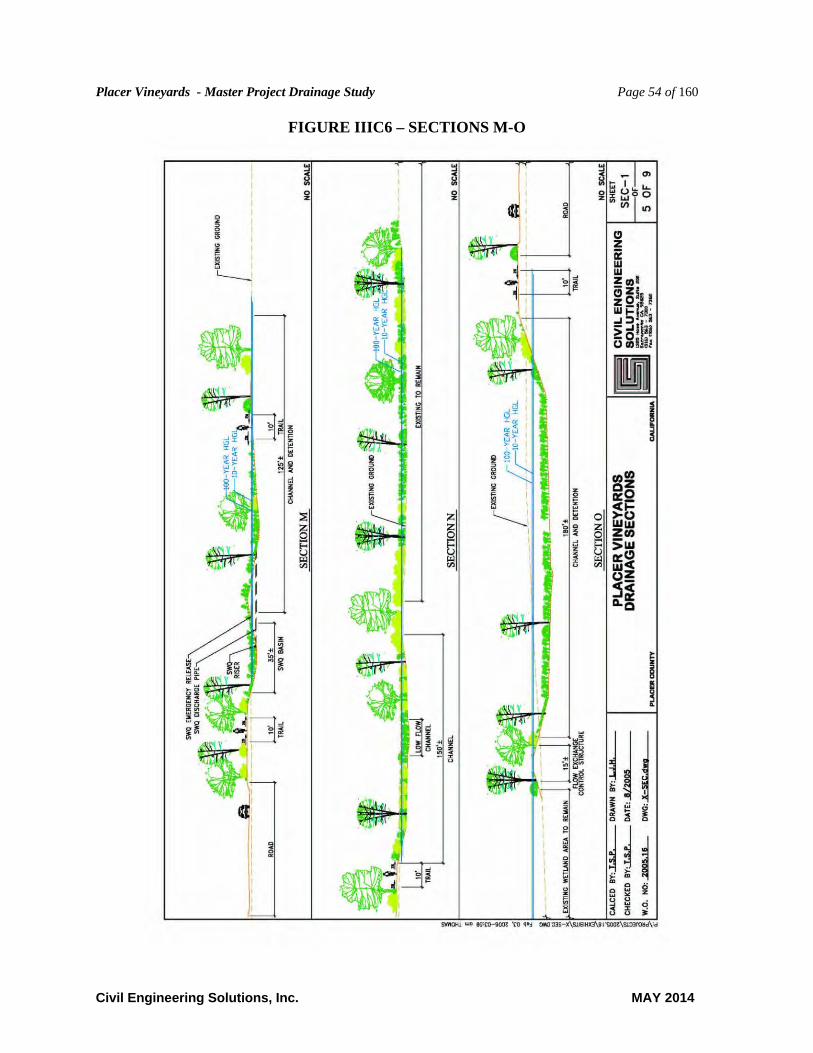
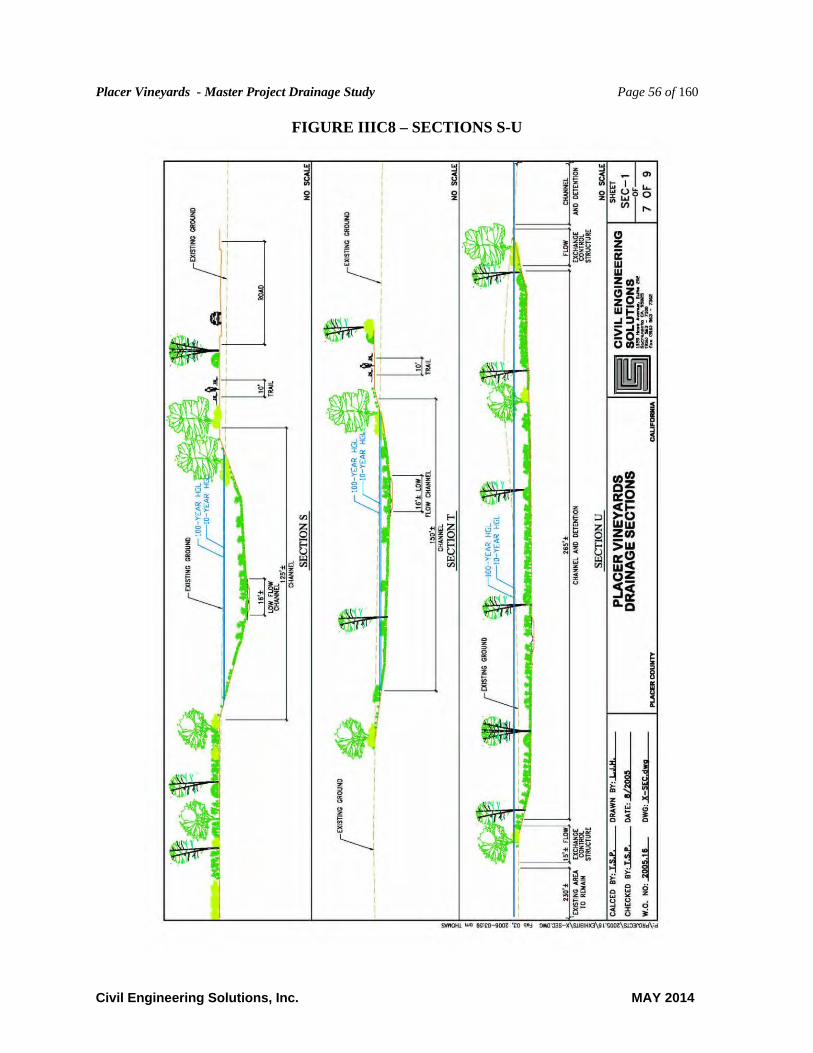
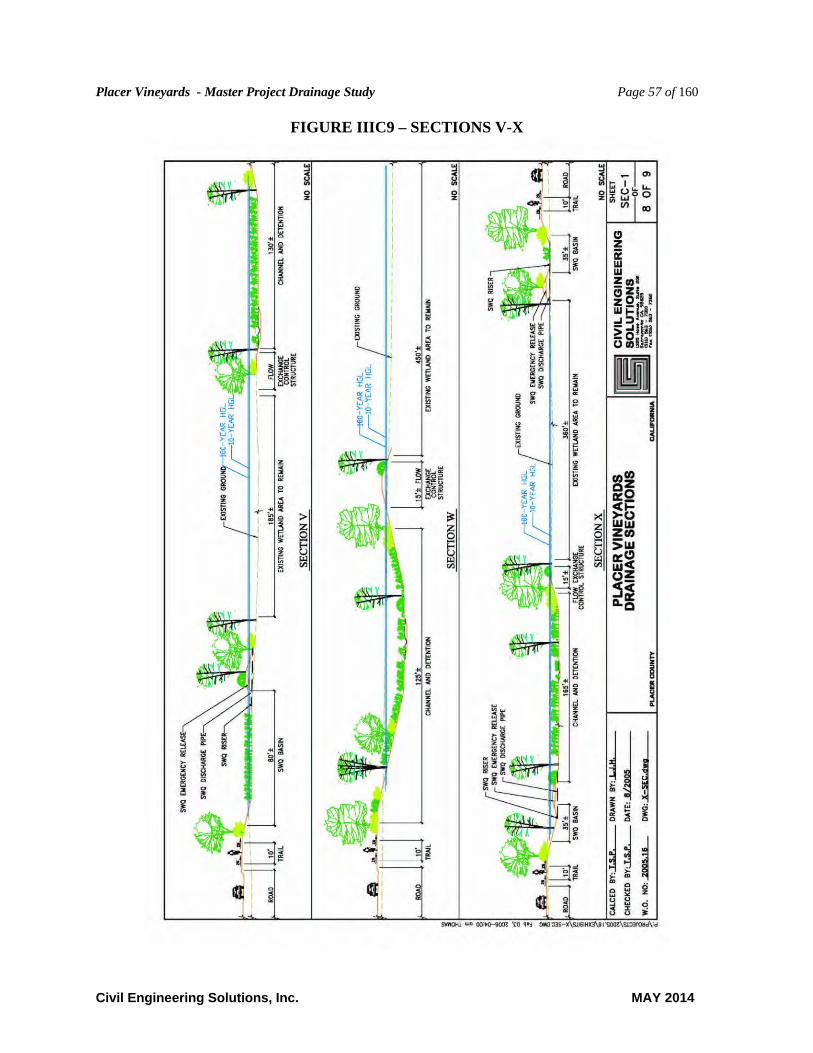
III.C Proposed Channels and Attenuation Facilities: The project proposes to collect runoff within storm drainage systems which would discharge into channels and detention facilities. Flood control channels within this project will consist of newly constructed complete channel systems and parallel flood control channels where “avoidance areas” are to be maintained in the natural state. These facilities would generally follow or be placed along the natural drainage courses within the project. The flooding limits would be confined within the channels and existing floodplain areas, generally providing 3 feet of 100-year freeboard to adjacent proposed structures. The channels would be excavated below the existing grades, and daylight at the downstream end to natural grades at the project limits. A low flow channel would be constructed throughout to confine the conveyance of year round nuisance waters. Based on information previously provided by the project engineer, we have prepared the cross sections shown in Figures IIIC2 to Figure IIIC10 (A to Z). The sections are located on Figure IIIC1, the project Schematic. Because this drawing is at a small scale, the Section locations are also shown on FP-2 (3 sheets). The cross sections presented show a concept of how the channelization and “avoidance areas” would be located within the project open space areas. The vegetation shown is simply for reference and does not necessarily represent the design vegetation of the improved areas (to be done by others).
Placer Vineyards - Master Project Drainage Study Page 49 of 160
Civil Engineering Solutions, Inc. MAY 2014
FIGURE IIIC1 – PROJECT SCHEMATIC
Placer Vineyards - Master Project Drainage Study Page 50 of 160
Civil Engineering Solutions, Inc. MAY 2014
FIGURE IIIC2 – SECTIONS A-C
Placer Vineyards - Master Project Drainage Study Page 51 of 160
Civil Engineering Solutions, Inc. MAY 2014
FIGURE IIIC3 – SECTIONS D-F
Placer Vineyards - Master Project Drainage Study Page 52 of 160
Civil Engineering Solutions, Inc. MAY 2014
FIGURE IIIC4 – SECTIONS G-I
Placer Vineyards - Master Project Drainage Study Page 53 of 160
Civil Engineering Solutions, Inc. MAY 2014
FIGURE IIIC5 – SECTIONS J-L
Placer Vineyards - Master Project Drainage Study Page 54 of 160
Civil Engineering Solutions, Inc. MAY 2014
FIGURE IIIC6 – SECTIONS M-O

Placer Vineyards - Master Project Drainage Study Page 55 of 160
Civil Engineering Solutions, Inc. MAY 2014
FIGURE IIIC7 – SECTIONS P-R
Placer Vineyards - Master Project Drainage Study Page 56 of 160
Civil Engineering Solutions, Inc. MAY 2014
FIGURE IIIC8 – SECTIONS S-U
Placer Vineyards - Master Project Drainage Study Page 57 of 160
Civil Engineering Solutions, Inc. MAY 2014
FIGURE IIIC9 – SECTIONS V-X

Placer Vineyards - Master Project Drainage Study Page 58 of 160
Civil Engineering Solutions, Inc. MAY 2014
FIGURE IIIC10 – SECTIONS Y-Z

Placer Vineyards - Master Project Drainage Study Page 59 of 160
Civil Engineering Solutions, Inc. MAY 2014
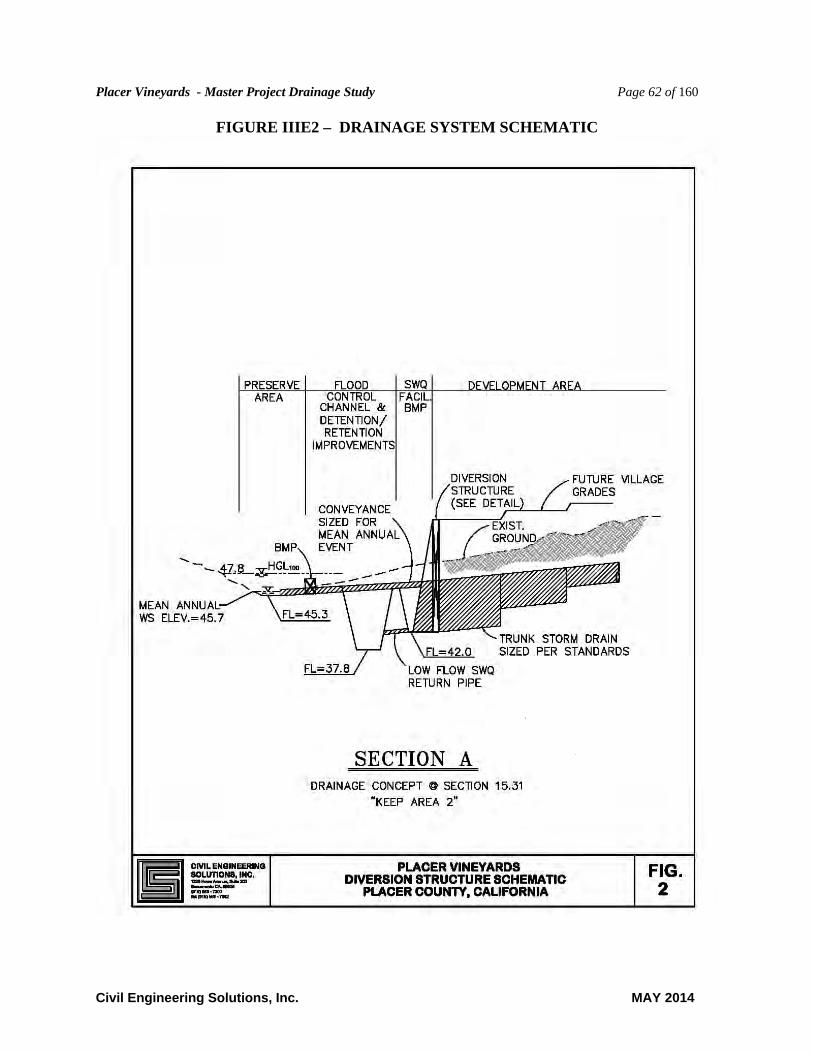
III.D Trunk Storm Drain Facilities: Figure IIIC1, the project Schematic and Exhibits SD-1A and SD-1B shows trunk storm drainage facilities. Trunk Storm drainage facilities were sized using the “Small Watershed Method” identified in the Placer County Flood Control and Water Conservation District Stormwater Management Manual (SWMM). The CS DRAINAGE STUDIO software was used to evaluate and optimize the trunk facility sizes. Complete calculation summaries are provided in Appendix K, for the 10-year and 100-year events. III.E Special Structures for Avoidance Areas: In order to preserve the integrity of the “avoidance areas” within the project where wetlands and critical habitat are to be preserved, it will be necessary that the project not adversely impact mean annual and peak annual type events. Meaning, increases in flow rates for these events should not be allowed within the unaltered swales. Additionally, where seasonal wetlands are identified, nuisance waters from non storm discharges will need to be diverted to the flood control facilities so as to not affect the seasonal nature of the existing features. In the Amendment (November 2013), we connected Trunk Storm Drain outfalls to stormwater quality basins, and determined that all storm drain can gravity outfall to proposed channels. The need for many of the complex structures previously documented has gone away, and flow distributions will be handled by weirs, channels and culverts to maintain mean annual runoff without nuisance waters to the existing swale preservation areas. These are documented on the AT-1A and AT-1B exhibits as well as the tables of this report. See detail included for special structure. A flow separation structure will still be needed in the northwest area of the project where trunk storm drains intercept runoff which currently exits the site. It is the intent of the project to install a special structure at this location that will permit nuisance waters to drain in the trunk system to project Stormwater quality basins, but discharge the mean annual even flows to the existing swale which drains offsite to the west. Because these flows are not treated, a structural type BMP will be installed on this discharge. Additionally, a high flow release will be installed at this location to discharge flows below the proposed street level which are in excess of the pressure flow capacity of this truink system. This flow split will reduce peak flows that would currently discharge to this system. Due to future potential conflicts it may be necessary to specify and construct special structures or structural BMP’s in the design phase which are not shown in this plan. These special structures may need to be used in the drainage system to divert excess floodwaters to the flood control channels, or to divert nuisance waters away from the existing swales. In any case, project drainage will be treated for water quality prior to discharge to an existing or proposed flood control channel. The Project Schematic Figure IIIC1 and Exhibits SD-1A and SD-1B show the locations of these special structures. Initial design concepts of the structures are shown in Figures IIIE1 and IIIE2 of this section.
Placer Vineyards - Master Project Drainage Study Page 60 of 160
Civil Engineering Solutions, Inc. MAY 2014
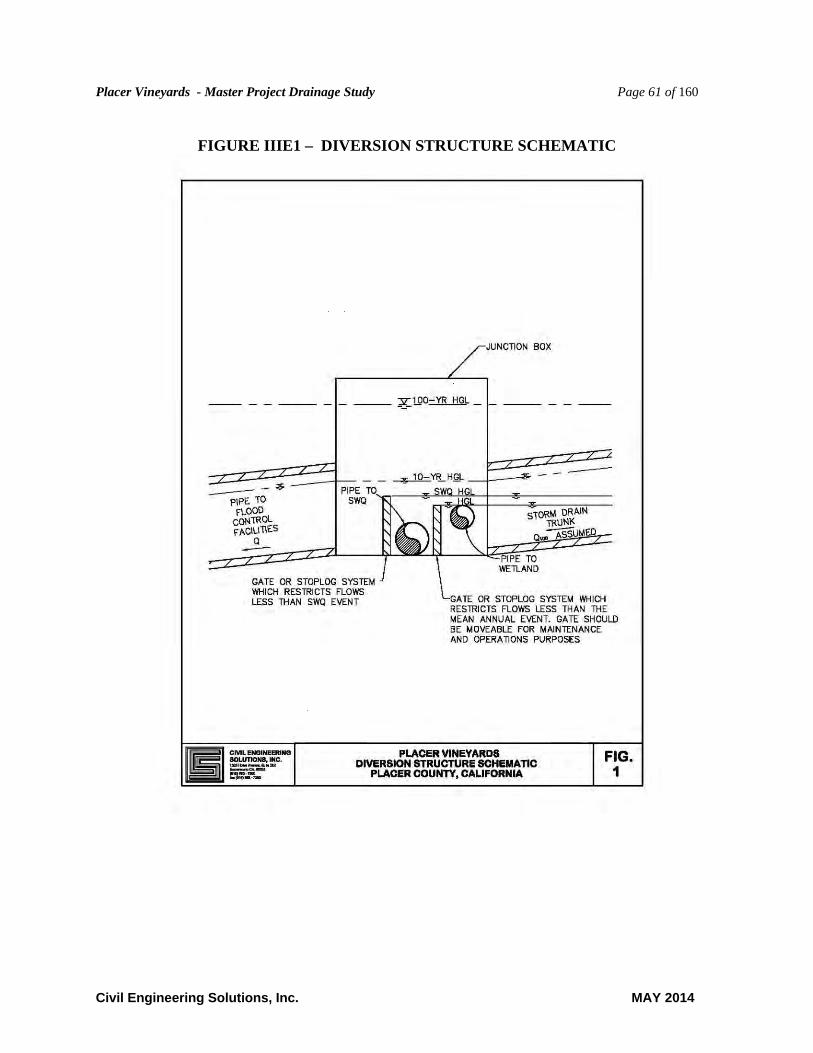
Based on the hydraulic function of the proposed project improvements, the following generalizations may be used in preliminary design of the systems:
It roughly works out such that when the difference in elevation between the existing wetland invert and the surface elevation of the future streets is less than 7 feet, pumping or a design standard modification may be necessary to maintain mean annual flow rates. The design standard modification relates to the Placer County standard which does not permit pressure flow in the 10-year design event. When the difference is less than roughly 7 feet, in order to prevent submergence of the storm drainage system in the 10-year event it would need to be constructed so shallow it would conflict with other utilities, and minimum pipe slopes cannot be obtained. Minimum pipe slopes must be maintained, and conflicts with other utilities must be avoided. As a result, in some cases the storm drain will be constructed to a depth where flows cannot gravity to the wetland areas directly, and pumps may be necessary. In other cases, where the storm drain minimum slopes can be maintained, it may be necessary to request a design standard exception to permit a portion of the trunk storm drainage system, upstream of the diversion structure, to flow under pressure in the 10-year event.
The gate or stop log system between the wetland discharge and the stormwater quality discharge should be removable to permit maintenance flushing of sediment out of the system. Also, it may be possible to design this gate on a float system, to permit flood event flows (in excess of mean annual) to pass directly through to the next chamber, such that sediment and debris will not collect in the backwater upstream of the wetland diversion weir.
Note that where the pipe system invert is above the invert of the wetlands, the diversion to wetlands component should be placed downstream of the water quality device.
Where the pipe system invert is below the invert of the wetlands, a separate stormwater quality device would be necessary on the wetland feeder system.
The exhibits provided are schematic only, and each system will have different constraints which will require special design considerations. We recommend that the ability to use pumping and 10-year pipe submergence criteria be verified prior to design.
Placer Vineyards - Master Project Drainage Study Page 61 of 160
Civil Engineering Solutions, Inc. MAY 2014
FIGURE IIIE1 – DIVERSION STRUCTURE SCHEMATIC
Placer Vineyards - Master Project Drainage Study Page 62 of 160
Civil Engineering Solutions, Inc. MAY 2014
FIGURE IIIE2 – DRAINAGE SYSTEM SCHEMATIC
Placer Vineyards - Master Project Drainage Study Page 63 of 160
Civil Engineering Solutions, Inc. MAY 2014
III.F State Legislative Requirements (SB5): The State of California has passed several legislative mandates that have the potential to impact the project design requirements. In 2007, the State of California passed a series of laws referred to as SB5(2007) directing the Department of Water Resources to prepare flood maps for the central valley flood system and the State Plan of Flood Control (SPFC) which includes a system of levees and flood control facilities located in the Central Valley. This legislation also set the 200-year event as the urban level of flood protection for the state. Finally this legislation renamed the State Reclamation Board as the “Central Valley Flood Protection Board” (CVFBP) and provided that Board with additional direction on its authority with respect to certain provisions of Title 23 – Water Code. Specifically related to this project, SB5 “requires all cities and counties within the Sacramento-San Joaquin Valley, as defined in California Government Code Sections 65007(h) and (j), to make findings related to an urban level of flood protection or the national Federal 1-2 August 2013 Urban Level of Flood Protection Criteria Emergency Management Agency (FEMA) standard of flood protection before: (1) entering into a development agreement for any property that is located within a flood hazard zone; (2) approving a discretionary permit or other discretionary entitlement, or a ministerial permit that would result in the construction of a new residence, for a project that is located within a flood hazard zone; or (3) approving a tentative map, or a parcel map for which a tentative map was not required, for any subdivision that is located within a flood hazard zone.” (ULOP August 2013 DRAFT) This means that Cities and counties with areas that drain to the Central Valley and have urban developing areas within the FEMA identified potential 500-year flood prone zones must make a finding of fact about the flood protection meeting the Urban Level of flood Protection before issuing permits. In 2012, SB1278 and AB1965 establish the timeline for the requirements of Cities and Counties to amend their General Plans and Zoning Ordinances to comply with SB5, and also defined the Urban Level of Flood Protection (ULOP) per the following:
“Urban level of flood protection” means the level of protection that is necessary to withstand flooding that has a 1-in-200 chance of occurring in any given year using criteria consistent with, or developed by, the Department of Water Resources. “Urban level of flood protection” shall not mean shallow flooding or flooding from local drainage that meets the criteria of the national Federal Emergency Management Agency standard of flood protection.
Once Cities and Counties have revised their General Plans and Zoning Ordinances, the ULOP requirements will go into effect (expected by July 15, 2015). The Department of Water Resources is developing a guidance document for how to interpret the ULOP criteria. Essential to this is defining “Local” and “:Shallow”. The August 2013 draft of this document (not currently available to the public) defines:
Placer Vineyards - Master Project Drainage Study Page 64 of 160
Civil Engineering Solutions, Inc. MAY 2014
“Flooding from local drainage considers both the watershed size and source of flooding. For these criteria, flooding from local drainage is defined as flooding from a drainage area less than 10 square miles. “
“For purposes of these criteria, shallow flooding is defined as flooding that is 3.0 feet or less based on a 200-year event. Shallow flooding typically includes unconfined flows over broad, relatively low relief areas, such as alluvial plains; intermittent flows in arid regions that have not developed a system of well-defined channels; overbank flows that remain unconfined, such as on delta formations; overland flow in urban areas; and flows collecting in depressions to form ponding areas.”
The Finding of Fact process is defined in the ULOP as: The California Department of Water Resources developed the Urban Level of Flood Protection Criteria (Criteria). For selected land use decisions, cities and counties in specific locations within the Sacramento and San Joaquin river basins need to make a finding related to an urban level of flood protection based on substantial evidence in the record. Cities and counties may use criteria consistent with this Criteria or apply this Criteria directly The Evidentiary processes are defined in the ULOP guidance document. The affected Land Use decisions are listed as:
• Entering into a development agreement for all types of property development • Approving a discretionary permit or discretionary entitlement for all projects • Approving a ministerial permit for all projects that would result in construction of a new residence • Approving a tentative map consistent with the Subdivision Map Act for all subdivisions • Approving a parcel map for which a tentative map is not required consistent with the Subdivision Map Act for all subdivisions
An Urban Area is defined as: “It is located within an urban area that is a developed area as defined by Code of Federal Regulations Title 44, Section 59.1 with 10,000 residents or more4, or an urbanizing area that is a developed area or an area outside a developed area that is planned or anticipated to have 10,000 residents or more within the next 10 years.” III.F.1 Applicability to Placer Vineyards: The ULOP sets forth two criteria applicable to all lands within the Central Valley. The fundamental difference between the two is whether the lands are considered Urban, in which case the 200-year event criteria goes into effect. The alternate minimum criteria for areas which are not subject to the Urban Level of Protection is the NFIP 100-year event criteria described in the code of federal regulations Articles 63 and 65. To determine this project’s applicability to the Urban Level of Protection, Table III.F.1 is used to respond to the ULOP questions:
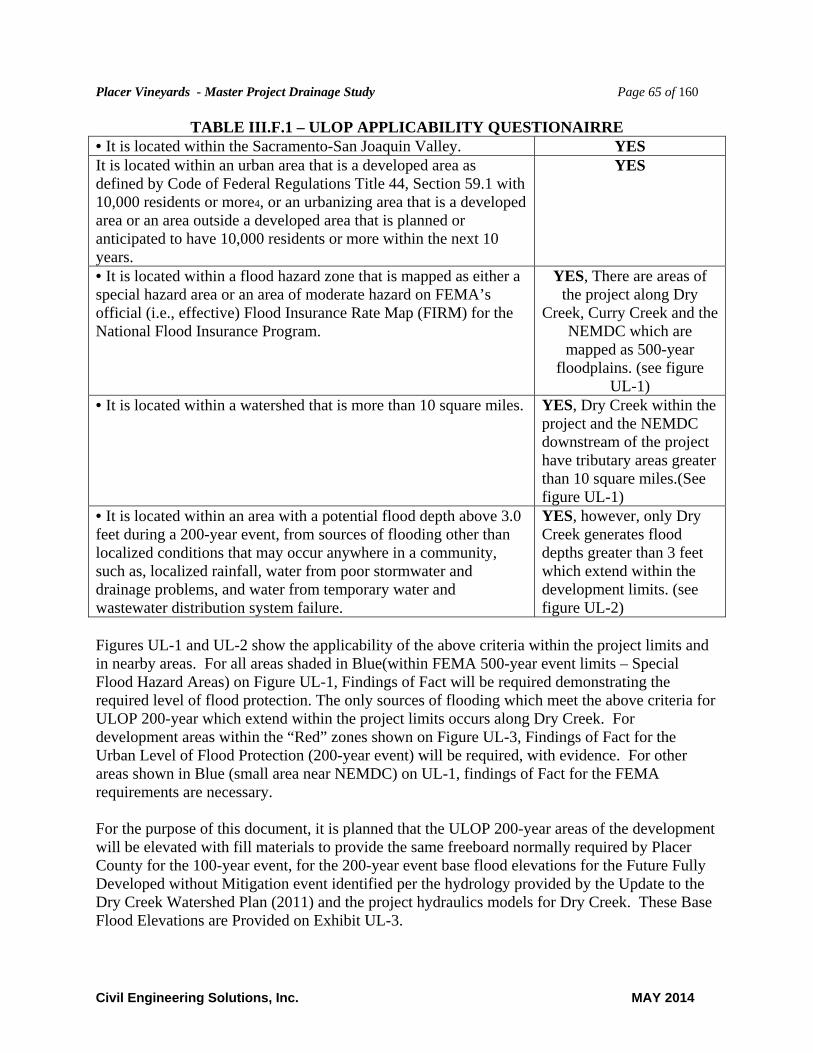
Placer Vineyards - Master Project Drainage Study Page 65 of 160
Civil Engineering Solutions, Inc. MAY 2014
TABLE III.F.1 – ULOP APPLICABILITY QUESTIONAIRRE • It is located within the Sacramento-San Joaquin Valley. YES It is located within an urban area that is a developed area as defined by Code of Federal Regulations Title 44, Section 59.1 with 10,000 residents or more4, or an urbanizing area that is a developed area or an area outside a developed area that is planned or anticipated to have 10,000 residents or more within the next 10 years.
YES
• It is located within a flood hazard zone that is mapped as either a special hazard area or an area of moderate hazard on FEMA’s official (i.e., effective) Flood Insurance Rate Map (FIRM) for the National Flood Insurance Program.
YES, There are areas of the project along Dry
Creek, Curry Creek and the NEMDC which are mapped as 500-year
floodplains. (see figure UL-1)
• It is located within a watershed that is more than 10 square miles. YES, Dry Creek within the project and the NEMDC downstream of the project have tributary areas greater than 10 square miles.(See figure UL-1)
• It is located within an area with a potential flood depth above 3.0 feet during a 200-year event, from sources of flooding other than localized conditions that may occur anywhere in a community, such as, localized rainfall, water from poor stormwater and drainage problems, and water from temporary water and wastewater distribution system failure.
YES, however, only Dry Creek generates flood depths greater than 3 feet which extend within the development limits. (see figure UL-2)
Figures UL-1 and UL-2 show the applicability of the above criteria within the project limits and in nearby areas. For all areas shaded in Blue(within FEMA 500-year event limits – Special Flood Hazard Areas) on Figure UL-1, Findings of Fact will be required demonstrating the required level of flood protection. The only sources of flooding which meet the above criteria for ULOP 200-year which extend within the project limits occurs along Dry Creek. For development areas within the “Red” zones shown on Figure UL-3, Findings of Fact for the Urban Level of Flood Protection (200-year event) will be required, with evidence. For other areas shown in Blue (small area near NEMDC) on UL-1, findings of Fact for the FEMA requirements are necessary. For the purpose of this document, it is planned that the ULOP 200-year areas of the development will be elevated with fill materials to provide the same freeboard normally required by Placer County for the 100-year event, for the 200-year event base flood elevations for the Future Fully Developed without Mitigation event identified per the hydrology provided by the Update to the Dry Creek Watershed Plan (2011) and the project hydraulics models for Dry Creek. These Base Flood Elevations are Provided on Exhibit UL-3.

Placer Vineyards - Master Project Drainage Study Page 66 of 160
Civil Engineering Solutions, Inc. MAY 2014
For the Remainder of the project, the current Placer County requirements for Freeboard and analysis of the 100-year event, meet or exceed the requirements of the code of Federal Regulations (FEMA criteria), and will be required as described in this report to meet the non-urban ULOP requirements..
Placer Vineyards - Master Project Drainage Study Page 67 of 160
Civil Engineering Solutions, Inc. MAY 2014
IV. Water Quality:
Stormwater Managmeent During Construction: The release of on-site stormwater runoff during Construction activities is regulated by the State General Construction Permit issued by the Regional Water Quality Control Board for all construction sites greater than one acre. The General Construction permit requires that a Storm Water Pollution Prevention Plan (SWPPP) is created to address how the storm water from a particular construction site will be maintained and treated prior to being discarded from the site. The SWPPP is an evolving document that changes with the dynamics of the site development. The use of Best Management Practices (BMPs) during the construction process will generally incorporate erosion controls and sediment controls. Erosion and sediment control BMPs include such things as applying straw mulch to disturbed areas, the use of fiber rolls and silt fences, sedimentation basins, drain inlet protection, stabilized construction accesses, and material management. The final sizing and selection of BMPs will consider requirements specific to the Curry Creek watershed and proposed developed activities.
A Stormwater Pollution Prevention Plan (SWPPP) will be required to describe the BMPs which will be used to prevent erosion and to clean site discharge waters before entering State Waters. A permit with the Central Valley Regional Water Quality Control Board of the State of California will be obtained for the proposed construction activities. If construction occurs during the wet season, additional winterization improvements will be required to stabilize the disturbed areas of the site, prevent erosion, and clean discharge waters. All construction related BMP improvements must comply with the “NPDES General Permit for Storm Water Discharges Associated with Construction Activities, NPDES No. CAS000002, Order No. 99-08DWQ”.
A Fact Sheet on the pplicability and requirements of the General Construction Permit can be found at the following link:
http://www.waterboards.ca.gov/water_issues/programs/stormwater/docs/constpermits/wqo_2009_0009_factsheet.pdf
Post Construction Stormwater Management: The onsite project drainage would be designed to provide water quality treatment of runoff from paved and other developed areas prior to release into the swales and streams. This treatment will consist of the following:
1. Directing some of the flow to sheet discharge onto grassy areas or open space. 2. The installations of “Fossil Filter” or equivalent petroleum absorbing insert assemblies
in the project drop inlets. 3. The placement of water quality interceptor devices.
Placer Vineyards - Master Project Drainage Study Page 68 of 160
Civil Engineering Solutions, Inc. MAY 2014
4. The placement of water quality sediment basins within detention facilities and channels. 5. ...Use of rock-lined ditches below pipe outlets.
Another best management practice will involve prompt re-vegetation of disturbed areas. Regional proposed project Stormwater Quality facilities are shown on Figure IVA1 and on exhibits SWQ-1A and SWQ-1B. Preliminary Sizing for the basins shown are presented in Table IVA1. Sizing of these facilities is based on the methodologies outlined in the “BMP Sizing Recommendations – Technical Subcommittee of the PRSCG – Placer Regional Stormwater Coordination Group”, dated 7/23/04. The sizing outlined in Table IV1 also assumes that no other inner basin treatment or BMP’s are proposed which would reduce the size of the regional facilities. However, some of the BMP’s typically implemented on projects like this may required reduce the size of the regional facilities, by treating a portion of the flows upstream of the proposed regional basin or structural BMP locations. The sizing factors using Low Impact Development Measures as further detailed in this section. Figure IVA2 shows the locations where untreated and treated flows would be located in the post-project conditions.
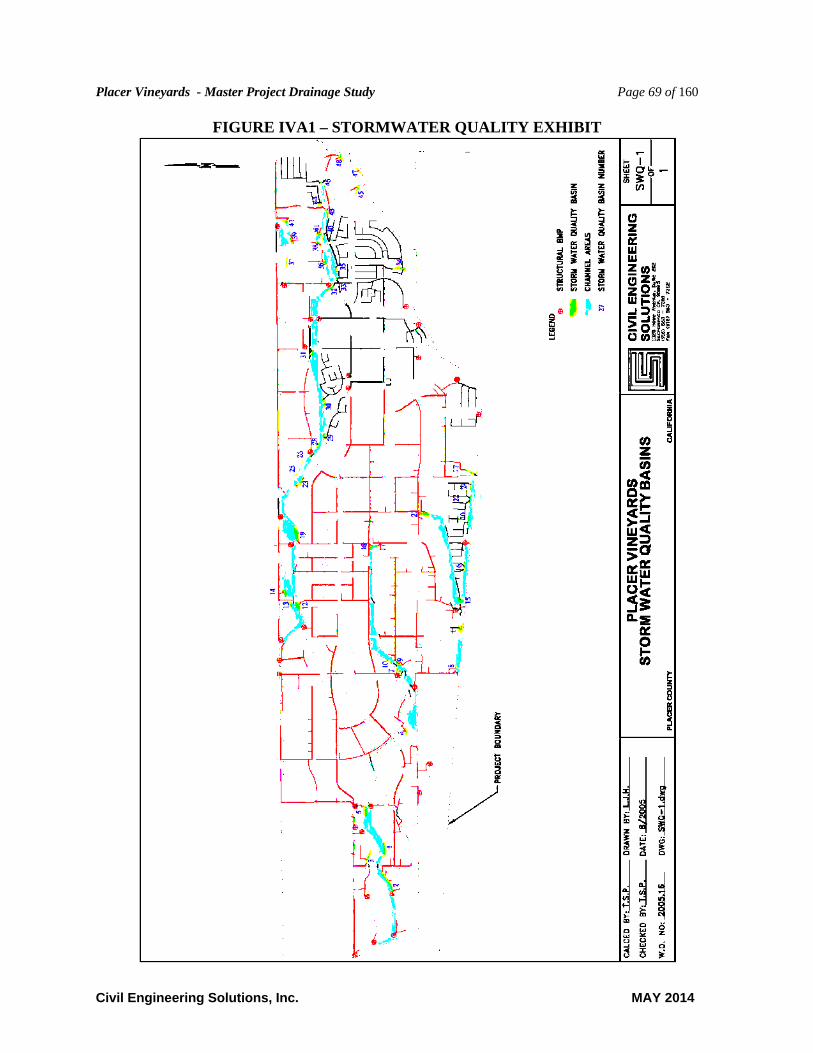
Placer Vineyards - Master Project Drainage Study Page 69 of 160
Civil Engineering Solutions, Inc. MAY 2014
FIGURE IVA1 – STORMWATER QUALITY EXHIBIT
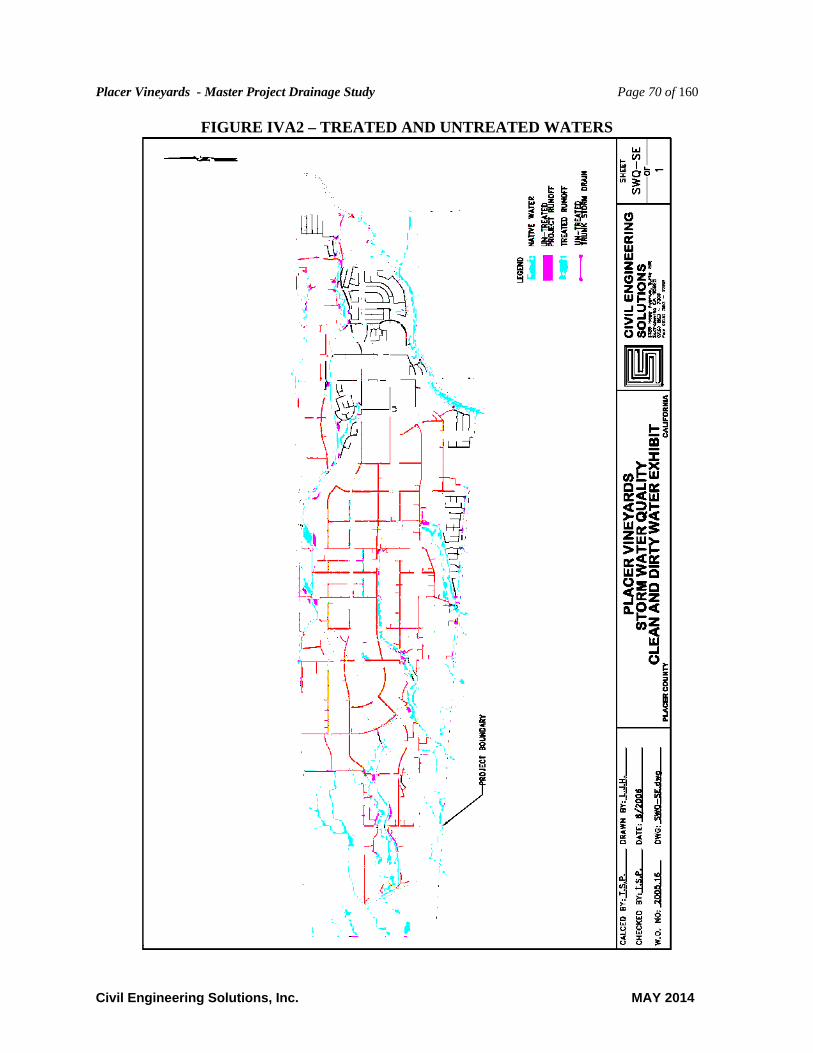
Placer Vineyards - Master Project Drainage Study Page 70 of 160
Civil Engineering Solutions, Inc. MAY 2014
FIGURE IVA2 – TREATED AND UNTREATED WATERS
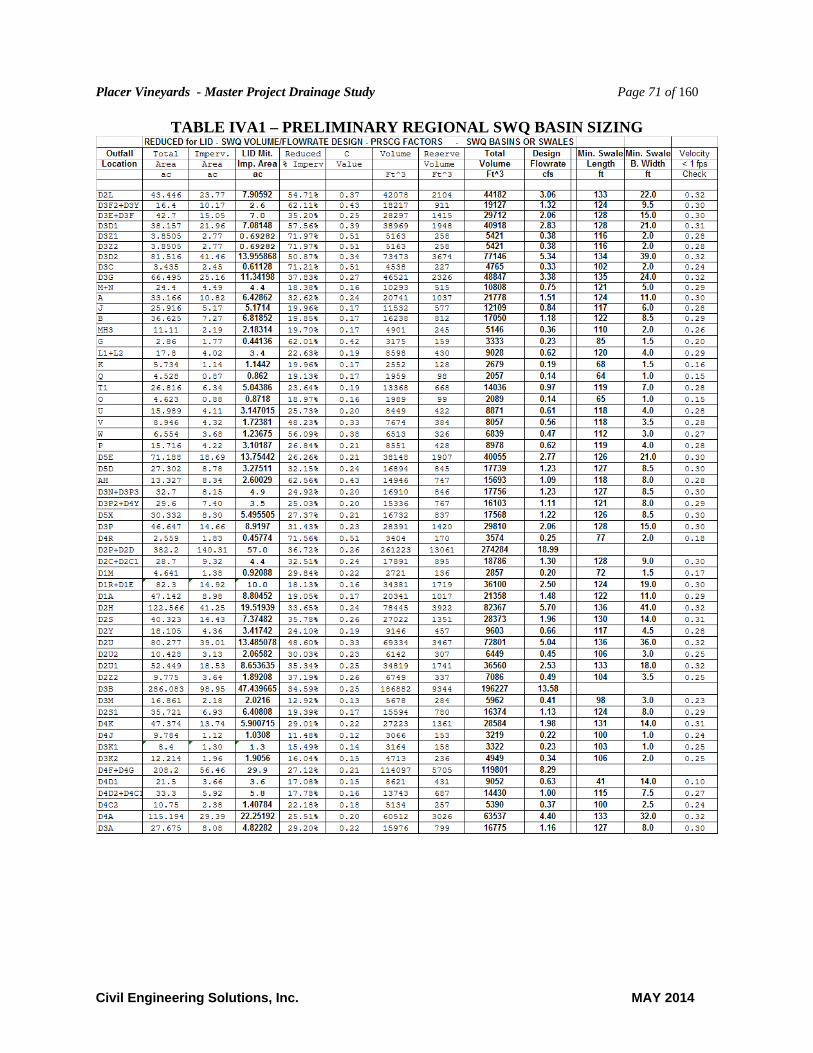
Placer Vineyards - Master Project Drainage Study Page 71 of 160
Civil Engineering Solutions, Inc. MAY 2014
TABLE IVA1 – PRELIMINARY REGIONAL SWQ BASIN SIZING
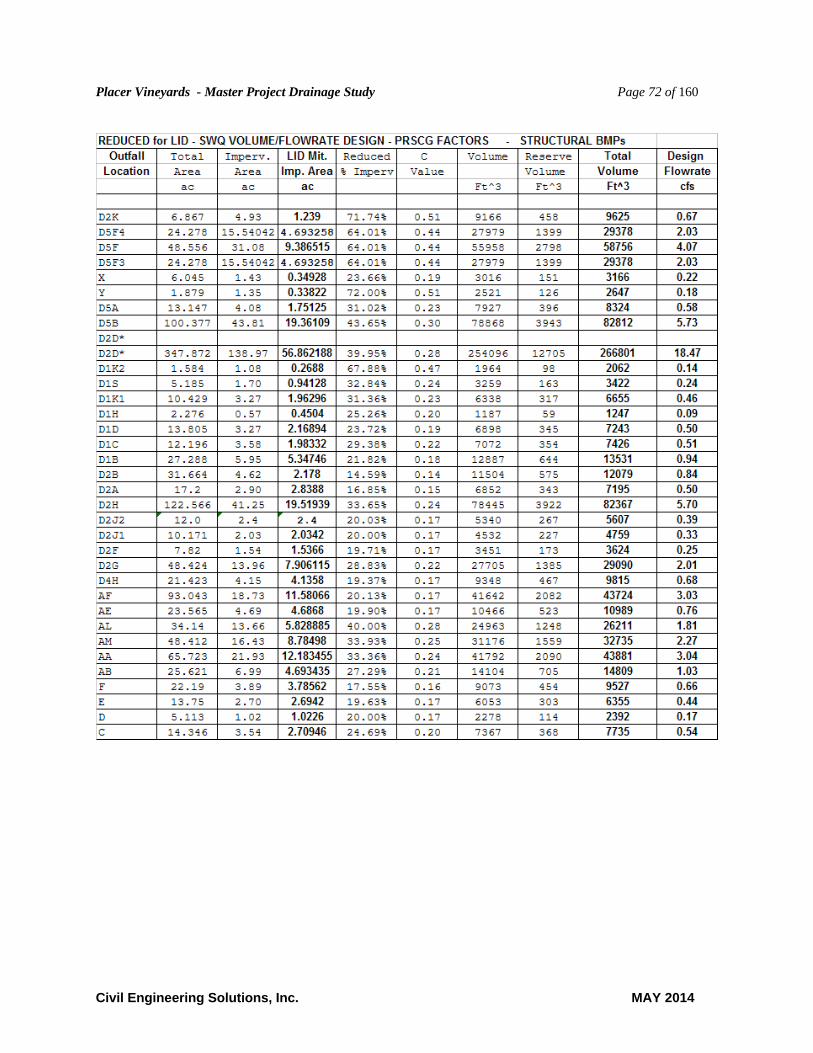
Placer Vineyards - Master Project Drainage Study Page 72 of 160
Civil Engineering Solutions, Inc. MAY 2014

Placer Vineyards - Master Project Drainage Study Page 73 of 160
Civil Engineering Solutions, Inc. MAY 2014
IV.A LOW IMPACT DEVELOPMENT MEASURES: Order NO. 2013-0001-DWQ (CAS000004), otherwise known as the new (2013) Phase II MS4 Permit, requires (starting July 2014): E.12.b.ii Implementation Level - Projects shall implement one or more of the following site design measures to reduce project site runoff:
(a) Stream Setbacks and Buffers - a vegetated area including trees, shrubs, and herbaceous vegetation, that exists or is established to protect a stream system, lake reservoir, or coastal estuarine area; (b) Soil Quality Improvement and Maintenance - improvement and maintenance soil through soil amendments and creation of microbial community; (c) Tree Planting and Preservation - planting and preservation of healthy, established trees that include both evergreens and deciduous, as applicable; (d) Rooftop and Impervious Area Disconnection - rerouting of rooftop drainage pipes to drain rainwater to rain barrels, cisterns, or permeable areas instead of the storm sewer; (e) Porous Pavement - pavement that allows runoff to pass through it, thereby reducing the runoff from a site and surrounding areas and filtering pollutants; (f) Green Roofs - a vegetative layer grown on a roof (rooftop garden); (g) Vegetated Swales - a vegetated, open-channel management practice designed specifically to treat and attenuate storm water runoff; (h) Rain Barrels and Cisterns - system that collects and stores storm water runoff from a roof or other impervious surface.
E.12.e.ii.(a) Site Assessment At the earliest planning stages, the Permittee shall require Regulated Projects to assess and evaluate how site conditions, such as soils, vegetation, and flow paths, will influence the placement of buildings and paved surfaces. The evaluation will be used to meet the goals of capturing and treating runoff and assuring these goals are incorporated into the project design. The Permittee may adopt or reference an existing LID site assessment methodology22Permittees shall require Regulated Projects to consider optimizing the site layout through the following methods:
1) Define the development envelope and protected areas, identifying areas that are most suitable for development and areas to be left undisturbed.
2) Concentrate development on portions of the site with less permeable soils and preserve areas that can promote infiltration. 3) Limit overall impervious coverage of the site with paving and roofs. 4) Set back development from creeks, wetlands, and riparian habitats. 5) Preserve significant trees. 6) Conform the site layout along natural landforms. 7) Avoid excessive grading and disturbance of vegetation and soils. 8) Replicate the site's natural drainage patterns. 9) Detain and retain runoff throughout the site.
These two sections of the permit address the mandatory need for the use of Low Impact development measures with this project. Through the development of a plan to implement the above measures we estimate that the following mitigation for the stormwater quality and 2-year events can be achieved:
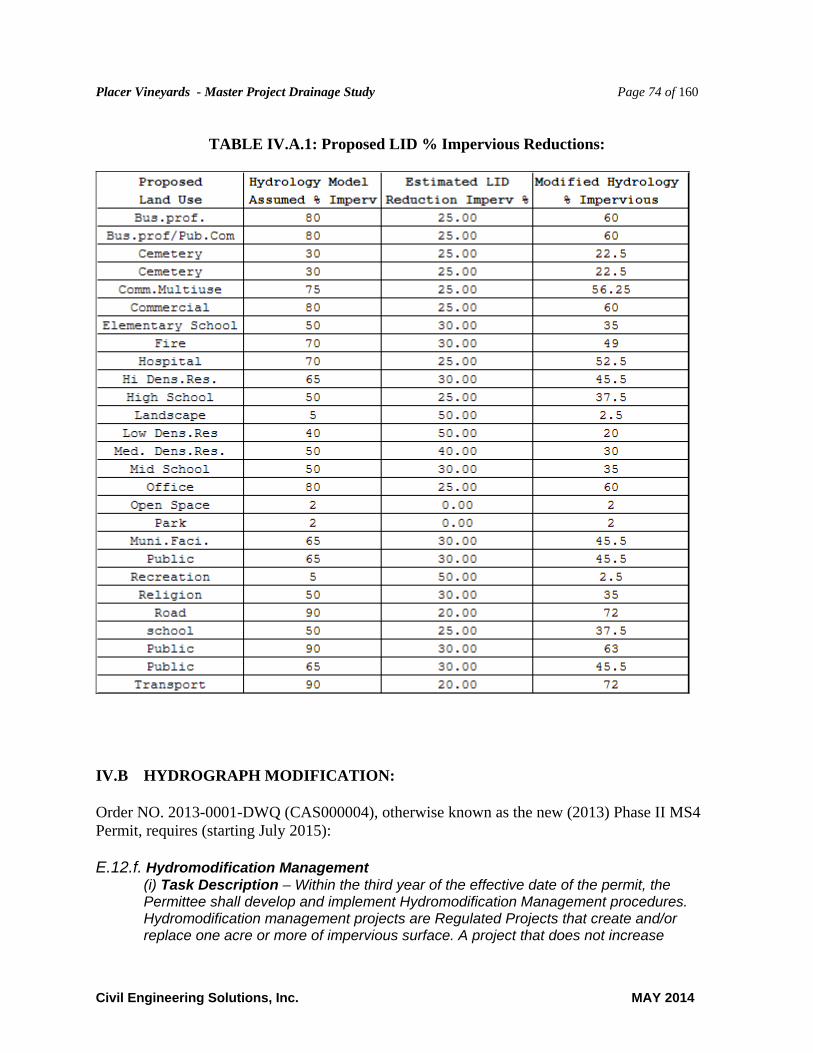
Placer Vineyards - Master Project Drainage Study Page 74 of 160
Civil Engineering Solutions, Inc. MAY 2014
TABLE IV.A.1: Proposed LID % Impervious Reductions:
IV.B HYDROGRAPH MODIFICATION: Order NO. 2013-0001-DWQ (CAS000004), otherwise known as the new (2013) Phase II MS4 Permit, requires (starting July 2015): E.12.f. Hydromodification Management
(i) Task Description – Within the third year of the effective date of the permit, the Permittee shall develop and implement Hydromodification Management procedures. Hydromodification management projects are Regulated Projects that create and/or replace one acre or more of impervious surface. A project that does not increase
Placer Vineyards - Master Project Drainage Study Page 75 of 160
Civil Engineering Solutions, Inc. MAY 2014
impervious surface area over the pre-project condition is not a hydromodification management project.
(ii) Implementation Level - The Permittee shall implement the following Hydromodification Standard:
(a) Post-project runoff shall not exceed estimated pre-project flow rate for the 2-year, 24-hour storm
Alternatively, the Permittee may use a geomorphically based hydromodification standard or set of standards and analysis procedures designed to ensure that Regulated Projects do not cause a decrease in lateral (bank) and vertical (channel bed) stability in receiving stream channels. The alternative hydromodification standard or set of standards and analysis procedures must be reviewed and approved by the Regional Board Executive Officer.
Alternative methods and requirements have not been established by PRSCG or Placer County. For the purposes of this study “(a)” is interpreted such that the term “flow rate” means the “peak flow rate”. However, we recognize that the timing and shape of resulting hydrographs should also be considered. In order to provide a better comparison, the hydrology models have been improved (November 2013 amendment), and hydraulic routing is being used for main channels within the project to better estimate the expected hydrograph response for small events including the 2-year 24-hour event. A special version of the hydrology models were created for the Post-project Conditions factoring the Low Impact Development measures, and impervious reductions identified in TABLE IV.A.1. Tables IVB1, IVB2 and IVB3 identify the hydrology input factors used for the LID factored post-project analysis. This analysis was only run for the 2-year 24-hour event.
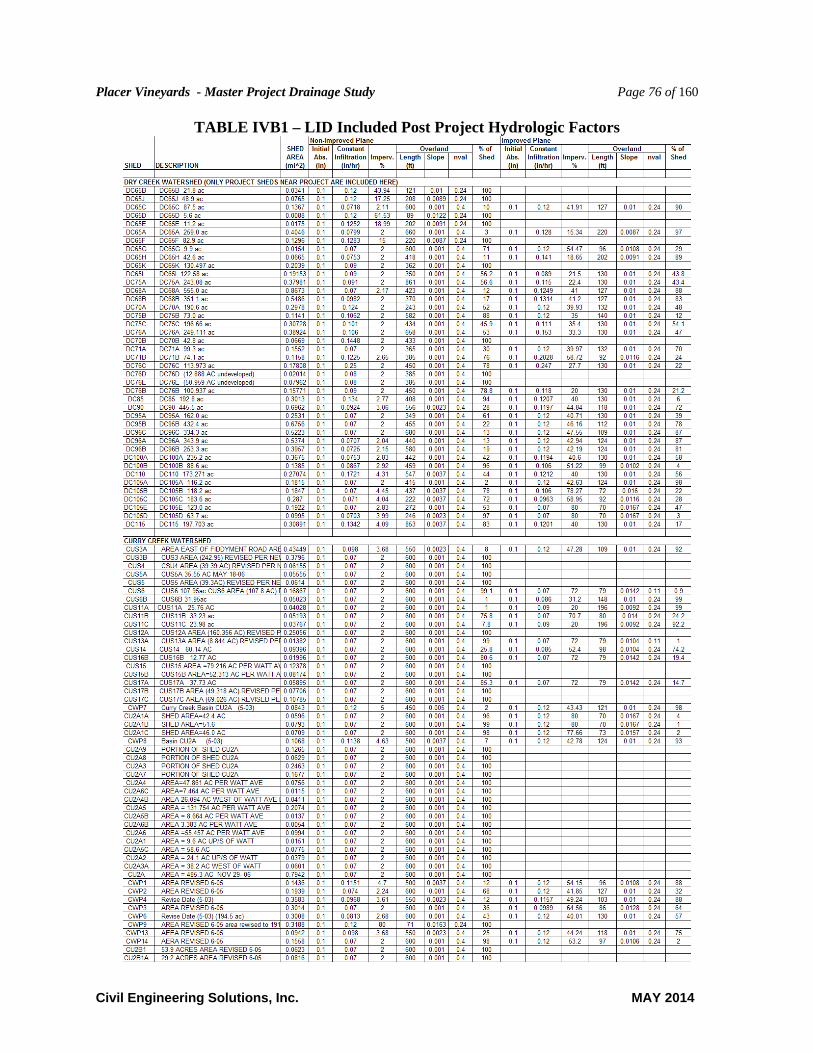
Placer Vineyards - Master Project Drainage Study Page 76 of 160
Civil Engineering Solutions, Inc. MAY 2014
TABLE IVB1 – LID Included Post Project Hydrologic Factors
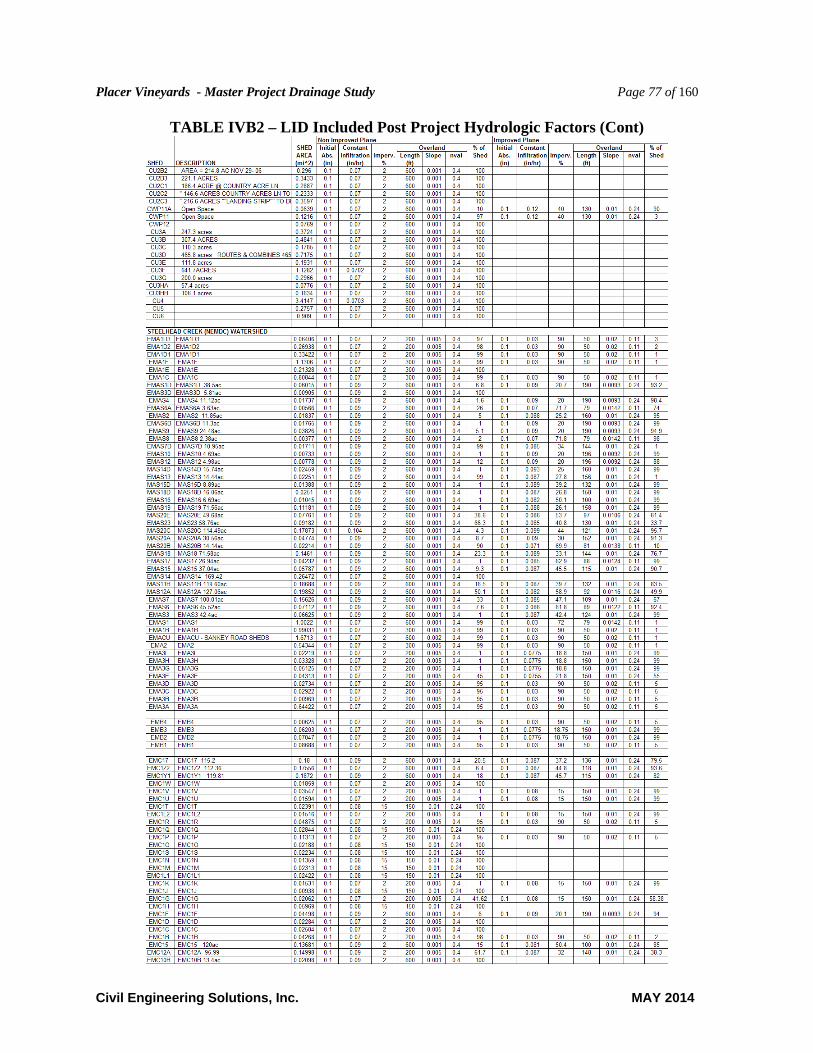
Placer Vineyards - Master Project Drainage Study Page 77 of 160
Civil Engineering Solutions, Inc. MAY 2014
TABLE IVB2 – LID Included Post Project Hydrologic Factors (Cont)
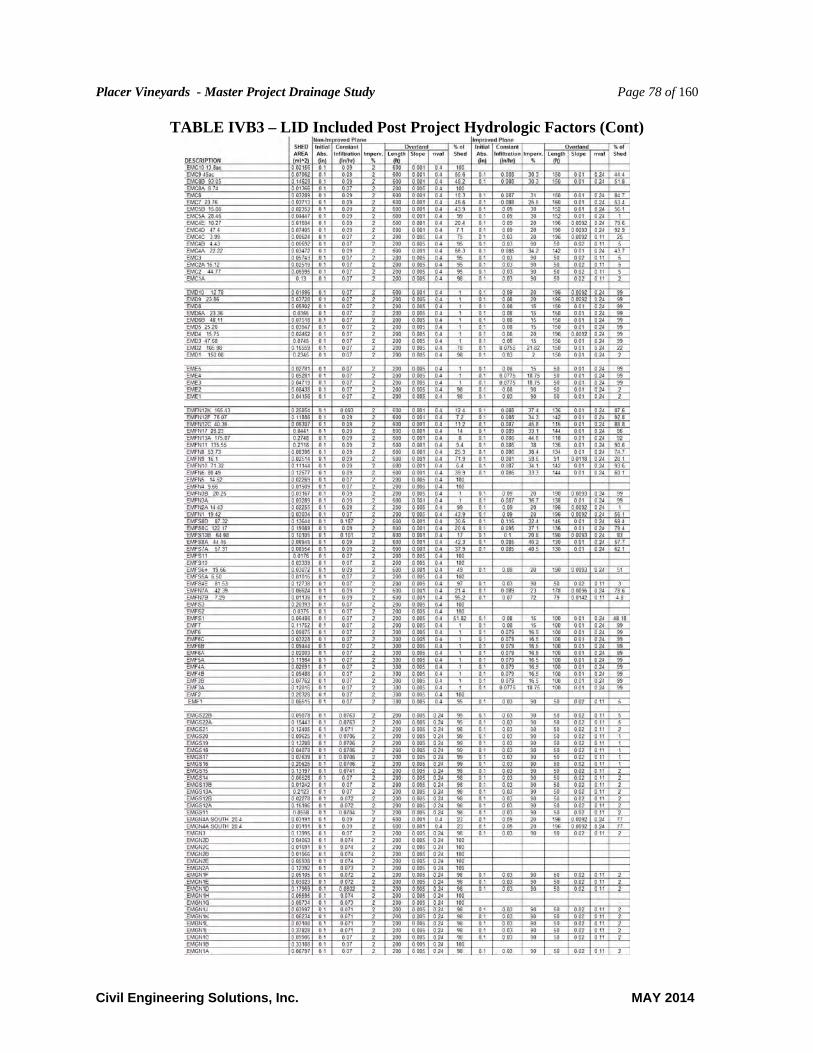
Placer Vineyards - Master Project Drainage Study Page 78 of 160
Civil Engineering Solutions, Inc. MAY 2014
TABLE IVB3 – LID Included Post Project Hydrologic Factors (Cont)
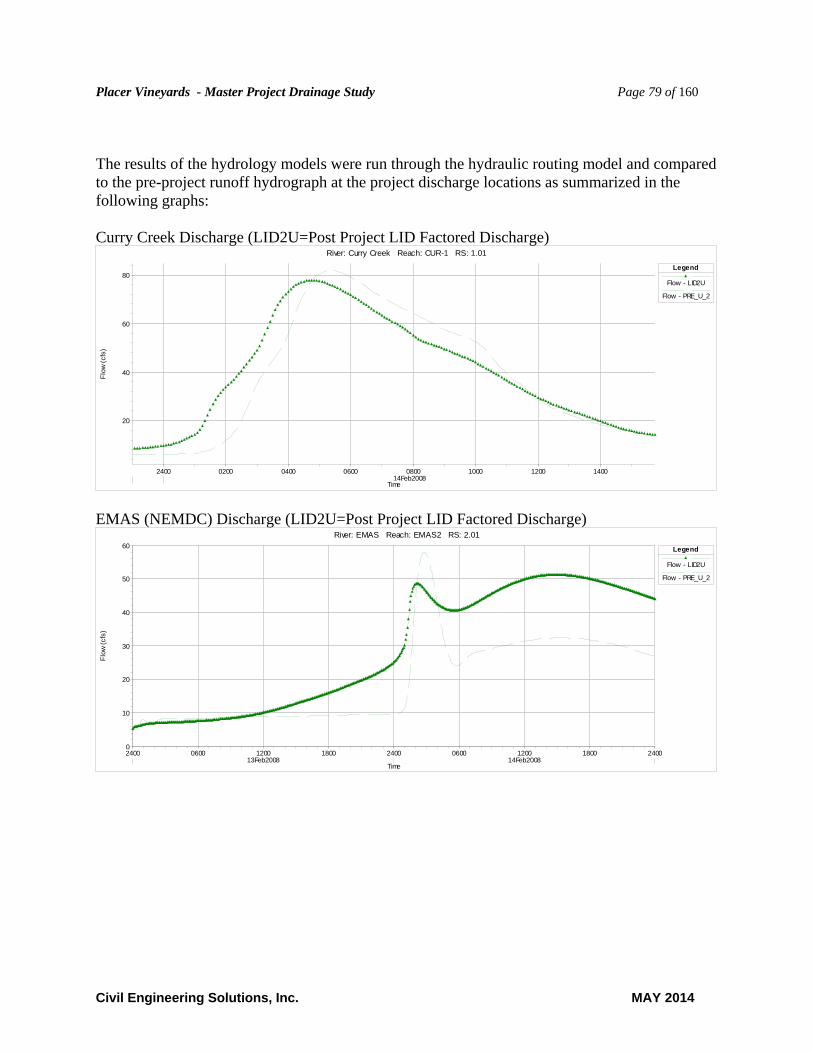
Placer Vineyards - Master Project Drainage Study Page 79 of 160
Civil Engineering Solutions, Inc. MAY 2014
The results of the hydrology models were run through the hydraulic routing model and compared to the pre-project runoff hydrograph at the project discharge locations as summarized in the following graphs: Curry Creek Discharge (LID2U=Post Project LID Factored Discharge)
2400 0200 0400 0600 0800 1000 1200 140014Feb2008
20
40
60
80
River: Curry Creek Reach: CUR-1 RS: 1.01
Time
Flo
w (
cfs)
Legend
Flow - LID2U
Flow - PRE_U_2
EMAS (NEMDC) Discharge (LID2U=Post Project LID Factored Discharge)
2400 0600 1200 1800 2400 0600 1200 1800 240013Feb2008 14Feb2008
0
10
20
30
40
50
60
River: EMAS Reach: EMAS2 RS: 2.01
Time
Flo
w (
cfs)
Legend
Flow - LID2U
Flow - PRE_U_2

Placer Vineyards - Master Project Drainage Study Page 80 of 160
Civil Engineering Solutions, Inc. MAY 2014
EMA3 (NEMDC) Discharge (LID2U=Post Project LID Factored Discharge)
2400 0600 1200 180014Feb2008
0
5
10
15
20
River: EMA3 Reach: EMA3 RS: 18.0
Time
Flo
w (
cfs)
Legend
Flow - PRE_U_2
Flow - LID2U
EMCN (NEMDC) Discharge (LID2U=Post Project LID Factored Discharge)
2400 0600 1200 1800 240014Feb2008
0
10
20
30
40
River: EMCN Reach: EMCN9 RS: 25.03
Time
Flo
w (
cfs)
Legend
Flow - LID2U
Flow - PRE_U_2
EMCS (NEMDC) Discharge (LID2U=Post Project LID Factored Discharge)
2400 0200 0400 0600 0800 1000 1200 1400 1600 1800 200014Feb2008
10
20
30
40
50
River: EMCS Reach: EMCS9 RS: 15.08
Time
Flo
w (
cfs)
Legend
Flow - LID2U
Flow - PRE_U_2
EMD (NEMDC) Discharge (LID2U=Post Project LID Factored Discharge)