Embed Size (px)
Citation preview
1
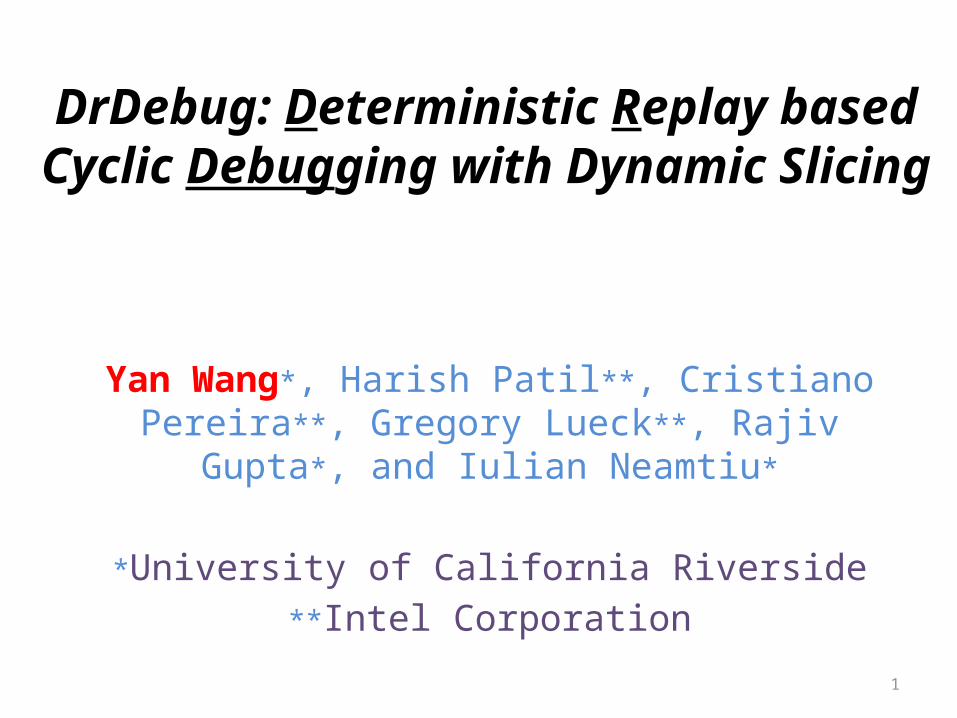
DrDebug: Deterministic Replay based Cyclic Debugging with Dynamic Slicing
Yan Wang*, Harish Patil**, Cristiano Pereira**, Gregory Lueck**, Rajiv Gupta*, and Iulian Neamtiu*
*University of California Riverside
**Intel Corporation
2
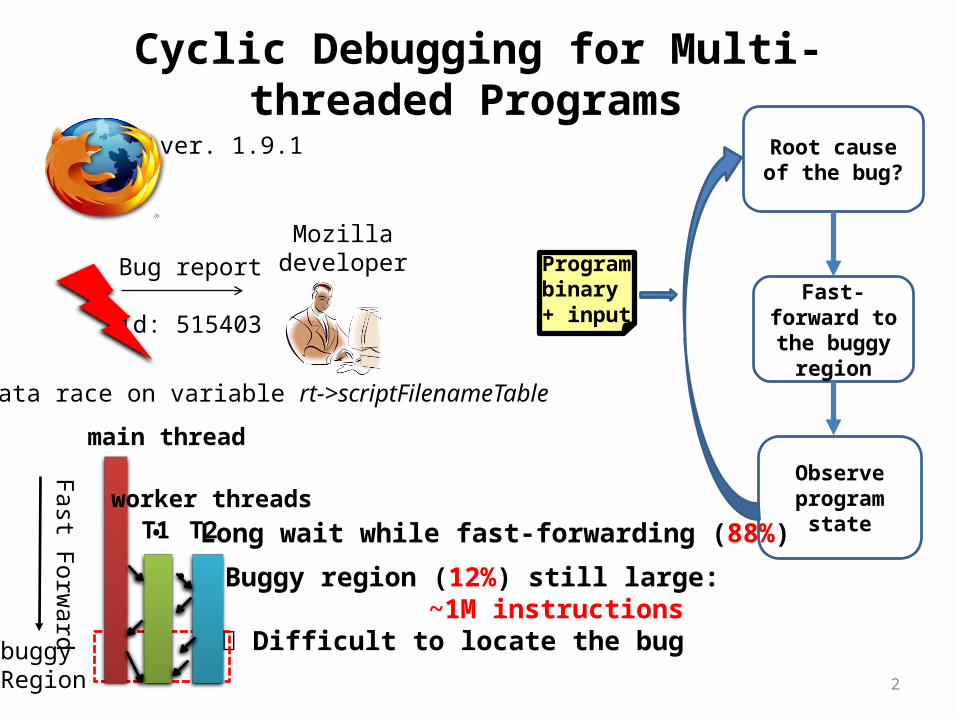
Cyclic Debugging for Multi-threaded Programs
MozilladeveloperBug report
Id: 515403
Observe program state
Fast-forward to the buggy
region
Program binary + input
Root cause of the bug?
ver. 1.9.1
• Buggy region (12%) still large: ~1M instructions Difficult to locate the bug
Data race on variable rt->scriptFilenameTable
Fast Forw
ard
• Long wait while fast-forwarding (88%)
buggyRegion
main thread
T1 T2worker threads
3
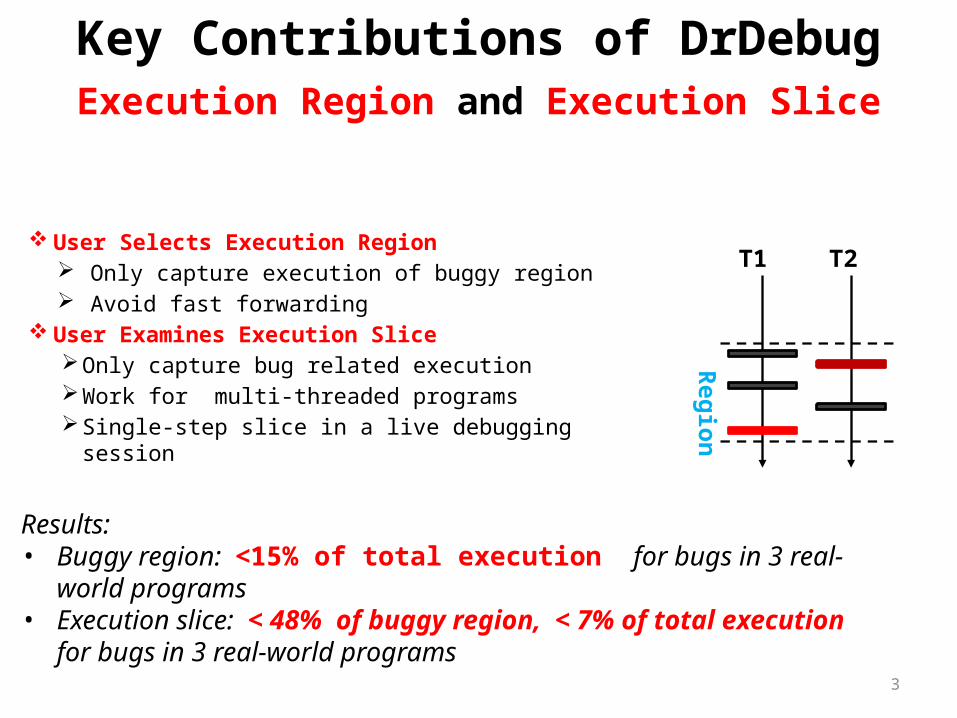
Key Contributions of DrDebug
User Selects Execution Region Only capture execution of buggy region Avoid fast forwarding
User Examines Execution Slice Only capture bug related execution Work for multi-threaded programs Single-step slice in a live debugging session
Execution Region and Execution Slice
Results: • Buggy region: <15% of total execution for bugs in 3 real-world programs• Execution slice: < 48% of buggy region, < 7% of total execution for bugs
in 3 real-world programs
T1 T2Region
4
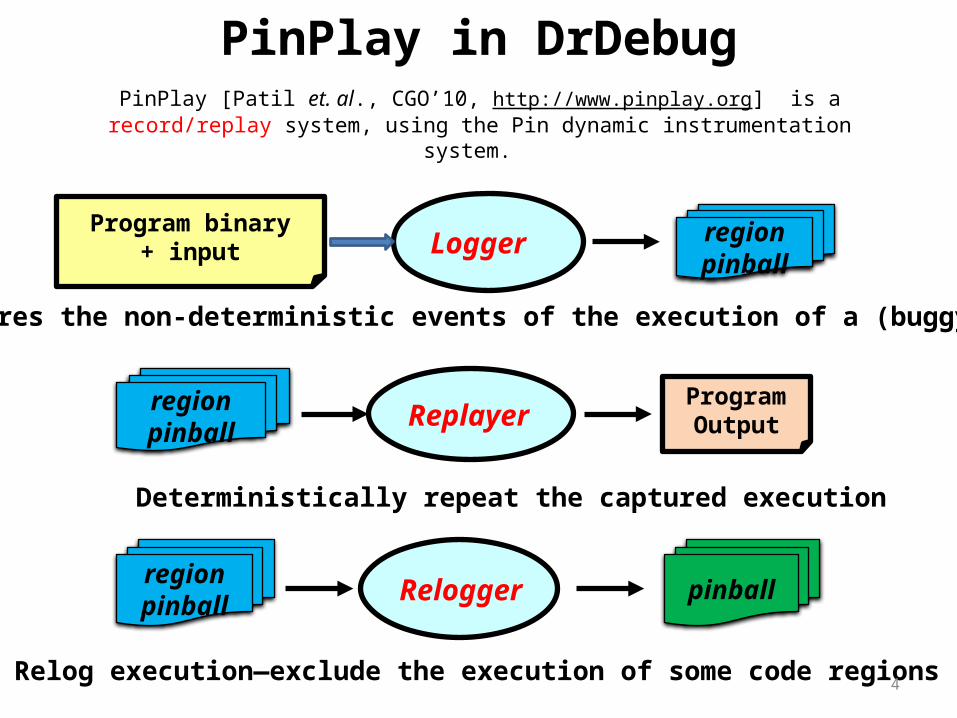
PinPlay in DrDebugPinPlay [Patil et. al., CGO’10, http://www.pinplay.org] is a record/replay
system, using the Pin dynamic instrumentation system.
Logger Program binary
+ inputregionpinball
Captures the non-deterministic events of the execution of a (buggy) region
Replayerregionpinball
Program Output
Deterministically repeat the captured execution
Relogger pinballregionpinball
Relog execution—exclude the execution of some code regions
5
T2T1
Region
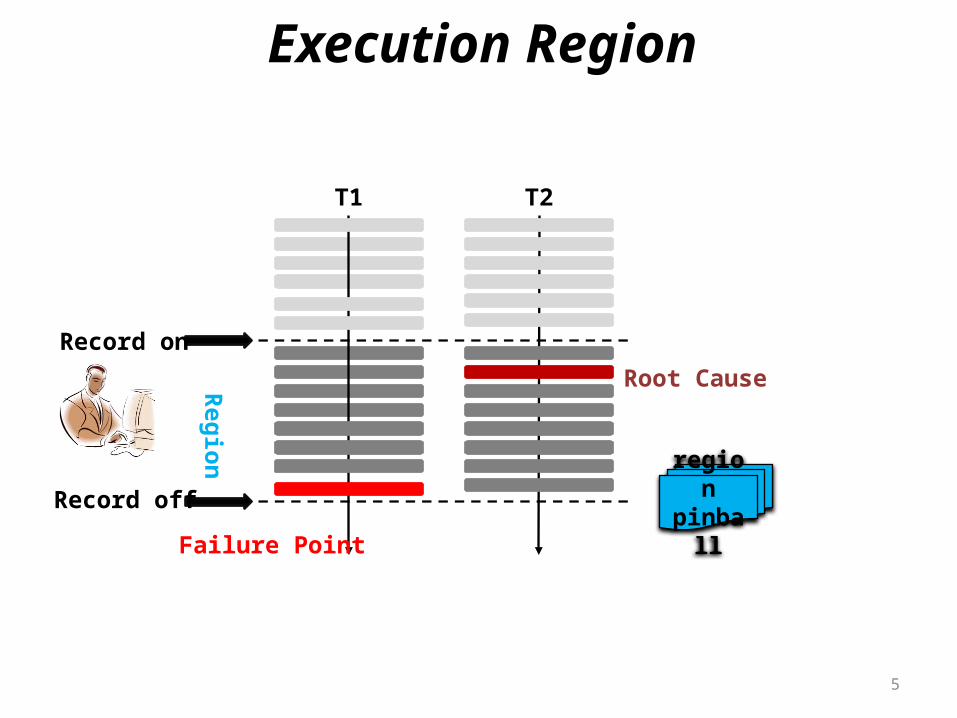
Execution Region
regionpinball
Record on
Record off
Root Cause
Failure Point
6
T1 T2
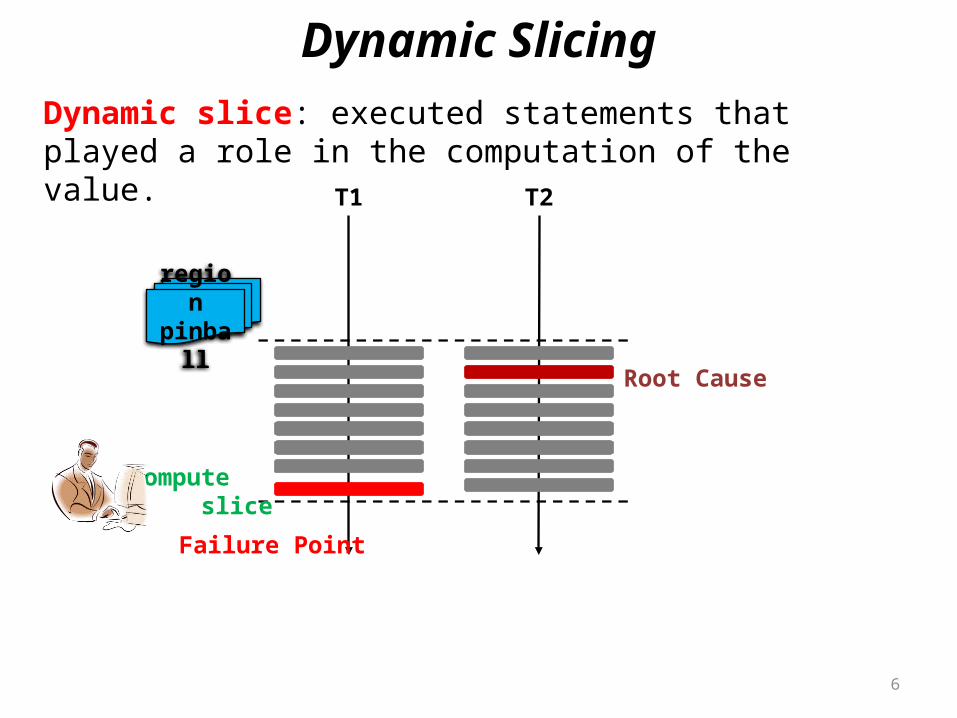
regionpinball
Dynamic SlicingDynamic slice: executed statements that played a role in the computation of the value.
compute slice
Failure Point
Root Cause
7
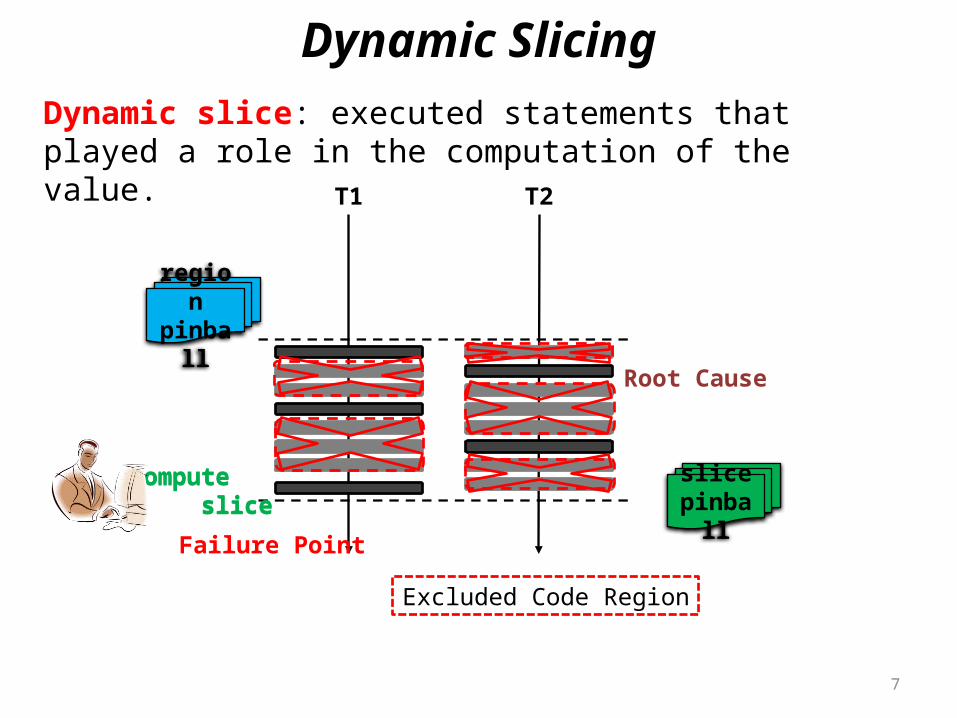
T1 T2
regionpinball
compute slice
slicepinball
Excluded Code Region
Dynamic slice: executed statements that played a role in the computation of the value.
compute slice
Failure Point
Root Cause
Dynamic Slicing
8
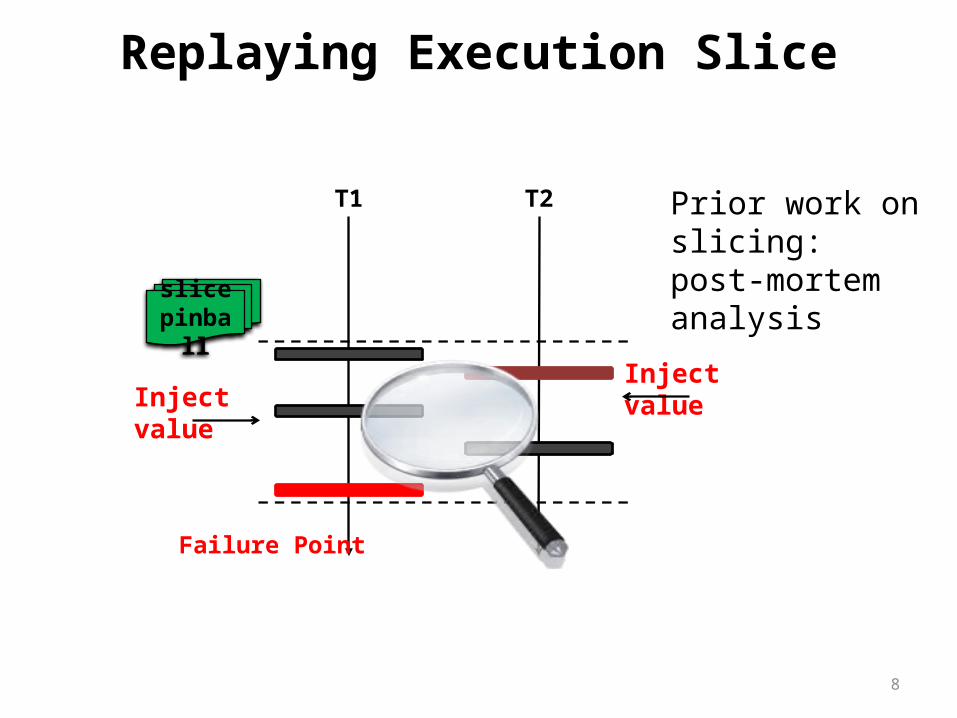
T1 T2
slicepinball
Replaying Execution Slice
Inject valueInject value
Prior work on slicing: post-mortem analysis
Failure Point
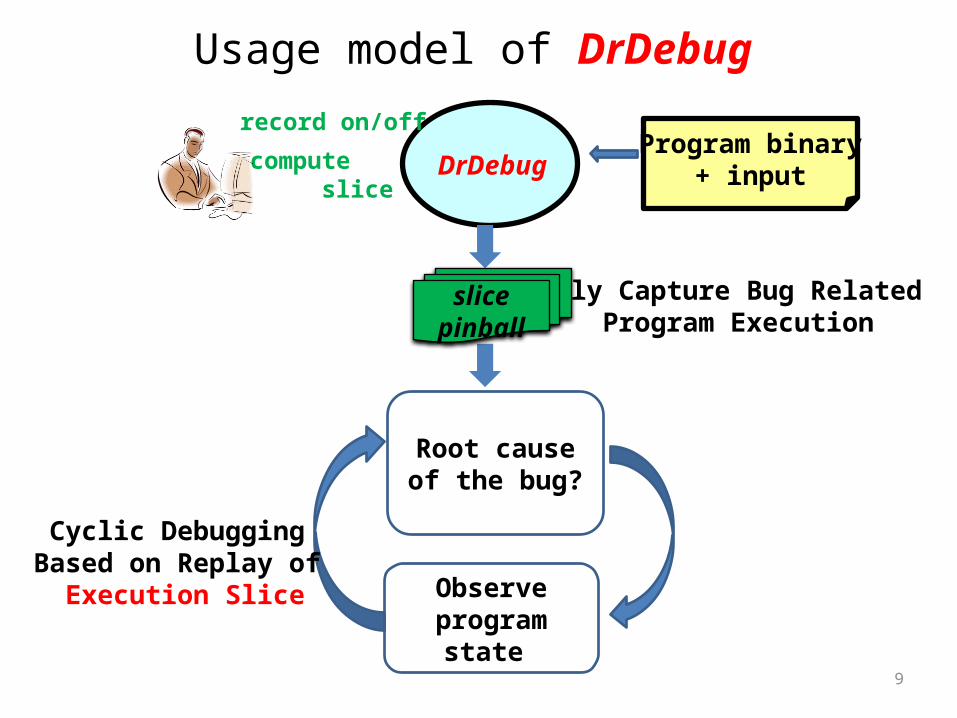
DrDebug Program binary
+ input
Observe program state
Root cause of the bug?
Only Capture Bug Related Program Execution
Usage model of DrDebug
slicepinball
Cyclic Debugging Based on Replay of
Execution Slice
9
compute slice
record on/off
10
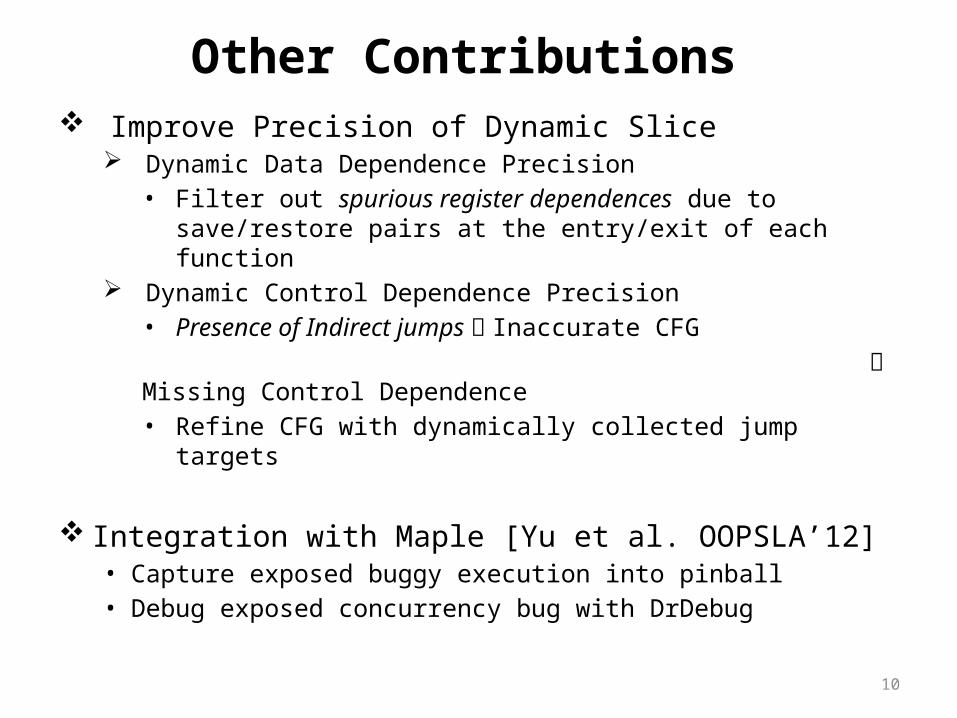
Other Contributions Improve Precision of Dynamic Slice
Dynamic Data Dependence Precision• Filter out spurious register dependences due to save/restore pairs
at the entry/exit of each function Dynamic Control Dependence Precision
• Presence of Indirect jumps Inaccurate CFG
Missing Control Dependence• Refine CFG with dynamically collected jump targets
Integration with Maple [Yu et al. OOPSLA’12]• Capture exposed buggy execution into pinball• Debug exposed concurrency bug with DrDebug
11
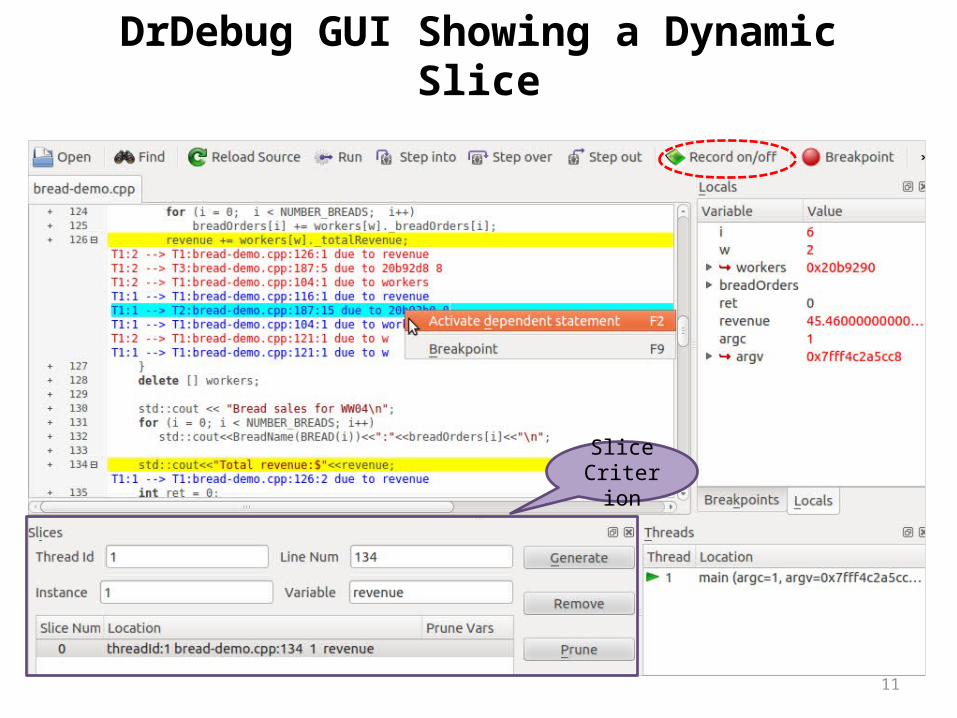
Slice Criterion
DrDebug GUI Showing a Dynamic Slice
12
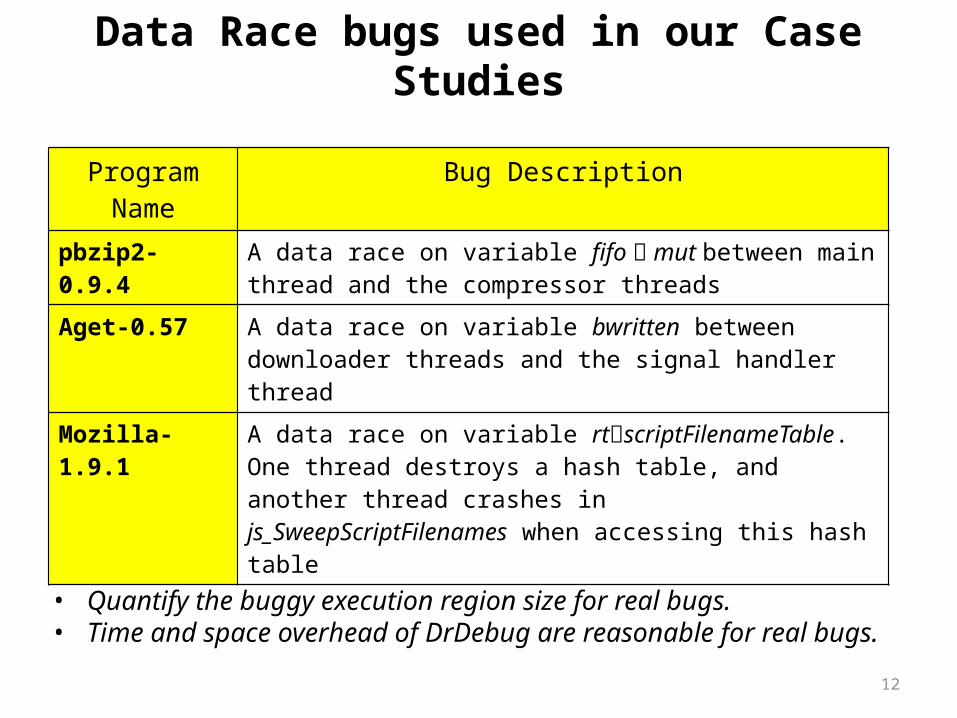
Data Race bugs used in our Case Studies
Program Name Bug Description
pbzip2-0.9.4 A data race on variable fifo mut between main thread and the compressor threads
Aget-0.57 A data race on variable bwritten between downloader threads and the signal handler thread
Mozilla-1.9.1 A data race on variable rtscriptFilenameTable. One thread destroys a hash table, and another thread crashes in js_SweepScriptFilenames when accessing this hash table
• Quantify the buggy execution region size for real bugs.• Time and space overhead of DrDebug are reasonable for real bugs.
13
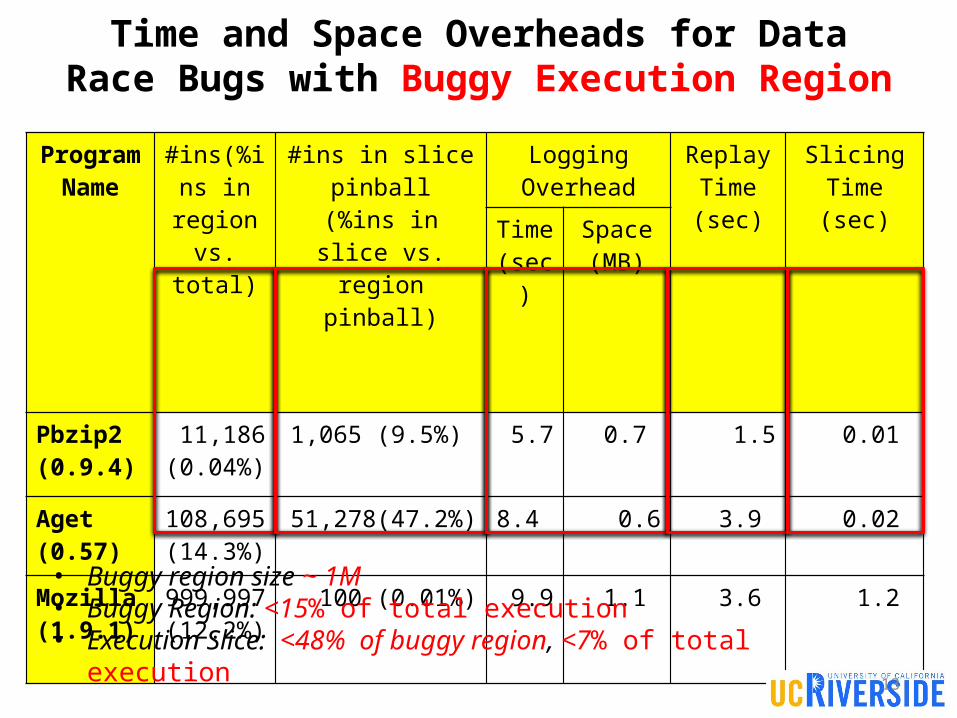
Time and Space Overheads for Data Race Bugs with Buggy Execution Region
Program Name
#ins(%ins in region vs. total)
#ins in slice pinball(%ins in slice vs. region pinball)
Logging Overhead
ReplayTime(sec)
Slicing Time(sec)
Time(sec)
Space(MB)
Pbzip2(0.9.4)
11,186(0.04%)
1,065 (9.5%) 5.7 0.7 1.5 0.01
Aget(0.57)
108,695(14.3%)
51,278(47.2%) 8.4 0.6 3.9 0.02
Mozilla(1.9.1)
999,997(12.2%)
100 (0.01%) 9.9 1.1 3.6 1.2
• Buggy region size ~ 1M • Buggy Region: <15% of total execution • Execution Slice: <48% of buggy region, <7% of total execution
14
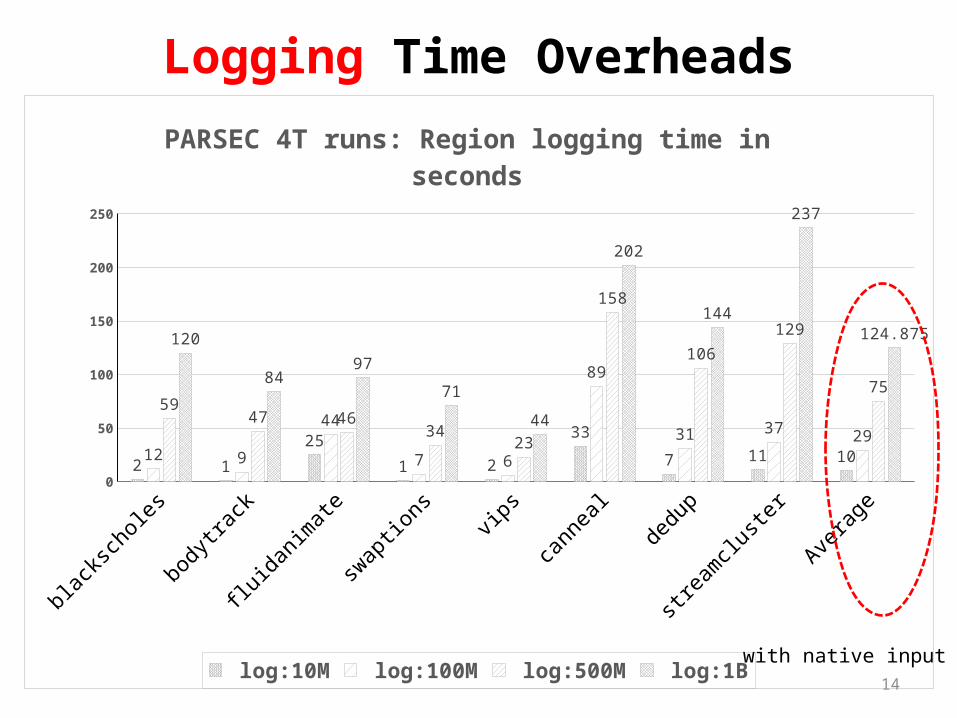
Logging Time Overheads
blacksc
holes
bodytrac
k
fluidanim
ate
swap
tionsvip
s
cannea
l
dedup
strea
mcluste
r
Averag
e0
50
100
150
200
250
2 1
25
1 2
33
7 11 1012 9
44
7 6
89
31 3729
5947 46
3423
158
106
129
75
120
8497
71
44
202
144
237
124.875
PARSEC 4T runs: Region logging time in seconds
log:10M log:100M log:500M log:1Bwith native input
15
Replay Time Overheads
blacksc
holes
bodytrac
k
fluidanim
ate
swap
tionsvip
s
canneal
dedup
stream
cluste
r
Averag
e0
20
40
60
80
100
120
140
160
1 3
16
1 2
34
1218
115 7
29
1 2
105
2835
2719
29
17
4 5
132
83
5243
3744
35
5 8
142
105
6055
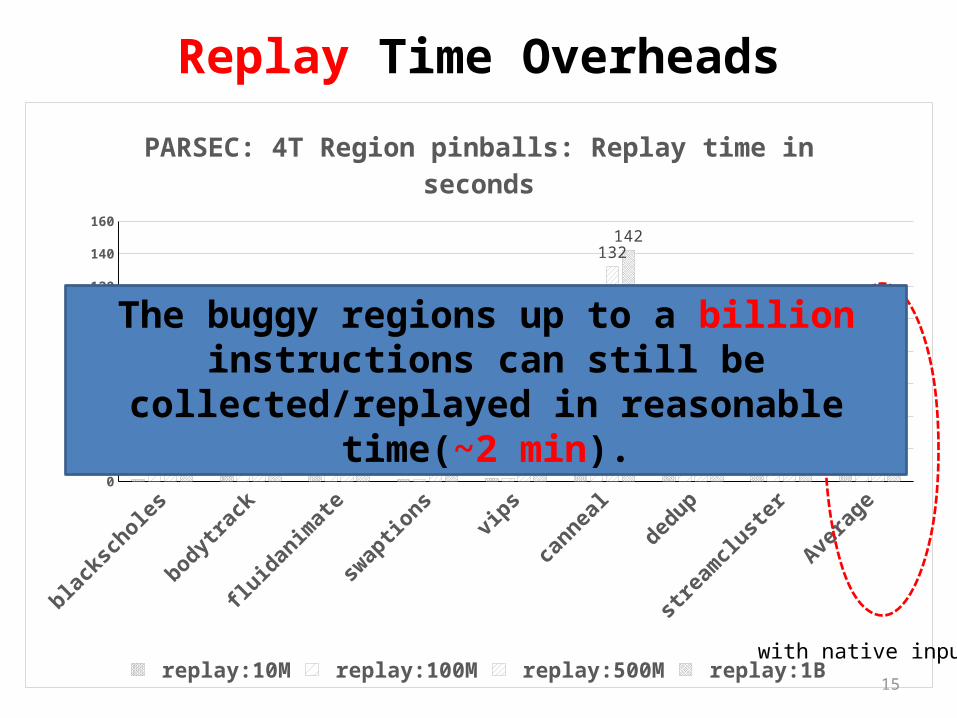
PARSEC: 4T Region pinballs: Replay time in seconds
replay:10M replay:100M replay:500M replay:1Bwith native input
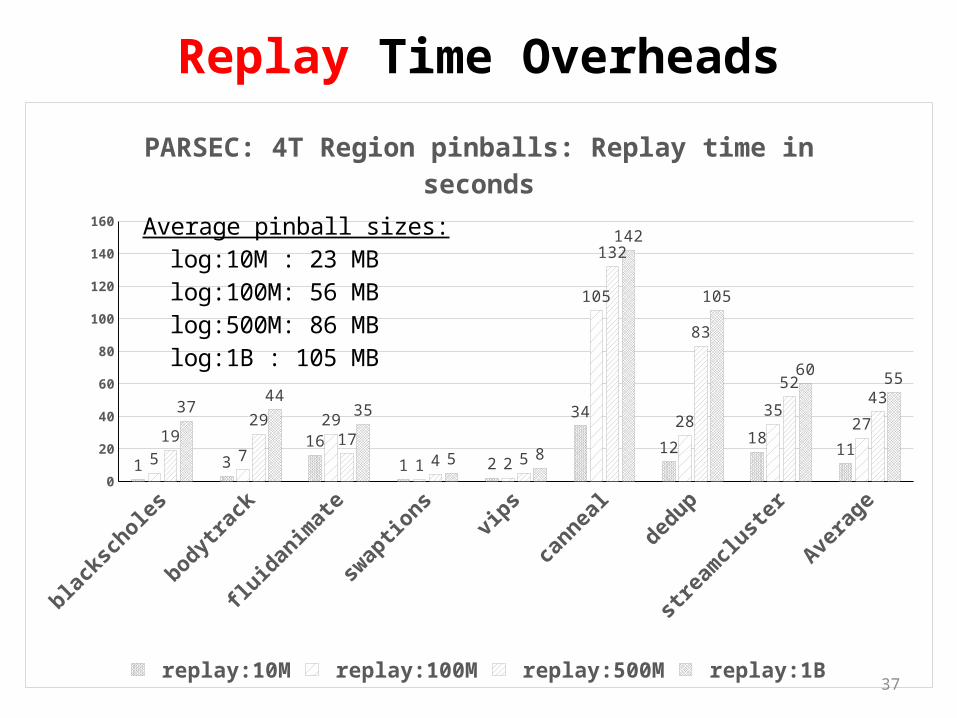
The buggy regions up to a billion instructions can still be collected/replayed in reasonable time(~2 min).
16
Execution Slice: replay time
blacksch
oles
bodytrack
fluidanimate
swaptions
vips
canneal
dedup
streamclu
ster
Avera
ge0.0
1.0
2.0
3.0
4.0
5.0
0.30
2.102.30
0.70
0.30
4.40
3.40
2.101.95
0.19
1.76
0.99
0.36 0.30
4.36
1.23
0.69
1.23
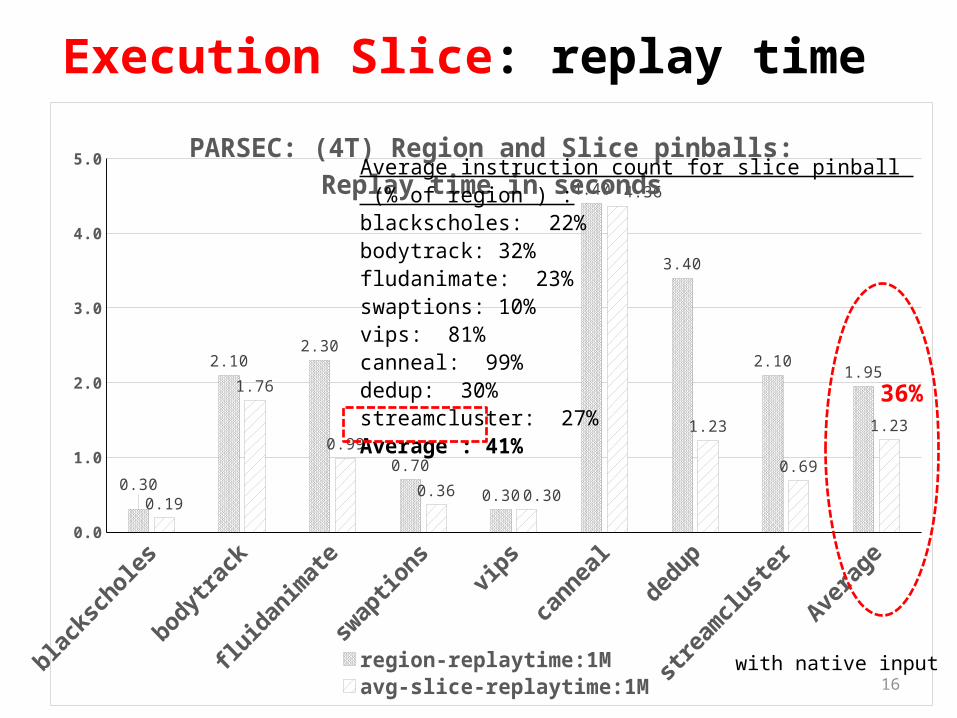
PARSEC: (4T) Region and Slice pinballs: Replay time in seconds
region-replaytime:1M avg-slice-replaytime:1M
Average instruction count for slice pinball (% of region ) :blackscholes: 22%bodytrack: 32%fludanimate: 23%swaptions: 10%vips: 81%canneal: 99%dedup: 30%streamcluster: 27%Average : 41%
with native input
36%
17
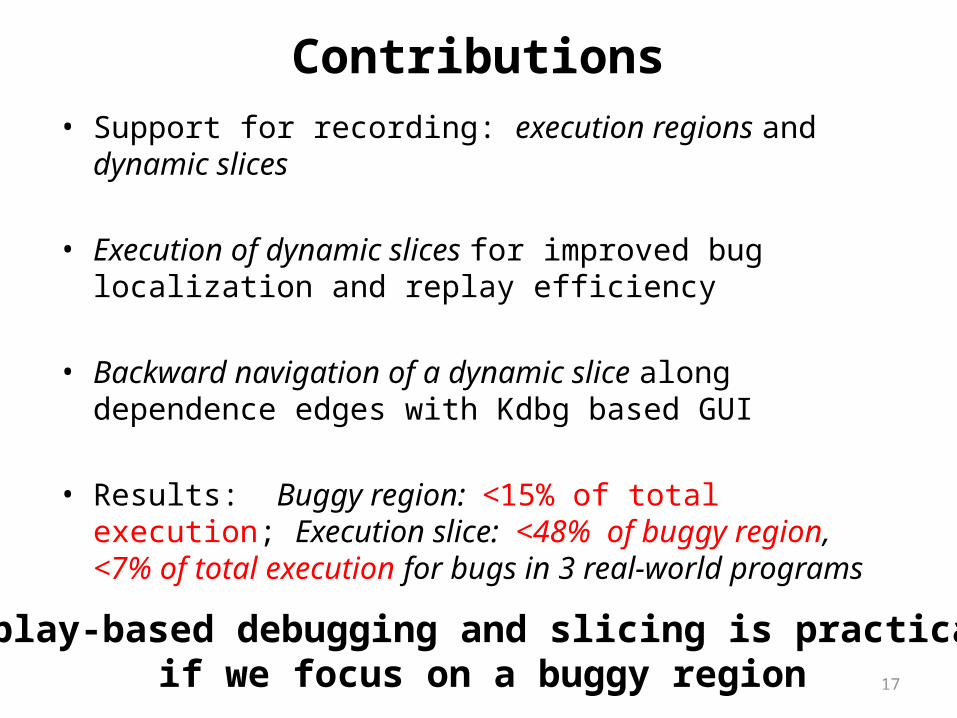
Contributions• Support for recording: execution regions and dynamic slices
• Execution of dynamic slices for improved bug localization and replay efficiency
• Backward navigation of a dynamic slice along dependence edges with Kdbg based GUI
• Results: Buggy region: <15% of total execution; Execution slice: <48% of buggy region, <7% of total execution for bugs in 3 real-world programs
Replay-based debugging and slicing is practical if we focus on a buggy region

18
Q&A?
19
Backup
20
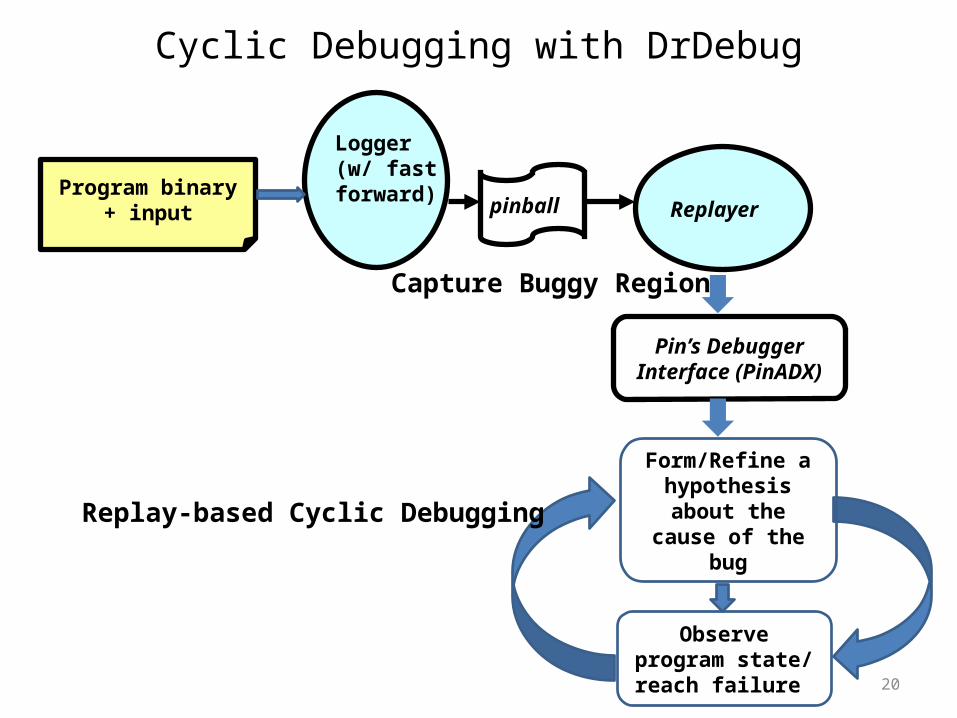
pinball
Logger(w/ fast forward)
Replayer
Pin’s DebuggerInterface (PinADX)
Program binary + input
Observe program state/ reach failure
Form/Refine a hypothesis about
the cause of the bug
Capture Buggy Region
Replay-based Cyclic Debugging
Cyclic Debugging with DrDebug
21
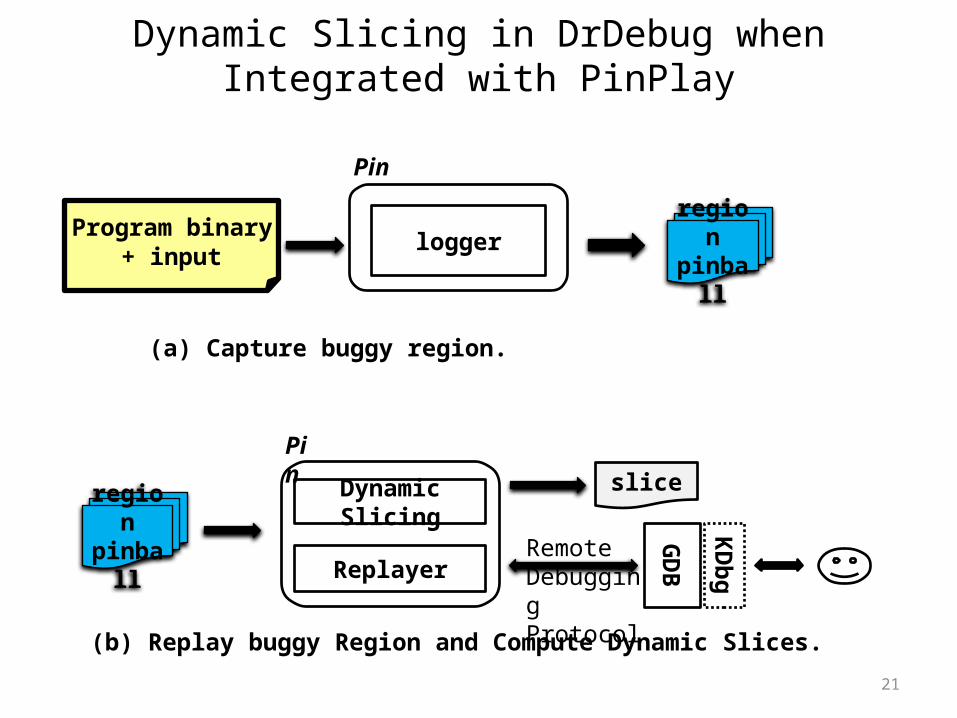
Dynamic Slicing in DrDebug when Integrated with PinPlay
Dynamic Slicing
Pin
ReplayerRemote Debugging Protocol
KDbg
GD
B
regionpinball
slice
(b) Replay buggy Region and Compute Dynamic Slices.
(a) Capture buggy region.
regionpinball
Pin
logger Program binary + input
22
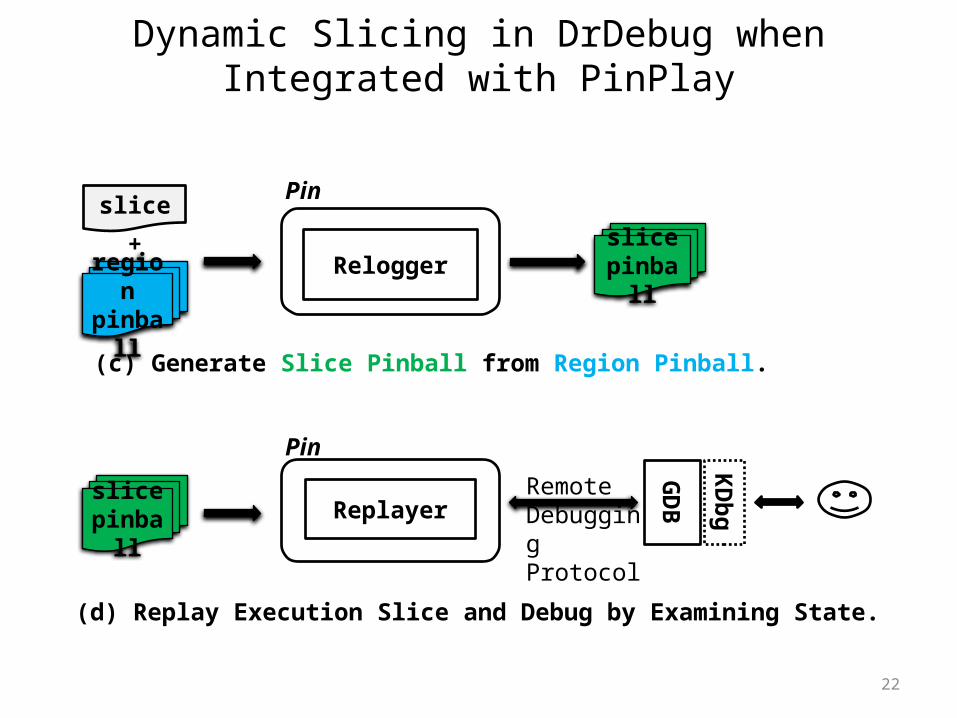
Dynamic Slicing in DrDebug when Integrated with PinPlay
slicepinball
Pin
Relogger
slice
region pinball
+
(c) Generate Slice Pinball from Region Pinball.
Remote Debugging Protocol
KDbg
GD
B
Pin
Replayerslicepinball
(d) Replay Execution Slice and Debug by Examining State.
23
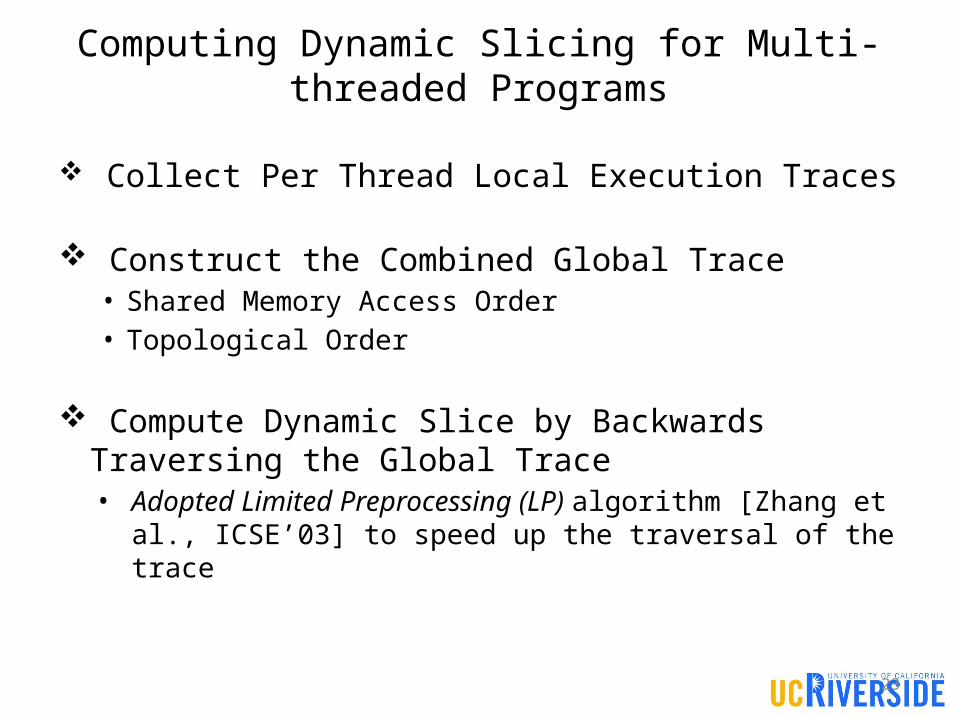
Computing Dynamic Slicing for Multi-threaded Programs
Collect Per Thread Local Execution Traces
Construct the Combined Global Trace• Shared Memory Access Order• Topological Order
Compute Dynamic Slice by Backwards Traversing the Global Trace• Adopted Limited Preprocessing (LP) algorithm [Zhang et
al., ICSE’03] to speed up the traversal of the trace
24
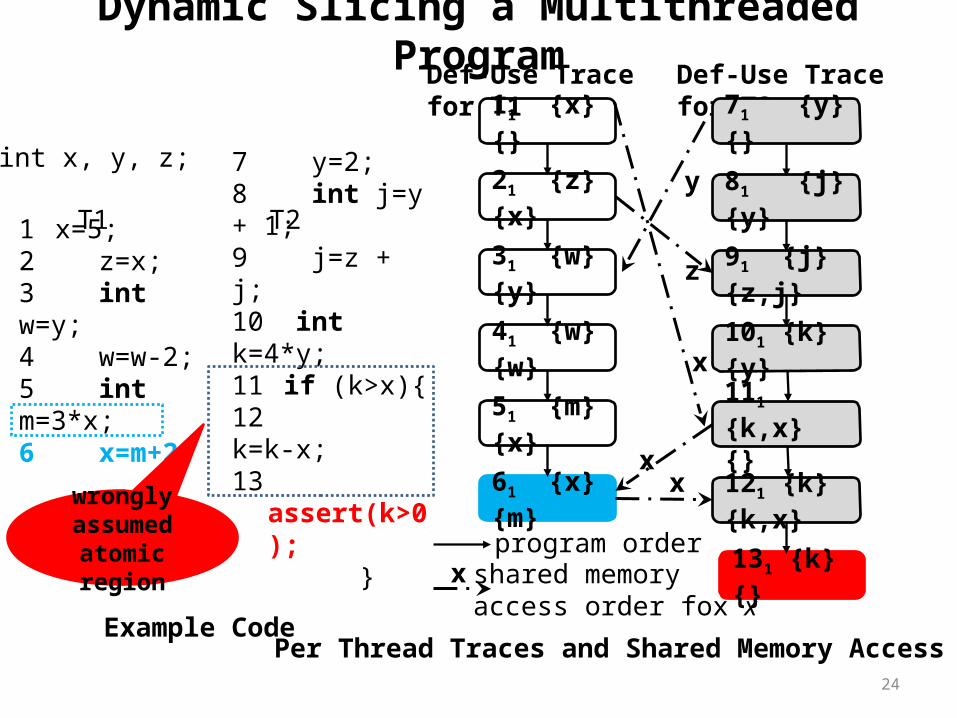
Dynamic Slicing a Multithreaded Program
11 {x} {}
21 {z} {x}
51 {m} {x}
31 {w} {y}
Def-Use Trace for T1
41 {w}{w}
61 {x} {m}
Def-Use Trace for T2
101 {k} {y}
81 {j} {y}
91 {j} {z,j}
111 {k,x} {}
121 {k}{k,x}
131 {k} {}
71 {y} {}
xx
y
x
z
shared memoryaccess order fox x
xprogram order
Per Thread Traces and Shared Memory Access Order
T1 T2
1 x=5; 2 z=x;3 int w=y;4 w=w-2; 5 int m=3*x;6 x=m+2;
7 y=2;8 int j=y + 1;9 j=z + j;10 int k=4*y;11 if (k>x){12 k=k-x;13 assert(k>0); }
Example Code
int x, y, z;
wrongly assumed
atomic region
25
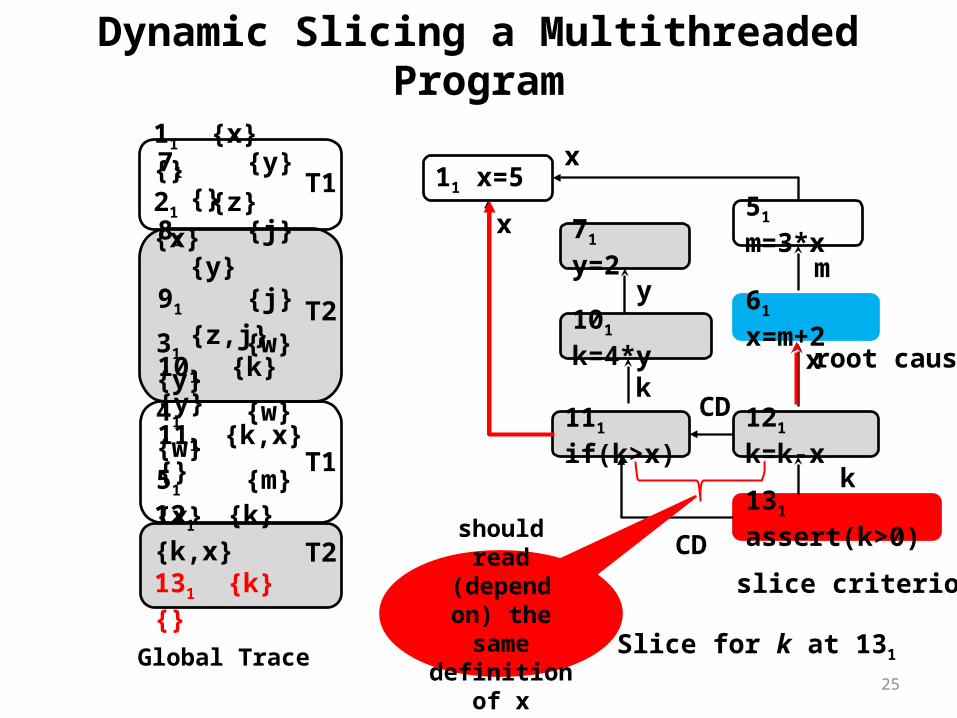
Dynamic Slicing a Multithreaded Program
71 {y} {}81 {j} {y}91 {j} {z,j}101 {k} {y}111 {k,x} {}31 {w} {y}41 {w} {w}51 {m} {x}61 {x} {m}
11 {x} {}21 {z} {x}
121 {k} {k,x}131 {k} {}
T1
T2
T2
T1
Global Trace
51 m=3*x
111 if(k>x) 121 k=k-x
131 assert(k>0)
61 x=m+2
71 y=2
CD
x
k
m
CD
11 x=5
101 k=4*y
x
x
k
y
slice criterion
root cause
Slice for k at 131
should read (depend on)
the same definition of x
26
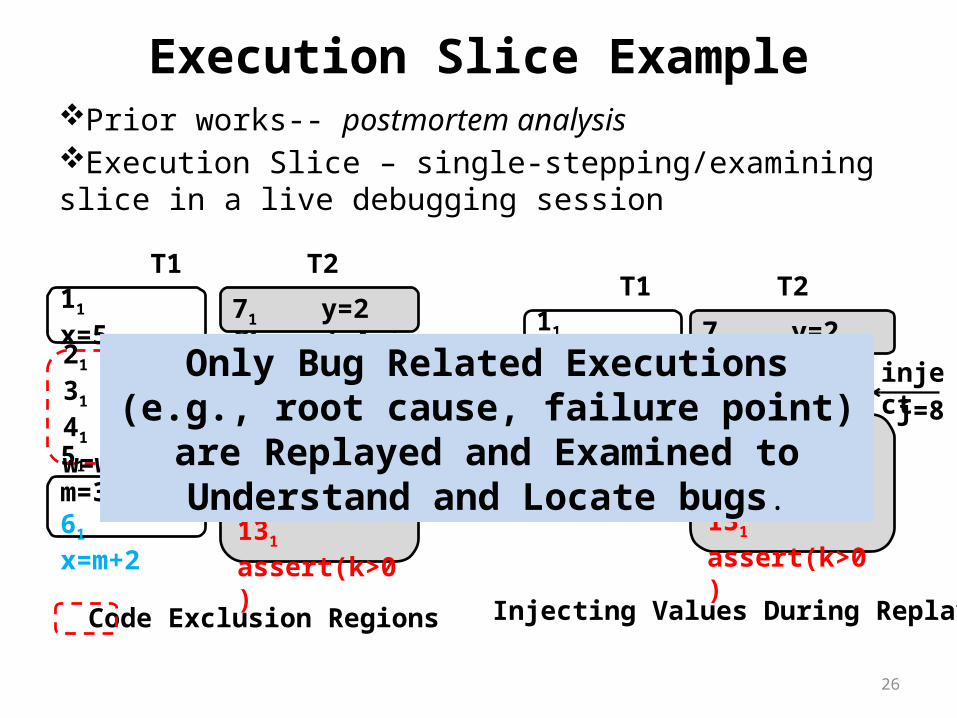
Execution Slice Example
101 k=4*y111 if (k>x)121 k=k-x131 assert(k>0)
T1 T2
51 m=3*x61 x=m+2
11 x=5 71 y=2
injectj=8
z=5w=0
inject
Injecting Values During Replay
81 j=y + 191 j=z + j
101 k=4*y111 if (k>x)121 k=k-x131 assert(k>0)
T1 T2
51 m=3*x61 x=m+2
11 x=5
21 z=x31 w=y41 w=w-2
71 y=2
Code Exclusion Regions
Only Bug Related Executions (e.g., root cause, failure point) are Replayed and Examined to
Understand and Locate bugs.
Prior works-- postmortem analysisExecution Slice – single-stepping/examining slice in a live debugging session
27
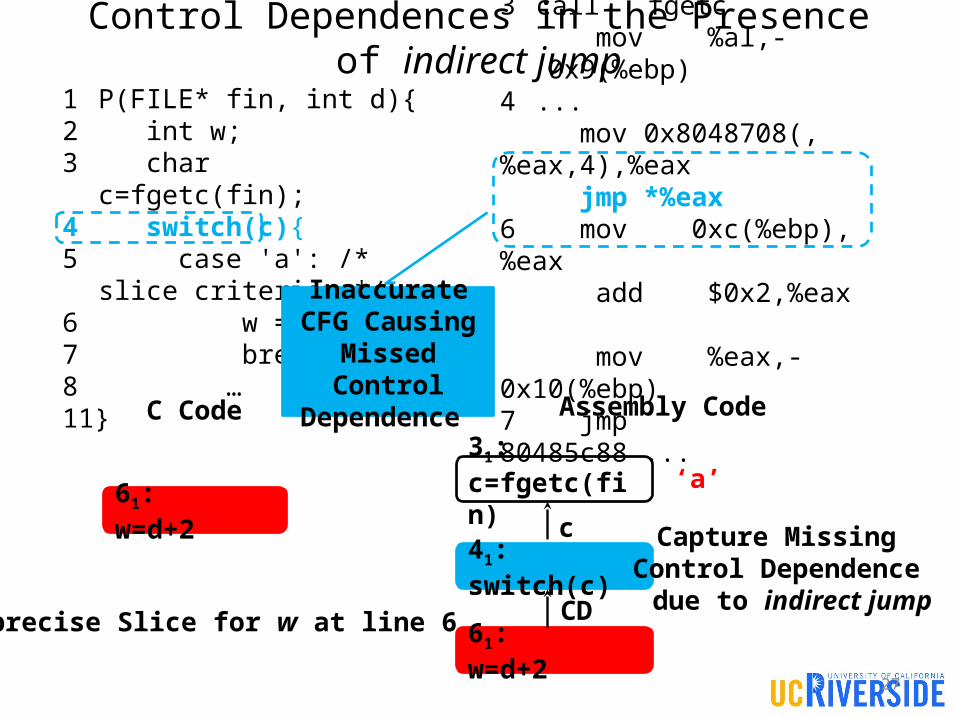
Control Dependences in the Presence of indirect jump
1 P(FILE* fin, int d){2 int w;3 char c=fgetc(fin);4 switch(c){5 case 'a': /* slice criterion */6 w = d + 2;7 break;8 …11}
C Code
3 call fgetc mov %al,- 0x9(%ebp)4 ... mov 0x8048708(,%eax,4),%eax jmp *%eax6 mov 0xc(%ebp),%eax add $0x2,%eax mov %eax,-0x10(%ebp)7 jmp 80485c88 ...
Assembly Code
Inaccurate CFG Causing
Missed Control Dependence
61: w=d+2
Imprecise Slice for w at line 61
31: c=fgetc(fin)
41: switch(c)
61: w=d+2
‘a’
c
CD
Capture Missing Control Dependence due to indirect jump
28
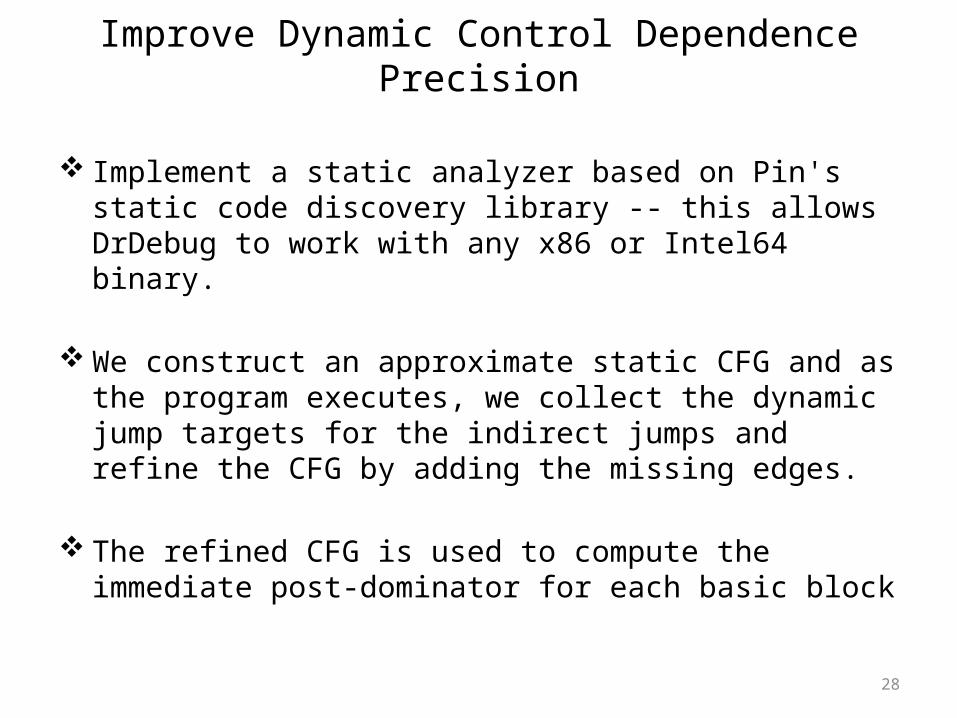
Improve Dynamic Control Dependence Precision
Implement a static analyzer based on Pin's static code discovery library -- this allows DrDebug to work with any x86 or Intel64 binary.
We construct an approximate static CFG and as the program executes, we collect the dynamic jump targets for the indirect jumps and refine the CFG by adding the missing edges.
The refined CFG is used to compute the immediate post-dominator for each basic block
29
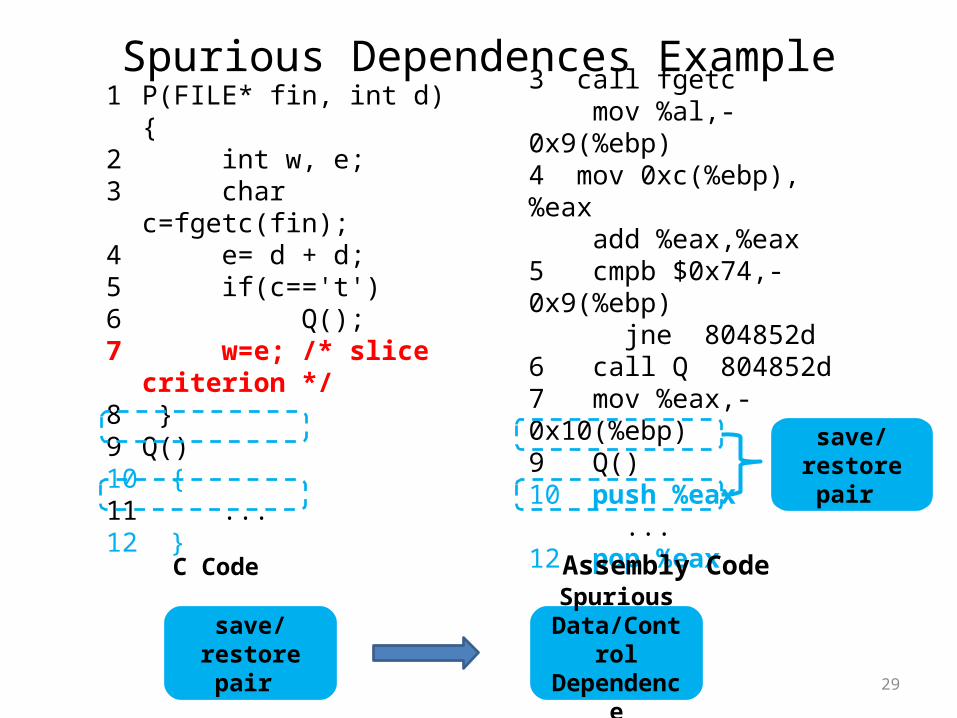
Spurious Dependences Example
1 P(FILE* fin, int d){2 int w, e;3 char c=fgetc(fin);4 e= d + d;5 if(c=='t')6 Q();7 w=e; /* slice criterion */8 }9 Q()10 {11 ...12 }
C Code
3 call fgetc mov %al,-0x9(%ebp)4 mov 0xc(%ebp),%eax add %eax,%eax5 cmpb $0x74,-0x9(%ebp) jne 804852d6 call Q 804852d7 mov %eax,-0x10(%ebp)9 Q()10 push %eax ...12 pop %eax
Assembly Code
save/restore pair
save/restore pair
Spurious Data/Control Dependence
30
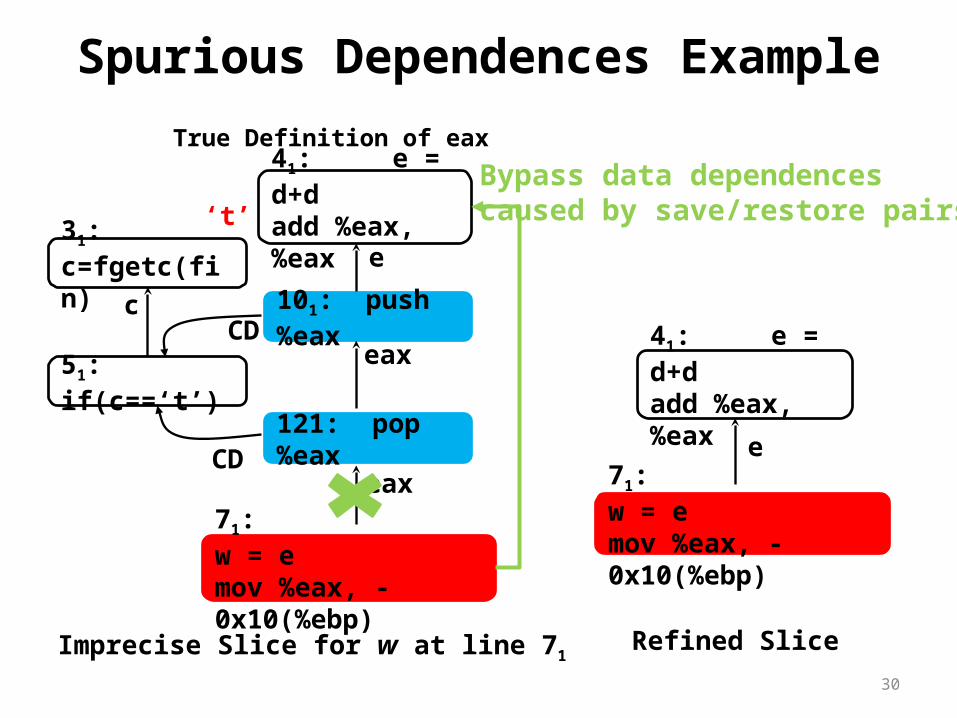
Spurious Dependences Example
71: w = emov %eax, -0x10(%ebp)
41: e = d+dadd %eax, %eax
e
Refined Slice
31: c=fgetc(fin)
51: if(c==‘t’)
121: pop %eax
‘t’
c
71: w = emov %eax, -0x10(%ebp)
101: push %eax
41: e = d+dadd %eax, %eax
CD
CDeax
eax
e
Imprecise Slice for w at line 71
Bypass data dependences caused by save/restore pairs
True Definition of eax
31
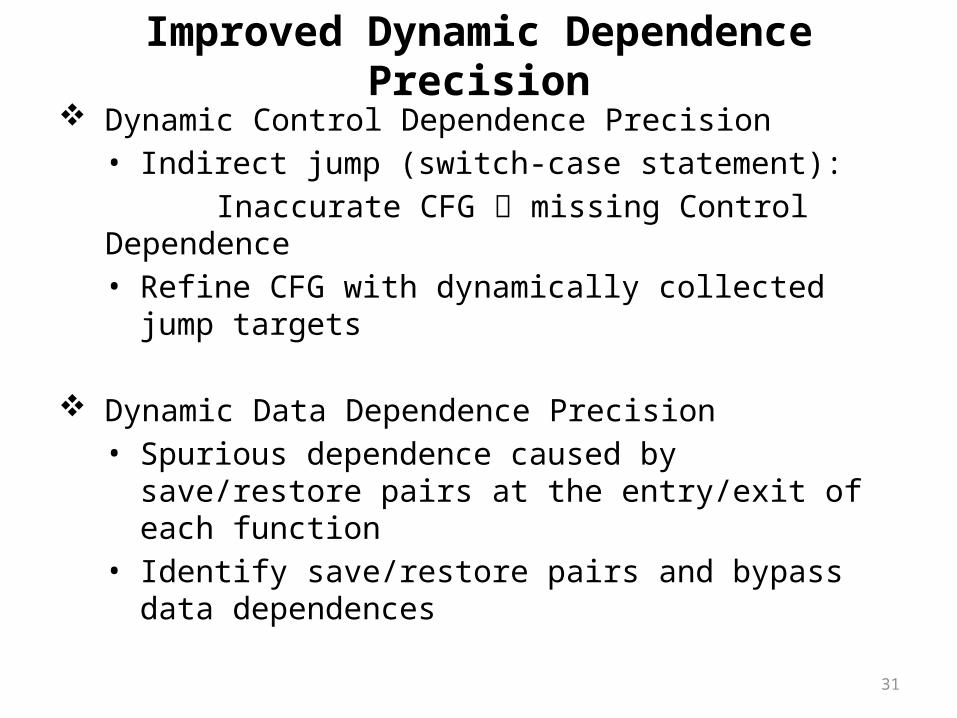
Improved Dynamic Dependence Precision Dynamic Control Dependence Precision• Indirect jump (switch-case statement):
Inaccurate CFG missing Control Dependence• Refine CFG with dynamically collected jump targets
Dynamic Data Dependence Precision• Spurious dependence caused by save/restore pairs at the
entry/exit of each function• Identify save/restore pairs and bypass data dependences
32
Integration with Maple
Maple [Yu et al. OOPSLA’12] is a thread interleaving coverage-driven testing tool. Maple exposes untested thread interleaving as much as possible.
We changed Maple to optionally do PinPlay-based logging of the buggy execution it exposes.
We have successfully recorded multiple buggy executions and replayed them using DrDebug.
33
Slicing Time Overhead
10 slices for the last 10 different read instructions, spread across five threads, for region length 1M (main thread)
Average dynamic information tracing time: 51 seconds
Average size of slice: 218K dynamic instructions
Average slicing time: 585 seconds
34
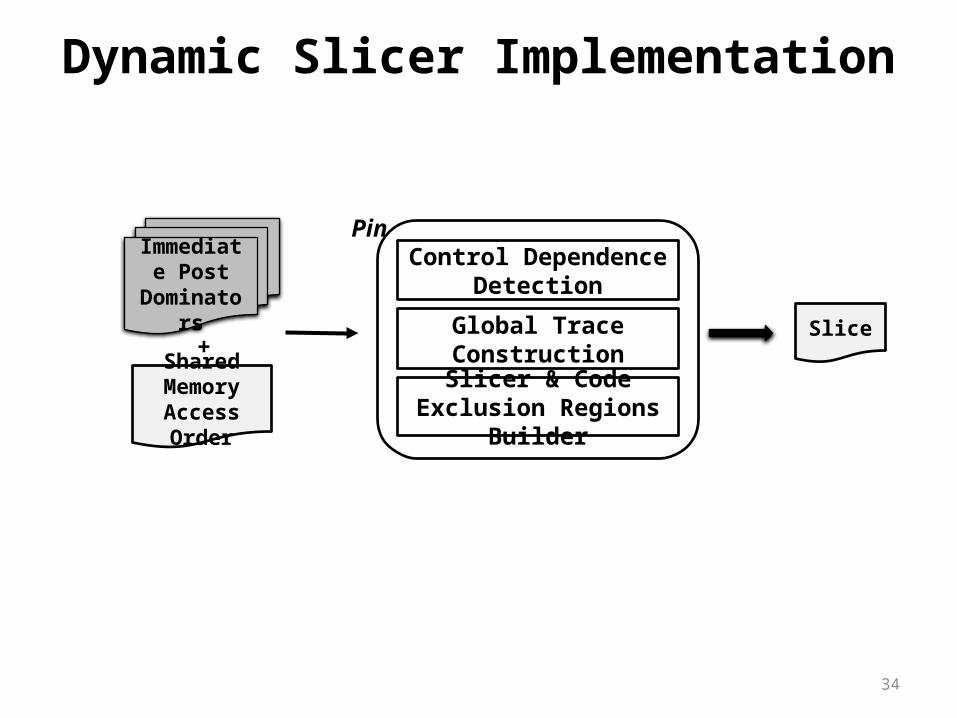
Dynamic Slicer Implementation
Slice
Control Dependence Detection
Global Trace Construction
Slicer & Code Exclusion Regions Builder
PinImmediate
Post Dominators
Shared Memory
Access Order
+
35
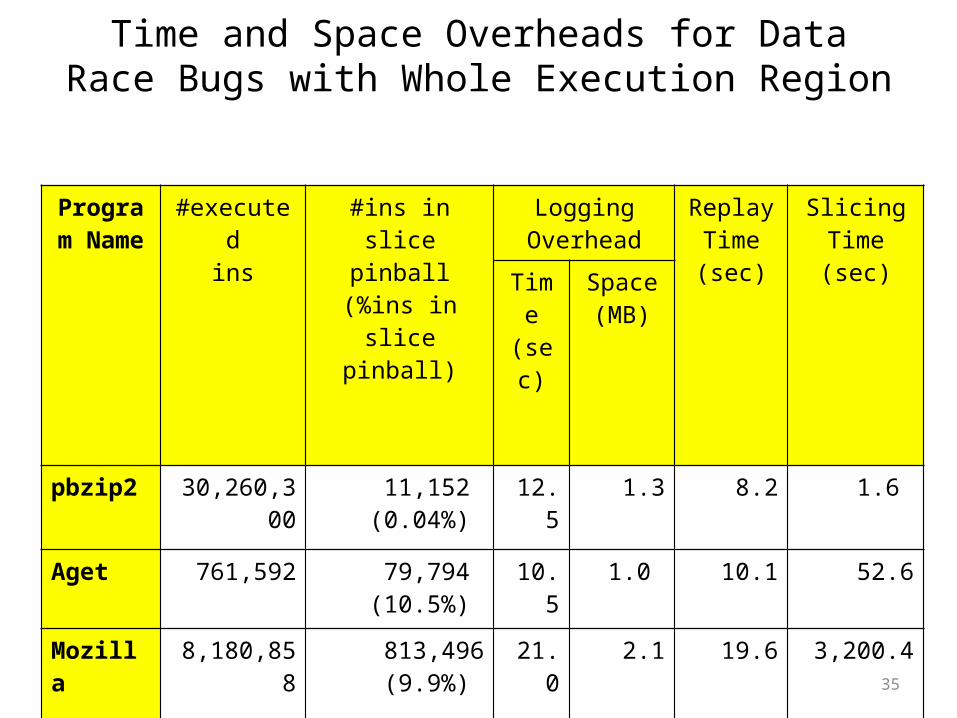
Time and Space Overheads for Data Race Bugs with Whole Execution Region
Program Name
#executedins
#ins in slice pinball
(%ins in slice pinball)
Logging Overhead
ReplayTime(sec)
Slicing Time(sec)
Time(sec)
Space(MB)
pbzip2 30,260,300 11,152 (0.04%) 12.5 1.3 8.2 1.6
Aget 761,592 79,794 (10.5%) 10.5 1.0 10.1 52.6
Mozilla 8,180,858 813,496 (9.9%) 21.0 2.1 19.6 3,200.4
36
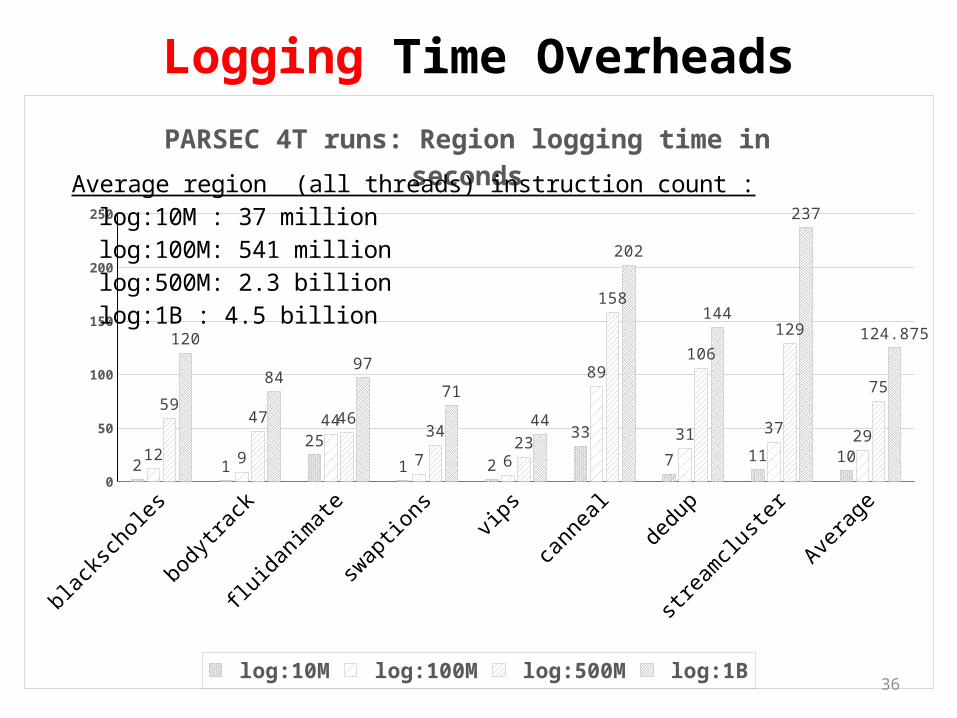
Logging Time Overheads
blacksc
holes
bodytrac
k
fluidanim
ate
swap
tionsvip
s
cannea
l
dedup
strea
mcluste
r
Averag
e0
50
100
150
200
250
2 1
25
1 2
33
7 11 1012 9
44
7 6
89
31 3729
5947 46
3423
158
106
129
75
120
8497
71
44
202
144
237
124.875
PARSEC 4T runs: Region logging time in seconds
log:10M log:100M log:500M log:1B
Average region (all threads) instruction count :log:10M : 37 millionlog:100M: 541 millionlog:500M: 2.3 billionlog:1B : 4.5 billion
37
Replay Time Overheads
blacksc
holes
bodytrac
k
fluidanim
ate
swap
tionsvip
s
canneal
dedup
stream
cluste
r
Averag
e0
20
40
60
80
100
120
140
160
1 3
16
1 2
34
1218
115 7
29
1 2
105
2835
2719
29
17
4 5
132
83
5243
3744
35
5 8
142
105
6055
PARSEC: 4T Region pinballs: Replay time in seconds
replay:10M replay:100M replay:500M replay:1B
Average pinball sizes:log:10M : 23 MBlog:100M: 56 MBlog:500M: 86 MBlog:1B : 105 MB
38
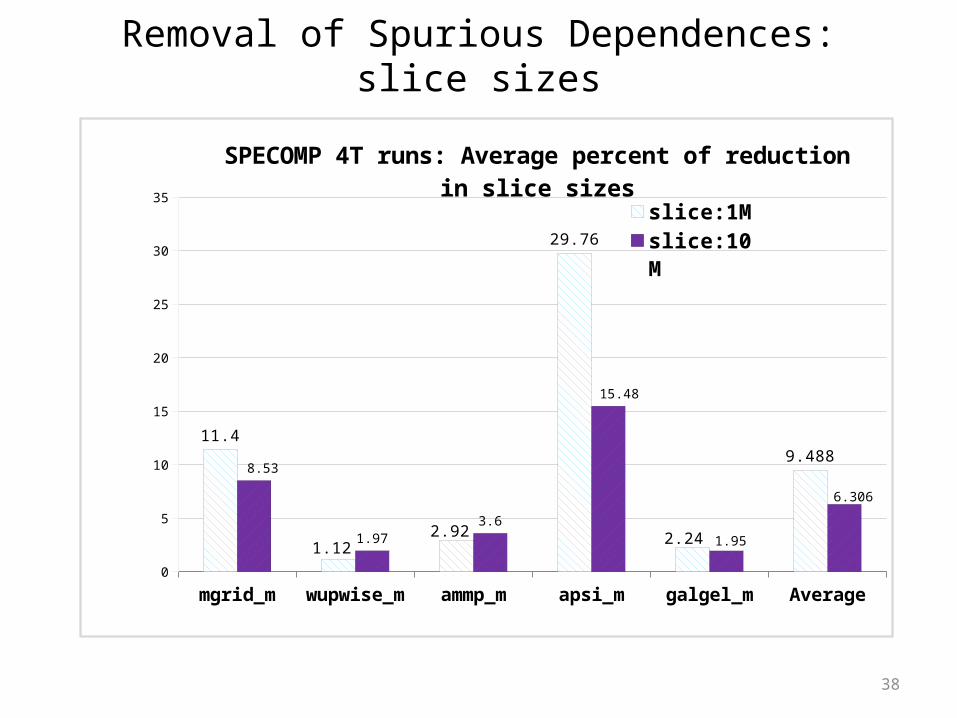
Removal of Spurious Dependences: slice sizes
mgrid_m wupwise_m ammp_m apsi_m galgel_m Average0
5
10
15
20
25
30
35
11.4
1.122.92
29.76
2.24
9.4888.53
1.973.6
15.48
1.95
6.306
SPECOMP 4T runs: Average percent of reduction in slice sizes
slice:1M
slice:10M