Embed Size (px)
Citation preview
.-------------------- - -
3 ,o. 2./1//,,/ /'/yF <':;/,c' ,
Dredge Pump Research
GAS REMOVAL SYSTEMPART III: MODEL STUDY
byJ~ B.· HerbichJ. R. Adams
S.C.Ko
Fritz Engineering Laboratory Report No. 310.21
CIVIL ENGINEERING DEPATMENTFRITZ ENGINEERING LABORATORY
HYDRAULICS AND SANITARY ENGINEERING DIVISION
GAS REMOVAL SYSTEM
PART III
MODEL STUDY
Project Report No. 53
Prepared by
J. B. Herbich
J. R. Adams
s. C. Ko
Prepared for
U. S. Army Engineer District, Philadelphia
Corps of Engineers
Philadelphia, Pennsylvania
February 1969
Fritz Engineering Laboratory Report No. 310.21
ABSTRACT
The results at Test Series No~ 1 and No.2, Phase C, of the
study of gas removal systems for dredge pumps are presented. In ad
dition, a brief study of the effect of gas injection methods is dis
cussed o
Test Series No. 1 resulted in development of a criterion
for the gas flow which can be tolerated in dredging. The effect of
continuous gas flow on dredging performance was determined.
Test Series No.2 indicated that the existing gas removal
system is not effective when continuous gas flow is encountered.
Control of accumulator vacuum was found to be difficult.
The air injection studies showed that the behavior of the
gas flow is an important factor. Intermittent air slugs were partial
ly removed, and generally caused only a momentary decrease in pump
performance.
i
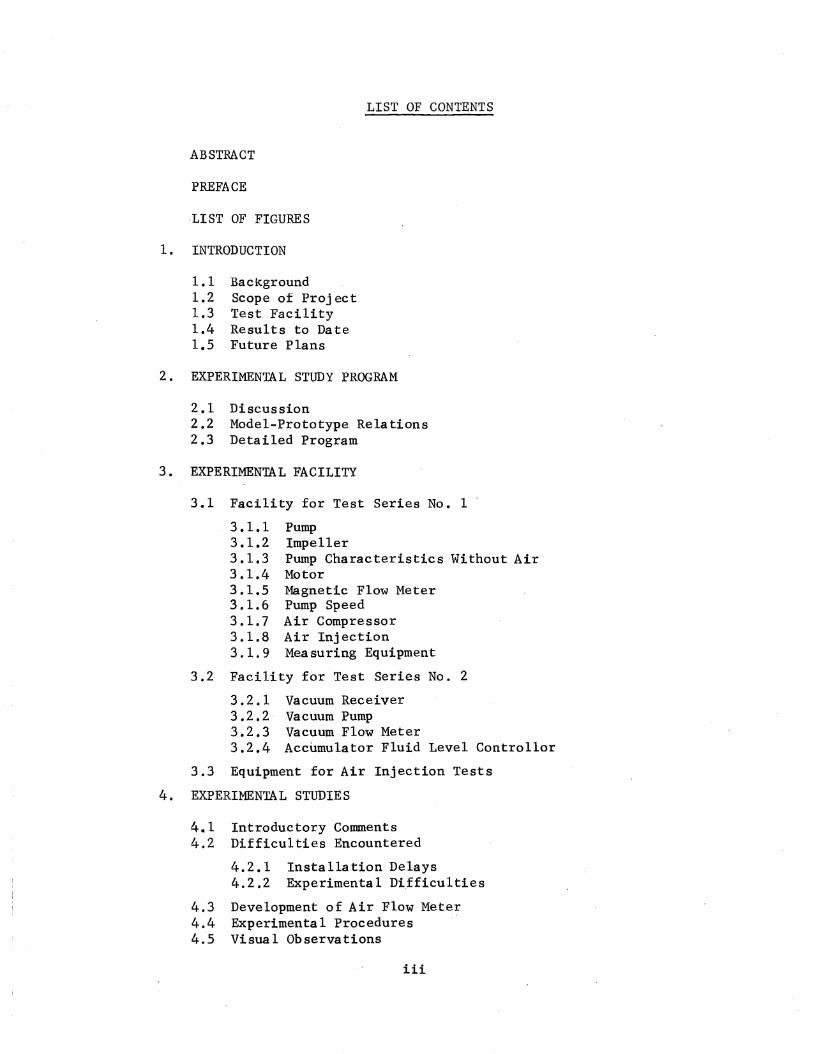
PREFACE
The following project report summarizes the studies performed
as part ot Phase ,C of the project between February 1965 and October 1967.
The project is being conducted in the Hydraulic and Sanitary Engineering
Division of Fritz Engineering Laboratory, Department of Civil Engineer
ing, Lehigh University, in accordance with Contract No. DA-36-109
CIVENG-64-72 for the Marine Design Division, Philadelphia District; U. S.
Army Corps of Engineers. Progress on this phase of the project has been
reported in eleven status reports dated June 1965, August 1965, August
1966, October 1966, December 1966, April 1967, and September 1967.
Phases A and B of the project were completed and summarized in
Fritz Engineering Laboratory Report Nos. 310.3 (June 1964) and 310.7
(February 1965) respectively.
Dr. John R. Adams is the Project Director, and he is assisted
by Mr. So C. Ko, Research Instructor. Dr. John B. Herbich was Project
Director prior to February 1967. Dr. Adnan Shindala, Mr. A. N. Amatange10,
Mr. G. Bagge, and Mr. R. E. Miller assisted in portions of the program.
Dr. D. A. VanHorn is Chairman of the Civil Engineering Department and
Dr. L. S. Beedle is Director of Fritz Engineering Laboratory.
ii
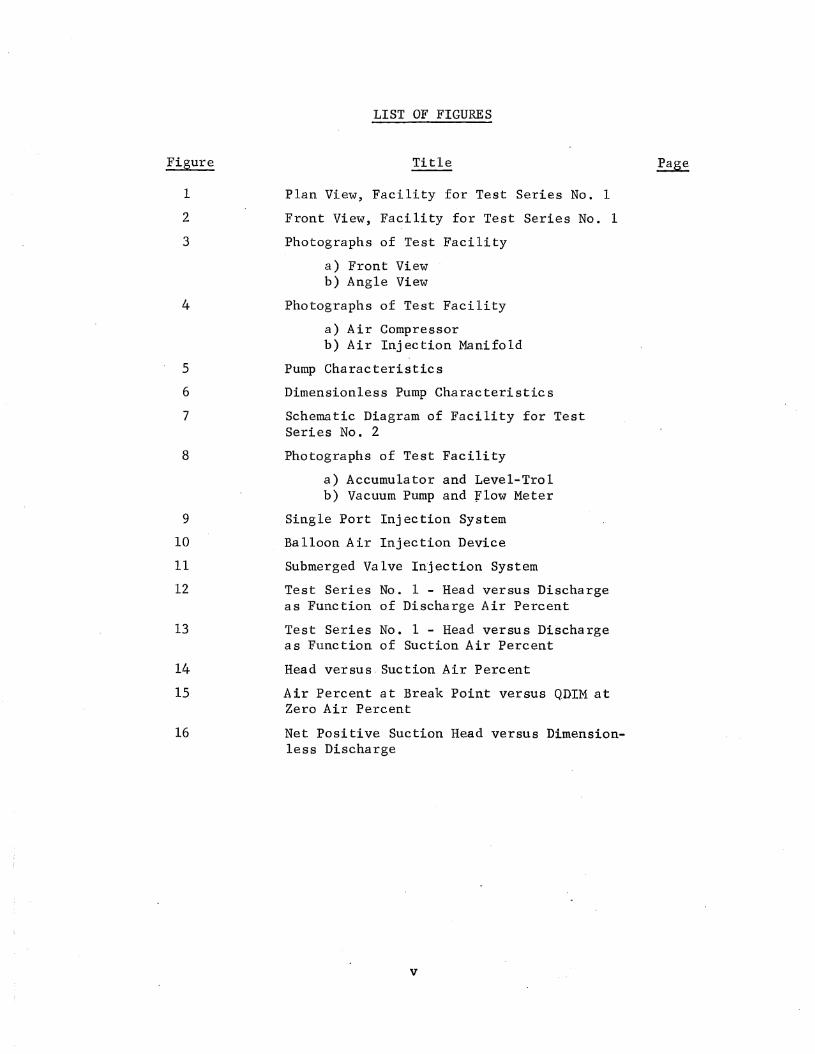
LIST OF CONTENTS
ABSTRACT
PREFACE
.LI 8T OF FIGURE 8
1. INTRODUCTION
1.1 Background1.2 Scope of Project1.3 Test Facility1.4 Results to Date1.5 Future Plans
2. EXPERIMENTAL STUDY PROGRAM
2.1 Discussion2.2 Model-Prototype Relations2.3 Detailed Program
3. EXPERIMENTAL FACILITY
3.1 Facility for Test Series No.1'
3.1.1 Pump3.1.2 Impeller3.1.3 Pump Characteristics Without Air3.1.4 Motor3.1.5 Magnetic Flow Meter3.1.6 Pump Speed3.1.7 Air Compressor3.1.8 Air Injection3.1.9 Measuring Equipment
3.2 Facility for Test Series No.2
3.2.1 Vacuum Receiver3.2.2 Vacuum Pump3.2.3 Vacuum Flow Meter3.2.4 Accumulator Fluid Level Control1or
3.3 Equipment for Air Injection Tests
4 . EXPERlMENTA L STUDIE S
4.1 Introductory Comments4.2 Difficulties Encountered
4.2.1 Installation Delays4.2.2 Experimental Di,fficulties
4.3 Development of Air Flow Meter4.4 Experimental Procedures '4.5 Visual Observations
iii

5. EXPERIMENTAL RESULTS
5.1 Data Analysis5.2 Test Series No.15.3 Test Series No.25.4 Air Injection Tests
6. CONCLUSIONS
6.1 Genera 16.2 Future
FIGURES
APPENDIX A
APPENDIX B
REFERENCES
iv
Figure
1
2
3
4
5
6
7
8
9
10
11
12
13
14
15
16
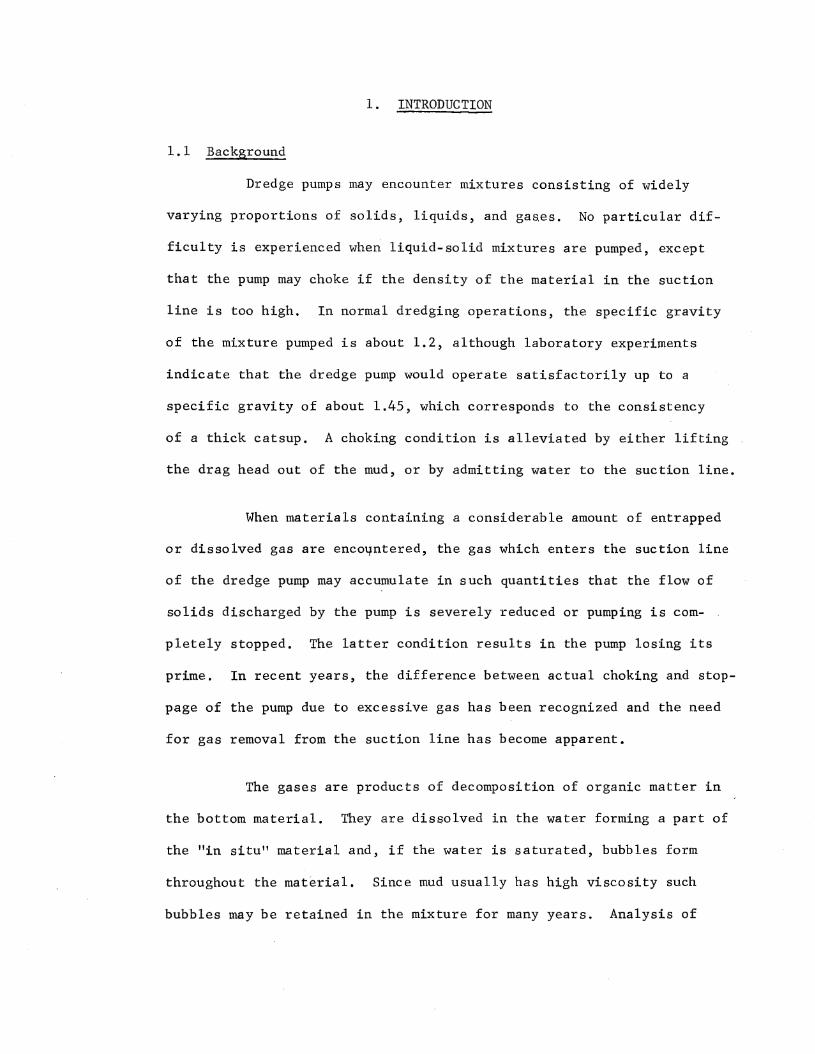
LIST OF FIGURES
Title
Plan View, Facility for Test Series No. 1
Front View, Facility for Test Series No. 1
Photographs of Test Facility
a) Front Viewb) Angle View
Photographs of Test Facility
a) Air Compressorb) Air Injection Manifold
Pump Characteristics
Dimensionless Pump Characteristics
Schematic Diagram of Facility for TestSeries No.2
Photographs of Test Facility
a) Accumulator and Level-Trolb) Vacuum Pump and flow Meter
Single Port Injection System
Balloon Air Injection Device
Submerged Valve Injection System
Test Series No. 1 - Head versus Dischargeas Function of Discharge Air Percent
Test Series No. 1 - Head versus Dischargeas Function of Suction Air Percent
Head versus. Suction Air Percent
Air Percent at Break Point versus QDIM atZero Air Percent
Net Positive Suction Head versus Dimensionless Discharge
v
1. INTRODUCTION
1.1 Background
Dredge pumps may encounter mixtures consisting of widely
varying proportions of solids, liquids, and gases. No particular dif
ficulty is experienced when liquid-solid mixtures are pumped, except
that the pump may choke if the density of the material in the suction
line is too high. In normal dredging operations, the specific gravity
of the mixture pumped is about 1.2, although laboratory experiments
indicate that the dredge pump would operate satisfactorily up to a
specific gravity of about 1.45, which corresponds to the consistency
of a thick catsup. A choking condition is alleviated by either lifting
the drag head out of the mud, or by admitting water to the suction line.
When materials containing a considerable amount of entrapped
or dissolved gas are enco~ntered, the gas which enters the suction line
of the dredge pump may accumulate in such quantities that the flow of
solids discharged by the pump is severely reduced or pumping is com
pletely stopped. The latter condition results in the pump losing its
prime. In recent years, the difference between actual choking and stop
page of the pump due to excessive gas has been recognized and the need
for gas removal from the suction line has become apparent.
The gases are products of decomposition of organic matter in
the bottom material. They are dis~olved in the water forming a part of
the "in situ" material and, if the water is saturated, bubbles form
throughout the material. Since mud usually has high viscosity such
bubbles may be retained in the mixture for many years. Analysis of
samples indicates a gas mixture with range of methane (CH4 ) from 0 to
85%, nitrogen (N ) from 0.2 to 98.8%, hydrogen (H ) from 0.6 to 29.8%,2 2
oxygen (0 ) from 0.4 to 12.1%, and carbon dioxide (CO) from 1.0 to2 2
14.6%. Methane gas is, of course, inflammable and the need to remove
it from the suction line is also important for fire safety.
1.2 Scope of Project
The project was originally divided into four parts: Phase A,
Literature Search and Formulation of Test Program; Phase B, Formulation
of Specific Test Set~ups and Establishment of Test Schedule; Phase C,
Establishment of Test Facility and Performance of MOdel with Water only;
Phase D, Performance of Model with Solid-Water Mixtures. Phases A and
B have been completed and the results reported to the sponsor (1,2)1.
This report describes Test Series No. 1 and No.2, Phase C, and ad-
ditional studies of air injection methods.
1.3 Test Facility
The test facility consists of two large tanks connected by
the model dredge pump system and a return line. The model test facility
was designed to simulate the prototype condition as closely as possible.
The drag head was not modeled, but an attempt was made to simulate it by
a set of orifices installed at the entrance to the suction pipe. Air
has been used in the model to simulate the gas since it was economical
and closely approximates the solubility of methane, the gas most
INumbers in parentheses refer to items in the list of references.
-2-
frequently encountered in the field. The air was injected just upstream
of the entrance to the suction pipe.
Measurements of suction pressure and discharge pressure, water
flow rate, and temperature were taken. In addition, the volume of air
introduced into the suction line as well as temperature and pressure was
monitored.
1.4 Results to Date
Test Series No. 1 was conducted to determine the effect of air
content on pump operation. The air content is given as the percentage
by volume of the water flow rate, and is for pump suction conditions.
Air contents less than 9 percent have little effect on pump operation,
reducing the head by less than 8 percent for a fixed value of discharge.
However, air contents above 9 percent cause a large and unstable drop in
pump head. The pump became filled with air and lost its prime for air
contents approaching 20 percent.
Test Series No. 2 was carried out to determine the effective
ness of the gas removal system. Manual vacuum control did not result
in any gas removal unless water was also drawn through the vacuum sys
tem. The use of the Level-Tro1 to control an air admission valve in
response to water level fluctuation in the accumulator resulted in
some gas removal at high air flows. With the Level-Trol in operation,
the pump did not lose its prime until the air quantity at suction
reached 25 percent.
-3-

An additional set of tests was run to determine if the method
of air injection had an effect on the gas removal system. The importance
of air injection was demonstrated, as slug type air flow was more readily
removed. A method was developed to provide pulsed slug flow through a
spring action valve on a large air pipe just outside the end of the suc
tion line.
1.5 'Future Plans
Quantitative measurements are to be carried out using the slug
i~jection method. Following these tests, a new accumulator with a slop
ing shoulder on the downstream side will be installed, and visual as
well as quantitative studies will be made. The use of a water driven
ejector in place of the vacuum pump wil~ also be investigated. This is
a continuation of Phase C. Plans for Phase D, Performance of Model with
Solid-Water Mixtures, remain to be formulated.
-4-
2. EXPERIMENTAL STUDY PROGRAM
2.1 Discussion
The objectives of the study program were: (a) to build a scale
model of a dredge suction system; (b) to study the flow of a gas-water
mixture in this system; (c) to install a gas removal system, and (d) to
evaluate the effectiveness of the removal system. Hopefully, recom-
mendations could then be made for modifications to existing gas removal
systems so that they could operate more efficiently.
The test objectives seemed to indicate a basic feeling of those
concerned that existing removal systems "almost worked," and all that was
required were some fairly minor changes in instrumentation and control
devices. This is evidenced by the fact that formulation of specific test
set-ups (Phase B) proposed installation of equipment which was the same
as that already in operation on dredges like Essayons, Goethals, and
Comber. Visits to these dredges by the investigators did not give en-
couragement that the existing systems were effective in removing gas,
or that they "really did work."
The basic ideas for gas removal systems apparently come from.,(
two patents granted to Mr. Richard T. Hoffman. These patents were
filed in 1947, and covered both the vacuum pump system and the ejector
system used on Army dredges. The idea is simply that entrained gas will
collect in an enlargement on top of the suction pipe and this gas can
oJ..
ft U. S. Patents 2,795,873, and 3,119,344.
-5-
then be drawn off with a suction pressure. The suction could come from
either a vacuum pump or an ejector. Although this is the basic concept,
in actual practice the removal systems have. a considerable amount of aux
iliary apparatus to prevent solids and water from being drawn through the
vacuum pump.
The gas removal equipment installed on existing dredges pro
vides no means of observing the flow of gas into the system. In fact,
the only indication of positiv~ results with the prototype systems is
an occasional odor of gas from the exhaust of the removal system. The
unpredictable occurrence of gas in actual dredging operations makes the
evaluation of removal systems by production data very difficult. This
lack of information from operational gas removal systems leaves unan
swered the question as to whether the existing systems are at all ef
fective in removing entrained gas from the dredged material. The pur
poses of this study program are then redefined. First, the behavior of
gas in the suction pipe must he studied. Without this basic information
on where the gas collects in the suction pipe it is not possible to ef
fectively install a removal system. The second objective should be to
determine the effectiveness of the existing prototype installations.
This can be determined by installing a similar system on the model and
observing its behavior. Finally, it was intended that observation of
the model performance would allow practical recommendations to be made
for the improvement of the prototype removal systems.
The use of clear water rather than mud for 'the model pump was
. a necessary simplification. Mud would make visual observations much
-6-
more difficult, and would have been a constant source of difficulty in
the laboratory measuring and control equipment. However, Phase D has
been included to check the performance of the recommended system with
solid-water-gas mixtures.
2.2 Model-Prototype Relations
The results presented in this report are based on tests per
formed with a one-eighth scale model pump and drag arm. It is, therefore,
useful to briefly discuss the similarity ~aws used in scale modeling of
centrifugal pumps.
The use of models to study prototype pumps requires geometric
similitude as well as geometrically similar vector diagrams of the ve
locity entering and leaving the impeller. Viscous effects must be ne
glected as it is generally impossible to satisfy the geometric similarity
requirements, and have equal Reynolds numbers in the model and in the
prototype. However, the modern technique of conducting model pump tests
at prototype heads results in higher Reynolds numbers than might be ex
pected, thus reducing the error due to incorrectly modeled viscous forces.
The most important action in a pump is the dynamic transfer of
energy from the rotating impeller to the moving fluid. If two pumps are
geometrically similar and have similar velocity vector diagrams they are
considered homologous. Homologous pumps also have similar streamlines,
and for practical purposes, dynamic similitude exists. It is, therefore,
assumed that the scale model pump used for the experiments can accurately
predict the performance characteristics of the prototype pump.
-7-
The prediction of prototype performance from tests of a homo-
logolis model requires the use of certain general laws of similarity.
These similarity laws define a group of dimensionless terms which in
turn can be used to predict the performance of the prototype pump.
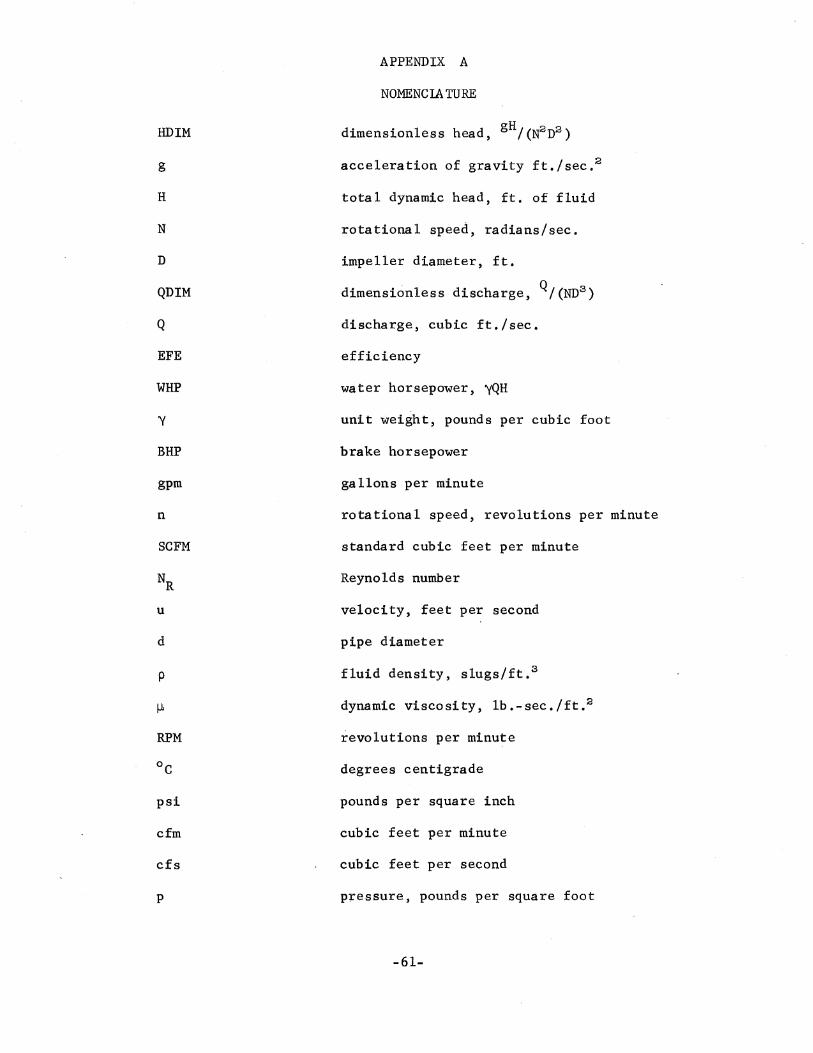
Dimensionless Terms
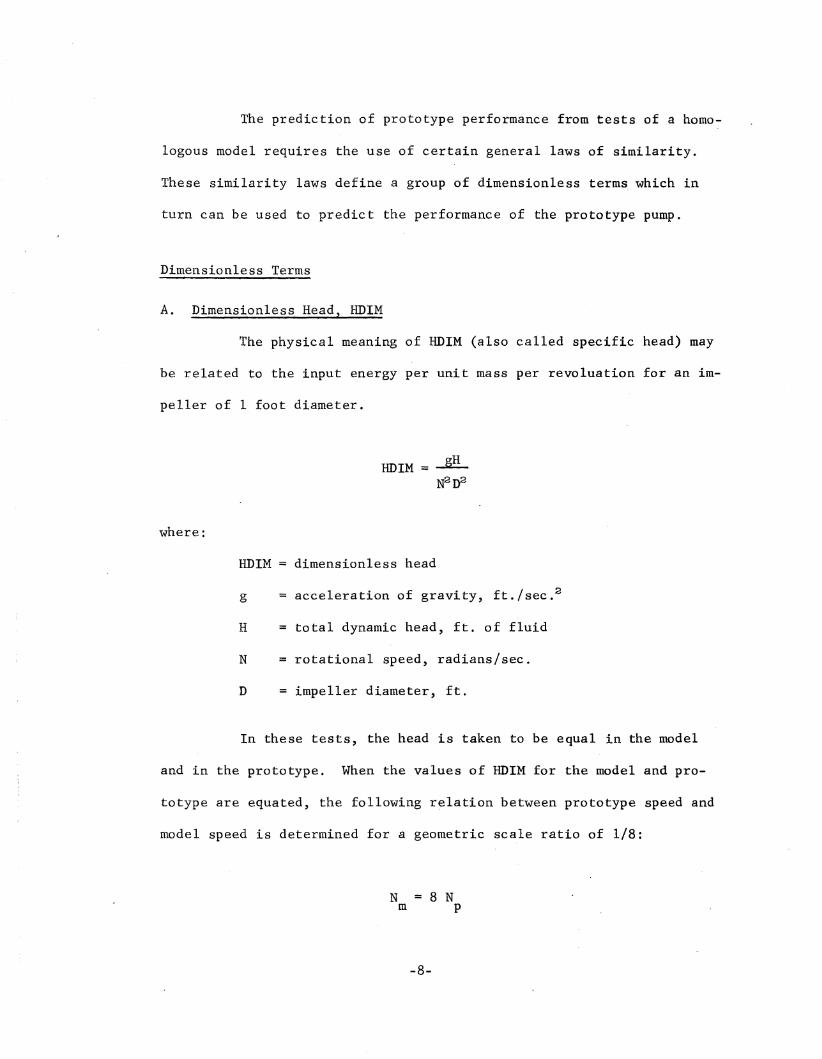
A. Dimensionless Head, HDIM
The physical meaning of HDIM (also called specific head) may
be related to the input energy per unit mass per revaluation for an im-
peller of 1 foot diameter.
HDIM
where:
HDIM
g
H
N
D
dimensionless head
acceleration of gravity, ft./sec. 2
total dynamic head, ft. of fluid
rotational speed, radians/sec.
impeller diameter, ft.
In these tests, the head is taken to be equal in the model
and in the prototype. When the values of HOlM for the model and pro-
totype are equated, the following r~lation between prototype speed and
model speed is determined for a geometric scale ratio of 1/8:
N = 8 Nm p
-8-
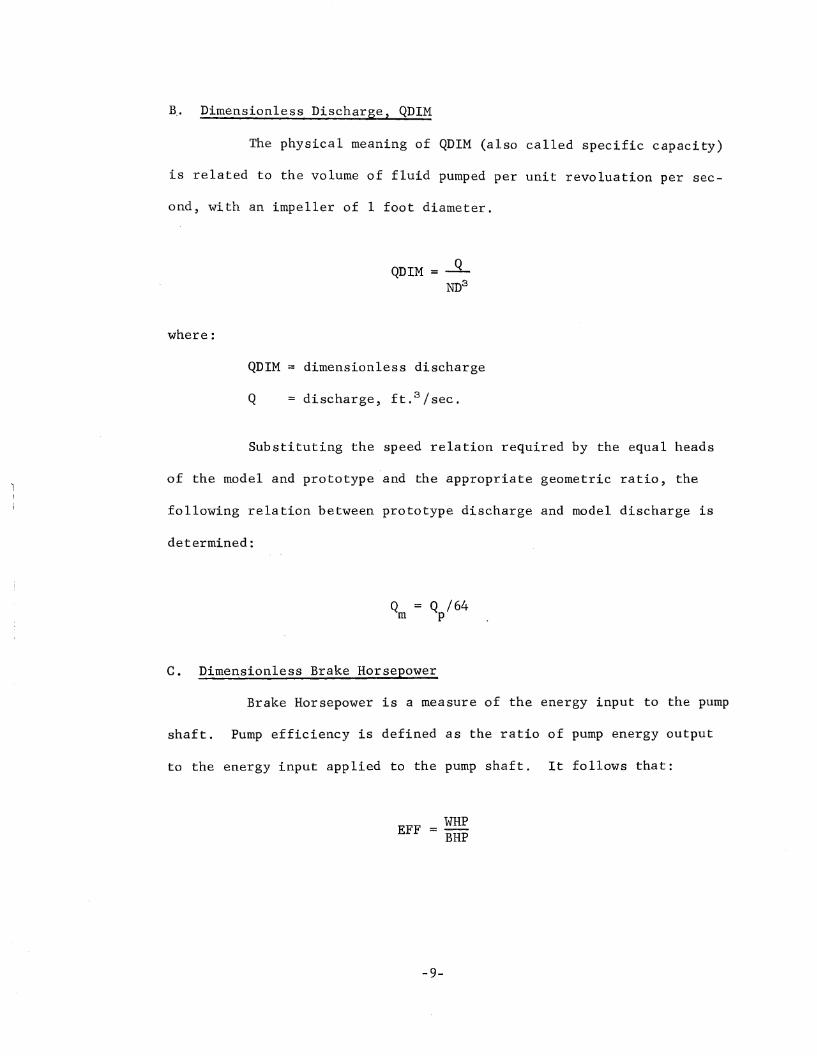
B.. Dimensionless Discharge 2 QDIM
The physical meaning of QDIM (also called specific capacity)
is related to the volume of fluid pumped per unit revaluation per sec-
and, with an impeller of 1 foot diameter.
QDIM = .JLND3
where:
QDIM = dimensionless discharge
Q discharge, ft. 3 /sec.
Substituting the speed relation required by the equal heads
of the model and prototype and the appropriate geometric ratio, the
following relation between prototype discharge and model discharge is
determined:
Q /64p
c. Dimensionless Brake Horsepower
Brake Horsepower is a measure of the energy input to the pump
shaft. Pump efficiency is defined as the ratio of pump energy output
to the energy input applied to the pump shaft. It follows that:
EFF WHPBHP
-9-
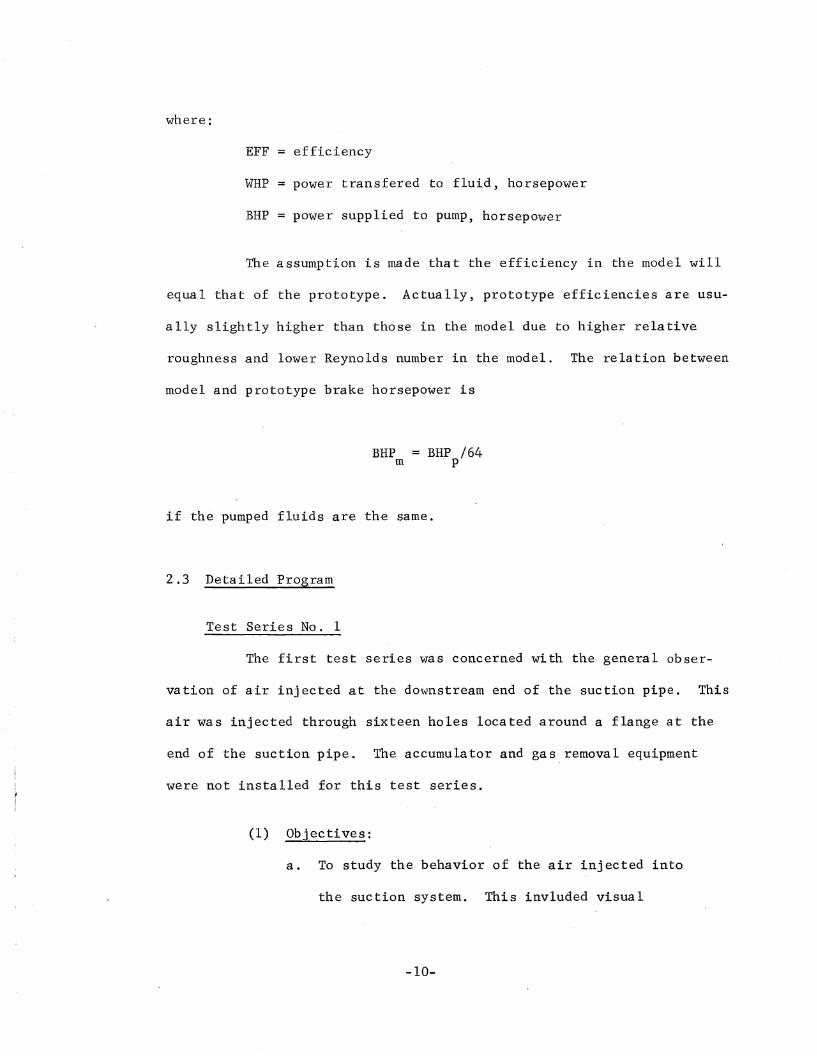
where:
EFF efficiency
WHP power transfered to fluid, horsepower
BHP power supplied to pump, horsepower
The assumption is made that the efficiency in the model will
equal that of the prototype. Actually, prototype efficiencies are usu-
ally slightly higher than those in the model due to higher relative
roughness and lower Reynolds number in the model. The relation between
model and prototype brake horsepower is
BHP = BHP /64m p
if the pumped fluids are the same.
2.3 Detailed Program
Test Series No. 1
The first test series was concerned with the general obser-
vation of air injected at the downstream end of the suction pipe. This
air was injected through sixteen holes located around a flange at the
end of the suction pipe. The accumulator and gas removal equipment
were not installed for this test series.
(1) Objectives:
a. To study the behavior of the air injected into
the suction system. This inv1uded visual
-10-
observations on the position of the gas
bubbles as they moved up the suction pipe.
b. To determine the amount of air that caused
pump collapse at various flow rates.
c. To obtain reference data for evaluating the
system with the gas removal equipment installed.
(2) Parameters:
The main parameters were flow rate and gas content.
The pump speed and suction geometry were briefly
investigated to see if they were significant para-
meters.
(3) Procedure:
B. Select an initial water flow rate.
b. Start the pump motor and set the desired speed.
(1140 rpm is the design speed for the model pump).
c. Open the discharge valve until the selected dis-
charge is obtained.
d. Measure the control parameters, such as pressure,
voltage, amperage, and flow rate.
e. Inject a controlled amount of air into the suction
pipe.
f. Observe the rise, position and size of the gas
bubbles using strobotac and motion pictures.
g. Increase the air flow and repeat steps, d, e, and
f, holding the pump speed constant.
-11-
h. Note the amount of air which causes complete
collapse of the dredge pump.
The previous procedure was repeated for seven different flow
rates between 400 and 1000 gpm.
(4) Analysis:
Plot curves showing the effect of air content on pump
discharge and on the total dynamic head.
Test Series No.2
The second test series re uired the installation of a plexi
glas accumulator and a facuum pump. After the installation of this
gas removal equipment, the dredge pump was again tested and the per
formance of the system was recorded.
(1) Objectives:
a. Determine if the gas removal system is beneficial
to the performance of the dredge pump.
b. Determine the amount of gas which is removed by the
removal system.
c. Investigate the use of various control devices
(Level-Tro! and diaphragm valve) to improve the
efficiency of the removal system.
d. Based on the observations of Test Series No.1 and
prototype clearances, investigate the effect of
varying the accumulator location.·
-12-
(2) Procedure:
Repeat the procedure of Test Series No. 1 with the gas
removal system in operation. Record the amount of gas
removed from the accumulator. These tests should be
repeated for each accumulator location, and for dif
ferent control devices if the removal system appears to
be func tiona 1.
(3) Analysis:
Plot curves similar to those of Test Series No.1,
showing pump performance with removal equipment op
e~ating.
-13-
3. EXPERIMENTAL FACILITY
3.1 Facility for Test Series No.1
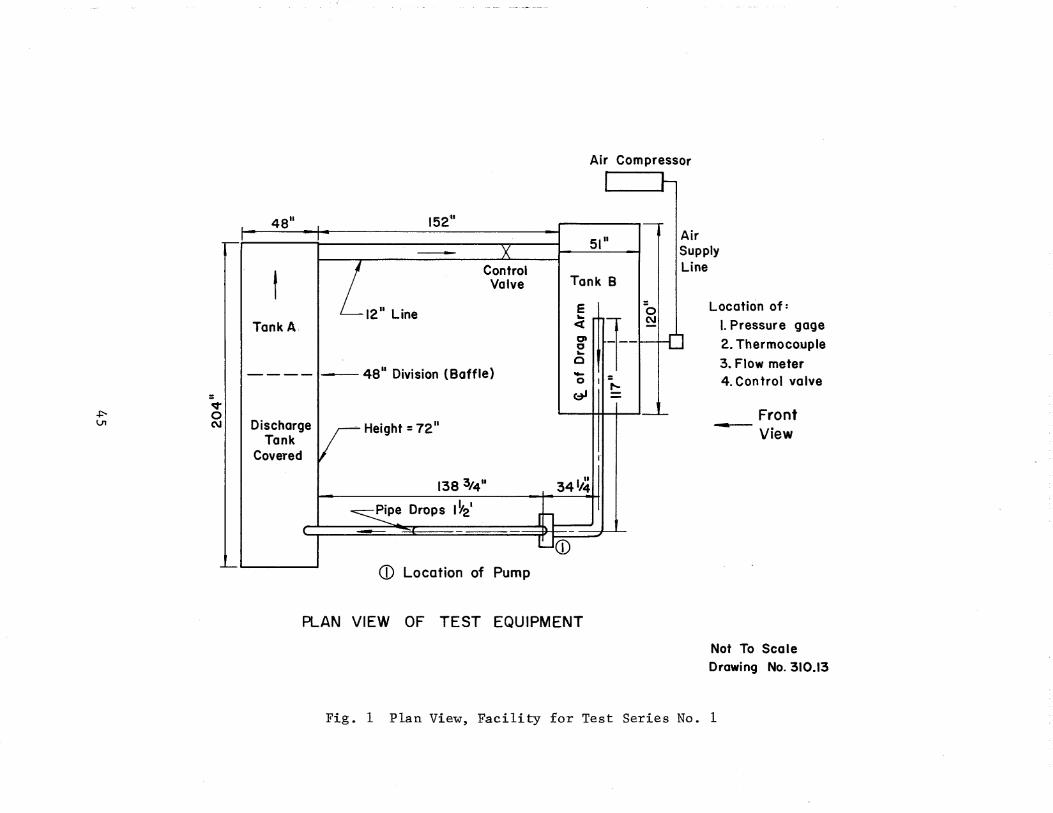
The test set-up consisted of a suction tank, suction pipe,
pump, discharge pipe, discharge tank, and a return pipe all connected
in a continuous flow loop. External to the flow system is the pump
motor and the air compressor. The layout of the equipment is shown in
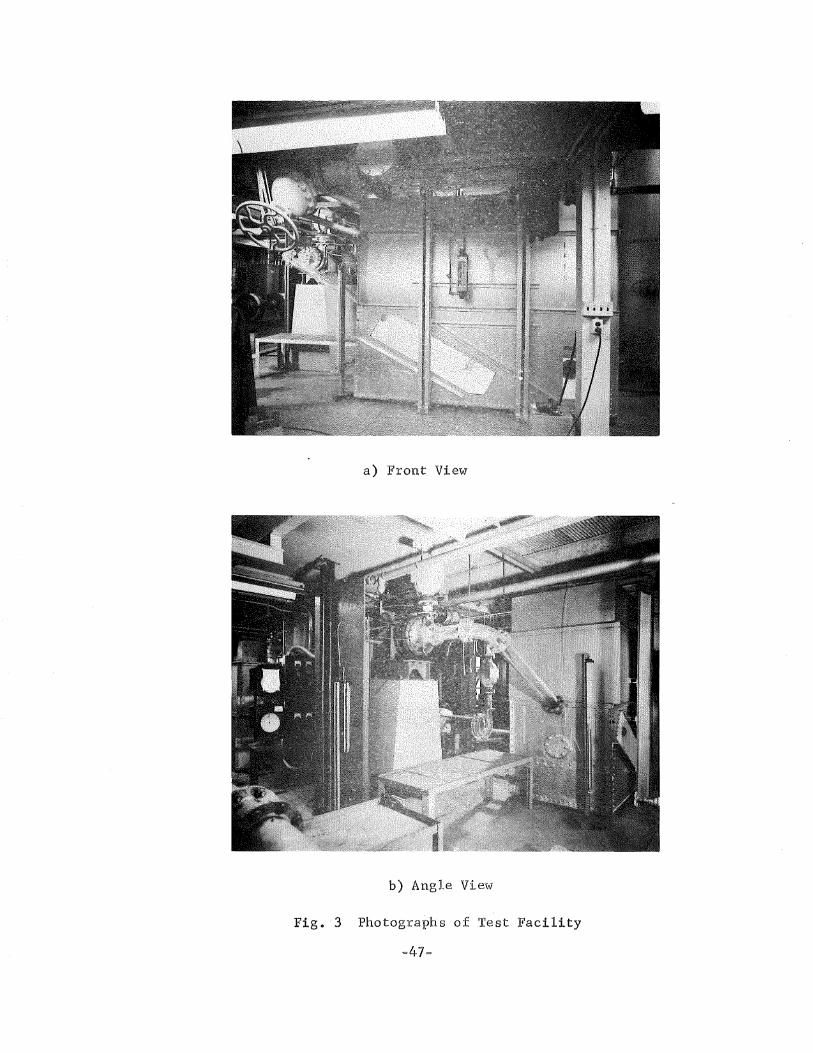
Figs. 1 and 2. Figure 3a shows the front of Tank B. The suction pipe
and dredge pump may be seen in ,the left center of-the picture. One of
the injected a,ir flow meters is located in the center of Tank B. Above
and to the right of the flow meter the filters in the air .line may be
seen. Figure 3b shows the pump and suction pipe as well as the mano
meter board for measuring pump pressures. The magnetic flow meter is
directly above the pump, while the flow rate indicator and electrical
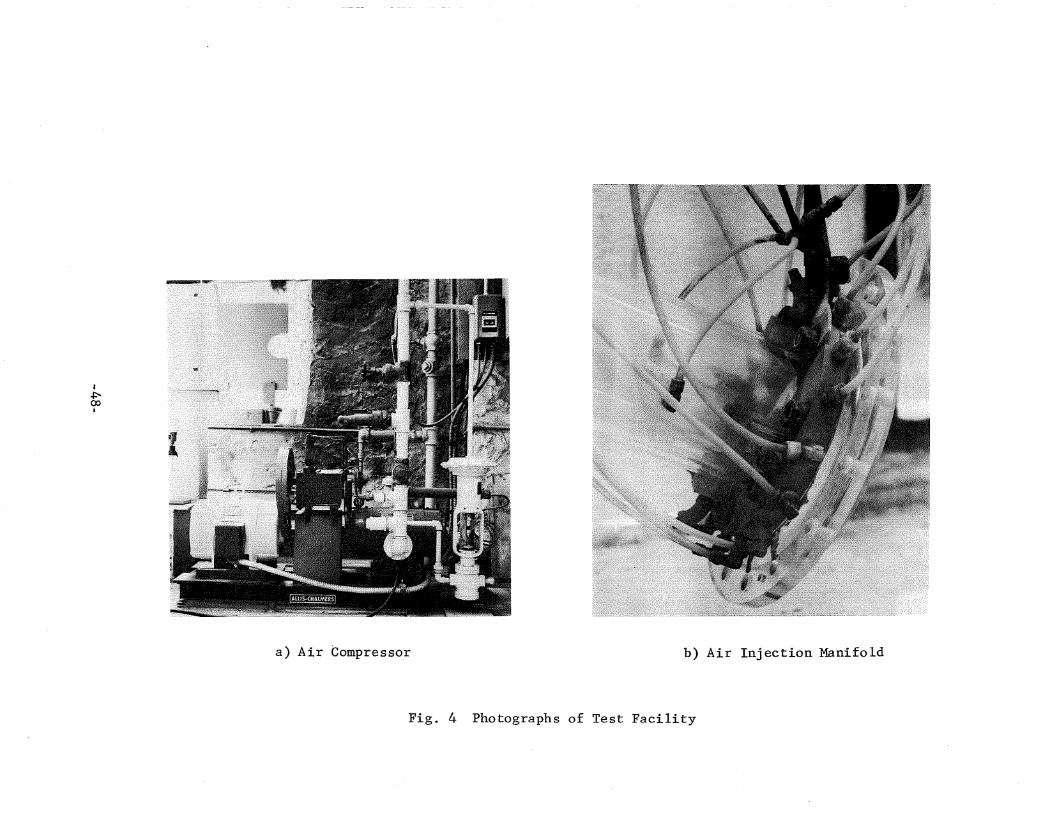
meters are located to the left of the manometer board. Figure 4a shows
the rotary air compressor with the associated control and safety devices.
Figure 4b is a close-up of the air injection manifold which is visible
through the window in Tank B in Fig. 3a.
3.1.1 Pump
The pump is a 1 to 8 scale model of the centrifugal pumps on
the Army Corps of Engineers' hopper dredge Essayons. The pump is a
radial flow type of design which means the fluid is turned ninety de
grees as it passes through the pump. The front of the pump casing is
made of plexiglas so that actual flow conditions can be observed. The
remainder of the pump casing is a bronze casting. The model pump and
the prototype pumps were manufactured by the Ellicott 'Machine Corporation.
-14-
3.1.2 Impeller
The pump impeller is 10.5 inches in diameter and has five
vanes. The vane layout is in the form of an involute curve with an
entrance angle of 45° and an exit angle of 22°30'. The pump impeller
is a bronze casting, but it is fitted with a plexiglas suction-side
shroud.
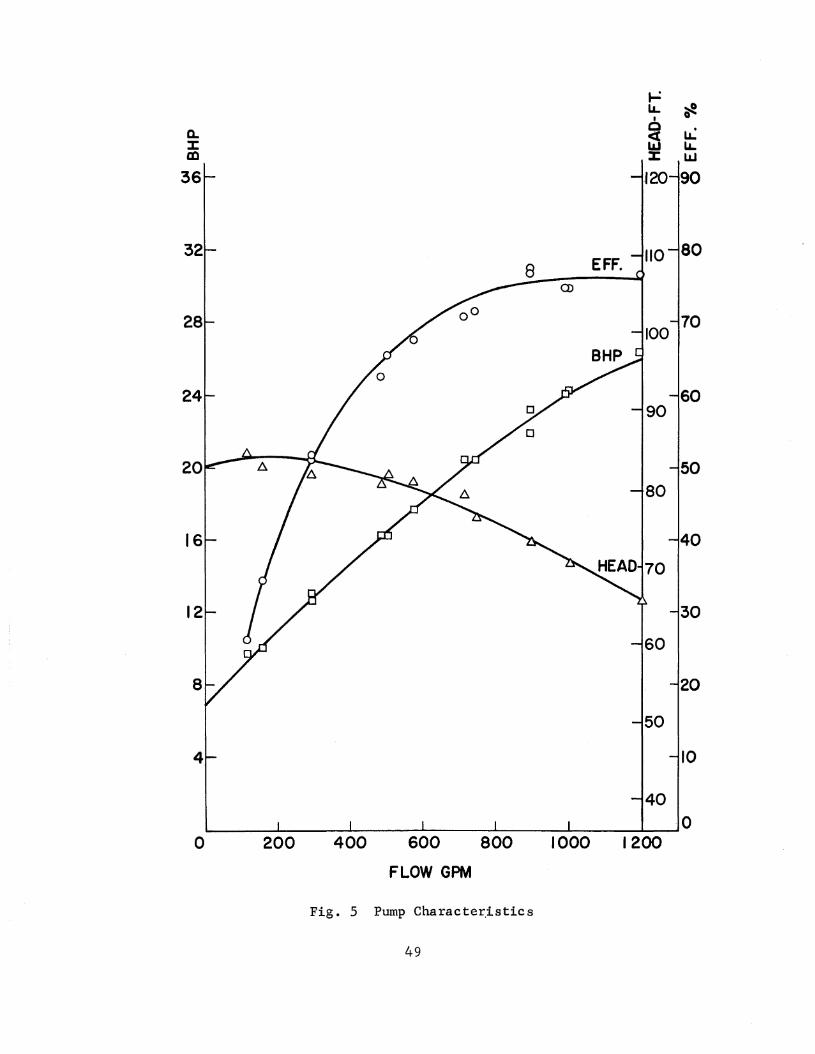
3.1.3 Pump Characteristics Without Air
In order to characterize the pump used in this investigation,
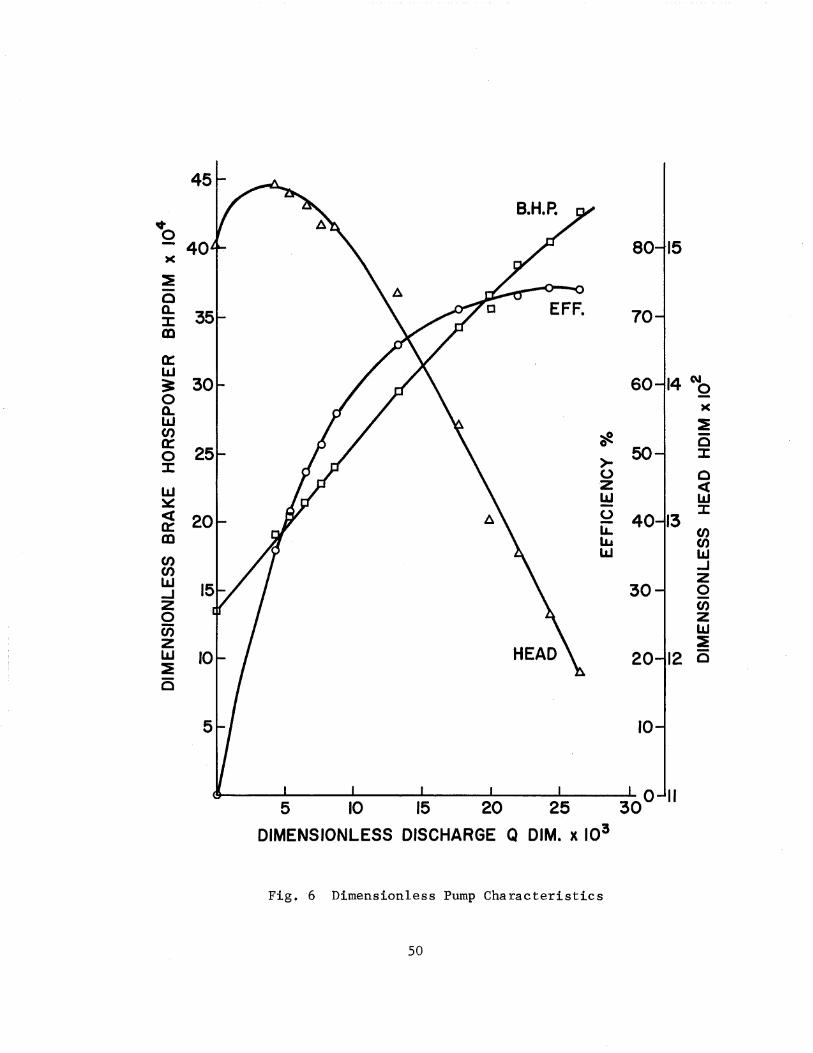
a standard plot of the pump's characteristics is given in Fig. 5, while
dimensionless characteristics are given in Fig. 6. Specific speed is a
dimensionless parameter which can be used to describe a pump. The spe-
cific speed is defined as the revolutions per minute needed to produce
a discharge of 1 GPM at a head of I foot of water. The discharge used
is the one with the maximum efficiency. This is easily determined from
the plot of the pump characteristics. Stepanoff defines specific speed
as follows (3):
n(Q)1/2Specific Speed = ---
H3/ 4
where:
n = speed, revolutions/minute
Q discharge, gallons/minute
H head, ft.
-15-

From Fig. 5 is seen that a discharge of 1100 GPM and a head
of 67 feet correspond to the maximum efficiency. Thus, the specific
speed of the pump is 2040.
3.1.4 Motor
The motor is a 40-hp, Life Line H, Frame 405, direct current
motor manufactured by Westinghouse Electric Corporation, Buffalo, New
York. This motor is designed to provide a wide speed range and accurate
speed regulation. The motor was calibrated so that its power output
could be calculated from input voltage and amperage data.
3.1.5 Magnetic Flow Meter
The discharge from the pump was measured with a ~gnetic Flow
Meter manufactured by the Foxboro Company, Foxboro, Massachusetts. In
a magnetic flow meter a glass pipe is used with a magnetic field induced
across the pipe by an electromagnet. The fluid flowing through the pipe
generates a voltage which is proportional to the velocity of the flowing
fluid. Two electrodes placed in the pipe wall pick up this voltage, and
transfer it to a Dynalog Recorder. The recorder is used to convert the
generated voltage into a readout of a pen on a 24-hour revolving chart.
The flow meter and recorder are shown in Fig. 3b.
Under test conditions, the discharge is a 'mixture of air and
water. The flow meter reads the volume flow rate of the total air-water
mixture. The only assumptions are that the meter tube is running full
and that the discharge is a homogeneous mixture.
-16-
3.1.6 Pump Speed
Originally, a tachometer generator was mounted on the shaft
of the D.C. motor. This arrangement gave inaccurate speed measurement,
possibly because of misalignment of the generator. The tachometer was
removed, and the speed was ·measured with a Hasler speed indicator. The
speed was also monitored frequently with a stroboscopic tachometer.
3.1.7 Air Compressor
The air was provided by a single stage rotary compressor, model
5CCA, which is rated at 45 CFM at a discharge pressure of 30 psig. This
compressor was manufactured by Allis-Chalmers, Milwaukee, Wisconsin. The
compressor is powered by a 7.5 HP A.C. motor. The compressed air is fed
through an aftercoo1er, a separator, and a filter before it is injected
into the suction pipe. The compressor is shown in Fig. 4a. The separator
and filter are visible at the top of Fig. 3a.
3.1.8 Air Injection
Air injection is accomplished .by a manifold with 16 hoses con
nected to 1/16 inch diameter holes drilled through the end flange of the
suction pipe. The injection holes were located 2 inches from the end of
the suction pipe. Figure 4b is a close-up photograph of this injector.
3.1.9 Measuring Equipment
The injected air flow was measured with a rotameter calibrated
to read SCFM air at 25 psia, 70°F. The air temperature at the flow meter
was measured with a calibrated resistance wire temperature gage. The air
-17-
pressure at the meter is also measured, and all air volumes were cor
rected to the above mentioned standard conditions.
The suction head was measured with a 50 inch range mercury
manometer. The suction head was measured in the suction pipe one inch
upstream from the outer edge of the pump face. The discharge head is
measured with two 100 inch range mercury manometers. It was measured
in the discharge pipe directly before the magnetic flow meter 12.8
inches above the pump centerline.
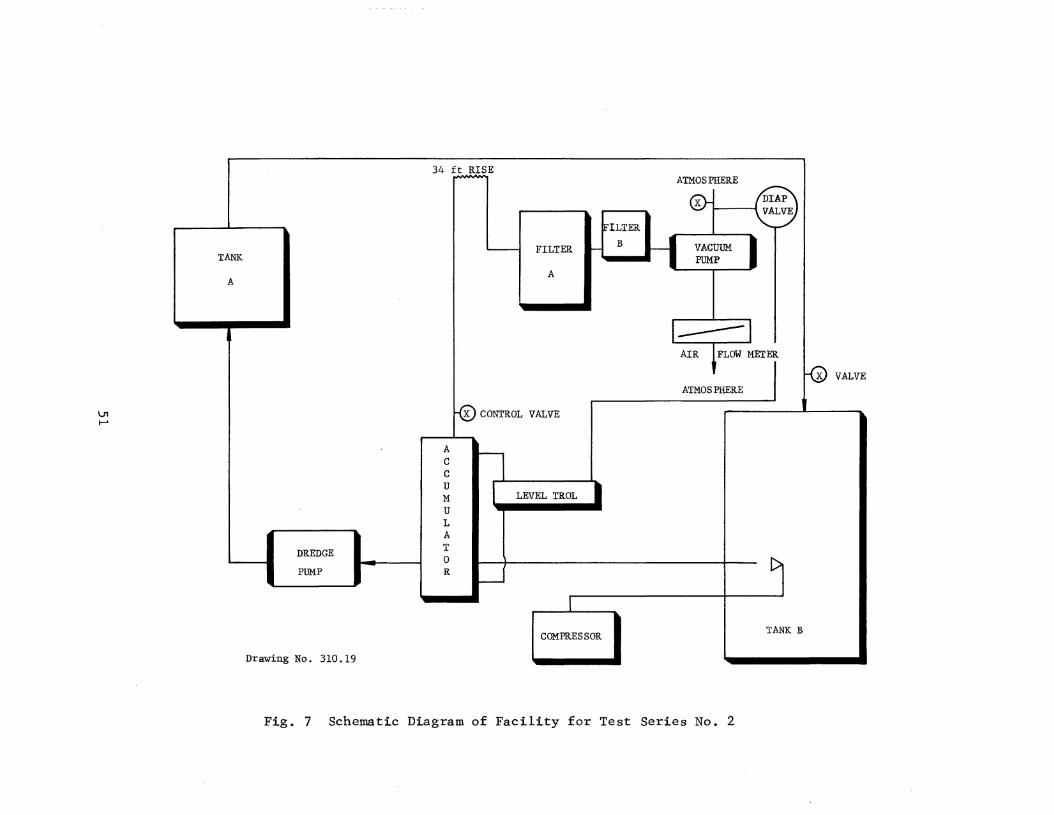
3.2 Facility for Test Series No.2
The test set-up for this series of tests# remained the same,
except for the installation of the gas removal equipment. A 4-1/2 inch
square plexiglas accumulator was added to the top of the suction pipe.
The center of the accumulator is 12-3/4 inches from the face of the pump.
The accumulator is 17 inches high. A schematic sketch of the gas removal
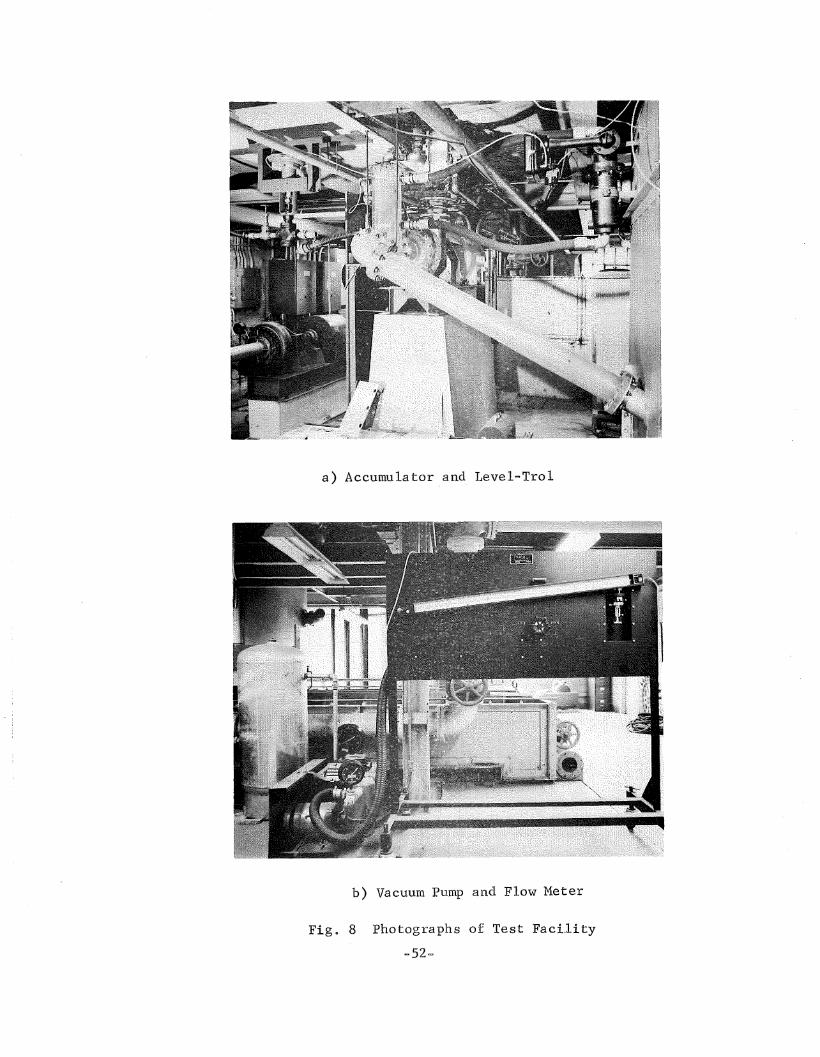
system is shown in Fig. 7. Figure 8a shows the accumulator installed with
the Level-Trol and automatic air admission valve on either side of it.
Figure 8b shows the vacuum pump and related equipment.
3.2.1 Vacuum Receiver
This is a 20 x 48 inch cylindrical tank galvanized inside and
outside. It has a capacity of sixty gallons and serves to keep water
from entering the vacuum pump. The receiver is near the left edge of
Fig. 8b.
-18-
3.2.2 Vacuum Pump
The vacuum pump is a piston type, V244, with 4 x 4 inch cyl
inders. It is driven by a 2 HP A.C. motor. The pump has a maximum
vacuum of 29.65 inches mercury, and a piston displacement of 16.0 CFM.
It was manufactured by Ingersoll-Rand Co., Painted Post, New York. The
vacuum pump is at the lower left center of Fig. 8b.
3.2.3 Vacuum Flow Meter
A laminar air flow meter was used to measure air removed from
the system. This meter is a model D-23170 manufactured by the Meriam
Instrument Co., Cleveland, Ohio. This appears in the upper right fore
ground of Fig. 8b.
3.2.4 Accumulator Fluid Level Controllor
This was a Fisher, type 2502-249 Level-Trol. It has a 3 inch
diameter by 13 inch long float chamber. The Level-Tro1 was manufactured
by the Fisher Governor Co., Marshall Town, Iowa. This device is used to
keep a constant level in the accumulator .. It does this by sensing a ris
ing liquid level in the accumulator and activating a diaphragm valve which
admits atmospheric air to reduce the vacuum and thus lower the level in
the accumulator. This equipment appears in Fig. 8a. The Level-Trol is in
the upper right, attached to the end of Tank B. The diaphram valve is to
the left of the accumulator.
3.3 Equipment for Air Injection Tests
The various injection methods are shown by sketches. The first
trial, with a single inlet port in the center of the end of the suction
-19-
line, is shown in Fig. 9. The arrangement for the balloon scheme is
shown in Fig. 10. The large (2 1/2 inch) inlet with a lever actuated
ball valve just upstream from the end of the air pipe, is shown in
Fig. 11.
-20-
4. EXPERIMENTAL STUDIES
4.1 Introductory Comments
The original experimental program was modified because of prac
tical difficulties. The use of an orifice to simulate the drag head
proved to be impractical, and had to be discarded after considerable time
and effort. The intended measurements of air flow rate proved very dif
ficult, and required much trial and error work before even partial success
was achieved. The control of accumulator liquid level and vacuum was also
a problem. The Level-Tro! device was eventually installed properly and
operated as planned.
Subsequently, suitable test procedures were developed for both
test series. High and medium speed movies were taken of desired flow
conditions, especially during Test Series No. 2 with the accumulator in
stalled.
4.2 Difficulties Encountered
Many difficult problems were encountered in the experimental
instrumentation and operation. Some of these problems were compounded
by unexpected delays in equipment delivery and problems of installation.
4.2.1 Installation Delays
Delays in delivery of the air compressor, associated equip
ment, and the bronze-plexiglas pump casing held back the initial test
date over four (4) months. Additional delays occurred when the vacuum
pump and vacuum control equipment were purchased for Test Series No.2.
-21-
~vo serious mistakes were made by the electrical contractor
during installation. The polarity of the D.C. motor was reversed. This
caused the pump impeller to spin off the shaft and resulted in damage to
the impeller. This caused a considerable delay while the impeller was
repaired. The electricians also wired the compressor motor for 120 volts
instead of the specified 220 volts. This resulted in a burned out switch
box, but no damage to the compressor.
The old volumetric ta'nk which wa~ modified ,arid was used as the
discharge tank (Tank B, Fig. 1) sustained a bracing failure when subject
ed to pumping pressure. This required draining the system- and welding in
new bracing with all the usual leakage problems when gaskets are allowed to
dry.
These unexpected and uncontrollable delays in putting the test
equipment into operation delayed the completion of Test Series No.1 by
approximately 6 months. Permission from the sponsor to begin preliminary
work on Test Series No. 2 before completion of Test Series No.1, recov
ered about 2 months of the lost time.
4.2.2 Experimental Difficulties
The first problem arose when various sized orifices were used
at the inlet to the model drag arm. These were to simulate the head loss
and flow control by the prototype drag head and bottom consistency. The
two larger orifices caused a decrease in flow rate of only 2.5 percent
for zero air. The two smaller orifices cavitatad rinLess the flow rate
was severely restricted by using the discharge valve.
-22-
Though discharge control of flow rate was not desired since
it is not used on prototype dredges, it was accepted with limitations.
Alternatives, including a model drag head and movable tank bottom, were
dismissed as either being too expensive or requiring too much time.
The efforts to use a set of orifices were time consuming,
not to mention that a day was required to change orifice plates.
The air mass balance mentioned in Section 2.2 required mea
surement of air flow at three locations. The excess air not removed
by the removal system was supposed to collect in discharge tank Band
to be measured by a flow meter. In addition, the air injection rate
and the air flow rate from the gas removal system were to be measured.
The amount of air removed through the accumulator was measured by a
laminar air flow meter. The adaption of this meter to the vacuum sys
tem is described in Section 4.3. The amount of air going into or out
of solution in the water could be obtained from the air diffusion equa
tions (4). As for the amount of air collected in TAnk B, unforeseen
difficulties were encountered. A steady flow of both air and water
could not be established between Tank A and B. When air enters Tank B,
it follows a very random path to the outlet. The air passes through
the flow meter in an unsteady m~nner, carrying large quantities of
water with it. The quiescent surface with an air pocket of appreciable
size above did not form as originally expected.
The vacuum system installed to remove air from the accumulator
required the trial of many vAriations in geometry and location of
-23-
equipment. Despite an eight cubic foot scrubber tank and a filter, water
was drawn through the vacuum ~ump when a vacuum noticeably greater than
dredge pump suction was applied. Addition of an 8 foot high pipe loop or
even a 30 foot high hose loop did not ·stop the passage of the air-water
mixture through the vacuum pump and flow meter. An enlargement near the
top of the loop might have stopped this action, but was not tried due to
a lack of time.
The use of the Level~Trol to control vacuum by admitting at
mospheric air to the vacuum line prevented carry-over or pumping of
water. However, a steady water level in the accumulator was not achieved
since the response of the Level-Trol and the time to admit sufficient air
was too slow. This resulted in a periodic fluctuation of water level in
the accumulator. But this facility did remove some air when the dredge
pump was near the collapse point.
4.3 Development of Air Flow Meter
A laminar air flow. meter was installed as described in Sec
tion 3.2 to measure the amount of removed air. The laminar air flow
meter consisted of two parts, the laminar flow element and an inclined
manometer.
The basic relation between flow rate and pressure drop for
this air flow meter is based on the Hagen-Poiseuille Law. Unfortunately,
this law applies only to laminar flow while most of the flows encountered
in engineering work are turbulent. It is the function of the laminar
-24-
flow element to force the flow to become laminar by a severe reduction
in size of flow passage. Referring to the Reynolds Number
which is the criterion for distinguishing between laminar and turbulent
flow,. it is seen that the only free terms are fluid velocity, u, and
the tube diameter, d, since for a given fluid viscosity, ~, and density,
p, will be fixed. The laminar flow element channels the flow through
myriad parallel ducts which keeps the velocity about the same as in the
pipe, while reducing the duct dimension sufficiently to produce laminar
flow.
A correction for air temperature is needed since the flow
varies inversely with the viscosity which is dependent on temperature.
For air, an increase of lOaF will increase the differential pressure
15% for the same volume flow.
Weight or mass flow rates must be used in comparing air flow
rates measured at different pressures and temperatures. For such pur-
poses, the effect of pressure on density must be taken into account.
The Reynolds Number is also directly proportional to the fluid density.
There are two possible locations for the laminar air flow
meter. One is on the vacuum pump exhaust as indicated in Fig. 7. The
other one is to locate the air flow meter between the scrubber tank and
the vacuum pump. However, with this arrangement, there is a possibility
-25-
that the manometer gage fluid will be drawn into the vacuum line due
to reverse flow. Also, the manufacturer could offer no advice or as
surance on the correct operation of the meter at vacuum conditions.
Consequently, the flow meter was placed on the exhaust side
of the vacuum pump. Since the temperature increased throughout a
test run, the correction for temperature became very large. This re
sulted in apparent flow indications which were induced entirely by the
temperature rise which often reached 50°F. The pressures were always
slightly above atmospheric pressure. The laminar flow device damped
the unsteady flow from the reciprocating vacuum pump.
4.4 Experimental Procedures
The description of experimental procedures will be more easily
followed if reference is made to Fig. 7. The difference in procedure
between Test Series No. 1 and Test Series No~ 2 is noted as necessary.
8. Preliminary
Before each experiment was started, the initial readings of
the manometer were recorded. In order to have more accurate readings,
this procedure was repeated at the end of the experiment. The air and
water temperatures and the atmospheric pressure were also recorded.
b. Starting the Equipment
The pump was driven by a D.C. motor. Before the pump was
started, the sealing water, flow meter, and voltage were turned on and
adjusted. The pump speed was measured by a tachometer and checked with
-26-
a strobotac. (Usually, the pump was run At 1440 rpm). After the speed
was set, the discharge valve was opened gradually And adjusted to desired
flow rate. The pump speed was checked after the desired flow rate was
established.
The following check list shows the equipment used in each
test series:
PumpAccumulatorCompressorVacuum PumpLevel-TrolLaminar Flow Meter
Test Series No. 1
x
x
Test Series No.2
xXXXXX
c. Setting Variables
For a typical test, the pump speed was set at 1440 rpm, the
initial discharge at 1000 gpm, and the injected air pressure at 10 psi__.
In Test Series No.2, the vacuum at the vacuum pump was set at 15 inches
of mercury (the vacuum level was set by adjusting the relief valve). The
amount of injected air was increased gradually until the pump collapsed.
In part of Test Series No.2, the Level-Trol was in operation. The reset
frequency was set at minimum in order to have the fastest response pos-
sible.
d. Recording Data and Repeating Points
After the desired experimental conditions were established,
-27-
the following data were recorded for each injected air flow.
1. Injected air pressure, ususal1y 10 psig
2. Amount of injected air
3. Laminar flow meter reading (Test Series No. 2 only)
4. Temperature of exhaust air (Test Series No.2 only)
5. Combined flow rate
6. Suction head
7. Discharge head
8. Motor voltage and amperage
9. Dredging depth
10. Remarks
Test Series No. 1 included 53 tests for a total of 416 runs.
Test Series No.2 included 21 tests totaling 148 runs. ·The data from
each test were processed by computer. The Air Injection Test Series
included 15 tests in which visual observation was the primary source
of data.
e. Shutting Down
The test was terminated after the pump collapsed. The in
jected air, the vacuum pump, and finally the dredge pump were turned
off.
4.5 Visual Observations
Both medium speed (128 frames/sec.) movies and high speed
movies (approximately 3000 frames/sec.) were taken ~o study the air-
-28-
water flow pattern in the suction line, and in the accumulator.
The medium speed movies were quite useful in Test Series No.1
as sequences from two perpendicular directions could be used to locate
the highest concentration of air. For this test series the high speed
films showed only that the air was widely dispersed in small bubbles at
all air flows less than that at which pump collapse was incipient.
For Test Series No. 2 the high speed movies were necessary to
observe the flow pattern in the accumulator. There was no obvious change
in flow pattern in the suction pipe s~ few medium speed movies were taken
in this test series.
High speed movies of the accumulator and sloping portion of
the suction pipe were used to observe the details of air bubble size,
shape, and distribution. These movies have been spliced with titles
onto an 800 foot reel.
A separate written commentary was written to accompany the
edited movies and includes discussion which is meaningful only when
watching the movies. The edited movies and the commentary have been
sent to the Marine Design Section, Philadelphia District, U. S. Army
Corps of Engineers.
The Strobotac and Strobolume were used to observe conditions
in the pump as the air flow rate was varied.
-29-
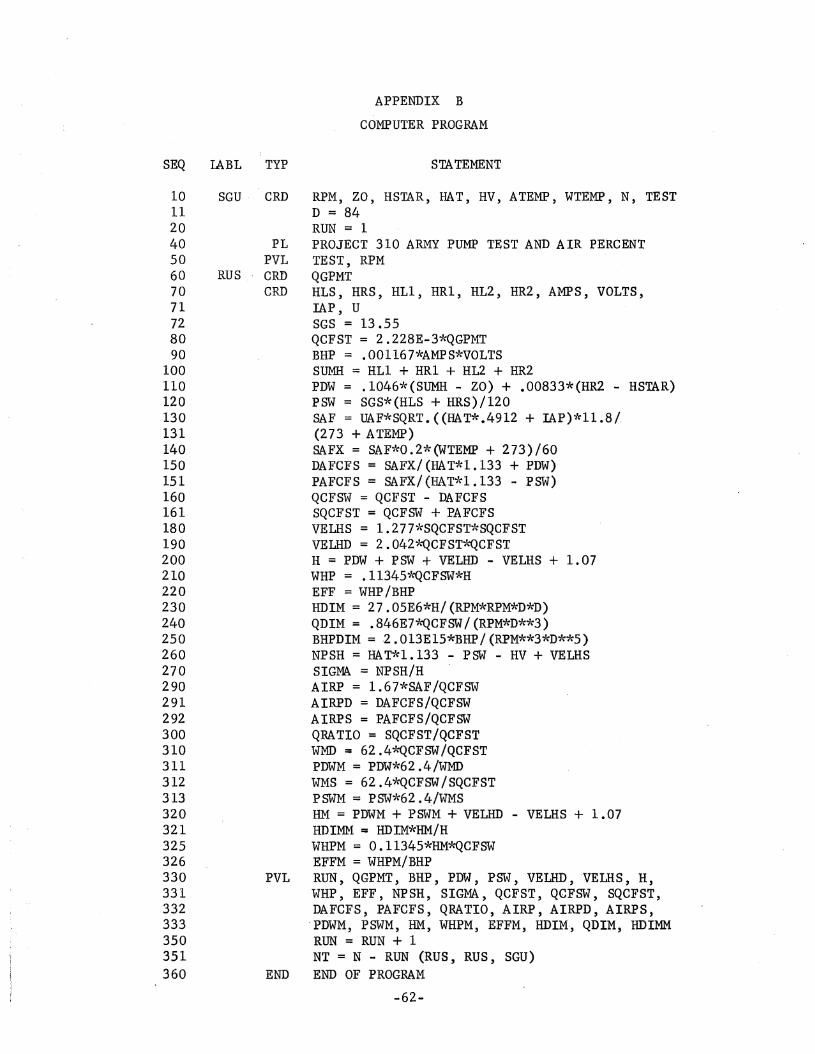
5 • EXPERIMENTAL RESULTS
5.1 Data Analysis
A sample calculation is included here to il1ustratec.the pro-
cedure for data reduction, anq to show the method for calculating values
of the variables which appear in the various plots. The basic data re-
duction was carried out on the GE 225 digital computer in the Lehigh Uni-
versity Computer Center. The final version of ~he computer program is
shown in Appendix B. The language is LEWIZ (5).
The sample calculation 1.8 for Test No. 41, Runs No. 1 (no air)
and No.6 (with air).
Initial Readings: (for entire test)
Pump Speed, RPM, 1440Discharge Manometers, inches 1.2, 0.8, 0'.9, 0.8Suction Manometer, inches 0.4, 0.4Atmospheric Pressure, inches of mercury, 29.90Vapor Pressure, ft. of water, 0.83Air Temperature, °c , 29oWater Temperature, C, 21
Readings, Run No.1.:
Flow Rate, gpm, 1000 .Discharge Manometers, inches 14.0, 13.1, 13.2, 13.2Suction Manometer, inches 4.8, 4.3Motor Current, amperes, 83Motor Voltage, volts, 241Input Air Pressure, psi, 0Input Air Flow, cfm, 0
Computed Quantities, Run No.1:
Flow Rate = 2.28 cfsDischarge Pressure = 53.12 ft. of waterSuction Pressure = -10.28 ft. of waterTotal Dynamic Head = 68.27 ft. of water
-30-
Water Horsepower = 17.26Brake Horsepower = 73.92Dimensionless Head = 0.126Dimensionless Discharge = 0.0221
Reading, Run No.6:
. Flow Rate, gpm, 965Discharge Manometer, inches 13.8, 13.8, 13.1, 13.0Suction Manometer, inches 4.6, 4.2MOtor Current, amperes, 81Motor Voltage, 'volts, 240Input Air Pressure, psi, 10.0Input Air Flow, cfm, 4.55
Computed Quantities, Run No.6:
Total Flow Rate = 2.15 cfsDischarge Air Flow = 0.05 cfsSuction Air Flow = 0.18 cfsWater Flow Rate = 2.10 cfsDischarge Air Percent = 2.4Suction Air Percent = 8.7Discharge Pressure = 53.43 ft. of mixtureSuction Pressure = -10.80 ft. of mixtureTotal Dynamic Head = 68.20 ft. of mixtureWater Horsepower = 16.24Brake Horsepower = 22.69Efficiency, Percent = 71.59Dimensionless Head = 0.0886Dimensionless Discharge 0.0177
5.2 Test Series No.1
As stated in Section 2.2, the purpose of Test Series No. 1
was to determine dredging performance with an air-water 'mixture, but
with no gas removal system. The variables were flow rate, pump speed,
and air content. The flow rate was varied by manipulating the discharge
valve with zero air flow. Once set, the discharge valve was not used
during a given test. Pump speed was maintained at a predetermined value
throughout each test. Data was taken for each test with a fixed air
flow rate.
-31-
Figure 6 shows the dimensionless head, dimensionless horse-
power, and efficiency versus dimensionless discharge curves for the
pump. As the three pump speeds all fit very well on these lines, most
tests were run at 1440 RPM with a few speed· check tests run at 1300 or
1600 RPM. Figure 5 shows the" actual head, horsepower, and discharge re-
lations for a pump speed of 1440 RPM.
The total dynamic head, H, developed by the pump is obtained
from application of the steady flow energy equation between a section
at pump suction, and another section in the discharge line. For a
homogeneous mixture, the heads are expressed in feet of the flowing
fluid mixture. Thus, the total dynamic head is given by:
H = (.E. + z + u2.\ _ i.E. + z + U
2)
Y 2 Jd \y 2 s
where:
p = pressure, pounds p~r square foot
y = unit weight of mixture, pounds per cubic foot
u = velocity, feet per sec6nd
z = elevation, feet
d = refers to discharge section
s = refers to suction section
The velocity is calcula~ed using the total flow rat~ and the
area for each section. Since the pressure changes from suction to
discharge, the volume flow rate of air changes accordingly though the
mass or weight flow rate is the same. Thus, the local total volume'
-32-
flow rate and the local unit weight of the assumed homogeneous mixture
are different for suction and discharge conditions. The sample calcu
lation in Section 5.1 illustrates this as the air flow at pump suction
is 0.18 cfs, while the air flow at discharge is 0.05 cfs.
The data for Test Series No.1 were originally reported in Status
Report No. 15 (6) with the hea,ds expressed in feet of water and air per
centages given for air flow rates determined at standard conditions
(70°F, 25 psia). Since the discharge pressure is approximately 25 psia,
air percentages at pump discharge are similar to those shown. For com
parative purposes, Fig. 12 shows the effect of air on the dimensionless
head - discharge relation for the dredge pump as reported originally.
This figure shows that only moderate reductions in discharge and head
occur if the air percentage is less than 4. When the air flow increases
above 4 percent, a sudden and unstable drop in head and discharge occurs
with final "collapse", or stoppage taking place at about 10 percent air
flow. The precise collapse point is not predictable.
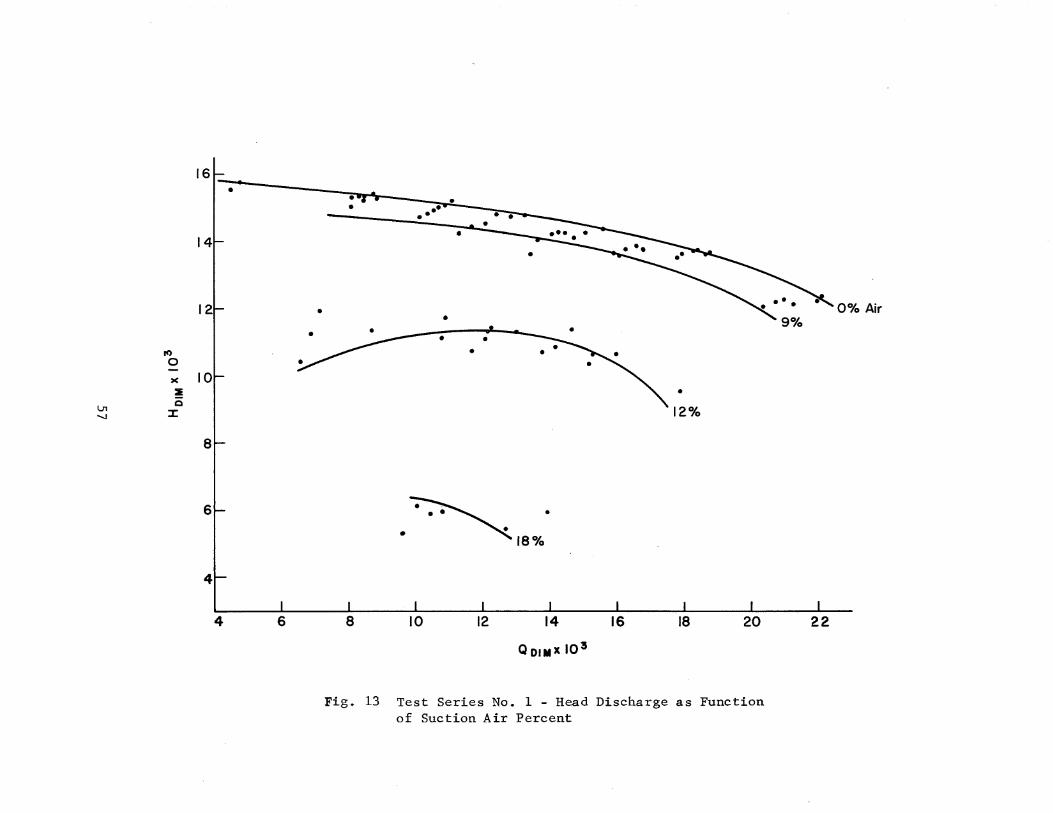
The picture remains similar when the head is put in terms of
feet of the mixture, and the air flow is calculated for pump suction
conditions. Figure 13 presents the data in this form. The obvious
change is the increase in air percentages. Less apparent in this fig
ure is the initial trend of the test data. The discharge decreases
while the head remains nearly constant as the air flow is increased
from 0 to 9 percent of the water flow. At this point, the water flow
rate has dropped approximately 10 percent. If the air flow is increased
to approximately 12 percent, a sudden drop in both head and discharge
-33-
occurs. The head drops 20 percent while the flow rate drops to 5 per-
cent below the zero air flow level. The operating conditions for air
flows above 9 percent are very unstable, and permit recording few data
points at high air flows. Tests with lower initial water flows (QDIM
less than 0.015, or actual flow less than 700 gpm) ended at lower air
flows. This change in collapse point from near 18 percent air to 12
percent air takes place in a narrow range of initial discharges. Lower
initial discharge tests end after operating for some length of time at
the last set air flow. The tests with higher initial flows end quickly
when the air flow is increased above a quasi-stable operation at the
previous air flow.
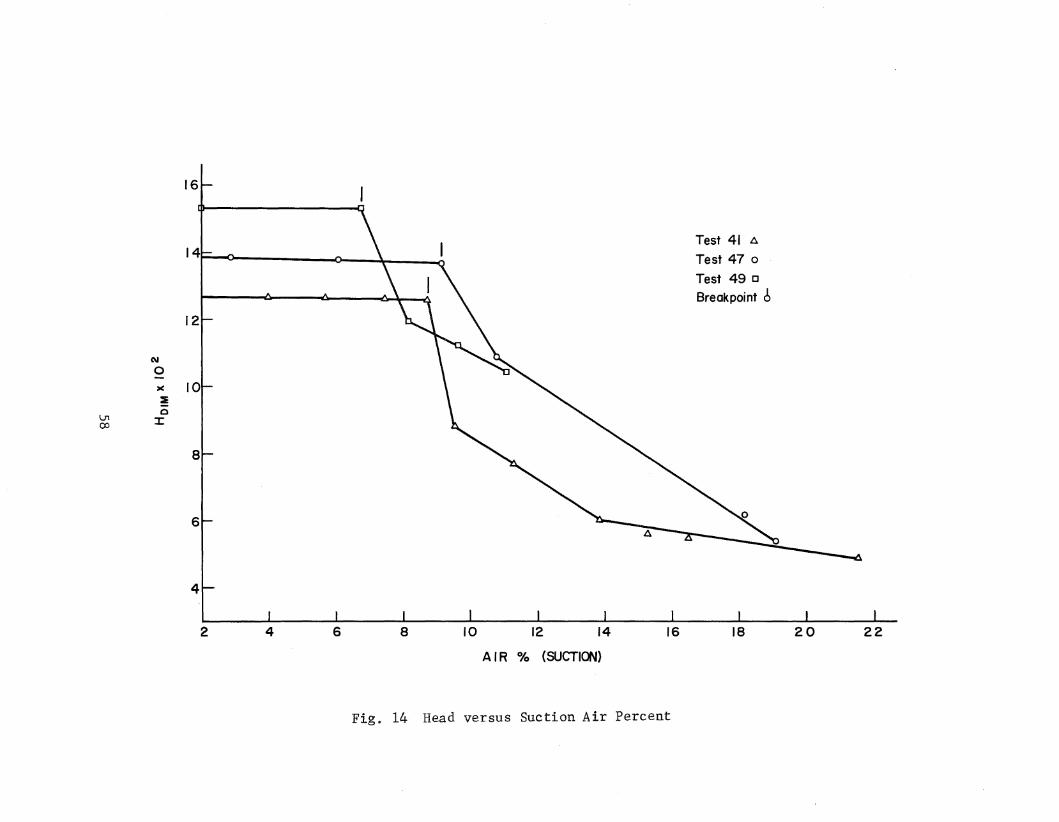
Plotting of the head as a function of air percentage produces
curves like the typical ones shown in Fig. 14. The air percentage at
which the head initially drops can be defined quite well' for each test
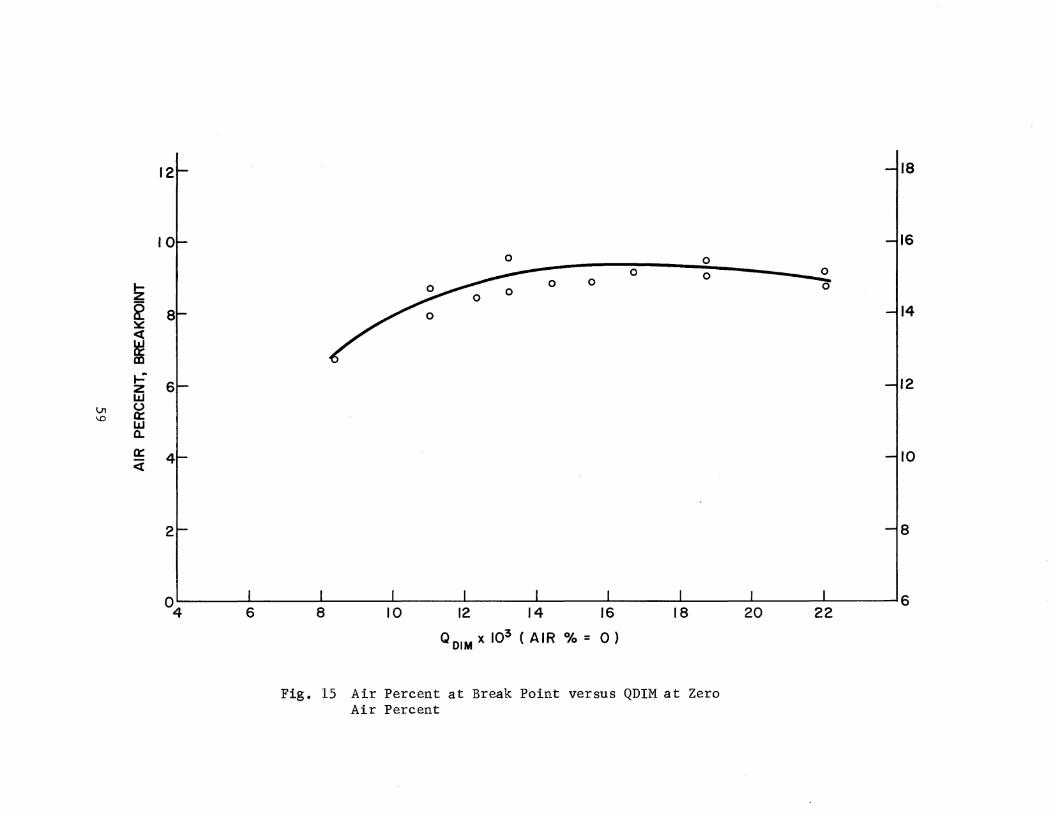
which was carried past this point. This may be termed the "break point",
and Fig. 15 shows the experimental relation between the air percentage
at the break point as a function, and the dimensionless discharge for
zero air flow. The significance of this relation is that a definite
criterion for acceptable air flow rates is given by this rather flat
curve. For a wide range of flow rates, up to 9 percent air' by volwne
at pump suction may be handled with no drop in pump head, and only a
10 percent decrease in dredging rate. Thus, the performance of air re-
moval equipment would be adequate, 'if the air volume passing through
the dredge pump were reduced below the 9 percent limit. This is based
on a steady flow of air. It is likely that short, inte~ittent bursts
-34-
of higher air volume could be handled with only momentary reduction
in dredge production.
From visual observation, the optimum position for the gas re-
moval system appears to be as close to the suction elbow as possible.
However, due to the prototype suction line valve, it is impossible to
locate the removal system clo~e to the suction line elbow.
5.3 Test Series No.2
Test Series No.2 was conducted with the gas removal system
installed. Several tests were run to see if the change in suction
pipe geometry due to the accumulator changed in pump suction conditions.
These tests showed that it has no affect on the pump suction conditions.
In the first part of this test series, the water level in the
accumulator was not controlled. Neither the experimental data nor vis-
ual observation shows any significant amount of air flow out of the sys-
tern. Tests were run with the vacuum at. the vacuum pump varied from zero
to thirty inches of mercury. At vacuums lower than the pump suction
pressure, atmospheric air was drawn into the suction line through the re-r
lief valve on the vacuum line and caused a further decrease in efficiency
of the pump. With the vacuum on the top of the accumulator equal to the
pump suction pressure, no significant amount of air is removed, and pump
operation is not affected. At vacuums higher than pump suction pressure
both air and water are carried through the vacuum system. A 34 foot high
hose loop and a scrubber tank reduced the chance of drawing water through
the vacuum pump. However, this did not result in removal of useful quan-
tities of air from the accumulator.
-35-
The Level-trol was used for some test runs, but resulted in
air removal only near collapse. An increase of 10 percent in air con-
tent at collapse was noted. There was no improvement in the air re-
moval at lower air flows. The response times of the Level-trol and
diaphram operated relief valve were quite slow, and caused an oscil-
lating water level in the accumulator.
The accumulator was tilted 45 degrees, in an attempt to get
the bottom of the accumulator closer to the main air stream in the
suction pipe. However, the air stream was still carried past the
accumulator.
The results of Test Series No. 2 are practically identical
with the results of Test Series No. 1 shown in Fig. 13. Suction con-
ditions are commonly described by either the "net positive suction
head", NPSH, or by the ratio of NPSH to H, the total pump head. Net
positive suction head is defined by the equation:
where:
NPSH _.
Pv- -.-y
atm denotes atmosphere
s denotes pump sucti~n
v denotes water vapor
The ratio of NPSH to H is often labeled, G, and called the cavitation
index. Depending on the pump design, a value of a'below a critical
-36-
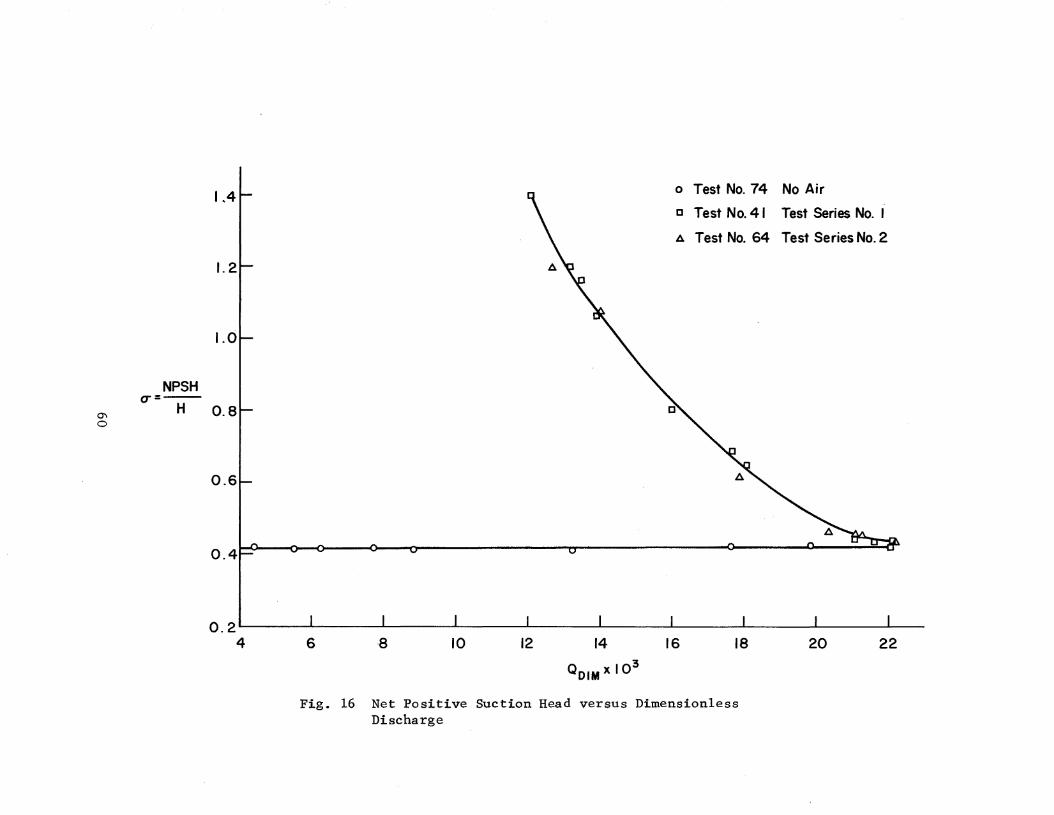
limit indicates probable cavitation. Figure 16 presents a plot of
NPSH versus QDIM for several conditions. The nearly horizontal line
at a cr of 0.43 is for no air flow. This indicates that there is no
change in the chance of cavitation with varied flow rate within the
operating range of the pump when the pumped fluid is clear water.
The other line is for varied air flow. Data points for a typical
test in each test series are shown and fallon the same line. The
trend of this curve may be explained by noting that the suction pres
sure, which is below atmospheric at normal flow rates, approaches zero
quite rapidly with increasing air flow, while the total head drops more
gradually. In fact, at collapse the NPSH is approximately given by
Patm - Pv' but the total head drops to zero. This plot was chosen over
a plot of NPSH versus Q, since it puts all tests on the same basis with
regard to atmospheric conditions and the cr value for no air flow. The
data indicates that the gas removal system does little to improve dredge
pump suction conditions which ·are vital to continued operation. In par
ticular, the gas removal system did not ~revent the suction pressure and
velocity from becoming zero at some air flow rate.
5.4 Air Injection Tests
The failure of the model gas removal system to remove any sig
nificant amount of air may have been caused by improper modeling of the
prototype air flow. The test facility for Test Series No. 1 and No.2
provided for continuous injection of air through a manifold of small
openings around the inlet to the drag arm. A continuous stream of very
fine air bubbles resulted from this method of injection. Though the
-37-
air tended to rise in the drag arm, the secondary flow induced by the
elbow dispersed the bubbles throughout the flow section at the accumu
lator. At high flow rates the travel time in the suction line was not
sufficient for the air to concentrate in the upper portion of the pipe,
and-the air is more uniformly distributed than it was at lower flow
rates.
Prototype dredges probably encounter gas in conditions con
ducive to the entry of occasional slugs or bursts of air into the drag
arm. This would be quite different in affect on dredging operations
than continuous gas flow, even if several slugs were encountered in
close succession.
Consequently, a brief visual study of air injection and air
flow in the suction line was conducted. Three basic plans were typed
before practical method of slug injection was devised.
The first modification was designed to determine the effect
of number, size, and location of injection ports. The planned change
was from many small ports to fewer larger ports. A scheme involving
a single, large, and centrally located port was installed to check
the opposite extreme from the original system. This arrangement is
illustrated in Fig. 9. .Both 1/2 inch and 3/4 inch ~ipe were tested.
Slug flow was not obtained for any water flow rate with either steady
or pulsed air flow. For continuous air flow, the air stream broke into
fine bubbles, and dispersed throughout the flow before it could be ob
served in the clear suction pipe. The pulsed flow was obtained by
opening and closing the air flow valves near the ai~ flow meters.
-38-
The gate valves could not be operated very rapidly, and the length of
1/2 inch pipe (apprxoimately 8 ft.) between the valve and the end of
the pipe caused an elongated air mass to be injected. This was also
dispersed rapidly into fine bubbles.
These observations showed that changing injector geometry
could not effect the desired ~hange in air flow pattern. A valve some
distance from the injection point was not effective for producing slug
flow. Automatic pressure relief valves were considered, but their re
sponse appeared too slow to give compact slugs.
A simplistic innovation was developed. Air filled balloons
were lowered into the drag arm inlet where they were punctured by a
spike. Figure 10 illustrates the pulley system used to lower and break
the balloons. This system produced slug flow. A considerable portion
of the air slug rose into the accumulator at a water flow rate of 400
gallons per minute. Unfortunately, this method of producing slug flow
is not readily adapted to yield quantita~ive results.
The third and most successful method of air injection required
a valve and small receiver tank at the injection point. This proved to
allow successful generation of a wide range of air flow patterns. De
pending on the speed of operating the valve any type of flow, from a
very short slug to a continuous stream, can be produced. Two versions
of this device were tested. Initially, a spring returned quick acting
gate valve was installed at the end of the 12 inch long receiver of
2 inch pipe. This valve was opened by means of a nylon lanyard or
operating rope and closed by spring action. The spring corroded from
-39-
the continuous exposure to water, and regular maint~nance was needed to
keep the valve operating properly. This is the system shown in Fig. 11.
Subsequently, the valve was replaced by a ball valve. The ball valve
is operated by means of a pipe extending from the valve stem to an
operating lever mounted above the water surface in tank B. This is
the current configuration of the air irijection system.
-40-
6. CONCLUSIONS
6.1 General
The effect of continuous air or gas flow on dredge pump oper
ation was determined in Test Series No.1. Gas flows of less than 9
percent of the water flow have only minor effect on the pumping head
and flow rate. This percentage is based on volume flow rates calcu
lated at pump suction conditions. Gas flows above 10 percent of the
water flow result in unstable flow conditions and in severely reduced
head and flow. Depending ?pon the pumping rate without gas, gas flows
of 12 to 20 percent will cause collapse with the pump casing filled
with gas. Dredging is suspended until the pump is reprimed with
clear water.
The visual observations and movie studies demonstrated that
the air is widely dispersed in small bubbles by the turbulent water
flow. The continuous injection of air in fine bubbles resulted in a
uniform distribution of air throughout the suction pipe. The only
concentration occurs at the elbow. Here the density difference and
centrifugal effect combine to cause most of the air to collect at
the inside of the bend. The air has become widely dispersed before
it reaches the pump.
Test Series No. 2 showed that the currently used accumulator
and vacuum pump were not effective in removing dispersed gas bubbles.
The use of automatic control permitted a slight increase in air per
centage at collapse, but caused the water level to oscillate in the
-41-
accumulator. With the vacuum system in operation, the accumulator
geometry caused no change in gas flow pattern.
More detailed study of air injection methods found that
the effectiveness of the accumulator and collapse of the pump are
dependent on the nature of the air flow. Individual slugs of air
were partially deflected into the accumulator. The pump momentarily
lost head and flow, but did not collapse when moderate slugs were
injected. As no quantitative measure of air volume was made, the
effectiveness of the gas removal system and the ability of the
dredge pump to pass intermittent gas flows without collapse could
not be related to the size or frequency of the gas slugs.
6.2 Future
Four additional test sequences are to be accomplished under
the latest contract modification. The first of these test series
will be performed on a redesigned accumulator. This accumulator will
have a sloping side to allow a wider base for air to enter. It will
be made as high as possible to permit study of the influence of liquid
level in gas removal. In addition, the effect of stream speed on gas
removal will be investigated.
The next test sequence will include measurement of gas
volumes for slug flow to determine ,the proportion of gas flow between
the accumulator and dredge pump.
The third phase involves a major change i~ equipment. The
vacuum ,pump will be replaced by a water driven ejector in order to
-42-
compare the effectiveness of the two methods of removing gas from the
accumulator.
Finally, comparison of the accumulatorB and vacuum systems
will be made considering the influence of accumulator liquid level and
fluid velocity.
-43-

7. FIGURES
-44-
Air Compressor
Front.-.-- View
Location of:I. Pressure gage
2. Thermocouple
3. Flow meter4. Control valve
AirSupplyLine
CD Location of Pump
I I4811 152'11
51 u
X~
tL'2 11
Line
ControlValve Tank B
E 0~
l--C\I
Tank A. «CP --0~
c---- - 48 11
Division (Baffle) ~
I =0
(:).I,...
Discharge V Height =7211
TankCovered r
138 3/411 34 1/4
~e Drops '~211~
( ,-.- -I
-----
-voC\I
+'U1
PLAN VIEW OF TEST EQUIPMENT
Not To ScaleDrawing No. 310.13
Fig. I Plan View, Facility for Test Series No. 1
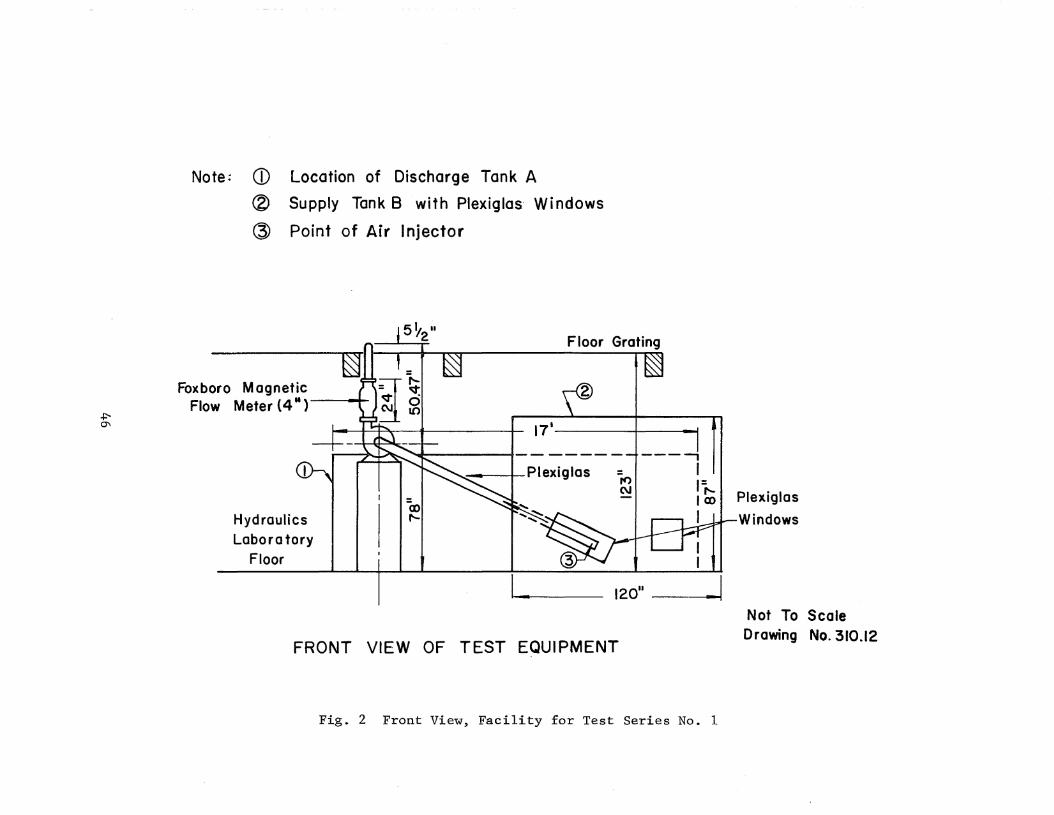
Note: <D Location of Discharge Tank A
® Supply Tank B with Plexiglas· Windows
(3) Point of Air Injector
2
Floor Grating
Plexiglas
Windows
,.,.,C\J
---I
I1=1'1mIII
3~ * I
171
_ I Plexiglas
HydraulicsLaboratory
Floor
Foxboro MagneticFlow Meter (4 II )------.__1..-.
+'Q"\
I - 120" _I
FRONT VIEW OF TEST EQUIPMENT
Not To ScaleDrawing No. 310.12
Fig. 2 Front View, Facility for Test Series No. 1
a) Front View
b) Angle View
Fige 3 Photographs of Test Facility
-47-
I.po.(X)I
a) Air Compressor b) Air Injection Manifold
Fig. 4 Photographs of Test Facility
t-=LL. ~
I 0
a.. c u..:«~ L&J LLCD :I: UJ
36 f20 90
32
28
24
20
16
12
8
4
o 200 400 600 800
FLOW GPM
Fig. 5 Pump Character,istics
49
1000
EFF.110 80
100 70
6090
5080
40
30
60
20
50
10
40-0
1200
5 10 15 20 25 300
II
DIMENSIONLESS DISCHARGE Q DIM. x 103
45
B.H.~
·0-- 40 80 15)(
:Eca.. 35 70:J:m0:::LLJ
14 t\l03= 30 600a. )(
lLJ ~C/)~ C0: 0
0 25 50 ::I:::t: >-
0 CL&J 'Z «~
LIJ I.LJ
« 0 J:cc 20 La..
40 13m U)
IJ.a VJC/)
LL1 lJJ...JC/)ZW
...J 30 0z (J)0 zen I.LIz ::Ew 10 20 12 C:E0
10
Fig. '6 Dimensionless Pump Characteristics
50
U1t---'"
ATMOSPHERE
k!) CONTROL VALVE
kY- VALVE
DREDGE
PUMP
Drawing No. 310.19
ACCUM-uLAToR
LEVEL TROL
uI
COMPRESSOR
~TANK B
Fig. 7 Schematic Diagram of Facility for Test Series No.2
a) Accumulator and Level-Trol
b) Vacuum Pump and Flow Meter
Figo 8 Photographs of Test Facility
-52-
LnW
Tank 8
SiJct."... '0" A.
7/)6
PressureGage
Air FlowMeter
~ ,,-Compressor
1/211
Pipe
SKETCH OF SINGLE PORT INJECTION SYSTEM
Fig. 9 Single Port Injection System
Not to Scale:No. 310.20
..Q)
0(\1u .(1)0-oro~.....o 0zz
-J
c: en0 ::)- ~>. e
ZQ)a: +J
~en~en
0- s::« 0.r-1
Z 4J
0(JQ)
9 -,.-,e::
...IH
« ~.r-1
- CD <-c Ll-e::
CD0
0 0r-Ir-I
r5ct1~
t- O
LLIr-I
~.
b.OC/) •.-1
~
54
lJ1lJ1
Tank B
Pull toOpen
SlICfiOI) .
~,oe
QuickAction Valve
2" Pipe
SUBMERGED VALVE INJECTION SYSTEM
Fig. 11 Submerged Valve Injection System
PressureGage
Flowmeter
No. 310.22
16
14
12
t\I0
)( 10:IE
lTt0
0\I
8I
)"-
~ ~5%
~~60/0
4
4 6 8 ,10 14
Q01M xl"03
16 18
Fig. 12 Test Series No. 1 - Head versus Dischargeas Function of Discharge Air Percent
16
14
I 2t- • ~ -. '" 00/0 Air• ~9~. I... 0
• •~ I ~ •
o-: 10
~ Z~ I "1;%8
6
••
180/0
4
4 6 8 10 12 14 16 18 20 22
Q DIMX 10 3
Fig. 13 Test Series No. 1 - Head Discharge as Functionof Suction Air Percent
16
6
14~ \ ITest 41 A
-- Test 47 0
Test 49 [J
I \ \Breakpoint 6
12\.
N
0)( 10:i
U1a
(X) Z
8
4
2 4 6 8 10 12 14 16 18 20 22
A IR % (SUCTION)
Fig. 14 Head versus Suction Air Percent
12 18
lOr- -1160 0
0 0
!zI ~ L' 0
~ 81- ~t'\ -114~
<C
~t-=
6~ -112zIJJ
lJ1 U\0 a::
IJJa..a:::
4~ -lID<t
2 8
0 1 I I I I I I I I , '64 6 8 10 12 14 16 18 20 22
Q01M
x 103 (AIR % = 0)
Fig. 15 Air Percent at Break Point versus QDIM at ZeroAir Percent
Q"\o
1..4
1.2
1.0
NPSHu =... _._-_...... 0 8H .
0.6
0.4
o Test No. 74 No Air
[] Test No. 41 Test Series No. I
4 Test No. 64 Test Series No.2
2220181614
QOIM xI03
1210·860.2' , I I , , , I , ,
4
Fig. 16 Net Positive Suction Head versus DimensionlessDischarge
HDIM
g
H
N
D
QDIM
Q
EFE
WHP
Y
BHP
gpm
n
u
d
P
~
RPM
psi
cfm
cfs
p
APPENDIX A
NOMENCIA TURE
dimensionless head, gH/(N2 n2 )
acceleration of gravity ft./sec. 2
total dynamic head, ft. of fluid
rotational speed, radians/sec.
impeller diameter, ft.
dimensionless discharge, Q/(ND3 )
discharge, cubic ft./sec.
efficiency
water horsepower, yQH
unit weight, pounds per cubic foot
brake horsepower
gallons per minute
rotational speed, revolutions per minute
standard cubic feet per minute
Reynolds number
velocity, feet per second
pipe diameter
fluid density, slugs/ft. 3
dynamic viscosity, Ib.-sec./ft. 2
revolutions per minu~e
degrees centigrade
pounds per square inch
cubic feet per minute
cubic feet per second
p~essure, pounds per square foot
-61-
APPENDIX B
COMPUTER PROGRAM
SEQ LABL TYP STATEMENT
10 SGU eRD RPM, ZO, HSTAR" HAT, HV, ATEMP, WTEMP, N, TEST11 D = 8420 RUN = 140 PL PROJECT 310 ARMY PUMP TEST AND AIR PERCENT50 PVL TEST, RPM60 RUS CRD QGPMT70 CRD HLS, HRS, HLl, HRl, HL2, HR2, AMPS, VOLTS,71 IAP, U72 SGS = 13.5580 QCFST = 2.228E-3*QGPMT90 BHP = .001167*AMPS*VOLTS
100 SUMH = HLI + HR1 + HL2 + HR2110 PDW = .1046*(SUMH - ZO) + .00833*(HR2 - HS~R)
120 PSW = SGS*(HLS + HRS)/120130 SAF = UAF"/(SQRT. «HAT*.4912 + IAP)*11.8l131 (273 + ATE:MP)140 SAFX = SAF*O.2*(WTEMP + 273)/60150 DAFCFS = SAFX/ (HA T*l. 133 + PDW)151 PAFCFS = SAFX/ (HAT*1.133 - PSW)160 QCFSW = QCFST - DAFCFS161 SQCFST = QCFSW + PAFCFS180 VELHS = 1.277*SQCFST*SQCFST190 VELHD = 2.042*QCFST*QCFST200 H = PDW + PSW + VELHD - VELHS + 1.07210 WHP = .11345*QCFSW*H220 EFF = WHP/BHP230 HDIM = 27.05E6*H/(RPM*RPM*D*D)240 QDIM = .846E7*QCFSW/(RPM*D**3)250 BHPDIM = ·2. 013E15*BHP / (RPM**3*D**5)260 NPSH = HAT*1.133 - PSW - HV + VELHS270 SIGMA = NPSH/H290 AIRP = 1.67"lcSAF/QCFSW291 AIRPD = DAFCFS/QCFSW292 AIRPS = PAFCFS/QCFSW300 QRATIO = SQCFST/QCFST310 WMD = 62.4*QCFSW/QCFST311 PDWM = PDW*62.4/W:MD312 WMS = 62.4*QCFSW/SQCFST313 PSW"M = PSW*62 .~/WMS
320 lIM = PDWM + PSWM + VELHD - VELHS + 1.07321 HDI:MM = HDIM*HM/H325 WHPM = O.11345*HM*QCFSW326 EFFM = WHPM/BHP330 PVL RUN, QGPMT, BHP, PDW, PSW', VELHD, ·VEUlS, H,331 WHP, EFF, NPSH, SIGMA, QCFST, QCFSW, SQCFST,332 DAFCFS, PAFCFS, QRATIO, AIRP, AIRPD, AIRPS,333 .PDWM, PSWM, HM, WHPM, EFFM, HDIM" QDIM, HDIMM350 RUN = RUN + 1351 NT = N - RUN (RUS, RUS, SGU)360 END END OF PROGRAM
-62-
REFERENCES
1. Herbich, J. B. and W. P. IsaacsGAS REMOVAL SYSTEMS PART I: LITERATURE SURVEY AND FORMUIATIONOF TEST PROGRAM, Lehigh University, Fritz Engineering LaboratoryReport No. 310.3, June, 1964.
2. Shinda1a, A. and J. B. HerbichGAS REMOVAL SYSTEMS PART II: FORMUIATION OF TEST PROGRAMDEVELOPMENT OF FACILITY LAYOUT, Lehigh University, Fritz Engineering Laboratory R~port No. 310.7, February, 1965.
3. Stepanoff, A. J.CENTRIFUGAL AND AXIAL FLOW PU:MPS, John Wiley & Sons, New York,1957.
4. Bewtra, J. K.AIR DIFFUSION STUDIES, Journal of Water Pollution ControlFederation, Vol. 3 , October, 1964.
5.LEWIZ PROGRAMMING MANUAL, Lehigh University, Computing Center,1963.
6. Miller, R. E., S. C. Ko, and J. R. AdamsGAS REMOVAL SYSTEM ASSOCIATED WITH DREDGE PUMP: PHASE C,Lehigh University, Fritz Engineering Laboratory Report No.310.19, April, 1967.
-63-