Embed Size (px)
Citation preview

including the Annual Financial Report
Reference Document2009


2009 Reference Document(Unoffi cial English language translation)
This Reference Document was fi led with the French Financial Market Authority (Autorité des marchés fi nanciers, or “AMF”) on March 24, 2010 in accordance with Article 212-13 of its General Regulations. It may be used for the purpose of a fi nancial transaction provided it is accompanied by a transaction notice approved by the AMF. This document was prepared by the issuer and its signatories are liable for its content.
Copies of this Reference Document are available for free from Technip, at 6-8, allée de l’Arche–92973 Paris-La Défense Cedex–France, and on Technip’s website (www.technip.com) and the AMF’s website (www.amf-france.org).

002 2009 Reference Document
Contents Foreword 4
1 Person responsible for the Reference Document 51.1. Person responsible for the Reference Document 51.2. Statement by person responsible for the Reference Document 5
2 Statutory Auditors 62.1. Principal Auditors 62.2. Alternate Auditors 62.3. Statement of Statutory Auditors’ Fees 6
3 Selected Financial Information 73.1. General Presentation of the Group 73.2. Selected Financial Information 8
4 Risk Factors 104.1. Risks relating to the Group and its activities 104.2. Risks relating to the Group’s industry 134.3. Regulatory and Legal Risks 144.4. Industrial and environmental risks 164.5. Credit/counter-party risk 174.6. Liquidity risk 184.7. Market risks 194.8. Risk management policy and insurance 22
5 Information on the Company and the Group 265.1. History and Development 265.2. Investments 30
6 Overview of the Group’s Activities 316.1. Technip’s business in 2009 326.2. Group business environment 376.3. Description of project strategy 396.4. The Group’s business segments 416.5. Suppliers 456.6. Environment 45
7 Organizational Structure 497.1. Simplifi ed Group Organizational Structure as of December 31, 2009 497.2. Subsidiaries and Investments 49
8 Property, Plant and Equipment 518.1. Signifi cant existing or planned Property, Plant and Equipment and major related Expenses 518.2. Environmental Matters that may impact the Group’s Use of its Property, Plant and Equipment 55
9 Review of Financial Position and Financial Performance 56 Comments 569.1. Presentation of the Consolidated Financial Statements included in the Reference Document 579.2. Changes in Backlog and Presentation of Revenues 589.3. Presentation of Operating Costs 619.4. Comments on the Results of Operations for the year ended December 31, 2009,
compared to the year ended December 31, 2008 629.5. Changes in Balance Sheet and Financial Position between the year ended December 31, 2009
and the year ended December 31, 2008 65
10 Capital Resources 6810.1. Comparison of Net Cash Position and Cash Flows for the year ended December 31, 2009
and the year ended December 31, 2008 6810.2. Comparison of Shareholders’ Equity and Financing between the year ended December 31, 2009
and the year ended December 31, 2008 69
11 Research and Development, Patents and Licenses 7011.1. Research and Development 7011.2. Patents and Licenses 7111.3. Technological Partnerships 7111.4. Acquisitions 72
12 Information on Trends 7312.1. Prospects 7312.2. Financial Communications Agenda 74
13 Profi t Estimates and Forecasts 75

0032009 Reference Document
14 Administrative, Management, Supervisory and General Management Bodies 7614.1. Board of Directors 7714.2. The Company’s Management 8114.3. Committees of the Board of Directors 8114.4. Confl icts of Interest at the Level of Administrative, Management, Supervisory and General Management Bodies 82
15 Compensation and Benefi ts 8315.1. Compensation and other benefi ts granted to Directors 8315.2. Compensation and Retirement Commitments of the Group’s principal Executives 88
16 Operation of Administrative and Management Bodies 8916.1. Description of the Role and Practices of the Board of Directors 8916.2. Company’s Management 9116.3. Role and Practices of the Committees of the Board of Directors 9216.4. Corporate Governance: Evaluation of the Boardof Directors and of the Board’s Committees 9616.5. Contracts between the Board Members and the Company or one of the Group’s company 96
17 Employees 9717.1. Workforce 9717.2. Participating interests and share subscription or purchase options held by members
of the Board of Directors and other corporate offi cers (mandataires sociaux) 10317.3. Arrangements for involving the employees in the capital of the Company 108
18 Principal Shareholders 11018.1. The Company’s Principal Shareholders 11018.2. Shareholder Voting Rights 11318.3. Controlling Interest 11318.4. Agreements that may result in a Change of Control 113
19 Related Party Transactions 11419.1. Main Related Party Transactions 11419.2. Statutory Auditors’ Special Report on Certain Related Party Transactions for the Financial Year 2009 115
20 Financial Information on the Company’s Assets, Financial Situation and Results 11720.1. Consolidated Financial Statements 11820.2. Statutory Financial Statements 17720.3. Dividend Distribution Policy 19520.4. Legal and Arbitration Procedures 19520.5. Signifi cant Changes in the Financial or Commercial Position 196
21 Additional Information 19721.1. Share capital 19721.2. Articles of Association 202
22 Signifi cant Contracts 20522.1. Bond issue 2004-2011 20522.2. Deep Energy Financing 20522.3. Skandi Arctic Financing 20522.4. BNDES Financing 20522.5. Revolving Credit Agreement and Bilateral Lines 20622.6. Private Placement with Deferred Payment 206
23 Information from Third Parties, Declarations Filed by Experts and Declarations of Interest 207
24 Publicly Available Documents 208
25 Information on Equity Interests 209
AnnexAnnex A: Offi ces held by Board Members, current at December 31, 2009 and over the past fi ve years 210Annex B: Financial Results of the Last Five Years as of December 31, 2009 212Annex C: Report of the Chairman of the Board of Directors to the Shareholders’ Meeting on the Composition,
Conditions of the Preparation and Organization of the Board of Directors’ Work, the Internal Control Procedures and Risk Management Procedures Put in Place by the Company (Article L. 225-37 of the French Commercial Code) 213
Annex D: Statutory Auditors’ report, prepared in accordance with article L. 225-235 of the French Commercial Code on the report prepared by the Chairman of the Board of Technip 228
Annex E: Agenda, Presentation of the Resolutions and Proposed Resolutions 230Annex F: Annual Information Document 243Annex G: Reconciliation Tables 246Annex H: Glossary 249

004 2009 Reference Document
Foreword
When used in this Reference Document, the terms “Technip” and “Group” refer collectively to Technip SA and to all of its directly and indirectly consolidated subsidiaries located in France and outside France.
In this Reference Document, the terms “Company” and “issuer” refer exclusively to Technip SA, the Group’s parent company.
In accordance with Article 28 of European Commission regulation no. 809/2004 of April 29, 2004, the following information is incorpo-rated by reference in this document:
the 2008 consolidated fi nancial statements and statutory fi nancial statements, as well as the Statutory Auditors’ reports for the �
fi nancial year ended December 31, 2008 included in Sections 20.1 and 20.2 of the 2008 Reference Document dated March 25, 2009 fi led with the French Financial Markets Authority (hereinafter, the “AMF”) under no. D.09-0152;
the key fi nancial information, the Company’s and the Group’s Management Reports and all of the fi nancial information for the fi nancial �
year ended December 31, 2008 included in Section 3 as well as the sections mentioned in the Reconciliation Tables in Annex G of the 2008 Reference Document dated March 25, 2009 fi led with the AMF under no. D.09-0152;
the 2007 consolidated fi nancial statements and the 2007 Company fi nancial statements, as well as the Statutory Auditors’ reports for �
the fi nancial year ended December 31, 2007 included in parts III, IV, V of the 2007 Reference Document dated March 25, 2008 fi led with the AMF under no. D.08-0146;
the key fi nancial information, the Company’s and the Group’s Management Reports and all of the fi nancial information for the fi nancial �
year ended December 31, 2007 included in parts I and II of the 2007 Reference Document dated March 25, 2008 fi led with the AMF under no. D.08-0146.
The sections of these documents that are not included are either not relevant to investors or are addressed in another part of the Reference Document.
This Reference Document contains all of the information from the Management Report of the Board of Directors.

0052009 Reference Document
1.1. Person responsible for the Reference Document . . . . . . . . . . . . . . . . . . . . . . . . . . . . . . . . . . . . . . . . . . . . . . . . . . . . . . . . . . . . . . . . . . . . 5
1.2. Statement by person responsible for the Reference Document . . . . . . . . . . . . . . . . . . . . . . . . . . . . . . . . . . . . . . . . . . . . . 5
Person responsible for the Reference Document
1
1.1. Person responsible for the Reference Document
The person responsible for the Reference Document is Thierry Pilenko, the Company’s Chairman and Chief Executive Offi cer.
1.2. Statement by person responsible for the Reference Document
To the best of my knowledge, and after taking every reasonable measure for such purpose, I attest that the information contained herein gives a true and fair view of the facts and that no material aspects of such information have been omitted.
I confi rm that, to my knowledge, the fi nancial statements have been prepared in compliance with applicable accounting standards and are a true representation of the assets, fi nancial position and profi ts of the Company and all consolidated entities and that the Management Report as referred to in the Table of Reconciliation in Annex G of this Reference Document is a true representation of the change in business, profi ts and the fi nancial position of the Company and all consolidated entities as well as the description of the main risks and uncertainties facing them.
I have obtained a work completion document from the Auditors (lettre de fi n de travaux), in which they indicate that they have verifi ed the information relating to the fi nancial situation and the fi nancial statements presented in this Reference Document and carried out a review of the entire Reference Document. The Statutory Auditors have issued reports on the fi nancial information which are included in sections 20.1.1 and 20.2.1 of this 2009 Reference Document. These reports were issued without reservation and contain one observation concerning an ongoing procedure relating to an old project in Nigeria managed by a joint venture. The Statutory Auditors have issued reports on the 2008 historical fi nancial information which are included in sections 20.1.1 and 20.2.1 of the 2008 Reference Document fi led with the AMF on March 25, 2009. These reports were issued without reservation and contain the same identical observation.
Thierry Pilenko
Chairman and Chief Executive Offi cer

006 2009 Reference Document
2.1. Principal Auditors . . . . . . . . . . . . . . . . . . . . . . . . . . . . . . . . . . . . . . . . . . . . . . . . . . . . . . . . . . . . . . . . . . . . . . . . . . . . . . . . . . . . . . . . . . . . . . . . . . . . . . . . . . . . . . . . . . . . . . . . . . . . . . . 6Ernst & Young et Autres, represented by Nour-Eddine Zanouda . . . . . . . . . . . . . . . . . . . . . . . . . . . . . . . . . . . . . . . . . . . . . . . . . . . . . . . . . . . . . . . . . .6PricewaterhouseCoopers Audit, represented by Louis-Pierre Schneider . . . . . . . . . . . . . . . . . . . . . . . . . . . . . . . . . . . . . . . . . . . . . . . . . . . . . . .6
2.2. Alternate Auditors . . . . . . . . . . . . . . . . . . . . . . . . . . . . . . . . . . . . . . . . . . . . . . . . . . . . . . . . . . . . . . . . . . . . . . . . . . . . . . . . . . . . . . . . . . . . . . . . . . . . . . . . . . . . . . . . . . . . . . . . . . . . . 6Yves Nicolas . . . . . . . . . . . . . . . . . . . . . . . . . . . . . . . . . . . . . . . . . . . . . . . . . . . . . . . . . . . . . . . . . . . . . . . . . . . . . . . . . . . . . . . . . . . . . . . . . . . . . . . . . . . . . . . . . . . . . . . . . . . . . . . . . . . . . . . . . . . . . . . . .6Auditex . . . . . . . . . . . . . . . . . . . . . . . . . . . . . . . . . . . . . . . . . . . . . . . . . . . . . . . . . . . . . . . . . . . . . . . . . . . . . . . . . . . . . . . . . . . . . . . . . . . . . . . . . . . . . . . . . . . . . . . . . . . . . . . . . . . . . . . . . . . . . . . . . . . . . . . . .6
2.3. Statement of Statutory Auditors’ Fees . . . . . . . . . . . . . . . . . . . . . . . . . . . . . . . . . . . . . . . . . . . . . . . . . . . . . . . . . . . . . . . . . . . . . . . . . . . . . . . . . . . . . . . 6
2Statutory Auditors
2.1. Principal Auditors
Ernst & Young et Autres, represented by Nour-Eddine Zanouda*Member of the Compagnie Régionale de Versailles
41, rue Ybry–92576 Neuilly-sur-Seine Cedex (France)
Date of fi rst appointment: 1986
Expiry date of current appointment: at the close of the Shareholders’ Meeting convened to approve the fi nancial statements for the 2009 fi nancial year which will be held on April 29, 2010. The renewal of this appointment will be proposed at the Shareholders’ Meeting.
PricewaterhouseCoopers Audit, represented by Louis-Pierre SchneiderMember of the Compagnie Régionale de Versailles
63, rue de Villiers–92208 Neuilly-sur-Seine Cedex (France)
Date of fi rst appointment: 2004
Expiry date of current appointment: at the close of the Shareholders’ Meeting convened to approve the fi nancial statements for the 2009 fi nancial year which will be held on April 29, 2010. The renewal of this appointment will be proposed at the Shareholders’ Meeting.
* Ernst & Young et Autres was represented by Gilles Puissochet, who executed 2007 and 2008 fi nancial statements.
2.2. Alternate Auditors
Yves NicolasMember of the Compagnie Régionale de Versailles
63, rue de Villiers–92208 Neuilly-sur-Seine (France)
Date of fi rst appointment: 2004
Expiry date of current appointment: at the close of the Share holders’ Meeting convened to approve the fi nancial statements for the 2009 fi nancial year which will be held on April 29, 2010. The renewal of this appointment will be proposed at the Shareholders’ Meeting.
AuditexMember of the Compagnie Régionale de Versailles
11, allée de l’Arche–Faubourg de l’Arche–92037 La Défense Cedex (France)
Date of fi rst appointment: 2007
Expiry date of current appointment: at the close of the Shareholders’ Meeting convened to approve the fi nancial statements for the 2009 fi nancial year which will be held on April 29, 2010. The renewal of this appointment will be proposed at the Shareholders’ Meeting.
2.3. Statement of Statutory Auditors’ Fees
See the statement of Statutory Auditors’ fees in Note 34 to the Consolidated Financial Statements as of December 31, 2009 included in Section 20.1 of this Reference Document.

0072009 Reference Document
3.1. General Presentation of the Group. . . . . . . . . . . . . . . . . . . . . . . . . . . . . . . . . . . . . . . . . . . . . . . . . . . . . . . . . . . . . . . . . . . . . . . . . . . . . . . . . . . . . . . . . . . . . . 7Subsea . . . . . . . . . . . . . . . . . . . . . . . . . . . . . . . . . . . . . . . . . . . . . . . . . . . . . . . . . . . . . . . . . . . . . . . . . . . . . . . . . . . . . . . . . . . . . . . . . . . . . . . . . . . . . . . . . . . . . . . . . . . . . . . . . . . . . . . . . . . . . . . . . . . . . . . . . .7Offshore . . . . . . . . . . . . . . . . . . . . . . . . . . . . . . . . . . . . . . . . . . . . . . . . . . . . . . . . . . . . . . . . . . . . . . . . . . . . . . . . . . . . . . . . . . . . . . . . . . . . . . . . . . . . . . . . . . . . . . . . . . . . . . . . . . . . . . . . . . . . . . . . . . . . . . .7Onshore . . . . . . . . . . . . . . . . . . . . . . . . . . . . . . . . . . . . . . . . . . . . . . . . . . . . . . . . . . . . . . . . . . . . . . . . . . . . . . . . . . . . . . . . . . . . . . . . . . . . . . . . . . . . . . . . . . . . . . . . . . . . . . . . . . . . . . . . . . . . . . . . . . . . . . .7
3.2. Selected Financial Information. . . . . . . . . . . . . . . . . . . . . . . . . . . . . . . . . . . . . . . . . . . . . . . . . . . . . . . . . . . . . . . . . . . . . . . . . . . . . . . . . . . . . . . . . . . . . . . . . . . . . . 8Consolidated Income Statement Data for 2009 and 2008 (IFRS) . . . . . . . . . . . . . . . . . . . . . . . . . . . . . . . . . . . . . . . . . . . . . . . . . . . . . . . . . . . . . . . .8Other Financial Information Derived from the Consolidated Income Statement for 2009 and 2008 . . . . . . . . .8Information by Business Segment. . . . . . . . . . . . . . . . . . . . . . . . . . . . . . . . . . . . . . . . . . . . . . . . . . . . . . . . . . . . . . . . . . . . . . . . . . . . . . . . . . . . . . . . . . . . . . . . . . . . . . . . . . . . . . . .9Consolidated Balance Sheet Data as of December 31, 2009 and 2008 . . . . . . . . . . . . . . . . . . . . . . . . . . . . . . . . . . . . . . . . . . . . . . . . . . . . . . .9
3Selected Financial Information
3.1. General Presentation of the Group
Technip is a world leader in project management, engineering and construction for the oil and gas industry, with a comprehensive portfolio of innovative solutions and technologies, and consoli-dated revenues of €6.5 billion in 2009.
As of February 28, 2010, Technip employed a regular workforce of 23,000 people, representing 101 nationalities. The Group is present in close to 50 countries on fi ve continents.
As of February 28, 2010, its production facilities (fl exible pipes, umbilicals), manufacturing yards and spoolbases were located in France, Brazil, the United Kingdom, Norway, the United States, Finland and Angola and by the second half of 2010 will also be located in Malaysia. As of February 28, 2010, the Group’s fl eet comprised 17 vessels specialized in subsea pipelay, subsea construction, diving support and exploration. Two additional vessels are expected to join the fl eet by 2011.
Technip possesses integrated capacity and recognized expertise in subsea infrastructures (Subsea), offshore platforms (Offshore) and onshore mega-complexes (Onshore). The Group is active in three segments of the worldwide oil and gas industry.
SubseaIn 2009, the Subsea segment generated revenues of €2,866.1 million, representing 44.4% of consolidated 2009 revenues. With respect to hydrocarbon field development, Technip’s subsea activities include the design, manufacture and installation of rigid and fl exible subsea pipelines and umbilicals. Technip is a key operator on this market as a result of its Research and Development investments. Technip offers a wide range of innovative subsea pipe technologies and solutions, and has leading industrial and operational assets. Technip has two fl exible pipe manufacturing plants, three umbilical production units, fi ve reeled rigid pipe spoolbases and a constantly evolving fl eet of specialized
vessels for pipeline installation and subsea construction, strategi-cally deployed in the world’s major offshore markets.
OffshoreWith revenues of €565.0 million in 2009, representing 8.7% of the Group’s 2009 consolidated revenues, the Offshore segment including engineering, development and construction activities in relation of Offshore for oil and gas platforms in both shallow water (fi xed platforms such as TPG 500 and Unideck®) or deepwater (fl oating platforms such as Spar, semi-submersible platforms and FPSOs). Technip devotes signifi cant resources annually to research and development and is a leader in fl oatover technology. With the development of fl oating LNG, Technip continues to strengthen its offshore expertise.
OnshoreIn 2009, the Onshore segment generated revenues of €3,024.9 million, representing 46.9% of consolidated revenues. This segment is active in engineering and construction for the entire range of onshore facilities for the oil and gas industry (refining, hydrogen, sulphur, gas treatment and liquefaction, onshore pipelines), petrochemical (ethylene, aromatics, olefi ns, polymers) and non-oil activities (mining and metallurgical projects, biofuels and renewable energy). Technip holds several proprietary technologies and is the leader in the design and construction of LNG and gas treatment plants as well as hydrogen and syngas units. The Group is a worldwide leader in refi ning and petrochemical units.
The Group is strongly committed to developing innovative technol-ogies and reinforcing its expertise in each of its business segments.

008 2009 Reference Document
Selected Financial Information
3.2. Selected Financial Information3
Technip is active in increasingly ambitious, complex and chal-lenging projects involving deep water, extreme climatic conditions, large-scale projects, non-conventional resources and higher envi-ronmental performance standards. The Group is thus a key actor in the development of sustainable solutions to the challenges facing the energy sector in the 21st century.
At February 28, 2010, its roster of clients included international oil companies, such as ExxonMobil, Shell, ConocoPhilips, Total, BP, Chevron and Statoil as well as a large number of national companies, such as Saudi Aramco, Petronas, Petrobras, Petrochina,
ADGAS and Qatar Petroleum. Its fi ve main clients represented 32.3% of consolidated revenues in 2009 compared to 27.3% in 2008, and the revenues generated from its ten main clients represented 44.5% of consolidated revenues in 2009 compared to 42.4% in 2008.
The top fi ve projects represented 15% of consolidated revenues in 2009 compared to 20% in 2008. The top ten projects generated 25% of consolidated revenues in 2009 compared to 29% in 2008.
3.2. Selected Financial Information
The table below presents selected consolidated fi nancial data that have been extracted or derived from the Consolidated Financial Statements for the two years ended December 31, 2009 and 2008, prepared in accordance with International Financial Accounting Standards.
This note should be read in conjunction with the Consolidated Financial Statements included in Section 20.1 of this Reference Document.
Consolidated Income Statement Data for 2009 and 2008 (IFRS)
12 months
In millions of Euro 2009 2008
Revenues 6,456.0 7,481.4
Operating Income/(Loss) from Recurring Activities 676.7 656.9
Operating Income/(Loss) 429.2 656.9
Net Income/(Loss) for the Year 178.5 454.3
Attributable to:
Shareholders of the Parent Company 170.4 448.0
Minority Interests 8.1 6.3
Other Financial Information Derived from the Consolidated Income Statement for 2009 and 2008
12 months
In millions of Euro 2009 2008
Revenues 6,456.0 7,481.4
Gross Margin 1,141.9 1,139.7
(in % of Revenues) 17.7% 15.2%
Operating Income/(Loss) from Recurring Activities 676.7 656.9
(in % of Revenues) 10.5% 8.8%
Operating Income/(Loss) (1) 429.2 656.9
(in % of Revenues) 6.6% 8.8%
Net Income/(Loss) for the Year 178.5 454.3
Amortization and Depreciation for the Year 224.1 188.6
Earnings per Share (in Euro) 1.60 4.27
Diluted Earnings per Share (in Euro) 1.59 4.25
(1) This amount includes a €245.0 million non-recurring charge in relation with the provision for TSKJ litigation.
0092009 Reference Document
Selected Financial Information
3.2. Selected Financial Information 3
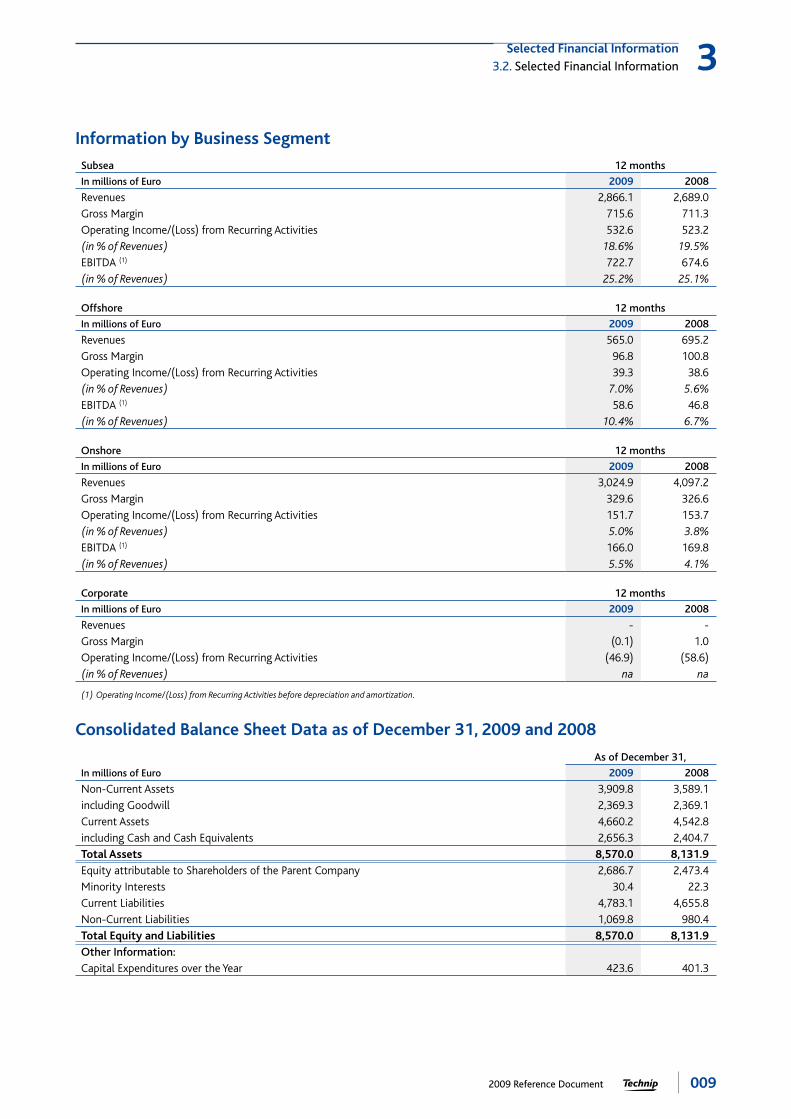
Information by Business Segment
Subsea 12 months
In millions of Euro 2009 2008
Revenues 2,866.1 2,689.0
Gross Margin 715.6 711.3
Operating Income/(Loss) from Recurring Activities 532.6 523.2
(in % of Revenues) 18.6% 19.5%
EBITDA (1) 722.7 674.6
(in % of Revenues) 25.2% 25.1%
Offshore 12 months
In millions of Euro 2009 2008
Revenues 565.0 695.2
Gross Margin 96.8 100.8
Operating Income/(Loss) from Recurring Activities 39.3 38.6
(in % of Revenues) 7.0% 5.6%
EBITDA (1) 58.6 46.8
(in % of Revenues) 10.4% 6.7%
Onshore 12 months
In millions of Euro 2009 2008
Revenues 3,024.9 4,097.2
Gross Margin 329.6 326.6
Operating Income/(Loss) from Recurring Activities 151.7 153.7
(in % of Revenues) 5.0% 3.8%
EBITDA (1) 166.0 169.8
(in % of Revenues) 5.5% 4.1%
Corporate 12 months
In millions of Euro 2009 2008
Revenues - -
Gross Margin (0.1) 1.0
Operating Income/(Loss) from Recurring Activities (46.9) (58.6)
(in % of Revenues) na na
(1) Operating Income/(Loss) from Recurring Activities before depreciation and amortization.
Consolidated Balance Sheet Data as of December 31, 2009 and 2008
As of December 31,
In millions of Euro 2009 2008
Non-Current Assets 3,909.8 3,589.1
including Goodwill 2,369.3 2,369.1
Current Assets 4,660.2 4,542.8
including Cash and Cash Equivalents 2,656.3 2,404.7
Total Assets 8,570.0 8,131.9
Equity attributable to Shareholders of the Parent Company 2,686.7 2,473.4
Minority Interests 30.4 22.3
Current Liabilities 4,783.1 4,655.8
Non-Current Liabilities 1,069.8 980.4
Total Equity and Liabilities 8,570.0 8,131.9
Other Information:
Capital Expenditures over the Year 423.6 401.3

010 2009 Reference Document
4.1. Risks relating to the Group and its activities . . . . . . . . . . . . . . . . . . . . . . . . . . . . . . . . . . . . . . . . . . . . . . . . . . . . . . . . . . . . . . . . . . . . . . .10
4.2. Risks relating to the Group’s industry . . . . . . . . . . . . . . . . . . . . . . . . . . . . . . . . . . . . . . . . . . . . . . . . . . . . . . . . . . . . . . . . . . . . . . . . . . . . . . . . . . . .13
4.3. Regulatory and Legal Risks . . . . . . . . . . . . . . . . . . . . . . . . . . . . . . . . . . . . . . . . . . . . . . . . . . . . . . . . . . . . . . . . . . . . . . . . . . . . . . . . . . . . . . . . . . . . . . . . . . . . . . . . .14
4.4. Industrial and environmental risks . . . . . . . . . . . . . . . . . . . . . . . . . . . . . . . . . . . . . . . . . . . . . . . . . . . . . . . . . . . . . . . . . . . . . . . . . . . . . . . . . . . . . . . . . .16
4.5. Credit/counter-party risk. . . . . . . . . . . . . . . . . . . . . . . . . . . . . . . . . . . . . . . . . . . . . . . . . . . . . . . . . . . . . . . . . . . . . . . . . . . . . . . . . . . . . . . . . . . . . . . . . . . . . . . . . . . .17
4.6. Liquidity risk. . . . . . . . . . . . . . . . . . . . . . . . . . . . . . . . . . . . . . . . . . . . . . . . . . . . . . . . . . . . . . . . . . . . . . . . . . . . . . . . . . . . . . . . . . . . . . . . . . . . . . . . . . . . . . . . . . . . . . . . . . . . . . . . . . . .18
4.7. Market risks . . . . . . . . . . . . . . . . . . . . . . . . . . . . . . . . . . . . . . . . . . . . . . . . . . . . . . . . . . . . . . . . . . . . . . . . . . . . . . . . . . . . . . . . . . . . . . . . . . . . . . . . . . . . . . . . . . . . . . . . . . . . . . . . . . . . .194.7.1. Currency risk . . . . . . . . . . . . . . . . . . . . . . . . . . . . . . . . . . . . . . . . . . . . . . . . . . . . . . . . . . . . . . . . . . . . . . . . . . . . . . . . . . . . . . . . . . . . . . . . . . . . . . . . . . . . . . . . . . . . . . . . . . . . . . . . . . . . . . . . . . . .194.7.2. Rate risk . . . . . . . . . . . . . . . . . . . . . . . . . . . . . . . . . . . . . . . . . . . . . . . . . . . . . . . . . . . . . . . . . . . . . . . . . . . . . . . . . . . . . . . . . . . . . . . . . . . . . . . . . . . . . . . . . . . . . . . . . . . . . . . . . . . . . . . . . . . . . . . . . . .204.7.3. Stock risk and other fi nancial instruments . . . . . . . . . . . . . . . . . . . . . . . . . . . . . . . . . . . . . . . . . . . . . . . . . . . . . . . . . . . . . . . . . . . . . . . . . . . . . . . . . . . . . . . . . . . . . .214.7.4. Raw materials risk. . . . . . . . . . . . . . . . . . . . . . . . . . . . . . . . . . . . . . . . . . . . . . . . . . . . . . . . . . . . . . . . . . . . . . . . . . . . . . . . . . . . . . . . . . . . . . . . . . . . . . . . . . . . . . . . . . . . . . . . . . . . . . . . . . . .21
4.8. Risk management policy and insurance . . . . . . . . . . . . . . . . . . . . . . . . . . . . . . . . . . . . . . . . . . . . . . . . . . . . . . . . . . . . . . . . . . . . . . . . . . . . . . . .224.8.1. Generalities. . . . . . . . . . . . . . . . . . . . . . . . . . . . . . . . . . . . . . . . . . . . . . . . . . . . . . . . . . . . . . . . . . . . . . . . . . . . . . . . . . . . . . . . . . . . . . . . . . . . . . . . . . . . . . . . . . . . . . . . . . . . . . . . . . . . . . . . . . . . . .224.8.2. Crisis management . . . . . . . . . . . . . . . . . . . . . . . . . . . . . . . . . . . . . . . . . . . . . . . . . . . . . . . . . . . . . . . . . . . . . . . . . . . . . . . . . . . . . . . . . . . . . . . . . . . . . . . . . . . . . . . . . . . . . . . . . . . . . . . . . .224.8.3. Management of risks relating to the Group and its activities. . . . . . . . . . . . . . . . . . . . . . . . . . . . . . . . . . . . . . . . . . . . . . . . . . . . . . . . . . . . . . . . . .224.8.4. Raw materials risk management. . . . . . . . . . . . . . . . . . . . . . . . . . . . . . . . . . . . . . . . . . . . . . . . . . . . . . . . . . . . . . . . . . . . . . . . . . . . . . . . . . . . . . . . . . . . . . . . . . . . . . . . . . . . . .224.8.5. Management of maritime risk . . . . . . . . . . . . . . . . . . . . . . . . . . . . . . . . . . . . . . . . . . . . . . . . . . . . . . . . . . . . . . . . . . . . . . . . . . . . . . . . . . . . . . . . . . . . . . . . . . . . . . . . . . . . . . . . .234.8.6. Best practices / Security management for Large Projects. . . . . . . . . . . . . . . . . . . . . . . . . . . . . . . . . . . . . . . . . . . . . . . . . . . . . . . . . . . . . . . . . . . . . . . .234.8.7. Management of air travel risk . . . . . . . . . . . . . . . . . . . . . . . . . . . . . . . . . . . . . . . . . . . . . . . . . . . . . . . . . . . . . . . . . . . . . . . . . . . . . . . . . . . . . . . . . . . . . . . . . . . . . . . . . . . . . . . . . .234.8.8. Management of risks related to information and information systems . . . . . . . . . . . . . . . . . . . . . . . . . . . . . . . . . . . . . . . . . . . . . . . . . .234.8.9. Management of risk linked to its personnel . . . . . . . . . . . . . . . . . . . . . . . . . . . . . . . . . . . . . . . . . . . . . . . . . . . . . . . . . . . . . . . . . . . . . . . . . . . . . . . . . . . . . . . . . . . . .234.8.10. Financial risks management. . . . . . . . . . . . . . . . . . . . . . . . . . . . . . . . . . . . . . . . . . . . . . . . . . . . . . . . . . . . . . . . . . . . . . . . . . . . . . . . . . . . . . . . . . . . . . . . . . . . . . . . . . . . . . . . . . . . .244.8.11. Insurance . . . . . . . . . . . . . . . . . . . . . . . . . . . . . . . . . . . . . . . . . . . . . . . . . . . . . . . . . . . . . . . . . . . . . . . . . . . . . . . . . . . . . . . . . . . . . . . . . . . . . . . . . . . . . . . . . . . . . . . . . . . . . . . . . . . . . . . . . . . . . . . . .24
4Risk Factors
Investors should carefully consider all of the information in this Reference Document, including the risk factors described in this section, before deciding whether to invest in the Company’s securities. The risks described in this section are those that the Company has identifi ed as of the date of this Reference Document, which could have a signifi cant adverse effect on the Group,
its business activity, fi nancial position, performance and growth were they to materialize. Investors should be aware that other currently unknown or unforeseen risks, which could also have a signifi cant adverse effect on the Group, its business activity, fi nancial position, performance and growth may exist.
4.1. Risks relating to the Group and its activities
Technip is contractually exposed to signifi cant construction �
risks, which could cause Technip to incur losses on projects.
Technip is subject to signifi cant construction risks in connection with lump-sum turnkey contracts, under which Technip designs, engineers, builds and delivers a ready-to-operate industrial facility for a fi xed price. Actual expenses incurred in executing a lump-sum turnkey contract can vary substantially from those originally anticipated for several reasons, including:
unanticipated increases in the costs of raw materials, equipment �
or manpower;
unforeseen construction conditions; �
delays caused by local weather conditions and/or natural �
disasters (including earthquakes and fl oods); and
failure of suppliers or subcontractors to perform. �
Under the terms of lump-sum turnkey contracts, Technip is not always able to increase its prices to refl ect factors that were unforeseen at the time its bid was submitted. As a result, it is impossible to estimate with complete certainty the fi nal costs or margin of a project at the time of bidding or during the early phases of performance. If costs were to increase for any of these reasons, Technip’s profi t margins could be reduced and Technip could incur a signifi cant loss on the contract.

0112009 Reference Document
Risk Factors
4.1. Risks relating to the Group and its activities 4
Losses on one or several large contracts could reduce �
Technip’s net income or cause it to incur a loss.
If Technip fails to achieve expected margins or incurs losses on one or more of its key contracts, it may experience a decrease in net income or a net loss.
Unforeseen additional costs could reduce Technip’s margin �
on lump-sum contracts.
Technip’s engineering, procurement and construction (“EPC”) projects could encounter diffi culties that could lead to additional costs, lower revenues, litigation or disputes. These projects are generally complex, requiring the purchase of important equipment and the management of large-scale construction projects. Delays could occur and Technip could encounter diffi culties with the design, engineering, procurement, construction or installation related to these projects. These factors could impact Technip’s ability to complete certain projects on its initial schedule.
Furthemore, under the terms of certain of Technip’s contracts, its customers agree to provide certain information relating to design or engineering, as well as materials or equipment for use on a particular project. These contracts may also require the customer to indemnify Technip for any additional work or expenses if the customer (i) changes its instructions or (ii) is unable to provide Technip with required information relating to the design or engi-neering for the project or adequate materials and equipment.
In these circumstances, Technip generally negotiates monetary compensation from the customer for any additional time or money spent as a consequence of the customers’ failure. However, Technip cannot guarantee that it will receive adequate compensation for expenses incurred, including through litigation or arbitration. In such an event, Technip’s earnings and fi nancial condition could be signifi cantly affected.
Technip could be held liable to pay monetary compensation should it fail to meet schedules or to comply with other contractual provisions. Problems with the performance of contracts (present or future) could also have a signifi cant impact on Technip’s operating income and harm Technip’s reputation in its industry and with its customers.
Risks related to subcontractors and suppliers with respect to �
lump-sum or cost plus fee contracts.
Technip generally uses subcontractors and suppliers for the perfor-mance of its contracts. Technip’s inability to hire subcontractors or to acquire equipment and materials could compromise its ability to generate a signifi cant margin on a project or to complete it within the contractual timeframe.
If the amount that Technip is required to pay for such services, equipment or materials exceeds the amount estimated during the proposal phase for lump-sum contracts, Technip could incur losses in the performance of such contracts. Any delay on the part of subcontractors or suppliers in the completion of their portion of the project, any failure on the part of a subcontractor or supplier to meet its obligations or any other event attributable to a subcontractor or supplier that is beyond Technip’s control or that Technip cannot anticipate can lead to delays in the overall progress of the project and/or generate potentially signifi cant extra costs.
Technip performs a credit analysis as part of its selection process for subcontractors and suppliers, which could lead Technip to not select a subcontractor or a supplier, to require that they issue bank guarantees or to adapt their payment conditions to the risks identifi ed.
Despite this process, failures and defaults by subcontractors or suppliers could result in signifi cant delays and extra costs, and Technip could be required to compensate customers for such delays. Even where these extra costs are borne by the defaulting supplier or subcontractor, Technip could be unable to recover the entirety of these costs and this could impact Technip’s fi nancial results.
Equipment or mechanical failure could impact project costs �
and reduce Technip fi nancial results.
The successful execution of projects by Technip is dependent on its assets being highly reliable. Nevertheless, Technip could experience equipment or mechanical failures. Equipment or mechanical failures could not only result in greater project execution costs, but also lead to delays in ongoing or subsequent projects for which such assets were intended to be used. Despite the maintenance program implemented by the Group to keep its assets in good working condition, failures may still occur. Any equipment or mechanical failures with respect to Technip’s main assets could impact a project’s costs, decrease revenues and lead to penalties for failure to comply with a project’s conditions. Any such event could signifi cantly affect the economics of a project and Technip’s results of operations.
Technip’s business could be heavily impacted by national �
or international terrorist acts, wars or revolutions, or by the consequences of such events. Furthermore, a large number of projects are located in emerging countries where political, economic and social instability could result in the cancellation, postponement or delay of those projects.
A large part of Technip’s business in 2009 involves projects in countries where national or international events related to terrorist acts, wars or revolutions, acts of subversion or the consequences of such acts, unforeseen political events or social instability or changes in economic or social policies (see in particular the regulatory and legal risks included in Section 4.3 of this Reference Document) could result in a signifi cant decrease of the Group’s profi tability and signifi cantly impact its fi nancial results and situation.
Political instability may also result in fewer new projects meeting Technip’s criteria. As a result, political instability in emerging countries could lead to greater costs and therefore signifi cantly impact the Group’s fi nancial results and limit the Group’s growth opportunities.
Exposure to a particular area or country can be reduced by choo-sing either not to carry out new Projects in that area or country or by specifi c analysis and the implementation of preventive and protective measures against the identifi ed risks, making such risks acceptable. Technip maintains contact with insurance companies and export-credit agencies to subscribe when necessary insurance to cover political risk. However in the event of national or regional political instability, these insurance policies may be inadequate to prevent a loss on ongoing projects, which could reduce Technip’s net income or cause Technip to incur a loss.

012 2009 Reference Document
Risk Factors
4.1. Risks relating to the Group and its activities4
Technip’s operations may cause harm to persons and �
property, which could damage its reputation and, in addition, to the extent any such harm is not covered contractually or by insurance, cause Technip to incur substantial costs.
Technip’s operations are subject to the risks inherent in providing engineering and construction services to the oil and gas and petro-chemical industries, such as the risk of equipment failure, bodily injury, fi re or explosion. These risks could lead to injury, death, business disruption, damage to real or personal property, pollution or other environmental damages, which could result in claims against Technip. Technip may also be subject to claims resulting from the subsequent operation of facilities it has designed or delivered.
Technip’s policy is to contractually limit its liability and provide for indemnity provisions, as well as to obtain insurance coverage. However, such precautions may not always prove to be effective. Environmental and social liability may be assigned to Technip as a matter of law in certain jurisdictions where Technip operates. In addition, clients and subcontractors may not have adequate fi nancial resources to meet their indemnifi cation obligations to Technip.
Furthermore, losses may result from risks that are not addressed in Technip’s indemnity agreements or that are not covered by its insurance policies.
Finally, the Group may not be in a position to obtain adequate insurance coverage on commercially reasonable terms for certain types of risks. Failure to have appropriate and adequate insurance coverage in place for any of the reasons discussed above could subject Technip to substantial additional costs and potentially lead to losses. Additionally, the occurrence of any of these events could harm Technip’s reputation and signifi cantly impact its fi nancial results.
Maritime security risks
Piracy, mainly in the Gulf of Aden and to a lesser extent in the Gulf of Guinea, has signifi cantly increased in recent years. It represents a risk for fl eets, including Technip’s, and for all projects which equire the transport of material through sensitive maritime areas. The materialization of such maritime security risks may impact a project’s execution schedule and require time to fi nd an alternative solution, and accordingly result in a negative impact on Technip’s margin.
Air travel risks
Technip operates in countries where airlines and/or the air control network may fail. Depending on the state of execution of a parti-cular project, business trips may include a signifi cant number of Group employees. Despite internal travel procedures requiring that employees staffed on the same project should travel in separate planes, the limited number of fl ights for certain destinations may lead such employees to use the same means of transportation. Should this risk materialize it could have an impact on a project’s execution schedule or the submission of an offer and result in a negative impact on human resources and the Group’s image.
Risks related to information and information systems
Data storage on electronic media and in information systems is one of the foundations of Technip engineering activities. A weakness in a dysfunction of or an attack against the Group’s Information Systems may result in a delay in a project’s execution schedule or the submission of an offer until saved data is restored and systems are reset, and may result in a negative impact on the Group’s image.
Dependence
Technip believes that the large portfolio of technologies that it owns or that it licenses from third parties is a strategic asset in winning and executing its projects. However Technip could be subject to legal actions brought by third parties for the purpose of enforcing intellectual property rights it alleges to hold.
Such legal actions could have a signifi cant impact on operations and image and result in a decline in Technip’s market share and consequently affect the Group fi nancial results.
However, Technip does not believe that its business or fi nancial situation is dependent upon any single patent, brand, technology or intellectual property right.
Technip is not dependent upon its suppliers. In this regard, Technip is not limited in its choice of suppliers and approaches all suppliers active on the worldwide market.
Technip is not dependent on any individual customer as a result of its large customer base. Over the course of the last two fi scal years, the Group consolidated revenues generated by Technip’s top fi ve customers were:
In % of Group revenues 2009 2008
Client A 11.8% 8.5%
Client B 6.9% 7.6%
Client C 6.0% 3.9%
Client D 4.1% 3.9%
Client E 3.5% 3.4%
Total 32.3% 27.3%
For informational purposes, Technip’s top 10 customers repre-sented 44.5% of consolidated revenues in 2009 (as compared to 42.4% in 2008).
The success of joint ventures in which Technip participates �
depends on the satisfactory performance of its partners’ obligations.
The failure of Technip’s joint venture partners to perform their obligations in accordance with the contract awarded to the joint venture could lead to additional obligations being imposed on Technip, such as the defaulting partner’s obligations, or to addi-tional costs being incurred by Technip as a result of a partner’s non-satisfactory performance (such as a delay), which could reduce Technip’s profi ts or, in certain cases, generate signifi cant losses.

0132009 Reference Document
Risk Factors
4.2. Risks relating to the Group’s industry 4
4.2. Risks relating to the Group’s industry
Technip could fail to retain its key personnel or fail to attract �
the new qualifi ed employees it will need to maintain and develop its know-how.
Technip’s success in this fi eld depends on its ability to recruit, train and retain a sufficient number of employees including managers, engineers and technicians who have the required skills and expertise and local knowledge. Competition for recruitment of individuals with this type of profi le is strong.
Technological progress might render the technologies used �
by Technip obsolete.
The oil industry is developing oil and gas reserves in increasingly diffi cult conditions, such as the deep seas, high-pressure and high-temperature fi elds and the Arctic. Technological development is key to overcoming these diffi culties and provides a signifi cant competitive edge.
Unlike in other sectors, this industry has not experienced any technological breakdowns, but continuous research and deve-lopment is required in order to continually push the limits of production-exploration. Technip’s success depends on continuous and regular research and development in order to develop new products and new installation methods that will provide solutions at an acceptable cost to the market (for details regarding R&D policy and expenses, see Section 11, Note 4-(c) included in Section 20.1 of this Reference Document).
The failure to sustain continuous and regular research and development could result in a decline in Technip’s market share, which could have a signifi cant impact on its activities and its fi nancial results.
Increasing price pressure by competitors could reduce the �
volume of contracts meeting Technip’s margin criteria.
Most of Technip’s contracts are obtained through a competitive bidding process, which is customary for the sector. Technip’s main competitors are engineering and construction companies in the United States, Europe, Asia and the Middle East. While service quality, technological capability, reputation and experience are considered in client decisions, price remains one of the determining factors in most contract awards. Historically, this industry has been frequently subject to intense price competition. Such competition intensifi ed from the growing demand over 2004-2008 and could have a negative impact on the Group’s margin requirements if demand were to shrink signifi cantly and sustainably and conse-quently have a negative impact on the Group’s revenues.
Impact of the current fi nancial crisis on loans, letters of �
credit, bank guarantees and other guarantees necessary to Technip’s operations.
The fi nancial crisis, which began in July 2007 and became an economic crisis in 2008, has led to an increase in the cost of loans, bank guarantees and letters of credit, which are necessary for the development of Technip’s activities. This increase is due to balance sheet, liquidity and arbitrage constraints and constraints with regard to allocations of equity that fi nancial institutions have faced.
Technip continues to benefi t from bonding lines of signifi cant amounts with a large number of fi nancial institutions, enabling Technip to satisfy its contractual obligations. Nevertheless, the changes in the banking market may have an impact on the future issuance of bank guarantees and letters of credit in signifi cant amounts and may require the involvement of several banks. These issuances could be more restrictive and more expensive to structure in a banking market where banks are increasingly reluctant to take risks on their peers. This could impact Technip’s capacity to develop its business, its backlog and its earnings.
Despite Technip’s credit risk management and hedging procedures, particularly during project assessments where such procedures begin at the offer stage (as detailed in Sections 6.3.1 and 6.3.2 of this Reference Document), Technip cannot guarantee that it will not be required to directly bear the risk of fi nancial failure of any of its clients, partners or subcontractors following the loss of fi nancing for certain projects and, more generally, due to the impact of the current fi nancial crisis on the availability of credit to companies or the increase of negotiation periods for fi nancing of projects for which Technip is a contractor. Such trends may have a signifi cant adverse impact on Technip’s activities and fi nancial results.
The reduction in export credits could make fi nancing certain �
projects by Technip’s clients more diffi cult and lead to a reduction in the number of new projects, which could limit Technip’s growth opportunities.
Technip and its subsidiaries maintain contact with many export credit agencies to promote projects which may be subject to orders and to obtain as an exporter their assistance in the hedging or guarantee of such projects.
Should the level of involvement of these export credit agencies fall, customers could choose to undertake fewer projects. A decline in the number of new contracts for this reason could limit Technip’s growth opportunities and have a signifi cant impact on its business.

014 2009 Reference Document
Risk Factors
4.3. Regulatory and Legal Risks4
The reduction in investments in the oil sector due, in �
particular, to the current international fi nancial crisis, could cause Technip’s projects to be postponed or cancelled and could limit Technip’s ability to increase or maintain its profi ts.
Technip’s business is largely dependent on investments made by the oil industry to develop onshore or offshore oil and gas reserves, as well as to process oil, natural gas and their by-products (refi ning units, petrochemical sites, natural gas liquefaction plants).
Oil and gas prices on world markets, as well as expectations of changes in these prices, signifi cantly impact the level of investment in this sector.
In the upstream segment of the oil industry, a prolonged decrease in oil and gas prices where development costs, such as equipment procurement costs, do not simultaneously decline, could force customers to postpone new investments, signifi cantly reduce the amount of such investments or even cancel such investments.
In the downstream segment of the industry, sustained increases in oil and gas prices may put downward pressure on consumer demand for products derived from oil and gas, including fuel and
plastics. Any slowing of demand would reduce Technip’s clients’ incentives to invest in additional treatment capacity.
Furthermore, in both of these segments high volatility in oil and gas prices could also lead oil and gas companies to delay or even cancel their investment projects.
Finally, investments in the oil industry are not only infl uenced by oil prices, but also by other factors, the most important of which are the following:
the level of exploration and development of new oil and gas �
reserves;
the rate of decline of existing reserves; �
changes in the global demand for energy; �
international economic growth; �
local political and economic conditions; and �
changes in environmental legislation. �
A decrease in investments in the oil industry, as a result of one of the factors described above, or for any other reason, could decrease Technip’s capacity to increase, or even maintain, its operating income and profi ts.
4.3. Regulatory and Legal Risks
New governmental regulations could potentially be �
unfavorable to Technip.
Technip’s operations and means of production are governed by the international, regional, transnational and national laws and regulations of approximately 50 countries worldwide, in various fi elds such as export control, securities laws, internal controls, health and safety, personal data protection, labor law and envi-ronmental protection laws. The changes in each of these fi elds require Technip to make fi nancial and technical investments or withdraw from certain countries in order to adapt to and comply with these changes.
Technip cannot guarantee, that certain assets will not be natio-nalized or expropriated or that contractual rights will not be challenged. The materialization of such a risk could result in a loss of market share and have a signifi cant impact on the Group’s operations and fi nancial results.
Changes in Technip’s operational environment, in particular, �
changes in tax regulations or interpretations thereof in the countries where Technip is active, could impact the determination of Technip’s tax liabilities.
Technip operates in approximately 50 countries and is, as a result, subject to tax in a number of different jurisdictions. Revenues generated in the various jurisdictions are taxed on different bases, including net income actually earned, deemed net profi t and tax withholding. The fi nal determination of Technip’s tax liabilities requires interpreting local tax laws, treaties and the practices of the tax authorities in each jurisdiction, where Technip operates, as well as making assumptions regarding the scope of future
operations and the nature and timing of the fi nancial results from these operations. Changes in tax regulations and practices could signifi cantly impact Technip’s tax liabilities if the Group, contrary to the recommendations of the Group Tax Department, is not contractually protected against risk incurred as a result of a change in tax regulations, interpretations and practices.
If Technip fails to effectively protect its technologies, certain �
competitors could develop similar technologies, causing Technip to lose its competitive advantage and resulting in a loss of revenues.
Certain of Technip’s products, as well as the processes used by Technip to produce and market such products, are patented or are subject to patent applications or constitute trade secrets. Not all countries offer the same level of protection of intellectual property rights. If Technip’s intellectual property rights were to be consi-dered invalid or if they could not be protected, or if Technip failed to obtain a given patent, its competitors could then independently develop and exploit technologies similar to Technip’s unpatented or unprotected technologies. Such events could have an impact on the Group’s brand, operations and fi nancial results.
Technip may have to take a legal action to have its intellectual property rights enforced, as well as to assess the validity and scope of rights held by third parties. Technip could also be subject to legal actions brought by third parties for the purpose of enforcing intellectual property rights they allege to hold. Any court proceedings could result in major costs for Technip as well as the dedication of resources and have a signifi cant impact on its operating income.
0152009 Reference Document
Risk Factors
4.3. Regulatory and Legal Risks 4
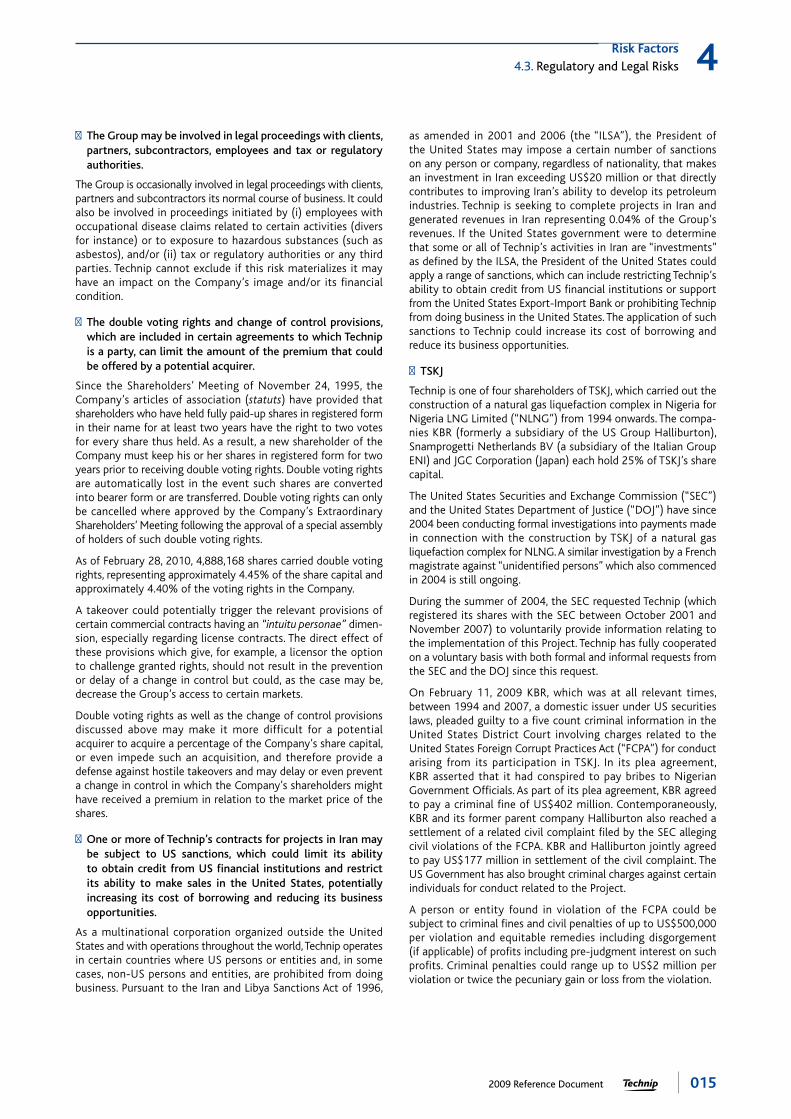
The Group may be involved in legal proceedings with clients, �
partners, subcontractors, employees and tax or regulatory authorities.
The Group is occasionally involved in legal proceedings with clients, partners and subcontractors its normal course of business. It could also be involved in proceedings initiated by (i) employees with occupational disease claims related to certain activities (divers for instance) or to exposure to hazardous substances (such as asbestos), and/or (ii) tax or regulatory authorities or any third parties. Technip cannot exclude if this risk materializes it may have an impact on the Company’s image and/or its fi nancial condition.
The double voting rights and change of control provisions, �
which are included in certain agreements to which Technip is a party, can limit the amount of the premium that could be offered by a potential acquirer.
Since the Shareholders’ Meeting of November 24, 1995, the Company’s articles of association (statuts) have provided that shareholders who have held fully paid-up shares in registered form in their name for at least two years have the right to two votes for every share thus held. As a result, a new shareholder of the Company must keep his or her shares in registered form for two years prior to receiving double voting rights. Double voting rights are automatically lost in the event such shares are converted into bearer form or are transferred. Double voting rights can only be cancelled where approved by the Company’s Extraordinary Shareholders’ Meeting following the approval of a special assembly of holders of such double voting rights.
As of February 28, 2010, 4,888,168 shares carried double voting rights, representing approximately 4.45% of the share capital and approximately 4.40% of the voting rights in the Company.
A takeover could potentially trigger the relevant provisions of certain commercial contracts having an “intuitu personae” dimen-sion, especially regarding license contracts. The direct effect of these provisions which give, for example, a licensor the option to challenge granted rights, should not result in the prevention or delay of a change in control but could, as the case may be, decrease the Group’s access to certain markets.
Double voting rights as well as the change of control provisions discussed above may make it more difficult for a potential acquirer to acquire a percentage of the Company’s share capital, or even impede such an acquisition, and therefore provide a defense against hostile takeovers and may delay or even prevent a change in control in which the Company’s shareholders might have received a premium in relation to the market price of the shares.
One or more of Technip’s contracts for projects in Iran may �
be subject to US sanctions, which could limit its ability to obtain credit from US fi nancial institutions and restrict its ability to make sales in the United States, potentially increasing its cost of borrowing and reducing its business opportunities.
As a multinational corporation organized outside the United States and with operations throughout the world, Technip operates in certain countries where US persons or entities and, in some cases, non-US persons and entities, are prohibited from doing business. Pursuant to the Iran and Libya Sanctions Act of 1996,
as amended in 2001 and 2006 (the “ILSA”), the President of the United States may impose a certain number of sanctions on any person or company, regardless of nationality, that makes an investment in Iran exceeding US$20 million or that directly contributes to improving Iran’s ability to develop its petroleum industries. Technip is seeking to complete projects in Iran and generated revenues in Iran representing 0.04% of the Group’s revenues. If the United States government were to determine that some or all of Technip’s activities in Iran are “investments” as defi ned by the ILSA, the President of the United States could apply a range of sanctions, which can include restricting Technip’s ability to obtain credit from US fi nancial institutions or support from the United States Export-Import Bank or prohibiting Technip from doing business in the United States. The application of such sanctions to Technip could increase its cost of borrowing and reduce its business opportunities.
TSKJ �
Technip is one of four shareholders of TSKJ, which carried out the construction of a natural gas liquefaction complex in Nigeria for Nigeria LNG Limited (“NLNG”) from 1994 onwards. The compa-nies KBR (formerly a subsidiary of the US Group Halliburton), Snamprogetti Netherlands BV (a subsidiary of the Italian Group ENI) and JGC Corporation (Japan) each hold 25% of TSKJ’s share capital.
The United States Securities and Exchange Commission (“SEC”) and the United States Department of Justice (“DOJ”) have since 2004 been conducting formal investigations into payments made in connection with the construction by TSKJ of a natural gas liquefaction complex for NLNG. A similar investigation by a French magistrate against “unidentifi ed persons” which also commenced in 2004 is still ongoing.
During the summer of 2004, the SEC requested Technip (which registered its shares with the SEC between October 2001 and November 2007) to voluntarily provide information relating to the implementation of this Project. Technip has fully cooperated on a voluntary basis with both formal and informal requests from the SEC and the DOJ since this request.
On February 11, 2009 KBR, which was at all relevant times, between 1994 and 2007, a domestic issuer under US securities laws, pleaded guilty to a fi ve count criminal information in the United States District Court involving charges related to the United States Foreign Corrupt Practices Act (“FCPA”) for conduct arising from its participation in TSKJ. In its plea agreement, KBR asserted that it had conspired to pay bribes to Nigerian Government Offi cials. As part of its plea agreement, KBR agreed to pay a criminal fi ne of US$402 million. Contemporaneously, KBR and its former parent company Halliburton also reached a settlement of a related civil complaint fi led by the SEC alleging civil violations of the FCPA. KBR and Halliburton jointly agreed to pay US$177 million in settlement of the civil complaint. The US Government has also brought criminal charges against certain individuals for conduct related to the Project.
A person or entity found in violation of the FCPA could be subject to criminal fi nes and civil penalties of up to US$500,000 per violation and equitable remedies including disgorgement (if applicable) of profi ts including pre-judgment interest on such profi ts. Criminal penalties could range up to US$2 million per violation or twice the pecuniary gain or loss from the violation.

016 2009 Reference Document
Risk Factors
4.4. Industrial and environmental risks4
The amount of any fi nes or monetary penalties depend on factual fi ndings, including among others, the amount, timing, nature and scope of any improper payment and related business transactions and the level of cooperation provided to the authorities during the investigations. Investigations of this nature and any related settlements could result in (i) third party claims against Technip which could include claims for special, indirect or consequen-tial damages (ii) adverse consequences on Technip’s ability to obtain or continue fi nancing for current or future projects and/ or (iii) damage to Technip’s business or reputation via negative publicity adversely affecting Technip’s prospects in the commercial market place.
French law was modifi ed in September 2000 to attach, for the fi rst time, liability for the corruption of foreign public offi cials. Under that law, criminal fi nes of up to €750,000, the confi scation of the direct and indirect proceeds of the offence and various prohibitions and civil damages may be imposed on a legal entity.
Technip and its counsel have held meetings with the US authorities since July 2008 and have discussed a resolution of the investiga-tion. While these discussions have not concluded, Technip recorded
an exceptional charge of €245 million in the fourth quarter 2009 accounts refl ecting the estimated costs of resolution based on the status of ongoing discussions. The potential resolution does not contemplate a criminal conviction for Technip’s role in the TSKJ joint venture and would not affect Technip’s ability to continue its operations in a normal manner. While Technip currently has no reason to believe that the US investigation will not be resolved as anticipated, there can be no assurance that fi nal agreement will be reached with the DOJ and the SEC. If fi nal agreement is not reached, Technip cannot exclude a different conclusion of the investigation which could have a material adverse impact on Technip’s fi nancial position or operations.
The principles used to evaluate the amounts and types of provi-sions for liabilities and charges are described in Note 1-C-(t) Provisions ; the criteria for classifying an asset / liability as “current” or “non-current” in the balance sheet is described in Note 1-C Accounting Rules and Estimates which is included in Section 20.1 of this Reference Document.
A presentation of signifi cant legal proceedings involving the Group can be found in Section 20.4 of this Reference Document.
4.4. Industrial and environmental risks
The operation of facilities Technip has used, built or is �
currently building may expose Technip to liability claims in connection with environmental protection or industrial risk prevention regulations.
Technip operates in countries with numerous regulations related to environmental protection and the operation of industrial sites, which are increasingly stringent and constantly changing. Technip could be held liable, for environmental liabilities under the European Directive of April 21, 2004 which has been transposed in the legislation of most of the member states where Technip operates. In particular, Technip could be held liable for pollution, including the release of petroleum products, hazardous substances and waste from production, refi ning or industrial facilities, as well as other assets owned, operated, or which were operated in the past, by the Group, its customers or subcontractors. A breach of environmental regulations could result in the remediation of polluted sites at costs that could prove to be substantial, the suspension or prohibition of certain activities and Technip’s liability for damages incurred by third parties, which could have a negative impact on the Group’s operations and fi nancial results.
Although Technip does not directly operate facilities classifi ed under Clause IV of Article L. 515-8 of the French Environmental Code (Seveso high threshold), certain of its activities (construction, installation or commissioning) are carried out at industrial facilities subject to risks. The persons responsible for these activities, in cooperation with Technip’s customers, are subject to a number
of obligations and must take all necessary measures, in particular, to monitor and evaluate risks and evacuate persons. This policy, which places a premium on training, refl ects accomplishments in the areas of quality-assurance and employees accident prevention. In 2009, more than 973,000 hours have been spent on training.In the event of a major industrial accident in a facility subject to such risks, Technip’s liability as an onsite participant for damages to Technip’s employees or property, or the loss of an important customer affected by a major accident, could have a negative impact on the Group’s operations and income. Due to the exceptional character of these risk factors, no provision has been taken in 2009.
In addition to compliance with legislation since 2003, Technip has adhered to the ten principles of the United Nations Global Impact and discloses its initiatives in this respect (see Section 6.6 of this Reference Document).
Technip has implemented an internal control system based on the framework of the Committee of Sponsoring Organization’s of the Treadway Commission (“COSO”) and risk management processes described in Section 4 of the Report of the Chairman of the Board of Directors to the Shareholders’ Meeting, included in Annex C of this Reference Document. Within this framework, the main risks of the Group are assessed and benefi t from a management system at various levels of organization. These risks are annually assessed and are subject to corrective actions that are analyzed by the Internal Audit Plan.

0172009 Reference Document
Risk Factors
4.5. Credit/counter-party risk 4
Climate change could have an unfavorable impact on �
Technip’s operations and income.
Technip divides climate change risks into three categories, each of which is approached differently in terms of economic risks and opportunities:
1. regulatory risks resulting from more stringent international, European or national regulations intended to reduce greenhouse gas emissions;
2. competition risks resulting from possible changes in customer demand for more energy-effi cient products and processes; and
3. physical risks such as damages or delays in the completion of projects, resulting from an increasing number of climate events.
The various control processes applied throughout the Group or with respect to a project allow it to assess and manage these risks depending on their size and on the perimeters of responsibility.
1. Technip has no facilities classifi ed under the French national greenhouse gas quota scheme (PNAQ II for the 2008-2012 period). However, investments in the petroleum industry can be particularly impacted by changes in environmental laws and regulations applicable to the place where a project is located and to relevant business sectors. Regional Business Units, with the assistance of Product Business Units, permanently monitor environmental regulations in order to propose innovative solu-tions to reduce greenhouse gas emissions. However, if certain regulations change in an unexpected manner or impose require-ments for which Technip would not be in a position to propose solutions, the obligations imposed by such regulations could have a signifi cant negative impact on the Group’s operations and fi nancial results.
2. Reporting directly to the Company’s Chairman and Chief Executive Officer, the New Technologies Department is responsible for identifying future technologies and developing Technip’s action plan to fi ght global warming and to forecast the future of energy demand.
In the absence of such an approach, Technip could no longer be in a position to satisfy market demand, which could negatively impact its operations and fi nancial results.
3. Technip’s business could be materially affected by severe weather conditions in countries in which it operates, which could require the evacuation of its employees and the suspen-sion of such activities. A three-level operational organization is in place to manage crisis situations. A corporate organization involves regions and projects, which also implement their own crisis management and communication processes to improve effi ciency should a crisis occur: this includes planning resource (both of assets and persons) allocation, rapid activation of crisis management processes, mobilization of persons and optimization of the crisis management system. The actions undertaken and the training provided relate to crisis alert, process activation, management and resolution. Despite the implementation of these procedures, unfavorable climate condi-tions could result in the interruption of Technip’s operations. Each of these events could signifi cantly and adversely affect compliance with contractual completion deadlines as well as Technip’s operating income.
Technip could face claims for occupational disease related �
to asbestos and incur liabilities as an employer.
Like most diversifi ed industrial groups, Technip may have to address claims for occupational disease related to its employees’ exposure to asbestos. In the event asbestos-related occupational disease is discovered, an employer could be held liable and be required to pay signifi cant compensation to victims or to their heirs and assigns. The exposure of Technip’s employees to asbestos could result from the presence of asbestos in certain buildings or equipment used in the Group’s business in its numerous locations and not to the use of asbestos in the manufacturing process, subject to certain very limited exceptions. The Group is unaware of any claims for occupational diseases in this respect. Nevertheless, should Technip be held liable and should case law with respect to the indemnities payable, evolve in favor of victims the Group could suffer serious fi nancial consequences.
4.5. Credit/counter-party risk
Because the worldwide market for the production, transportation and transformation of hydrocarbons and by-products, as well as the other industrial sectors in which the Group operates, is dominated by a small number of companies, Technip’s business is concentrated on a limited number of customers. The Group regularly performs credit risk analyses before entering into contracts and sets up payment guarantees as necessary, where the risk is considered too high, as well as procedures for monitoring customer payments.
With respect to past due but not impaired trade receivables, the principal counterparty represents €58,0 million as of December 31, 2009 (see Note 33-(d) to the Consolidated Financial Statements
for the fi nancial year ended December 31, 2009 included in Section 20.1 of this Reference Document). Part of this trade receivable was paid beginning of 2010.
In 2009 and as of the date of this Reference Document, the Group has not suffered signifi cant payment defaults by its clients. See Note 16 to the Consolidated Financial Statements included in Section 20.1 of this Reference Document, indicating the amount of doubtful accounts and provisions for depreciation pertaining thereto.
For informational purposes, the percentage of consolidated revenues generated by Technip’s top fi ve and top ten customers is reported in Section 4.1 of this Reference Document.

018 2009 Reference Document
Risk Factors
4.6. Liquidity risk4
Group’s exposure to liquidity risks is presented in Note 33-(a) to the Consolidated Financial Statements included in Section 20.1 of this Reference Document.
As of January 1, 2009, Standard and Poor’s corporate credit rating of Technip was BBB/Stable/A-2. On November 26, 2009, the pers-pective was changed from stable to positive as of December 31, 2009 the Standard and Poor’s corporate credit rating of Technip is BBB/positive/A-2.
Technip’s business generates negative working capital requirements.
Technip’s fi nancing needs are met pursuant to a Group policy �
implemented by the Finance and Control Division.
Cash management is centralized at the head offi ce and coor- �
dinated through fi nancial centers located in the Group’s main operating subsidiaries.
Technip Eurocash SNC, a French general partnership (société en nom collectif) acts as a cash pooling entity for the Group’s main entities, in compliance with applicable laws and regulations in each of the relevant countries. In this regard, Technip Eurocash SNC has entered into cash pooling agreements with most of the Group’s subsidiaries in order to pool surplus cash and to meet their needs, except where local economic and fi nancial considerations result in resorting to external local debt. Technip Eurocash SNC’s management committee is comprised of the Group’s Regional Chief Financial Offi cers and meets several times per year.
As of December 31, 2009, the Group had various unused fi nan- �
cing sources that allow it to meet its requirements for fi nancing its general corporate needs, or which are reserved for fi nancing new assets or certain activities.
Bond issue 2004-2011 �
In May 2004, Technip issued a €650 million bond loan, as described in Note 21 to the Consolidated Financial Statements (“Financial Debts”) included in Section 20.1 of this Reference Document. This issue, listed on the Luxembourg Stock Exchange, enabled Technip to extend the average maturity of its debt. This bond loan contains commitment and default clauses for bond issues, and do not include any fi nancial ratios.
Deep Energy � fi nancing
The US$241 million credit facilities agreement entered into in 2009 for the fi nancing of Deep Energy–(the vessel formerly called the New Pipelay Vessel (NPV)), which is currently under construction:
a credit facility in the amount of US$125 million granted to �
Technip, to be reimbursed in four equal semi annual installments from June 15, 2011 until December 15, 2012;
a credit facility in the amount of US$88 million granted to �
TP-NPV Singapore Ltd, guaranteed by Technip and benefi ting from credit insurance from the export credit agency Finnerva
(Finland), to be reimbursed in 17 equal semi annual installments from July 15, 2011 until July 15, 2019;
a line of credit in an amount of US$28 million granted to Technip �
NPV Singapore Ltd, guaranteed by Technip and benefi ting from a credit insurance from the export credit agency Coface (France), to be reimbursed in 14 equal semi annual installments from July 15, 2011 until January 15, 2018.
These variable interest rate credit agreements include the usual commitments and default provisions applicable to Technip and the subsidiaries of the Group and do not include any fi nancial ratios. They do not include any asset.
As of December 31, 2009, US$30 million were drawn on the US$125 million credit facility.
Skandi Arctic � fi nancing
In March 2009, Doftech DA (a 50% indirectly owned subsi-diary of Technip) signed a 1 billion Norwegian crowns facility agreement for the fi nancing of the Skandi Arctic vessel. This facility will be reimbursed in 24 equal semi annual installments starting September 16, 2009 and ending March 16, 2021. As of December 31, 2009, the facility, fully drawn, amounts to 958.333 million Norwegian crowns following the fi rst semi annual payment on September 16, 2009.
One tranche of the facility, corresponding to 70% of the total amount is granted at a fi xed rate of 5.05% by the Norwegian fi nancing institution Eksportfi nans and benefi ts from a guarantee by GIEK. The other tranche of the facility is granted at variable rate by a commercial bank.
This credit facility is guaranteed jointly but not severally by Technip Offshore International and by the parent company of the other shareholder of Doftech DA, on a 50/50 basis. It also benefi ts from a mortgage over the Skandi Arctic vessel.
This credit agreement includes the usual commitments and default provisions and does not include any fi nancial ratio.
BNDES (Banco Nacional de Desenvolvimento Econômico e �
Social) Facilities
In September 2009, the Brazilian subsidiary Flexibras signed three separate credit facilities for a total amount of 300 million Brazilian reals to sustain the prefi nancing of its export activities.
Each facility was signed with a different commercial bank on behalf of BNDES in connection with BNDES fi nancing and for different amounts (140 million, 90 million and 70 million Brazilian reals respectively). As of December 31, 2009, each loan was fully drawn.
The three facilities are at fi xed rate with a single redemption date: August 15, 2012. The credit agreements include the usual default provision for such facilities and do not include any fi nancial ratio.
4.6. Liquidity risk

0192009 Reference Document
Risk Factors
4.7. Market risks 4
Syndicated credit facility and bilateral lines �
As of December 31, 2009, the Group had various unused fi nancing sources that allow it to meet its general corporate purposes fi nancing needs:
1/ A credit facility in the amount of €850 million, which was signed in 2004 and amended in 2005, 2006 and 2007 at Technip’s request. This credit facility is redeemable in fi ne on June 20, 2012. It is not secured by any of the Group’s assets. It carries commitments from Technip and those of its affi liates entitled to draw on the facility customary for a fi nancing of this type, and does not include any fi nancial ratios.
The amendment signed in June 2005 principally related to a credit maturity extension to June 2010 and to a reduction in fi nancial conditions. The amendment signed in June 2006 extended the credit maturity to June 2011. The amend-ment signed in June 2007 extended the credit maturity to June 2012.
2/ Two credit facilities in the amount of €125 million each, drawable in Euros or in US dollars. The expiry dates are, respec-tively, May 26, 2012 and June 27, 2012, following bilateral negotiations. They have the same commitments as the credit line described above including the exclusion of any fi nancial ratios.
3/ Two credit facilities in the amount of €80 million and €90 million, respectively, drawable in Euros or in US dollars. The expiry date for the €80 million facility is May 7, 2013. Repayment under the €90 million facility will begin on May 13, 2011 and end on May 13, 2015. These facilities both have the same commitments as those described in paragraph 2/ above.
4/ Various unused credit facilities amounting to €37.6 million.
The credit agreements providing for these fi nancing arrange-ments do not include early payment provisions in the case of deterioration of the borrower’s credit rating. These credit agreements include variable interest rate in the event they are used as well as usual default provisions.
As of December 31, 2009, the credit facilities confi rmed and �
available to the Group amounted to €1,454 million, of which €1,416.5 million are available beyond December 31, 2010. Of this amount of 1,454 million euros, €183 million are reserved for the fi nancing of certain assets or for certain subsidiaries.In the light of market conditions, no commercial paper was �
outstanding as of December 31, 2009. Technip Eurocash SNC retains an authorization from the Banque de France for a maximum amount of €600 million.Amounts falling due in 2010 and 2011 under long-term debt �
amount to €749.8 million including €78.4 million of accrued interest and fees and €671.4 million of principal.
Private placement notes with a deferred issue date �
On November 19, 2009, Technip signed an agreement with an international bank establishing the terms on which Technip agreed to issue in July 2010 200 million euros of notes which will be subscribed by an investor in a private placement conducted by the international bank and, subject to certain conditions, the international bank’s obligation to procure the subscriber or, failing which, to subscribe and pay for the notes itself.
The signed agreement details the summary terms of the notes: the issue date will be July 27, 2010, the maturity date will be July 27, 2020, and the annual coupon amounts to 5%. The other terms of the notes are similar to the terms of the bond loan issued in 2004 and do not include any fi nancial ratios. These notes will be listed on the Luxembourg Stock Exchange.
4.7. Market risks
4.7.1. Currency riskTechnip considers that the main currency risk it has to face is the operating currency risk. A currency risk analysis is performed for each contract. It takes into account currency fl ows in and currency fl ows out. Exposure per currency is calculated and covered, and this exposure is regularly updated.
Each contract is individually monitored pursuant to the Group’s procedures. The initial currency exposure is systematically covered when the contract is entered into and is regularly reviewed during the performance of the contract. This monitoring is included in internal reporting.
Currency hedging is conducted in accordance with accounting standards taking into account future fl ows (microeconomic cover)
and are spread among several banking counterparties, each of which is selected following due analysis.
As discussed in Note 1-C-(c) to the Consolidated Financial Statements (“Foreign Currency Transactions and Financial Instruments”) included in Section 20.1 of this Reference Document, Technip uses fi nancial instruments to manage its exposure to currency risks incurred in the normal course of its business. The exchange rate hedging contracts arranged by the Group are for specifi c, future projects pursuant to signed contracts.
Technip believes that the allocation of revenues and principal operational expenses among the main invoicing currencies is not necessary information for Technip.

020 2009 Reference Document
Risk Factors
4.7. Market risks4
The main hedging instruments used by the Group to address currency risks are the following:
As of December 31,
2009 2008
MaturityNominal
ValueNominal
Value
In millions of Euro2011 and
beyond 2010
Buy Foreign Currency, Sell National Currencies 17.3 400.0 417.3 475.4
Sell Foreign Currency, Buy National Currencies 771.6 982.5 1,754.1 1,151.0
Buy/Sell Foreign Currency 79.4 353.4 432.8 433.7
Total Hedging Instruments 868.3 1,735.9 2,604.2 2,060.1
Currency risk is mainly related to the US dollar. An upward or downward change in the US dollar spot price of 10% at the end of the fi scal year would have had increased or decreased earnings before taxes by €3.9 million (as a result of fi nancial instruments held for economic hedging but not qualifi ed for hedging accoun-
ting) and would have increased or decreased fair value reserves in equity by €97,8 million.
As of December 31, 2009, no currency options has been used.
The Group’s consolidated currency position is not measured. However, as of December 31, 2009, Technip’s outstanding hedging instruments by currency were the following:
USD/EUR purchaseUSD/EUR
saleUSD/GBP purchase
USD/GBP sale
Purchase/sale of foreign currency
vs. EURPurchase/sale of foreign currency
vs. Foreign currency
189.3 1,537.8 14 265.2 444.3 153.6
The Group’s rules require that all of its transactions in foreign currencies be hedged. As a result, almost all of its assets and liabi-lities denominated in foreign currencies are hedged and Technip believes that the residual currency risk is not signifi cant.
Entities in the Group may be subject to currency risks linked to foreign currency exchange. Most of the Group’s subsidiaries’ short-term fi nancing needs are met by the cash pooling entity, Technip Eurocash, in the requested currency. Technip Eurocash centralizes excess cash in any currency for most of the Group’s subsidiaries
and has the necessary cash available in a requested currency or it enters into forward exchanges contracts. The fonctionnal currency of Technip’s subsidiaries is most often the local currency.
4.7.2. Rate riskThe following table sets forth the maturity of Technip’s fi nancial assets and fi nancial debts as of December 31, 2009. The schedule of maturity corresponds to the date of revision of interest rates.
In millions of EuroCall Money Rate
within 1 Year 1 to 5 years Over 5 years Total
Convertible Bonds
- - - -(including Accrued Interest Payable)
Bond Loans
18.1 650 - 668.1(including Accrued Interest Payable)
Bank Borrowings and Credits
5.1 133.8 23.2 162.1(including Accrued Interest Payable)
Refundable Advances - - - -
Fixed Rate 23.2 783.8 23.2 830.2
Cash and Cash Equivalents (2,656.3) - - (2,656.3)
Commercial Papers - - - -
Bank Loans and Credits 3.4 27.5 10 40.9
Bank Overdrafts 1.6 - - 1.6
Floating Rate (2,651.3) 27.5 10.0 (2,613.8)
Total (2,628.1) 811.3 33.2 (1,783.6)

0212009 Reference Document
Risk Factors
4.7. Market risks 4
Sensitivity analysis in regards to a change in interest ratesTechnip’s variable rate debt amounted to €42.5 million, as compared to total debt of €872.7 million.
The Group’s treasury is invested in short-term securities so as to ensure its liquidity. Financial products vary depending on the fl uctuations in currency interest rates.
As of December 31, 2009, the Group’s net short-term cash posi-tion (cash and cash equivalents less short-term fi nancial debts) amounted to €2,628.1 million.
A 1% (100 basis points) increase in interest rates would reduce the fair value of the fi xed rate debt issuance before taxes as of December 31, 2009 by €10.6 million. Conversely, a decrease of 1% (100 basis points) would increase fair value before taxes by €29.1 million.
Moreover, a 1% (100 basis points) increase in interest rates would generate an additional profi t of €26.3 million before tax to the Group’s short-term net cash position. A 1% (100 basis points) decrease in interest rates would generate a loss in the same amount.
12/31/2009
In millions of Euro
Impact on estimated
fi nancial charges and revenues before taxes*
Impact on equity
before taxes
Impact of +1% change on interest rates 25.9 0
Impact of -1% change on interest rates (25.9) 0
* On the basis of outstanding amounts as of December 31, 2009.
Method of monitoring interest rate risksTechnip regularly analyzes its exposure to interest rate risks, under the responsibility of the Director of the Treasury Division, who reports directly to the Deputy CFO.
The Group does not use fi nancial instruments for speculative purposes.
As of December 31, 2009, the Group had not entered into any hedging instruments (e.g., interest rate swaps, forward rate agreements).
The only outstanding fi xed rate debt for which the residual matu-rity is greater than one year amounts to 807.3 million euros, and is mainly comprised of the bond loan as well as the draw downs on the subsidized loans granted to one of the Brazilian subsidiaries in connection with the pre-fi nancing of its export activity and the refi nancing of investments, and a portion of a loan granted to a Norwegian subsidiary in connection with the fi nancing of the Skandi Arctic.
4.7.3. Stock risk and other fi nancial instruments
Risks related to Technip’s shares
In millions of Euro
Portfolio of third party shares or
mutual funds (OPCVM)
Portfolio of treasury
shares
Asset balance 0 143.8
Provisions for risk 0 (100.2)
Off balance-sheet 0 0
Net total position 0 43.6
Sensitivity to changes in share priceThe Company holds 3,065,910 treasury shares. In the event of a 10% decrease in Technip’s share price, which was €49.40 at December 31, 2009, the Company would be required to record a provision in its annual accounts in an amount of €3.2 million.
The Group owns 789,067 shares of Gulf Island Fabricators Inc. (GIFI), an American company listed in New York (NASDAQ).
The Group holds no other third party shares, either directly or through a collective investment vehicle (Organisme de Placement Collectif en Valeurs Mobilières, or “OPCVM”).
See Note 26 to the Consolidated Financial Statements included in Section 20.1 of this Reference Document for a summary of investments by type of fi nancial instrument and by accounting classifi cation.
4.7.4. Raw materials riskTechnip’s main procurement relates to equipment for which raw materials are purchased by suppliers and subcontractors. This main equipment is rotating equipment, pressure vessels, heat exchangers etc…
The direct impact of variations in raw material prices on equipment cost is rather low except for some products such as pipes for which the added value is limited. Since fl exible pipes and its components are very specifi c, plants limit their stocks to needs for ongoing projects and backlog.
Technip participates in the commodity market for the procurement of its fl exible pipes and umbilical plants representing in value 11% of Group’s procurement in 2009. Such procurement is made, from the most important to the less one, of steel wires, thermoplastics and stainless steel.
A signifi cant increase in commodity prices, especially energy such as oil and gas, may impact the operating costs of the Group and its subcontractors. When Technip is committed to a lump-sum contract it is not always possible to recover an increase in commo-dity prices from clients. This could result in a decrease in profi t margins or a loss on contracts, which could have a negative impact on Technip’s results and fi nancial situation.

022 2009 Reference Document
Risk Factors
4.8. Risk management policy and insurance4
4.8. Risk management policy and insurance
Technip aims to deliver installations and services of high quality and to perform within the deadlines and budgets negotiated with its clients. Furthermore its leading global position in project mana-gement, engineering and construction for the oil and gas industry as well as the large technological portfolio that it is able to offer to its clients exposes it to technological, strategic and reputational risk, which are particulary affected by the development of the environment in which the Company operates and by applicable regulation. Consequently, a balanced management of risks and opportunities of a fi nancial, industrial, environmental, geopolitical and business nature are key elements of the economical and operational development and performance of the Group.
4.8.1. GeneralitiesDepending on their nature and importance, risks are managed by Group Divisions (see Section 4.2.2 of the Report of the Chairman of the Board of Directors to the Shareholders’ Meeting included in Annex C of this Reference Document) and at the level of Regions.Under the authority of the Chairman and Chief Executive Offi cer of the Company, the Group is organized around Corporate Divisions. Each Corporate Division contributes to the management and assessment of those risks faced by the Group within its sphere of responsibility. Risk assessment is directed from the Corporate Divisions, across the Regions and the other divisions of the Group to the level of each individual project.
Additional information on risk management and the parties involved is included in Section 4.2.2 of the Report of the Chairman of the Board of Directors to the Shareholders’ Meeting included in Annex C of this Reference Document.
Under the authority of the Senior Vice President Corporate Risk Manager, an initiative to inventory and analyze risks has been ongoing within the Group since 2008. Risks are mapped internally and improvement plan are implemented and provisions taken as necessary.
4.8.2. Crisis managementAs part of its global risk management policy, in 2008 Technip instituted an operational organization on three levels to manage all manner of crisis situations. A central system is connected directly with the Regions and the individual Projects, which have implemented their own crisis management and communication systems to increase effi ciency in the event of a crisis: these include anticipating human and material resource needs, rapid activation of the crisis management system, staff mobilization, and optimization of crisis management. Initiatives taken and training have focused on alert mechanisms, crisis management system activation, and exit strategies.
Crisis management and business continuityTechnip has implemented a crisis management system refl ecting its organizational and operational requirements, particularly Offshore and Subsea. Training and drills are regularly organized in the different Regions of the Group (including within the fl eet under the supervision of Technip Safety Division) to familiarize the Emergency Response Teams with their roles and responsibilities in case of incident.
A Business Continuity Plan in place for Corporate and will be extended to production units and to different Regions of the Group over 2010 and 2011.
4.8.3. Management of risks relating to the Group and its activities
In addition to the usual legal precautions reviewed at the project stage (see Sections 6.3.1 and 6.3.2 of this Reference Document), the Group endeavours to reduce its exposure to risks it encounters in connection with its activities. In this regard, since 2007 it has been developing a “de risking” approach, detailed in Section 6.3.3 of this Reference Document, aimed at tailoring contractual forms to the geographical areas where it performs its contracts, balan-cing backlog by business segment and at developing association strategies in order to share the risk of its projects.
More specifi cally the Group aims to reduce the risks relating to contractual exposure to construction risks and also endeavours to limit risks relating to contract performance through a selective approach to projects as early as the proposal stage. See Section 6.3.1 of this Reference Document for further information.
Furthermore, Technip includes in its selection process for subcon-tractors and suppliers a credit analysis, which could result in Technip not selecting a subcontractor or a supplier, to require that they issue bank guarantees or to adapt their payment conditions to the risks identifi ed.
With respect to its competition exposure, the Group endeavours to reduce such exposure by seeking to differentiate itself from its competitors in various areas in which Technip operates, in particular in technologies, geographical organization and execution capabilities and by proposing them to potential clients. Finally, balancing activities across geographical areas and business segments also contributes to the reduction of competition risks (see Section 6.3.3 of this Reference Document).
Risk management procedures also include the development of expertise relating to the security of large projects (the imple-mentation of a specifi c entity dedicated to the management of security of large projects: Technip Security Management System) and, if necessary, the purchase of insurance policies covering political risks.
4.8.4. Raw materials risk managementTechnip uses an information network in order to adequately anticipate risks of increase in commodity prices. For projects requiring a large quantity of the raw materials which are most sensitive to market variations, Technip’s endeavours to fi x such prices at the time of contract signature. For some contracts in which a specifi c raw material or specifi c equipment represents a signifi cant part of the contract, Technip may qualify to purchase price of such raw materials or equipment in its commercial offer in order not to support an increase in the price of such raw materials or equipment for the duration the contract.
With respect to raw materials used by Subsea in the manufacturing of fl exible pipes and umbilical in 2009, the Group used fi rst-class suppliers such as ArcelorMittal, Sandvik, Bekaert, Balmoral and Arkema.

0232009 Reference Document
Risk Factors
4.8. Risk management policy and insurance 4
Technip continuously strives to consolidate its procurement sources and to maintain suffi cient suppliers for strategic equipment and raw materials. This aims at making it possible for each Group’s project to constantly benefi t from best market conditions.
New suppliers are under qualifi cation with the opening of Asiafl ex Products, the new production unit in Malaysia. All the Group’s plants shall benefi t from these new sources. For these plants and whenever it is possible, Technip aims to conclude long term contracts with its suppliers in order to limit unforeseen turn of events linked to variations of prices of such commodity.
4.8.5. Management of maritime riskImportant prevention and protection measures have been imple-mented within Technip, including, in particular, security procedures dedicated to transit through areas considered “diffi cult” on the basis of information provided by relevant authorities. Emphasis is also placed on raising awareness and training crews in security and crisis management.
A “Technip Security Navy Tracking” system was also developed by Technip Security Division. It enables the tracking of both Technip’s fl eet and sensitive maritime areas, in order to implement appro-priate measures to reduce the exposure to potential threat.
Technip Security Division teams, exclusively dedicated to maritime protection, directly report to managers of fl eet operations in order to provide expertise and contact with the various authorities on a permanent basis.
4.8.6. Best practices / Security management for Large Projects
Over recent years, Technip has developed specific security know-how on large Projects in Africa, Asia and the Middle East. In an environment of increasingly complex and volatile therefore Technip has created its own security assessment system for an upstream identifi cation of potential risks, and a global security management system based on innovative solutions.
These different experiences have been analyzed, to extract information, which has been gathered in the Technip Security Management System handbook dedicated to the Projects security. This framework document enables the sharing of good security practices with all the entities of the Group. It encourages the integration of security issues into projects as early as possible in order to propse solutions in a tailored, measured (especially in terms of human involvement and cost) and effi cient manner at each key step. Implementation of appropriate security measures is a key factor for the successful execution of projects, in particular during the Evaluation and Construction phases. This approach is explained to clients, partners and subcontractors, to be as consistent as possible.
4.8.7. Management of air travel riskTechnip pays special attention to the security of its employees’ means of travel, especially air travel conditions. Several preventive measures have been developed in order to make Project teams aware of international recommendations for the selection of airlines and the possibility of conducting preliminary audits in order to ensure the reliability of airlines.
4.8.8. Management of risks related to information and information systems
Technip oversees the protection of its technological know-how. Security of Information Systems, especially on Projects, contributes to the preservation of this know-how and reduces risks of IT incidents, which could have repercussions on activities and proper operation of Group business.
Security of Information Systems is notably based on a pro-active approach assuming separation of operational functions and cost risks:
the system is set up by the IT Division according to strict �
guidelines;
it is internally audited by the Security Division; and �
potential vulnerabilities are immediately corrected by IT �
Division.
This process permits a continuous update of the security of the Group’s information systems.
4.8.9. Management of risk linked to its personnel
In order to attract qualifi ed employees, in 2009 Technip created new roles:
Vice President for Strategic Resources. Dedicated to specifi c �
populations of qualifi ed employees (Onshore, Offshore, Subsea, experts, critical support functions), he or she ensures Technip has the appropriate workforce plan in place to manage its resources both quantitatively and qualitatively;
these efforts are complemented by the recently created Head of �
Global Sourcing & Recruitment who is in charge of identifying talents globally, in order to meet the recruitment objectives of the Regions.
In order to retain qualifi ed employees, in 2009 Technip established a list of critical personnel composed of holders of critical positions who have high potential and for which retention mechanisms, as well as an alert system, have been put in place.
This list of critical personnel is prepared jointly by business and HR management and is updated twice a year. Such critical personnel represent 20% of the total headcount.
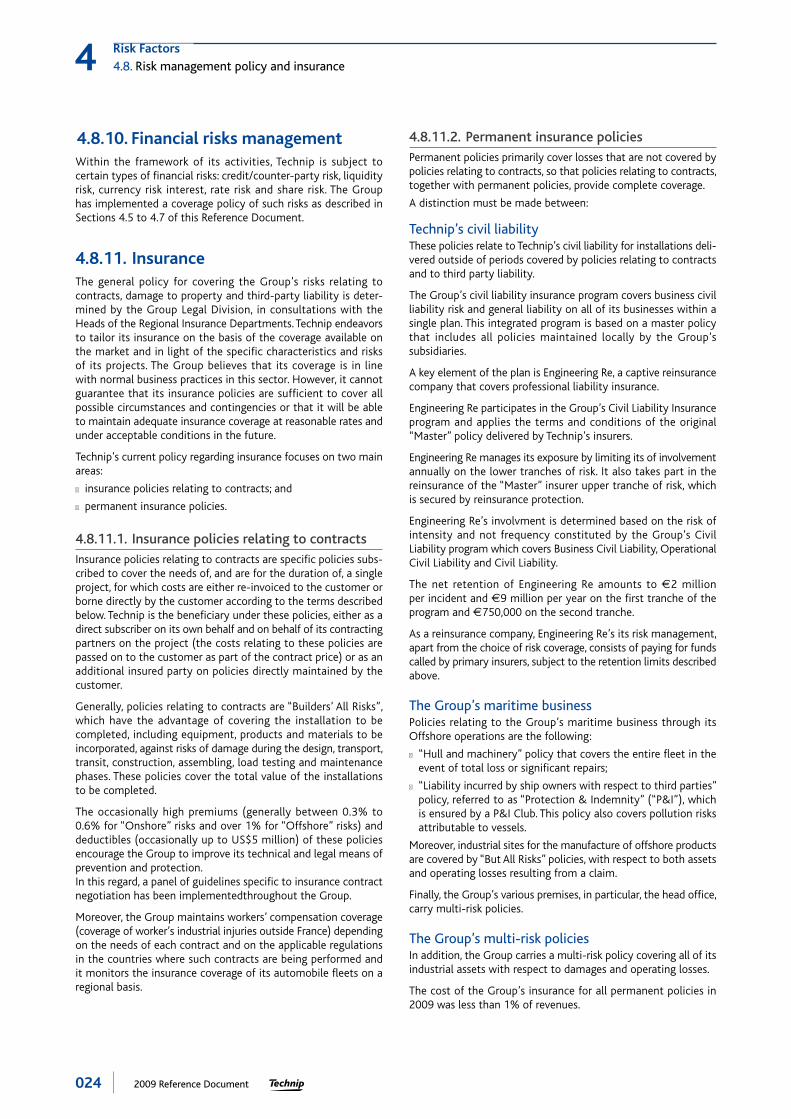
024 2009 Reference Document
Risk Factors
4.8. Risk management policy and insurance4
4.8.10. Financial risks managementWithin the framework of its activities, Technip is subject to certain types of fi nancial risks: credit/counter-party risk, liquidity risk, currency risk interest, rate risk and share risk. The Group has implemented a coverage policy of such risks as described in Sections 4.5 to 4.7 of this Reference Document.
4.8.11. InsuranceThe general policy for covering the Group’s risks relating to contracts, damage to property and third-party liability is deter-mined by the Group Legal Division, in consultations with the Heads of the Regional Insurance Departments. Technip endeavors to tailor its insurance on the basis of the coverage available on the market and in light of the specifi c characteristics and risks of its projects. The Group believes that its coverage is in line with normal business practices in this sector. However, it cannot guarantee that its insurance policies are suffi cient to cover all possible circumstances and contingencies or that it will be able to maintain adequate insurance coverage at reasonable rates and under acceptable conditions in the future.
Technip’s current policy regarding insurance focuses on two main areas:
insurance policies relating to contracts; and �
permanent insurance policies. �
4.8.11.1. Insurance policies relating to contractsInsurance policies relating to contracts are specifi c policies subs-cribed to cover the needs of, and are for the duration of, a single project, for which costs are either re-invoiced to the customer or borne directly by the customer according to the terms described below. Technip is the benefi ciary under these policies, either as a direct subscriber on its own behalf and on behalf of its contracting partners on the project (the costs relating to these policies are passed on to the customer as part of the contract price) or as an additional insured party on policies directly maintained by the customer.
Generally, policies relating to contracts are “Builders’ All Risks”, which have the advantage of covering the installation to be completed, including equipment, products and materials to be incorporated, against risks of damage during the design, transport, transit, construction, assembling, load testing and maintenance phases. These policies cover the total value of the installations to be completed.
The occasionally high premiums (generally between 0.3% to 0.6% for “Onshore” risks and over 1% for “Offshore” risks) and deductibles (occasionally up to US$5 million) of these policies encourage the Group to improve its technical and legal means of prevention and protection.In this regard, a panel of guidelines specifi c to insurance contract negotiation has been implementedthroughout the Group.
Moreover, the Group maintains workers’ compensation coverage (coverage of worker’s industrial injuries outside France) depending on the needs of each contract and on the applicable regulations in the countries where such contracts are being performed and it monitors the insurance coverage of its automobile fl eets on a regional basis.
4.8.11.2. Permanent insurance policiesPermanent policies primarily cover losses that are not covered by policies relating to contracts, so that policies relating to contracts, together with permanent policies, provide complete coverage.
A distinction must be made between:
Technip’s civil liabilityThese policies relate to Technip’s civil liability for installations deli-vered outside of periods covered by policies relating to contracts and to third party liability.
The Group’s civil liability insurance program covers business civil liability risk and general liability on all of its businesses within a single plan. This integrated program is based on a master policy that includes all policies maintained locally by the Group’s subsidiaries.
A key element of the plan is Engineering Re, a captive reinsurance company that covers professional liability insurance.
Engineering Re participates in the Group’s Civil Liability Insurance program and applies the terms and conditions of the original “Master” policy delivered by Technip’s insurers.
Engineering Re manages its exposure by limiting its of involvement annually on the lower tranches of risk. It also takes part in the reinsurance of the “Master” insurer upper tranche of risk, which is secured by reinsurance protection.
Engineering Re’s involvment is determined based on the risk of intensity and not frequency constituted by the Group’s Civil Liability program which covers Business Civil Liability, Operational Civil Liability and Civil Liability.
The net retention of Engineering Re amounts to €2 million per incident and €9 million per year on the fi rst tranche of the program and €750,000 on the second tranche.
As a reinsurance company, Engineering Re’s its risk management, apart from the choice of risk coverage, consists of paying for funds called by primary insurers, subject to the retention limits described above.
The Group’s maritime businessPolicies relating to the Group’s maritime business through its Offshore operations are the following:
“Hull and machinery” policy that covers the entire fl eet in the �
event of total loss or signifi cant repairs;
“Liability incurred by ship owners with respect to third parties” �
policy, referred to as “Protection & Indemnity” (“P&I”), which is ensured by a P&I Club. This policy also covers pollution risks attributable to vessels.
Moreover, industrial sites for the manufacture of offshore products are covered by “But All Risks” policies, with respect to both assets and operating losses resulting from a claim.
Finally, the Group’s various premises, in particular, the head offi ce, carry multi-risk policies.
The Group’s multi-risk policiesIn addition, the Group carries a multi-risk policy covering all of its industrial assets with respect to damages and operating losses.
The cost of the Group’s insurance for all permanent policies in 2009 was less than 1% of revenues.

0252009 Reference Document
Risk Factors
4.8. Risk management policy and insurance 4
4.8.11.3. Prospects of permanent policiesOver the fi rst half of 2009, the Group engaged an external consul-tant to carry out an in-depth audit of its permanent insurance coverages. The audit report provides a positive assessment of existing coverage and proposes recommendations in order to pursue improvements.Based on the recommendations of this report, which suggests, in particular, clearer policies and simpler brokerage, Technip has undertaken a three-year optimization plan (2009-2011) of its permanent coverage. This plan includes a qualitative aspect (i.e., adjustments to liability policy covers structure including an eventual captive solutions option), and a budgetary aspect (i.e., in the region of 10% reduction target while at least maintaining the same coverage contents conditions).
It has been decided to reduce the number of insurance brokers from 3 to 2.

026 2009 Reference Document
5.1. History and Development. . . . . . . . . . . . . . . . . . . . . . . . . . . . . . . . . . . . . . . . . . . . . . . . . . . . . . . . . . . . . . . . . . . . . . . . . . . . . . . . . . . . . . . . . . . . . . . . . . . . . . . . . . . . .265.1.1. Name . . . . . . . . . . . . . . . . . . . . . . . . . . . . . . . . . . . . . . . . . . . . . . . . . . . . . . . . . . . . . . . . . . . . . . . . . . . . . . . . . . . . . . . . . . . . . . . . . . . . . . . . . . . . . . . . . . . . . . . . . . . . . . . . . . . . . . . . . . . . . . . . . . . . . . . . .265.1.2. Registration place and number. . . . . . . . . . . . . . . . . . . . . . . . . . . . . . . . . . . . . . . . . . . . . . . . . . . . . . . . . . . . . . . . . . . . . . . . . . . . . . . . . . . . . . . . . . . . . . . . . . . . . . . . . . . . . . . . . . .265.1.3. Date of incorporation and term . . . . . . . . . . . . . . . . . . . . . . . . . . . . . . . . . . . . . . . . . . . . . . . . . . . . . . . . . . . . . . . . . . . . . . . . . . . . . . . . . . . . . . . . . . . . . . . . . . . . . . . . . . . . . . . . .265.1.4. Registered offi ce, legal form and applicable Law . . . . . . . . . . . . . . . . . . . . . . . . . . . . . . . . . . . . . . . . . . . . . . . . . . . . . . . . . . . . . . . . . . . . . . . . . . . . . . . . . . . . . . . .265.1.5. History . . . . . . . . . . . . . . . . . . . . . . . . . . . . . . . . . . . . . . . . . . . . . . . . . . . . . . . . . . . . . . . . . . . . . . . . . . . . . . . . . . . . . . . . . . . . . . . . . . . . . . . . . . . . . . . . . . . . . . . . . . . . . . . . . . . . . . . . . . . . . . . . . . . . . . .265.1.6. Technip and the stock exchange . . . . . . . . . . . . . . . . . . . . . . . . . . . . . . . . . . . . . . . . . . . . . . . . . . . . . . . . . . . . . . . . . . . . . . . . . . . . . . . . . . . . . . . . . . . . . . . . . . . . . . . . . . . . . . . .28
5.2. Investments . . . . . . . . . . . . . . . . . . . . . . . . . . . . . . . . . . . . . . . . . . . . . . . . . . . . . . . . . . . . . . . . . . . . . . . . . . . . . . . . . . . . . . . . . . . . . . . . . . . . . . . . . . . . . . . . . . . . . . . . . . . . . . . . . . . . . . .305.2.1. Investments made since 2007 . . . . . . . . . . . . . . . . . . . . . . . . . . . . . . . . . . . . . . . . . . . . . . . . . . . . . . . . . . . . . . . . . . . . . . . . . . . . . . . . . . . . . . . . . . . . . . . . . . . . . . . . . . . . . . . . . . .305.2.2. Main investments underway and main future investments . . . . . . . . . . . . . . . . . . . . . . . . . . . . . . . . . . . . . . . . . . . . . . . . . . . . . . . . . . . . . . . . . . . . . . .30
5Information on the Company and the Group
5.1. History and Development
5.1.1. NameThe Company’s name is “Technip”.
5.1.2. Registration place and numberCommercial register of Nanterre: 589 803 261 RCS Nanterre.
APE code: 7010 Z.
5.1.3. Date of incorporation and termThe Company was created on April 21, 1958 for a period of 99 years. The expiration date is April 20, 2057.
5.1.4. Registered offi ce, legal form and applicable Law
The registered offi ce is located at 6-8, allée de l’Arche–Faubourg de l’Arche–ZAC Danton–92400 Courbevoie (France).
The registered offi ce telephone number is +33(0)1 47 78 21 21.
Technip is a French limited liability company with a Board of Directors, governed by French law, including the provisions of Book II of the French Commercial Code.
5.1.5. History
1958-1960sTechnip was created on April 21, 1958. Its fi rst signifi cant commis-sions on the French market were Total’s Donges and Feyzin refi neries and the natural gas desulfurization in Lacq. Building on its initial success in France, Technip began to look abroad, and was awarded contracts to build refi neries in Chittagong, Abidjan and Tamatave. The Company also moved the industry forward when it won the contract to build the world’s fi rst natural gas liquefaction plant in Arzew, Algeria.
In the late 1960s, Technip expanded its operations to include petrochemicals, chemicals and fertilizers.
After opening a site in Lyon, the Company entered into contracts to build the natural gas liquefaction plant in Skikda, Algeria and the fi rst unit of the natural gas desulphurization complex in Orenburg, the former USSR.
1970sIn the early 1970s, Technip worked to assemble an international engineering group, including Technipetrol in Rome and Tecplant in Barcelona.

0272009 Reference Document
Information on the Company and the Group
5.1. History and Development 5
Technip’s young petrochemicals business was awarded two major contracts: one for China’s massive Liao Yang complex and one for the number two steam cracker in Feyzin, France.
1971 saw the birth of Cofl exip, a company specialized in the design and manufacture of the fl exible pipes used in subsea hydrocarbon extraction.
Over the course of this decade, Technip also created Technip-Geoproduction, a hydrocarbon fi eld equipment specialist, and merged with COCEI, an engineering company specialized in various non-oil industrial sectors such as bottling factory and cement, fuelling the Company’s sector diversifi cation.
Building on its earlier success in the ex-USSR, Technip entered into contracts worth FRF2.5 billion (around €381 million) for aromatic complexes in Ufa and Omsk, as well as a contract to improve 2,000 oil wells in Western Siberia using gas lift tech-nology. Technip was awarded its fi rst projects in Brazil and the Middle East, to build steam crackers in Triunfo, Brazil and Umm Said, Qatar.
1980sThe early 1980s brought signifi cant progress for the Company’s business in the Middle East and in Asia, with contracts to build a gas processing plant in Zubair, Iraq and the refi nery in Umm Said, Qatar, as well as with the creation of TPG Malaysia in Kuala Lumpur and Technip Abu Dhabi. Technip entered into a contract to build a refi nery in Al Jubail, Saudi Arabia with an annual capacity of 12 million tons, and launched the fi rst phase of the Astrakhan gas complex in the ex-USSR. It also purchased Creusot Loire Entreprise (CLE), gaining a foothold in the cement industry.
In the mid 1980s, while undergoing a fi nancial restructuring, Technip was awarded two major gas processing contracts: Astrakhan 2 in the ex-USSR and North Field in Qatar. Adding to Technip’s reputation as a pioneer, Technip-Geoproduction achieved a technological breakthrough with the raising of the Ekofi sk platforms in the North Sea. In cooperation with SGN, the Company also assisted in expanding the nuclear fuel reprocessing plant in La Hague. To help service its growing South American presence, Cofl exip built a fl exible pipe plant in Brazil in 1986.
At the turn of the decade, the Group founded Technip Seri Construction and acquired a stake in Portuguese engineering company, Lusotecna.
1990sIn 1990, Cofl exip founded an umbilical manufacturing plant, Duco Ltd.
Turnkey business became a major part of Technip’s work in the early 1990s, with gas processing installations such as Accro 1 in Venezuela and Bab Habshan (OGD 1) in Abu Dhabi. Continuing its expansion, Technip acquired Spie-Batignolles’ industrial engineering operations (Speichim and EGI) and took over Saint Petersburg-based company Lentep, which it renamed Technip CIS. Cofl exip also acquired Perry Tritech Inc., a radio-guided subsea robot manufacturer.
Cofl exip was listed on the NASDAQ in 1993, and Technip was listed on the Paris Stock Exchange in 1994.
Turnkey construction of the Leuna refi nery in Germany and the Bonny natural gas plant in Nigeria began in the 1990s. Technip also delivered breakthroughs in the worldwide upstream oil sector with the world’s largest fl oating production unit in the N’Kossa, Congo fi eld and the fi rst TGP 500 platform in the Harding fi eld in the North Sea.
The mid 1990s saw another fl urry of expansion. The Company founded Technip Tianchen in China, acquired a majority stake in Houston’s upstream oil specialist, CBS Engineering, and, with SGN, created Krebs-Speichim, a chemical engineering company. The Group rounded out the decade with the acquisition of KTI/MDEU and the creation of Technip Germany, Technip USA and Technip Benelux, increasing its workforce by more than one-third in just a few short years to 10,000. It was at this point that Technip became the industry’s European leader.
Meanwhile, Cofl exip acquired the Stena Offshore Group, a subsea works business in the crude oil-related industry, specializing in the installation of “reeled” pipes, and built a steel umbilicals manufacturing unit, Duco Inc., in Houston, Texas.
2000sIn April 2000, Technip took an important step by becoming Cofl exip’s largest shareholder. Separately, Cofl exip acquired Slingsby Engineering Systems Ltd, a subsea robotic systems maker.
2001 was a year of major organizational changes: Krebs-Speichim merged with Technip, creating Technip LCI from the Life Science, Chemical and Industry segments. In 2001, Technip also acquired Brazilian engineering company UTC.
Cofl exip acquired Aker Maritime’s Deep Sea division. Technip launched a takeover bid for Cofl exip in 2001. The two companies were merged into Technip-Cofl exip, Europe’s leading operator in the engineering, technology and oil and gas services sectors, and the fi fth-largest worldwide. Technip was listed on the New York Stock Exchange (NYSE) in 2001.
By the mid-2000s, Technip was generating annual revenues of nearly €5.4 billion and boasted a workforce of nearly 21,000 employees representing 60 nationalities and working in more than 50 countries.
Once the integration of its acquisitions was complete, Technip underwent a structural reorganization, and adapted its asset base to changes in its markets:
Technip UK Limited concluded a memorandum of understan- ■
ding with Mermaid Offshore Services Limited, for the sale of Marianos, a diving support vessel;
Technip USA Holdings Inc sold the assets and business of Gulf ■
Marine Fabricators, a Technip subsidiary located near Corpus Christi, Texas, USA, to a subsidiary of Gulf Island Fabrication, Inc. (NASDAQ: GIFI). They also signed a cooperation agreement for engineering, construction and procurement (ECP) projects, which gave Technip the continued benefi t of access to manufacturing capacities in the Gulf of Mexico;

028 2009 Reference Document
Information on the Company and the Group
5.1. History and Development5
Technip sold its stake in Technip Portugal to the branch’s ■
management, changing its name to Technoedif Engenharia. This Lisbon-based company carries out engineering projects for the Portuguese market and continues to work with Technip on a case-by-case basis;
Technip created a joint venture with Subsea 7 to address subsea ■
operations in the Asia Pacifi c region (excluding India and the Middle East). Technip Subsea 7 Asia Pacifi c Pty Ltd began opera-tions on July 1, 2006. In February 2009, Technip and Subsea 7 announced their decision to terminate this joint venture.
In keeping with its policy of selling assets that are not part of its core business, Technip sold its 100% holding in the share capital of Perry Slingsby Systems Ltd. and Perry Slingsby Systems Inc. to Triton Group Holdings in early 2007. Technip also sold several other companies and holdings:
it sold its 20% stake in Nargan, an Iranian engineering company, ■
to another of Nargan’s shareholders;
Technip sold its holding in Guigues, a company specialized ■
in water treatment and the environment, to a subsidiary of Institut Pasteur.
In addition, the Group continued to consolidate its leadership in the oil and gas markets by acquiring complementary technologies and technological expertise, as well as geographical positions that enabled it to extend its global market coverage and by strengthe-ning its construction and manufacturing activities:
Citex, a wholly-owned subsidiary of Technip specializing in chemical ■
engineering, acquired Setudi, an engineering company with a staff of approximately 40 employees, located in Rouen, France;
Technip Offshore (Nigeria) Limited, a wholly-owned subsidiary of ■
Technip, acquired a 39% stake in Crestech Engineering Limited, a Nigerian company with a staff of approximately 100 employees, at the time of its creation.
Technip also grew organically by increasing fl exible pipe produc-tion and plant capacity by 50% in Vitoria, Brazil and by 20% in Le Trait, France. Malaysia-based Asiafl ex Products, wholly owned by the Group, was created to build a fl exible pipe and umbilicals manufacturing plant, further reinforcing Technip’s fl exible pipe manufacturing capacity. A joint venture was created between Technip Norge AS and Dofcon AS for the ownership of the Skandi Arctic vessel built for the Norwegian market.
Later in 2007, Technip voluntarily delisted its American Depositary Shares (ADS) from the New York Stock Exchange (NYSE) and deregistered from the United States Securities and Exchange Commission (SEC).
Despite the tumultuous economy in 2008, Technip seized opportu-nities to develop its activities. The Company acquired engineering and consulting company Eurodim, and a joint venture with Areva called the TSU Project was formed to develop major mining projects. Technip’s Onshore segment acquired EPG (BV Ingenieursbureau EPG), an engineering specialist with strong positions in the oil and gas and petrochemical sectors, bringing Technip’s total staff in the Benelux region to over 500 employees.
Technip is accompanying its clients in developing innovative alter-native energy projects, including Hywind, the world’s fi rst full-scale offshore fl oating wind turbine and a partnership agreement signed on August 1, 2008, with Geogreen on a non-exclusive basis. This agreement allows Technip to team its know-how in CO2 capture, transport and gas compression for injection into underground structures, with Geogreen’s expertise in CO2 transport and geological storage and enables the two companies to offer their clients studies on integrated solutions for the entire carbon (CO2) capture, transport and storage chain.
Currently with these projects, Technip continued to win new contracts, confi rming its leadership position among engineering, construction and service provider to the oil and gas industry. The Company also expanded its Angofl ex umbilical manufacturing plant in Lobito, Angola as part of a unique hub of local assets serving the West African deepwater market.
Technip’s business in 2009 is described in Section 6.1.1 of this Reference Document.
5.1.6. Technip and the stock exchangeOn September 21, 2009, Technip was included in the CAC 40, the primary index of the Paris Stock Exchange (Euronext Paris), where the Group is listed. Against a backdrop of recovering economic growth, and on the back of a strategy that continues to focus on profi tability, industrial risk management, successful project execution and technological excellence, Technip’s stock turned in the strongest performance of the CAC 40 index, gaining 126.5% in 2009.
At December 31, 2009, Technip’s shares ranked 34th on the CAC 40 by weighted capitalization (0.68%).

0292009 Reference Document
Information on the Company and the Group
5.1. History and Development 5
Share Price Performance on Euronext Paris–Compartment A (from January 2, 2009 to December 31, 2009)
-40%
-20%
0%
20%
40%
60%
80%
100%
120%
140%
01/0
1/09
02/0
1/09
03/0
1/09
04/0
1/09
05/0
1/09
06/0
1/09
07/0
1/09
08/0
1/09
09/0
1/09
10/0
1/09
11/0
1/09
12/0
1/09
12/3
1/09
Technip = 126.5% CAC 40 = 22.3%
Technip Share Performance on Euronext Paris over the last 18 months
High/low prices (in Euro)
Date Highest Lowest Number of shares traded Capital exchanged
2008 September 2008 56.35 36.40 21,338,997 973,711,600
October 2008 40.24 19.50 38,492,178 997,007,300
November 2008 26.46 16.75 23,323,221 505,914,500
December 2008 23.68 18.00 20,213,247 422,094,700
2009 January 2009 27.00 20.70 16,902,760 406,818,500
February 2009 28.88 23.04 16,757,111 442,665,100
March 2009 29.465 22.81 19,944,507 540,917,400
April 2009 33.71 25.95 18,622,605 547,786,000
May 2009 35.77 30.7 16,878,769 580,291,300
June 2009 38.2 31.52 17,895,277 643,757,400
July 2009 43.5 32.21 18,483,277 701,757,700
August 2009 47.03 40.1 10,368,993 457,248,100
September 2009 46.88 39.97 21,698,203 988,656,000
October 2009 51.96 41.6 15,636,183 737,792,300
November 2009 49.88 42 11,957,916 568,601,100
December 2009 49.95 45.55 9,113,709 439,723,200
2010 January 2010 53.39 47.61 12,814,145 657,520,400
February 2010 55 47.67 19,662,678 1,038,777,000

030 2009 Reference Document
Information on the Company and the Group
5.2. Investments5
5.2. Investments
5.2.1. Investments made since 2007To meet sustained demand in this sector, Technip launched a major investment program in 2006 for the 2007-2010 period to expand its fl eet and to increase its fl exible pipeline production capacity. This program includes:
a rigid pipelay vessel, the NPV named ■ Deep Energy with a top speeds of 20 knots per hour, designed to be used in the North Sea and in the deep sea of the golden triangle (Gulf of Mexico, Brazil, West Africa);
a diving and construction vessel, the ■ Skandi Arctic, held equally with Dofcon, which was designed for a framework agreement signed with StatoilHydro in 2005 for the Norwegian market;
a fl exible pipelay vessel in Brazil, the ■ Skandi Vitoria, to meet the recent increase in the Group’s plant capacity in this country;
a 10-year lifespan extension for the ■ Orelia, diving vessel that has operated in the North Sea since September 2008;
an umbilical pipelay system designed for the deep seas of the ■
Gulf of Mexico;
a total increase of 30% in the production capacities of the ■
Le Trait (France) and Vitoria (Brazil) plants; and,
the construction of a new 200 km/year fl exible pipe plant in ■
Malaysia, with production expected to begin in 2010.
In June 2009, a new construction support vessel, the Apache II, was acquired from Oceanteam ASA. This new vessel, delivered in August 2009, will carry out rigid pipelay operations in a wide range of water depths.
The total amount of these investments at December 31, 2009 amounted to €423.6 million. The breakdown by segment is as follows:
Subsea: ■ €399.4 million;
Offshore: ■ €8.1 million;
Onshore: ■ €16.1 million.
In 2009 the construction of the Deep Energy, the Skandi Arctic and the Skandi Vitoria moved forward according to the invest-ment program for the 2007-2010 period as described above. The expenses related to this construction for the year 2009 amounted to €67.7 million, €22.1 million and €66.1 million, respectively. The completion rates on these projects were 72.7%, 99.7% and 91.2%, respectively, at December 31, 2009.
5.2.2. Main investments underway and main future investments
Technip will continue its 2007-2010 investment program through- out 2010, and investments should amount to approximately €400 million.
Technip decided to add a subsea umbilicals production unit for the Asia Pacifi c market to its Asiafl ex Products fl exible pipe manu-facturing plant, currently under construction in Malaysia.
Technip also expects increase the production capacity of its umbilicals plant in Angola in order to meet the increasing demand of deep water projects and to increase its local presence.

0312009 Reference Document
6.1. Technip’s business in 2009 . . . . . . . . . . . . . . . . . . . . . . . . . . . . . . . . . . . . . . . . . . . . . . . . . . . . . . . . . . . . . . . . . . . . . . . . . . . . . . . . . . . . . . . . . . . . . . . . . . . . . . . . . .326.1.1. Business activities in 2009 . . . . . . . . . . . . . . . . . . . . . . . . . . . . . . . . . . . . . . . . . . . . . . . . . . . . . . . . . . . . . . . . . . . . . . . . . . . . . . . . . . . . . . . . . . . . . . . . . . . . . . . . . . . . . . . . . . . . . . . .326.1.2. Major Acquisitions and Divestments in 2009 . . . . . . . . . . . . . . . . . . . . . . . . . . . . . . . . . . . . . . . . . . . . . . . . . . . . . . . . . . . . . . . . . . . . . . . . . . . . . . . . . . . . . . . . . . .366.1.3. Events between January 2010 and the Reference Document publication date . . . . . . . . . . . . . . . . . . . . . . . . . . . . . . . . . . . . . . . .36
6.2. Group business environment. . . . . . . . . . . . . . . . . . . . . . . . . . . . . . . . . . . . . . . . . . . . . . . . . . . . . . . . . . . . . . . . . . . . . . . . . . . . . . . . . . . . . . . . . . . . . . . . . . . . . .376.2.1. Market environment . . . . . . . . . . . . . . . . . . . . . . . . . . . . . . . . . . . . . . . . . . . . . . . . . . . . . . . . . . . . . . . . . . . . . . . . . . . . . . . . . . . . . . . . . . . . . . . . . . . . . . . . . . . . . . . . . . . . . . . . . . . . . . . . .376.2.2. Group business segments . . . . . . . . . . . . . . . . . . . . . . . . . . . . . . . . . . . . . . . . . . . . . . . . . . . . . . . . . . . . . . . . . . . . . . . . . . . . . . . . . . . . . . . . . . . . . . . . . . . . . . . . . . . . . . . . . . . . . . . . .376.2.3. Geographical areas where the Group is present . . . . . . . . . . . . . . . . . . . . . . . . . . . . . . . . . . . . . . . . . . . . . . . . . . . . . . . . . . . . . . . . . . . . . . . . . . . . . . . . . . . . . . .39
6.3. Description of project strategy . . . . . . . . . . . . . . . . . . . . . . . . . . . . . . . . . . . . . . . . . . . . . . . . . . . . . . . . . . . . . . . . . . . . . . . . . . . . . . . . . . . . . . . . . . . . . . . . . .396.3.1. Selective approach to projects . . . . . . . . . . . . . . . . . . . . . . . . . . . . . . . . . . . . . . . . . . . . . . . . . . . . . . . . . . . . . . . . . . . . . . . . . . . . . . . . . . . . . . . . . . . . . . . . . . . . . . . . . . . . . . . . . .396.3.2. Internal process for review of potential transactions . . . . . . . . . . . . . . . . . . . . . . . . . . . . . . . . . . . . . . . . . . . . . . . . . . . . . . . . . . . . . . . . . . . . . . . . . . . . . . . .396.3.3. A “de-risking” approach . . . . . . . . . . . . . . . . . . . . . . . . . . . . . . . . . . . . . . . . . . . . . . . . . . . . . . . . . . . . . . . . . . . . . . . . . . . . . . . . . . . . . . . . . . . . . . . . . . . . . . . . . . . . . . . . . . . . . . . . . . . .396.3.4. Description of contractual forms . . . . . . . . . . . . . . . . . . . . . . . . . . . . . . . . . . . . . . . . . . . . . . . . . . . . . . . . . . . . . . . . . . . . . . . . . . . . . . . . . . . . . . . . . . . . . . . . . . . . . . . . . . . . . .406.3.5. Types of associations . . . . . . . . . . . . . . . . . . . . . . . . . . . . . . . . . . . . . . . . . . . . . . . . . . . . . . . . . . . . . . . . . . . . . . . . . . . . . . . . . . . . . . . . . . . . . . . . . . . . . . . . . . . . . . . . . . . . . . . . . . . . . . . .40
6.4. The Group’s business segments. . . . . . . . . . . . . . . . . . . . . . . . . . . . . . . . . . . . . . . . . . . . . . . . . . . . . . . . . . . . . . . . . . . . . . . . . . . . . . . . . . . . . . . . . . . . . . . . .416.4.1. Subsea. . . . . . . . . . . . . . . . . . . . . . . . . . . . . . . . . . . . . . . . . . . . . . . . . . . . . . . . . . . . . . . . . . . . . . . . . . . . . . . . . . . . . . . . . . . . . . . . . . . . . . . . . . . . . . . . . . . . . . . . . . . . . . . . . . . . . . . . . . . . . . . . . . . . . . .416.4.2. Onshore . . . . . . . . . . . . . . . . . . . . . . . . . . . . . . . . . . . . . . . . . . . . . . . . . . . . . . . . . . . . . . . . . . . . . . . . . . . . . . . . . . . . . . . . . . . . . . . . . . . . . . . . . . . . . . . . . . . . . . . . . . . . . . . . . . . . . . . . . . . . . . . . . . . .426.4.3. Offshore . . . . . . . . . . . . . . . . . . . . . . . . . . . . . . . . . . . . . . . . . . . . . . . . . . . . . . . . . . . . . . . . . . . . . . . . . . . . . . . . . . . . . . . . . . . . . . . . . . . . . . . . . . . . . . . . . . . . . . . . . . . . . . . . . . . . . . . . . . . . . . . . . . . .44
6.5. Suppliers . . . . . . . . . . . . . . . . . . . . . . . . . . . . . . . . . . . . . . . . . . . . . . . . . . . . . . . . . . . . . . . . . . . . . . . . . . . . . . . . . . . . . . . . . . . . . . . . . . . . . . . . . . . . . . . . . . . . . . . . . . . . . . . . . . . . . . . . . . . .45
6.6. Environment . . . . . . . . . . . . . . . . . . . . . . . . . . . . . . . . . . . . . . . . . . . . . . . . . . . . . . . . . . . . . . . . . . . . . . . . . . . . . . . . . . . . . . . . . . . . . . . . . . . . . . . . . . . . . . . . . . . . . . . . . . . . . . . . . . . . .456.6.1. Resource consumption. . . . . . . . . . . . . . . . . . . . . . . . . . . . . . . . . . . . . . . . . . . . . . . . . . . . . . . . . . . . . . . . . . . . . . . . . . . . . . . . . . . . . . . . . . . . . . . . . . . . . . . . . . . . . . . . . . . . . . . . . . . . . .456.6.2. Raw materials, energy and energy effi ciency . . . . . . . . . . . . . . . . . . . . . . . . . . . . . . . . . . . . . . . . . . . . . . . . . . . . . . . . . . . . . . . . . . . . . . . . . . . . . . . . . . . . . . . . . . . .466.6.3. Greenhouse gas emissions (GGE) . . . . . . . . . . . . . . . . . . . . . . . . . . . . . . . . . . . . . . . . . . . . . . . . . . . . . . . . . . . . . . . . . . . . . . . . . . . . . . . . . . . . . . . . . . . . . . . . . . . . . . . . . . . . .466.6.4. Waste. . . . . . . . . . . . . . . . . . . . . . . . . . . . . . . . . . . . . . . . . . . . . . . . . . . . . . . . . . . . . . . . . . . . . . . . . . . . . . . . . . . . . . . . . . . . . . . . . . . . . . . . . . . . . . . . . . . . . . . . . . . . . . . . . . . . . . . . . . . . . . . . . . . . . . . .476.6.5. Noise pollution . . . . . . . . . . . . . . . . . . . . . . . . . . . . . . . . . . . . . . . . . . . . . . . . . . . . . . . . . . . . . . . . . . . . . . . . . . . . . . . . . . . . . . . . . . . . . . . . . . . . . . . . . . . . . . . . . . . . . . . . . . . . . . . . . . . . . . . . .476.6.6. Biodiversity protection. . . . . . . . . . . . . . . . . . . . . . . . . . . . . . . . . . . . . . . . . . . . . . . . . . . . . . . . . . . . . . . . . . . . . . . . . . . . . . . . . . . . . . . . . . . . . . . . . . . . . . . . . . . . . . . . . . . . . . . . . . . . . .476.6.7. Legal and regulatory compliance . . . . . . . . . . . . . . . . . . . . . . . . . . . . . . . . . . . . . . . . . . . . . . . . . . . . . . . . . . . . . . . . . . . . . . . . . . . . . . . . . . . . . . . . . . . . . . . . . . . . . . . . . . . . . .476.6.8. Expenses related to reducing the Group’s environmental impact. . . . . . . . . . . . . . . . . . . . . . . . . . . . . . . . . . . . . . . . . . . . . . . . . . . . . . . . . . . . .476.6.9. Health, Safety and Environmental organization. . . . . . . . . . . . . . . . . . . . . . . . . . . . . . . . . . . . . . . . . . . . . . . . . . . . . . . . . . . . . . . . . . . . . . . . . . . . . . . . . . . . . . . .476.6.10. Environmental provisions and guaranties – Compensation paid during the fi nancial year ended
December 31, 2009 stemming from Court’s decisions on environmental issues and subsequent actions damage repair. . . . . . . . . . . . . . . . . . . . . . . . . . . . . . . . . . . . . . . . . . . . . . . . . . . . . . . . . . . . . . . . . . . . . . . . . . . . . . . . . . . . . . . . . . . . . . . . . . . . . . . . . . . . . . . . . . . . . . . . . . . . . . .48
6.6.11. Targets assigned to subsidiaries outside France . . . . . . . . . . . . . . . . . . . . . . . . . . . . . . . . . . . . . . . . . . . . . . . . . . . . . . . . . . . . . . . . . . . . . . . . . . . . . . . . . . . . . . . .48
6Overview of the Group’s Activities

032 2009 Reference Document
Overview of the Group’s Activities
6.1. Technip’s business in 20096
6.1.1. Business activities in 2009Technip’s top priorities in 2009 continued to be good project execution, profi tability and targeting selected contracts of all sizes that refl ect its technological strengths and for which Technip believes that it has a particular expertise enabling it to contri-bute particular insight and add value. In this context, Technip has brought in quality projects that showcase its expertise, and has made small acquisitions and formed alliances that lay the groundwork for future profi table growth. The recovery in oil prices and lower input costs have led to an increase in our tendering activity. Nonetheless conditions remain challenging. Accordingly, Technip will stick to its strategic priorities, continuing to invest in new assets and R&D with a focus on areas that highlight its differentiating attributes.
The Subsea segment had a great year for ground-breaking accomplishments and new business, notably in the Gulf of Mexico, the North Sea and Brazil. In March Technip’s work at Shell’s Perdido Development in the Gulf of Mexico set two new industry records: deepest reeled fl owline installation at a water depth of 2,961 meters (9,713 feet), and deepest reeled steel catenary riser installation at a water depth of 2,469 meters (8,100 feet). These new records further demonstrate the leadership of Technip in the deep subsea market.
Building on this leadership, in March Technip was awarded a lump-sum contract from ConocoPhillips Skandinavia AS for the Ekofi sk VA subsea water injection project located in block 2/4 on the Norwegian Continental Shelf. This contract provides for the installation, tie-in and commissioning of subsea facilities between the existing Ekofi sk facilities and a new eight-well subsea injection template (2/4VA). The contract includes installation engineering, procurement of installation equipment, installation of client provided spools, fl exible fl owlines and umbilicals; and design, fabrication and installation of protection covers, and tie-in and commissioning. Installation will be performed by several vessels, including Technip’s newly-built diving support vessel, the Skandi Arctic.
In May Technip won three EPIC contracts in the Gulf of Mexico: a contract by W&T Offshore Inc. to develop the Daniel Boone fi eld as well as two lump-sum contracts from Bluewater Industries for the Telemark and Clipper Corridor fi eld developments. The latter two contracts include high pressure fl exible risers made by Technip. The Telemark fi eld is located in Atwater Valley Block 63 at a water depth of 1,357 meters (4,450 feet) and is being tied back to the ATP Titan platform, while the Clipper Corridor fi eld is located in Green Canyon Block 299, at a water depth of 1,055 meters (3,460 feet) and is tied back to the Front Runner platform.
May also saw Technip win a BHP Billiton contract for the fabri-cation, transportation and installation of a fl owline, as well as
the transportation and installation of an umbilical for the BHP Billiton-operated Angostura gas project located off Trinidad & Tobago in approximately 30 meters (100 feet) of water.
Technip kicked off the summer by winning yet another Gulf of Mexico contract: the K2 fi eld expansion project operated by Anadarko Petroleum Corporation. Two additional wells will be tied back to the existing subsea equipment and to the Marco Polo platform with production fl owlines. These wells are located in Green Canyon Blocks 562 and 606 at a water depth of approxi-mately 1,200 meters (4,000 feet).
Adding to its successes in the Gulf of Mexico, Technip was awarded two lump-sum contracts by Anadarko Petroleum Corporation as Unit Operator for the Caesar/Tonga oil fi eld development. The fi rst contract includes four pipe-in-pipe fl owlines which provide insulation and fl ow assurance for effective production in deep and ultra-deep water. The second EPIC contract also covers engineering and fabrication of two control umbilicals and their termination hardware.
At the end of the summer, Technip won a lump-sum contract from Marathon Oil Company for the Ozona fi eld development in the Gulf of Mexico. The project consists of the tie-in of a well in Garden Banks 515 (3,280 feet – 1,000 meters – water depth) to the Shell Auger platform. The EPIC contract covers a pipe-in-pipe fl owline, two PLETs, an anchor pile and rigid jumper, and installa-tion of an umbilical.
In September Technip won its fi rst contract from DONG E&P Norge AS – an engineering, procurement, construction and installation project for the Oselvar fi eld development (1) offshore Norway at a water depth of 72 meters. The lump sum contract covers turnkey delivery of an approximately 27 kilometers (17 miles) long pipe-in-pipe fl owline, installation of umbilical and subsea equipment and tie-ins.
Next in September came a lump sum contract with BP Exploration and Production Company for the Isabela project in the Gulf of Mexico. The project is a subsea tie-back to the Na Kika semi-submersible platform located in Mississippi Canyon, 225 kilometers (140 miles) offshore New Orleans, Louisiana, at a water depth of approximately 1,920 meters (6,300 feet). The contract covers project management and engineering, fabrication and installation of pipe-in-pipe fl owlines, steel catenary risers and subsea equipments.
Adding to the company’s development in Africa, Technip secured two lump sum contracts with Tullow Ghana Limited (2) for the development of the Jubilee oil fi eld. This fi eld is located off the coast of Ghana at water depths ranging between 1,200 and 1,700 meters (3,937 to 5,577 feet).
(1) The Production License No. PL 274 and 274CS (Oselvar) Owner Group consists of Norwegian Energy Company ASA (NORECO), Bayerngas Norge AS and DONG E&P Norge AS
(operator).(2) Tullow Ghana Limited is the Jubilee Field Unit Operator and Kosmos Energy is the Technical Operator leading the Integrated Project Team.
6.1. Technip’s business in 2009

0332009 Reference Document
Overview of the Group’s Activities
6.1. Technip’s business in 2009 6
The fi rst contract comprises the engineering and fabrication of seven 10-inch diameter and two 8-inch diameter risers for a total length of more than 27 kilometers (17 miles). The second covers engineering, fabrication and installation of approximately 48 kilo-meters (30 miles) of production and gas and water injection rigid fl owlines; installation of 26 kilometers (16 miles) of umbilicals, nine fl exible risers (supplied by Technip under the fi rst contract) and subsea manifold and riser base structures; connection of the fl owlines to the wellheads and subsea manifolds; and testing the entire system. The offshore campaign is scheduled to start in early 2010.
Recognizing Technip’s ability to tackle innovative projects, Eni Norge AS awarded us an engineering, procurement, construction and installation contract for the Goliat fi eld development (1). Goliat will be the fi rst Norwegian oil-producing fi eld north of the Arctic Circle in the Barents Sea. The fi eld is located approximately 85 kilometers (53 miles) northwest of the city of Hammerfest on the Norwegian coast. The lump sum contract includes supply and installation of the infi eld pipeline systems, including fl exible risers, clad production fl owlines complete with direct heating systems, and water and gas injection fl owlines. The contract also comprises the installation of the subsea production system, inclu-ding umbilicals, templates and riser bases provided by the client. Technip was selected by Eni Norge after an in-depth evaluation of the technical and commercial aspects of the contract. Offshore installation is scheduled to be carried-out over three construction seasons from 2011 to 2013.
In November Technip was awarded a lump sum contract by ENI US Operating for the Appaloosa development project in the Gulf of Mexico at a water depth of approximately 860 meters (2,825 feet). The contract covers project management and surveys, engineering, fabrication and installation of a 34 kilo-meters (21 miles long) production fl owline, a riser and subsea equipment; installation of free issued umbilical and fl ying leads; and pre-commissioning and dewatering of the fl owline.
In December Technip was awarded an engineering, procurement, construction and installation lump sum contract by Statoil ASA for the Åsgard Gas Transfer Project (2), located on the Norwegian Continental Shelf at a water depth of 300 meters (984 feet). The contract covers fabrication and installation of an approximately 4 kilometers (2.5 miles) long rigid fl owline in 2010 and the repla-cement of two fl exible risers in 2011.
Technip also won a lump sum engineering, procurement, installa-tion and construction (EPIC) contract from Burullus Gas Company SAE (3) for the West Delta Deep Marine (WDDM) Phase VII development project. The project is designed to maintain overall plateau production for the WDDM Concession, located 95 kilo-meters (59 miles) offshore Egypt in the Mediterranean. Technip’s operating center in Oslo, Norway, will execute this contract with assistance from the Group’s team in Cairo, Egypt. It covers turnkey delivery of the tie-in structure between a new gas export pipeline and two existing pipelines, including the connecting work that
will be carried out without stopping the ongoing production (“hot tap tie-in”). This contract demonstrates the synergies between Technip’s operating centers and the fl exibility of its organization.
As 2009 drew to a close, Technip added two more contracts from BP for the Schiehallion fi eld development. The fi eld is located in the North Sea, 175 kilometers (110 miles) west of the Shetland Islands, United Kingdom. The fi rst contract, already completed, was on a lump sum/reimbursable basis and covered the design and manufacture of a 720 meters (2,400 feet) gas-lift fl exible riser and a 770 meters (2,500 feet) water-injection fl exible riser. The second contract testing of the entire system. The offshore, on a reimbursable basis, covers the installation of these risers, as well as pre-commissioning, tie-ins and testing. These awards fall under a current agreement with BP to provide diving construction services for extensions to existing hydrocarbon fi eld development projects in the North Sea.
In other Subsea segment news Technip and Subsea 7 announced in February that they would dissolve their joint venture, Technip Subsea 7 Asia Pacifi c (TS7), once all its existing projects and tendered work have been completed. TS7 was formed in 2006 after several years of collaboration between the two companies and has successfully executed a number of major offshore deve-lopment projects. With the expected continued growth of the deepwater subsea construction market in the region, the parties now wish to pursue separate strategic development opportunities, but this does not exclude working together on a case-by-case basis on future projects.
During the summer of 2009, Technip acquired a newly built construction support vessel hull, the North Ocean 103, from Oceanteam ASA. The transaction was completed with the purchase of the ship-owning entity, North Ocean III KS. The vessel will be fi tted out to Technip’s specifi cations in 2009/10 at its yard in Pori, Finland. The acquisition accelerates Technip’s strategy of renewing its fl eet with state-of-the-art pipelay and construction vessels. The North Ocean 103 will enable the company to replace the 30-year-old Apache in 2010. This new vessel will strengthen Technip’s abilities to carry out rigid pipelay operations in harsh environments and a wide variety of water depths. This operation illustrates Technip’s confi dence in the Subsea market and refl ects Technip’s willingness to enhance its competitiveness, using its liquid balance sheet to acquire world-class assets and thereby reinforce its leadership.
In November, Technip and Schlumberger announced a global cooperation agreement to jointly develop subsea integrity and surveillance solutions for fl exible pipes used in deep offshore oil and gas production. The new agreement extends the collabora-tion between the companies that began in 1998. The agreement initially focuses on surveillance systems activities for new and challenging fl exible pipe applications such as those required in the deepwater pre-salt environment in Brazil. Several key Schlumberger technologies used in subsurface applications have been identifi ed for integration into Technip’s new ultra deepwater
(1) The Production License No PL229/PL229B (Goliat) Owner Group consists of ENI Norge (65% and Operator) and StatoilHydro (35%).
(2) The Production License No PL 094 Owner Group consists of Statoil ASA (operator), ExxonMobil E&P Norway, ENI, Total and Petoro.
(3) Burullus Gas Company SAE is a joint operating company of Egyptian General Petroleum Corporation (EGPC) 50%, BG Group 25% and Petronas 25% conducting oil and gas operations
on behalf of the WDDM partners.

034 2009 Reference Document
Overview of the Group’s Activities
6.1. Technip’s business in 20096
fl exible pipe designs, creating a new generation of intelligent fl exible pipe for the development of ultra deepwater fi elds. As part of the collaboration, retrofi t solutions will also be pursued to address the large number of fl exible pipes in operation utilizing proven technologies and methodologies applied to the subsurface, but are now tailored to the fl exible pipe domain.
The Offshore segment was awarded an engineering project in February by Shtokman Development AG for a consortium composed of Technip, Aker Solutions and SBM Offshore. This highly challenging project includes concept defi nition for the fl oating production unit, and front-end engineering design (FEED) for the hull, turret and mooring system and topsides. The fl oating production unit is for the offshore portion of the fi rst phase of the integrated development of the Shtokman gas-condensate fi eld in the Barents Sea section of Russia. It will be able to withstand the extreme climate conditions of the Arctic Ocean and will have an ice-resistant hull that can be disconnected to avoid the threat of large icebergs.
The major announcement from the Offshore segment in 2009 was the master agreement that Shell Gas & Power Developments BV (Shell) signed in late July with a consortium comprised of Technip and Samsung for the design, construction and installa-tion of multiple fl oating liquefi ed natural gas (FLNG) facilities, including interfaces with riser systems interfaces, for up to fi fteen years. Shell and Technip-Samsung also signed an extending front-end engineering and design (FEED) services contract for Shell’s 3.5 million ton per annum (mtpa) FLNG solution. Shell’s FLNG solution has the potential to place gas liquefaction facilities directly over offshore gas fi elds, thereby making long-distance pipelines and extensive onshore infrastructure unnecessary. This innovative alternative to traditional onshore LNG plants provides a commercially attractive and environmentally sensitive approach for monetizing offshore gas fi elds. The broad operating parameters of the Shell design mean it can be redeployed. Shell’s standardized “design one – build many” approach allows material repeatability gains to be captured during design and construction phases. This project is a true representation of Technip’s technological differentiation through the integration of all its core activities: LNG process, offshore facilities and subsea infrastructures. It gives Technip an opportunity to lead a powerful consortium with Samsung on the frontier areas of the gas business, creating value for Shell through Technip’s innovation, technical excellence and delivery track record.
In another fi rst for Technip, the company joined StatoilHydro in celebrating the inauguration of the Hywind demonstration wind turbine on September 8 in Karmøy, Norway. Located 10 kilo-meters (6 miles) offshore Karmøy, Hywind is the fi rst full-scale fl oating wind turbine and has a capacity of 2.3 MW. The total structure measures 165 meters (541 feet) of which 100 meters is below sea level. The Hywind demonstration unit will operate for a period of at least two years. The objective is to gain knowledge on practical aspects of the operation and maintenance of fl oating offshore windmills. This project illustrates Technip’s ambition and ability to implement expertise from its core business in service of renewable energies.
In December Technip was awarded a front-end engineering design (FEED) contract by Chevron Australia Pty Ltd. For the offshore processing platform associated with the Wheatstone Project in
Australia. The upstream (offshore) portion of the project comprises development of gas fi elds in the WA-17-R and WA-253-P petro-leum titles located on the Northwest Shelf offshore Western Australia at water depths of 70 to 200 meters (230 to 656 feet). Subsea gas gathering systems will transport production to the processing platform where the gas and condensate will be respec-tively dehydrated, dewatered, compressed and exported through a 200 kilometer (124 mile) export pipeline to the onshore gas plant located at Ashburton North, 12 kilometers (7.5 miles) west of Onslow, on the Pilbara coast of mainland Western Australia. The platform topsides is anticipated to be one of the world’s largest single integrated fl oatover installations. Technip’s expertise in the construction and installation of heavy topsides in offshore envi-ronments is especially suited to the Wheatstone project, given the size and weight of the platform topsides and the seasonal weather constraints in the region.
Also in December Technip in association with JGC Corp. and Modec Inc., was awarded a lump sum contract by Petrobras for the front-end engineering design (FEED) of a proposed fl oating liquefi ed natural gas unit (FLNG) as part of a design competition. This FLNG project is being conducted by the joint venture formed between Petrobras, BG, Repsol and Galp Energia for the challen-ging pre-salt reservoirs of the Santos basin offshore Brazil. This project would be the fi rst FLNG unit in Brazil and confi rms the Group’s leadership as a major FLNG concept provider in this very promising market.
The Onshore segment won a number of successes in early 2009, both in contract wins and corporate deals. The winter months brought in a series of refi nery projects. In February Technip garnered an EPC contract from Middle East Oil Refi nery (MIDOR) to expand the delayed coking unit of its refi nery in Alexandria, Egypt. Engineering, procurement and supply of equipment and materials will be delivered on a lump-sum basis; construction acti-vities will be charged on a reimbursable basis. This award attests to the successful collaboration between Technip and MIDOR, for whom the Group built the Alexandria refi nery in the 1990s.
The second win was a lump-sum contract by State Company Oil Project (SCOP) for the front-end engineering design (FEED) of a new refi nery to be built in Karbala, Iraq. The future refi nery will include 18 process units based on state-of-the-art technologies and is expected to produce liquid petroleum gas, gasoline, jet fuel, diesel oil, asphalt and fuel oil, mainly for the internal needs of the Iraqi market.
In March Technip was awarded a lump-sum contract worth approximately €10 million by Lukoil Neftochim Burgas for the front-end engineering design (FEED) of new units to be built at their refi nery in Burgas, Bulgaria. The contract covers four units based on Axens technology, two hydrogen units based on Technip KTI technology, relevant utilities and offsite facilities.
In April Technip announced a milestone in the LNG sector. A joint venture by Chiyoda and Technip joined QatarGas 2 in celebrating the inauguration of the QatarGas 2 Project in Ras Laffan, Qatar. Trains 4 and 5 are the world’s largest LNG (liquefi ed natural gas) trains, with a unit capacity of 7.8 million tons per year. Chiyoda and Technip were involved in all aspects of the engineering, procurement and construction of Trains 4 and 5 and achieved an outstanding safety record. These are the fi rst two of six LNG

0352009 Reference Document
Overview of the Group’s Activities
6.1. Technip’s business in 2009 6
trains to be inaugurated within the framework of the three ongoing projects (QatarGas 2, QatarGas 3 & 4 and RasGas 3) at the Ras Laffan Industrial City.
In early June Technip won a lump-sum contract from CF Industries for the front-end engineering design (FEED) of a proposed grassroots nitrogen complex to be built near San Juan de Marcona, Peru. The project would be the fi rst major nitrogen fertilizer complex in Peru and reinforces Technip’s position on the fertilizer market. A fi nal decision on the project will be made once results of the FEED study and other analysis are completed.
On June 22, 2009, Technip was awarded an EPC lump-sum contract by Ningxia Hanas Natural Gas Company Ltd for of a mid-scale liquefi ed natural gas (LNG) plant to be built in Yinchuan, China. This LNG plant will be the largest facility of its kind in China. This contract is an important milestone for Technip in Asia Pacifi c as it is the fi rst LNG plant to be designed and built by Technip in this region. It is also a breakthrough into the mid-scale LNG market, representing new opportunities for Technip.
Technip was awarded two major EPC lump-sum turnkey contracts in July by the Saudi Aramco Total Refi ning and Petrochemical Company (SATORP) for a grassroots refi nery to be built at the Al Jubail industrial area in Saudi Arabia. The contracts cover the highly technological hydro and catalytic cracking conversion process units and some of the utility units, as well as the inter-connecting network and process control system of the entire refi nery. Technip successfully executed the front-end engineering design (FEED) for nearly three years for this refi nery. Prior to signing the contract, the Group obtained fi rm commitments from certain suppliers of equipment and materials, as well as from a subcontractor for the mobilization. These major awards confi rm both Technip’s leadership in grassroots refi neries and the Group’s technological know-how and project management capabilities. They illustrate Technip’s willingness to accompany its clients from the earliest stages of such projects.
Technip ended July by winning a contract from EDF (Électricité de France S.A.), in coordination with EnBW Energie Baden-Württemberg AG, for the engineering, procurement and construction management of the “Crystal” Gas Plant project located in Etzel, Germany. The “Crystal” project covers gas compression and treatment facilities for storing gas in underground salt caverns. Following a recent award from OMV in Austria, this award marks another milestone in the fi eld of underground gas storage for Technip’s operating center in Düsseldorf, Germany.
Technip was awarded in August a lump-sum services contract by PT Chevron Pacifi c Indonesia for the Minas fi eld located in Sumatra, Indonesia. The contract covers detail engineering, project management, procurement assistance and construction management for water treatment and cooling facilities and for a polymer and surfactant mixing plant, including chemical injection packages and production facilities.
Yet another success late in November was the Abu Dhabi Gas Industries Ltd (GASCO) lump sum turnkey EPC contract for the
ASAB 3 Project. Technip is responsible for the installation of a new booster compression station, transfer lines, debottlenecking of existing ASAB 0 facilities and diverting feed fl ow from ASAB 0 to ASAB I/II by installing a new compressor, transfer lines and other associated facilities.
This award reaffi rms Technip’s decision in March 2009 to create a new Middle East regional organization based in Abu Dhabi as part of its strategy to increase proximity to its markets and clients.
Still regarding the Onshore segment, towards the end of May, Technip and HeliSwirl announced that Technip had acquired the intellectual property rights for applying the small amplitude helical tubing technology to steam cracking furnaces from HeliSwirl. This acquisition broadens Technip’s technological offer and will reinforce its position as leader on the steam cracking furnace market.
Another deal involved Technip and Air Products signing a long-term extension of the global business alliance for hydrogen and synthesis gas facilities that has linked the companies since 1992. The alliance extension ensures reliable and safe supply of hydrogen and synthesis gas to an ever-growing number of customers in the fi elds of refi ning, chemicals and petrochemicals, and continuous product development to improve effi ciency and cost-effective solutions for the industry. Both companies bring a long history of hydrogen experience to the alliance. Technip provides licensing for its proprietary technologies, design and engineering services, while Air Products provides the gas separation technology. With more than 230 successfully delivered units and a proprietary steam reforming technology, Technip is consistently recognized as the market leader in hydrogen.
Furthering the company’s development in the Middle East, in November Technip and SaudConsult signed a memorandum of understanding to set up a 50/50 joint venture company aimed at creating a new engineering center in Saudi Arabia. The planned Engineering Center of Excellence will be located in Al Khobar, Saudi Arabia. It will have broad execution capability and will focus on front end engineering design (FEED) and detailed engineering, procurement and construction management (EPCM) services serving Saudi Arabia’s oil, gas, petrochemical and other industries. This partnership will give Technip the opportunity to develop a world-class engineering center in Saudi Arabia, with a strong local content and a high international profi le. This move is in line with Technip’s strategy of increasing proximity to the Middle East market through the development of local operating centers. Pending regulatory clearance and after completion of local incorporation processes, the new company is expected to begin operations by mid 2010 with about 500 employees.
In other Technip Corporate news, in the third quarter of 2009 the Fonds stratégique d’investissements (FSI – the French Strategic Investment Fund) acquired a shareholding stake of more than 5% following the purchase of shares on the market. Technip welcomed the entry into its capital structure of a prestigious, long-term shareholder who understands the appeal of the oil and gas services industry and Technip’s differentiating attributes.

036 2009 Reference Document
Overview of the Group’s Activities
6.1. Technip’s business in 20096
The hard work paid off in September when Technip was added to the CAC 40, the primary index of Euronext Paris, where the Group is listed. Technip is honored to be recognized amongst such a select group of leading companies. Joining the CAC 40 is an opportunity for Technip to increase its visibility, especially in the fi nancial markets.
6.1.2. Major Acquisitions and Divestments in 2009
Technip’s external growth policy aims at consolidating the Group’s leadership in its markets by strengthening its geographic positions, technological portfolio and resources and capabilities in critical areas for successful project execution.
In the 2009 fi nancial year, Technip completed the following transactions:
Acquisitions, acquired interests or divestments: �
On March 9, 2009, Technip Maritime Do Brasil acquired -70% of Terminal Portuario de Angra Dos Reis S/A (TPAR), a company that owns the port in the city of Angra Dos Reis. The remaining 30% is held by a company outside the Technip Group (FCA Participaçoes S/A);On March 12, 2009, Technip Operadora Portuaria S/A (TOP) -was incorporated to act as Port Operator for the port in the city of Angra Dos Reis. It is wholly owned by Technip Brasil Ltda. FCA Participaçoes S/A, Technip’s co-shareholder in TPAR, has an option to acquire 30% of TOP shares, but this option has not been exercised as of December 31, 2009;On June 2, 2009, Technip Offshore Finland Oy sold its 5.6% -stake in the Krasnye Barrikady shipyard in Astrakhan (Russia);On June 12, 2009, Technip acquired the North Ocean III KS, a -Norwegian limited partnership. The partnership interests are held by its general partner Technip Ships Norge AS (90%), and by its limited partner, Technip Norge AS (10%);North Ocean III KS owns a pipelay vessel, the - North Ocean 103, which is under construction. This vessel will be named Apache II and will replace the Apache in 2010;On July 17, 2009, China Tianchen Engineering Corporation -transferred to Technip its 40% equity interest in Technip Tianchen Chemical Engineering (Tianjin) Company Limited. Thus, Technip Tianchen Chemical Engineering (Tianjin) Company Limited became a 100% subsidiary of Technip. This acquisition is part of the Group’s development strategy for the Chinese market. Technip currently employs around 290 employees in the People’s Republic of China.
6.1.3. Events between January 2010 and the Reference Document publication date
The information presented below is taken from Technip’s 2010 press releases, which are available in their entirety on the Group’s website (www.technip.com). The following is a summary to be read in conjunction with the quantifi ed information included in these press releases, where applicable.
January 2010Technip has been awarded a reimbursable contract by Polimerica �
to perform the front end engineering design (FEED) for a new ethylene plant, which will have a capacity of 1.3 million tons/year and will be part of a new petrochemical complex to be built in Josè, Venezuela.
Technip has been awarded a lump sum contract by Noble �
Energy EG Ltd. for the development of the Aseng fi eld, located in Block “I” offshore Equatorial Guinea, at a water depth of approximately 1,000 meters (3,281 feet).
Technip and Subsea 7 have been awarded a subsea installation �
contract by Woodside Energy Ltd for the Cossack Wanaea Lambert Hermes redevelopment project in Australia. The overall redevelopment project involves the replacement of the oil producing fl oating production storage and offl oading (FPSO) facility, and refurbishment of associated subsea infrastructure.
Technip has been awarded a lump sum contract, worth �
approximately €21 million, by Lundin Britain Limited for an augmentation pipeline at the Broom fi eld in the UK North Sea.
February 2010A charge was booked for potential resolution of the TSKJ Nigeria �
matter in the US. Technip announced better than expected fourth quarter 2009 operating performances.
Technip has been awarded a lump sum contract by Repsol �
Investigaciones Petroliferas SA for the development of two fi elds located approximately 50 kilometers (31 miles) off the east coast of Spain.
2009 year end results. �
Technip was awarded by Talisman Energy (UK) Limited two �
engineering, procurement and installation contracts, worth in excess of €40 million on a lump sum basis, for the development of the Auk North and Burghley fi elds in the UK North Sea.
Technip, leader in a joint venture with Chiyoda, has been �
awarded by Qatar Liquefi ed Gas Company Limited (Qatargas 1) an engineering, procurement and construction contract for the Plateau Maintenance Project (PMP) in Ras Laffan, Qatar.
March 2010Technip was awarded by China National Offshore Oil �
Corporation (CNOOC) a fl exible pipe supply contract for the Lufeng 13-1/13-2 oil fi elds, located in the South China Sea. This award is the fi rst contract for commercial manufacture in its new fl exible pipe plant, Asiafl ex Products, located in the Tanjung Langsat industrial complex in Malaysia.
Shell signed two contracts with the Technip and Samsung �
Heavy Industries consortium for the Prelude fl oating liquefi ed natural gas (LNG) project off the coast of Western Australia. These contracts formalize the announcement made by Shell in October 2009 that Prelude is in the engineering and design phase of development.
Technip was awarded by Nord Stream AG a frame contract, �
worth €35 million, for the Nord Stream project in the Baltic Sea. The contract covers four tie-ins on the two parallel pipelines that will run through the Baltic Sea, from Vyborg in Russia to Lubmin in Germany crossing Russian, Finnish, Swedish, Danish and German waters. The pipelines will have a total length of approximately 1,220 kilometers.

0372009 Reference Document
Overview of the Group’s Activities
6.2. Group business environment 6
6.2.1. Market environmentThe oil and gas industry was affected by the fi nancial crisis and global economic slowdown in the second half of 2008.
During this period, oil prices fell from a record high of US$145 per barrel in July 2008 to US$30 at the end of 2008. The International Energy Agency (IEA) and International Monetary Fund (IMF) both lowered their oil demand forecasts and world economic growth forecasts for 2009 and beyond in the monthly reports they issued in 2008.
As a result, O&G companies revised their investment plans for 2009 and postponed projects following a period of sustained capital investment between 2005 and 2008. According to Barclay’s Capital’s Original E&P Spending Survey dated December 17, 2009, global E&P expenditures declined by 15% in 2009.
Financial markets and the world economy showed signs of impro-vement during the second half of 2009. Oil prices stabilized above US$60 per barrel and the IEA’s mid-term oil demand forecast was revised upward, driven notably by the economic recovery in deve-loping countries. In the same survey cited above, Barclays Capital now forecasts that global E&P expenditures should increase by 11% in 2010.
The Panorama technical reports of the French Petroleum Institute (Institut Français du Pétrole – IFP) published at the end of 2009 provide a similar assessment of the environment, i.e. a contraction in upstream and downstream markets in 2009 and expectations of a progressive recovery of the upstream market in 2010. The IFP anticipates a more gradual recovery for the downstream market.
In the medium and long term, the factors driving Technip’s markets remain robust, including notably an anticipated increase in future global oil and gas demand, a need for O&G companies to offset the natural depletion of their reserves, the decrease in production and an ongoing shift towards harsh environments (e.g. deep water developments) and increasingly complex projects (e.g. Floating LNG solutions).
6.2.2. Group business segmentsTechnip is a world leader in project management, engineering and construction for the oil and gas industry.
Its main markets include Onshore plants (e.g. refi ning, gas treatment), Offshore platforms (e.g. Spar, FLNG) and Subsea construction (e.g. installation of subsea pipelines).
Technip revenues by segment
In millions of Euro 2009 2008
Subsea 2,866 2,689
Offshore 565 695
Onshore 3,025 4,097
Total 6,456 7,481
Technip orders at the end of 2009
30% - Deep sea
14% - Shallow sea1% - Other
38% - Refining / Heavy oils
10% - Gaz / LNG 7% - Petrochemical
Technip orders at the end of 2008
42% - Deep sea
13% - Shallow sea3% - Other
18% - Refining / Heavy oils
17% - Gaz / LNG
7% - Petrochemical
6.2.2.1. Subsea
Subsea market environmentThe Subsea market grew signifi cantly between 2004 and 2008, with new project awards doubling in value over this period (Technip estimates). This growth was driven, in part, by the development of deepwater fi elds in the Gulf of Mexico, Brazil and West Africa. The more mature North Sea market, meanwhile, has remained active.
In 2009, new project awards declined from 2008 levels; projects were postponed as a result of the global economic slowdown, the fi nancial crisis and oil price fl uctuations.
The Subsea market is expected to recover in 2010 and grow in the following years, driven by offshore gas developments, Brazil, and a continuous shift to deeper waters.
6.2. Group business environment

038 2009 Reference Document
Overview of the Group’s Activities
6.2. Group business environment6
Subsea strategyTechnip aims to strengthen its worldwide leadership in the Subsea market. Its strategy includes the following priorities:
increase its local presence in high-potential regional markets �
(e.g. Africa, Gulf of Mexico, Brazil, Asia Pacifi c);
further improve project execution capabilities; �
upgrade its fl eet of vessels and manufacturing capabilities for �
fl exible pipelines and umbilicals; and
develop the technologies and know-how required to cope �
with subsea projects in increasingly deep waters and harsh environments.
Subsea competitionTechnip competes against subsea construction contractors and manufacturers of fl exible pipes and umbilicals.
Its main competitors in subsea construction include Acergy, Aker Solutions, Allseas, Clough, Global, Heerema, Helix, McDermott, Saipem and Subsea 7. With respect to fl exible pipes, Technip’s main competitors include NKT-Flexibles, Prysmian and Wellstream. With respect to umbilicals, Technip’s main competitors include Aker Solutions, Nexans, Oceaneering and Prysmian.
6.2.2.2. Offshore
Offshore market environmentThe Offshore market includes various types of projects, from small fi xed platforms in shallow water to large fl oating platforms in deep water.
Like the Subsea market, the Offshore market grew strongly between 2004 and 2008, driven primarily by the Gulf of Mexico, the Gulf of Guinea and Brazil.
In 2009, the market was affected by the global economic slowdown; specifi cally, the number of new fl oating platforms launched by oil and gas companies declined from 2008 levels.
In 2010 and beyond, the Offshore market is expected to recover, driven in part by the pre-salt developments in Brazil, large offshore gas projects, and the emergence of the fl oating LNG market.
Offshore strategyIn the Offshore market, Technip is positioning itself on the most demanding “frontier” projects, including ultra-deep water fl oaters, large topsides, fl oatover solutions and fl oating LNG.
Its strategy is based on the following priorities:
consolidate its lead in the emerging fl oating LNG market; �
further develop its local delivery capabilities in regions with �
substantial market potential;
invest in technologies and technical know-how; and �
improve project execution capabilities. �
Offshore competitionThe competition is relatively fragmented, with various players present different core capabilities. They include Offshore construc-tion contractors, such as Aker Solutions, McDermott and Saipem; shipyards, such as Hyundai Heavy Industry, DSME and Samsung Heavy Industry; leasing contractors, such as SBM and Modec; and local yards in Asia Pacifi c, the Middle East and Africa.
6.2.2.3. Onshore
Onshore market environmentThe Onshore market covers upstream and downstream plants, including gas treatment, LNG, refi ning, ethylene and petrochemicals.
This market was affected by the economic slowdown and oil price fl uctuations in the second half of 2008. New projects were postponed as oil and gas companies reviewed their investment plans and looked for ways to reduce costs.
New project awards declined in 2009 from 2008 levels. The order intake reported by leading Onshore players (CB&I, Chiyoda, Fluor, Foster Wheeler, JGC, KBR, Saipem and Technip) declined by more than 10% in 2009 compared to 2008. The market contraction particularly affected developed economies (North America and Western Europe) and downstream petrochemical projects.
The expected global economic recovery and long-term growth of energy demand should bolster the Onshore market in 2010 and beyond, especially in the Middle East, Asia Pacifi c and Latin America, where oil and gas companies are considering a signifi cant number of large new investment projects.
Onshore strategyTechnip is one of the world’s leading Onshore contractors, with a solid track record on large-scale projects around the globe.
Technip’s strategy is based on the following priorities:
strengthen its internal project management, engineering, �
procurement and construction capabilities;
expand its local presence in large regional markets; �
develop customer relationships and get involved in the early �
project phases;
optimize its risk profi le and diversify its contract portfolio �
(conceptual studies and FEED, EPCM and LSTK projects); and
invest in technologies and technical know-how. �
Onshore competitionIn the Onshore market, Technip faces a large number of compe-titors, including US players (e.g. Bechtel, CB&I, Fluor, Foster Wheeler, Jacobs and KBR), Japanese companies (Chiyoda, JGC and Toyo), European companies (Linde, Lurgi, Petrofac, Saipem, Tecnicas Reunidas and Uhde) and Korean companies (GS, Hyundai, Samsung Engineering and SK). In addition, Technip competes against smaller and more local engineering and construction companies in certain countries.

0392009 Reference Document
Overview of the Group’s Activities
6.3. Description of project strategy 6
6.2.3. Geographical areas where the Group is present
Technip is a global player in the oil and gas industry with signifi -cant revenues in most regions of the world:
the Middle East accounted for 23% of Technip’s revenues in �
2009 and 38% of its backlog at the end of the year;
Europe, Russia and Central Asia: 27% and 18% respectively; �
Americas: 24% and 17% respectively; �
Asia Pacifi c: 12% and 8% respectively; �
Africa: 14% and 19% respectively. �
6.3. Description of project strategy
Projects are increasingly more ambitious, more complex and in many areas, more pioneering.
In this environnement, Technip must focus its management and fi nancial resources on its specialty sectors, develop teams and assets adapted to these challenges and prepare for the future by strengthening its technological assets and expertise.
Within this strategic framework, Technip’s organization has evolved and now focuses, in particular, on continuing to develop its geographical presence and optimizing project execution.
Technip’s seven Regions are responsible for marketing and sales activities, project execution, and fi nancial results.
Technip’s decentralized structure favors the Group’s development while allowing the Group’s management to make decisions related to major projects exceeding a certain threshold, below which decisions are made by the Regions.
6.3.1. Selective approach to projectsBecause of the high cost associated with preparing a proposal, Technip only bids on projects that have been scrutinized through its selection process. In particular, each project is evaluated on its own merits with no exceptions, market share and/or asset utilization considerations included.
To achieve an optimized “Risk/Reward” profi le satisfying the Group’s criteria, all transactions are reviewed at the Group or Region level to properly assess all risks. The decision to follow-up on a project, submit an offer and/or accept a letter of intent or sign a contract is systematically subject to preliminary approval at the appropriate level. The latter is defi ned by business segment and by Region with respect to the Group’s organization note.
6.3.2. Internal process for review of potential transactions
Before a decision is made to submit a proposal, Technip fi rst reviews each specifi c prospect through an Early Tendering (“ET”) process, at the end of which the Management of the Group or of a Region decides whether Technip should make a proposal.
After a decision is made to submit a proposal, Technip enters the proposal formulation stage, during which all terms and conditions of the transaction are analyzed through an Authorization to Tender (“ATT”) process. At the end of this process, the Management of the Group or of a Region, as the case may be, decides the terms under which the proposal will be submitted or, in very few cases, a proposal will not be submitted.
Once a proposal is made by Technip and accepted by the client, the analysis and risk assessment performed during the ATT process is updated during an Authorization to Commit (“ATC”) process. Technip cannot accept any letters of intent and cannot enter into any contracts prior to receiving approval from the Management of the Group or of a Region during an ATC.
6.3.3. A “de-risking” approach“De-risking” has been a key element of Technip’s strategy since 2007. It strives to improve the Group’s project management as early as the proposal stage.
Through this strategy, Technip strives not only to improve the range of contract types it offers, but also to achieve a better balance of revenue generation among its Regions and business segments.
6.3.3.1. Change in contractual formsDepending on the nature of the risks highlighted during the ET and ATT processes, Technip will propose “cost plus fee” contracts rather than contracts on a lump-sum basis and/or will propose to exclude certain services such as equipement procurement and/or construction, particularly, where design studies are not developed enough during the proposal stage, or will propose progressive turnkey contracts instead of lump-sum turnkey contracts.
In the context of its “de-risking” approach, Technip also strives to obtain fi rm commitments from its suppliers prior it submits proposals to clients on a case-by-case basis.

040 2009 Reference Document
Overview of the Group’s Activities
6.3. Description of project strategy6
6.3.3.2. Geographical backlog diversifi cationThe Group strives to diversify the countries where it performs contracts in order to avoid or mitigate the potential effects of events such as excessive concentration of projects in a region or in a specifi c country that may render the execution of such projects more diffi cult, longer and/or more expensive.
6.3.3.3. Backlog balance by business segmentThe Group also endeavors to balance its backlog between the Subsea segment and the Onshore and Offshore segments, to lower its exposure to the cycles in each of these business segments.
6.3.3.4. Association strategyTo mitigate its risks on a specifi c project, Technip may decide to submit a bid in association with one or more companies through either a joint venture or a consortium.
The type of association is carefully reviewed at the proposal stage by taking into account all relevant parameters, including a client’s requirements and needs, respective expertise of each member of the association, and interfaces. Most of the time, the members of a joint venture or a consortium are jointly and severally liable vis-à-vis the client.
6.3.4. Description of contractual forms
6.3.4.1. “Cost plus fee” contractsContrary to lump-sum contracts, under which Technip bears the full risk of any overruns, cost plus fee contracts allow Technip to avoid bearing a risk on the fi nal cost. Under this type of contract, Technip is paid for its services on an hourly basis and it is also paid for procurement and construction activities based on actual costs, plus a predetermined profi t margin.
6.3.4.2. EPCM contractsFor specifi c types of projects where Technip cannot take risks with respect to the supply of equipment and construction activities, particularly, where design studies were not fully completed at the time proposals were submitted, EPCM contracts are preferable. Under an EPCM contract, Technip’s activities are limited to provi-ding services (e.g., engineering, procurement and construction services, as well as assistance during the construction phase). All risks associated with procurement and construction activities are thus transferred to the client. Cost plus fee arrangements are also used for major EPCM contracts. In addition, these types of contracts often provide for a success fee related to the investment cost and the overall project schedule.
6.3.4.3. Progressive turnkey contractsGiven today’s uncertain market conditions (for example, in relation to raw material costs), Technip has introduced a new contractual scheme to reduce its risks and costs as well as those of its clients. With progressive turnkey contracts, payment is made on a cost plus fee basis during the design and procurement phases until an appropriate time, after which Technip takes into account all relevant factors. Once this is completed, payment is converted to a lump-sum basis. This allows Technip to mitigate risks related to the design phase and to increasing costs and allows clients to reduce their provisions for risks.
6.3.4.4. Lump-sum turnkey projectsUnder lump-sum turnkey contracts, Technip is responsible for all activities necessary for the completion of a project (i.e. design and engineering activities, supplying of equipment and materials, and construction) with respect to:
(i) technical aspects, (including on any portion subcontracted to suppliers and to construction companies);
(ii) completion deadlines;
(iii) fi nancial aspects. In this regard, Technip takes full responsi-bility with respect to any budget overruns, as initially agreed for the performance of the project at the time the contract was entered into, with the exception of those resulting from specifi c events that give a contractual right to renegotiate the price or applicable deadlines.
Technip remains a key actor in lump-sum turnkey contracts, which remains the prevailing standard in certain parts of the world such as in the Middle East, and in other regions where the Group considers the construction costs manageable.
6.3.5. Types of associationsIn order to mitigate risks associated with mega projects or projects presenting technological challenges, and risks associated with construction, Technip may decide to submit a bid in asso-ciation with one or more companies through a joint venture or a consortium.
A joint venture or a consortium is generally formed for the sole purpose of a specifi c project and is dissolved when all obligations and liabilities of the client and the members have been duly satisfi ed.
6.3.5.1. Joint venturesA joint venture is a temporary association of companies (for which a company may be created) under which its members perform their respective scope of work, generally as an integrated team, and share the risks and rewards according to a predetermined prorata rule.

0412009 Reference Document
Overview of the Group’s Activities
6.4. The Group’s business segments 6
6.3.5.2. ConsortiumA consortium is also a temporary association of companies, but differs from joint ventures in that each member is solely and individually responsible for the performance of its scope of work and individually bears all of the risks associated with such performance.
A consortium is used where each member’s respective scope of work is clearly identifi ed and especially when Technip decides to associate itself with a construction company or a shipyard.
6.4. The Group’s business segments
Technip is active on the three following business segments: the Subsea, the Onshore and the Offshore segments. See Section 9.2 of this Reference Document for a breakdown of revenues by geographical area.
6.4.1. SubseaIn 2009, the Subsea segment generated revenues of €2,866.41 million, representing 44.4% of the Group’s consoli-dated revenues. See Section 9.4 of this Reference Document for a description of Subsea operating income.
Technip provides integrated design, engineering, manufacturing and installation services for subsea infrastructures and pipe systems used in oil and gas production and transportation.
Technip is considered a world leader in the Subsea construction sector, and its engineers and technicians give it internationally recognized technological expertise. The Group’s focus on deve-loping technologies allows it to offer its own technologies both as products and for installation processes.
Services for subsea oil fi elds (Subsea)One alternative to using platforms with surface wells for offshore hydrocarbon production is placing trees on the sea bed and connecting them to processing and removal platforms through rigid and/or fl exible pipes. Trees and subsea collection systems are remotely controlled through umbilicals that send data, steer the subsea trees and send service fl uids from a platform or a production vessel. Technip’s services include the turnkey delivery of these subsea systems, particularly, offshore work (pipelay and subsea construction) and the manufacture of critical equipment such as umbilicals and fl exible pipes. Technip can also handle the procurement of other subsea equipment and the procurement of rigid pipes that the Group acquires from third parties through international bids. As markets move towards greater sea depths, there is a growing need to implement new resources and approa-ches. Due to its technological innovations, Technip can serve customers opening new ultra-deep sea fi elds, as demonstrated by contracts it won in 2009 for the installation of pipes at record depths in the Gulf of Mexico, Ghana, Equatorial Guinea or Brazil.
In general, subsea work requires the participation of divers and/or Remotely Operated Vehicles (“ROVs”) that are operated from diving or construction support vessels.
In addition to the engineering and installation of new systems, Subsea activities also include the maintenance and repair of existing subsea infrastructures and the replacement or removal of subsea equipment.
Technip has one of the world’s top-performing fl eets of subsea pipelay and construction vessels, which is essential to its Subsea activities.
Technip is active in various business sub-segments and projects:
Flexible pipe supplySome operators, and particularly Petrobras in Brazil, purchase fl exible risers and fl owlines directly from fl exible pipe manufac-turers without installation services or other equipment. In this segment, Technip performs the engineering and manufacturing of the fl exible pipes, relying on:
its engineering Centers in Rio de Janeiro, Paris, Oslo, Aberdeen, �
Kuala Lumpur, Perth and Houston;
its manufacturing units in Vitoria (Brazil) and in Le Trait (France); �
and
and soon in its Asiafl ex Products Center in Johor Baru (Malaysia) �
where production is scheduled to start in 2010.
The goods are delivered along side the quay of the manufacturing unit and are loaded on a vessel operated by the client.
Umbilical supplyDuco, is a subsidiary of Technip with engineering expertise and substantial business experience that it employs in responding to calls for tender issued by different types of clients (the oil compa-nies, Subsea wellhead manufacturers, and turn-key projects). In this respect, Duco relies upon the engineering Centers in Newcastle (United Kingdom) and Houston (United States) and the thermo plastic or steel tube umbilicals manufacturing units in Newcastel (United Kingdom), Channel View (United States), Lobito (Angola) and soon at the Asiafl ex Products Center in Johor Baru (Malaysia), which is scheduled to come on stream during 2010.

042 2009 Reference Document
Overview of the Group’s Activities
6.4. The Group’s business segments6
Long term charter vesselsThis market segment is specifi c to Brazil where Petrobras char-ters vessels fi tted with fl exible and umbilical laying equipment. Technip operates two vessels in long-term charter for Petrobras: the Sunrise, with the capacity to lay three lines simultaneously and the Normand Progress, fi tted with a VLS (Vertical Laying System).
In 2010 a third vessel, the Skandi Vitoria fi tted with a vertical and horizontal laying system, is scheduled to start operations under a four-year contract. This contract includes an option of another four years.
Turnkey projectsMost of the Subsea contracts are performed under lump sum turnkey contracts, with Technip performing engineering, procure-ment and project management for the entire fi eld development. Rigid pipeline installation is performed by the Deep Blue, the Apache and the Deep Energy, which will start operations in 2011. Support is provided by the spoolbases located in Mobile (United States), Dande (Angola), Evanton (United Kingdom) and Orkanger (Norway). Flexible pipes and other Subsea infrastructures are installed with offshore construction vessels such as the Deep Constructor, Deep Pioneer, Skandi Arctic and Normand Pioneer, or diving support vessels such as the Venturer, Wellservicer, Orelia, Skandi Achiever and Alliance.
Recent large-scale turn-key projects of Technip include Agbami in Nigeria and Cascade in the United States which represents the fi rst development in the Gulf of Mexico using an FPSO and in very deep waters (2,500 meters, or 8,202 feet).
Inspection, Maintenance and Repair (IMR)The inspection and maintenance of Subsea infrastructure is a signifi cant market segment, particularly in mature fi elds. Due to its long-standing presence in the North Sea, Technip has developed recognized expertise using a high performance fl eet of diving vessels.
The development of deepwater fi elds and the aging of these installations increase the need for IRM services using ROVs.
6.4.2. OnshoreTechnip’s Onshore segment covers all types of onshore facilities for the production, treatment and transportation of oil and gas, petrochemicals and other, non-oil and gas activities. Technip also designs and builds infrastructures related to these activities, in particular hydrogen production units, electricity generation units, sulfur recovery units and storage units.
In 2009 the Onshore segment generated revenues of €3,024.9 million, representing 46.9% of the Group’s consoli-dated revenues. See Section 9.4 of this Reference Document for a description of Onshore operating income.
Development of onshore fi eldsTechnip designs and builds all types of facilities for the develop-ment of Onshore oil and gas fi elds, from wellheads to processing facilities and product export systems. In addition to participating in the development of new Onshore fi elds, Technip also expands existing facilities by modernizing production equipment and control systems, and brings them into line with applicable envi-ronmental standards.
Land pipelinesTechnip builds pipeline systems chiefl y for natural gas, crude oil and oil products, water and liquid sulfur. Through its operating center in Düsseldorf (Germany), Technip is one of the world’s most experienced pipeline builders and has completed projects in the most challenging of environments, including deserts, tundra, mountains and swamps. Since 1960, Technip has completed more than 160 pipeline projects in over 40 countries, amounting to an aggregate length of 34,000 kilometers (21,127 miles) of pipelines.
Natural gas treatment and liquefactionTechnip’s vast experience and signifi cant ongoing projects in the natural gas and liquefi ed natural gas industries position the Group among the world leaders in these industries. With over 45 years of experience in this area, Technip is a pioneer in the fi eld of natural gas liquefaction (LNG), as demonstrated by its construction of the fi rst high-capacity liquefaction facility in Arzew, Algeria in the early 1960s.
Technip’s joint venture with Chiyoda was awarded three mega LNG projects in Qatar in 2004, 2005 and 2006. Three out of the six LNG trains have been completed, two for QatarGas II and one for Rasgas 3. The second train of Rasgas 3 and the two trains of QatarGas III/IV are nearing the end of construction.
Technip’s joint venture with JGC and KBR, which Technip heads, was awarded an LNG project in Yemen in 2005, and the fi rst of two trains is now completed.
A contract for a mid-scale LNG plant was awarded by Ningxia Hanas Natural Gas Company Ltd, in June 2009. This is the fi rst LNG plant to be designed and built by the Group in the Asia Pacifi c region.
Finally in July 2009 Technip, in association with Samsung Heavy Industries signed a 15-year framework agreement with Shell for the development of FLNG (fl oating LNG) solutions and projects.
Technip is very well positioned in the emerging Gas-to-Liquids (GTL) market, with the engineering and construction of the fi rst-ever large-scale GTL plant in Qatar (Oryx) in 2003, which commenced operations in 2006.
Technip benefi ts from solid experience in natural gas processing and has access to corresponding licensed technologies. Technip is specialized in extracting sulfur from natural gas and is, according to the Group’s assessment of the market, the world leader in terms of number of units installed.
0432009 Reference Document
Overview of the Group’s Activities
6.4. The Group’s business segments 6
With its Cryomax technology, Technip specializes in the highly effi cient extraction of C2 and C3 hydrocarbons from natural gas and the refi ning of residual gases.
Building on its fully-certifi ed ALLS system for offshore aerial transfer of LNG using cryogenic fl exible pipe, Technip is leading a joint industry program with 11 partners, all major players in LNG, that is now developing a fl oating offshore LNG transfer system that is a major step towards the construction of the fi rst offshore LNG platform.
Refi ningTechnip’s activities in this sector range from the preparation of conceptual and feasibility studies to the design, construction and start-up of complex refi neries or single refi nery units. In 2009 Technip was awarded the EPC contract for a signifi cant portion of the 400,000 BPSD Al Jubail Grassroots Refi nery in Saudi Arabia. Since its creation in 1958, Technip has been involved in the desi-gned and construction of 30 grassroot refi neries, ten of which since 1990, and has completed over 100 expansion or revamp project each requiring more than 90,000 manhours. These projects were with both national and international oil companies, involved more than 810 individual process units and were located in over 75 countries. Technip’s technical expertise, its well established relationship with international licensors and its patented techno-logies, such as hydrogen and the progressive crude oil distillation concept (owned jointly with Total), give it a strategic edge for successfully delivering all kinds of refi nery projects.
HydrogenTechnip is a leading actor in the design and construction of hydrogen and synthesis gas production units and sulfur recovery units. Hydrogen is used to treat and/or process refi nery products and petrochemicals. Synthesis gas is used to make various chemical products such as acetic acid and methanol. Technip designs and builds hydrogen and synthesis gas plants for the refi ning, petrochemical and chemical industry. Also, since 1992 Technip has participated in a worldwide alliance with Air Products & Chemicals Inc. to supply over the fence high-purity hydrogen to the refi ning and other industries. High-purity hydrogen is critical for converting heavy crude into low-sulfur fuels that meet the most stringent environmental standards. Technip was awarded multiple contracts in 2009, including turnkey contracts for custo-mers in Thailand and in India for the design and implementation of hydrogen plants, and a contract in Belarus for the engineering and supply of a hydrogen unit. Since its founding, Technip has participated in the design and construction of more than 240 units of this type worldwide for the refi ning and other related industries.
EthyleneTechnip has unique proprietary technology and is a leader in the design, construction and commissioning of ethylene production plants. Technip’s numerous ongoing projects have an overall ethylene capacity exceeding seven million tons per year. In 2009, Technip commissioned the two largest steamcracking units in the Middle East and completed design work on two new plants in Saudi Arabia. These projects are at various stages of completion and reaffi rm Technip’s competitive edge in this fi eld.
Petrochemicals & FertilizersPetrochemicals are a traditional point of strength for Technip. It has designed and built more than 400 individual processing units, including about 150 polymer units. Technip has an impor-tant position in polymer units, with over 113 polyolefi n units designed and/or built including the largest production capacities worldwide. The Group further cemented its leadership position in 2009 by expanding its market share through a licensing coope-ration between Technip and Ineos Technologies signed on July 20, 2009. The market’s continued appreciation of Ineos’ Gas Phase technologies for Polyethylene and Polypropylene, combined with the great success of Ineos’ Slurry technology for High Density Polyethylene allowed both Ineos and Technip to record a succes-sful year, winning six licenses for new units in the midst of a global economic crisis.
Technip and Ineos also expanded their cooperation in the polyolefi ns area to include polystyrenes while the successful cooperation with SABTEC in low-density polyethylene (LDPE) and with Asahi Kasei in the Chlor-Alkali business continued in 2009. The companies jointly pursued various projects that are expected to materialize as the economy recovers.
Large projects in Chlor-Alkali, Vinyl Chloride Monomer (VCM) and Polyvinylchloride (PVC) are still under way and will continue in 2010. Other major petrochemical units, such as hydrogen peroxide, polyurethane and acetic acid, were completed in 2008 and 2009, namely in China, where the Group is still very active.
Regarding fertilizers, renewed efforts to license Technip’s Phosphoric Acid technology made it possible to acquire licenses for three new Phosphoric Acid Concentration Units from Fosfertils in Brazil.
Main activities in other fertilizer sectors involved the Front-End Engineering Design of the new Nitrogen Complex planned by CF Industries in Peru in preparation for subsequent EPC work.
The successful long-term cooperation with world-leading licen-sors in the fi eld, such as Haldor Topsoe of Denmark, MECS of the USA, Saipem of Italy and UFT of the Netherlands continued in 2009.
Biofuels and renewable energiesIn 2009, Technip continued its efforts to develop operations in the fi eld of CCS and renewable energies:
Through ongoing projects such as “bio-village” in Canada or �
Neste Oil biodiesel in Singapore and Rotterdam, and with its in-house expertise, Technip worked on the Group’s offerings in the emerging fi eld of next generation biofuels;
In polysilicon production plants which are needed to manufac- �
ture solar PV panels, Technip strengthened its knowledge of the process to help clients lower silicon production cost as much as possible, thereby helping clients improve their margins;
In the fi eld of marine energies, Technip brought the Statoil �
Hywind project on time and budget. The project is the fi rst industrial demonstration of a fl oating wind turbine (in wind farms built so far, all of the turbines are fi xed on the seabed), and was inaugurated on September 8, 2009. Based on that success, Technip expanded its technological offering to develop new products for this promising and emerging market. The Group also worked on an initial offering for the more established

044 2009 Reference Document
Overview of the Group’s Activities
6.4. The Group’s business segments6
“fi xed” wind turbine market, which is expected to see a boom in the years ahead, particularly in Europe. Lastly, Technip has also been involved in the tidal current and wave energy fi eld, where its subsea expertise in installing machines on the seabed is attractive to project managers and technology developers;
There will be a major demonstration program in the Carbon �
Capture and Storage sector in the next fi ve years in the USA or Europe. With its CO2 storage-oriented partner Geogreen, Technip is eager to be involved in those projects, particularly when they are implemented in connection with onshore or offshore oil and gas projects. Technip is particularly well suited to address this new market, because the Group has extensive knowledge in all of the fi elds needed to implement such a project: large numbers of references for onshore and offshore carbon capture processes, CO2 compatible pipelines and offs-hore fl exible pipelines, and CO2 compression and re-injection;
In the USA, Technip established a strategic partnership in the fi eld �
of Geothermal power plants with Mannvit, a leading Icelandic Engineering company. This agreement will enable Technip to enter the Geothermal power plant market, which is receiving very active support from federal and state authorities.
Other IndustriesTechnip also offers its engineering and construction services to industries other than the oil and gas industries, principally mines and metals companies.
Mining and MetalsIn 2008 the Group participated in two major projects in the nickel industry for XStrata and Eramet and entered into a partnership with AREVA to develop uranium mining projects. TSU Projects, a jointly-owned subsidiary of Technip and SGN (a subsidiary of the AREVA group), was formed in 2008.
Moreover, several feasibility studies were conducted for reliable sulfuric acid projects in connection with the hydroprocessing of uranium and nickel ores.
6.4.3. OffshoreIn 2009, the Offshore segment generated revenues of €565.0 million, representing 8.7% of the Group’s consolidated revenues. See Section 9.4 of this Reference Document for a description of Offshore operating income.
Technip designs, manufactures and installs fi xed and fl oating plat-forms that support surface facilities for the drilling, production and processing of oil and gas reserves located in offshore shallow fi elds as well as ultra-deep water fi elds.
In the offshore platform sector, in addition to its skills and patented intellectual property, the Group is renowned in the following areas:
large-projects management; �
innovative platform concepts; �
expertise in the building of complex facilities; and �
associated technologies (deepwater risers and mooring and �
installation techniques for modularization of processing facilities).
Technip offers a range of best-in-class platforms, such as Spars (fl oating platforms), TPG 500 (fi xed platforms), TLD (tension leg platforms) and semi-submersible platforms, as well as new solu-tions for fl oating platforms, such as Extendable Draft Platforms (EDP).
Technip is also renowned for its worldwide expertise in the building of complex facilities, including the world’s largest FPSO (Floating Production, Storage and Offl oading) units and the fi rst-ever awarded contract for FLNG (Floating LNG), with Shell.
In addition, Technip owns advanced technologies for installing of topsides using the “fl oatover” method for fi xed and fl oating plat-forms. These technical solutions, which do not require heavy lift operations offshore, were largely used to install topside facilities for low air gap platforms, semi-submersible platforms and Spars.
Technip’s “fl oatover” technology includes, in particular, new solutions for installing and removing surface facilities from high air gap fi xed platforms.
Fixed PlatformsThe TPG 500 is a self-installing, high-capacity fi xed platform that is built, equipped and tested onshore and then towed onsite.
Once on site, the platform’s legs are jacked down and installed on the seabed, at depths of up to 150 meters (492 feet), which is suitable for many fi elds in the North Sea. The fi xed platform is then raised to its fi nal position.
Floating and semi-submersible platformsThe Spar is a fl oating platform for drilling, production and proces-sing based on technology jointly owned by Technip and J. Ray McDermott. This structure includes a cylindrical hull anchored vertically to the seabed. The platform is used for production from individual wells through wellheads installed at the surface instead of on the seabed, which provides direct and permanent access to the wells for drilling and maintenance.
Spar platforms constitute an important component of Technip’s strategy for fl oating production platforms.
In addition to Spar platforms, Technip is also developing a Tension Leg Platform (TLP) concept for use at water depths of between 270 and 1,500 meters (886 to 4,921 feet), as well as semi-submersible platforms such as the Extendable Draft Platform (EDP), a self-installing, high-capacity, semi-submersible platform suitable for use worldwide.

0452009 Reference Document
Overview of the Group’s Activities
6.6. Environment 6
6.5. Suppliers
Projects managed by Technip and Technip’s own business require the use of many raw materials, parts and equipment. Equipment purchases are carried out through competitive bids, and suppliers are selected based on economic and technical qualifi cation criteria. Technip has stable working relationships with its main suppliers and has not yet had diffi culties fi nding high-quality raw materials to meet the needs of its manufacturing processes. Technip continuously strives to consolidate its procurement sources and to maintain an adequate number of suppliers for strategic equipment and raw materials.
Technip procures its equipment and components for Onshore and Offshore project execution from a large number of interna-tional suppliers recognized as leaders in their respective sectors.
Vallourec, Elliot, Dresser Rand and Flowserve were among the Group’s main suppliers in 2009.
With regard to the main raw materials used in the Subsea segment to manufacture fl exible pipes and umbilicals, the Group turned to leading suppliers in 2009 such as ArcelorMittal, Sandvik, Bekaert, Balmoral and Arkema.
The decrease in raw material prices since the end of 2008 has progressively impacted the cost of equipment and projects in 2009. The situation in the market during 2009 and its impact on suppliers did not result in any shortage of strategic raw materials and equipment for Technip.
6.6. Environment
The year 2009 was marked by an increased awareness by key players of the major environmental challenges facing the planet, such as climate change, paired with fi nancial systems in disarray and their impacts on economic and social institutions.
In this context, the strategic choices that Technip has been pursuing since 2007 are proving more and more relevant: providing clients with the most effective solutions in project management, products and services while protecting its employees and partners, and the environment they live in.
Environmental performance steering:
In order to implement its commitment to steadily reducing its environmental impact, Technip adopted a policy of environmental certifi cation, the ISO 14001 standard. As of December 31, 2009, 24 Group sites had earned this certifi cation.
The pursuit of this certifi cation not only ensures that the environ-mental impact of each entity’s activity is identifi ed, assessed and mitigated but it also testifi es to the management’s commitment to implementing a continuous improvement plan to prevent pollution and assess compliance with environmental regulations.
An integrated software solution manages the improvement process, providing assistance for monitoring and for improving the Group’s health, safety and environmental conditions.
More than 790 persons at the Group are involved in implementing this monitoring process.
To assess the effectiveness of its sustainable development program, in 2009 Technip ordered an audit of these management processes in compliance with the guidelines of the future ISO 26000 “Social Responsibility” certifi cation.
6.6.1. Resource consumptionThe variety of Technip’s business activities and locations gives rise to a wide range of water needs (drinking and industrial water, hydraulic tests, cleaning, etc.) and the implementation of local initiatives for water treatment and reducing consumption (recy-cling water at industrial sites). In reality, consumption fl uctuates as a function of a particular site’s activities.
2009 2008
Water consumption Qty (m3) Qty (m3)
Yards 4,097,290 4,210,446
Plants 198,489 213,205
Vessels 72,282 80,000
Offi ces 146,932 217,328
Onshore, aqueous effl uents are treated in situ. This is particularly true for large sites located in Qatar, where Technip has built six sewage treatment plants of 10,000 inhabitant equivalents to process greywater from these sites.
Offshore, Technip’s vessels are fi tted with sewage treatment systems.

046 2009 Reference Document
Overview of the Group’s Activities
6.6. Environment6
2009 2008
Wasted water managementQuantity (m3)
Treatment in situ
Treatment outside of the sites
Treatment in situ
Treatment outside of the sites
Yards 2,130,974 1,023,911
Plants 8,400 37,185 107,392
Vessels 59,836 3,915 28,043
Offi ces 17,314 197,233
6.6.2. Raw materials, energy and energy effi ciency
2009 2008
Heating and electricity consumption for permanent plants installation (MWh) Natural gas
Fuel-oil, Diesel Electricity Natural gas
Fuel-oil, Diesel Electricity
Plants 13,547 14,235 53,476 18,535 55,731 32,675
Offi ces 3,191 1,342 24,840 17,293 33,252
Fuel and electricity consumption relating to operations made on projects (MWh)
2009 2008
Carburants Electricity Carburants Electricity
Yards 337,483 24,922 773,774 99,907
Offi ces 749,289 710,043
6.6.3. Greenhouse gas emissions (GGE)The table below shows the total quantity of CO2 emitted, in ton CO2 equivalents, in the form of direct emissions generated by Technip activities. It should be noted however, that Technip is not bound by any Greenhouse gas quotas.
Technip also quantifi es its indirect emissions, which are those resulting from its own electric consumption and that of its subcontractors at its sites and on onshore operations.
Technip discusses climate issues in the Carbon Disclosure Project (CDP). The aim of the CDP is to provide institutional investors with accurate information about the impact on companies of the “carbon constraint” and global warming. Since 2008, Technip has been a member of the “Carbon Disclosure Leadership Index” (CDLI) in France which includes those companies with the best transparency and the most meaningful responses to these issues.
In 2009 Technip continued to pursue initiatives aimed at reducing its energy consumption:
The Group signed contracts in Italy with renewable energies providers for a third of the offi ces consumption. Photovoltaic installations on some of the Group’s offi ces rooftops supply 150 MWh a year.
Total Greenhouse gas emissionsQuantity (in t CO2 equiv.)
2009 2008
Direct Emissions Indirect Emissions Direct Emissions Indirect Emissions
Yards 234,162 5,092 218,204 61,238
Plants 1,044 9,719 19,534 6,750
Vessels 200,266 200,232
Offi ces 388 5,645 3,562 10,431
Total direct Greenhouse gas emissionsQuantity (in tons)
2009 2008
Emissions Emissions
CO2 217,062 240,509
CO 543 601
NOx 4,002 4,434
SO2 543 601
CH4 18 20
VOC 156 173

0472009 Reference Document
Overview of the Group’s Activities
6.6. Environment 6
6.6.4. WasteTechnip’s waste management policy is based on three key points: limiting waste production, sorting waste to ensure its traceability, and recycling.
WasteTotal waste weight, by type (in tons) 2009 2008
Non-hazardous waste 63,302 87,763
Hazardous waste 2,441 4,325
6.6.5. Noise pollutionMost of the Group’s operational sites are located in densely indus-trial environments and offshore. The noise impact of the Group’s activities is specifi cally analyzed, and effective systems and procedures are implemented at yards to mitigate disturbances.
6.6.6. Biodiversity protectionTechnip is an engineering and services company that helps its clients carry out their projects and their investments.
As it is the client’s responsibility to select project locations, Technip provides them with environmental consulting services. To this end, the operating centers have progressively developed a systemic environmental analysis method (ENVID) that is imple-mented at every stage of the project.
This tool ensures that all environmental aspects are properly accounted for in the design and construction or installation phases, and when evaluating selected options in terms of cost, environmental sensitivity and best practices.
In 2009, specifi c attention was paid to coastal zones. On the Kupe construction site, in New Zealand, an original phyto-fi ltration system has been put in place to collect and treat the run off waters from the construction site. This prevents the discharge of waste waters in the natural environment and contributes to the preservation of the coastal ecosystem. In Yemen, where the Company has delivered the fi rst LNG train of the YLNG gas lique-faction unit, the works on the coastline and at sea are subject to
a particular attention in order to protect the coral reefs near the site.
In Brazil, as part of the celebration of the 50th anniversary of the Company, the plantation of 50 different species of trees has been launched in Macae and Rio de Janeiro.
6.6.7. Legal and regulatory complianceTechnip operates within the framework of environmental regu-lations, standards, laws and international codes in force in the countries where it does business. Applicable regulations and client demands are identifi ed at the proposal stage in order to ensure they are properly monitored and respected during project execu-tion. The project manager issues a document summarizing legal and other contractual requirements for each discipline. Quality, HSE and legal departments of each entity verify that activities are in compliance with these regulations and monitor regulatory developments.
6.6.8. Expenses related to reducing the Group’s environmental impact
These expenses are linked to the strategic investments and the operating charges related to managing waste and effl uents at sites. The two new vessels that started operations in 2009, are “DNV clean design” certifi ed and are designed to reduce their environmental impact and energy consumption.
Annual expenditure related to environmental protection (in thousands of Euro) 2009 2008
Total running costs 325 370
Total engaged investments 1,457 674
6.6.9. Health, Safety and Environmental organization
OrganizationEnvironmental policy implementation relies upon Management’s commitment, the accountability of each Region and ongoing dialogue with parties involved.
The Sustainable Development Committee, with the support of HSE management, coordinates a network of environmental representatives at each entity, organizes technical working groups including experts from each activity, and puts together programs at the company focusing on environmental performance indica-tors, carbon accounting and eco-design.

048 2009 Reference Document
Overview of the Group’s Activities
6.6. Environment6
TrainingTraining in 2009, focused on leadership with the Pulse program which was developed internally.
As part of this initiative, all Technip entities worldwide partici-pated in the “UN World Environment Day” in June.
This year’s theme was “Your planet needs you – Unite to combat climate change”.
The goal of this international event is to make Technip employees aware of environmental issues and to be proactive on sustainable development and fair trade initiatives.
Training and environmental awareness 2009 2008
Hours conventioned under training 96,123 109,904
Number of hours on site 877,000 900,000
See details on risk management, in Sections 4.4 and 4.8 of this Reference Document.
Environmental incident preventionIn 2009, there were no environmental incidents identifi ed and considered signifi cant, meaning: one that requires the interven-tion of a third party and/or has an impact on the environment
outside of the area of operations, for activities involving Technip and its subcontractors.
90 minor incidents linked to hydrocarbon or lubricant accidental spillage on the ground, were reported in 2009.
Distribution of accidental releases
2009 2008
Number of incidents Volume
Number of incidents Volume
Yards 37 4,002 49 33,998*
Plants 10 2,007 20 1,640
Vessels 42 3,455 29 511
Offi ces 1 2 0 0
* Includes 30,000 liters of sanitary waste water treated and rejected in the natural environment further to a defect of pomping station.
6.6.10. Environmental provisions and guaranties – Compensation paid during the fi nancial year ended December 31, 2009 stemming from Court’s decisions on environmental issues and subsequent actions damage repair
Technip has not taken any specifi c provisions for environmental risks. Technip paid US$90,000 in connection with judicial deci-sions regarding environmental issues, in 2009.
6.6.11. Targets assigned to subsidiaries outside France
The programs, resources and results of Technip’s subsidiaries outside of France are included in this Reference Document. The Group’s HSE policy is implemented in all entities, regardless of legal status.
0492009 Reference Document
7
7.1. Simplifi ed Group Organizational Structure as of December 31, 2009 . . . . . . . . . . . . . . . . . . . . . . . . . .49
7.2. Subsidiaries and Investments . . . . . . . . . . . . . . . . . . . . . . . . . . . . . . . . . . . . . . . . . . . . . . . . . . . . . . . . . . . . . . . . . . . . . . . . . . . . . . . . . . . . . . . . . . . . . . . . . . . . . .49
Organizational Structure
7.1. Simplifi ed Group Organizational Structure as of December 31, 2009
Technip SA is the Group parent company.
To continue the move towards greater autonomy of the Regions which began two years ago, it was decided to create a new legal structure dedicated to the Group’s corporate activities. Until now, most of the corporate activities were geographically and legally incorporated in the Group’s main French entity. The creation of a separate entity, Technip Corporate Services (TCS), helps to clarify the Group’s organization. The corporate teams, grouped within TCS, focus on their respective missions. They continue to support the Group’s growth strategy, serving all Regions and
providing expertise to cross-Group functions such as HSE, Human Resources, Finance, Legal, Product Lines, Communication, and IT. The TCS structure has been operational since January 1, 2010.
The Company’s business is primarily to act as a holding company, receive dividends, and centralize and reinvoice management and administrative costs as management fees and specifi c costs such as insurance fees and commissions on representations and warranties.
All of the Company’s revenues are generated by its subsidiaries.
7.2. Subsidiaries and Investments
The subsidiaries handle and execute contracts. The Group’s main subsidiaries include the following:
Technip France is a simplifi ed joint-stock company ■ (société par actions simplifi ée) whose registered offi ce is located at 6-8, allée de l’Arche, 92400 Courbevoie (France). It is regis-tered with the Commercial Registry of Nanterre under the number 391 637 865. Technip France has been active for over 50 years in the engineering and project construction fi elds for the oil and gas and chemical industries. It manages contracts in the Subsea, Offshore and Onshore segments. As of December 31, 2009, the Group holds 100% of this company’s share capital.
Technip Italy S.p.A. has its registered offi ce at Viale Castello della ■
Magliana, 68 Roma (Italy). Since 1969, Technip Italy has been a leading international Engineering Contractor with consolidated experience in the design and implementation of major plants in all sectors of the oil and gas industry. It also possesses a vast capacity to develop large projects in several industrial fi elds. The Group holds 100% of this company’s share capital.
Technip UK Limited (Aberdeen) is located at Enterprise Drive, ■
Westhill, Aberdeenshire AB32 6TQ (United Kingdom). Specialized in the Offshore and Subsea segments, this company primarily works on North Sea projects, particularly, the construction of fl oating and fi xed platforms. Its Evanton spoolbase is used to
assemble rigid pipe. The Group holds 100% of this company’s share capital.
Technip Geoproduction Malaysia Sdn Bhd has its registered ■
offi ce at 2nd Floor Wisma Technip 241 Jalan Tun Razak, 50400 Kuala Lumpur (Malaysia). Created in 1982, this company is active in the Subsea, Offshore and Onshore segments. It is the leading engineering technology solutions and turnkey contract provider in Asia Pacific for the design and construction of hydrocarbon fi eld development, oil refi ning, gas processing, petrochemicals and selected non-hydrocarbon projects. The Group holds 30% of this company’s share capital (in compliance with local regulation).
Flexibras Tubos Flexiveis Limitada is a Brazilian company, located ■
at 35 Rua Jurema Barroso, 29020 490 Vitoria (Brazil). Created in 1984, this company’s activity consists in the manufacture and sale of high-quality fl exible pipes. Its manufacturing plant is strategically located near offshore oil and gas fi elds. The Group holds 100% of this company’s share capital.
Technip USA Inc is a US company, located at 11700 Katy ■
Freeway, Suite 150, Houston, Texas 77079 (United States). It is active in the Subsea, Onshore and Offshore segments, in particular, with the construction of Spars for fi elds in the Gulf of Mexico. The Group holds 100% of this company’s share capital.

050 2009 Reference Document
Organizational Structure
7.2. Subsidiaries and Investments7
The table below presents key fi gures for the main subsidiaries for the year ended December 31, 2009:
In millions of Euro
Consolidated fi gures (except dividends) Technip
FranceTechnip
ItalyTechnip UK Ltd
Technip Geoproduction
Malaysia Sdn Bhd FlexibrasTechnip USA Inc
Revenues 1,474.0 594.3 743.9 63.8 334.2 700.5
Fixed Assets (not including Goodwill) 23.2 29.3 255.5 2.5 60.5 37.8
Financial Debts (out of the Group) - - 96.8 - 121.1 -
Cash in Balance Sheet 929.0 340.1 90.0 15.7 299.0 128.5
Dividends Paid during the Year to the Quoted Company 6.0 36.9 22.5 - 11.9 -
Amount Invoiced by Technip SA during the Year 89.0 17.2 17.8 1.7 0.3 19.4
Acquisitions completed during the year were not signifi cant at the Group level (see Note 2-(a) to the Consolidated Financial Statements included in Section 20.1 of this Reference Document), with revenues from the main acquisition in 2009 amounting to €1.6 million.
See also to the List of Subsidiaries and Investments as disclosed in Note 7 of the Company’s Statutory Accounts as of December 31, 2009, included in Section 20.2 of this Reference Document.

0512009 Reference Document
8
8.1. Signifi cant existing or planned Property, Plant and Equipment
and major related Expenses . . . . . . . . . . . . . . . . . . . . . . . . . . . . . . . . . . . . . . . . . . . . . . . . . . . . . . . . . . . . . . . . . . . . . . . . . . . . . . . . . . . . . . . . . . . . . . . . . . . . . . . . .518.1.1. Facilities . . . . . . . . . . . . . . . . . . . . . . . . . . . . . . . . . . . . . . . . . . . . . . . . . . . . . . . . . . . . . . . . . . . . . . . . . . . . . . . . . . . . . . . . . . . . . . . . . . . . . . . . . . . . . . . . . . . . . . . . . . . . . . . . . . . . . . . . . . . . . . . . . . . . .518.1.2. Fleet of Vessels . . . . . . . . . . . . . . . . . . . . . . . . . . . . . . . . . . . . . . . . . . . . . . . . . . . . . . . . . . . . . . . . . . . . . . . . . . . . . . . . . . . . . . . . . . . . . . . . . . . . . . . . . . . . . . . . . . . . . . . . . . . . . . . . . . . . . . . . . . .54
8.2. Environmental Matters that may impact the Group’s Use of its Property,
Plant and Equipment . . . . . . . . . . . . . . . . . . . . . . . . . . . . . . . . . . . . . . . . . . . . . . . . . . . . . . . . . . . . . . . . . . . . . . . . . . . . . . . . . . . . . . . . . . . . . . . . . . . . . . . . . . . . . . . . . . . . . .55
Property, Plant and Equipment
8.1. Signifi cant existing or planned Property, Plant and Equipment and major related Expenses
8.1.1. FacilitiesTechnip’s main facilities, with the exception of its vessels, include offi ces, operational centers, assembly plants and factories. Technip mostly leases its offi ce space. At December 31, 2009, Technip owned offi ces, including sites in Rome and New Delhi, as well as various factories such as the Le Trait plant in Normandy. Since 2003, the Company has leased a multi-story, single-site building
with a 3,200 workstation capacity in Courbevoie. It owns or leases construction sites and production sites for the Subsea Division’s operations and for the production of fl exible pipes and other subsea products. Technip believes that its installations are suited to its needs. In the Group Consolidated Financial Statements dated December 31, 2009, Technip’s land, buildings, machines and equipment were recorded at a net amount of €305.4 million, including €81.1 million of land and buildings.

052 2009 Reference Document
Property, Plant and Equipment
8.1. Signifi cant existing or planned Property, Plant and Equipment and major related Expenses 8
At December 31, 2009, the Group had access to the following main properties, either owned or leased:
Location Purpose Legal Status
(EUROPE)
Courbevoie (Paris La Défense), France Head Offi ce/Offi ces Lease
Paris, France Offi ces Lease
Le Trait, France Plant (fl exible hoses), Offi ces and Land Owned
Lyon, France Offi ces Lease
Rouen, France Offi ces Lease
Nîmes, France Offi ces Lease
Toulouse, France Offi ces Lease
Bagnolet, France Offi ces Lease
Rome, Italy Offi ces Owned/Lease
Zoetermeer, the Netherlands Offi ces Lease
Capelle a/d. IJssel, the Netherlands Offi ces Lease
‘s-Hertogenbosch, the Netherlands Offi ces Lease
Bergen op Zoom, the Netherlands Offi ces Lease
The Hague, the Netherlands Offi ces Lease
Düsseldorf, Germany Offi ces Lease
Newcastle, United Kingdom Plant (umbilicals) and Offi ces Owned/Lease
Aberdeen (Scotland), United Kingdom Offi ces and Warehouses Owned/Lease
London, United Kingdom Offi ces Lease
Edinburgh (Scotland), United Kingdom Warehouses Owned/Lease
Evanton (Scotland), United Kingdom Plant (Spoolbase) and Land Owned/Lease
Pori (Mäntyluoto), Finland Plant (ship construction yard) and Land Owned
Pori, Finland Offi ces Lease
Brussels, Belgium Offi ces Lease
Antwerp, Belgium Offi ces Lease
Barcelona, Spain Offi ces Lease
Madrid, Spain Offi ces Lease
Tarragone, Spain Offi ces Lease
Oslo & Stavanger, Norway Offi ces Lease
Orkanger, Norway Plant (Spoolbase), Offi ces and Land Owned/Lease
Athens, Greece Offi ces Lease
Warsaw, Poland Offi ces Lease
(EASTERN EUROPE)
Saint Petersburg, Russia Offi ces Lease
Moscow, Russia Offi ces Lease
Baku, Azerbaijan Offi ces Lease
(ASIA)
New Delhi, India Offi ces Owned/Lease
Chennai, India Offi ces Lease
Mumbai, India Offi ces Lease
Kuala Lumpur, Malaysia Offi ces Lease
Tanjung Langsat, Malaysia Plant under construction (fl exible hoses and umbilicals) and Land Lease
Shanghai, China Offi ces Lease
Beijing, China Offi ces Lease
Jakarta, Indonesia Offi ces Lease
Balikpapan, Indonesia Offi ces Lease
Bangkok, Thailand Offi ces Lease
Rayong, Thailand Offi ces Lease
Singapore, Singapore Offi ces Lease
Hanoi, Vietnam Offi ces Lease
Ho Chi Minh, Vietnam Offi ces Lease

0532009 Reference Document
Property, Plant and Equipment
8.1. Signifi cant existing or planned Property, Plant and Equipment and major related Expenses 8
Location Purpose Legal Status
(OCEANIA)
Perth, Australia Offi ces Lease
(NORTH AMERICA)
Channelview (Texas), United States Plant (umbilicals) and Land Owned
Claremont (California), United States Offi ces Lease
Mobile (Alabama), United States Plant (Spoolbase) and Land Owned/Lease
Houston (Texas), United States Offi ces Lease
St. John’s, Canada Offi ces Lease
Calgary, Canada Offi ces Lease
Monterrey, Mexico Offi ces Lease
(SOUTH AMERICA)
Vitoria, Brazil Plant (fl exible hoses) and Land Owned/Lease
Rio de Janeiro, Brazil Offi ces Owned/Lease
Macaé, Brazil Logistics base and Offi ces Owned
Angra dos Reis, Brazil Harbor facilities and Offi ces Lease
Caracas, Venezuela Offi ces Co-Owned
Bogota, Colombia Offi ces Owned
(AFRICA)
Lagos, Nigeria Offi ces Lease
Port Harcourt, Nigeria Plant (naval construction site), Offi ces and Land Owned/Lease
Lobito, Angola Plant (umbilicals) and Land Owned/Lease
Dande, Angola Plant (spoolbase) and Land Owned/Lease
Luanda, Angola Offi ces Lease
Johannesburg, South Africa Offi ces Lease
(MIDDLE EAST)
Dubai, UAE Offi ces Lease
Abu Dhabi, UAE Offi ces Lease
Doha, Qatar Offi ces Lease
Al Khobar, Saudi Arabia Offi ces Lease
Sana’a, Yemen Offi ces Lease
None of the leased properties belongs to any of the Group’s executives.
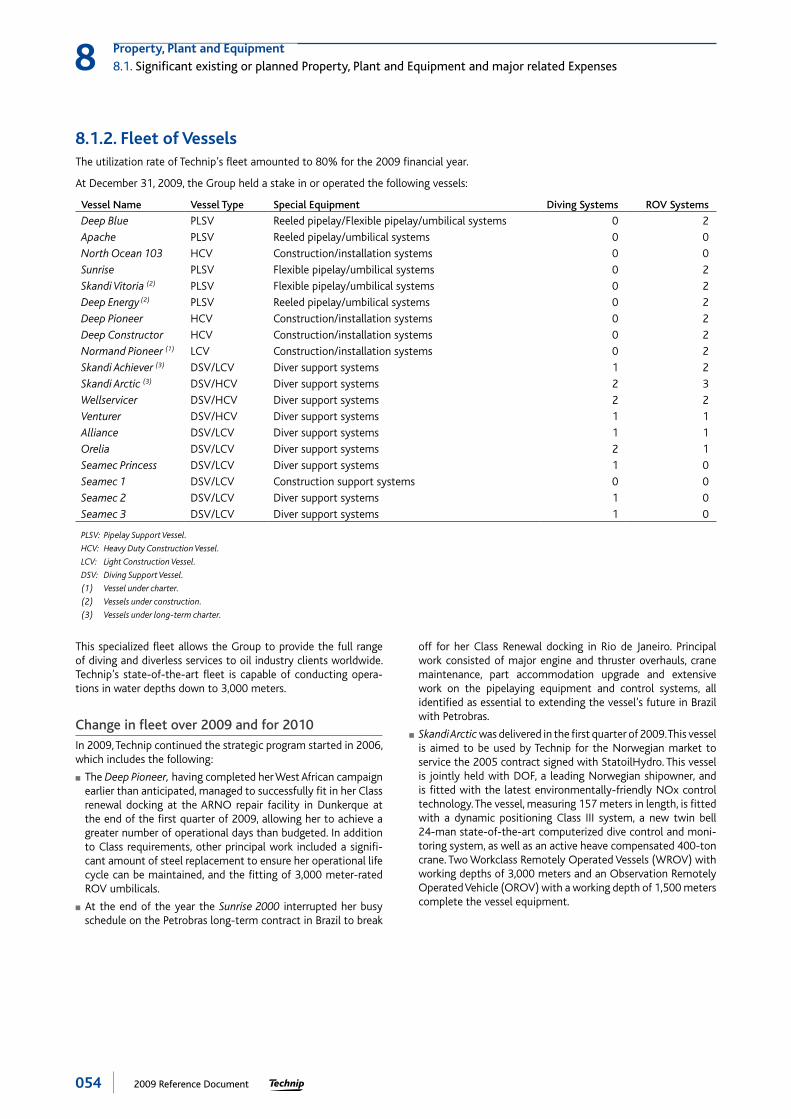
054 2009 Reference Document
Property, Plant and Equipment
8.1. Signifi cant existing or planned Property, Plant and Equipment and major related Expenses 8
8.1.2. Fleet of VesselsThe utilization rate of Technip’s fl eet amounted to 80% for the 2009 fi nancial year.
At December 31, 2009, the Group held a stake in or operated the following vessels:
Vessel Name Vessel Type Special Equipment Diving Systems ROV Systems
Deep Blue PLSV Reeled pipelay/Flexible pipelay/umbilical systems 0 2
Apache PLSV Reeled pipelay/umbilical systems 0 0
North Ocean 103 HCV Construction/installation systems 0 0
Sunrise PLSV Flexible pipelay/umbilical systems 0 2
Skandi Vitoria (2) PLSV Flexible pipelay/umbilical systems 0 2
Deep Energy (2) PLSV Reeled pipelay/umbilical systems 0 2
Deep Pioneer HCV Construction/installation systems 0 2
Deep Constructor HCV Construction/installation systems 0 2
Normand Pioneer (1) LCV Construction/installation systems 0 2
Skandi Achiever (3) DSV/LCV Diver support systems 1 2
Skandi Arctic (3) DSV/HCV Diver support systems 2 3
Wellservicer DSV/HCV Diver support systems 2 2
Venturer DSV/HCV Diver support systems 1 1
Alliance DSV/LCV Diver support systems 1 1
Orelia DSV/LCV Diver support systems 2 1
Seamec Princess DSV/LCV Diver support systems 1 0
Seamec 1 DSV/LCV Construction support systems 0 0
Seamec 2 DSV/LCV Diver support systems 1 0
Seamec 3 DSV/LCV Diver support systems 1 0
PLSV: Pipelay Support Vessel.
HCV: Heavy Duty Construction Vessel.
LCV: Light Construction Vessel.
DSV: Diving Support Vessel.
(1) Vessel under charter.
(2) Vessels under construction.
(3) Vessels under long-term charter.
This specialized fl eet allows the Group to provide the full range of diving and diverless services to oil industry clients worldwide. Technip’s state-of-the-art fl eet is capable of conducting opera-tions in water depths down to 3,000 meters.
Change in fl eet over 2009 and for 2010In 2009, Technip continued the strategic program started in 2006, which includes the following:
The ■ Deep Pioneer, having completed her West African campaign earlier than anticipated, managed to successfully fi t in her Class renewal docking at the ARNO repair facility in Dunkerque at the end of the fi rst quarter of 2009, allowing her to achieve a greater number of operational days than budgeted. In addition to Class requirements, other principal work included a signifi -cant amount of steel replacement to ensure her operational life cycle can be maintained, and the fi tting of 3,000 meter-rated ROV umbilicals.
At the end of the year the ■ Sunrise 2000 interrupted her busy schedule on the Petrobras long-term contract in Brazil to break
off for her Class Renewal docking in Rio de Janeiro. Principal work consisted of major engine and thruster overhauls, crane maintenance, part accommodation upgrade and extensive work on the pipelaying equipment and control systems, all identifi ed as essential to extending the vessel’s future in Brazil with Petrobras.
Skandi Arctic ■ was delivered in the fi rst quarter of 2009. This vessel is aimed to be used by Technip for the Norwegian market to service the 2005 contract signed with StatoilHydro. This vessel is jointly held with DOF, a leading Norwegian shipowner, and is fi tted with the latest environmentally-friendly NOx control technology. The vessel, measuring 157 meters in length, is fi tted with a dynamic positioning Class III system, a new twin bell 24-man state-of-the-art computerized dive control and moni-toring system, as well as an active heave compensated 400-ton crane. Two Workclass Remotely Operated Vessels (WROV) with working depths of 3,000 meters and an Observation Remotely Operated Vehicle (OROV) with a working depth of 1,500 meters complete the vessel equipment.

0552009 Reference Document
Property, Plant and Equipment
8.2. Environmental Matters that may impact the Group’s Use of its Property, Plant and Equipment 8
Construction of Technip’s new pipelay vessel ■ (Deep Energy) is progressing at STXHI’s yard in Dalian (China). Main vessel equi-pment has now been delivered to the construction yard. Vessel delivery complete with all marine equipment is expected by the end of 2010. The vessel will then transit back to Europe for the installation of the main pipelay equipment. Engineering and fabrication of the main lay equipment is progressing well with European fabricators. The NPV will be a dynamically positioned Class III vessel measuring 194 meters in length, with a pipe capacity of 5,600 tons on two off reels. This high transit speed vessel will be able to function worldwide and will be able to install rigid pipes with diameters of up to 18 inches in a range of water depths.
The construction of the Technip's new fl exible pipelay vessel, ■
Skandi Vitoria, continues in Brazil. This vessel, jointly held with DOF, will be used for the Brazilian market under a long-term
contract with Petrobras. She features a vertical laying system for fl exible pipes in water depths down to 2,500 meters, as well as a horizontal laying system for umbilicals. At the end of 2009, the Vertical Lay System, the main 2,000-ton carousel and the 250-ton active heave compensated crane were installed. Vessel sea trials were completed, and fi nal vessel delivery after lay equipment commissioning is expected in mid-2010.
Lastly, in 2009, Technip took delivery from the Metalships ■
yard in Vigo (Spain) of a newly built construction vessel, North Ocean 103, purchased from Oceanteam ASA. The vessel called Apache II then transited to Technip’s yard in Pori, Finland, where she is being retrofi tted with the existing Apache pipelay ramp and equipment. Delivery of the completed vessel is scheduled for the fi rst half of 2010. With additional crane capacity and Remotely Operated Vehicles (ROVs), this vessel will offer greater construction capacity than the previous Apache confi guration.
8.2. Environmental Matters that may impact the Group’s Use of its Property, Plant and Equipment
See Sections 4.3 and 4.4 of this Reference Document.

056 2009 Reference Document
Comments . . . . . . . . . . . . . . . . . . . . . . . . . . . . . . . . . . . . . . . . . . . . . . . . . . . . . . . . . . . . . . . . . . . . . . . . . . . . . . . . . . . . . . . . . . . . . . . . . . . . . . . . . . . . . . . . . . . . . . . . . . . . . . . . . . . . . . . . . . . . . . .56
9.1. Presentation of the Consolidated Financial Statements included
in the Reference Document. . . . . . . . . . . . . . . . . . . . . . . . . . . . . . . . . . . . . . . . . . . . . . . . . . . . . . . . . . . . . . . . . . . . . . . . . . . . . . . . . . . . . . . . . . . . . . . . . . . . . . . . . .57Main Changes in the Scope of Consolidation . . . . . . . . . . . . . . . . . . . . . . . . . . . . . . . . . . . . . . . . . . . . . . . . . . . . . . . . . . . . . . . . . . . . . . . . . . . . . . . . . . . . . . . . . . . . .57Reporting by Business Segment and by Geographical Area. . . . . . . . . . . . . . . . . . . . . . . . . . . . . . . . . . . . . . . . . . . . . . . . . . . . . . . . . . . . . . . . . . . . . . . .57
9.2. Changes in Backlog and Presentation of Revenues . . . . . . . . . . . . . . . . . . . . . . . . . . . . . . . . . . . . . . . . . . . . . . . . . . . . . . . . . . . . . .58Changes in Backlog . . . . . . . . . . . . . . . . . . . . . . . . . . . . . . . . . . . . . . . . . . . . . . . . . . . . . . . . . . . . . . . . . . . . . . . . . . . . . . . . . . . . . . . . . . . . . . . . . . . . . . . . . . . . . . . . . . . . . . . . . . . . . . . . . . . .58Presentation of Revenues . . . . . . . . . . . . . . . . . . . . . . . . . . . . . . . . . . . . . . . . . . . . . . . . . . . . . . . . . . . . . . . . . . . . . . . . . . . . . . . . . . . . . . . . . . . . . . . . . . . . . . . . . . . . . . . . . . . . . . . . . . .59
9.3. Presentation of Operating Costs . . . . . . . . . . . . . . . . . . . . . . . . . . . . . . . . . . . . . . . . . . . . . . . . . . . . . . . . . . . . . . . . . . . . . . . . . . . . . . . . . . . . . . . . . . . . . . . .61Cost of Sales. . . . . . . . . . . . . . . . . . . . . . . . . . . . . . . . . . . . . . . . . . . . . . . . . . . . . . . . . . . . . . . . . . . . . . . . . . . . . . . . . . . . . . . . . . . . . . . . . . . . . . . . . . . . . . . . . . . . . . . . . . . . . . . . . . . . . . . . . . . . . . .61Research and Development Costs . . . . . . . . . . . . . . . . . . . . . . . . . . . . . . . . . . . . . . . . . . . . . . . . . . . . . . . . . . . . . . . . . . . . . . . . . . . . . . . . . . . . . . . . . . . . . . . . . . . . . . . . . . . . . .61Selling and Administrative Expenses . . . . . . . . . . . . . . . . . . . . . . . . . . . . . . . . . . . . . . . . . . . . . . . . . . . . . . . . . . . . . . . . . . . . . . . . . . . . . . . . . . . . . . . . . . . . . . . . . . . . . . . . . .61Payroll Expenses . . . . . . . . . . . . . . . . . . . . . . . . . . . . . . . . . . . . . . . . . . . . . . . . . . . . . . . . . . . . . . . . . . . . . . . . . . . . . . . . . . . . . . . . . . . . . . . . . . . . . . . . . . . . . . . . . . . . . . . . . . . . . . . . . . . . . . . . .61Other Operating Income and Expenses . . . . . . . . . . . . . . . . . . . . . . . . . . . . . . . . . . . . . . . . . . . . . . . . . . . . . . . . . . . . . . . . . . . . . . . . . . . . . . . . . . . . . . . . . . . . . . . . . . . . .61
9.4. Comments on the Results of Operations for the year ended
December 31, 2009, compared to the year ended December 31, 2008. . . . . . . . . . . . . . . . . . . . . . . .62Operating Income/(Loss) from Recurring Activities. . . . . . . . . . . . . . . . . . . . . . . . . . . . . . . . . . . . . . . . . . . . . . . . . . . . . . . . . . . . . . . . . . . . . . . . . . . . . . . . . . . .62Income/(Loss) from Sale of Activities . . . . . . . . . . . . . . . . . . . . . . . . . . . . . . . . . . . . . . . . . . . . . . . . . . . . . . . . . . . . . . . . . . . . . . . . . . . . . . . . . . . . . . . . . . . . . . . . . . . . . . . . .64Provision for Litigation . . . . . . . . . . . . . . . . . . . . . . . . . . . . . . . . . . . . . . . . . . . . . . . . . . . . . . . . . . . . . . . . . . . . . . . . . . . . . . . . . . . . . . . . . . . . . . . . . . . . . . . . . . . . . . . . . . . . . . . . . . . . . . .64Net Operating Income . . . . . . . . . . . . . . . . . . . . . . . . . . . . . . . . . . . . . . . . . . . . . . . . . . . . . . . . . . . . . . . . . . . . . . . . . . . . . . . . . . . . . . . . . . . . . . . . . . . . . . . . . . . . . . . . . . . . . . . . . . . . . . .64Financial Result . . . . . . . . . . . . . . . . . . . . . . . . . . . . . . . . . . . . . . . . . . . . . . . . . . . . . . . . . . . . . . . . . . . . . . . . . . . . . . . . . . . . . . . . . . . . . . . . . . . . . . . . . . . . . . . . . . . . . . . . . . . . . . . . . . . . . . . . . .64Income Tax . . . . . . . . . . . . . . . . . . . . . . . . . . . . . . . . . . . . . . . . . . . . . . . . . . . . . . . . . . . . . . . . . . . . . . . . . . . . . . . . . . . . . . . . . . . . . . . . . . . . . . . . . . . . . . . . . . . . . . . . . . . . . . . . . . . . . . . . . . . . . . . . .65Net Income from Discontinued Operations . . . . . . . . . . . . . . . . . . . . . . . . . . . . . . . . . . . . . . . . . . . . . . . . . . . . . . . . . . . . . . . . . . . . . . . . . . . . . . . . . . . . . . . . . . . . . . .65Net Income Attributable to Minority Interests. . . . . . . . . . . . . . . . . . . . . . . . . . . . . . . . . . . . . . . . . . . . . . . . . . . . . . . . . . . . . . . . . . . . . . . . . . . . . . . . . . . . . . . . . . .65Net Income . . . . . . . . . . . . . . . . . . . . . . . . . . . . . . . . . . . . . . . . . . . . . . . . . . . . . . . . . . . . . . . . . . . . . . . . . . . . . . . . . . . . . . . . . . . . . . . . . . . . . . . . . . . . . . . . . . . . . . . . . . . . . . . . . . . . . . . . . . . . . . . .65Earnings per Share. . . . . . . . . . . . . . . . . . . . . . . . . . . . . . . . . . . . . . . . . . . . . . . . . . . . . . . . . . . . . . . . . . . . . . . . . . . . . . . . . . . . . . . . . . . . . . . . . . . . . . . . . . . . . . . . . . . . . . . . . . . . . . . . . . . . . .65
9.5. Changes in Balance Sheet and Financial Position between the year ended
December 31, 2009 and the year ended December 31, 2008 . . . . . . . . . . . . . . . . . . . . . . . . . . . . . . . . . . . . . . . . . .65Non-Current Assets . . . . . . . . . . . . . . . . . . . . . . . . . . . . . . . . . . . . . . . . . . . . . . . . . . . . . . . . . . . . . . . . . . . . . . . . . . . . . . . . . . . . . . . . . . . . . . . . . . . . . . . . . . . . . . . . . . . . . . . . . . . . . . . . . . . .65Current Assets . . . . . . . . . . . . . . . . . . . . . . . . . . . . . . . . . . . . . . . . . . . . . . . . . . . . . . . . . . . . . . . . . . . . . . . . . . . . . . . . . . . . . . . . . . . . . . . . . . . . . . . . . . . . . . . . . . . . . . . . . . . . . . . . . . . . . . . . . . . .66Provisions . . . . . . . . . . . . . . . . . . . . . . . . . . . . . . . . . . . . . . . . . . . . . . . . . . . . . . . . . . . . . . . . . . . . . . . . . . . . . . . . . . . . . . . . . . . . . . . . . . . . . . . . . . . . . . . . . . . . . . . . . . . . . . . . . . . . . . . . . . . . . . . . . . .66Financial Debts . . . . . . . . . . . . . . . . . . . . . . . . . . . . . . . . . . . . . . . . . . . . . . . . . . . . . . . . . . . . . . . . . . . . . . . . . . . . . . . . . . . . . . . . . . . . . . . . . . . . . . . . . . . . . . . . . . . . . . . . . . . . . . . . . . . . . . . . . . .66Off-Balance Sheet Commitments . . . . . . . . . . . . . . . . . . . . . . . . . . . . . . . . . . . . . . . . . . . . . . . . . . . . . . . . . . . . . . . . . . . . . . . . . . . . . . . . . . . . . . . . . . . . . . . . . . . . . . . . . . . . . .67
Review of Financial Position and Financial Performance
9
Comments
The following document presents Technip’s consolidated fi nancial results for the two periods ended respectively December 31, 2009 and 2008, prepared in accordance with International Financial Reporting Standards (IFRS) (the “Consolidated Financial Statements”). When used in this section, the term “Technip” refers to Technip SA and its consolidated subsidiaries.
The reader is encouraged to read the presentation below in light of the entire Reference Document, including the Consolidated Financial Statements and the Notes that accompany them, as presented in Section 20.1 of this Reference Document.

0572009 Reference Document
Review of Financial Position and Financial Performance
9.1. Presentation of the Consolidated Financial Statements included in the Reference Document 9
9.1. Presentation of the Consolidated Financial Statements included in the Reference Document
Main Changes in the Scope of Consolidation(See Note 2 to the Consolidated Financial Statements at December 31, 2009)
In 2009 the Group made the following acquisitions:
On February 9, 2009, Technip Maritime do Brasil Ltda acquired TPAR Terminal Portuario de Angra dos Reis S/A, a Brazilian company holding a lease for a port land in Angra Porto. Between February 9, 2009 and December 31, 2009 TPAR generated revenues of €1.6 million and a net loss of €0.1 million. The total balance sheet of the company amounted to €6.8 million as of December 31, 2009. Goodwill amounted to €8 million and was accounted for as intan-gible asset amortized over the 15-year lease period that remains.
On June 12, 2009, Technip Norge AS and Technip Cofl exip Norge AS acquired respectively 90% and 10% of North Ocean III KS, a Norwegian company that owns a vessel under construction (Apache II).
In 2009 the following subsidiaries were created: Technip Ships Norge AS, 100% owned by Technip and fully consolidated; TSU Niger SARL, 60% owned by Technip and consolidated under the proportionate method; Technip Italy Direzione Lavori, 100% owned by Technip and fully consolidated; Technip Thailand Ltd., 49% owned by Technip and consolidated under the proportionate method; and Technip Operadora Portuaria, 100% owned by Technip and fully consolidated.
During 2009 fi nancial year, Cofl exip Maritime Inc. was merged into Technip USA Holdings Inc, Gulf Deepwater Yards Inc. was merged into Technip USA Inc and EPG Holding BV and BV Uitzendbureau UPG were merged into Technip EPG BV.
Two companies, SCI CB3-Défense and Aransas Partners, were closed.
No company included in the scope of consolidation was sold in 2009.
In 2008, Technip acquired in the Onshore segment EPG Holding BV and two subsidiaries. The goodwill arising from this operation amounted to €3.9 million and, in the absence of any identifi able asset, was allocated entirely to goodwill. In the Offshore segment, Technip acquired Eurodim, an engineering and consulting company based near Paris. Goodwill amounted to €9.8 million and was accounted for as patents for €3.7 million and as goodwill for €6.1 million.
Cofl exip Développement acquired Sofremines on December 31, 2008, an engineering company based near Paris. Sofremines,
renamed Technip Mines, employs around 20 people and is dedicated to the Onshore segment. Goodwill amounted to €1.0 million and, in the absence of any identifi able asset, was allocated entirely to goodwill.
In 2008, the following subsidiaries were created: Genesis Oil and Gas Consultant Canada, 100% owned by Technip and fully consoli-dated; Techdof, 50% owned by Technip, and TSU Projects, 60% owned by Technip, consolidated under proportionate method.
During 2008 fi nancial year, Citex was merged into Technip France and RJ Brown Deepwater was merged into Technip USA Holdings Inc.
Technip Biopharm, Technip Upstream Management, Cofl exip Stena Offshore AS, TSKJ-US LLC, TSKJ Italia SRL, TS Usan and Consortio Jantec were closed.
No activity was sold in 2008.
Reporting by Business Segment and by Geographical AreaTechnip has reported its operating performance based on the following four segments since 2008:
the Subsea segment, which includes the design, manufacture, ■
provisioning and installation of subsea equipment;
the Offshore segment, which includes the design and construc- ■
tion of fi xed or fl oating facilities and surface installations;
the Onshore segment, which includes the entire engineering ■
and construction business for petrochemical and refi ning plants as well as facilities for developing onshore oil and gas fi elds, including gas treatment units, liquefi ed natural gas (LNG) units and onshore pipelines as well as the engineering and construc-tion of non-petroleum facilities; and
the Corporate segment, which includes holding company activi- ■
ties, as well as the different centralized services provided to the Group’s entities.
From a geographical standpoint, Technip’s operating activities and performance are reported on the basis of the following fi ve regions:
Europe, Russia and Central Asia; ■
Africa; ■
Middle East; ■
Asia Pacifi c; and ■
Americas. ■

058 2009 Reference Document
Review of Financial Position and Financial Performance
9.2. Changes in Backlog and Presentation of Revenues9
9.2. Changes in Backlog and Presentation of Revenues
Changes in BacklogBacklog, defi ned as the difference between the total contrac-tual sale prices of all contracts in force and the cumulated revenues recognized at that date on these contracts, amounted
to €8,018.3 million at December 31, 2009, compared to €7,208.4 million at December 31, 2008, representing an increase of 11.2%, which is primarily attributable to stronger Onshore order intake in 2009 than in 2008.
Order intake by segment in 2009, compared to 2008, is shown below:
12/31/2009 12/31/2008 Change
Subsea 2,480.4 2,854.4 -13.1%
Offshore 554.1 517.6 7.1%
Onshore 4,141.2 2,382.7 73.8%
Total 7,175.7 5,754.7 24.7%
The increase in the level of order intake in 2009 can be explained by the strong rise in the Onshore segment (increase of €1,758 million relative to 2008) related mainly to the award of the Jubail’s refi nery contracts. Order intake in the Subsea segment
decreased by €374 million compared to 2008, but remained high because several large contracts entered into force, such as Jubilee, Goliat and Tupi. Order intake in the Offshore segment did not vary signifi cantly from one year to the next (+7.1%).
Backlog by segment is detailed below:
12/31/2009 12/31/2008 Change
Subsea 3,053.0 3,495.9 -12.7%
Offshore 467.9 461.1 1.5%
Onshore 4,497.4 3,251.4 38.3%
Total 8,018.3 7,208.4 11.2%
The Onshore segment was the largest contributor with €4,497.4 million, i.e. 56.1% of the backlog at the end of 2009, representing an increase of 38.3% from the backlog at December 31, 2008, which amounted to €3,251.4 million (i.e. 45.1% of total backlog). This increase was mainly attributable to the Middle East region, which, at €3,007.1 million, represented 66.9% of the Onshore segment’s backlog in 2009, compared to 43.9% in 2008 (€1,428.6 million). Technip was awarded two major contracts in the Middle East: the grassroots refi nery at Jubail in Saudi Arabia and a lump sum turnkey contract by Abu Dhabi Gas Industries Ltd (Gasco) for the ASAB 3 project. The backlog in Europe, Russia and Central Asia decreased: €851.3 million in 2009 (i.e. 18.9% of the segment) from €1,067.4 million in 2008 (i.e. 32.8% of the segment). The backlog stemmed from a lump sum turnkey contract for the Gdansk refi nery in Poland (Grupa Lotos), signed in July 2007, and two contracts in Russia: an extension of an ethylene plant for Sibur Neftehim awarded in 2008 and the construction of a petrochemical plant for RusVinyl in 2009. In the Asia Pacifi c region, backlog remained stable at €444.2 million in 2009 (i.e. 9.9% of the Onshore segment’s backlog), compared to €437.1 million at the end of 2008 (i.e. 13.5% of the Onshore segment’s 2008 backlog). The backlog comprised mainly the lump sum contract of a mid-scale liquefi ed natural gas plant for Ningxia Hanas in China, and two contracts for HPCL (Hindustan Petroleum Corporation Limited) in India, all three of them awarded this year. With regard to the Americas, activity was affected in 2009 by a strong slowdown and the backlog was cut in half to
€119.1 million in 2009 (i.e. 2.6% of the segment’s backlog), compared to €220.5 million at the end of 2008 (i.e. 6.8% of the Onshore segment’s backlog). At this date, the backlog comprised mainly several small and midsize service contracts.
The Subsea segment was the second largest contributor with €3,053.0 million, representing 38.1% of the total backlog at the end of 2009, a decrease of 12.7% compared to backlog at December 31, 2008 (€3,495.9 million, i.e. 48.5% of the total backlog). Nevertheless, trends in the regions where the Group operates have varied signifi cantly. In this regard, Africa accounted for 43.8% of the Subsea segment’s backlog in 2009 (i.e. €1,339.0 million), compared to 42.7% in 2008 (i.e. €1,492.0 million) which represented a decline of 10.3%. The major contract awarded in 2009 is the development of Jubilee oilfi eld (Tullow Oil) offshore Ghana and, to a lesser extent, Aseng Field Development (Noble Energy) in Equatorial Guinea and West Delta (Burullus Gas) in Egypt. Backlog for the Americas (including Brazil) also slightly decreased to €1,040.5 million in 2009, representing 34.1% of the Subsea segment’s backlog, compared to €1,221.0 million in 2008, which represented 34.9% of the backlog. This was due, in particular, to new major contracts awarded with Petrobras including the supply and installation of rigid pipe for the Tupi oilfi eld and the supply of fl exible pipes for the Tambau Urugua, UNBC Grande Diametro and Cachalote projects. In the Gulf of Mexico, two major contracts for rigid pipe supply and installation in the Isabella (BP) and Caesar Tonga

0592009 Reference Document
Review of Financial Position and Financial Performance
9.2. Changes in Backlog and Presentation of Revenues 9
(Anadarko) oilfi elds were also signed. The backlog in Asia Pacifi c fell a more substantial 54.9% reaching €97.4 million compared to €216.3 million in 2008. This drop can be explained by progress on Woodside contracts (Greater Enfi eld and NEFRP) and lower level of order intake compared to 2008, despite the award of another contract of fl exible pipe supply and installation with Woodside in Australia (CWLH Refurbishment). Lastly, the backlog at the end of 2009 in Europe, Russia and Central Asia was fl at representing €545.7 million (i.e. 17.9% of the Subsea backlog) compared to €560.7 million at December 31, 2008 (i.e. 16.0% of the segment’s backlog).
The Offshore segment’s backlog amounted to €467.9 million, compared to €461.1 million at the end of 2008, representing an increase of 1.5%. 19.4% of the backlog consisted of contracts to be executed in Africa, with €90.9 million from the Akpo FPSO (Total) and Ofon T&I (Total) contracts in Nigeria. The Americas area contributed 44.2% of the Offshore segment’s backlog with €206.9 million, including notably the P56 semi-submersible production platform project (Petrobras) and the FPSO P58-62 topside (Petrobras). The Asia Pacifi c region contributed €101.7 million representing 21.8% of the Offshore’s backlog with
the FEEDs for Shell (for a Floating Liquefi ed Natural Gas solution–FLNG) and for Chevron for the Offshore processing platform associated with the Wheatstone project. The Middle East area contributed €25.2 million, representing 5.4% of the segment’s backlog, primarily resulting from the Zakum/GPF (ADMA-OPCO) contract offshore Abu Dhabi.
Presentation of RevenuesRevenues on contracts are measured on the basis of costs incurred and the margin recognized based on the percentage of completion, which is computed as follows:
for all contracts, which include construction services subject ■
to performance commitments (turnkey contracts), once their progress is deemed suffi cient, the percentage of completion is based on technical milestones defi ned for the main components of the contracts;
for other construction contracts, the percentage of completion ■
is recognized based on the ratio between costs incurred to date and estimated total costs at completion.
The table below shows consolidated revenues by business segment for the years ended December 31, 2009 and 2008:
In millions of Euro Subsea Offshore Onshore CorporateTotal Continuing
OperationsDiscontinued
Operations Total
Revenues 2009 2,866.1Var.
6.6% 565.0Var.
-18.7% 3,024.9Var.
-26.2% - 6,456,0Var.
-13,7% - 6,456,0Var.
-13,7%
Revenues 2008 2,689.0 695.2 4,097.2 - 7,481,4 - 7,481,4
Revenues decreased from €7,481.4 million in 2008 to €6,456.0 million in 2009, a 13.7% drop. The impact of foreign exchange rates on revenues was relatively small during the period (€-101.2 million), as the depreciation of the US dollar partially offset the appreciation of the pound sterling (12% against euro).
Revenues by Business Segment
SubseaThe Subsea segment generated revenues of €2,866.1 million in 2009, an increase of 6.6% over 2008 (€2,689.0 million). It accounted for 44.4% of 2009 consolidated revenues, compared to 35.9% in 2008. The increase in 2009 was due to the value of projects executed over the course of the year and the substantial activity on the projects in Africa and in the North Sea in particular. The main projects were: for Africa, Paz Flor (Total) in Angola, Jubilee (Tullow Oil) in Ghana, and Agbami (Chevron Texaco), ABO 2 (Agip) and Oyo (ENI) in Nigeria; for Europe, Russia and Central Asia, DSVI (THT) in Great Britain, and the Yme Redevelopment (Talisman) and Gjoa Tie In (StatoilHydro) projects in Norway; for the Americas, P53, P51 and PDET-PDEG (Petrobras) in Brazil, as well as Cascade Chinook (Petrobras) in the United States and North Amethyst (Husky Oil) in Canada; and lastly for Asia Pacifi c, Greater Enfi eld and NEFRP (Woodside) in Australia and MAD6 Installation Phase 2 (Aker) in India.
OffshoreOffshore revenues were €565.0 million in 2009, an 18.7% decrease from €695.2 million in 2008. They represented 8.7% of 2009 consolidated revenues, compared to 9.3% in 2008. The main projects contributing to 2009 revenues were: for the Americas, the P56 semi-submersible production platform (Petrobras) in Brazil; for Africa, the Akpo FPSO (Floating Production Storage Offl oading) for Total in Nigeria; for the Middle East, Zakum/GPF (ADMA-OPCO); and for Europe, Russia and Central Asia, the Genesis subsidiary’s consulting and engineering projects.
OnshoreThis segment showed the largest decrease in revenues, which amounted to €3,024.9 million in 2009 versus €4,097.2 million in 2008, representing a decrease of 26.2%. Despite this trend, the Onshore segment remained the largest contributor, accounting for 46.9% of 2009 consolidated revenues, compared to 54.8% of 2008 consolidated revenues. The reduction in revenues stemmed from the relatively low level of order intake in 2008 compared to previous years, and the completion of fi nal milestones realized on major projects. The main revenue contributions came from the LNG and gas treatment projects in the Middle East (Qatargas II, Qatargas III & IV, Rasgas III, AKG2, OAG), the activities operated in Poland such as the Gdansk refi nery expansion for Grupa Lotos, and the Fujairah water transmission system project in the United Arab Emirates.

060 2009 Reference Document
Review of Financial Position and Financial Performance
9.2. Changes in Backlog and Presentation of Revenues9
Revenues by Geographical AreaThe following table shows consolidated revenues by geographical area for the years ended December 31, 2009 and December 31, 2008:
In millions of EuroEurope, Russia,
Central Asia Africa Middle East Asia Pacifi c Americas Total
Revenues 2009 1,726.5Var.
2.6% 942.6Var.
20.7% 1,467.0Var.
-33.7% 765.7Var.
-26.0% 1,554.2Var.
-12.2% 6,456.0Var.
-13.7%
Revenues 2008 1,682.2 780.8 2,213.5 1,034.5 1,770.4 7,481.4
Europe, Russia and Central AsiaThis region generated stable revenues, with €1,726.5 million in 2009, compared to €1,682.2 million in 2008, representing an increase of 2.6%. It is the top region in terms of value, with a contribution representing 26.7% of 2009 consolidated revenues, up from 22.5% in 2008. The Onshore segment remained the main contributor generating €871.4 million of revenues compared to €857.5 million in 2008. The main contracts executed in this region are the projects executed in Poland for Grupa Lotos notably, and a service contract in Greece for Motor Oil Hellas (for a crude oil distillation unit at the Corinth refi nery). The Subsea segment generated €734.4 million, representing 42.5% of the region’s revenues, compared to €707.0 million in 2008, which represented 42.0% of the region’s revenues. Revenues were mainly driven by the DSVI (THT) and Don Southwest (Petrofac) projects in Great Britain, the Yme Redevelopment (Talisman), Skarv (BP) and Gjoa Tie In (StatoilHydro) projects in Norway. The Offshore segment contributed 7.0% of this region’s revenues, same as 2008 contribu-tion. It represented revenues of €120.7 million in 2009 compared to €117.7 million in 2008.
AfricaThis region’s contribution to Technip’s revenues amounted to €942.6 million, representing 14.6% of 2009 consolidated revenues, compared to 10.4% in 2008 (€780.8 million), representing an increase of 20.7% which is mainly due to the increase of activity in Subsea segment. The Subsea segment remained the largest contributor with revenues of €757.3 million, i.e. 80.3% of region’s revenues and 35.7% increase versus €558.2 million of revenues in 2008 (i.e. 71.5%). The main contracts contributing to 2009 revenues were Paz Flor (Total) in Angola, Jubilee (Tullow Oil) in Ghana, and Agbami (Chevron Texaco), ABO 2 (Agip) and Oyo (ENI) in Nigeria. The Offshore segment contributed 11.6% of the revenues from the Africa region with €109.4 million in revenues compared to 19.1% in 2008, which represented €149.0 million. The main contracts contributing to revenues were Akpo FPSO (Total) in Nigeria and Dalia FPSO (Total) in Angola. The Onshore segment generated stable revenues of €75.9 million in 2009, representing 8.1% of revenues in this geographical area, compared to 9.4% in 2008 (€73.6 million).
Middle EastThis region’s contribution to Technip’s revenues amounted to €1,467.0 million, representing 22.7% of 2009 consolidated reve-nues, compared to €2,213.5 million in 2008, which represented 29.6% of consolidated revenues. Revenues decreased by 33.7% year-on-year, primarily due to the decrease in Onshore activity in this region. The Onshore segment generated €1,391.1 million in 2009, compared to €2,165.5 million in 2008, representing 94.8% of the region’s revenues in 2009 (versus 97.8% in 2008). The most signifi cant contracts in the region comprised, on the one hand, large LNG and gas treatment contracts executed in Qatar (Qatargas II, Rasgas III, Qatargas III & IV, AKG2–signed in 2004, 2005 and 2006 in partnership with Chiyoda), Yemen (Yemen LNG
signed in 2005), Saudi Arabia (Khursaniyah) and the United Arab Emirates (ADGAS OAG), and, on the other hand, major ethylene contracts such as Sabic Yanbu in Saudi Arabia, Ras Laffan in Qatar, and lastly, the Fujairah water transmission system project in the United Arab Emirates. Some of those contracts are close to completion, which explains the year-on-year revenue decrease. The Offshore segment contributed €59.5 million in 2009, representing 4.0% of this region’s revenues, compared to €47.0 million in 2008, representing 2.1% of this region’s revenues. The biggest contributor to revenues was the Zakum/GPF contract (ADMA-OPCO).
Asia Pacifi cThis region generated revenues of €765.7 million, repre-senting 11.9% of 2009 consolidated revenues, compared to €1,034.5 million, which represented 13.8% of 2008 consolidated revenues. The two main contributors were the Onshore and Subsea segments, with respective revenues of €413.9 million (versus €451.2 million in 2008) and €277.7 million (versus €487.8 million in 2008), representing respectively 54.0% and 36.3% of the region’s revenues. In the Onshore segment, the most signifi cant contract was the construction of a nickel smelter unit located in New Caledonia. In addition, Technip executed the Dung Quat refi nery project in Vietnam (Petrovietnam), entered into force in 2005 in partnership with JGC and Tecnicas Reunidas, and worked as contractor for the engineering, procurement and construction management (EPCM) of its new generation NExBTL renewable diesel plant under construction in Singapore. The Subsea contribution fell by 43.1% compared to an exceptional level of activity in 2008. The Offshore segment represented 9.7% of the region’s revenues in 2009 at €74.1 million, compared to revenues of €95.5 million in 2008, or 9.2% in 2008.
AmericasThis region generated revenues of €1,554.2 million, representing 24.1% of 2009 consolidated revenues, up from 23.7% in 2008 (€1,770.4 million). The Subsea segment was still the main contributor with €1,080.3 million, representing 69.5% of the region 2009 revenues, improving compared to €935.0 million in 2008 (i.e. 52.8% of the area total revenues). The Subsea segment main projects were P53, P51 and PDET-PDEG (Petrobras) in Brazil, as well as Cascade Chinook (Petrobras) in the United States and North Amethyst (Husky Oil) in Canada. The Onshore segment’s revenues were €272.6 million (compared to €549.4 million in 2008), representing 17.5% of 2009 revenues, down from 31.0% in 2008. The most signifi cant Onshore contracts for this region in 2009 were refi neries extensions including the Cartagena refi nery in Columbia and the Port Arthur refi nery in the United States, for Valero. The segment was affected by the general slowdown of Onshore activity in North America. The Offshore segment contributed €201.3 million in 2009, representing 13.0% of this region’s revenues compared to €286.0 million in 2008, which represented 16.2% of the region’s revenues. The main contributors to this segment’s revenues were the P56 and P51 semi-submersible production platforms (Petrobras) in Brazil as well as pipelines in Trinidad and the Mariscal Sucre FEED.
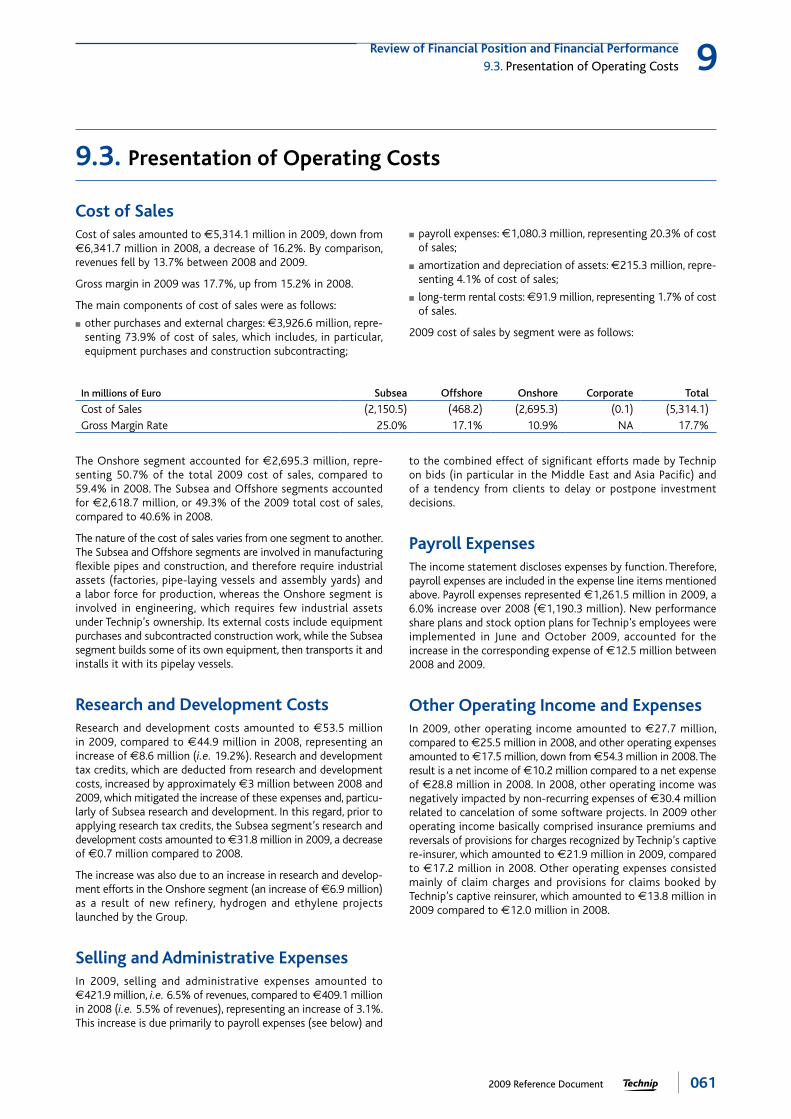
0612009 Reference Document
Review of Financial Position and Financial Performance
9.3. Presentation of Operating Costs 9
9.3. Presentation of Operating Costs
Cost of SalesCost of sales amounted to €5,314.1 million in 2009, down from €6,341.7 million in 2008, a decrease of 16.2%. By comparison, revenues fell by 13.7% between 2008 and 2009.
Gross margin in 2009 was 17.7%, up from 15.2% in 2008.
The main components of cost of sales were as follows:
other purchases and external charges: ■ €3,926.6 million, repre-senting 73.9% of cost of sales, which includes, in particular, equipment purchases and construction subcontracting;
payroll expenses: ■ €1,080.3 million, representing 20.3% of cost of sales;
amortization and depreciation of assets: ■ €215.3 million, repre-senting 4.1% of cost of sales;
long-term rental costs: ■ €91.9 million, representing 1.7% of cost of sales.
2009 cost of sales by segment were as follows:
In millions of Euro Subsea Offshore Onshore Corporate Total
Cost of Sales (2,150.5) (468.2) (2,695.3) (0.1) (5,314.1)
Gross Margin Rate 25.0% 17.1% 10.9% NA 17.7%
The Onshore segment accounted for €2,695.3 million, repre-senting 50.7% of the total 2009 cost of sales, compared to 59.4% in 2008. The Subsea and Offshore segments accounted for €2,618.7 million, or 49.3% of the 2009 total cost of sales, compared to 40.6% in 2008.
The nature of the cost of sales varies from one segment to another. The Subsea and Offshore segments are involved in manufacturing fl exible pipes and construction, and therefore require industrial assets (factories, pipe-laying vessels and assembly yards) and a labor force for production, whereas the Onshore segment is involved in engineering, which requires few industrial assets under Technip’s ownership. Its external costs include equipment purchases and subcontracted construction work, while the Subsea segment builds some of its own equipment, then transports it and installs it with its pipelay vessels.
Research and Development CostsResearch and development costs amounted to €53.5 million in 2009, compared to €44.9 million in 2008, representing an increase of €8.6 million (i.e. 19.2%). Research and development tax credits, which are deducted from research and development costs, increased by approximately €3 million between 2008 and 2009, which mitigated the increase of these expenses and, particu-larly of Subsea research and development. In this regard, prior to applying research tax credits, the Subsea segment’s research and development costs amounted to €31.8 million in 2009, a decrease of €0.7 million compared to 2008.
The increase was also due to an increase in research and develop-ment efforts in the Onshore segment (an increase of €6.9 million) as a result of new refinery, hydrogen and ethylene projects launched by the Group.
Selling and Administrative ExpensesIn 2009, selling and administrative expenses amounted to €421.9 million, i.e. 6.5% of revenues, compared to €409.1 million in 2008 (i.e. 5.5% of revenues), representing an increase of 3.1%. This increase is due primarily to payroll expenses (see below) and
to the combined effect of signifi cant efforts made by Technip on bids (in particular in the Middle East and Asia Pacifi c) and of a tendency from clients to delay or postpone investment decisions.
Payroll ExpensesThe income statement discloses expenses by function. Therefore, payroll expenses are included in the expense line items mentioned above. Payroll expenses represented €1,261.5 million in 2009, a 6.0% increase over 2008 (€1,190.3 million). New performance share plans and stock option plans for Technip’s employees were implemented in June and October 2009, accounted for the increase in the corresponding expense of €12.5 million between 2008 and 2009.
Other Operating Income and ExpensesIn 2009, other operating income amounted to €27.7 million, compared to €25.5 million in 2008, and other operating expenses amounted to €17.5 million, down from €54.3 million in 2008. The result is a net income of €10.2 million compared to a net expense of €28.8 million in 2008. In 2008, other operating income was negatively impacted by non-recurring expenses of €30.4 million related to cancelation of some software projects. In 2009 other operating income basically comprised insurance premiums and reversals of provisions for charges recognized by Technip’s captive re-insurer, which amounted to €21.9 million in 2009, compared to €17.2 million in 2008. Other operating expenses consisted mainly of claim charges and provisions for claims booked by Technip’s captive reinsurer, which amounted to €13.8 million in 2009 compared to €12.0 million in 2008.

062 2009 Reference Document
Review of Financial Position and Financial Performance
9.4. Comments on the Results of Operations for the year ended at December 31, 2009, compared to the year ended December 31, 2008
9
9.4. Comments on the Results of Operations for the year ended December 31, 2009, compared to the year ended December 31, 2008
Operating Income/(Loss) from Recurring ActivitiesOperating income from recurring activities in 2009 was €676.7 million, a 3.0% increase over the 2008 fi gure of €656.9 million. The operating margin from recurring activities was 10.5%, up from 8.8% in 2008.
Currency fl uctuations had a €12.9 million negative impact on 2009 operating income from recurring activities compared to the operating income from recurring activities in 2008.
Operating Income/(Loss) from Recurring Activities by Business Segment
In millions of Euro Subsea Offshore Onshore CorporateNot
AllocableTotal Continuing
OperationsDiscontinued
Operations Total
Var. Var. Var. Var. Var. Var.
Operating Income/(Loss) from Recurring Activities 2009 532.6 1.8% 39.3 1.8% 151.7 -1.3% (46.9) -20.0% - 676.7 3.0% - 676.7 3.0%
% Operating Margin from Recurring Activities 2009 18.6% 7.0% 5.0% 10.5% 10.5%
Operating Income/(Loss) 2009 537.9 2.8% 39.3 1.8% 151.7 -1.3% (46.9) -20.0% (252.8) 429.2 -34.7% - 429.2 -34.7%
% Operating Margin 2009 18.8% 7.0% 5.0% 6.6% 6.6%
Operating Income/(Loss) from Recurring Activities 2008 523.2 38.6 153.7 (58.6) - 656.9 - 656.9
% Operating Margin from Recurring Activities 2008 19.5% 5.6% 3.8% 8.8% 8.8%
Operating Income/(Loss) 2008 523.2 38.6 153.7 (58.6) - 656.9 - 656.9
% Operating Margin 2008 19.5% 5.6% 3.8% 8.8% 8.8%
The Subsea segment, which generated an operating income from recurring activities of €532.6 million in 2009, i.e. 18.6% of revenues, compared to €523.2 million in 2008, or 19.5% of revenues. This was the largest contribution to Technip’s operating income from recurring activities in 2009 as well as in 2008. The performance was achieved thanks to good utilization of Group assets (fl eet, fl exible plants) and an excellent progress on ongoing contracts in every region.
The Onshore segment was the second-biggest contributor to the operating income from recurring activities, with €151.7 million in 2009, versus €153.7 million in 2008, down 1.3%. Thanks to good progress on ongoing projects, the operating margin from recurring activities rose to 5.0% in 2009 from 3.8% in 2008.
The Offshore segment generated an operating income from recur-ring activities of €39.3 million in 2009, compared to €38.6 million in 2008. As a result, the operating margin from recurring activi-ties was 7.0% of revenues in 2009, up from 5.6% in 2008. The combined Offshore/Onshore operating margin from recurring activities was 5.3% in 2009 compared to 4.0% in 2008.
The Corporate segment recorded an operating loss of €46.9 million in 2009, compared to a loss of €58.6 million in 2008. This was notably due to €38.6 million costs related to stock options, share purchase options and performance share grants compared to €23.0 million in 2008.

0632009 Reference Document
Review of Financial Position and Financial Performance
9.4. Comments on the Results of Operations for the year ended at December 31, 2009, compared to the year ended December 31, 2008
9
Operating Income/(Loss) from Recurring Activities by Geographical Area
In millions of EuroEurope, Russia,
Central Asia Africa Middle East Asia Pacifi c Americas Not Allocable Total
Var. Var. Var. Var. Var. Var. Var.
Operating Income/(Loss) from Recurring Activities 2009 220.7 -17.3% 207.3 31.0% (63.4) 122.5% 103.8 -26.5% 255.2 43.5% (46.9) -20.0% 676.7 3.0%
% Operating Margin from Recurring Activities 2009 12.8% 22.0% -4.3% 13.6% 16.4% 10.5%
Operating Income/(Loss) 2009 222.1 -16.8% 208.7 31.9% (63.4) 122.3% 104.3 -26.1% 257.2 44.7% (299.7) x 5.1 429.2 -34.7%
% Operating Margin 2009 12.9% 22.1% -4.3% 13.6% 16.5% 6.6%
Operating Income/(Loss) from Recurring Activities 2008 266.8 158.2 (28.5) 141.2 177.8 (58.6) 656.9
% Operating Margin from Recurring Activities 2008 15.9% 20.3% -1.3% 13.6% 10.0% 8.8%
Operating Income/(Loss) 2008 266.8 158.2 (28.5) 141.2 177.8 (58.6) 656.9
% Operating Margin 2008 15.9% 20.3% -1.3% 13.6% 10.0% 8.8%
Europe, Russia and Central AsiaOperating income from recurring activities amounted to €220.7 million in 2009, versus €266.8 million in 2008, resulting in an operating margin from recurring activities of 12.8%, compared to 15.9% in 2008. The decrease was primarily attributable to the Subsea and Offshore segments.
The Subsea segment’s contribution was €91.7 million (i.e. an operating margin from recurring activities of 12.5%), against €142.0 million in 2008 (i.e. an operating margin from recurring activities of 20.1%). This reduction was mainly due to an impair-ment booked on vessels operating in the region.
The Onshore segment’s operating margin from recurring activities rose 16.4% to €139.6 million in 2009 (i.e. an operating margin from recurring activities of 16.0%), from €119.9 million in 2008 (i.e. an operating margin from recurring activities of 14.0%). This was the result, in particular, of progress on and successful execution of contracts in Poland (including the Grupa Lotos refi nery in Gdansk), Greece (including the service contract for the crude oil distilla-tion unit at the Corinth refi nery), and the Netherlands (including the renewable diesel plant project for Neste Oil Corporation).
The Offshore segment contributed a loss of €10.6 million in 2009, representing a negative operating margin from recurring activities of 8.8% against a positive contribution of €4.9 million in 2008, which represented an operating margin from recurring activities of 4.2%.
AfricaOperating income from recurring activities amounted to €207.3 million in 2009, i.e. an operating margin from recurring activities of 22.0%, compared to €158.2 million in 2008 (i.e. an operating margin from recurring activities of 20.3%).
The Subsea segment contributed €180.8 million in 2009 (i.e. an operating margin from recurring activities of 23.9%), compared
to €155.7 million in 2008 (or a margin of 27.9%), owing to the Agbami, Oyo and ABO 2 contracts in Nigeria.
The Onshore segment showed a €14.7 million profi t in 2009, compared to a loss €7 million in 2008 (i.e. an operating margin from recurring activities of 19.4% versus a negative operating margin from recurring activities of 9.5% in 2008).
The Offshore segment recorded income of €11.8 million in 2009, giving an operating margin from recurring activities of 10.8%, up from €9.5 million and a margin of 6.4% in 2008.
Middle EastOperating income from recurring activities in the Middle East remained negative, with a loss of €63.4 million compared to a loss of €28.5 million in 2008, resulting in negative operating margins from recurring activities of 4.3% in 2009 and 1.3% in 2008.
Operating income from recurring activities in the Middle East for Onshore remained negative, with a loss of €77.7 million, versus a loss of €28.0 million in 2008, representing, respectively, negative operating margins from recurring activities of 5.6% in 2009 and 1.3% in 2008. The deterioration between 2008 and 2009 was caused by a drop in activity on contracts that make material positive contributions; this strong volume effect reduced the absorption of fi xed costs, especially because Technip made a signifi cant effort in 2009 to enhance its presence and commercial positioning in the region.
Among the projects impacting the region are: on the one hand, the large LNG and gas treatment contracts executed in Qatar (Qatargas II, Rasgas III, Qatargas III & IV, AKG2–signed in 2004, 2005 and 2006 in partnership with Chiyoda), in Yemen (Yemen LNG signed in 2005), in Saudi Arabia (Khursaniyah) and in the United Arab Emirates (Adgas OAG), and, on the other hand, major ethylene contracts such as Sabic Yanbu in Saudi Arabia and Ras Laffan in Qatar; and, lastly, a contract for the Fujairah water transmission system in the United Arab Emirates.

064 2009 Reference Document
Review of Financial Position and Financial Performance
9.4. Comments on the Results of Operations for the year ended at December 31, 2009, compared to the year ended December 31, 2008
9
The Offshore segment’s contribution rose to €4.0 million in 2009 (i.e. an operating margin from recurring activities of 6.7%) from a loss of €0.5 million in 2008 (i.e. a negative operating margin from recurring activities of 1.1%). The improvement is primarily attributable to improved profi tability on the Zakum/GPF project.
Asia Pacifi cOperating income from recurring activities in Asia Pacifi c was €103.8 million, versus €141.2 million in 2008, giving an operating margin from recurring activities of 13.6%, stable compared 2008.
The Subsea segment generated €15.6 million of operating income from recurring activities (i.e. an operating margin from recurring activities of 5.6%) versus €88.0 million in 2008 (i.e. an operating margin from recurring activities of 18.0%). The main reasons for the signifi cant reduction were a contraction of the activity in the area and an increased competition.
The Offshore segment contributed a positive operating income from recurring activities of €20.7 million in 2009 (i.e. an oper-ating margin from recurring activities of 27.9%), compared to a €15.2 million loss in 2008 (i.e. a negative operating margin from recurring activities of 15.9%).
The Onshore segment’s contribution remained stable, in terms of both value, at €67.5 million in 2009 (i.e. an operating margin from recurring activities of 16.3%) compared to €68.4 million in 2008 (i.e. an operating margin from recurring activities of 15.2%); and in proportion to the segment’s overall operating income from recurring activities of the segment (i.e. 44.5% in both 2009 and 2008). The performance in this area can be attributed to good execution of ongoing projects, notably the Koniambo project in New Caledonia (nickel smelter unit construction contract), the contract with Map Ta Phut Olefi ns Co. Ltd (MOC) to build a steam-cracking furnace for an ethylene plant located in Thailand, and a service contract (EPCM) for the new generation NExBTL renewable diesel plant in construction in Singapore.
AmericasOperating income from recurring activities in this region was €255.2 million, up from €177.8 million in 2008, representing operating margins from recurring activities of 16.4% and 10.0% respectively.
The Subsea segment’s operating income from recurring activities amounted to €234.2 million in 2009, representing an operating margin from recurring activities of 21.7%, versus €137.0 million and a margin of 14.7% in 2008. This signifi cant improvement was due to the completion of major projects such as Cascade B fl ow-lines and Gas Export Installation (Petrobras) in the Gulf of Mexico and North Amethyst (Husky Oil) in Canada. The good contribution from fl exible supply projects in Brazil was also noteworthy.
The income for the Onshore segment improved, with €7.6 million in 2009 (i.e. an operating margin from recurring activities of 2.8%), compared to €0.9 million in 2008 (i.e. an operating margin from recurring activities of 0.2%). The region’s performance in 2009 was notably driven by refi nery extension contracts in Colombia and the United States.
The Offshore segment contributed €13.4 million in 2009 (i.e. an operating margin from recurring activities of 6.7%), compared to €39.9 million in 2008 (i.e. an operating margin from recurring activities of 14.0%).
In addition, Technip mentions that the Perdido Spar’s Hull was delivered to Shell under good conditions in 2008 (Gulf of Mexico).
Income/(Loss) from Sale of ActivitiesIn 2009 the result from sale of activities amounted to a loss of €2.5 million, even though no activities were divested in 2009. The loss stemmed from a €5.3 million reversal of provisions related to sales made in an earlier period, offset by a net expense of €7.8 million corresponding to a provision recorded to cover a risk on an old contract.
Provision for LitigationThe Group decided to record an exceptional charge of €245 million in the fourth quarter of 2009, in respect of the ongoing investiga-tions by the American authorities of events involving the joint venture company TSKJ. Technip has been cooperating with the United States Securities and Exchange Commission (“SEC”) and the United States Department of Justice (“DOJ”) in the ongoing investigations involving the joint venture company TSKJ, of which Technip has a 25% share, in relation to events which occurred between 1994 and 2004. Technip and the SEC and DOJ have discussed a resolution of all potential claims against the company arising from the investigation. While these discussions have not concluded, the provision of €245 million refl ects the estimated costs of resolution based on the current status of the ongoing discussions. It is important to note that not all matters in resolu-tion of the investigation have been fi nalized, and Technip expects some additional weeks of discussion.
Net Operating IncomeNet operating income in 2009, excluding the provision of €245.0 million for the TSKJ litigation, was €674.2 million, compared to €656.9 million in 2008. This represented an increase of €17.3 million, or 2.6%, as a result of successful project execu-tion in all segments during the year. Broken down by segment, the net operating income was as follows:
Subsea: ■ €537.9 million (vs. €523.2 million in 2008), representing an operating margin of 18.8% in 2009 (vs. 19.5% in 2008);
Offshore: ■ €39.3 million (vs. €38.6 million in 2008), representing an operating margin of 7.0% in 2009 (vs. 5.6% in 2008);
Onshore: ■ €151.7 million (vs. €153.7 million in 2008), repre-senting an operating margin of 5.0% in 2009 (vs. 3.8% in 2008);
Corporate: a negative contribution of ■ €46.9 million in 2009 (vs. a negative contribution of €58.6 million in 2008) (see Note 4 to the Consolidated Financial Statements at December 31, 2009).
Including the provision for the TSKJ litigation, net operating income in 2009 amounted to €429.2 million (i.e. 6.6% of revenues) against €656.9 million in 2008 (i.e. 8.8% of revenues), a €227.7 million decrease (-34.7%).
Financial ResultNet fi nancial expenses were €60.7 million in 2009, representing a deterioration of 452% compared to €11.0 million of net fi nancial expenses in 2008. This variation was primarily due to the net foreign exchange result: net foreign exchange losses amounted to €35.3 million in 2009, whereas net foreign exchange gains amounted to €21.4 million in 2008.
Financial expenses amounted to €538.7 million, which included interest on bond loans of €30.1 million, financial charges relating to other loans and bank overdrafts of €13.0 million and

0652009 Reference Document
Review of Financial Position and Financial Performance
9.5. Changes in Balance Sheet and Financial Position between the year ended December 31, 2009 and the year ended December 31, 2008
9
fi nancial costs relating to employee benefi ts in the amount of €10.9 million.
Financial income amounted to €478.0 million, and mainly included €35.0 million interest from treasury management (primarily proceeds from the disposal of marketable securities and interest on term deposits), and €4.2 million of fi nancial income relating to employee benefi ts.
The yield on funds provided under turnkey contracts does not appear under this heading but is included in revenues. For 2009, fi nancial income on contracts represented a contribution to revenues of €25.5 million, compared to €45.8 million in 2008.
Income TaxThe 2009 income tax expense amounted to €194.7 million, versus €193.8 million in 2008 on pre-tax earnings of €618.2 million (excluding provision on TSKJ litigation). Technip’s tax rate in 2009 was 31.5% (excluding provision on TSKJ litigation), whereas the French tax rate was 34.43% in 2009.
Net Income from Discontinued OperationsAs in 2008, no operations were closed or discontinued in 2009.
Net Income Attributable to Minority InterestsNet income attributable to minority interests increased from €6.3 million in 2008 to €8.1 million in 2009.
Net income from affi liates accounted for using the equity method amounted to €4.7 million in 2009, compared to €2.2 million in 2008. As in 2008, only Technip KTI Spa was accounted for using the equity method in 2009.
Net IncomeNet income attributable to shareholders of the parent company amounted to €170.4 million in 2009, compared to €448.0 million in 2008, which represented 2.6% of Technip’s consolidated revenues, compared to 6.0% in 2008. Excluding the provision for TSKJ litigation, net income amounted to €415.4 million, i.e. 6.4% of revenues.
Earnings per ShareCalculated on a diluted basis of 106,259,060 shares, earnings per share amounted to €1.59 in 2009, compared to €4.25 in 2008, a decrease of 62.6%. The strong decrease was mainly the result of lower net income (-62.0%). The average number of shares calcu-lated on a diluted basis remained stable: 105,325,760 shares taken into account in the 2008 calculation, compared to 107,209,020 shares in the 2009 calculation. The increase resulted primarily from new performance shares and stock option plans implemented in June and October 2009.
Basic earnings per share were €1.60 in 2009, compared to €4.27 in 2008.
To the best of Technip’s knowledge, no signifi cant change in Technip’s fi nancial or business position has occurred since the accounting period ended December 31, 2009.
9.5. Changes in Balance Sheet and Financial Position between the year ended December 31, 2009 and the year ended December 31, 2008
Non-Current Assets
Fixed AssetsAs of December 31, 2009, net intangible assets amounted to €2,408.2 million, compared to €2,409.2 million as of December 31, 2008. They primarily consisted of €2,369.3 million in net goodwill, including €2,239.3 million from the purchase of Cofl exip, which was allocated to the Subsea and Offshore busi-ness segments. In accordance with impairment tests performed to confi rm the value of goodwill, no depreciation was recorded in 2009. In 2009 the goodwill increased by €0.2 million due to an adjustment of goodwill related to Eurodim. In 2008, the goodwill allocated to the Offshore segment had increased by €6.1 million due to the acquisition of Eurodim and the goodwill allocated to the Onshore segment had increased by €5.6 million due to the acquisition of EPG (€3.9 million), Sofremines (€1.0 million) and Setudi (€0.7 million). Other net intangible assets represented €38.9 million at December 31, 2009, compared to a net amount
of €40.1 million at December 31, 2008, and consisted of soft-ware, patents and brand names, as well as development costs for internally-developed software (see Note 10 to the Consolidated Financial Statements at December 31, 2009).
Net tangible fixed assets amounted to €1,194.5 million at December 31, 2009, compared to €945.0 million at December 31, 2008 (representing an increase of 26.4%) and mainly included the vessels used in Subsea operations, carried at €414.9 million, the vessels under construction, carried at €322.5 million, and land and buildings for administrative use or production (production plants and construction yards). The increase in net value of €249.5 million in 2009 was due to new capital expenditures of €413.2 million and a positive foreign exchange impact of €35.9 million, reduced primarily by amortization and depreciation expenses for the year of €201.8 million (see Note 9 to the Consolidated Financial Statements at December 31, 2009).
Capital expenditures amounted to €423.6 million in 2009, compared to €401.3 million in 2008, representing an increase of 5.6%.
066 2009 Reference Document
Review of Financial Position and Financial Performance
9.5. Changes in Balance Sheet and Financial Position between the year ended December 31, 2009 and the year ended December 31, 2008
9
These investments were primarily related to vessels (in an amount of €78.6 million), machines and equipment (in an amount of €34.7 million), construction (in an amount of €7.6 million), patents, licenses and software rights (in an amount of €10.4 million), plus assets under construction (in an amount of €259.4 million out of which around €200 million for vessels under construction). Technip continued to carry out its investment program in order to expand the fl eet of vessels. In 2009 a new diving-support vessel was delivered, the Skandi Arctic, and three new vessels were put under construction: a pipelay vessel (Deep Energy), scheduled for delivery in 2011 (€67.7 million capitalized in 2009); a new fl exlay vessel, the Skandi Vitoria, scheduled for delivery in 2010 (€66.1 million capitalized in 2009); and the Apache 2, a vessel under construction owned by North Ocean III KS, a company acquired during the period (see Note 2-(a) to the Consolidated Financial Statements at December 31, 2009). In addition the Group continues to build a fl exible plant in Malaysia, for which €48.4 million was recorded in assets under construction as of December 31, 2009, of which €25.1 million in 2009.
The amount of pledged assets is not material and amounted to €60.6 million as of December 31, 2009.
Other Non-Current AssetsOther non-current assets included mainly deferred tax assets, €263.8 million in 2009 compared to €201.4 million in 2008, i.e. an increase of €62.4 million (+31.0%). The change is primarily due to the tax impact linked to the increase of warranty accruals on completed contracts.
Current AssetsEntries under the line item “Construction contracts” include accumulated costs incurred, as well as the margin recognized on the basis of the contract’s percentage of completion, less payments received from clients, with the net balance appearing on the asset side or the liability side depending on whether the balance is a debit or a credit. At December 31, 2009, the line item “Construction contracts–Amounts in assets” shown on the asset side amounted to €158.0 million, compared to €140.8 million in 2008, representing an increase of 12.2%. The line item “Construction contracts–Amounts in liabilities” amounted to €975.6 million at December 31, 2009, compared to €1,253.0 million at December 31, 2008 (see Note 15 to the Consolidated Financial Statements at December 31, 2009), representing a decrease of 22.1%. These changes are related to the progress made on different contracts.
Inventories, trade receivables and other receivables amounted to €1,845.9 million in 2009, a decrease of 7.6% relative to 2008
(€1,997.3 million). The change is primarily due to the decrease in trade receivables during the period.
Net cash position increased by 10.5% year-on-year and amounted to €2,656.3 million in 2009, compared to €2,404.7 as of December 31, 2008. Technip also had suffi cient available resources to fi nance, if necessary, operating and investing activities (see “Financing Structure” in Section 10.1 of this document). Cash generated from operating activities amounted to €634.1 million in 2009, compared to €454.7 million in 2008.
ProvisionsProvisions for liabilities and charges amounted to €584.5 million in 2009, up 104.2% from €286.2 million in 2008. These amounts consisted of the provision for the TSKJ litigation of €245.0 million, provisions for contract risks of €129.0 million (€83.0 million in 2008), provisions for employee pensions of €96.1 million (€98.8 million in 2008) provisions for taxes of €15.6 million (€11.6 million in 2008) and provisions for claims recorded at Technip’s captive reinsurer of €8.9 million (€18.3 million in 2008) (see Note 23 to the Consolidated Financial Statements at December 31, 2009). The increase in this line item was primarily due to the provision for the TSKJ litigation of €245.0 million recorded in the fourth quarter and to €91.2 million of new provisions for contract risks in 2009.
Financial DebtsAt December 31, 2009, Technip’s consolidated debt amounted to €872.7 million, which included €28.2 million of current fi nancial debts (see details of fi nancial debts in Section 10.1 of this document). Consolidated debt increased by €112.6 million (+14.8%) compared to the previous year (€760.1 million at December 31, 2008), primarily due to a new credit facility of €53.6 million granted to the Norwegian subsidiary Doftech, 50% owned by Technip, for the construction of the Skandi Arctic; a credit facility of €20.8 million granted to Technip SA; credit facilities of €35.2 million granted to the Brazilian subsidiaries. The current portion of fi nancial debt primarily includes €9.2 million in overdrafts and in short-term bank credit lines (primarily at the Norwegian subsidiary) and €19.0 million in accrued interest of which €18.3 million related to bonds. Long-term fi nancial debts of €844.5 million comprised the bond issued on May 26, 2004 for €650 million and the €194.5 million of credit facilities for Norwegian and Brazilian subsidiaries and Technip SA as at December 31, 2009 (see Note 21 to the Consolidated Financial Statements at December 31, 2009).
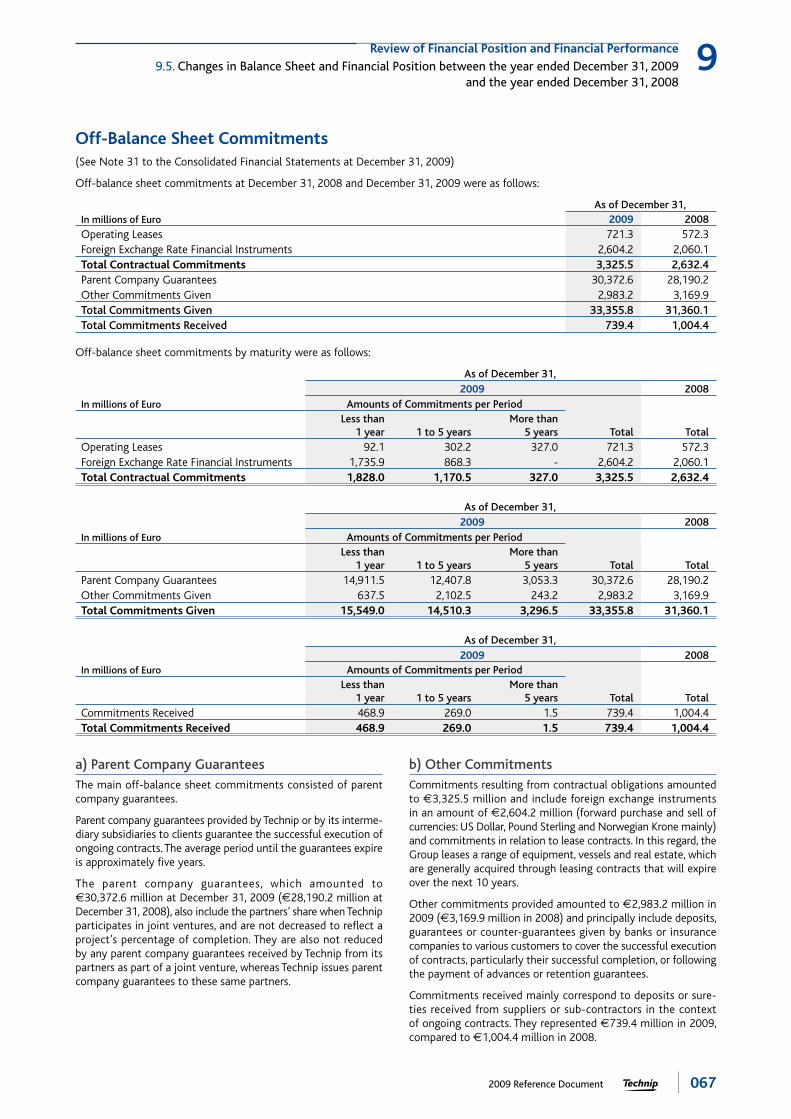
0672009 Reference Document
Review of Financial Position and Financial Performance
9.5. Changes in Balance Sheet and Financial Position between the year ended December 31, 2009 and the year ended December 31, 2008
9
a) Parent Company GuaranteesThe main off-balance sheet commitments consisted of parent company guarantees.
Parent company guarantees provided by Technip or by its interme-diary subsidiaries to clients guarantee the successful execution of ongoing contracts. The average period until the guarantees expire is approximately fi ve years.
The parent company guarantees, which amounted to €30,372.6 million at December 31, 2009 (€28,190.2 million at December 31, 2008), also include the partners’ share when Technip participates in joint ventures, and are not decreased to refl ect a project’s percentage of completion. They are also not reduced by any parent company guarantees received by Technip from its partners as part of a joint venture, whereas Technip issues parent company guarantees to these same partners.
b) Other CommitmentsCommitments resulting from contractual obligations amounted to €3,325.5 million and include foreign exchange instruments in an amount of €2,604.2 million (forward purchase and sell of currencies: US Dollar, Pound Sterling and Norwegian Krone mainly) and commitments in relation to lease contracts. In this regard, the Group leases a range of equipment, vessels and real estate, which are generally acquired through leasing contracts that will expire over the next 10 years.
Other commitments provided amounted to €2,983.2 million in 2009 (€3,169.9 million in 2008) and principally include deposits, guarantees or counter-guarantees given by banks or insurance companies to various customers to cover the successful execution of contracts, particularly their successful completion, or following the payment of advances or retention guarantees.
Commitments received mainly correspond to deposits or sure-ties received from suppliers or sub-contractors in the context of ongoing contracts. They represented €739.4 million in 2009, compared to €1,004.4 million in 2008.
Off-Balance Sheet Commitments(See Note 31 to the Consolidated Financial Statements at December 31, 2009)
Off-balance sheet commitments at December 31, 2008 and December 31, 2009 were as follows:
As of December 31,In millions of Euro 2009 2008Operating Leases 721.3 572.3Foreign Exchange Rate Financial Instruments 2,604.2 2,060.1Total Contractual Commitments 3,325.5 2,632.4Parent Company Guarantees 30,372.6 28,190.2Other Commitments Given 2,983.2 3,169.9Total Commitments Given 33,355.8 31,360.1Total Commitments Received 739.4 1,004.4
Off-balance sheet commitments by maturity were as follows:
As of December 31,2009 2008
In millions of Euro Amounts of Commitments per PeriodLess than
1 year 1 to 5 yearsMore than
5 years Total TotalOperating Leases 92.1 302.2 327.0 721.3 572.3Foreign Exchange Rate Financial Instruments 1,735.9 868.3 - 2,604.2 2,060.1Total Contractual Commitments 1,828.0 1,170.5 327.0 3,325.5 2,632.4
As of December 31,2009 2008
In millions of Euro Amounts of Commitments per PeriodLess than
1 year 1 to 5 yearsMore than
5 years Total TotalParent Company Guarantees 14,911.5 12,407.8 3,053.3 30,372.6 28,190.2Other Commitments Given 637.5 2,102.5 243.2 2,983.2 3,169.9Total Commitments Given 15,549.0 14,510.3 3,296.5 33,355.8 31,360.1
As of December 31,2009 2008
In millions of Euro Amounts of Commitments per Period
Total TotalLess than
1 year 1 to 5 yearsMore than
5 yearsCommitments Received 468.9 269.0 1.5 739.4 1,004.4Total Commitments Received 468.9 269.0 1.5 739.4 1,004.4

068 2009 Reference Document
10.1. Comparison of Net Cash Position and Cash Flows for the year ended
December 31, 2009 and the year ended December 31, 2008. . . . . . . . . . . . . . . . . . . . . . . . . . . . . . . . . . . . . . . .68Net Cash Generated from Operating Activities . . . . . . . . . . . . . . . . . . . . . . . . . . . . . . . . . . . . . . . . . . . . . . . . . . . . . . . . . . . . . . . . . . . . . . . . . . . . . . . . . . . . . . .68Net Cash Used in Investing Activities . . . . . . . . . . . . . . . . . . . . . . . . . . . . . . . . . . . . . . . . . . . . . . . . . . . . . . . . . . . . . . . . . . . . . . . . . . . . . . . . . . . . . . . . . . . . . . . . . . . . . .69Net Cash Generated from Financing Activities . . . . . . . . . . . . . . . . . . . . . . . . . . . . . . . . . . . . . . . . . . . . . . . . . . . . . . . . . . . . . . . . . . . . . . . . . . . . . . . . . . . . . . . .69
10.2. Comparison of Shareholders’ Equity and Financing between the year ended
December 31, 2009 and the year ended December 31, 2008. . . . . . . . . . . . . . . . . . . . . . . . . . . . . . . . . . . . . . . .69Shareholders’ Equity . . . . . . . . . . . . . . . . . . . . . . . . . . . . . . . . . . . . . . . . . . . . . . . . . . . . . . . . . . . . . . . . . . . . . . . . . . . . . . . . . . . . . . . . . . . . . . . . . . . . . . . . . . . . . . . . . . . . . . . . . . . . . . . .69Financing Structure. . . . . . . . . . . . . . . . . . . . . . . . . . . . . . . . . . . . . . . . . . . . . . . . . . . . . . . . . . . . . . . . . . . . . . . . . . . . . . . . . . . . . . . . . . . . . . . . . . . . . . . . . . . . . . . . . . . . . . . . . . . . . . . . . .69
Capital Resources
10
10.1. Comparison of Net Cash Position and Cash Flows for the year ended December 31, 2009 and the year ended December 31, 2008
(See Note 18 to the Consolidated Financial Statements at December 31, 2009)
Technip’s net cash position at December 31, 2009 and December 31, 2008 was as follows:
In millions of Euro 12/31/2009 12/31/2008
Cash 515.7 477.3
Cash Equivalents 2,140.6 1,927.4
Total Cash and Cash Equivalents 2,656.3 2,404.7
Bond Loan 650.0 650.0
Other Financial Debts 222.7 110.1
Total Financial Debts 872.7 760.1
Net Cash Position 1,783.6 1,644.6
Net cash position amounted to €1,783.6 million at December 31, 2009, representing an increase of 8.5% (€139.0 million) over December 31, 2008 (€1,644.6 million). This increase was mainly due to the change in operating cash fl ows (see below).
There is no signifi cant restriction on cash transfers between Technip SA and its subsidiaries.
Net Cash Generated from Operating ActivitiesNet cash generated from operating activities rose 39.5% to €634.1 million from €454.7 million in 2008, primarily due to the evolution between 2008 and 2009 of the working capital requirement (€243.5 million excluding TSKJ impact).
Free cash fl ow amounted to €372.6 million, down 45.3% versus €681.7 million in 2008. This signifi cant decrease can be explained by the following items:
2009 net income (including minority interests) fell sharply ■
year-on-year (€-275.8 million) because of the TSKJ provision;
amortization and depreciation of tangible and intangible assets ■
increased by €35.5 million from €188.6 million in 2008 to €224.1 million in 2009.
Change in working capital requirements amounted to €16.5 million in 2009, compared to €-227.0 million in 2008.

0692009 Reference Document
Capital Resources
10.2. Comparison of Shareholders’ Equity and Financing between the year ended December 31, 2009 and the year ended December 31, 2008
10
Net Cash Used in Investing ActivitiesNet cash used in investing activities remained stable at €-429.1 million in 2009, versus €-411.3 million in 2008:
capital expenditures relating to property, plant and equipment ■
and intangible assets amounted to €423.6 million in 2009, up from €401.3 million in 2008. The high level of investment was due to Technip’s ongoing policy of increasing its capacity in terms of both its fl eet of vessels and its fl exible pipe production;
proceeds from sales of assets amounted to ■ €2.9 million in 2009, down from €5.1 million in 2008. In 2009, this primarily involved €1.0 million of proceeds from the sale of our 5.6% share in the company Krasnye Barrikady;
the decrease in net cash position caused by changes in the scope ■
of consolidation represents the total purchase price or disposal price of the company in question, less the net cash position of purchased or sold companies, measured on the purchase or disposal date, i.e. a decrease of €8.1 million in 2009, compared
to €15.0 million in 2008. In 2009, this was mainly due to cash outfl ow in the context of the TPAR-Terminal Portuario de Angra Dos Reis acquisition in Brazil and the buyout of minority share-holders in Technip Tianchen. In 2008, this was mainly due to the Eurodim (€11.5 million) and EPG acquisitions (€4.7 million).
Net Cash Generated from Financing ActivitiesNet cash generated from fi nancing activities amounted to €-42.8 million in 2009, compared to 25.2 million in 2008. Debt increased in 2009 by €84.1 million. Dividends paid amounted to €127.5 million to be compared to €125.1 million distributed in 2008. Capital increases in 2009 amounted to €0.6 million as a result of the exercise of stock options. In 2008 capital increases resulted from the subscription to the capital increase reserved for employees (€60.0 million) and the exercise of stock options (€11.3 million).
10.2. Comparison of Shareholders’ Equity and Financing between the year ended December 31, 2009 and the year ended December 31, 2008
Shareholders’ EquityAt December 31, 2009, equity attributable to the Group amounted to €2,686.7 million, compared to €2,473.4 million at the end of 2008. The principal reasons for the change were the net income realized over the period (€170.4 million), the divi-dend paid in 2009 (€127.5 million, i.e. €1.20 per share), change in foreign currency translation reserve of €75.4 million, change in fair value reserve for an amount of €-18.4 million, and change in reserves relating to stock options and performance shares for €112.3 million (see Note 20 to the Consolidated Financial Statements at December 31, 2009).
As of the date of this Reference Document, there are no restric-tions on the use of capital that had any impact over the 2009 fi scal year or may signifi cantly affect Technip’s business.
Financing Structure(See Note 21 to the Consolidated Financial Statements at December 31, 2009)
At December 31, 2009, the amount of credit facilities confi rmed available to Technip and unused amounted to €1,454.0 million,
including €1,416.5 million available beyond December 31, 2010. This amount is a 12.4% increase over December 31, 2008. In light of market conditions, the Group had no commercial paper outstanding at December 31, 2009. The Group still had authoriza-tion from the National Bank of France (Banque de France) for a maximum amount of €600 million. Technip believes that these credit lines, together with the cash and marketable securities on hand, provide Technip with the necessary resources to fi nance its operational needs.
With respect to borrowing conditions, Technip’s fl oating rate indebtedness amounts to €42.5 million compared to total indebtedness of €872.7 million. The bond loan that Technip issued on May 26, 2004 represents the largest portion of fi nancial debt and amounts to €650 million, with a maturity date of May 26, 2011. The annual interest rate is 4.625%, and is payable on each anniversary date of the date of issuance. Over the 2009 year, the average rate of the fi xed rate debt was 4.91% per year, compared to 4.62% in 2008. Over the same period, the average rate of the Group’s total debt (both fl oating and fi xed rates) amounted to 5.48% up from to 4.90% in 2008. The average rate of debt is calculated by dividing the amount of fi nancial costs for the fi scal year (excluding bank fees not expressly related to the debt) by the average outstanding debt for the fi scal year.

070 2009 Reference Document
11.1. Research and Development . . . . . . . . . . . . . . . . . . . . . . . . . . . . . . . . . . . . . . . . . . . . . . . . . . . . . . . . . . . . . . . . . . . . . . . . . . . . . . . . . . . . . . . . . . . . . . . . . . . . . . .70Subsea . . . . . . . . . . . . . . . . . . . . . . . . . . . . . . . . . . . . . . . . . . . . . . . . . . . . . . . . . . . . . . . . . . . . . . . . . . . . . . . . . . . . . . . . . . . . . . . . . . . . . . . . . . . . . . . . . . . . . . . . . . . . . . . . . . . . . . . . . . . . . . . . . . . . .70Onshore . . . . . . . . . . . . . . . . . . . . . . . . . . . . . . . . . . . . . . . . . . . . . . . . . . . . . . . . . . . . . . . . . . . . . . . . . . . . . . . . . . . . . . . . . . . . . . . . . . . . . . . . . . . . . . . . . . . . . . . . . . . . . . . . . . . . . . . . . . . . . . . . . . .70Offshore . . . . . . . . . . . . . . . . . . . . . . . . . . . . . . . . . . . . . . . . . . . . . . . . . . . . . . . . . . . . . . . . . . . . . . . . . . . . . . . . . . . . . . . . . . . . . . . . . . . . . . . . . . . . . . . . . . . . . . . . . . . . . . . . . . . . . . . . . . . . . . . . . .71
11.2. Patents and Licenses . . . . . . . . . . . . . . . . . . . . . . . . . . . . . . . . . . . . . . . . . . . . . . . . . . . . . . . . . . . . . . . . . . . . . . . . . . . . . . . . . . . . . . . . . . . . . . . . . . . . . . . . . . . . . . . . . . . .71
11.3. Technological Partnerships . . . . . . . . . . . . . . . . . . . . . . . . . . . . . . . . . . . . . . . . . . . . . . . . . . . . . . . . . . . . . . . . . . . . . . . . . . . . . . . . . . . . . . . . . . . . . . . . . . . . . . . . .71
11.4. Acquisitions . . . . . . . . . . . . . . . . . . . . . . . . . . . . . . . . . . . . . . . . . . . . . . . . . . . . . . . . . . . . . . . . . . . . . . . . . . . . . . . . . . . . . . . . . . . . . . . . . . . . . . . . . . . . . . . . . . . . . . . . . . . . . . . . . . . . .72
11Research and Development, Patents and Licenses
11.1. Research and Development
Research and Development is essential to Technip’s success in all of its activities.
Technip’s Research and Development operations strive to meet its customers’ future needs and improve its competitiveness. Technip is working on development and engineering programs in a number of advanced technical fi elds related to deepwater oil and gas production (including large platforms and fl oating production units, low-temperature, deepwater liquid natural gas and crude oil transport systems) and in Carbon Capture and Storage processes.
Technip has a three-phase strategy for acquiring new technolo-gies related to its operations: (i) development through in-house Research and Development, (ii) external growth through the acquisition of specialized companies, and (iii) mixed organic and external growth through research partnerships.
The Group has Research and Development sites in all main Centers: Le Trait, Aberdeen, Paris, Rome, Houston, Claremont, Kuala Lumpur and Rio de Janeiro. These teams include approxi-mately 300 employees as of December 31, 2009. They helped Technip to fi le 44 patents in 2009, 42 in 2008 and 29 in 2007.
Technip also works with external Research and Development teams to develop strategic technological partnerships intended to facilitate commercial development in these sectors.
Technip’s Research and Development expenditures for the 2009 and 2008 fi nancial years amounted to €53.5 million and €44.9 million, respectively. Most of its research and engineering
operations are focused on specifi c projects, which are not taken into account in these fi gures.
SubseaResearch and Development activities in the Subsea segment focus on improving the quality of the products and services provided to its customers and developing new fl exible pipes and “reeled” pipes technologies.
The growing Subsea market presents new technological chal-lenges related to increasingly extreme water depths, pressures and temperatures. Technip’s technological priorities include fi nding solutions for installing risers at depths reaching 3,000 meters, isolation and active heating techniques, the development of fl exible pipes for extreme pressure, temperature and corrosive fl uid conditions, as well as “intelligent” riser systems that allow a monitoring of their integrity and production parameters.
OnshoreOnshore Research and Development programs carried out in 2008 and 2009 improved energy effi ciency and reduced the environmental impact of industrial complexes built by Technip:
with respect to LNG, as a result of the high effi ciency Wieland ■
heat exchange tubes, the cryogenic pipe-in-pipe (aerial or fl oating), the cryogenic fl exible pipe and the concept of fl oating LNG plants;

0712009 Reference Document
Research and Development, Patents and Licenses
11.3. Technological Partnerships 11
more effi cient processes for ethane recovery from natural gas; ■
with respect to ethylene, as a result of more selective cracking ■
coils and a higher effi ciency in the separation section;
with respect to hydrogen, as a result of developing an exchanger/ ■
reformer for large capacities;
with respect to hydrogen in refi ning, Technip has developed a ■
new tool allowing optimal hydrogen usage and minimal CO2
emissions in a refi nery environment (HyN DT™);
in renewable energies Technip has targeted development of ■
second generation biofuel plants and in the Marine Energy Sector (offshore Wind, fi xed or fl oating).
Technip has further improved the design, effi ciency, cost and time to market of its offering through Technology Cooperation Agreements with Dow (on ethylene), in place since 1997 and about to be renewed, with Ineos (on polyoelfi ns), on July 20, 2009 and with Air Products (hydrogen) in place since 1992 and renewed on October 23, 2008.
OffshoreThroughout 2008 and 2009, Technip, already widely renowned for its Offshore technologies for the energy industry, pursued its research into several innovative concepts:
Adapting the Spar platform to ultra-deep waters: Technip ■
is working on solutions to meet the challenges of exploiting hydrocarbon fi elds at water depths beyond 3,000 meters by
adapting its Spar concept for projects located in the deepest waters of the Gulf of Mexico and the South Atlantic offshore Brazil.
Arctic Spar: with the Arctic Spar, Technip is developing a ■
platform concept able to withstand the extreme conditions of the Arctic Ocean. This unconventional environment presents new challenges in terms of harsh climate conditions (very low temperatures, the ice shelf and icebergs) and environmental protection.
Floatover: Technip is a leader in topside installations for fi xed ■
and fl oating platforms without the use of heavy lift equipment. The Floatover High Air Gap technology developed by Technip has improved its technological capability for the installation of topside facilities that are heavier and higher in relation to water levels in regions where platforms are exposed to heavy swell and hurricane conditions.
TLP: Technip is also developing a Tension Leg Platform concept ■
for water depths of 270 meters to 1,500 meters. This platform concept is designed to meet new market needs in relation to projects in the Gulf of Mexico, Brazil, Southeast Asia and Australia.
Technip’s 2008 acquisition of Eurodim, an engineering and consulting company with solid technological expertise, notably in the offshore oil and fl uid transfer sectors, strengthens its techno-logical portfolio in relation to the cryogenic fl exible pipes used in Liquefi ed Natural Gas (LNG) transfer, offshore LNG plants and the adaptation of offshore facilities to harsh maritime environments.
11.2. Patents and Licenses
For its operations, Technip holds a large number of patents, registered trademarks and other intellectual property rights, including industrial and intellectual property rights acquired from third parties. At February 28, 2009, Technip held approximately 425 patent families (i.e., approximately 3,000 patents in effect in over 80 countries), mainly in the Offshore and Subsea sectors (subsea pipes, umbilicals, fl exible systems, platforms and equip-ment), but also in the Offshore sector (cryogenics, refi ning,
cement, hydrometallurgy, and ethylene and hydrogen produc-tion). Technip jointly holds a limited number of patents with IFP and other industrial partners.
Petrochemical operations depend on the implementation of licenses belonging to third parties (such as UOP, Avi Products and BASF). They are implemented on a project-by-project basis and the fees are passed on to customers.
11.3. Technological Partnerships
Technip participates in technological partnerships in the Onshore sector, particularly, with Air Products for hydrogen units; BP Chemicals for PTA; Dow Chemicals for ethylene furnaces; Ineos for linear low-density polyethylene, high-density polyethylene and polypropylene; Sabtec for low-density polyethylene; Asahi
Kasei for chlorine and caustic soda membrane electrolysis and Wieland for enhanced heat transfer tubes for LNG and ethylene applications. In the Offshore sector, Technip and IFP work together on research operations, particularly, for deepwater oil and gas production.

072 2009 Reference Document
Research and Development, Patents and Licenses
11.4. Acquisitions11
11.4. Acquisitions
Technip also acquires major technologies when it buys companies that have developed them, as was the case with the acquisition of KTI’s businesses, which have since been renamed Technip Benelux, Technip USA and Technip KT India. These acquisitions have allowed Technip to reinforce its skills and acquire fi rst-class technologies in the ethylene and hydrogen sectors. Cofl exip’s acquisition in 2001 of Aker Maritime ASA’s Deep Sea Division gave Technip access to technologies related to “Spar” Offshore platforms.
In May 2009 Technip acquired from HeliSwirl the intellectual property rights for the application of the Small Amplitude Helical Tubing (SMAHT) technology for steam cracking furnaces for ethylene production. This acquisition broadens Technip’s techno-logical offer and strengthens its position as a key player in the steam cracking furnace market.
The Group’s main acquisitions in 2009 are listed in Section 6.1.2 of this Reference Document.
0732009 Reference Document
12
12.1. Prospects . . . . . . . . . . . . . . . . . . . . . . . . . . . . . . . . . . . . . . . . . . . . . . . . . . . . . . . . . . . . . . . . . . . . . . . . . . . . . . . . . . . . . . . . . . . . . . . . . . . . . . . . . . . . . . . . . . . . . . . . . . . . . . . . . . . . . . . . . .73
12.2. Financial Communications Agenda . . . . . . . . . . . . . . . . . . . . . . . . . . . . . . . . . . . . . . . . . . . . . . . . . . . . . . . . . . . . . . . . . . . . . . . . . . . . . . . . . . . . . . . . .74
Information on Trends
12.1. Prospects
Looking forward, Technip believes that the key drivers of its busi-ness environment have not changed signifi cantly over the past few months.
Bidding activity has held up well in early 2010, as stronger oil prices and lower project costs have encouraged its customers to assess their project portfolio. Yet Technip has observed delays in fi nal investment decisions, resulting in a low bid conversion rate and continuous pricing pressure in its industry.
However, projects cannot be postponed indefi nitely. For 2010 and beyond, while uncertainty persists for hydrocarbon demand, reserves and production issues will emerge at some stage, parti-cularly for oil. Assuming relative stability in oil prices and greater certainty on overall project costs, fi nal investment decisions could pick up during the second half of 2010.
Upstream, declining production at more mature oilfi elds will have to be offset by resources that are increasingly located in frontier areas, which requires greater technological innovation and carries greater risks, in addition to possibly extending project execution phases. Downstream, Technip sees an accelerating geographical shift as the industry reduces refi ning and petrochemical capacity in the developed countries while building more modern and effi cient plants closer to resources (Middle East, Latin America) and end-markets (Asia).
Technip draws a distinction between markets where projects will depend on nearer-term movements in hydrocarbon prices or other factors, and those with strategic growth.
Technip believes that the North Sea market may rebound, with smaller operators being more confi dent in their cash fl ows and credit access. In West Africa, Nigerian activity and bidding will continue to be affected by political uncertainties, while Angola could award some projects in 2010. With respect to the Onshore segment, North America may see some renewed interest in the Canadian oil sands projects, while US downstream markets will remain depressed by overcapacity, particularly in refi ning.
By contrast, Technip believes that deepwater Gulf of Mexico acti-vity should remain robust. Sustained activity is expected in Brazil, with a huge build-up of operational assets needed in particular for the pre-salt developments. Logistics and local fabrication will be key in this market. Technip also believes that the Middle East will continue to be strong in the United Arab Emirates, Saudi Arabia and, to a lesser extent, Qatar. These countries are building up large downstream infrastructures to increase the value of their gas and petroleum products. Technip believes that Iraq will not be a signifi cant market in the short term but represents a signifi cant upside in conventional developments as soon as the security situation improves. Asia Pacifi c will be dominated by gas projects of all sizes, led by Australia with new LNG projects.
Technip is positioned to capitalize on these geographic and segmental trends. Technip can differentiate itself through its strategic investments, local empowerment, and technology: three attributes capable of generating profi table growth in all its segments.
First, Technip will continue to implement plans to expand its global fl eet, increase its manufacturing capacity (Asia, Angola) and improve logistics (Brazil).
Second, Technip will leverage its regional organization to increase its local presence, reduce costs and capture complex global projects that require strong global coordination–a key capability for both international operators and national companies that operate abroad.
Third, Technip will focus on technological differentiation, notably in deepwater, fl oating LNG and heavy oil refi ning.
Technip enters 2010 with a good degree of visibility as a result of its management priorities over the last three years, such as the management of legacy issues, including the TSKJ matter. Technip has a solid, recently acquired €8 billion backlog balanced between business segments and locations, and a strong balance sheet.

074 2009 Reference Document
Information on Trends
12.2. Financial Communications Agenda12
Technip targets 2010 revenues in the €5.9-6.1 billion range, at year end exchange rates, with Subsea revenues of €2.6-2.7 billion. Technip targets a Subsea operating margin above 15%, and Onshore/Offshore combined operating margin stable year-on-year.
Accordingly, Technip can focus greater attention in 2010 on posi-tioning its business for long-term profi table growth worldwide.
Looking ahead over 2010-2012, Technip believes that its backlog should be solid and stable with good visibility:
In millions of Euro Subsea Offshore Onshore Group
2010 2,156.6 341.7 2,002.4 4,500.7
2011 725.9 126.2 1,681.5 2,533.6
2012+ 170.5 - 813.5 984.0
Total 3,053.0 467.9 4,497.4 8,018.3
Source: Technip.
12.2. Financial Communications Agenda
The 2010 fi nancial communications agenda is as follows:
April 29, 2010 2010 First Quarter Results
April 29, 2010 Annual Shareholders’ Meeting
July 22, 2010 2010 Second Quarter and First Six Months’ Results
October 28, 2010 2010 Third Quarter Results

0752009 Reference Document
13Profi t Estimates and Forecasts
None.

076 2009 Reference Document
Compliance with Code. . . . . . . . . . . . . . . . . . . . . . . . . . . . . . . . . . . . . . . . . . . . . . . . . . . . . . . . . . . . . . . . . . . . . . . . . . . . . . . . . . . . . . . . . . . . . . . . . . . . . . . . . . . . . . . . . . . . . . . . . . . . .76
14.1. Board of Directors . . . . . . . . . . . . . . . . . . . . . . . . . . . . . . . . . . . . . . . . . . . . . . . . . . . . . . . . . . . . . . . . . . . . . . . . . . . . . . . . . . . . . . . . . . . . . . . . . . . . . . . . . . . . . . . . . . . . . . . . .7714.1.1. Composition of the Board of Directors . . . . . . . . . . . . . . . . . . . . . . . . . . . . . . . . . . . . . . . . . . . . . . . . . . . . . . . . . . . . . . . . . . . . . . . . . . . . . . . . . . . . . . . . . . . . . . . . . . . .7714.1.2. Biographies of the Directors . . . . . . . . . . . . . . . . . . . . . . . . . . . . . . . . . . . . . . . . . . . . . . . . . . . . . . . . . . . . . . . . . . . . . . . . . . . . . . . . . . . . . . . . . . . . . . . . . . . . . . . . . . . . . . . . . . . .7914.1.3. Company Shares Held by the directors . . . . . . . . . . . . . . . . . . . . . . . . . . . . . . . . . . . . . . . . . . . . . . . . . . . . . . . . . . . . . . . . . . . . . . . . . . . . . . . . . . . . . . . . . . . . . . . . . . .80
14.2. The Company’s Management. . . . . . . . . . . . . . . . . . . . . . . . . . . . . . . . . . . . . . . . . . . . . . . . . . . . . . . . . . . . . . . . . . . . . . . . . . . . . . . . . . . . . . . . . . . . . . . . . . . .81Declarations concerning the administrative, management, supervisory and corporate management bodies . . . . . . . . . . . . . . . . . . . . . . . . . . . . . . . . . . . . . . . . . . . . . . . . . . . . . . . . . . . . . . . . . . . . . . . . . . . . . . . . . . . . . . . . . . . . . . . . . . . . . . . . .81
14.3. Committees of the Board of Directors . . . . . . . . . . . . . . . . . . . . . . . . . . . . . . . . . . . . . . . . . . . . . . . . . . . . . . . . . . . . . . . . . . . . . . . . . . . . . . . . . . .8114.3.1. The Audit Committee . . . . . . . . . . . . . . . . . . . . . . . . . . . . . . . . . . . . . . . . . . . . . . . . . . . . . . . . . . . . . . . . . . . . . . . . . . . . . . . . . . . . . . . . . . . . . . . . . . . . . . . . . . . . . . . . . . . . . . . . . . . . . .8114.3.2. The Nominations and Remunerations Committee . . . . . . . . . . . . . . . . . . . . . . . . . . . . . . . . . . . . . . . . . . . . . . . . . . . . . . . . . . . . . . . . . . . . . . . . . . . . . . . . . .8214.3.3. The Strategic Committee. . . . . . . . . . . . . . . . . . . . . . . . . . . . . . . . . . . . . . . . . . . . . . . . . . . . . . . . . . . . . . . . . . . . . . . . . . . . . . . . . . . . . . . . . . . . . . . . . . . . . . . . . . . . . . . . . . . . . . . . .8214.3.4. The Ethics and Governance Committee . . . . . . . . . . . . . . . . . . . . . . . . . . . . . . . . . . . . . . . . . . . . . . . . . . . . . . . . . . . . . . . . . . . . . . . . . . . . . . . . . . . . . . . . . . . . . . . . . .82
14.4. Confl icts of Interest at the Level of Administrative, Management,
Supervisory and General Management Bodies . . . . . . . . . . . . . . . . . . . . . . . . . . . . . . . . . . . . . . . . . . . . . . . . . . . . . . . . . . . . . . . . . . . .8214.4.1. Absence of current or potential confl icts of interests. . . . . . . . . . . . . . . . . . . . . . . . . . . . . . . . . . . . . . . . . . . . . . . . . . . . . . . . . . . . . . . . . . . . . . . . . . . . . .8214.4.2. Shareholders’ agreements. . . . . . . . . . . . . . . . . . . . . . . . . . . . . . . . . . . . . . . . . . . . . . . . . . . . . . . . . . . . . . . . . . . . . . . . . . . . . . . . . . . . . . . . . . . . . . . . . . . . . . . . . . . . . . . . . . . . . . . .82
Administrative, Management, Supervisory and General Management Bodies
14
Compliance with CodeIn accordance with the provisions of Article 26 of French law no. 2008-649 dated July 3, 2008, adapting various provisions of corporate law to European law, the Company declares voluntarily referring to and applying the entire AFEP-MEDEF corporate governance code for listed companies resulting from the consolidation of the AFEP-MEDEF report of October 2003 and the AFEP-MEDEF recommendations of January 2007 and October 2008 concerning the compensation of executive directors of listed companies (the “AFEP-MEDEF Code”). The AFEP-MEDEF Code is available on the MEDEF’s website (www.medef.fr).
France Proxy, an independent corporate governance consultant fi rm, reviewed Sections 14, 15, 16 and Annex C included in this Reference Document, following the Company’s request and confi rms that the Company complies with the AFEP-MEDEF Code provisions.

0772009 Reference Document
Administrative, Management, Supervisory and General Management Bodies
14.1. Board of Directors 14
14.1. Board of Directors
14.1.1. Composition of the Board of Directors
At February 28, 2010, the Board of Directors was comprised of 11 members. It does not include any directors representing employees or employee shareholders. Three directors are not of French nationality.
The average age of the directors is 59.
The term of offi ce of Board members is set at four years, which is consistent with the recommendations made in the AFEP-MEDEF Code.
In accordance with the recommendations made in the AFEP-MEDEF Code and based on an amendment of the Articles of Association adopted by the Company’s Combined Shareholders’ Meeting of April 27, 2007, in order to foster smooth transitions in Board renewal and to prevent “renewal en masse”, the Board of Directors, at its meeting of April 27, 2007, introduced a rolling renewal system, pursuant to which one-half of its members’ terms of offi ce will be renewed every two years.
In accordance with the AFEP-MEDEF Code recommendations, the qualifi cation of a Board member as an “independent director” is discussed and reviewed every year by the Board of Directors upon the Nominations and Remunerations Committee’s proposal.
At its meeting on February 16, 2009, the Nominations and Remunerations Committee examined the qualifi cation of the Company’s Board members as “independent director” in light of the defi nition and criteria used in the AFEP-MEDEF Code, which states that: “A director is independent when he or she has no relationship of any kind whatsoever with the corporation, its group or the management of either that is such as to colour his or her judgment.”
Therefore a director is independent when he or she has no rela-tionship of any kind whatsoever with the corporation, its group or the management of either that is such as to colour his or her judgment. This means besides:
not to be an employee or executive director of the corporation, ■
or an employee or director of its parent or a company that it consolidates, and not having been in such a position for the previous fi ve years;
not to be an executive director of a company in which the ■
corporation holds a directorship, directly or indirectly, or in which an employee appointed as such or an executive director of the corporation (currently in offi ce or having held such offi ce going back fi ve years) is a director;
not to be a customer, supplier, investment banker or commer- ■
cial banker: that is material for the corporation or its group; or for a signifi cant part of whose business the corporation or its group accounts;
not to be related by close family ties to an executive director; ■
not to have been an auditor of the corporation within the ■
previous fi ve years;
not to have been a director of the corporation for more than ■
12 years. As a practical guideline, loss of the status of indepen-dent director on the basis of this criterion should occur only upon expiry of the term of offi ce during which the 12-year limit is reached.
The Committee presented its conclusions to the Board of Directors, which adopted them at its meeting of February 18, 2009.
The Nominations and Remunerations Committee also met on January 28, 2010 to examine the qualifi cation as an “independent director” as per AFEP-MEDEF independence criteria, of Board members who were in offi ce at the date of the Committee’s meeting.
The Committee presented its conclusions to the Board of Directors, which adopted them at its meeting of February 16, 2010.
At February 28, 2010, the Board was comprised of eight indepen-dent members. It therefore exceeds the recommendations made in the AFEP-MEDEF Code, which stipulates that one-half of the Board members should be independent in widely-held companies that have no controlling shareholders.

078 2009 Reference Document
Administrative, Management, Supervisory and General Management Bodies
14.1. Board of Directors14
At February 28, 2010, the Board of Directors was comprised of the following members:
NameMain positionProfessional addressAge, Nationality
Position within the Board of Directors Term
Thierry PilenkoTechnip’s Chairman and Chief Executive Offi cer6-8, allée de l’Arche–Faubourg de l’Arche–92400 Courbevoie52–French
Technip’s Chairman and Chief Executive Offi cer
Date of fi rst appointment: April 27, 2007.Expiry of the current term of offi ce: Ordinary Shareholders’ Meeting convened to approve the fi nancial statements for the year ending December 31, 2010.
Olivier AppertChairman of the Institut Français du Pétrole ("IFP")Institut Français de Pétrole–1 et 4, avenue de Bois-Préau–92852 Rueil-Malmaison Cedex60–French
Director Date of fi rst appointment: May 21, 2003.Date of last appointment: April 27, 2007.Expiry of the current term of offi ce: Ordinary Shareholders’ Meeting convened to approve the fi nancial statements for the year ending December 31, 2010.
Pascal ColombaniChairman of the Board of Directors of Valeo43, rue Bayen–75017 Paris64–French
Independent Director Date of fi rst appointment: April 27, 2007.Expiry of the current term of offi ce: Ordinary Shareholders’ Meeting convened to approve the fi nancial statements for the year ending December 31, 2010.
Germaine GibaraChairman of Avvio Management Inc. strategic consultancy fi rmAvvio Management–1470 Peel Street–Suite 200–Montreal H3A 1T1–Canada65–Canadian
Independent Director Date of fi rst appointment: April 27, 2007.Expiry of the current term of offi ce: Ordinary Shareholders’ Meeting convened to approve the fi nancial statements for the year ending December 31, 2010.
Gérard Hauser6-8, allée de l’Arche–Faubourg de l’Arche–92400 Courbevoie68–French
Independent Director Date of fi rst appointment: April 30, 2009.Expiry of the current term of offi ce: Ordinary Shareholders’ Meeting convened to approve the fi nancial statements for the year ending December 31, 2012.
Marwan LahoudChief Strategy & Marketing Offi cer of EADS37, boulevard de Montmorency–75781 Paris Cedex 1643–French
Independent Director Date of fi rst appointment: April 30, 2009.Expiry of the current term of offi ce: Ordinary Shareholders’ Meeting convened to approve the fi nancial statements for the year ending December 31, 2012.
Jean-Pierre LamoureChairman of Solétanche FreyssinetSolétanche Freyssinet–133, boulevard National– 92500 Rueil-Malmaison60–French
Independent Director Date of fi rst appointment: March 13, 1998.Date of last appointment: April 30, 2009.Expiry of the current term of offi ce: Ordinary Shareholders’ Meeting convened to approve the fi nancial statements for the year ending December 31, 2012.
Daniel LebègueChairman of the Institut Français des AdministrateursIFA–Institut français des administrateurs–7, rue Balzac–75382 Paris Cedex 0866–French
Independent Director Date of fi rst appointment: April 11, 2003.Date of last appointment: April 30, 2009.Expiry of the current term of offi ce: Ordinary Shareholders’ Meeting convened to approve the fi nancial statements for the year ending December 31, 2012.
John O’LearyChairman and Chief Executive Offi cer of Strand Energy (Dubai)Strand Energy–PO Box 28717–Dubai Investment Park–Dubai–UAE54–Irish
Independent Director Date of fi rst appointment: April 27, 2007.Expiry of the current term of offi ce: Ordinary Shareholders’ Meeting convened to approve the fi nancial statements for the year ending December 31, 2010.
Joseph RinaldiPartner in Davis Polk & WardwellDavis Polk & Wardwell–450 Lexington Avenue–New York NY 10017–USA52–Australian and Italian
Independent Director Date of fi rst appointment: April 30, 2009.Expiry of the current term of offi ce: Ordinary Shareholders’ Meeting convened to approve the fi nancial statements for the year ending December 31, 2012.
Bruno Weymuller12, rue Christophe Colomb–75008 Paris61–French
Director Date of fi rst appointment: February 10, 1995.Date of last appointment: April 30, 2009.Expiry of the current term of offi ce: Ordinary Shareholders’ Meeting convened to approve the fi nancial statements for the year ending December 31, 2012.
Other offi ces held by the members of the Board of the Directors are listed in Annex A of this Reference Document.

0792009 Reference Document
Administrative, Management, Supervisory and General Management Bodies
14.1. Board of Directors 14
14.1.2. Biographies of the DirectorsThierry PILENKO is Chairman and Chief Executive Offi cer of Technip, a world leader in engineering, technologies and project management for the oil and gas industry.Before joining Technip in 2007, he was Chairman and Chief Executive Offi cer of Veritas DGC, a seismic services company based in Houston. While at Veritas DGC he successfully managed its merger with the Compagnie Générale de Géophysique.Prior to this appointment, Thierry Pilenko held various manage-ment and executive positions with Schlumberger where he started in 1984 as a geologist. He held several international positions in Europe, Africa, the Middle East and Asia before becoming President of Schlumberger GeoQuest in Houston and subsequently Managing Director of SchlumbergerSema in Paris until 2004.Thierry Pilenko holds degrees from France’s Nancy School of Geology (1981) and the IFP School (1982). He serves on the Board of Directors of Hercules Offshore and CGGVeritas.
Olivier APPERT has been Chairman of the Institut Français du Pétrole (IFP) since April 2003. Since October 1, 1999, he has been Director of Long-term Cooperation and Energy Policy Analysis at the International Energy Agency. In 1998, he was appointed Vice Chairman of ISIS, a holding company in which IFP was the majority shareholder and which held shares in companies from the oil and gas industry sectors. He had joined the corporate management of IFP in 1994 where he took charge of research and development activities. In 1989, he became director of hydrocarbons in the Ministry for Industry, after having managed, in 1987, the strategy for Télécommunications Radioélectriques et Téléphoniques (TRT). After holding several posts in the French Ministry for Industry and in the Prime Minister’s Cabinet, he held the post of Deputy Director of the Cabinet of the minister for industry from 1984 to 1986. He began his career at the Mines de Lyon.Former student of the French École Polytechnique, Olivier Appert is a Civil Engineer.
Pascal COLOMBANI is Chairman of the Board of Directors of Valeo and Associate Director and Senior Advisor for innovation, high technology and energy at the A.T. Kearney strategic consul-tancy fi rm; he is a member of the French Academy of Technology, a director of Alstom, British Energy Group p.l.c. (EDF’s subsid-iary), Rhodia and Energy Solutions. In 2000, he was appointed Managing Director of the French Atomic Energy Commission (Commissariat à l’Énergie Atomique–CEA), a post that he held until December 2002. He chaired the Supervisory Board from the start of the restructuring of the industrial holdings of the CEA and the creation of Areva in 2000 until May 2003. Between 1997 and 1999, he was the Director of Technology at the Ministry for Research. Pascal Colombani spent close to 20 years (1978-1997) at Schlumberger in various posts, in the US and in Europe, before becoming Chairman and CEO of its Japanese subsidiary in Tokyo. He began his career at CNRS.Pascal Colombani is a graduate of the French École Normale Supérieure in Saint-Cloud (1969) and Doctor of sciences (1974).
Germaine GIBARA chairs the Avvio Management Inc. Strategy Advisory practice that she founded in 1992. She is a registered fi nancial analyst and also gives conferences on technology management and marketing at McGill University and at the Massachusetts Institute of Technology. She also sits on the Boards of Directors of Agrium, Cogeco Cable and Sun Life Financial. She previously sat on the Boards of Directors of Pechiney, the Chamber of Commerce in Canada, Videotron, Ault Food and the Economic Council of Canada.
From 1994 to 1995, Germaine Gibara was Vice Chairman in charge of holdings in companies from the technological sector at the Caisse des Dépôts et Placements in Quebec. She joined Alcan Aluminium Ltd. in 1975 where she successively held the posts of Director of Investor Relations (1975-1984), Director of Strategic Studies (1985-1986), and Chairman of the Alcan Automobile Structure (1986-1991). She began her career at Lombard Odier managing private assets (1970-1975).Germaine Gibara is a graduate of the American University of Cairo (1966) and the University of Dalhousie, Halifax (1968) as well as Harvard Business School (1984).
Gérard HAUSER was Chairman and Chief Executive Offi cer of Nexans from June 2000 to June 2009. He remains member of the Board of Nexans. He joined Alcatel in 1996 and became President of its Cable and Component Sector. From 1975 till 1996, he worked for the Pechiney Group, as Chairman and Chief Executive Offi cer of Pechiney World Trade fi rst and of Pechiney Rhénalu later; he was later appointed Senior Executive Vice President of American National Can and member of the Group Executive Board. From 1965 till 1975, Gérard Hauser covered several senior positions in the Philips Group.
Marwan LAHOUD has been Chief Strategy and Marketing Offi cer of EADS since June 2007. He ran previously MBDA as Chief Executive Offi cer from January 2003. When EADS was founded in July 2000, he was appointed Senior Vice President Mergers & Acquisitions. In May 1998, he joined Aerospatiale as Vice President Development. In June 1999, he was appointed Senior Vice President Strategy and Planning for Aerospatiale Matra. At the end of 1995, he moved to a new position within the French Ministry of Defence, serving as Advisor for Industrial Affairs, Research and Weapons. He began his career at the French Defence procurement agency DGA (Délégation générale pour l’armement) in 1989 at the Landes test range, where he served fi rst as head of the computation centre.Chief Weapons Engineer of the French Army and alumnus of pres-tigious French engineering school École Polytechnique, Marwan Lahoud is an engineering graduate of French aeronautics and space institute (École Nationale Supérieure de l’Aéronautique et de l’Espace).
Jean-Pierre LAMOURE has been Chairman of Solétanche Freyssinet (formerly named Solétanche SA until December 31, 2008) since 1989 and of Solétanche Bachy Entreprise since 1997. He joined the Solétanche Group in 1983 as a Development Manager. Within the Solétanche Group, he was also Chairman of Forasol-Foramer from 1988 to 1997. He has also been Chairman of the Supervisory Board of the family-owned Atlantic Group since 1998. From 1981 to 1983, he worked at Saint-Gobain after holding various posts at the French Ministry for Industry (1975-1981).Former student of the École Polytechnique, Jean-Pierre Lamoure is also a graduate of the École des Mines in Paris.
Daniel LEBÈGUE has been Chairman of the Study Center for Corporate Social Responsibility since October 2008 and has chaired the Institut Français des Administrateurs (“IFA”), a profes-sional association of directors of companies exercising their duties in France since July 2003. From 1998 to 2002, he held the post of Chief Executive Offi cer of the Caisse des Dépôts et Consignations. He is also Chairman of the Institut du Développement Durable et des Relations Internationales, Chairman of the French section of Transparency International and Co-Chairman of Eurofi . In 1987, he joined the Banque Nationale de Paris as Managing Director, and then became Vice Chairman in 1996.

080 2009 Reference Document
Administrative, Management, Supervisory and General Management Bodies
14.1. Board of Directors14
Daniel Lebègue held the post of Treasury Director from 1984 to 1987 after becoming Deputy Director to the Treasury Management in 1983. In 1981, he was appointed Technical Advisor to the Prime Minister’s Cabinet, in charge of economic and fi nancial affairs. He held various posts at the Treasury Department from 1976 to 1981 after being a Financial Attaché at the French Embassy in Japan from 1974 to 1976. He began his career in 1969 at the Ministry of Economy and Finances as a Civil Director for the Treasury Department.Daniel Lebègue is a graduate of the Institut d’Études Politiques in Lyon and is also a former student of the French École Nationale d’Administration.
John O’LEARY has, since January 2007, held the post of Chairman and Chief Executive Offi cer of Strand Energy (Dubai), a company involved in seeking out investment and development opportu-nities in the oil and gas sector and also sits on the Supervisory Boards of Huisman Itrec and Khan Shipping. From 2004 to 2006, he was a partner in Pareto Offshore ASA, a Norwegian company specialized in advising customers in the exploration/production sector. In 1985, he joined the Forasol-Foramer group where he successively held the posts of Development and Partnerships Manager (1985-1989) and Vice Chairman for Marketing (1990-1997). After the takeover in 1997 of Forasol-Foramer by Pride International, a company specialized in onshore and offshore drilling, he became the Chief Executive Offi cer of the new group until 2004. He joined Total as a drilling engineer (1980-1985) after beginning his career as a trader in the Irish National Petroleum Corporation (1979-1980).John O’Leary is a graduate of Trinity College in Dublin, the University College in Cork as well as the Institut Français du Pétrole.
Joseph RINALDI is a partner in the international law fi rm of Davis Polk & Wardwell. He advises on mergers and acquisitions transactions, corporate governance and securities and corporate
law. Joseph Rinaldi is a frequent speaker and author on merger and acquisition and corporate governance issues. From 2002 to 2007 he was the senior partner in the Paris offi ce of Davis Polk after joining Davis Polk in 1984 and becoming a partner in 1990. Joseph Rinaldi graduated from the University of Sydney, Australia, with fi rst class honors in 1979, and in 1981 received his LL.B, with fi rst class honors, from the University of Sydney, where he was a member of the editorial committee of the Sydney Law Review. He received an LL.M from the University of Virginia School of Law in 1984. He is admitted to practice law in New York.
Bruno WEYMULLER held the position of Director for Strategy and Risk Assessment at Total (2000-2008) and a member of the Executive Committee. Bruno Weymuller held various management posts within the Elf Aquitaine Group from 1981 to January 2000, in particular, as Group Financial Director from 1994 to 2000. He began his career at the Ministry for Industry from 1972 to 1978, after which he joined the Prime Minister’s Cabinet from 1978 to 1981 as an Offi cial Representative.Bruno Weymuller is a former student of the École Polytechnique, he is also a graduate of the École des Mines in Paris, and holds a Master of Science from the Massachusetts Institute of Technology.
Patrick PICARD is Secretary of the Board of Directors.
14.1.3. Company Shares Held by the directors
Pursuant to the provisions of Article 14 of the Company’s articles of association at the date of this Reference Document, each director is required to hold at least 400 Company shares in registered form.
At February 28, 2010, to the Company’s knowledge, each of the Board members held the following number of shares in registered form:
Members of the Board of DirectorsNumber of Technip shares held at February 28, 2010
Thierry PILENKO 3,400
Olivier APPERT 662
Pascal COLOMBANI 400
Germaine GIBARA 400
Gérard HAUSER 900
Marwan LAHOUD 400
Jean-Pierre LAMOURE 2,004
Daniel LEBÈGUE 400
John O’LEARY 800
Joseph RINALDI 400
Bruno WEYMULLER 400
Total 10,166
0812009 Reference Document
Administrative, Management, Supervisory and General Management Bodies
14.3. Committees of the Board of Directors 14
14.2. The Company’s Management
On January 15, 2007, the Board of Directors, upon the Nominations and Remunerations Committee’s proposal, appointed Thierry Pilenko as the Company’s Executive Vice President.
The Combined Shareholders’ Meeting of April 27, 2007 appointed Thierry Pilenko to the Board of Directors for a four-year term expiring after the Shareholders’ Meeting convened to approve the fi nancial statements for the year ending December 31, 2010.
At its meeting on April 27, 2007, the Board of Directors appointed Thierry Pilenko as Chairman of the Board of Directors. At its meeting on the same day and in accordance with Article 18 of the Company’s Articles of Association, the Board opted to combine the offi ces of Chairman and Chief Executive Offi cer of the Company, determining that this management organization is best suited for the Company, and appointed Thierry Pilenko as Chairman and Chief Executive Offi cer for the duration of his term of offi ce as a director.
At the date of this Reference Document, the Board of Directors had not appointed any Executive Vice President.
Declarations concerning the administrative, management, supervisory and corporate management bodiesTo the Company’s knowledge:
there is no close family relationship between or among the ■
members of the Company’s Board of Directors;
no judgment for fraud has been rendered over the past fi ve years ■
against a member of the Board of Directors or the Chairman and Chief Executive Offi cer;
none of the members of the Board of Directors or the Chairman ■
and Chief Executive Offi cer has been, over the past fi ve years, the subject of a bankruptcy, sequestration or liquidation procedure as a member of an administrative, management or supervisory body or as a Chief Executive Offi cer;
no incrimination and/or offi cial public sanction has been made ■
against any of the members of the Board of Directors of the Company or the Chairman and Chief Executive Offi cer by any regulatory authority (including appointed professional organi-zations) over the past fi ve years; and
none of the members of the Board of Directors or the Chairman ■
and Chief Executive Offi cer has agreed to any restrictions on the disposal of their holdings in Technip’s shares, within a certain period of time, which are more restrictive than those resulting from the Board Members Charter described in Section 16.1.1. of this Reference Document.
14.3. Committees of the Board of Directors
In order to assist it in carrying out its duties, the Board of Directors has established four specialized Committees: an Audit Committee, a Nominations and Remunerations Committee and a Strategic Committee, all three of which were created in 2003, and an Ethics and Governance Committee created in 2008.
The existence of the Audit Committee and of the Nominations and Remunerations Committee satisfi es the recommendations made in the AFEP-MEDEF Code. The Board also established two specialized committees: the Strategic Committee and the Ethics and Governance Committee in order to meet specifi c concerns as permitted by the AFEP-MEDEF Code.
The role and the practices of these Committees are described in Section 16.3 of this Reference Document.
14.3.1. The Audit CommitteeAt February 28, 2010, the Audit Committee’s members were as follows:
Member Title Date of 1st appointment
Daniel LEBÈGUE Chairman May 21, 2003
Gérard HAUSER Member April 30, 2009
John O’LEARY Member April 27, 2007
Bruno WEYMULLER Member April 30, 2009
The Committee’s internal charter provides that the Committee must be comprised of at least three directors appointed by the Board of Directors. In considering directors for membership to the Audit Committee, the Board carefully reviews their independence and ensures that at least one member has specifi c qualifi cations in fi nancial and accounting matters, as required by Article 14 of the French regulation no. 2008-1278 of December 8, 2008.

082 2009 Reference Document
Administrative, Management, Supervisory and General Management Bodies
14.4. Confl its d’intérêts au niveau des organes d’administration, de direction et de surveillance et de la direction générale
14
At February 28, 2010, all of the Audit Committee members had, due to their education and professional experience, qualifi cations in fi nancial and accounting matters and three quarters of the members were independent directors. The Committee is thus comprised of more independent directors than (i) required by Article 14 of the French regulation no. 2008-1278 of December 8, 2008, which provides that at least one member must be inde-pendent, or (ii) recommended by the AFEP-MEDEF Code, which recommends that at least two-thirds of its members must be independent directors. The Audit Committee does not include as a member the Chairman and Chief Executive Offi cer, sole execu-tive director.
As provided for by the AFEP-MEDEF Code, members of the Audit Committee receive, from the date of their appointments, an information relating to corporation’s specifi c accounting, fi nancial and operational features.
The Committee appoints its Chairman and its Secretary.
14.3.2. The Nominations and Remunerations Committee
At February 28, 2010, the Nominations and Remunerations Committee’s members were as follows:
Member Title Date of 1st appointment
Bruno WEYMULLER Chairman May 21, 2003
Pascal COLOMBANI Member April 27, 2007
Germaine GIBARA Member April 27, 2007
Jean-Pierre LAMOURE Member May 21, 2003
The Committee’s internal charter provides that the Committee must be comprised of at least three directors designated by the Board of Directors, the majority of whom must be independent.
The Chairman and Chief Executive Offi cer, who is the only execu-tive director, is not a member of the Committee.
At February 28, 2010, the majority of the Nominations and Remunerations Committee’s members were independent directors, thus complying with the recommendations made in the AFEP-MEDEF Code, according to which the majority of the Committee’s members must be independent directors and none of them can be an executive director.
The Committee appoints its Chairman and its Secretary.
14.3.3. The Strategic CommitteeAt February 28, 2010, the Strategic Committee’s members were as follows:
Member Title Date of 1st appointment
Germaine GIBARA Chairman April 27, 2007
Pascal COLOMBANI Vice President April 27, 2007
Olivier APPERT Member May 21, 2003
Gérard HAUSER Member April 30, 2009
Marwan LAHOUD Member April 30, 2009
The Committee’s internal charter provides that the Committee must be comprised of at least three directors designated by the Board of Directors.
At February 28, 2010, the majority of the Strategic Committee’s members were independent directors.
The Committee appoints its Chairman and its Secretary.
14.3.4. The Ethics and Governance Committee
At February 28, 2010, the Ethics and Governance Committee’s members were as follows:
Member Title Date of 1st appointment
Pascal COLOMBANI Chairman December 9, 2008
Olivier APPERT Member December 9, 2008
Joseph RINALDI Member April 30, 2009
The Committee’s internal charter provides that the latter must be comprised of at least three directors appointed by the Board of Directors.
At February 28, 2010, two-thirds of the Ethics and Governance Committee’s members were independent directors.
The Committee appoints its Chairman and its Secretary.
14.4. Confl icts of Interest at the Level of Administrative, Management, Supervisory and General Management Bodies
14.4.1. Absence of current or potential confl icts of interests
To the Company’s knowledge, there are no current or potential confl icts of interest between the duties owed to the issuer and the private interests and/or other duties of the members of the Company’s Board of Directors.
14.4.2. Shareholders’ agreementsNone.
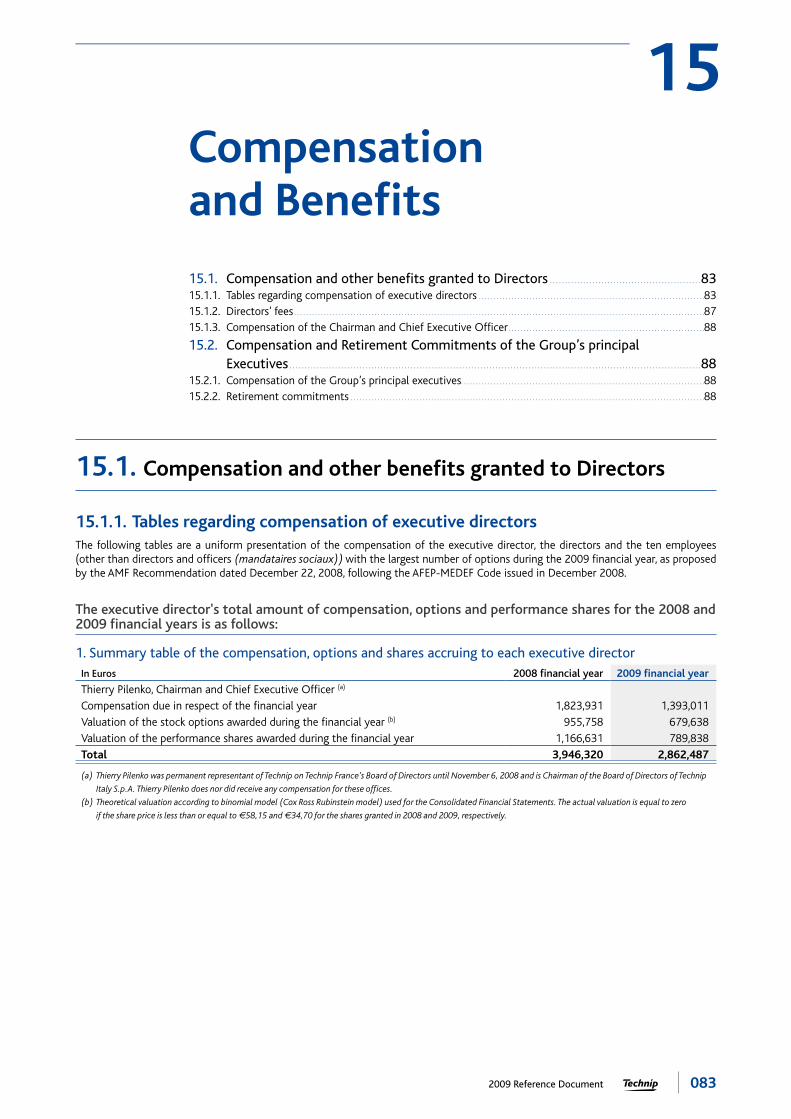
0832009 Reference Document
15
15.1. Compensation and other benefi ts granted to Directors . . . . . . . . . . . . . . . . . . . . . . . . . . . . . . . . . . . . . . . . . . . . . . . . . .8315.1.1. Tables regarding compensation of executive directors . . . . . . . . . . . . . . . . . . . . . . . . . . . . . . . . . . . . . . . . . . . . . . . . . . . . . . . . . . . . . . . . . . . . . . . . . . . .8315.1.2. Directors’ fees . . . . . . . . . . . . . . . . . . . . . . . . . . . . . . . . . . . . . . . . . . . . . . . . . . . . . . . . . . . . . . . . . . . . . . . . . . . . . . . . . . . . . . . . . . . . . . . . . . . . . . . . . . . . . . . . . . . . . . . . . . . . . . . . . . . . . . . . . .8715.1.3. Compensation of the Chairman and Chief Executive Offi cer . . . . . . . . . . . . . . . . . . . . . . . . . . . . . . . . . . . . . . . . . . . . . . . . . . . . . . . . . . . . . . . . . .88
15.2. Compensation and Retirement Commitments of the Group’s principal
Executives . . . . . . . . . . . . . . . . . . . . . . . . . . . . . . . . . . . . . . . . . . . . . . . . . . . . . . . . . . . . . . . . . . . . . . . . . . . . . . . . . . . . . . . . . . . . . . . . . . . . . . . . . . . . . . . . . . . . . . . . . . . . . . . . . . . . . . . .8815.2.1. Compensation of the Group’s principal executives. . . . . . . . . . . . . . . . . . . . . . . . . . . . . . . . . . . . . . . . . . . . . . . . . . . . . . . . . . . . . . . . . . . . . . . . . . . . . . . . . .8815.2.2. Retirement commitments . . . . . . . . . . . . . . . . . . . . . . . . . . . . . . . . . . . . . . . . . . . . . . . . . . . . . . . . . . . . . . . . . . . . . . . . . . . . . . . . . . . . . . . . . . . . . . . . . . . . . . . . . . . . . . . . . . . . . . .88
Compensation and Benefi ts
15.1. Compensation and other benefi ts granted to Directors
15.1.1. Tables regarding compensation of executive directorsThe following tables are a uniform presentation of the compensation of the executive director, the directors and the ten employees (other than directors and offi cers (mandataires sociaux)) with the largest number of options during the 2009 fi nancial year, as proposed by the AMF Recommendation dated December 22, 2008, following the AFEP-MEDEF Code issued in December 2008.
The executive director's total amount of compensation, options and performance shares for the 2008 and 2009 fi nancial years is as follows:
1. Summary table of the compensation, options and shares accruing to each executive director
In Euros 2008 fi nancial year 2009 fi nancial year
Thierry Pilenko, Chairman and Chief Executive Offi cer (a)
Compensation due in respect of the fi nancial year 1,823,931 1,393,011
Valuation of the stock options awarded during the fi nancial year (b) 955,758 679,638
Valuation of the performance shares awarded during the fi nancial year 1,166,631 789,838
Total 3,946,320 2,862,487
(a) Thierry Pilenko was permanent representant of Technip on Technip France’s Board of Directors until November 6, 2008 and is Chairman of the Board of Directors of Technip
Italy S.p.A. Thierry Pilenko does nor did receive any compensation for these offi ces.
(b) Theoretical valuation according to binomial model (Cox Ross Rubinstein model) used for the Consolidated Financial Statements. The actual valuation is equal to zero
if the share price is less than or equal to €58,15 and €34,70 for the shares granted in 2008 and 2009, respectively.

084 2009 Reference Document
Compensation and Benefi ts
15.1. Compensation and other benefi ts granted to Directors15
The total amount of compensation that fell due and was paid, as well as all other benefi ts granted to the executive director, over the 2008 and 2009 fi nancial years is as follows:
2. Summary table of the compensation of Thierry Pilenko
Thierry Pilenko, Chairman and Chief Executive Offi cer
2008 fi nancial year 2009 fi nancial year
Due (1) Paid (2) Due (1) Paid (2)
Fixed compensation (a) 756,000 711,000 756,000 756,000
Variable compensation (b) 1,060,920 631,100 630,000 1,060,920
Extraordinary compensation - - - -
Directors’ fees (c) - - - -
Fringe benefi ts (car) (d) 7,011 7,011 7,011 7,011
Total 1,823,931 1,349,111 1,393,011 1,823,931
(1) Amount corresponding to the fi xed and total compensation and fringe benefi ts as estimated at 01/01/N to be paid during year N and to the variable compensation
as estimated at 01/01/N.
(2) Amounts paid during year N, i.e. fi xed compensation and variable compensation for year N-1.
(a) Composed of the annual base compensation (before tax) on 12 months, and a fi xed amount for travelling equal to 20% of the annual base compensation.
(b) Variable compensation corresponds to the amount (before tax) due for 2008 and to be paid in 2009. For 2009, the amount (before tax) due for 2009 corresponds
to the target if 100% achieved (cf. details on variable compensation in Section 15.1.3 of this Reference Document).
(c) Thierry Pilenko does not receive any directors’ fees for the position he holds in the Group’s companies or as a Company director.
(d) Company car.
The individual amounts of directors’ fees for the 2008 fi nancial year, which were paid in January 2009, and for the 2009 fi nancial year, which were paid in January 2010 to each of the Board members were as follows:
3. Directors’ fees table
Board members (1)
Directors’ fees paid for the 2008
fi scal year
Directors’ fees paid for the 2009
fi scal year
Olivier Appert €23,800 €36,100
Pascal Colombani €29,800 €44,500
Jacques Deyirmendjian €36,300 €15,250
Germaine Gibara €49,800 (2) €53,500 (2)
Gérard Hauser N/A €27,350
Marwan Lahoud N/A €21,650
Jean-Pierre Lamoure €27,900 €32,900
Daniel Lebègue €38,700 €45,300
Roger Milgrim €50,900 (2) €17,450 (2)
John O’Leary €50,900 (2) €50,800 (2)
Joseph Rinaldi N/A €29,850 (2)
Rolf E. Rolfsen €34,900 (2) €14,250 (2)
Bruno Weymuller €31,600 €47,400
Thierry Pilenko €0 €0
Total €374,600 €436,300
(1) It is necessary to include in this column all members of the Board of Directors, even where the said information is already included in the tables concerning the individual
compensation of executive directors.
(2) Before the 25% withholding applicable to directors’ fees paid to Board members residing outside of France.
Directors (other than the Chairman and Chief Executive Offi cer) do not receive any other compensation from the Company or other companies of the Group.

0852009 Reference Document
Compensation and Benefi ts
15.1. Compensation and other benefi ts granted to Directors 15
The total amount of share purchase or share subscription options granted over the 2009 fi nancial year to the executive director by the Company or by any Group company is as follows:
4. Share purchase or share subscription options granted during the fi nancial year to the executive director by Technip (a)
Name of the executive director
Number and date
of the plan
Nature of the options
(purchase or subscription)
Valuation of the options according to the method
used for the Consolidated Financial Statements (b)
Number of options awarded
during the fi nancial year
Exercise price
Exercise period
Thierry Pilenko 06/15/2009 subscription €679,638 109,000 €34.70 06/15/2013 to
06/15/2015
(a) The number of shares resulting from the exercise of share purchase or share subscription options granted by the Board of Directors on June 15, 2009 will be subject
to the achievement by Technip of a performance measured by the progression over the 2009-2012 period of the Group’s Consolidated Operating Income in relation
to a representative sample of Group’s competitors. No shares can be exercised if the progression of the Group’s Operating Income is less than that of each
of the companies included in the sample.
(b) The valuation assumptions regarding these options are described in Note 20-(h) of the Group’s Consolidated Financial Statements (see Section 20.1 of this Reference
Document).
Share purchase or share subscription options exercised over the 2009 fi nancial year by the executive directorThierry Pilenko, the Company’s only executive director did not exercise any share purchase or share subscription options in the 2009 fi nancial year.
5. Stock options exercised during the fi nancial year by the executive director
Options exercised by the executive directorNumber and date
of the plan
Number of options exercised during
the fi nancial yearExercise
price Award year
N/A N/A 0 N/A N/A
Thierry Pilenko, the Company’s only executive director, in duty and the benefi ciary of share purchase or share subscription options does not engage in any risk hedging transactions.
The total amount of performance shares granted by the Company to the executive director over the 2009 fi nancial year is as follows:
6. Performance shares granted during the fi nancial year to the executive director
Name of the executive director
Number and date
of the plan
Number of performance
shares granted
Valuation of shares according to the method
used for the Consolidated Financial Statements (a)
Acquisition date
Availability date
Performance conditions
Thierry Pilenko 06/15/2009 32,000 €789,838 06/15/2012 06/15/2014 Same conditions
as for stock options*
(a) The valuation assumptions regarding these shares are described in Note 20-(i) of the Group’s Consolidated Financial Statements (see Section 20.1 of this Reference
Document).
* See note (a) in the table 4 hereabove.

086 2009 Reference Document
Compensation and Benefi ts
15.1. Compensation and other benefi ts granted to Directors15
The total amount of performance shares acquired by the executive director during the 2009 fi nancial year is as follows:
7. Performance shares acquired by the executive director
Performance shares acquired by the executive director over the 2009 fi nancial year
Number of performance
shares Price Grant date
Acquisition date, subject to
compliance with the conditions set by the
Board of DirectorsPlan
number
Performance shares acquired during the year by the executive director N/A N/A N/A N/A N/A
Thierry Pilenko, the Company’s only executive director, in duty and the benefi ciary of performance shares does not engage in any risk hedging transactions.
8. History of share subscription and share purchase options and information on share subscription and share purchase options
2005 Plan(3rd tranche)
Subscription options
1st additional grant to tranches 1, 2
and 3 of the 2005 Plan
Subscription options
2nd additional grant to
tranches 1, 2 and 3 of the 2005
Plan
Subscription options
2008 Plan1st tranche
Purchase options
2009 Plan
Subscription options
Date of Shareholders’ Meeting April 29, 2005 April 29, 2005 April 29, 2005 May 6, 2008 April 30, 2009
Date of Board of Directors’ meeting March 12, 2007 December 12, 2007 June 12, 2008 July 1, 2008 June 15, 2009
Number of options granted 965,214 (1) 85,000 (1) 106,858 (1) 953,100 (2) 1,093,175 (3)
Total number of shares available for subscription/purchase at December 31, 2009 928,346 80,310 103,858 937,060 1,091,075
Number of shares that may be subscribed/purchased at December 31, 2009 by:
the Chairman and Chief Executive ■
Offi cer, corporate offi cer* 255,655 0 0 80,000 109,000 (4)
Option exercise start date March 13, 2011 December 13, 2011 June 13, 2012 July 2, 2012 June 15, 2013
Expiry date** March 12, 2013 December 12, 2013 June 12, 2014 July 1, 2014 June 15, 2015
Subscription/purchase price per option €49.1705 €55.6727 €59.96 €58.15 €34.70
Options cancelled at December 31, 2009 60,458 5,019 3,000 16,040 2,100
Number of shares subscribed/ purchased at February 28, 2010 2,054 0 0 0 0
* The other mandataires sociaux are not benefi ciaries of Plans.
** All the plans are subject to certain restrictions limiting the exercise of options in the event the employee or the manager ceases to work for the Company.
(1) With respect to options granted under tranches 1, 2 and 3 and the two additional grants to the tranches of the 2005 Plan, the exercise of options is subject to the
achievement by Technip of a satisfactory performance for its shareholders. This performance will be measured by the change in the Company’s fully diluted net profi ts per
share compared with the average of that of a representative sample of the Group’s competitors. Thus, the number of options that may be exercised is subject to the level of
achievement of the aforementioned performance recorded at the option exercise start date.
With respect to 1st tranche of Plan 2005, the performance calculation over the period 2005-2008 amounted to 97.75% of the options.
(2) The number of purchase options granted by the Board of Directors on July 1, 2008 is subject to a satisfactory performance over the period 2008-2011. This performance will
be measured by the progression of the Group’s Consolidated Income in relation to a representative sample of the Group’s competitors. 50% of the granted shares are subject
to the level of achievement of the aforementioned performance recorded at the option exercise start date.
(3) The number of subscription options granted by the Board of Directors on June 15, 2009 is subject to a satisfactory performance over the period 2009-2012. This performance
will be measured by the progression of the Group’s Consolidated Income in relation to a representative sample of the Group’s competitors. 50% of the granted shares are
subject to the level of achievement of the aforementioned performance recorded at the option exercise start date.
(4) The number of subscription options granted by the Board of Directors on June 15, 2009 is subject to a satisfactory performance over the period 2009-2012. This performance
will be measured by the progression of the Group’s Consolidated Income in relation to a representative sample of the Group’s competitors. No options can be exercised by
the Chairman and Chief Executive Offi cer if the progression of the Group’s Operating Income is less than that of each of the companies included in the sample.

0872009 Reference Document
Compensation and Benefi ts
15.1. Compensation and other benefi ts granted to Directors 15
Share purchase or share subscription options granted to and exercised by the ten employees (other than directors and offi cers (mandataires sociaux)) with the largest number of options during the 2009 fi scal year:
9. Share purchase or share subscription options granted to and exercised by the 10 employees (other than directors and offi cers) with the largest number of options
Share purchase or share subscription options granted to and exercised by the 10 employees (other than directors and offi cers) with the largest number of options
Total number of granted shares/ of shares
subscribed or bought*/**
Weighted average price
*/** Plan Number
Options granted during the year by the issuer or by any company included in the grant perimeter to the 10 employees of the issuer or any company included in the grant perimeter, in receipt of the largest number of options (aggregate information)
148,000 €34.70 2009 Plan
Options held on the issuer and the aforementioned companies exercised during the year by the 10 employees of the issuer or another Group company having bought or subscribed to the highest number of options (aggregate information)
24,080 €43.4115 December 15, ■
1999 PlanCSO 11 Plan ■
2002 Plan (balance ■
of Tranche B)2005 Plan ■
(Tranche 2)
* The number of shares obtained of the share purchase options granted by the Board of Directors of June 15, 2009 is dependent on Technip’s achieving a performance
measured by the Group Consolidated Income in relation to the average of that of a representative sample of the Group’s competitors over the 2009-2012 period.
One-half of the options that can be exercised is subject to the level of achievement of the performance condition discussed above recorded at the option exercise start date.
** The Combined Shareholders’ Meeting of May 6, 2008 decided to distribute a dividend for 2008 taken in part from the Company’s available reserves. The Board of Directors’
meeting of May 14, 2008 made adjustments in accordance with applicable regulations. Consequently, the exercise prices and the number of options were adjusted so as to
maintain a constant total exercise price for benefi ciaries. These adjustments were made in accordance with methods provided for by regulations and resulted in a decrease
in the exercise price and an increase in the number of options.
Other information regarding the executive director is detailed in the following table:
10. Other information regarding the executive director
Employment
contractSupplementary retirement plan
Compensations or benefi ts due or potentially due in case of suspension
or change in the functions
Compensations relating to a non-
compete agreement
Thierry Pilenko No Yes (a) No Yes (b)
(a) See Section 15.1.3. of this Reference Document.
(b) See Section 15.1.3. of this Reference Document.
15.1.2. Directors’ feesThe amount of directors’ fees allocated to members of the Board of Directors for the 2009 fi nancial year was set at €440,000 by the Combined Shareholders’ Meeting of April 30, 2009. The amount actually paid amounted to €436,300. In accordance with the recommendations in the AFEP-MEDEF Code, directors’ fees should include a variable portion to be paid depending on the rate of attendance at Board and Committees meetings.
The individual amounts of directors’ fees for the 2008 and 2009 fi nancial years which where paid to each of the Board members are detailed in table 3 of Section 15.1.1 of this Reference Document.
The Board meeting of December 16, 2009 fi nalized the distribu-tion of directors’ fees for 2009 as follows:
€ ■ 205,000 divided equally among Board members (with the exception of the Chairman and Chief Executive Offi cer who does not receive directors’ fees), i.e., €20,500 per director, adjusted, if needed, on a prorata basis;
an additional amount of ■ €40,000 divided equally among directors residing outside of France, i.e. €12,000, adjusted, if needed, on a prorata basis;
an additional amount for 2009 divided among directors (other ■
than the Chairman and Chief Executive Offi cer), depending on the attendance rate of the Board members since January 1, 2009, as follows:
€ - 1,200 per Board meeting,€ - 1,000 per meeting of the Strategic Committee, the Nominations and Remunerations Committee and the Ethics and Governance Committee and €1,800 for each of the Chairmen of these Committees,€ - 1,500 per meeting of the Audit Committee and €2,800 for its Chairman.
The amount of directors’ fees that will be proposed by the Board of Directors to the Shareholders’ Meeting of April 29, 2010 for the 2010 fi nancial year is €600,000. The allocation of the same amount for each of the 2011 and 2012 fi scal years will be proposed to the Shareholders’ Meeting.

088 2009 Reference Document
Compensation and Benefi ts
15.2. Compensation and Retirement Commitments of the Group’s principal Executives15
15.1.3. Compensation of the Chairman and Chief Executive Offi cer
The compensation of the Company’s Chairman and Chief Executive Offi cer compensation is determined by the Board of Directors, upon the proposal of the Nominations and Remunerations Committee.
The total amount of compensation paid in 2009 by the Company to Thierry Pilenko amounted to €1,823,931 (see Section 15.1.1, table 2, for further details).
The variable portion of compensation is based on the fi xed compensation for the previous year. For 2009 the target variable portion is equal to 100% of the annual base compensation. 50% of the target variable portion is linked to the fi nancial performance of the Group based on 2009 operating income, 25% is linked to the achievement of individual objectives and 25% to the implementation of Group values and participation in the implementation of measures regarding Technip’s economic environment. The share of the variable portion linked to Group fi nancial performance is (i) nil if real performance is below 75% of the budgeted amount (performance fl oor), (ii) between 50% and 100% for a performance equal to 75% to 100% of the budgeted amount and (iii) between 100% and 200% for a performance equal to 100% to 115% of the budgeted amount (outperformance). If achieved fi nancial results are superior to the budgeted objective, a multiplier rate is calculated, up to a maximum of 2. The multi-plier is calculated based on the fi nancial portion of the objectives, representing 50% of the variable portion criteria. It is then applied to the other variable portion criteria in order to calculate the fi nal variable portion, which is capped at 200% of the target variable portion. The variable portion to be paid to Thierry Pilenko in 2010 for the 2009 fi nancial year is €1,140,300.
Thierry Pilenko does not receive any directors’ fees for the posi-tions he holds in the Group’s companies or as a Company director.
There is no specifi c retirement plan for the Chairman and Chief Executive Offi cer. The Chairman and Chief Executive Offi cer is a benefi ciary of the supplementary retirement plan for Group executives, with fi xed contributions of 8% of gross annual compensation paid up to income bracket 3, i.e., eight times the
annual French Social Security limit. The contribution for 2009 amounted to €21 597.
The Chairman and Chief Executive Offi cer also benefi ts from the Company’s existing supplementary retirement plan for Executive Committee members: a retirement income guarantee of 1.8% per year of service, up to a limit of 15 years, on income bracket 4 of gross annual compensation paid, i.e., exceeding eight times the French Social Security limit. The amount of gross compensation to which this retirement income guarantee applies corresponds to the average of the gross base compensation (including variable compensation within the limit of the target variable portion of 100%), received over the fi ve complete fi nancial years prior to the date of departure from the Company. The retirement income guarantee will only be due in the following events: a departure from the Company after his 60th birthday; a departure from the Company as a result of a 2nd or 3rd category disability (as defi ned under French law); a departure from the Company after his 55th birthday provided that such departure is not the result of gross misconduct or negligence on his part and that no salaried activity is resumed between leaving the Company and receiving a pension under the general French Social Security scheme.
109,000 stock options and 32,000 performance shares were granted to Thierry Pilenko over the 2009 fi nancial year (see Section 15.1.1, tables 4 and 6, for further details). Thierry Pilenko did not exercise any Technip share subscription or share purchase options during the 2009 fi nancial year. Thierry Pilenko is not a benefi ciary of any share subscription warrants from the Company or any other Group company.
At the time of his appointment, Thierry Pilenko signed a world-wide non-compete agreement. In order to take into account the AFEP-MEDEF recommendations of October 6, 2008, the Board of Directors, in its meeting of February 18, 2009, decided to limit the indemnity amounting to a compensation of 24 months calculated from the fi xed compensation plus the target variable portion of the last 12 months, corresponding to a non-compete provision of two years.
At the same meeting, the Board decided there will be no severance indemnity for the executive director in the event his mandate is revoked or is not renewed by the Company.
15.2. Compensation and Retirement Commitments of the Group’s principal Executives
15.2.1. Compensation of the Group’s principal executives
The total amount of all direct and indirect compensation paid in 2009 by the Group’s French and foreign companies to all of the Group’s principal executives (i.e., the nine members of the Executive Committee) amounted to €4,141,863. The variable portion represented 33.1% of the overall amount.
The charges relating to share purchase and share subscription options, as well as performance shares, granted to the Company’s executive offi cers, and accounted for in 2009, amounted to €4.2 million.
15.2.2. Retirement commitmentsPayment made in 2009 by Group companies under supplemen-tary retirement plans applicable to the hereabovementioned principal executives discussed above amounted to €0.4 million, including €0.3 million under the retirement income guarantee plan for Executive Committee members.
The amount for retirement commitments for Executive Committee members amounted to €1.9 million at December 31, 2009. The amount provisioned for these commitments was nil at December 31, 2009 because contributions had been paid.

0892009 Reference Document
Operation of Administrative and Management Bodies
16.1. Description of the Role and Practices of the Board of Directors . . . . . . . . . . . . . . . . . . . . . . . . . . . . . . . . . . . . . . . . . . . . . . . .8916.1.1. Role and Practices . . . . . . . . . . . . . . . . . . . . . . . . . . . . . . . . . . . . . . . . . . . . . . . . . . . . . . . . . . . . . . . . . . . . . . . . . . . . . . . . . . . . . . . . . . . . . . . . . . . . . . . . . . . . . . . . . . . . . . . . . . . . . . . . . . . .8916.1.2. The Board of Directors’ work in 2009 . . . . . . . . . . . . . . . . . . . . . . . . . . . . . . . . . . . . . . . . . . . . . . . . . . . . . . . . . . . . . . . . . . . . . . . . . . . . . . . . . . . . . . . . . . . . . . . . . . . . . .90
16.2. Company’s Management . . . . . . . . . . . . . . . . . . . . . . . . . . . . . . . . . . . . . . . . . . . . . . . . . . . . . . . . . . . . . . . . . . . . . . . . . . . . . . . . . . . . . . . . . . . . . . . . . . . . . . . . . . . .9116.2.1. The Chairman and Chief Executive Offi cer. . . . . . . . . . . . . . . . . . . . . . . . . . . . . . . . . . . . . . . . . . . . . . . . . . . . . . . . . . . . . . . . . . . . . . . . . . . . . . . . . . . . . . . . . . . . . .9116.2.2. The Executive Committee (EXCOM) . . . . . . . . . . . . . . . . . . . . . . . . . . . . . . . . . . . . . . . . . . . . . . . . . . . . . . . . . . . . . . . . . . . . . . . . . . . . . . . . . . . . . . . . . . . . . . . . . . . . . . .91
16.3. Role and Practices of the Committees of the Board of Directors . . . . . . . . . . . . . . . . . . . . . . . . . . . . . . . . .9216.3.1. Audit Committee . . . . . . . . . . . . . . . . . . . . . . . . . . . . . . . . . . . . . . . . . . . . . . . . . . . . . . . . . . . . . . . . . . . . . . . . . . . . . . . . . . . . . . . . . . . . . . . . . . . . . . . . . . . . . . . . . . . . . . . . . . . . . . . . . . . . .9216.3.2. The Nominations and Remunerations Committee . . . . . . . . . . . . . . . . . . . . . . . . . . . . . . . . . . . . . . . . . . . . . . . . . . . . . . . . . . . . . . . . . . . . . . . . . . . . . . . . . .9316.3.3. The Strategic Committee. . . . . . . . . . . . . . . . . . . . . . . . . . . . . . . . . . . . . . . . . . . . . . . . . . . . . . . . . . . . . . . . . . . . . . . . . . . . . . . . . . . . . . . . . . . . . . . . . . . . . . . . . . . . . . . . . . . . . . . . .9416.3.4. The Ethics and Governance Committee . . . . . . . . . . . . . . . . . . . . . . . . . . . . . . . . . . . . . . . . . . . . . . . . . . . . . . . . . . . . . . . . . . . . . . . . . . . . . . . . . . . . . . . . . . . . . . . . . .95
16.4. Corporate Governance: Evaluation of the Boardof Directors
and of the Board’s Committees . . . . . . . . . . . . . . . . . . . . . . . . . . . . . . . . . . . . . . . . . . . . . . . . . . . . . . . . . . . . . . . . . . . . . . . . . . . . . . . . . . . . . . . . . . . . . . . .96
16.5. Contracts between the Board Members and the Company
or one of the Group’s company. . . . . . . . . . . . . . . . . . . . . . . . . . . . . . . . . . . . . . . . . . . . . . . . . . . . . . . . . . . . . . . . . . . . . . . . . . . . . . . . . . . . . . . . . . . . . . . .96Absence of service agreements . . . . . . . . . . . . . . . . . . . . . . . . . . . . . . . . . . . . . . . . . . . . . . . . . . . . . . . . . . . . . . . . . . . . . . . . . . . . . . . . . . . . . . . . . . . . . . . . . . . . . . . . . . . . . . .96
16
16.1. Description of the Role and Practices of the Board of Directors
16.1.1. Role and PracticesThe Board of Directors’ practices are governed by an internal charter that was adopted on May 21, 2003 by the Board of Directors. This charter is periodically updated (it was last updated on February 18, 2009). The four specialized Committees also have their own charters describing their particular duties, responsibilities and practices.
A Directors’ Charter, which was adopted on May 21, 2003 (and distributed to each director at the start of his or her term of offi ce, along with the Board’s internal charter) and updated on December 9, 2008, outlines the rights and responsibilities of the Company’s directors. Each director must undertake to exercise his or her independent analysis, judgment and action, and to actively participate in the Board’s work. Each director must inform the Board of any confl icts of interest and must clearly express, where applicable, his or her opposition to any matter under consideration by the Board.
In addition, the Charter stipulates that the directors are subject to the Group’s Rules of Good Conduct relating to the communication and use of privileged information and that they are required to refrain from trading in any of the Company’s securities whenever such directors are in possession of material, non-public informa-
tion, as well as during the period beginning three weeks prior to the public announcement of consolidated annual and half-year results and two weeks prior to the public announcement of the consolidated results for the fi rst and third quarters and ending at the close of the second trading day on Euronext Paris following such public announcement, or later in the event the Company communicates at a later date.
Each director is required to notify the Company and the AMF of any transactions in the Company’s securities, which are carried out either directly or indirectly and either on his or her behalf or on behalf of a third party.
In accordance with the recommendations of the AFEP-MEDEF Code, the Directors’ Charter provides that each director will be provided with training sessions on the Company’s specifi cities, its activities and its business sectors, to the extent he or she considers it necessary.
Excerpt from the Board of Directors’ internal charter, as updated by the Board of Directors on February 18, 2009:
The Board determines the direction of the Company’s activities and oversees its implementation. Subject to the powers expressly assigned to the shareholders’ meetings, and within the scope of the corporate purpose, it shall take up any and all issues affecting

090 2009 Reference Document
Operation of Administrative and Management Bodies
16.1. Description of the Role and Practices of the Board of Directors16
the Company’s proper operation and shall decide in its meetings any issues concerning it.
The non-exhaustive list of its duties is as follows:
appoint the Chairman, the Chief Executive Offi cer and the ■
executive vice presidents (directeurs généraux délégués);
defi ne Technip’s strategy with the assistance of the Strategic ■
Committee;
discuss, with the assistance of the Strategic Committee, major ■
transactions considered by the Group, determine the conditions subject to which such transactions will be undertaken and provide its prior approval to signifi cant transactions that depart from the strategy announced by the Company;
remain informed of all important events concerning Technip’s ■
business, in particular, investments and divestitures in an amount of over 3% of shareholders’ equity;
remain regularly informed of the fi nancial position, the treasury ■
position and the Company’s commitments;
proceed with checks and verifi cations that are deemed appro- ■
priate and ensure, in particular:with the assistance of the Audit Committee, that internal -control entities are functioning properly and that the Statutory Auditors are carrying out their work in a satisfactory manner,that the specialized committees it has created are functioning -properly;
monitor the quality of disclosure provided to shareholders ■
and to the fi nancial markets through the fi nancial statements that it examines and the annual report or in case of major transactions;
convene and set the agenda for shareholders’ meetings; ■
establish, on an annual basis, upon Nominations and ■
Remunerations Committee’s proposal the list of directors consi-dered “independent” pursuant to corporate governance criteria, taking into consideration the standards and recommendations applicable in France, as well as, where applicable, in the markets where the Company’s securities are traded; and
authorize regulated agreements and security interests, guaran- ■
tees and warranties given by the Company.
The Board of Directors meets at least four times per year, or more frequently as may be required by the circumstances.
Directors may attend the Board of Directors’ meetings physically, or be represented by proxy or, in all cases legally authorized, participate by videoconference or other telecommunications means that meets the technical qualifi cations provided for by applicable regulations.
The Board of Directors may establish specialized committees and determine their composition and responsibilities. Committees that are established will exercise their activities under the responsibility of the Board of Directors.
The Board of Directors determines the terms of payment of directors’ fees ( jetons de présence) and may allocate additional directors’ fees to directors who are members of Board commit-tees, subject to the total amount approved by the shareholders’ meeting.
The Board of Directors formally evaluates, at intervals of no more than three years, its operating policies. In addition, it holds an annual discussion on its operations.
16.1.2. The Board of Directors’ work in 2009
The Board of Directors met nine times during the 2009 fi nancial year. The attendance rate for all directors was 92%. With the exception of the Board meeting held on October 24 and 25, 2009 in a two-day Strategic Seminar, the average duration of the Board of Directors’ meetings was approximately four hours.
Members of the Board of Directors
Attendance rate to the meetings of the Board of Directors in 2009*
Thierry PILENKO 100%
Olivier APPERT 89%
Pascal COLOMBANI 89%
Jacques DEYIRMENDJIAN** 100%
Germaine GIBARA 89%
Gérard HAUSER*** 100%
Marwan LAHOUD*** 83%
Jean-Pierre LAMOURE 78%
Daniel LEBÈGUE 100%
Roger MILGRIM** 100%
John C.G. O’LEARY 100%
Joseph RINALDI*** 100%
Rolf-Erik ROLFSEN** 67%
Bruno WEYMULLER 89%
* The attendance rate is calculated on a prorata basis taking into account the meetings when the directors were in offi ce.
** In offi ce until the General Meeting held on April 30, 2009.
*** In offi ce since the General Meeting held on April 30, 2009.
In accordance with the recommendations made in the AFEP-MEDEF Code, the Board of Directors’ internal charter provides that directors who are external to the Company (neither executive directors nor employees) meet periodically, to the extent they consider it necessary, without the only one “in-house” director of the Company, i.e. Thierry Pilenko. External directors thus meet at least once a year in order to evaluate notably the performance of the Chairman and Chief Executive Offi cer.
Directors receive all of the information that may be useful to the exercise of their duties, depending on the agenda, prior to each Board meeting. For these purposes, the Company complies with the rule it established, according to which documents that will be examined in a Board meeting are provided the week before the meeting.
Minutes of each Board meeting are among the documents sent to directors prior to the subsequent Board meeting, and are approved at the beginning of such meeting.
After examining the reports of the Audit Committee, the Strategic Committee, the Nominations and Remunerations Committee and the Ethics and Governance Committee regarding the issues within the scope of their missions, the matters on which the Board of Directors worked in 2009 included, in particular, the following:
Financial and accounting matters: ■
review of the annual accounts and Consolidated Financial -Statements for the 2008 financial year, the half-year Consolidated Financial Statements and quarterly information for 2009, upon the Audit Committee’s recommendation and the Statutory Auditors’ observations;

0912009 Reference Document
Operation of Administrative and Management Bodies
16.2. Company’s Management 16
review of the press release on the fi nancial results for the -period examined;approval procedure for the engagements carried out by the -Statutory Auditors;review of the half-year fi nancial report and interim fi nancial -information;assessment of the provisional management accounts. -
Preparation of the Annual Shareholders’ Meeting: ■
Notice of the meeting, agenda and draft resolutions; -Reference Document including the Board report. -
Decisions, in particular, regarding: ■
the list of independent directors; -the distribution of directors’ fees; -the implementation of the AFEP-MEDEF Code; -
the update of the internal charters of the Audit Committee, the -Strategic Committee and the Nominations and Remunerations Committee;the 2010 budget; -the approval of a share subscription plan and the grant of the -fi rst tranche of this plan; the approval of a performance share plan and the grant of two tranches of this plan; the grant of a third tranche of the 2008 performance share Plan;finalization of the share capital increase resulting from -exercises of share subscription options.
Review, in particular, of: ■
the Group’s strategic policy over a two-day seminar; -information on the Group’s activities; -treasury forecasts; -the remuneration of the Chairman of the Board and the Chief -Executive Offi cer and of his objectives for 2009.
16.2. Company’s Management
16.2.1. The Chairman and Chief Executive Offi cer
The Board of Directors gave to the Chairman and Chief Executive Offi cer the most extensive powers to act in all circumstances in the Company’s name, with the possibility of delegating these
powers in specific areas. The Chairman and Chief Executive Offi cer exercises his powers subject to the corporate purpose, the provisions of the internal charter of the Board of Directors and the powers expressly assigned by law to the shareholders’ meetings and the Board of Directors.
He represents the Company in its relations with third parties.
16.2.2. The Executive Committee (EXCOM)The Executive Committee assists the Chairman and Chief Executive Offi cer in his management duties.
At February 28, 2010, the members of the Executive Committee were as follows:
Member Title Date of appointment to the EXCOM
Thierry PILENKO Chairman and CEO 01/15/2007
Bernard DI TULLIO Chief Operating Offi cer (COO) 10/03/2005
John HARRISON General Counsel 12/03/2007
Dominique DE SORAS President, Subsea Division 01/01/2008
Nello UCCELLETTI Senior Vice President, Region B 01/01/2008
Julian WALDRON Chief Financial Offi cer (CFO) 10/28/2008
Thierry PARMENTIER Group Human Resources Director 06/22/2009
The Executive Committee prepares decisions for submission to Technip’s Board of Directors, concerning, in particular, the approval of the fi nancial statements, the determination of objectives and budgets, strategic orientations and the acquisitions or divestitures of assets and companies. It reviews the progress of major contracts
and important investment decisions and also examines plans and recommendations relating to internal auditing, IT and telecom-munications, human resources and asset management issues.
It met 33 times in 2009.

092 2009 Reference Document
Operation of Administrative and Management Bodies
16.3. Role and Practices of the Committees of the Board of Directors16
16.3.1. Audit CommitteeThe Board of Directors adopted the Audit Committee’s internal charter on December 17, 2003 and updated it on February 18, 2009.
PurposeThe Audit Committee’s duty, in accordance to the law, is to enable the Board of Directors to ensure the quality of internal controls and the integrity of the disclosure made to the Company’s shareholders and to the fi nancial markets.
The Audit Committee ensures the follow-up of issues regarding the preparation and control of accounting and fi nancial information and, to this end, is mainly responsible for:
monitoring the preparation process of fi nancial information; ■
monitoring the effectiveness of internal control and risk mana- ■
gement systems, in particular:evaluating internal control procedures as well as any measures -adopted to correct signifi cant problems encountered,reviewing the scope of work of internal and external auditors, -evaluating the relevance of risk analysis procedures; -
monitoring the Statutory Auditors’ legal verifi cation of the ■
annual accounts and the Consolidated Financial Statements, especially:
analyzing the assumptions used in the closing of the accounts -and reviewing the Company’s fi nancial statements and the consolidated annual and interim fi nancial statements or infor-mation prior to the Board of Directors’ review by remaining informed of the Company’s fi nancial situation, liquidity and commitments,evaluating the relevance of the adopted accounting principles -and methods in conjunction with the Statutory Auditors,at some time between the end of the fi nancial year and the -date on which the Audit Committee reviews a draft of the fi nancial statements, discussing the relevance of the adopted accounting principles and methods, the effectiveness of accounting control procedures and any other relevant matters with Technip’s Chairman and Chief Financial Offi cer;
recommending the appointment and compensation of the ■
Statutory Auditors to the shareholders’ meeting;
ensuring the independence of the Statutory Auditors, in parti- ■
cular, by:recommending procedures to be followed when engaging -the Statutory Auditors for purposes other than the auditing of the fi nancial statements in order to guarantee the inde-pendence of the auditing provided by the Statutory Auditors, in accordance with rules, regulations and recommendations applicable to Technip, and ensuring that such procedures are appropriately followed,authorizing all engagements of the Statutory Auditors for -purposes other than in connection with the auditing of the fi nancial statements;
reviewing the conditions applicable to the use of derivative ■
products;
remaining informed of signifi cant legal proceedings; ■
examining the procedures required to be implemented regarding ■
the receipt, retention and treatment of complaints regarding accounting, internal accounting controls or auditing matters, as well as documents sent anonymously and confi dentially by employees raising concerns regarding questionable accounting or auditing matters; and
generally advising and providing all appropriate recommenda- ■
tions on the above issues.
Operating proceduresThe Audit Committee may interview the Company’s Chairman and Chief Executive Offi cer and any operational or functional business heads in order to carry out its duties. In particular, the Committee may interview persons involved in the preparation or control of the accounts (Chief Financial Offi cer and main managers of the Financial Division, the Audit Director, General Counsel).
The Audit Committee also interviews the Statutory Auditors, and may do so outside the presence of Company representatives.
Directors who are not members of the Committee can freely attend the Committee’s meetings. This participation does not entitle them to receive directors’ fees in this respect.
Work reportThe Audit Committee’s Chairman presents a written report regar-ding the Committee’s work to the Board of Directors providing the Board with full information.
If, over the course of exercising its duties, the Committee detects a signifi cant risk that appears as though it has not been adequately addressed, the Committee’s Chairman must immediately report it to the Chairman and Chief Executive Offi cer.
The Committee presents an annual evaluation of its operating policies, in accordance with the requirements of its internal charter, and proposes improvements to its practices.
The Committee’s internal charter requires it to meet at least four times per year, in particular, to examine the annual Consolidated Financial Statements and quarterly fi nancial information.
The Committee met fi ve times during the 2009 fi nancial year with an attendance rate of 100%.
The Audit Committee’s work in 2009 mainly focused on the following points:
review of the annual fi nancial statements for 2008 and the ■
fi nancial information for the fourth quarter of 2008;
specifi c contracts follow up; ■
review of fi nancial information for the fi rst quarter of 2009; ■
review of fi nancial information for the fi rst quarter of 2009 ■
and of the Consolidated Financial Statements for the fi rst half of 2009;
Statutory Auditors’ fees; ■
the 2009 audit budget; ■
review of fi nancial information for the third quarter of 2009. ■
16.3. Role and Practices of the Committees of the Board of Directors
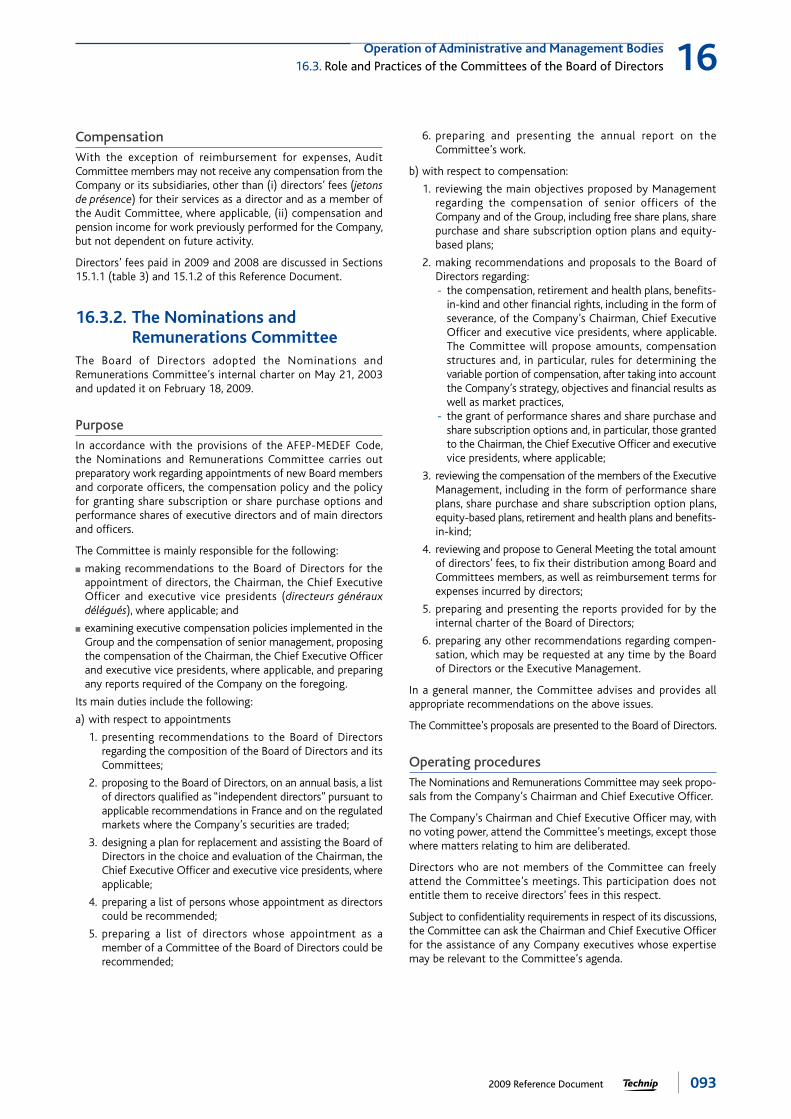
0932009 Reference Document
Operation of Administrative and Management Bodies
16.3. Role and Practices of the Committees of the Board of Directors 16
CompensationWith the exception of reimbursement for expenses, Audit Committee members may not receive any compensation from the Company or its subsidiaries, other than (i) directors’ fees (jetons de présence) for their services as a director and as a member of the Audit Committee, where applicable, (ii) compensation and pension income for work previously performed for the Company, but not dependent on future activity.
Directors’ fees paid in 2009 and 2008 are discussed in Sections 15.1.1 (table 3) and 15.1.2 of this Reference Document.
16.3.2. The Nominations and Remunerations Committee
The Board of Directors adopted the Nominations and Remunerations Committee’s internal charter on May 21, 2003 and updated it on February 18, 2009.
PurposeIn accordance with the provisions of the AFEP-MEDEF Code, the Nominations and Remunerations Committee carries out preparatory work regarding appointments of new Board members and corporate offi cers, the compensation policy and the policy for granting share subscription or share purchase options and performance shares of executive directors and of main directors and offi cers.
The Committee is mainly responsible for the following:
making recommendations to the Board of Directors for the ■
appointment of directors, the Chairman, the Chief Executive Officer and executive vice presidents (directeurs généraux délégués), where applicable; and
examining executive compensation policies implemented in the ■
Group and the compensation of senior management, proposing the compensation of the Chairman, the Chief Executive Offi cer and executive vice presidents, where applicable, and preparing any reports required of the Company on the foregoing.
Its main duties include the following:
a) with respect to appointments
1. presenting recommendations to the Board of Directors regarding the composition of the Board of Directors and its Committees;
2. proposing to the Board of Directors, on an annual basis, a list of directors qualifi ed as “independent directors” pursuant to applicable recommendations in France and on the regulated markets where the Company’s securities are traded;
3. designing a plan for replacement and assisting the Board of Directors in the choice and evaluation of the Chairman, the Chief Executive Offi cer and executive vice presidents, where applicable;
4. preparing a list of persons whose appointment as directors could be recommended;
5. preparing a list of directors whose appointment as a member of a Committee of the Board of Directors could be recommended;
6. preparing and presenting the annual report on the Committee’s work.
b) with respect to compensation:
1. reviewing the main objectives proposed by Management regarding the compensation of senior officers of the Company and of the Group, including free share plans, share purchase and share subscription option plans and equity-based plans;
2. making recommendations and proposals to the Board of Directors regarding:
the compensation, retirement and health plans, benefi ts- -in-kind and other fi nancial rights, including in the form of severance, of the Company’s Chairman, Chief Executive Offi cer and executive vice presidents, where applicable. The Committee will propose amounts, compensation structures and, in particular, rules for determining the variable portion of compensation, after taking into account the Company’s strategy, objectives and fi nancial results as well as market practices,the grant of performance shares and share purchase and -share subscription options and, in particular, those granted to the Chairman, the Chief Executive Offi cer and executive vice presidents, where applicable;
3. reviewing the compensation of the members of the Executive Management, including in the form of performance share plans, share purchase and share subscription option plans, equity-based plans, retirement and health plans and benefi ts-in-kind;
4. reviewing and propose to General Meeting the total amount of directors’ fees, to fi x their distribution among Board and Committees members, as well as reimbursement terms for expenses incurred by directors;
5. preparing and presenting the reports provided for by the internal charter of the Board of Directors;
6. preparing any other recommendations regarding compen-sation, which may be requested at any time by the Board of Directors or the Executive Management.
In a general manner, the Committee advises and provides all appropriate recommendations on the above issues.
The Committee’s proposals are presented to the Board of Directors.
Operating proceduresThe Nominations and Remunerations Committee may seek propo-sals from the Company’s Chairman and Chief Executive Offi cer.
The Company’s Chairman and Chief Executive Offi cer may, with no voting power, attend the Committee’s meetings, except those where matters relating to him are deliberated.
Directors who are not members of the Committee can freely attend the Committee’s meetings. This participation does not entitle them to receive directors’ fees in this respect.
Subject to confi dentiality requirements in respect of its discussions, the Committee can ask the Chairman and Chief Executive Offi cer for the assistance of any Company executives whose expertise may be relevant to the Committee’s agenda.

094 2009 Reference Document
Operation of Administrative and Management Bodies
16.3. Role and Practices of the Committees of the Board of Directors 16
Work reportThe Committee’s Chairman presents a written report regarding the Committee’s work to the Board of Directors providing the Board with full information.
The Committee examines a draft of the Company’s report on executive compensation as well as any reports on all matters within its scope of duties as required by applicable regulations.
The Committee presents an annual evaluation of its operating policies, in accordance with the requirements of its internal charter, and proposes improvements to its practices.
The Committee’s internal charter requires it to meet at least twice per year.
The Committee met six times during the 2009 fi nancial year with an attendance rate of 92%.
The Nominations and Remunerations Committee’s work in 2009 mainly focused on the following points:
with respect to appointments: ■
proposing to the Board of Directors a list of directors qualifi ed -as “independent directors” in accordance with the rules and recommendations applicable in France and on the regulated markets where the Company’s securities are traded; andevaluating the operating practices of the Board of Directors, -taking into account the Board’s composition and the terms of offi ces to be renewed in 2009;
with respect to compensation: ■
reviewing a draft of the Company’s report on executive -compensation for the annual report,reviewing the amount of directors’ fees ( - jetons de présence) for 2009 and making a recommendation as to their distribution,study on the competitivity of compensation and examining -its conclusions,making a recommendation regarding the compensation of -the Chairman and Chief Executive Offi cer to the Board of Directors,proposing to the Board of Directors severance payments -condition in the event of the Chairman and Chief Executive Offi cer’s departure,reviewing the compensation of the Group’s Executive -Committee members (variable portion for 2008, base compensation for 2009 and criteria for determining the variable portion for 2009),examining a proposed grant of a new tranche of stock -subscription options,examining a proposed grant of performance shares, -reviewing changes in the supplementary retirement plan for -executive offi cers and the introduction of a supplementary retirement plan for Executive Committee members; andexamination of changes in the Group’s bonus criteria. -
CompensationMembers of the Nominations and Remunerations Committee may not receive from the Company or its subsidiaries, with the exception of reimbursement for expenses, any compensation other than (i) directors’ fees (jetons de présence) owed in exchange for their services as a director and a member of the committee, and, where applicable, (ii) retirement and pension income for work previously performed for the Company, but not dependent on future activity.
Directors’ fees paid in 2009 and 2008 are mentioned in Sections 15.1.1 (table 3) and 15.1.2 of this Reference Document.
16.3.3. The Strategic CommitteeThe Board of Directors adopted the internal charter of the Strategic Committee on May 21, 2003 and updated it on February 18, 2009.
PurposeThe Strategic Committee assists the Board of Directors in exami-ning and making decisions regarding important transactions involving the Group’s main strategic orientations.
In order to assist the Company’s Board of Directors, the Strategic Committee’s main duties are to:
review the Group’s global strategy, as proposed by the ■
Company’s Chairman and Chief Executive Offi cer;
review the Group’s capital expenditures and investment budget; ■
examine any major asset acquisitions (and associated fi nancing) ■
or divestitures; and
review any transactions proposed by the Company’s Chairman ■
and Chief Executive Officer, which may present a serious business risk.
The Committee’s proposals are presented to the Board of Directors.
Operating proceduresThe Strategic Committee may seek proposals from the Company’s Chairman and Chief Executive Offi cer. The Company’s Chairman and Chief Executive Offi cer attends every meeting.
Directors who are not members of the Committee can freely attend the Committee’s meetings. This participation does not entitle them to receive directors’ fees in this respect.
The Committee can ask the Chairman and Chief Executive Offi cer for the assistance of any Company executives whose expertise may be relevant to the Committee’s agenda.
Work reportThe Committee’s Chairman presents a written report regarding the Committee’s work to the Board of Directors providing the Board with full information.
The Committee presents an annual evaluation of its operating policies, in accordance with the requirements of its internal charter, and proposes improvements to its practices.
The Committee’s internal charter requires it to meet at least twice per year.
The Committee met three times during the 2009 fi nancial year with an attendance rate of 100%.
The Strategic Committee’s work in 2009 mainly focused on the following topics:
the Group’s external growth policy; ■
the review of proposed acquisitions of smaller companies; ■
Technip’s business development in markets with high-growth ■
potential;
the 2010 budget and the investment plan. ■
Furthermore, the Strategic Committee determined the overall agenda and objectives of the Strategic Seminar of the Board of Directors, which took place on October 24 and 25, 2009, with all Board members to discuss changes in Technip’s markets, its positions as well as the main strategic issues facing the Group.

0952009 Reference Document
Operation of Administrative and Management Bodies
16.3. Role and Practices of the Committees of the Board of Directors 16
CompensationWith the exception of reimbursement for expenses, Strategic Committee members may not receive any compensation from the Company or its subsidiaries, other than (i) directors’ fees (jetons de présence) for their services as a director and as a member of the Strategic Committee, where applicable, (ii) compensation and pension income for work previously performed for the Company, but not dependent on future activity.
Directors’ fees paid in 2009 and 2008 are discussed in Sections 15.1.1 (table 3) and 15.1.2 of this Reference Document.
16.3.4. The Ethics and Governance Committee
The Ethics and Governance Committee’s internal charter was adopted by the Board of Directors on December 9, 2008. It has not been updated since then.
PurposeThe Committee assists the Board of Directors in promoting best practices regarding governance and ethics within the Group.
The Committee’s main duties include:
developing and recommending to the Board of Directors ■
French and international best practices regarding corporate governance applicable to the Company and to monitor their implementation;
monitoring compliance with ethics principles and discussing all ■
matters that the Board of Directors (or its Chairman) may send to it for examination;
proposing evaluation methods for Board practices and monito- ■
ring their implementation based on the following:the Board of Directors must include, on an annual basis, a -discussion on its operating procedures in its agenda,a formal evaluation must be carried out at least once every -three years.
Operating proceduresDirectors who are not members of the Committee can freely attend the Committee’s meetings. This participation does not entitle them to receive directors’ fees in this respect.
The Committee can ask the Chairman and Chief Executive Offi cer for the assistance of any Company executives whose expertise may be relevant to the Committee’s agenda.
Work reportThe Committee’s Chairman presents a written report regarding the Committee’s work to the Board of Directors providing the Board with full information.
The Committee presents an annual evaluation of its operating policies, in accordance with the requirements of its internal charter, and proposes improvements to its practices.
The Committee’s internal charter requires it to meet at least twice per year.
The Committee met three times during the 2009 fi nancial year with an attendance rate of 100%.
The Ethics and Governance Committee’s work in 2009 mainly focused on the following topics:
progress of discussions with the US authorities regarding TSKJ ■
issue; and
the organization implemented within the Group regarding ■
compliance.
CompensationWith the exception of reimbursement for expenses, Ethics and Governance Committee members may not receive any compensa-tion from the Company or its subsidiaries, other than (i) directors’ fees ( jetons de présence) for their services as a director and as a member of the Ethics and Governance Committee, where applicable, (ii) compensation and pension income for work previously performed for the Company, but not dependent on future activity.
Directors’ fees paid in 2009 and 2008 are discussed in Sections 15.1.1 (table 3) and 15.1.2 of this Reference Document.

096 2009 Reference Document
Operation of Administrative and Management Bodies
16.4. Corporate Governance: Evaluation of the Board of Directors and of the Board’s Committees16
16.4. Corporate Governance: Evaluation of the Boardof Directors and of the Board’s Committees
16.5. Contracts between the Board Members and the Company or one of the Group’s company
Absence of service agreementsNone of the members of the Board of Directors or the Chairman and Chief Executive Offi cer has a service agreement in place with the Company or one of its subsidiaries, which provides for benefi ts to be granted under such an agreement.
In accordance with the provisions of its internal charter and with the provisions of the AFEP-MEDEF Code, the Board of Directors formally evaluates, at intervals of no more than three years, its operating policies, in order to:
review its operating methods; ■
verify that important questions are appropriately prepared and ■
discussed;
assess the contribution of each director to the Board’s work ■
through his or her expertise and involvement in discussions.
The purpose of this evaluation is to ensure adherence to the Board’s operating policies and to identify ways to improve its performance and effectiveness.
The Board of Directors implemented in 2009 the measures intended to improve its operation, as listed on December 9, 2008 following the in-depth evaluation carried out in 2008.
The main consequences of these measures focused on:
the appointment of three new Board members on April 30, ■
2009;
a strategic seminar for the Board of Directors which took place ■
in Doha (Qatar) on October 24 and 25, 2009;
the updates of the internal charters of the Board of Directors’ ■
Committees on February 18, 2009.

0972009 Reference Document
17
17.1. Workforce . . . . . . . . . . . . . . . . . . . . . . . . . . . . . . . . . . . . . . . . . . . . . . . . . . . . . . . . . . . . . . . . . . . . . . . . . . . . . . . . . . . . . . . . . . . . . . . . . . . . . . . . . . . . . . . . . . . . . . . . . . . . . . . . . . . . . . . .9717.1.1. Evolution and Development . . . . . . . . . . . . . . . . . . . . . . . . . . . . . . . . . . . . . . . . . . . . . . . . . . . . . . . . . . . . . . . . . . . . . . . . . . . . . . . . . . . . . . . . . . . . . . . . . . . . . . . . . . . . . . . . . . . .9717.1.2. Organization of working hours–part-time . . . . . . . . . . . . . . . . . . . . . . . . . . . . . . . . . . . . . . . . . . . . . . . . . . . . . . . . . . . . . . . . . . . . . . . . . . . . . . . . . . . . . . . . . . . . .10017.1.3. Training of employees on the payroll . . . . . . . . . . . . . . . . . . . . . . . . . . . . . . . . . . . . . . . . . . . . . . . . . . . . . . . . . . . . . . . . . . . . . . . . . . . . . . . . . . . . . . . . . . . . . . . . . . . .10017.1.4. Other social information . . . . . . . . . . . . . . . . . . . . . . . . . . . . . . . . . . . . . . . . . . . . . . . . . . . . . . . . . . . . . . . . . . . . . . . . . . . . . . . . . . . . . . . . . . . . . . . . . . . . . . . . . . . . . . . . . . . . . . .101
17.2. Participating interests and share subscription or purchase options held by members of the Board of Directors and other corporate offi cers (mandataires sociaux) . . . . . . . . . . . . . . . . . . . . . . . . . . . . . . . . . . . . . . . . . . . . . . . . . . . . . . . . . . . . . . . . . . . . . . . . . . . . . . . . . . . . . . . . . . . . . . . . . . . . . . . . . . . . . . . 103
17.2.1. Summary statement of the transactions listed in article L. 621-18-2 of the French Monetary and Financial Code during the 2009 fi nancial year . . . . . . . . . . . . . . . . . . . . . . . . . . . . . . . . . . . . . . . . .103
17.2.2. Company share subscription or share purchase options . . . . . . . . . . . . . . . . . . . . . . . . . . . . . . . . . . . . . . . . . . . . . . . . . . . . . . . . . . . . . . . . . . . . . . . .10417.2.3. Awards of performance shares pursuant to Articles L. 225-197-1 et seq.
of the French Commercial Code . . . . . . . . . . . . . . . . . . . . . . . . . . . . . . . . . . . . . . . . . . . . . . . . . . . . . . . . . . . . . . . . . . . . . . . . . . . . . . . . . . . . . . . . . . . . . . . . . . . . . . . . . . . .106
17.3. Arrangements for involving the employees in the capital of the Company . . . . . . . . . . . 10817.3.1. Profi t sharing . . . . . . . . . . . . . . . . . . . . . . . . . . . . . . . . . . . . . . . . . . . . . . . . . . . . . . . . . . . . . . . . . . . . . . . . . . . . . . . . . . . . . . . . . . . . . . . . . . . . . . . . . . . . . . . . . . . . . . . . . . . . . . . . . . . . . . . . .10817.3.2. Incentive profi t sharing . . . . . . . . . . . . . . . . . . . . . . . . . . . . . . . . . . . . . . . . . . . . . . . . . . . . . . . . . . . . . . . . . . . . . . . . . . . . . . . . . . . . . . . . . . . . . . . . . . . . . . . . . . . . . . . . . . . . . . . . . .10817.3.3. Group Saving Plan–Employee Share Ownership. . . . . . . . . . . . . . . . . . . . . . . . . . . . . . . . . . . . . . . . . . . . . . . . . . . . . . . . . . . . . . . . . . . . . . . . . . . . . . . . . . . .10817.3.4. Group Pension Savings Plan. . . . . . . . . . . . . . . . . . . . . . . . . . . . . . . . . . . . . . . . . . . . . . . . . . . . . . . . . . . . . . . . . . . . . . . . . . . . . . . . . . . . . . . . . . . . . . . . . . . . . . . . . . . . . . . . . . .109
Employees
17.1. Workforce
17.1.1. Evolution and Development
Breakdown of employees by geographic zone 12/31/2009 12/31/2008
Europe 10,599 10,243
Americas 4,906 5,125
Asia Pacifi c 5,006 4,930
Middle East 1,484 1,738
Africa 795 548
Russia & Central Asia 159 169
Technip Employees on payroll and contracted workers in plants, yard and fl eet 22,949 22,753
Other contracted workforce 2,111 3,152
Total 25,060 25,905
At the end of 2009, the Group’s workforce was approximately 23,000 people. This fi gure includes permanent employees on the payroll, as well as personnel contracted from outside the Group to work in various industrial sites, such as the 17-vessel fl eet and the two vessels under construction, six plants throughout the world, and the Pori yard in Finland. During the fi rst half of 2009 in particular, outsourcing decreased compared to 2008, due both to the slowdown of business in certain Regions of the Group and certain segments (umbilicals), and to the fact that several projects were completed.
Breakdown of employees by category 12/31/2009 12/31/2008
Employees on payroll: 20,216 20,578
Permanent contracts 17,948 18,065
Temporary (fi xed-term) contracts 2,268 2,513
Contracted employees: 4,844 5,327
Contracted workers in plants, yard and fl eet 2,733 2,175
Other contracted workforce 2,111 3,152
Total 25,060 25,905

098 2009 Reference Document
Employees
17.1. Workforce17
Throughout 2009, given the highly turbulent economic climate that made it practically impossible to predict future trends, the Group adopted a proactive approach in order to keep its perma-nent employees and limit recourse to subcontracted or temporary workers.
The number of permanent employees within the Group was generally stable over the course of the year. The proportion of temporary employees, on the other hand, has continued to decline, decreasing from 12% to 11% of the workforce on payroll. In France, only 2.6% of the workforce on the payroll are tempo-rary employees.
Contracted personnel working at the Group’s industrial sites remain essential to the activity of the Group in all segments (Subsea, Offshore, Onshore). These specifi c competencies are mainly present in the fl eet in the United Kingdom (for performing installation work at sea), in the fl exible and umbilical plants in France, the United States and the United Kingdom, and at the Pori yard in Finland.
In 2009, the population working in industrial sites increased by 25% primarily due to the Group's need to satisfy the extra workload resulting from the conversion of the Apache II vessel in Finland.
Other contracted personnel strengthen Technip's engineering centers when there is a spike in workload. This workforce may vary signifi cantly depending on the Group’s needs and the projects in hand. In 2009, the number of subcontractors and agency personnel within the Group fell signifi cantly (down by approximately 1,000).
Headcount Structure (December 31, 2009)
Activities(% of total headcount)
73% - Engineering Centers
11% - Fleet & spoolbase
11% - Plants
5% - Yard
Size of entities(% of total headcount)
60% - 9 entities >1,000 p
10% - 32 entities <300 p
30% - 16 entities >300 and <1,000 p
Source Technip
Breakdown of expatriates by geographic origin 12/31/2009 12/31/2008
Europe 670 637
Asia Pacifi c 310 268
Middle East 195 291
Americas 92 81
Africa 7 7
Russia & Central Asia 0 0
Total 1,274 1,284
Although the number of expatriates was generally stable over 2009 (6.3% of employees on the payroll), a signifi cant increase was recorded in the number of expatriates assigned to other companies of the Group as part of job mobility or to work on specifi c projects (up 27%, excluding construction sites).
At the same time, the number of expatriates at construction sites decreased (down 13%) in 2009 due to the completion of projects during the year.
The Group’s expatriated employees represent 55 different natio-nalities, and work in 67% of its companies.
There are many initiatives aimed at making it easier for Group employees to relocate internationally. For example, an agreement was signed by Technip and international partner groups to facili-tate mobility for the partners of expatriated employees.
The development of internal mobility is one of the fi ve main projects launched in 2009 within the framework of “HR without borders”, a program that is part of the three-year strategic plan.
It was essential for the Group to improve mobility in order to ensure a better match between human resources and business requirements, to contribute to the professional development of employees in terms of skills and careers, to extend global exper-tise, and to strengthen the feeling of belonging to the Group.
To this end, a new internal recruitment website went live in early 2010. Its objectives are to rapidly fi ll vacant posts within the Group, while offering employees easy access to any opportunities available worldwide, both within and outside of their business segment, job or region.
Breakdown by gender 12/31/2009 12/31/2008
Executive Committee 7 8
Women 0% 13%
Men 100% 87%
Managers 2,111 3,290
Women 14% 15%
Men 86% 85%
Others 18,098 17,280
Women 26% 27%
Men 74% 73%
Total 20,216 20,578
Women 25% 25%
Men 75% 75%

0992009 Reference Document
Employees
17.1. Workforce 17
In accordance with the principles set forth in the Group’s Social Charter (1), the Diversity Manager, appointed in 2008, is respon-sible for developing and implementing initiatives to promote all aspects of diversity: gender equality, internationalization, equal opportunities for all and integration of disabled individuals.
Women comprise 25% of the employees on payroll and 30% of employees under age 30.
The number of managers reported in 2009 corresponds to the number of employees exercising a supervisory role and within the chain of command, in accordance with the implementation of the “Human Resources without borders” program (see details at Section 17.1.3 Training–Annual performance reviews of this Reference Document).
101 different nationalities are represented in the Group (nine more than last year) and the Group accordingly boasts a huge cultural and ethnic diversity, which it is constantly promoting and sharing throughout its entities through the internationalization of its teams, intercultural programs, and international mobility.
Indians, Brazilians and Malaysians are among the most represented nationalities in the Group (i.e., close to one third of the employees).
EQUAL OPPORTUNITY ■
Employees over age 50 in the Group represented 21% of the payroll in 2009, in line with the previous year. Seniors represented 12.4% of employees recruited by the Group during 2009.
In France, the agreement on maintaining jobs for seniors was previously discussed with the unions on the basis of initiatives aimed at employees of 50 and over. These initiatives relate mainly to:
anticipating changes in business careers; ■
improving working conditions; ■
developing skills and qualifi cations, and providing access to ■
training;
managing the end of careers and the transition from employ- ■
ment to retirement;
transferring know-how and skills, and developing mentoring ■
procedures.
Disabled workers represent 1.2% of employees in Europe. This fi gure does not include subcontracted services. Arrangements have been put in place to make workstations more accessible.
The Group is involved in a number of practical initiatives to over-come the diffi culties that some underprivileged young people encounter in education, career guidance and fi nding employment. In 2006, Technip was one of the signatories of the French Ministry of Education’s charter, in which companies pledge to promote equal opportunity. Moreover, a system has been set up in which certain employees act as tutors to high school and college students from underprivileged suburbs.
Payroll employees: arrivals & departures 12/31/2009 12/31/2008
Arrivals 2,322 4,747
Permanent contracts 1,223 3,041
Temporary contracts (fi xed-term) 1,099 1,706
Departures 2,957 3,269
Permanent contracts 1,899 2,127
Temporary contracts (fi xed-term) 1,058 1,142
Economic lay-offs 522 15
Renewal rate of permanent positions(1) 0.64 1.43
(1) Start/termination of permanent positions.
53% of new recruits were hired under permanent contracts. In addition, 19% of the average number of people on fi xed-term contracts were converted to permanent contracts in 2009. Overall, 72% of recruitments were made on a permanent basis, to meet the Group’s requirements, retain talents and anticipate generation gaps.
Technip is adapting to its international growth and the shortage of qualifi ed personnel in certain highly-specialized disciplines in its traditional recruitment zones by recruiting in countries where human resources are most available:
Brazil, India and Malaysia are among the top ten countries ■
with the largest number of recruitments; (these three countries together accounted for 30% of total employee recruitments in the Group);
Poland recruited almost half of its employees in 2009, Angola ■
31% and Nigeria 22%.
The Group's companies based in emerging countries are 78% staffed by local personnel.
The number of people leaving the Group fell signifi cantly (down 9.5%) in 2009 and the rate of resignations fell particularly sharply, decreasing by half.
Despite the preventive measures taken in early 2009 to contain the fi nancial crisis (reduction in the number of new recruits during the fi rst half, limitation of temporary contracts and external staff and an increase in internal mobility), the global economic reces-sion seriously affected orders in certain countries and business sectors, causing the deferment of certain projects and a reduction in the workload.
Lay-offs (522) were unavoidable in the onshore business in the United States and Abu Dhabi and in the umbilicals plants in the United States and the United Kingdom.
In the United Kingdom, where unions are present, staff represen-tatives were consulted and involved in every step of this process, especially in matters concerning social support measures and voluntary departures.
(1) Technip’s Social Charter, established in June 2005, defi nes the Group’s objectives in Social Responsibility and the corresponding guidelines. It is applied to all the Group's entities,
which adapt it to local legislation, to any cultural differences and to the specifi c local environment in which they operate. It is issued to all personnel of the Group’s companies by the
local entities and can be viewed on Technip’s website (www.technip.com).

100 2009 Reference Document
Employees
17.1. Workforce17
17.1.2. Organization of working hours–part-time
Organisation of working hours 12/31/2009 12/31/2008
Full-time employees 19,731 20,152
Part-time employees 485 426
Employees working in teams 1,686 1,723
Overtime (France and Regional headquarters) 695,690 729,487
Part-time employees in 2009 accounted for 2.4% of the payroll (compared to 2.1% in 2008). The average working time for a part-time employee varied between 20 hours and 33 hours per week depending on the country.
The number of employees benefi ting from a fl exible work-time accounted for 67% of the payroll, including staff working at industrial sites whose activity is hardly compatible with a fl exible work-schedule.
Absenteeism 12/31/2009 12/31/2008
Total rate of absenteeism (sickness/accident) 1.84% 1.78%
Number of days lost due to strikes 143 0
The global rate of absenteeism was 1.84% in 2009, which was stable compared to 2008 taking into account the number of employees. Rates varied among countries and were higher in Finland. Concerning the H1N1 fl u pandemic, the Group developed
an action plan to deal with this risk. Ultimately, the pandemic did not affect the Group absenteeism rate.
Specifi c measures have been implemented to protect the health of all employees. They essentially comprise two parts.
The fi rst part is dedicated to informing employees:
health warnings are released to all regions in which Technip ■
operates. An intranet site covering medical information by country advises travelers and expatriates on what vaccinations they need and how to prevent disease before they leave their home country;
during the H1N1 fl u pandemic, regular information about the ■
extent and risks of the illness, the measures to be taken to limit its spread, and recommendations on vaccinations were issued and made available on the medical website;
each year, Technip organizes a Group-wide international ■
information and prevention day. In 2009, this day concerned eye-sight disorders and their prevention.
The second part defi nes the procedures:
mandatory standards throughout the Group require minimum ■
repatriation assistance coverage for everyone. A medical monitoring requirement for all Group expatriates throughout their service abroad was added to these standards, together with a requirement that their families be supplied with all the information they need to accurately assess whether or not they too should move abroad;
mandatory standards are also applied to all projects in regions ■
where malaria is endemic, requiring preventive steps to be taken by all employees that could potentially be exposed to the disease.
17.1.3. Training of employees on the payroll
Training of employees on payroll 12/31/2009 12/31/2008
Training hours 632,917 659,144
Technical training 244,565 310,071
Non technical training (including management, cross disciplines) 227,721 173,080
Health, Safety, Security 96,123 109,904
Languages 55,512 58,753
Human rights, Ethics and Technip Values awareness training 8,996 7,336
Number of employees on payroll who benefi ted from at least one training during the year 15,239 15,405
Women 3,999 3,823
Men 11,240 11,582
Average hours of training per payroll employee 31 32
In 2009, almost 633,000 hours were devoted to training, distributed locally among the entities of the Group and Technip University. 75% of employees on the payroll received training.
Although the number of training hours and the number of employees trained decreased slightly in 2009, the number of women benefi ting from training increased this year (+176 women). Also in 2009, a seven point increase was observed in the number of women promoted as compared to 2008, representing 28% of all promotions.
Among the training topics, there was a signifi cant increase in support and management training (+32%), and in the awareness of Group Values, human rights and ethics (+23%).
Training courses leading to an accredited or certifi ed qualifi cation were given to 923 employees.
Technip University, created in July 2008, is designed to improve know-how throughout the Group to help develop individual potential and facilitate the incorporation of new talents. The Group’s top management is involved in the training process to ensure that the programs are in line with the Group’s business initiatives. All Technip entities are involved and benefi t from the initiatives of Technip University.
All employees are eligible for training. Moreover, the members of the European Works Council (EWC) receive special training.

1012009 Reference Document
Employees
17.1. Workforce 17
Annual performance reviews 12/31/2009 12/31/2008
Percentage of employees assessed during the year 90% 77%
As part of the “HR without borders” program, a new performance assessment system has been implemented throughout the Group. This new system is based on an interactive annual performance review that is constructive for both the employee and the manager, as it enables both of them to:
assess and formalize the initiatives and successes of the ■
employee over the past year;
set performance objectives for the year to come; ■
address career and mobility desires; ■
identify any training requirements; ■
analyze personal performance overall for the purpose of a ■
general assessment.
The annual performance reviews are performed interactively through an information system that can be accessed by all Technip employees. The fi rst campaign began in November 2009 and ended at the end of February 2010. The same process will happen every year. 90% of eligible employees completed their performance review, compared to 77% last year with heteroge-neous systems.
This global performance assessment system replaces all the local assessment systems which were in place. The performance of all Technip employees is therefore assessed using the same method and the same tools, with the assistance of HR correspondents specially trained to support employees and give them the instruc-tions specifi c to their Region.
17.1.4. Other social information
17.1.4.1. Compensation and its evolution, social security costs
The Group’s payroll expenses increased from €827.5 million in 2007 to €901.5 million in 2008 and €945.7 million in 2009. The Group’s social security costs increased from €154.5 million in 2007 to €188 million in 2008 and €178.8 million in 2009.
17.1.4.2. Profi t-sharingIn 2009, Technip pursued its policy of linking its teams to the Company’s economic performance, particularly by the continuation of initiatives designed to recognize and reward indi-vidual performance (i.e., grants of performance shares and share purchase and share subscription options to top management and key employees as described in Section 17.2 in this Reference Document).
Profi t sharingIn thousands of Euros 31/12/2009 31/12/2008
Amounts allocated to incentive profi t sharing (France, Spain, Italy) 12,771 2,594
Amounts allocated to mandatory profi t sharing (France) 13,683 19,852
More detailed information on profi t sharing is in Section 17.3 of this Reference Document.
17.1.4.3. Labor relations and collective agreements
Collective or individual labor relations are governed by legislation, by collective agreements, by the Golden Book or by GOPS (Group Operating Principles and Standards) issued at Group level.
Information and dialogue processes are also in place, locally, at the European level (European Works Council–EWC) or for the whole Group.
The European Council (EWC), set up in 2005, includes 15 employee representatives of ten European countries and meets twice a year. The EWC has an Intranet site that has been accessible to employees in represented countries since 2008.
Since 2006, EWC members have received special training each year that emphasizes multicultural matters. This training will continue.
161 collective agreements were in force during 2009, an increase of 10% compared to 2008 due to 44 new agreements being signed during the year. These agreements relate mainly to compensation, working hours, training, working conditions, equal opportunity, and health and safety.
43% of all Technip employees are governed by mandatory collec-tive agreements. This fi gure rises to 59% when solely taking into account the employees who work at Group companies operating in countries that have signed ILO convention No. 98 (1).
Group processes for keeping employees informed are in place so that everyone receives the same level of information at the same time. The Group’s quarterly “Horizons” magazine is dedicated to all the men and women employed by the Group. It features reports on their specialist skills, promotes their successes and shares their enthusiasm.
The fortnightly “Technip in motion” e-newsletter, launched in April 2008, gives a “snapshoot” of the Group’s events and achie-vements throughout the world.
In addition to the “HR without borders” program described above (Training section), Technip, as part of its knowledge management initiative, uses a collaborative Intranet portal which makes it possible for communities of technical experts to share best practices, know-how and key documents. Instant messaging and teleconferencing are available to facilitate discussions.
17.1.4.4. Civic responsibilityIn every country in which it operates, Technip ensures that the local communities profi t from the positive economic and social effects that its activities generate, and participates in community efforts with the local populations.
Promoting employment and regional developmentBecoming a part of the local economy is a necessity, both to help clients with their local development projects, and to ensure the project’s success by involving the local population.
(1) ILO convention No. 98: Right to Organize and Collective Bargaining Convention.

102 2009 Reference Document
Employees
17.1. Workforce17
Technip uses local companies that have a good knowledge of the market and its specifi c characteristics. Technip often gains entry to new countries through partnerships, as witnessed in 2009 by the creation of the Al Khobar center in Saudi Arabia, a joint venture with the Saudi engineering company SaudConsult. Whenever possible, the Group approaches local or regional suppliers and subcontractors. In France for example, Technip has signed the Pacte PME (SME Pact) through which it can contribute to the growth of innovative small and medium-sized French companies.
Technip’s projects are major driving forces for local economies. Bringing them to fruition sometimes involves tens of thousands of individuals. The infrastructure for receiving and supplying goods to the project sites essentially provides a new economy that proves lucrative for many local companies, such as those in the merchant, hotel, transport or agriculture trades.
Technip plays a key role as a local employer, and always seeks to hire local people where possible. An example of this is the planned Asiafl ex Products fl exible pipeline and umbilical plant in Malaysia, which will employ only 10 expatriates out of its workforce of 300.
This local employment policy is based on the transfer of skills. Through cooperation between the Group’s centers, nine Angolan operators at the Dande base have, for example, been welcomed on to the Evanton assembly base in the United Kingdom to be trained in the specialist technologies and operating procedures in place there.
This approach also strengthens Technip’s multicultural dimension, with local talent helping to build an international group with a strong local presence.
Throughout the world, Technip promotes access to know-how and promotes the oil and gas sector in order to prepare the recruits of tomorrow. For example, in the United Kingdom, Technip partici-pated in an event aimed at promoting the hydrocarbon industry to high-school students.
Developing relations with local associations and populationsTechnip has been a member of the United Nation’s World Compact since 2003 and has also been certifi ed since 2004 in Italy under the SA 8000 standard, concernig the respect for human, children and workers’ rights.
The trust of the local community is important for any project’s success. The Group’s approach therefore involves listening, discus-sing and understanding expectations to better understand the local population and adapting its actions to respect their cultures and traditions. On the Qatari and Yemeni work sites, for example, Technip has built places of worship to enable workers of different faiths to respect their religion and traditions.
Maintaining the health and safety of men and women at the sites is a priority. To avoid major problems–a potential source of accidents and sick leave–health check-ups offered to Group employees have been extended to the employees of the Group's subcontractors. In Colombia, medical services, medicine and labo-ratory examinations are available to the homeless people living close to the Technip center.
Technip’s employees show their generosity and the Group encou-rages them and supports this solidarity. Everywhere in the world, it invests greatly in a variety of humanitarian causes, particularly those associated with natural disasters, children or social inequa-lities. To mention just a few examples, in 2009, cash collections were organized for the victims of the forest fi res in Australia. In the United States, volunteers at the Houston center helped build a house for a deprived family. In Nigeria, the Oyo project teams presented a local charity with food that was distributed to the inhabitants of a village near Lagos.
17.1.4.5. Social worksIn addition to the subsidies paid to the Works Councils or equi-valent, Technip provides its personnel in several countries with various benefi ts, such as company concierge services, and help with transport and/or food expenses.
Moreover, Technip organizes events to raise employee awareness regarding the importance of education and sport in staying fi t and healthy. For example:
in Venezuela, 15% of Technip employees take part in sporting ■
events fi nanced by the company (equipment, renting sports fi elds); a culture and recreation program aimed at children is arranged during school holidays.
Awareness of medical emergency management is proposed in various entities:
in Abu Dhabi, training in emergency treatment has been given ■
to 40 employees;
in Italy, volunteer employees have received fi rst aid training so ■
that they can act if a friend or colleague has a heart attack;
in France, regular training is proposed to fi rst aid volunteers. ■
17.1.4.6. Health and Safety ConditionsThe ongoing drive toward HSE excellence has continued through the implementation of phase two of the Pulse program, Technip’s behavioral based HSE program which is designed to bring about positive organizational change toward HSE management at all levels of the business.
During 2009, a total of 1,450 people have attended pulse HSE ■
leadership alignment sessions. The attendees have come from all segments of the business. The sessions have also included a number of Technip’s clients and contractors.
Other site and offi ce based training has consumed over 800,000 ■
man-hours and has covered a diverse range of subjects about health and safety as well as skills and trade training at project sites of the Group.
Overall safety performance has improved over the last four ■
years and the current total recordable case frequency (TRCF) was 0.22 for 2009 compared to 0.61 in 2005. The TRCF is an industry standard calculated using the total number of incident cases that have occurred for every 200,000 man hours worked.
In 2009 Technip has introduced environmental reporting criteria ■
into its HSE information management system in order to establish the overall company carbon footprint and to identify potential improvements and cost reductions.

1032009 Reference Document
Employees
17.2. Participating interests and share subscription or purchase options held by members of the Board of Directors and other corporate offi cers (mandataires sociaux)
17
17.1.4.7. Security ConditionsThrough regular actions of prevention, awareness raising and trai-ning, Technip continues to spread the security culture among the Group, with the aim of building a secure working environment. Priority of the Group is clearly established: protect the personnel, whatever the environment is.
The “Security Travel Database”, which enables contacting an employee during his/her travel in case of incident, will be completed
in 2010 by an IT system which provides automatically to the traveller the relevant information about his/her country of destination.
Emergency Response Teams are regularly trained to Crisis Management and practices through Emergency Response Crisis exercises.
17.2. Participating interests and share subscription or purchase options held by members of the Board of Directors and other corporate offi cers (mandataires sociaux)
17.2.1. Summary statement of the transactions listed in article L. 621-18-2 of the French Monetary and Financial Code during the 2009 fi nancial year
This table presents a summary statement (Article 223-26 of the AMF general regulations) of the transactions referenced in Article L. 621-18-2 of the French Monetary and Financial Code during the 2009 fi nancial year:
Name and Surname Position
Financial Instrument
Date and place of transaction
Type of transaction Quantity Unit price
Amount of the transaction
Joseph Rinaldi Director Share 05/12/2009Paris
Purchase 400 €33.15 €13,260
Marwan Lahoud Director Share 05/20/2009Paris
Purchase 400 €32 €12,800
Gérard Hauser Director Share 06/22/2009Paris
Purchase 300 €32 €9,600

104 2009 Reference Document
Employees
17.2. Participating interests and share subscription or purchase options held by members of the Board of Directors and other corporate offi cers (mandataires sociaux)
17
17.2.2. Company share subscription or share purchase optionsThe table below presents an overview of the information related to the share subscription and share purchase options granted by the Company and outstanding at December 31, 2009.
History of share subscription and share purchase options and information on share subscription and share purchase options
2002 Plan(balance of tranche B)
Subscription options
2005 Plan(1st tranche)Subscription
options
2005 Plan(2nd tranche)Subscription
options
2005 Plan(3rd tranche)Subscription
options
1st additional grant to tranches 1, 2 and 3 of the
2005 PlanSubscription
options
2nd additional grant to tranches 1, 2 and 3 of the
2005 PlanSubscription
options
2008 Plan1st tranche
Purchase options
2009 PlanSubscription
options
Date of Shareholders’ Meeting June 20, 2002 April 29, 2005 April 29, 2005 April 29, 2005 April 29, 2005 April 29, 2005 May 6, 2008 April 30, 2009
Date of Board of Directors’ meeting
May 21, 2003
December 14, 2005
July 26, 2006
March 12, 2007
December 12, 2007
June 12, 2008
July 1, 2008
June 15, 2009
Number of options granted 20,960 965,213 (1) 965,213 (1) 965,214 (1) 85,000 (1) 106,858 (1) 953,100 (2) 1,093,175 (3)
Total number of shares available for subscription/purchase at December 31, 2009 0 887,237 879,923 928,346 80,310 103,858 937,060 1,091,075
Number of shares that may be subscribed/purchased at December 31, 2009 by:
the Chairman and Chief ■
Executive Offi cer, corporate offi cer* N/A N/A N/A 255,655 0 0 80,000 109,000 (4)
the 10 employees having ■
the largest number of options granted 0 461,106 68,788 129,264 58,221 70,000 112,000 148,000
Option exercise start date May 22, 2006
December 14, 2009
July 26, 2010
March 13, 2011
December 13, 2011
June 13, 2012
July 2, 2012
June 15, 2013
Expiry date** May 21, 2009
December 13, 2011
July 25, 2012
March 12, 2013
December 12, 2013
June 12, 2014
July 1, 2014
June 15, 2015
Subscription/purchase price per option €18.0188 €46.9395 €41.3862 €49.1705 €55.6727 €59.96 €58.15 €34.70
Number of shares subscribed / purchased at December 31, 2009 19,120 0 1,540 2,054 0 0 0 0
Number of options cancelled at December 31, 2009 2,206 102,764 109,265 60,458 5,019 3,000 16,040 2,100
Number of shares subscribed / purchased at February 28, 2010 N/A 10,036 1,540 2,054 0 0 0 0
Number of benefi ciaries 7 59 323 252 24 21 542 1,569
* The other mandataires sociaux are not benefi ciaries of Plans.
** All the plans are subject to certain restrictions limiting the exercise of options in the event the employee or the manager ceases to work for the Company.
(1) With respect to options granted under tranches 1, 2 and 3 and the two additional grants to the tranches of the 2005 Plan, the exercise of options is subject to the
achievement by Technip of a satisfactory performance for its shareholders. This performance will be measured by the change in the Company’s fully diluted net profi ts per
share compared with the average of that of a representative sample of the Group’s competitors. Thus, the number of options that may be exercised is subject to the level of
achievement of the aforementioned performance recorded at the option exercise start date.
With respect to 1st tranche of Plan 2005, the performance calculation over the period 2005-2008 amounted to 97.75% of the options.
(2) The number of purchase options granted by the Board of Directors on July 1, 2008 is subject to a satisfactory performance over the period 2008-2011. This performance will
be measured by the progression of the Group’s Consolidated Income in relation to a representative sample of the Group’s competitors. 50% of the granted shares are subject
to the level of achievement of the aforementioned performance recorded at the option exercise start date.
(3) The number of subscription options granted by the Board of Directors on June 15, 2009 is subject to a satisfactory performance over the period 2009-2012. This performance
will be measured by the progression of the Group’s Consolidated Income in relation to a representative sample of the Group’s competitors. 50% of the granted shares are
subject to the level of achievement of the aforementioned performance recorded at the option exercise start date.
(4) The number of subscription options granted by the Board of Directors on June 15, 2009 is subject to a satisfactory performance over the period 2009-2012. This performance
will be measured by the progression of the Group’s Consolidated Income in relation to a representative sample of the Group’s competitors. No options can be exercised by
the Chairman and Chief Executive Offi cer if the progression of the Group’s Operating Income is less than that of each of the companies included in the sample.

1052009 Reference Document
Employees
17.2. Participating interests and share subscription or purchase options held by members of the Board of Directors and other corporate offi cers (mandataires sociaux)
17
Takeover of Cofl exip’s obligationsFurther to Cofl exip’s merger into the Company, the Company’s Combined Shareholders’ Meeting of July 11, 2003 authorized the takeover of Cofl exip’s commitments resulting from the share subscription and share purchase options it granted to its employees and directors and offi cers (mandataires sociaux), as well as those of affi liated companies.
Following the merger, shares obtained from the exercise of share purchase options or issued upon exercise of share subscription options will be Technip shares rather than Cofl exip shares.
Given the merger exchange ratio (nine Technip shares for every eight Cofl exip shares), the new bases for exercising the share purchase and share subscription options granted by Cofl exip have been calculated, for each of the options granted and not yet exercised at the date of the merger, in order to refl ect the exchange ratio.
Taking into account the elements above, the following table presents information relating to the share subscription and share purchase options previously granted by Cofl exip, which were outstanding at December 31, 2009 or had expired during the fi nancial year ended December 31, 2009:
History of share subscription and share purchase options and information on share subscription and share purchase options
Share subscription option plans CSO 10 Plan CSO 11 Plan
Subscription options Subscription options
Date of the Shareholders’ Meeting (1) June 2, 1999 May 30, 2000
Date of the Board of Directors’ meeting (2) December 14, 1999 March 20, 2001
Number of options granted 508,544 720,000
Total number of shares available for subscription/purchase at December 31, 2009 0 142,439
Number of shares that may be subscribed/purchased at December 31, 2009 by:
the Chairman and Chief Executive Offi cer, corporate offi cer ■ 0 0
the 10 employees having the largest number of options granted ■ 0 51,948
Option exercise start date December 15, 2001 March 21, 2003
Expiry date December 14, 2009 March 20, 2011
Subscription/purchase price per option after adjustment €16.5866 €33.3998
Number of options subscribed / purchased at December 31, 2009 0 363,764
Number of options cancelled at December 31, 2009 0 219,751
Number of shares subscribed / purchased at February 28, 2010 N/A 369,675
Number of benefi ciaries 100 144
(1) Date of Cofl exip’s Shareholders’ Meeting that authorized the grant of Cofl exip’s share purchase and share subscription option plans.
(2) Date of Cofl exip’s Board of Directors’ meeting granting the option plans.
POTENTIAL DILUTION ■
At December 31, 2009, the total number of shares that may be issued pursuant to the exercise of outstanding share subscription options described in the tables above is 4,113,188 shares with a par value per share of €0.7625, representing approximately 3.76% of the Company’s share capital as of that date.
The share purchase or share subscription options granted to or exercised by each director and offi cer during the 2009 fi nancial
year are detailed tables 4 and 5 included in Section 15.1.1 of this Reference Document.
The share purchase or share subscription options granted to and exercised by the ten employees (other than directors and offi -cers (mandataires sociaux)) with the largest number of options during the 2009 fi scal year are detailed in table 9 included in Section 15.1.1 of this Reference Document.

106 2009 Reference Document
Employees
17.2. Participating interests and share subscription or purchase options held by members of the Board of Directors and other corporate offi cers (mandataires sociaux)
17
17.2.3. Awards of performance shares pursuant to Articles L. 225-197-1 et seq. of the French Commercial Code
The following table sets forth information relating to the performance share grants outstanding at December 31, 2009:
Performance share grant 2007 Plan 2007 Plan 2007 Plan 2007 Plan 2007 Plan 2007 Plan
List 1 List 21st additional grant to list 1
1st additional grant to list 2
2nd additional grant to list 1
2nd additional grant to list 2
Date of Shareholders’ meeting April 28, 2006
April 28, 2006
April 28, 2006
April 28, 2006
April 28, 2006
April 28, 2006
Date of Board of Directors’ meeting
March 12, 2007
March 12, 2007
December 12, 2007
December 12, 2007
July 1, 2008
July 1, 2008
Number of shares granted 398,800 (1) 711,870 (1) 25,300 (1) 19,200 (1) 8,800 (2) 11,500 (2)
Share acquisition date March 13, 2010
March 13, 2011
December 12, 2010
December 12, 2011
July 2, 2011
July 2, 2012
Expiry date of the conservation period (conversion of shares)
March 13, 2012
March 13, 2011
December 12, 2012
December 12, 2011
July 2, 2013
July 2, 2012
Number of shares acquired at December 31, 2009 234 0 0 0 0 0
Grants cancelled at December 31, 2009 20,666 86,666 1,600 1,000 0 0
Shares remaining available for acquisition at December 31, 2009 377,900 625,204 23,700 18,200 8,800 11,500
Number of shares acquired at February 28, 2010 0 0 0 0 0 0
Number of benefi ciaries 514 1,199 34 29 21 51
Number of directors and senior management concerned 0 0 0 0 0 0
(1) The number of performance shares granted by the Boards of Directors of March 12, 2007 and December 12, 2007 is subject to a satisfactory performance over the period
2007/2010. This performance will be measured by the change in the Company’s net profi ts by share compared with the average of that of a representative sample of Group’s
competitors. 50% of the granted shares are subject to the level of achievement of the aforementioned performance recorded at the share acquisition start date.
(2) The number of performance shares defi nitively acquired by the Boards of Directors of July 1, 2008 and December 9, 2008 is subject to a satisfactory performance over the
period 2008-2011. This performance will be measured by the progression of the Group’s Consolidated Income in relation to a representative sample of Group’s competitors.
50% of the granted shares are subject to the level of achievement of the aforementioned performance recorded at the share acquisition start date.
(3) The number of performance shares granted by the Board of Directors of February 18, 2009 is subject to a satisfactory performance over the period 2009/2012 of the Group’s
Consolidated Income in relation to a representative sample of Group’s competitors. 50% of the granted shares are subject to the level of achievement of the aforementioned
performance recorded at the share acquisition start date.
(4) The number of performance shares granted by the Board of Directors of June 15, 2009 is subject to a satisfactory performance over the period 2009-2012 of the Group’s
Consolidated Income in relation to a representative sample of Group’s competitors. 50% of the granted shares are subject to the level of achievement of the aforementioned
performance recorded at the share acquisition start date, except in the case of the Chairman and Chief Executive Offi cer to whom no shares will be granted if the progression
of the Group’s Operating Income is less than that of each of the companies included in the sample.
(5) The number of performance shares granted by the Board of Directors of October 25, 2009 is subject to a satisfactory performance over the period 2009-2012 of the Group’s
Consolidated Income in relation to a representative sample of Group’s competitors. 50% of the granted shares are subject to the level of achievement of the aforementioned
performance recorded at the share acquisition start date.
Technip performance shares granted to and acquired by the Company’s directors and offi cers (mandataires sociaux) during
the 2009 fi nancial year are detailed in tables 6 and 7 included in Section 15.1.1 of this Reference Document.

1072009 Reference Document
Employees
17.2. Participating interests and share subscription or purchase options held by members of the Board of Directors and other corporate offi cers (mandataires sociaux)
17
2008 Plan 2008 Plan 2008 Plan 2008 Plan 2008 Plan 2008 Plan 2009 Plan 2009 Plan 2009 Plan
List 1
Tranche 1
List 2
Tranche 1
List 1
Tranche 2
List 2
Tranche 2
List 1
Tranche 3
List 2
Tranche 3
List 1
Tranche 1
List 2
Tranche 1
List 1
Tranche 2
May 6, 2008
May 6, 2008
May 6, 2008
May 6, 2008
May 6, 2008
May 6, 2008
April 30, 2009
April 30, 2009
April 30, 2009
July 1, 2008
July 1, 2008
December 9, 2008
December 9, 2008
February 18, 2009
February 18, 2009
June 15, 2009
June 15, 2009
October 25, 2009
371,450 (2) 487,600 (2) 18,300 (2) 1,800 (2) 85,642 (3) 105,900 (3) 429,575 (4) 551,600 (4) 12,000 (5)
July 2, 2011
July 2, 2012
December 10, 2011
December 10, 2012
February 18, 2012
February 18, 2013
June 15, 2012
June 15, 2013
October 25, 2012
July 2, 2013
July 2, 2012
December 10, 2013
December 10, 2012
February 18, 2014
February 18, 2013
June 15, 2014
June 15, 2013
October 25, 2014
0 0 0 0 0 0 0 0 0
5,150 18,610 0 0 1,000 100 0 2,100 0
366,300 468,990 18,300 1,800 84,642 105,800 429,575 551,600 12,000
0 0 0 0 0 0 0 0 0
455 1,084 1 1 137 452 450 1,119 3
10 4 1 0 8 5 10 5 1

108 2009 Reference Document
Employees
17.3. Arrangements for involving the employees in the capital of the Company17
The following table shows the Technip performance shares granted to the Company’s 10 employees (other than directors and offi cers (mandataires sociaux)) who were granted the largest number of performance shares during the 2009 year:
Performance shares granted to fi rst ten non-director and non-offi cer employees
Total number of performance
shares*Average
price Grant date
Acquisition date, subject to compliance with the conditions set
by the Board of DirectorsPlan
number
Performance shares granted during the fi nancial year by the issuer or by any company included in the grant perimeter, to the ten employees of the issuer and of any company included within the grant perimeter who were granted the largest number of performance shares (aggregate information)
79,500 (France) June 15, 2009 June 15, 2012 2009 Plan(Tranche 1
List 1)
36,500 (outside France)
N/A June 15, 2009 June 15, 2013 2009 Plan(Tranche 1
List 2)
Performance shares of the issuer or of the aforementioned companies that were acquired during the year by the ten employees of the issuer or of these companies who have the largest number of performance shares (aggregate information)
234 €32.50March 12,
2007May 25, 2009
2007 PlanTranche 1
List 1
* The number of performance shares granted by the Board of Directors of June 15, 2009 is subject to a satisfactory performance over the period 2009-2012 of the Group’s
Consolidated Income in relation to a representative sample of Group’s competitors. 50% of the granted shares are subject to the level of achievement of the aforementioned
performance recorded at the share acquisition start date.
17.3. Arrangements for involving the employees in the capital of the Company
17.3.1. Profi t sharingPursuant to applicable law, French companies within the Group that have at least 50 employees and which generate suffi cient profi ts must distribute a profi t-sharing amount to their employees. For the 2009 fi nancial year, the total profi t-sharing amount to be paid in France was estimated at €13.7 million. Each company negotiates and signs a profi t-sharing agreement. The Group Savings Plan (Plan d’Épargne de Groupe, or “PEG”) and the Group Pension Savings Plan (Plan d’Épargne pour la Retraite Collectif, or “PERCO”) provide for the possibility of distributing profi t-sharing amounts into different company mutual funds (Fonds Communs de Placement d’Entreprise, or “FCPE”).
17.3.2. Incentive profi t sharingFor the 2009 fi nancial year, several of the Group’s French compa-nies had an incentive profi t sharing agreement in place: Technip, Technip France, Flexi France, Technip TPS, Seal Engineering and Setudi. Calculation methods vary for each company according to their business. Employees choose between a direct payment option, a transfer to the PEG where the amounts are locked-up for a period of fi ve years and an allocation to the PERCO where the amounts are locked-up until retirement.
The employees of Technip Iberia and Technip Italy also benefi t from a similar mechanism implemented pursuant to locally applicable regulations.
For the 2009 fi nancial year, the total amount of incentive profi t sharing paid in the Group’s subsidiaries was approximately €12.8 million.
17.3.3. Group Saving Plan–Employee Share Ownership
The Group Savings Plan (Plan d’Épargne de Groupe, or “PEG”) has been in place since May 31, 1991 and has been revised several times. It was last updated on April 25, 2008.
Its purpose is to enable employees to build, with the help of their company, a collective portfolio of marketable securities and to benefi t, where applicable, from social security and tax benefi ts applicable to this form of collective savings. The total amount invested in the PEG at December 31, 2009 amounted to €115.6 million, including €50.3 million in the form of employee shareholding.
At any time during the year, members may invest assets in the PEG and can choose between the various company mutual funds (Fonds Communs de Placement d’Entreprise, or “FCPE”), whose portfolios are invested in shares, bonds or monetary instruments pursuant to a management strategy corresponding to a specifi c investment goal. One of these funds is fully invested in Technip’s listed shares and allows employees to be associated with the Group’s development.

1092009 Reference Document
Employees
17.3. Arrangements for involving the employees in the capital of the Company 17
Other FCPEs created within the PEG are reserved for purposes of share capital increases reserved for employees, including employees of foreign companies that have joined the PEG.
The PEG provides a common framework for all Group companies that have joined in terms of the payments that can be made, the means by which company profi ts can be shared, investment options and general operating regulations.
17.3.4. Group Pension Savings PlanThe Group Pension Savings Plan (Plan d’Épargne pour la Retraite Collectif, or “PERCO”) was fi rst introduced on July 1, 2006 following the Group agreement of June 16, 2006. It is open to
all employees who have at least three months seniority and who are employed by any of the Group’s French companies that have joined the PERCO.
Its purpose is to enable employees to build, with the help of their company, pension savings and to benefi t, where applicable, from social security and tax benefi ts applicable to this form of collective savings.
The total amount invested in the PERCO at December 31, 2009 was €10.5 million.
It is composed of various company FCPEs whose portfolios are invested in shares, bonds or monetary instruments depending on the management strategy chosen by each employee.

110 2009 Reference Document
Principal Shareholders
18.1. The Company’s Principal Shareholders . . . . . . . . . . . . . . . . . . . . . . . . . . . . . . . . . . . . . . . . . . . . . . . . . . . . . . . . . . . . . . . . . . . . . . . . . . . . . . . 11018.1.1. Change in share capital and voting rights over the past three years . . . . . . . . . . . . . . . . . . . . . . . . . . . . . . . . . . . . . . . . . . . . . . . . . . . . .11018.1.2. Shareholders’ notices and crossing of thresholds . . . . . . . . . . . . . . . . . . . . . . . . . . . . . . . . . . . . . . . . . . . . . . . . . . . . . . . . . . . . . . . . . . . . . . . . . . . . . . . . . .112
18.2. Shareholder Voting Rights . . . . . . . . . . . . . . . . . . . . . . . . . . . . . . . . . . . . . . . . . . . . . . . . . . . . . . . . . . . . . . . . . . . . . . . . . . . . . . . . . . . . . . . . . . . . . . . . . . . . . . . 113
18.3. Controlling Interest. . . . . . . . . . . . . . . . . . . . . . . . . . . . . . . . . . . . . . . . . . . . . . . . . . . . . . . . . . . . . . . . . . . . . . . . . . . . . . . . . . . . . . . . . . . . . . . . . . . . . . . . . . . . . . . . . . . . 113
18.4. Agreements that may result in a Change of Control . . . . . . . . . . . . . . . . . . . . . . . . . . . . . . . . . . . . . . . . . . . . . . . . . . . . . 113
18.1. The Company’s Principal Shareholders
18.1.1. Change in share capital and voting rights over the past three years
Breakdown of share capital as at December 31, 2009As at December 31, 2009, to the Company’s knowledge and on the basis of statements and documents received by the Company, the breakdown of those of the shareholders of the Company who held 1% or more of the share capital and voting rights was:
ShareholdersNumber of
sharesPercentage
shareholdingNumber
of voting rights*Percentage
voting rights
BLACKROCK INC 6,148,856 5.60% 6,148,856 5.50%
TRADEWINDS NWQ 5,497,183 5.00% 5,497,183 4.95%
CAISSE DES DÉPÔTS ET CONSIGNATIONS (indirectly via the Fonds Stratégique d’investissement) 5,472,000 5.00% 5,472,000 4.90%
CAUSEWAY CAPITAL MANAGEMENT 4,756,416 4.35% 4,756,416 4.25%
NATIXIS 4,624,671 4.25% 4,624,671 4.15%
OPPENHEIMER FUNDS INC 3,880,070 3.55% 3,880,070 3.50%
INSTITUT FRANÇAIS DU PÉTROLE 3,088,212 2.80% 6,176,424 5.55%
AMUNDI ASSET MANAGEMENT 2,642,015 2.40% 2,642,015 2.40%
BNP PARIBAS 1,634,055 1.50% 1,634,055 1.50%
T.ROWE PRICE ASSOCIATES INC 1,300,685 1.20% 1,300,685 1.15%
ALLIANCEBERNSTEIN 1,275,479 1.20% 1,275,479 1.15%
AXA INVESTMENT MANAGERS 1,158,079 1.10% 1,158,079 1.05%
Self-owned** 3,065,910 2.80% 0 0.00%
Group employees*** 2,581,073**** 2.35% 4,020,019 3.60%
Public 62,218,590 56.90% 62,729,046 56.35%
TOTAL 109,343,294 100.00% 111,314,998 100.00%
* Including double voting rights (article 12 of the Company’s articles of association). As at December 31, 2009, 5,037,614 shares carried double voting rights.As at December 31, 2009, the total number of voting rights calculated on the basis of all of the shares to which they are attached, including shares stripped of voting rights (in accordance with the last paragraph of Article 223-11 of the AMF’s General Regulations), amounted to 114,380,908.
** As at December 31, 2009, the Company did not own any treasury shares.*** Employees according to Article L. 225-102, paragraph 2 of the French Commercial Code.**** Including 2,343,885 shares held through company mutual funds.
18

1112009 Reference Document
Principal Shareholders
18.1. The Company’s Principal Shareholders 18
Change in the breakdown of share capital and voting rights over the past three yearsOver the past three years, to the Company’s knowledge and on the basis of statements and documents received by the Company, the breakdown of those of the Company’s shareholders holding 1% or more of the share capital and voting rights was as follows:
December 31
2007 2008 2009
Share
capitalVoting rights*
Share capital
Voting rights*
Share capital
Voting rights*
BLACKROCK INC - - - - 5,60% 5,50%
TRADEWINDS NWQ 3.60% 3.60% 5.70% 5.60% 5.00% 4.95%
CAISSE DES DÉPÔTS ET CONSIGNATIONS (indirectly via the Fonds Stratégique d’investissement) - - - - 5.00% 4.90%
CAUSEWAY CAPITAL MANAGEMENT 5.10% 5.00% 5.40% 5.30% 4.35% 4.25%
NATIXIS - - 1.30% 1.25% 4.25% 4.15%
OPPENHEIMER FUNDS INC 5.40% 5.30% 4.75% 4.65% 3.55% 3.50%
INSTITUT FRANÇAIS DU PÉTROLE 2.90% 5.60% 2.80% 5.55% 2.80% 5.55%
AMUNDI ASSET MANAGEMENT - - - - 2.40% 2.40%
BNP PARIBAS - - - - 1.50% 1.50%
T. ROWE PRICE ASSOCIATES INC 1.50% 1.50% 1.50% 1.45% 1.20% 1.15%
ALLIANCEBERNSTEIN - - 4.75% 4.65% 1.20% 1.15%
AXA INVESTMENT MANAGERS - - - - 1.10% 1.05%
ING GROEP NV 5.15% 5.10% 5.00% 4.95% - -
GROUPE BARCLAYS - - 4.65% 4.55% - -
CAPITAL RESEARCH 4.70% 4.60% 4.65% 4.50% - -
UBS - - 1.60% 1.60% - -
FCP GROUPAMA 1.15% 1.10% 1.15% 1.10% - -
AMBER CAPITAL 1.10% 1.05% - - - -
ARTISAN FUNDS INC 3.95% 3.90% - - - -
Self-owned 2.90% 0.00% 2.80% 0.00% 2.80% 0.00%
Group employees*** 2.40%** 4.10% 2.90% 4.30% 2.35% 3.60%
Public 60.15% 59.15% 51.05% 50.55% 56.90% 56.35%
TOTAL 100% 100% 100% 100% 100% 100%
* Including double voting rights.The total number of Company shares at the end of 2007, 2008 and 2009 fi nancial years amounted to, respectively, 107,353,774 shares, 109,317,564 shares and 109,343,294 shares.
** The number of shares held by employees includes employees who hold shares as a result of the exercise of options.*** Employees according to Article L. 225-102 o the French Commercial Code.

112 2009 Reference Document
Principal Shareholders
18.1. The Company’s Principal Shareholders18
18.1.2. Shareholders’ notices and crossing of thresholdsBetween January 1, 2009 and December 31, 2009, the Company received the following notices from its shareholders, relating to the crossing of thresholds as provided by law or by its articles of association and all other declarations:
SHAREHOLDERNotifi cation
DateEffective
date
Number of shares
held
Share capital threshold crossed*
Number of voting rights
held
Voting rights threshold crossed*
AMF notice number,
if any
FCP GROUPAMA 01/15/2009 01/15/2009 1,461,388 1.34% (u) 1,461,388
BARCLAYS 02/11/2009 02/05/2009 5,492,901 5.02% (u) 5,492,901 4.80% N° 209C0245
BARCLAYS 02/26/2009 02/23/2009 5,746,689 5.26% (u) 5,746,689 5.02% N° 209C0335
CRÉDIT SUISSE 04/01/2009 04/01/2009 1,160,482 1.06% (u) 1,160,482 1.06%
ING 04/02/2009 03/31/2009 5,356,897 4.90% (d) 5,356,897 4.68% N° 209C0489
CRÉDIT AGRICOLE 04/02/2009 04/01/2009 1,100,527 1.01% (u)
CRÉDIT AGRICOLE 04/06/2009 04/02/2009 1,077,931 0.99% (d)
CRÉDIT SUISSE 04/15/2009 04/15/2009 2,532,182 2.32% (u) 2,532,182 2.32%
CRÉDIT SUISSE 04/28/2009 04/28/2009 3,435,335 (u) 3,435,335 3.14%
UBS 05/01/2009 04/29/2009 693,564 0.63% (d) 693,564 0.61%
UBS 05/13/2009 05/11/2009 2,163,287 1.98% (u) 2,163,287 1.89%
UBS 05/15/2009 05/13/2009 859,691 0.79% (d) 859,691 0.75%
CRÉDIT SUISSE 05/18/2009 05/18/2009 3,201,059 2.93% (d) 3,201,059 2.93%
UBS 05/21/2009 05/19/2009 1,242,269 1.14% (u) 1,242,269 1.09%
UBS 05/22/2009 05/20/2009 1,026,735 0.94% (d) 1,026,735 0.90%
UBS 05/26/2009 05/21/2009 1,408,558 1.29% (u) 1,408,558 1.23%
CRÉDIT SUISSE 05/26/2009 05/26/2009 1,953,857 1.79% (d) 1,953,857 1.79%
UBS 05/26/2009 05/22/2009 840,690 0.77% (d) 840,690 0.74%
BARCLAYS 05/28/2009 05/26/2009 5,418,532 4.96% (d) 5,418,532 4.74% N° 209C0762
CRÉDIT SUISSE 05/29/2009 05/29/2009 763,368 (d) 763,368 0.70%
CDC (FSI) 06/25/2009 06/25/2009 3,629,398 3.32% (u) 3,629,398 3.17%
CDC (FSI) 07/13/2009 07/08/2009 4,678,379 4.28% (u) 4,678,379 4.09%
CDC (FSI) 07/21/2009 07/15/2009 5,282,504 4.83% (u) 5,282,504 4.61%
TRADEWINDS 07/24/2009 07/20/2009 5,497,183 5.03% (d) 5,497,183 4.81% N° 209C1037
CRÉDIT SUISSE 07/31/2009 07/31/2009 1,105,687 1.01% (u)
CAUSEWAY 08/11/2009 08/07/2009 5,698,509 5.21% (d) 5,698,509 4.98% N° 209C1117
CRÉDIT SUISSE 08/11/2009 08/11/2009 1,071,173 0.97% (d)
FCP GROUPAMA 08/17/2009 08/17/2009 989,228 0.90% (d) 989,228 0.88%
CRÉDIT SUISSE 09/03/2009 09/03/2009 1,102,907 1.0089% (d) 1,102,907
CRÉDIT SUISSE 09/04/2009 09/04/2009 1,048,824 0.9594% (d) 1,048,824
CDC (FSI) 09/09/2009 09/03/2009 5,472,000 5.01% (u) 5,472,000 4.78% N° 209C1167
BNP PARIBAS 09/10/2009 09/09/2009 2,187,907 2.0013% (u) 2,187,907 1.91%
BNP PARIBAS 09/11/2009 09/10/2009 2,186,331 1.9998% (d) 2,186,331 1.91%
CRÉDIT AGRICOLE 09/21/2009 09/18/2009 2,642,015 2.42% (u) 2,642,015 2.31%
ING 09/23/2009 09/21/2009 3,203,706 2.93% (d)
BNP PARIBAS 09/23/2009 09/22/2009 2,244,984 2.0534% (u) 2,244,984 1.963%
BNP PARIBAS 09/25/2009 09/23/2009 2,289,604 2.0942% (u) 2,289,604 2.002%
BNP PARIBAS 09/28/2009 09/25/2009 2,251,793 2.0596% (u) 2,251,793 1.97%
CRÉDIT SUISSE 09/29/2009 09/29/2009 1,369,263 1.25% (u)
CRÉDIT SUISSE 09/30/2009 09/30/2009 911,820 0.83% (u)
BNP PARIBAS 10/01/2009 09/29/2009 2,084,912 1.9070% (d) 2,084,912 1.823%
CAUSEWAY 10/02/2009 09/30/2009 5,462,666 4.99% (d) 5,462,666 4.78% N° 209C1227
CAUSEWAY 10/05/2009 10/02/2009 5,475,301 5.01% (u) 5,475,301 4.79% N° 209C1241
CAUSEWAY 10/14/2009 10/13/2009 5,430,520 4.97% (d) 5,430,520 4.75% N° 209C1278
NATIXIS 10/16/2009 10/01/2009 3,250,868 2.97% (u) 3,250,868
BLACKROCK INC (having purchased Barclays) 12/09/2009 12/01/2009 5,878,421 5.38% (u) 5,878,421 5.14% N° 209C1482
* d = crossing of threshold downwards/ u = crossing of threshold upwards.This table only includes information provided in the notices and declarations received by the Company.

1132009 Reference Document
Principal Shareholders
18.4. Agreements that may result in a Change of Control 18
At the Company’s request, Euroclear France drew up a statement (the “TPI statement”), dated December 7, 2009, of identifi able bearer shares with no restriction on the number of shares held by shareholders or by fi nancial intermediaries. The TPI statement listed 43,822 shareholders holding shares in bearer form. The statement also showed that 84.3% of the shares are held by insti-tutional investors which are geographically distributed as follows:
30.6% in North America, 27.4% in France, 11.4% in the United Kingdom and Ireland, 8.9% in Continental Europe and 6.0% over the rest of the world.
At the date of this report, individuals held 6.2% of the shares.
At December 31, 2009, 1,689 shareholders held their shares in registered form in their name (inscrit au nominatif pur).
Between January 1, 2010 and March 4, 2010, the Company received the following notices from its shareholders, relating to the crossing of thresholds as provided by law or by its articles of association, and all other declarations:
SHAREHOLDERNotifi cation
DateEffective
date
Number of shares
held
Share capital
threshold crossed*
Number of voting
rights held
Voting rights
threshold crossed*
AMF notice
number,if any
T.ROWE PRICE 01/12/2010 09/30/2009 1,259,670 1,259,670
BLACKROCK 01/26/2010 12/31/2009 6,148,856 5.62% 6,148,856
NATIXIS 01/28/2010 12/31/2009 4,624,671
TRADEWINDS 01/29/2010 12/31/2009 5,497,183 5,497,183
CAUSEWAY 01/29/2010 12/31/2009 4,756,416 4,756,416
AXA INVESTMENTS 02/01/2010 12/31/2009 1,158,079
BNP PARIBAS 02/01/2010 12/31/2009 1,634,055
ALLIANCEBERNSTEIN 02/02/2010 12/31/2009 1,275,479
ING 02/05/2010 12/31/2009 869,375 0.80%
OPPENHEIMER FUNDS 02/09/2010 12/31/2009 3,880,070
CAISSE DES DÉPÔTS ET CONSIGNATIONS (indirectly via the Fonds Stratégique d’investissement) 02/11/2010 02/08/2010 5,729,398 5.23% 5,729,398 5.01%CRÉDIT SUISSE 02/24/2010 02/24/2010 1,806,616 1.6247%CRÉDIT SUISSE 02/25/2010 02/25/2010 2,276,119 2.0469%CRÉDIT SUISSE 03/04/2010 03/04/2010 3,462,634 3.1139%
* d = crossing of threshold downwards/ u = crossing of threshold upwards.This table only includes information provided in the notices and declarations received by the Company.
18.2. Shareholder Voting Rights
Among the Company’s main shareholders as indicated in Section 18.1 of this Reference Document, only the Institut Français du Pétrole holds double voting rights.
18.3. Controlling Interest
At the date of this Reference Document and to the Company’s knowledge, none of the shareholders has more than 5.62% (Blackrock Inc) of the Company’s share capital, as indicated in
the table included in Section 18.1.2 of this Reference Document. None of the shareholders thus holds a controlling interest in the Company, either directly or indirectly.
18.4. Agreements that may result in a Change of Control
To the Company’s knowledge, there are no arrangements between or among its main shareholders, the implementation of which could at a subsequent date result in a change in control of the Company.
The articles of association and the Internal Charter of the Company do not contain any provisions that could delay, defer or prevent a change in control of its shareholding.
A takeover could potentially trigger the relevant provisions of certain commercial contracts having an “intuitu personae” dimension, especially regarding license contracts. The direct effect of these provisions which give, for example, a licensor the option to challenge granted rights, should not result in the prevention or delay of a change in control but could, as the case may be, decrease the Group’s access to certain markets.

114 2009 Reference Document
19.1. Main Related Party Transactions . . . . . . . . . . . . . . . . . . . . . . . . . . . . . . . . . . . . . . . . . . . . . . . . . . . . . . . . . . . . . . . . . . . . . . . . . . . . . . . . . . . . . . . . . . . 114
19.2. Statutory Auditors’ Special Report on Certain Related Party
Transactions for the Financial Year 2009 . . . . . . . . . . . . . . . . . . . . . . . . . . . . . . . . . . . . . . . . . . . . . . . . . . . . . . . . . . . . . . . . . . . . . . . . . . . . 115
Related Party Transactions
19.1. Main Related Party Transactions
Technip’s related party transactions mainly consist of re-invoicing Group management and organization costs through a manage-ment fee, as well as costs related to insurance policies, and fees on guarantees given by the Company (see Note 6.14 to the Statutory Accounts as of December 31, 2009, included in Section 20.2 of this Reference Document).
Regulated agreements are described in the Statutory Auditors’ Special Report included in Section 19.2 of this Reference Document.
19

1152009 Reference Document
Related Party Transactions
19.2. Statutory Auditors’ Special Report on Certain Related Party Transactions for the Financial Year 2009 19
19.2. Statutory Auditors’ Special Report on Certain Related Party Transactions for the Financial Year 2009
This is a free translation in English of the Statutory Auditors’ special reports on certain transactions issued in the French language. It is solely provided for English speaking readers. This report includes information specifi cally required by French Law. This report on certain related party transaction should be read in conjunction with and construed in accordance with French Law and professional auditing standards applicable in France.
PricewaterhouseCoopers Audit
63, rue de Villiers92208 Neuilly-sur-Seine CedexFrance
ERNST & YOUNG et Autres
41, rue Ybry92576 Neuilly-sur-Seine CedexFrance
Special Report of the Statutory Auditors on Certain Related Party Transactions
For the year ended December 31, 2009To the Shareholders,
TechnipTour Technip6-8, allée de l’Arche92973 Paris La Défense
In our capacity as Statutory Auditors of Technip, we hereby present our report on certain related party transaction.
Our responsibility does not include identifying any undisclosed agreements. We are required to report to shareholders, based on the information provided, the main terms and conditions of the agreements that have been disclosed to us, without commenting on their relevance or substance. Under the provisions of article R. 225-31 of the French Commercial Code, it is the responsibility of shareholders to determine whether the agreements are appropriate and should be approved.
Related Party Transaction Authorized within the auditing periodWe inform you that we were not advised that new related party transaction were concluded during the auditing period and subjected to provisions of the article L. 225-38 of the French Commercial Code.
Continuing agreements which were entered into prior yearIn application of the French Commercial Code, we were advised that the following agreements which were entered into in prior years remained in force during the year.
Consulting contract with Mr. Daniel ValotIn its meeting of September 27, 2006, the Board of Directors decided to sign with Mr. Daniel Valot a consulting contract for a two year period. This contract is based on a daily rate of €4,000 (excluding taxes) for 80 days of service per year. In 2009, Mr. Daniel Valot was paid €191,360 in relation to this consulting contract. The contract ended on April 2009.
Subsidy granted to Technip Marine (M) SDN BHD (Malaysia)In its meeting of December 9, 2008, the Board of Directors authorised a subsidy to its subsidiary Technip Marine (M) SDN BHD (Malaysia). The purpose of this subsidy is to restore the net equity of the subsidiary that holds the Group activity licence in Malaysia for the Offshore segment.
The amount of the subsidy is capped at US$102 million. The amount attributed in 2008 was €21 million and took into account expected insurance benefi ts. An additional subsidy could have been granted to Technip Marine (M) SDN BHD in 2009 had the insurance benefi ts effectively received been less than those anticipated.
The subsidy granted by Technip to Technip Marine (M) SDN BHD in 2009 amounted to €13.1 million.

116 2009 Reference Document
Related Party Transactions
19.2. Statutory Auditors’ Special Report on Certain Related Party Transactions for the Financial Year 200919
Commitments towards Mr. Thierry Pilenko in case of cessation of his offi cesIn its meeting of February 18, 2009, the Board of Directors decided to limit the commitments signed for the benefi t of Mr. Thierry Pilenko in such case to a non-complete clause allowing the payment of an indemnity capped at two years of gross compensation (base compensation plus target variable compensation), in compliance with AFEP-MEDEF recommendations.
Moreover, the Board of Directors suppressed all other measures formerly applicable on this matter.
Mr. Thierry Pilenko’s supplemental pension planIt has been decided during the Board Meetings of the April 27, 2007 and February 20, 2008 to grant Mr. Thierry Pilenko a supplemental pension plan whose characteristics are described thereafter.
As a member of the senior executive team of Technip, Mr. Thierry Pilenko will benefi t from a supplemental defi ned contribution benefi t pension plan which is calculated as follows: 8% of the annual gross compensation capped to 8 times the upper limit of salary deductions for social security contribution. He will also have a defi ned contribution benefi t pension plan as member of Technip Executive Committee which is calculated as follows: for each year of service, but limited to 15 years, a retirement resource guarantee equal to 1.8% of “Tranche 4” of the annual gross paid compensation, i.e. the one above 8 times the upper yearly limit of salary deductions for French social security regime.
In 2009, the contribution paid by your company for the supplementary pension plan of Mr. Pilenko amounted to €21,957.
We have carried out our work in accordance with the professional standards applicable in France. These standards require that we performed procedures to verify that the information given to us agrees with the underlying documents.
Neuilly-sur-Seine, March 17, 2010
The Statutory Auditors
PricewaterhouseCoopers AuditLouis-Pierre Schneider
ERNST & YOUNG et AutresNour-Eddine Zanouda

1172009 Reference Document
20
20.1. Consolidated Financial Statements . . . . . . . . . . . . . . . . . . . . . . . . . . . . . . . . . . . . . . . . . . . . . . . . . . . . . . . . . . . . . . . . . . . . . . . . . . . . . . . . . . . . . . 11820.1.1. Statutory Auditors’ Report on the Consolidated Financial Statements . . . . . . . . . . . . . . . . . . . . . . . . . . . . . . . . . . . . . . . . . . . . . . . . .12020.1.2. Consolidated Financial Statements . . . . . . . . . . . . . . . . . . . . . . . . . . . . . . . . . . . . . . . . . . . . . . . . . . . . . . . . . . . . . . . . . . . . . . . . . . . . . . . . . . . . . . . . . . . . . . . . . . . . . . .122
1. Consolidated Income Statement . . . . . . . . . . . . . . . . . . . . . . . . . . . . . . . . . . . . . . . . . . . . . . . . . . . . . . . . . . . . . . . . . . . . . . . . . . . . . . . . . . . . . . . . . . . . . . . . . . . . . .1222. Consolidated Statement of Comprehensive Income . . . . . . . . . . . . . . . . . . . . . . . . . . . . . . . . . . . . . . . . . . . . . . . . . . . . . . . . . . . . . . . . . . . . . . . .1223. Consolidated Balance Sheet . . . . . . . . . . . . . . . . . . . . . . . . . . . . . . . . . . . . . . . . . . . . . . . . . . . . . . . . . . . . . . . . . . . . . . . . . . . . . . . . . . . . . . . . . . . . . . . . . . . . . . . . . . . . .1234. Consolidated Cash Flow Statement. . . . . . . . . . . . . . . . . . . . . . . . . . . . . . . . . . . . . . . . . . . . . . . . . . . . . . . . . . . . . . . . . . . . . . . . . . . . . . . . . . . . . . . . . . . . . . . . . .1245. Consolidated Statement of Changes in Shareholders’ Equity . . . . . . . . . . . . . . . . . . . . . . . . . . . . . . . . . . . . . . . . . . . . . . . . . . . . . . . . . . .1256. Notes to the Consolidated Financial Statements . . . . . . . . . . . . . . . . . . . . . . . . . . . . . . . . . . . . . . . . . . . . . . . . . . . . . . . . . . . . . . . . . . . . . . . . . . . . .126
20.2. Statutory Financial Statements. . . . . . . . . . . . . . . . . . . . . . . . . . . . . . . . . . . . . . . . . . . . . . . . . . . . . . . . . . . . . . . . . . . . . . . . . . . . . . . . . . . . . . . . . . . . . 17720.2.1. Statutory Auditors’ Report on the Financial Statements . . . . . . . . . . . . . . . . . . . . . . . . . . . . . . . . . . . . . . . . . . . . . . . . . . . . . . . . . . . . . . . . . . . . . . .17820.2.2. Statutory Financial Statements . . . . . . . . . . . . . . . . . . . . . . . . . . . . . . . . . . . . . . . . . . . . . . . . . . . . . . . . . . . . . . . . . . . . . . . . . . . . . . . . . . . . . . . . . . . . . . . . . . . . . . . . . . . . .180
1. Balance Sheet . . . . . . . . . . . . . . . . . . . . . . . . . . . . . . . . . . . . . . . . . . . . . . . . . . . . . . . . . . . . . . . . . . . . . . . . . . . . . . . . . . . . . . . . . . . . . . . . . . . . . . . . . . . . . . . . . . . . . . . . . . . . . . . . . . .1802. Income Statement . . . . . . . . . . . . . . . . . . . . . . . . . . . . . . . . . . . . . . . . . . . . . . . . . . . . . . . . . . . . . . . . . . . . . . . . . . . . . . . . . . . . . . . . . . . . . . . . . . . . . . . . . . . . . . . . . . . . . . . . . . . .1813. Cash Flow Statement . . . . . . . . . . . . . . . . . . . . . . . . . . . . . . . . . . . . . . . . . . . . . . . . . . . . . . . . . . . . . . . . . . . . . . . . . . . . . . . . . . . . . . . . . . . . . . . . . . . . . . . . . . . . . . . . . . . . . . .1824. Notes on Accounting Principles . . . . . . . . . . . . . . . . . . . . . . . . . . . . . . . . . . . . . . . . . . . . . . . . . . . . . . . . . . . . . . . . . . . . . . . . . . . . . . . . . . . . . . . . . . . . . . . . . . . . . . . .1825. Main Events of the Year . . . . . . . . . . . . . . . . . . . . . . . . . . . . . . . . . . . . . . . . . . . . . . . . . . . . . . . . . . . . . . . . . . . . . . . . . . . . . . . . . . . . . . . . . . . . . . . . . . . . . . . . . . . . . . . . . . . .1836. Notes to the Financial Statements . . . . . . . . . . . . . . . . . . . . . . . . . . . . . . . . . . . . . . . . . . . . . . . . . . . . . . . . . . . . . . . . . . . . . . . . . . . . . . . . . . . . . . . . . . . . . . . . . . .1847. Subsidiaries and Investments . . . . . . . . . . . . . . . . . . . . . . . . . . . . . . . . . . . . . . . . . . . . . . . . . . . . . . . . . . . . . . . . . . . . . . . . . . . . . . . . . . . . . . . . . . . . . . . . . . . . . . . . . . .194
20.3. Dividend Distribution Policy . . . . . . . . . . . . . . . . . . . . . . . . . . . . . . . . . . . . . . . . . . . . . . . . . . . . . . . . . . . . . . . . . . . . . . . . . . . . . . . . . . . . . . . . . . . . . . . . . . . 195
20.4. Legal and Arbitration Procedures . . . . . . . . . . . . . . . . . . . . . . . . . . . . . . . . . . . . . . . . . . . . . . . . . . . . . . . . . . . . . . . . . . . . . . . . . . . . . . . . . . . . . . . . . . 195 ITP dispute . . . . . . . . . . . . . . . . . . . . . . . . . . . . . . . . . . . . . . . . . . . . . . . . . . . . . . . . . . . . . . . . . . . . . . . . . . . . . . . . . . . . . . . . . . . . . . . . . . . . . . . . . . . . . . . . . . . . . . . . . . . . . . . . . . . . . . . . . . . . .195 TSKJ . . . . . . . . . . . . . . . . . . . . . . . . . . . . . . . . . . . . . . . . . . . . . . . . . . . . . . . . . . . . . . . . . . . . . . . . . . . . . . . . . . . . . . . . . . . . . . . . . . . . . . . . . . . . . . . . . . . . . . . . . . . . . . . . . . . . . . . . . . . . . . . . . . . . . . .196
20.5. Signifi cant Changes in the Financial or Commercial Position . . . . . . . . . . . . . . . . . . . . . . . . . . . . . . . . . . . . . 196
Financial Information on the Company’s Assets, Financial Situation and Results

118 2009 Reference Document
Financial Information on the Company’s Assets, Financial Situation and Results
20.1. Consolidated Financial Statements20
20.1.1. Statutory Auditors’ Report on the Consolidated Financial Statements . . . . . . . . . . . . . . . . . . . . . . . . 120
20.1.2. Consolidated Financial Statements . . . . . . . . . . . . . . . . . . . . . . . . . . . . . . . . . . . . . . . . . . . . . . . . . . . . . . 122
1. Consolidated Income Statement. . . . . . . . . . . . . . . . . . . . . . . . . . . . . . . . . . . . . . . . . . . . . . . . . . . . . . 122
2. Consolidated Statement of Comprehensive Income . . . . . . . . . . . . . . . . . . . . . . . . . . . . . . . . . . . . . 122
3. Consolidated Balance Sheet . . . . . . . . . . . . . . . . . . . . . . . . . . . . . . . . . . . . . . . . . . . . . . . . . . . . . . . . . . 123
4. Consolidated Cash Flow Statement . . . . . . . . . . . . . . . . . . . . . . . . . . . . . . . . . . . . . . . . . . . . . . . . . . . 124
5. Consolidated Statement of Changes in Shareholders’ Equity . . . . . . . . . . . . . . . . . . . . . . . . . . . . . 125
6. Notes to the Consolidated Financial Statements. . . . . . . . . . . . . . . . . . . . . . . . . . . . . . . . . . . . . . . . 126Note 1 – Summary of Signifi cant Accounting Principles. . . . . . . . . . . . . . . . . . . . . . . . . . . . . . . . . . . . . . . . . . . . . . . . . . . . . . . .126
A. Accounting Framework . . . . . . . . . . . . . . . . . . . . . . . . . . . . . . . . . . . . . . . . . . . . . . . . . . . . . . . . . . . . . . . . . . . . . . . . . . . . .126B. Consolidation Principles . . . . . . . . . . . . . . . . . . . . . . . . . . . . . . . . . . . . . . . . . . . . . . . . . . . . . . . . . . . . . . . . . . . . . . . . . . . . .127C. Rules and Estimates . . . . . . . . . . . . . . . . . . . . . . . . . . . . . . . . . . . . . . . . . . . . . . . . . . . . . . . . . . . . . . . . . . . . . . . . . . . . . . . .127
(a) Use of Estimates . . . . . . . . . . . . . . . . . . . . . . . . . . . . . . . . . . . . . . . . . . . . . . . . . . . . . . . . . . . . . . . . . . . . . . . . . . . . . . . . . . . . .127(b) Long-Term Contracts. . . . . . . . . . . . . . . . . . . . . . . . . . . . . . . . . . . . . . . . . . . . . . . . . . . . . . . . . . . . . . . . . . . . . . . . . . . . . . . . . .127(c) Foreign Currency Transactions and Financial Instruments. . . . . . . . . . . . . . . . . . . . . . . . . . . . . . . . . . . . . . . . . . . . . . . . . . .128(d) Business Combinations . . . . . . . . . . . . . . . . . . . . . . . . . . . . . . . . . . . . . . . . . . . . . . . . . . . . . . . . . . . . . . . . . . . . . . . . . . . . . . . .129(e) Segment Information . . . . . . . . . . . . . . . . . . . . . . . . . . . . . . . . . . . . . . . . . . . . . . . . . . . . . . . . . . . . . . . . . . . . . . . . . . . . . . . . .129(f) Operating Income from Recurring Activities and Operating Income. . . . . . . . . . . . . . . . . . . . . . . . . . . . . . . . . . . . . . . . . .130(g) Financial Result on Contracts. . . . . . . . . . . . . . . . . . . . . . . . . . . . . . . . . . . . . . . . . . . . . . . . . . . . . . . . . . . . . . . . . . . . . . . . . . .130(h) Income / (Loss) from Discontinued Operations . . . . . . . . . . . . . . . . . . . . . . . . . . . . . . . . . . . . . . . . . . . . . . . . . . . . . . . . . . .130(i) Earnings per Share . . . . . . . . . . . . . . . . . . . . . . . . . . . . . . . . . . . . . . . . . . . . . . . . . . . . . . . . . . . . . . . . . . . . . . . . . . . . . . . . . . . .130(j) Property, Plant and Equipment (Tangible Assets) . . . . . . . . . . . . . . . . . . . . . . . . . . . . . . . . . . . . . . . . . . . . . . . . . . . . . . . . . .130(k) Intangible Assets . . . . . . . . . . . . . . . . . . . . . . . . . . . . . . . . . . . . . . . . . . . . . . . . . . . . . . . . . . . . . . . . . . . . . . . . . . . . . . . . . . . . .131(l) Other Financial Assets. . . . . . . . . . . . . . . . . . . . . . . . . . . . . . . . . . . . . . . . . . . . . . . . . . . . . . . . . . . . . . . . . . . . . . . . . . . . . . . . .131(m) Inventories . . . . . . . . . . . . . . . . . . . . . . . . . . . . . . . . . . . . . . . . . . . . . . . . . . . . . . . . . . . . . . . . . . . . . . . . . . . . . . . . . . . . . . . . . . .131(n) Advances Paid to Suppliers . . . . . . . . . . . . . . . . . . . . . . . . . . . . . . . . . . . . . . . . . . . . . . . . . . . . . . . . . . . . . . . . . . . . . . . . . . . . .131(o) Trade Receivables . . . . . . . . . . . . . . . . . . . . . . . . . . . . . . . . . . . . . . . . . . . . . . . . . . . . . . . . . . . . . . . . . . . . . . . . . . . . . . . . . . . . .131(p) Cash and Cash Equivalents. . . . . . . . . . . . . . . . . . . . . . . . . . . . . . . . . . . . . . . . . . . . . . . . . . . . . . . . . . . . . . . . . . . . . . . . . . . . .132(q) Treasury Shares . . . . . . . . . . . . . . . . . . . . . . . . . . . . . . . . . . . . . . . . . . . . . . . . . . . . . . . . . . . . . . . . . . . . . . . . . . . . . . . . . . . . . .132(r) Stock Options and Free Share Allocations . . . . . . . . . . . . . . . . . . . . . . . . . . . . . . . . . . . . . . . . . . . . . . . . . . . . . . . . . . . . . . . .132(s) Capital Increase Reserved for Employees . . . . . . . . . . . . . . . . . . . . . . . . . . . . . . . . . . . . . . . . . . . . . . . . . . . . . . . . . . . . . . . . .132(t) Provisions . . . . . . . . . . . . . . . . . . . . . . . . . . . . . . . . . . . . . . . . . . . . . . . . . . . . . . . . . . . . . . . . . . . . . . . . . . . . . . . . . . . . . . . . . . .132(u) Deferred Income Tax . . . . . . . . . . . . . . . . . . . . . . . . . . . . . . . . . . . . . . . . . . . . . . . . . . . . . . . . . . . . . . . . . . . . . . . . . . . . . . . . . .132(v) Financial Debts (Current and Non-Current) . . . . . . . . . . . . . . . . . . . . . . . . . . . . . . . . . . . . . . . . . . . . . . . . . . . . . . . . . . . . . .133(w) Assets and Liabilities Held for Sale. . . . . . . . . . . . . . . . . . . . . . . . . . . . . . . . . . . . . . . . . . . . . . . . . . . . . . . . . . . . . . . . . . . . . . .133
Note 2 – Scope of Consolidation . . . . . . . . . . . . . . . . . . . . . . . . . . . . . . . . . . . . . . . . . . . . . . . . . . . . . . . . . . . . . . . . . . . . . . . . . . .133(a) Changes in Scope of Consolidation. . . . . . . . . . . . . . . . . . . . . . . . . . . . . . . . . . . . . . . . . . . . . . . . . . . . . . . . . . . . . . . . . . . . . .133(b) Scope of Consolidation as of December 31, 2009 . . . . . . . . . . . . . . . . . . . . . . . . . . . . . . . . . . . . . . . . . . . . . . . . . . . . . . . . .134
Note 3 – Segment Information . . . . . . . . . . . . . . . . . . . . . . . . . . . . . . . . . . . . . . . . . . . . . . . . . . . . . . . . . . . . . . . . . . . . . . . . . . . . .137(a) Information by Business Segment. . . . . . . . . . . . . . . . . . . . . . . . . . . . . . . . . . . . . . . . . . . . . . . . . . . . . . . . . . . . . . . . . . . . . . .137(b) Information by Geographical Segment. . . . . . . . . . . . . . . . . . . . . . . . . . . . . . . . . . . . . . . . . . . . . . . . . . . . . . . . . . . . . . . . . . .139
Note 4 – Operating Income / (Loss). . . . . . . . . . . . . . . . . . . . . . . . . . . . . . . . . . . . . . . . . . . . . . . . . . . . . . . . . . . . . . . . . . . . . . . . .139(a) Revenues . . . . . . . . . . . . . . . . . . . . . . . . . . . . . . . . . . . . . . . . . . . . . . . . . . . . . . . . . . . . . . . . . . . . . . . . . . . . . . . . . . . . . . . . . . . .139(b) Cost of Sales by Nature . . . . . . . . . . . . . . . . . . . . . . . . . . . . . . . . . . . . . . . . . . . . . . . . . . . . . . . . . . . . . . . . . . . . . . . . . . . . . . .140(c) Research and Development Costs . . . . . . . . . . . . . . . . . . . . . . . . . . . . . . . . . . . . . . . . . . . . . . . . . . . . . . . . . . . . . . . . . . . . . . .140(d) Administrative Costs by Nature. . . . . . . . . . . . . . . . . . . . . . . . . . . . . . . . . . . . . . . . . . . . . . . . . . . . . . . . . . . . . . . . . . . . . . . . .140(e) Other Operating Income . . . . . . . . . . . . . . . . . . . . . . . . . . . . . . . . . . . . . . . . . . . . . . . . . . . . . . . . . . . . . . . . . . . . . . . . . . . . . .140(f) Other Operating Expenses . . . . . . . . . . . . . . . . . . . . . . . . . . . . . . . . . . . . . . . . . . . . . . . . . . . . . . . . . . . . . . . . . . . . . . . . . . . . .140(g) Income / (Loss) from Sale of Activities . . . . . . . . . . . . . . . . . . . . . . . . . . . . . . . . . . . . . . . . . . . . . . . . . . . . . . . . . . . . . . . . . . .140(h) Other Non-Current Income and Expenses. . . . . . . . . . . . . . . . . . . . . . . . . . . . . . . . . . . . . . . . . . . . . . . . . . . . . . . . . . . . . . . .141(i) Employee Benefi t Expenses . . . . . . . . . . . . . . . . . . . . . . . . . . . . . . . . . . . . . . . . . . . . . . . . . . . . . . . . . . . . . . . . . . . . . . . . . . . .141
Note 5 – Financial Income and Expenses . . . . . . . . . . . . . . . . . . . . . . . . . . . . . . . . . . . . . . . . . . . . . . . . . . . . . . . . . . . . . . . . . . . .141(a) Financial Income . . . . . . . . . . . . . . . . . . . . . . . . . . . . . . . . . . . . . . . . . . . . . . . . . . . . . . . . . . . . . . . . . . . . . . . . . . . . . . . . . . . . .141(b) Financial Expenses . . . . . . . . . . . . . . . . . . . . . . . . . . . . . . . . . . . . . . . . . . . . . . . . . . . . . . . . . . . . . . . . . . . . . . . . . . . . . . . . . . . .141
Note 6 – Income Tax . . . . . . . . . . . . . . . . . . . . . . . . . . . . . . . . . . . . . . . . . . . . . . . . . . . . . . . . . . . . . . . . . . . . . . . . . . . . . . . . . . . . . .142(a) Income Tax Expense. . . . . . . . . . . . . . . . . . . . . . . . . . . . . . . . . . . . . . . . . . . . . . . . . . . . . . . . . . . . . . . . . . . . . . . . . . . . . . . . . . .142(b) Income Tax Reconciliation . . . . . . . . . . . . . . . . . . . . . . . . . . . . . . . . . . . . . . . . . . . . . . . . . . . . . . . . . . . . . . . . . . . . . . . . . . . . .142(c) Deferred Income Tax . . . . . . . . . . . . . . . . . . . . . . . . . . . . . . . . . . . . . . . . . . . . . . . . . . . . . . . . . . . . . . . . . . . . . . . . . . . . . . . . . .143(d) Tax Loss Carry-Forwards and Tax Credits . . . . . . . . . . . . . . . . . . . . . . . . . . . . . . . . . . . . . . . . . . . . . . . . . . . . . . . . . . . . . . . . .143
Note 7 – Income / (Loss) from Discontinued Operations. . . . . . . . . . . . . . . . . . . . . . . . . . . . . . . . . . . . . . . . . . . . . . . . . . . . . . .143Note 8 – Earnings per Share . . . . . . . . . . . . . . . . . . . . . . . . . . . . . . . . . . . . . . . . . . . . . . . . . . . . . . . . . . . . . . . . . . . . . . . . . . . . . . .144
20.1. Consolidated Financial Statements

1192009 Reference Document
Financial Information on the Company’s Assets, Financial Situation and Results
20.1. Consolidated Financial Statements 20
Note 9 – Property, Plant and Equipment (Tangible Assets) . . . . . . . . . . . . . . . . . . . . . . . . . . . . . . . . . . . . . . . . . . . . . . . . . . . .144Note 10 – Intangible Assets. . . . . . . . . . . . . . . . . . . . . . . . . . . . . . . . . . . . . . . . . . . . . . . . . . . . . . . . . . . . . . . . . . . . . . . . . . . . . . . .145
(a) Changes in Net Intangible Assets . . . . . . . . . . . . . . . . . . . . . . . . . . . . . . . . . . . . . . . . . . . . . . . . . . . . . . . . . . . . . . . . . . . . . . .146(b) Goodwill . . . . . . . . . . . . . . . . . . . . . . . . . . . . . . . . . . . . . . . . . . . . . . . . . . . . . . . . . . . . . . . . . . . . . . . . . . . . . . . . . . . . . . . . . . . .146
Note 11 – Investments in Associates Accounted for Using the Equity Method . . . . . . . . . . . . . . . . . . . . . . . . . . . . . . . . . . . .147Note 12 – Other Financial Assets. . . . . . . . . . . . . . . . . . . . . . . . . . . . . . . . . . . . . . . . . . . . . . . . . . . . . . . . . . . . . . . . . . . . . . . . . . .148Note 13 – Available-for-Sale Financial Assets. . . . . . . . . . . . . . . . . . . . . . . . . . . . . . . . . . . . . . . . . . . . . . . . . . . . . . . . . . . . . . . . .148Note 14 – Inventories. . . . . . . . . . . . . . . . . . . . . . . . . . . . . . . . . . . . . . . . . . . . . . . . . . . . . . . . . . . . . . . . . . . . . . . . . . . . . . . . . . . . .148Note 15 – Construction Contracts . . . . . . . . . . . . . . . . . . . . . . . . . . . . . . . . . . . . . . . . . . . . . . . . . . . . . . . . . . . . . . . . . . . . . . . . . .149Note 16 – Trade Receivables . . . . . . . . . . . . . . . . . . . . . . . . . . . . . . . . . . . . . . . . . . . . . . . . . . . . . . . . . . . . . . . . . . . . . . . . . . . . . . .149Note 17 – Other Current Receivables . . . . . . . . . . . . . . . . . . . . . . . . . . . . . . . . . . . . . . . . . . . . . . . . . . . . . . . . . . . . . . . . . . . . . . .150Note 18 – Cash and Cash Equivalents . . . . . . . . . . . . . . . . . . . . . . . . . . . . . . . . . . . . . . . . . . . . . . . . . . . . . . . . . . . . . . . . . . . . . . .150Note 19 – Assets and Liabilities Held for Sale . . . . . . . . . . . . . . . . . . . . . . . . . . . . . . . . . . . . . . . . . . . . . . . . . . . . . . . . . . . . . . . .150Note 20 – Shareholders’Equity . . . . . . . . . . . . . . . . . . . . . . . . . . . . . . . . . . . . . . . . . . . . . . . . . . . . . . . . . . . . . . . . . . . . . . . . . . . . .151
(a) Changes in the Parent Company’s Common Stock . . . . . . . . . . . . . . . . . . . . . . . . . . . . . . . . . . . . . . . . . . . . . . . . . . . . . . . .151(b) Technip Shareholders as of December 31 . . . . . . . . . . . . . . . . . . . . . . . . . . . . . . . . . . . . . . . . . . . . . . . . . . . . . . . . . . . . . . . .151(c) Treasury Shares . . . . . . . . . . . . . . . . . . . . . . . . . . . . . . . . . . . . . . . . . . . . . . . . . . . . . . . . . . . . . . . . . . . . . . . . . . . . . . . . . . . . . .151(d) Fair Value Reserves . . . . . . . . . . . . . . . . . . . . . . . . . . . . . . . . . . . . . . . . . . . . . . . . . . . . . . . . . . . . . . . . . . . . . . . . . . . . . . . . . . . .152(e) Distributable Retained Earnings. . . . . . . . . . . . . . . . . . . . . . . . . . . . . . . . . . . . . . . . . . . . . . . . . . . . . . . . . . . . . . . . . . . . . . . . .152(f) Statutory Legal Reserve . . . . . . . . . . . . . . . . . . . . . . . . . . . . . . . . . . . . . . . . . . . . . . . . . . . . . . . . . . . . . . . . . . . . . . . . . . . . . . .152(g) Dividends Paid and Proposed . . . . . . . . . . . . . . . . . . . . . . . . . . . . . . . . . . . . . . . . . . . . . . . . . . . . . . . . . . . . . . . . . . . . . . . . . . .152(h) Executive Stock Option Plans and Share Purchase Option Plans . . . . . . . . . . . . . . . . . . . . . . . . . . . . . . . . . . . . . . . . . . . . .153(i) Free Share Allocation Plans. . . . . . . . . . . . . . . . . . . . . . . . . . . . . . . . . . . . . . . . . . . . . . . . . . . . . . . . . . . . . . . . . . . . . . . . . . . . .156(j) Capital Increase Reserved for Employees . . . . . . . . . . . . . . . . . . . . . . . . . . . . . . . . . . . . . . . . . . . . . . . . . . . . . . . . . . . . . . . . .157(k) Capital Management . . . . . . . . . . . . . . . . . . . . . . . . . . . . . . . . . . . . . . . . . . . . . . . . . . . . . . . . . . . . . . . . . . . . . . . . . . . . . . . . . .158
Note 21 – Financial Debts (Current and Non-Current) . . . . . . . . . . . . . . . . . . . . . . . . . . . . . . . . . . . . . . . . . . . . . . . . . . . . . . . .159(a) Financial Debts, Breakdown by Nature. . . . . . . . . . . . . . . . . . . . . . . . . . . . . . . . . . . . . . . . . . . . . . . . . . . . . . . . . . . . . . . . . . .159(b) Comparison of Carrying Amount and Fair Value of Non-Current Financial Debts. . . . . . . . . . . . . . . . . . . . . . . . . . . . . . .159(c) Analysis by Type of Interest Rate. . . . . . . . . . . . . . . . . . . . . . . . . . . . . . . . . . . . . . . . . . . . . . . . . . . . . . . . . . . . . . . . . . . . . . . .159(d) Analysis by Currency . . . . . . . . . . . . . . . . . . . . . . . . . . . . . . . . . . . . . . . . . . . . . . . . . . . . . . . . . . . . . . . . . . . . . . . . . . . . . . . . . .160(e) Schedule of Financial Debts . . . . . . . . . . . . . . . . . . . . . . . . . . . . . . . . . . . . . . . . . . . . . . . . . . . . . . . . . . . . . . . . . . . . . . . . . . . .160(f) Secured Financial Debts . . . . . . . . . . . . . . . . . . . . . . . . . . . . . . . . . . . . . . . . . . . . . . . . . . . . . . . . . . . . . . . . . . . . . . . . . . . . . . .160
Note 22 – Pensions and other Post-Employment Benefi t Plans . . . . . . . . . . . . . . . . . . . . . . . . . . . . . . . . . . . . . . . . . . . . . . . . .160(a) Description of the Group’s Current Benefi t Plans. . . . . . . . . . . . . . . . . . . . . . . . . . . . . . . . . . . . . . . . . . . . . . . . . . . . . . . . . .161(b) Net Benefi t Expense Recognized in the Income Statement . . . . . . . . . . . . . . . . . . . . . . . . . . . . . . . . . . . . . . . . . . . . . . . . .161(c) Benefi t Asset/Liability Recognized in the Balance Sheet . . . . . . . . . . . . . . . . . . . . . . . . . . . . . . . . . . . . . . . . . . . . . . . . . . . .162(d) Actuarial Assumptions. . . . . . . . . . . . . . . . . . . . . . . . . . . . . . . . . . . . . . . . . . . . . . . . . . . . . . . . . . . . . . . . . . . . . . . . . . . . . . . . .163
Note 23 – Provisions . . . . . . . . . . . . . . . . . . . . . . . . . . . . . . . . . . . . . . . . . . . . . . . . . . . . . . . . . . . . . . . . . . . . . . . . . . . . . . . . . . . . .164(a) Changes in Provisions . . . . . . . . . . . . . . . . . . . . . . . . . . . . . . . . . . . . . . . . . . . . . . . . . . . . . . . . . . . . . . . . . . . . . . . . . . . . . . . . .164(b) Schedule of Provisions. . . . . . . . . . . . . . . . . . . . . . . . . . . . . . . . . . . . . . . . . . . . . . . . . . . . . . . . . . . . . . . . . . . . . . . . . . . . . . . . .164
Note 24 – Trade Payables . . . . . . . . . . . . . . . . . . . . . . . . . . . . . . . . . . . . . . . . . . . . . . . . . . . . . . . . . . . . . . . . . . . . . . . . . . . . . . . . .165Note 25 – Other Current and Non-Current Liabilities . . . . . . . . . . . . . . . . . . . . . . . . . . . . . . . . . . . . . . . . . . . . . . . . . . . . . . . . .165Note 26 – Financial Instruments . . . . . . . . . . . . . . . . . . . . . . . . . . . . . . . . . . . . . . . . . . . . . . . . . . . . . . . . . . . . . . . . . . . . . . . . . . .166
(a) Financial Assets and Liabilities by Category. . . . . . . . . . . . . . . . . . . . . . . . . . . . . . . . . . . . . . . . . . . . . . . . . . . . . . . . . . . . . . .166(b) Gains and Losses by Category of Financial Instruments . . . . . . . . . . . . . . . . . . . . . . . . . . . . . . . . . . . . . . . . . . . . . . . . . . . .167(c) Derivative Financial Instruments . . . . . . . . . . . . . . . . . . . . . . . . . . . . . . . . . . . . . . . . . . . . . . . . . . . . . . . . . . . . . . . . . . . . . . . .167
Note 27 – Payroll Staff. . . . . . . . . . . . . . . . . . . . . . . . . . . . . . . . . . . . . . . . . . . . . . . . . . . . . . . . . . . . . . . . . . . . . . . . . . . . . . . . . . . .168Note 28 – Related Party Disclosures . . . . . . . . . . . . . . . . . . . . . . . . . . . . . . . . . . . . . . . . . . . . . . . . . . . . . . . . . . . . . . . . . . . . . . . .168
(a) Transactions with Related Parties . . . . . . . . . . . . . . . . . . . . . . . . . . . . . . . . . . . . . . . . . . . . . . . . . . . . . . . . . . . . . . . . . . . . . . .168(b) Assets and Liabilities, Income and Expenses with respect to Associates in Joint Ventures. . . . . . . . . . . . . . . . . . . . . . . .168(c) Salary and Benefi ts of the Chief Executive Offi cer. . . . . . . . . . . . . . . . . . . . . . . . . . . . . . . . . . . . . . . . . . . . . . . . . . . . . . . . .168(d) Salary and Benefi ts of the Main Group Managers . . . . . . . . . . . . . . . . . . . . . . . . . . . . . . . . . . . . . . . . . . . . . . . . . . . . . . . . .169
Note 29 – Board of Directors Compensation . . . . . . . . . . . . . . . . . . . . . . . . . . . . . . . . . . . . . . . . . . . . . . . . . . . . . . . . . . . . . . . . .169Note 30 – Joint Ventures . . . . . . . . . . . . . . . . . . . . . . . . . . . . . . . . . . . . . . . . . . . . . . . . . . . . . . . . . . . . . . . . . . . . . . . . . . . . . . . . . .169Note 31 – Off-Balance Sheet Commitments . . . . . . . . . . . . . . . . . . . . . . . . . . . . . . . . . . . . . . . . . . . . . . . . . . . . . . . . . . . . . . . . .170
(a) Capital Leases and Operating Leases . . . . . . . . . . . . . . . . . . . . . . . . . . . . . . . . . . . . . . . . . . . . . . . . . . . . . . . . . . . . . . . . . . . .170(b) Bank and Commercial Guarantees . . . . . . . . . . . . . . . . . . . . . . . . . . . . . . . . . . . . . . . . . . . . . . . . . . . . . . . . . . . . . . . . . . . . . .170
Note 32 – Litigations and Contingent Liabilities . . . . . . . . . . . . . . . . . . . . . . . . . . . . . . . . . . . . . . . . . . . . . . . . . . . . . . . . . . . . . .171(a) Litigations . . . . . . . . . . . . . . . . . . . . . . . . . . . . . . . . . . . . . . . . . . . . . . . . . . . . . . . . . . . . . . . . . . . . . . . . . . . . . . . . . . . . . . . . . . .171(b) Contingent Liabilities. . . . . . . . . . . . . . . . . . . . . . . . . . . . . . . . . . . . . . . . . . . . . . . . . . . . . . . . . . . . . . . . . . . . . . . . . . . . . . . . . .172
Note 33 – Market Related Exposure . . . . . . . . . . . . . . . . . . . . . . . . . . . . . . . . . . . . . . . . . . . . . . . . . . . . . . . . . . . . . . . . . . . . . . . .173(a) Liquidity Risk. . . . . . . . . . . . . . . . . . . . . . . . . . . . . . . . . . . . . . . . . . . . . . . . . . . . . . . . . . . . . . . . . . . . . . . . . . . . . . . . . . . . . . . . .173(b) Foreign Currency Risk . . . . . . . . . . . . . . . . . . . . . . . . . . . . . . . . . . . . . . . . . . . . . . . . . . . . . . . . . . . . . . . . . . . . . . . . . . . . . . . . .174(c) Interest Rate Risk . . . . . . . . . . . . . . . . . . . . . . . . . . . . . . . . . . . . . . . . . . . . . . . . . . . . . . . . . . . . . . . . . . . . . . . . . . . . . . . . . . . . .175(d) Credit Risk . . . . . . . . . . . . . . . . . . . . . . . . . . . . . . . . . . . . . . . . . . . . . . . . . . . . . . . . . . . . . . . . . . . . . . . . . . . . . . . . . . . . . . . . . . .175
Note 34 – Auditors’ Fees and Services. . . . . . . . . . . . . . . . . . . . . . . . . . . . . . . . . . . . . . . . . . . . . . . . . . . . . . . . . . . . . . . . . . . . . . .176Note 35 – Subsequent Events. . . . . . . . . . . . . . . . . . . . . . . . . . . . . . . . . . . . . . . . . . . . . . . . . . . . . . . . . . . . . . . . . . . . . . . . . . . . . .176

120 2009 Reference Document
Financial Information on the Company’s Assets, Financial Situation and Results
20.1. Consolidated Financial Statements20
20.1.1. Statutory Auditors’ Report on the Consolidated Financial Statements
This is a free translation into English of the statutory auditors’ report issued in French and is provided solely for the convenience of English speaking users. The statutory auditors’ report includes information specifi cally required by French law in such reports, whether modifi ed or not. This information is presented below the opinion on the consolidated fi nancial statements and includes an explanatory paragraph discussing the auditors’ assessments of certain signifi cant accounting and auditing matters. These assessments were considered for the purpose of issuing an audit opinion on the consolidated fi nancial statements taken as a whole and not to provide separate assurance on individual account captions or on information taken outside of the consolidated fi nancial statements.
This report should be read in conjunction with, and construed in accordance with, French law and professional auditing standards applicable in France.
PricewaterhouseCoopers Audit ERNST & YOUNG et Autres
63, rue de Villiers92208 Neuilly-sur-Seine Cedex
France
41, rue Ybry92576 Neuilly-sur-Seine Cedex
France
Statutory Auditors’ Report on the Consolidated Financial Statements
For the year ended December 31, 2009
To the Shareholders,
Technip – Tour Technip – 6-8, allée de l’Arche – 92973 Paris-La Défense – France
In compliance with the assignment entrusted to us by your Annual General Meeting, we hereby report to you, for the year ended December 31, 2009, on:
the audit of the accompanying consolidated fi nancial statements of Technip; ■
the justifi cation of our assessments; ■
the specifi c verifi cation required by law. ■
These consolidated fi nancial statements have been approved by the Board of Directors. Our role is to express an opinion on these consolidated fi nancial statements based on our audit..
I. Opinion on the Consolidated Financial Statements
We conducted our audit in accordance with professional standards applicable in France; those standards require that we plan and perform the audit to obtain reasonable assurance about whether the consolidated fi nancial statements are free of material misstatement. An audit involves performing procedures, using sampling techniques or other methods of selection, to obtain audit evidence about the amounts and disclosures in the consolidated fi nancial statements. An audit also includes evaluating the appropriateness of accounting policies used and the reasonableness of accounting estimates made, as well as the overall presentation of the consolidated fi nancial statements. We believe that the audit evidence we have obtained is suffi cient and appropriate to provide a basis for our audit opinion.
In our opinion, the consolidated fi nancial statements give a true and fair view of the assets and liabilities and of the fi nancial position of the Group as at 31 December 2009 and of the results of its operations for the year then ended in accordance with International Financial Reporting Standards as adopted by the European Union.
Without qualifying our opinion, we draw your attention to the matter set out in the note 32 “Litigation and Contingent Liabilities” in the consolidated fi nancial statements regarding the risk concerning an on-going procedure in connection with a project in Nigeria carried by a joint-venture held in 25% by Technip as well as its impact on the fi nancial statements.

1212009 Reference Document
Financial Information on the Company’s Assets, Financial Situation and Results
20.1. Consolidated Financial Statements 20
II. Justifi cation of our assessments
In accordance with the requirements of article L.823-9 of the French Commercial Code (code de commerce) relating to the justifi cation of our assessments, we bring to your attention the following matters:
As indicated in the Note 1.C.(a) and 1.C.(b) to the fi nancial statements, Technip uses signifi cant accounting estimates to determine ■
the margin at completion for each long term contract which is based on an analysis of total costs and income at completion, that are reviewed periodically and regularly throughout the life of contract. Within the scope of our assessment of the signifi cant estimates used to prepare the fi nancial statements, we reviewed the processes set up by the Company in this respect, assessed the data and assumptions used as a basis for these estimates, and compared the accounting estimates of the previous periods with the corresponding actual fi gures.
As indicated in Notes 1.C.(a) and 1.C.(d) to the consolidated fi nancial statements, Technip annually carries out an impairment test ■
for the goodwill by using the discounted future cash fl ow method, as determined on the basis of strategic plans drawn up by the Company and presented to the Board. Within the scope of our assessment of the signifi cant estimates used to prepare the fi nancial statements, we have reviewed the assumptions adopted, the calculations made by the Company and the consistency of the methods used, and we have ensured that Note 10 provides adequate information in this regard.
The recoverability of deferred income tax assets recognized as of December 31, 2009, and more specifi cally those arisen from unused ■
tax loss carryforwards, have been evaluated by Technip on the basis of the forecast data from the Group strategic plans for each fi scal perimeter. We have reviewed the recoverability tests on those tax assets made by Technip and described within Note 1.C.(u).
We have ensured that the established procedures ensure the collection, evaluation and recording in the accounts of any litigation in ■
satisfactory conditions. We have specifi cally ensured that the litigations identifi ed by Technip while applying these procedures were accurately described within the appendix notes to the fi nancial statements and particularly within Note 32.
We carried out an assessment of the reasonableness of these estimates. As described in Note C, we point out that, since forecasts are inherently uncertain, actual fi gures may sometimes vary signifi cantly.
These assessments were made as part of our audit of the consolidated fi nancial statements taken as a whole, and therefore contributed to the opinion we formed which is expressed in the fi rst part of this report.
III. Specifi c verifi cations
As required by law, we have also verifi ed in accordance with professional standards applicable in France the information presented in the Group’s management report. We have no matters to report as to its fair presentation and its consistency with the consolidated fi nancial statements.
Neuilly-sur-Seine, March 17, 2010
The Statutory Auditors
PricewaterhouseCoopers Audit ERNST & YOUNG et Autres
Louis-Pierre Schneider Nour-Eddine Zanouda
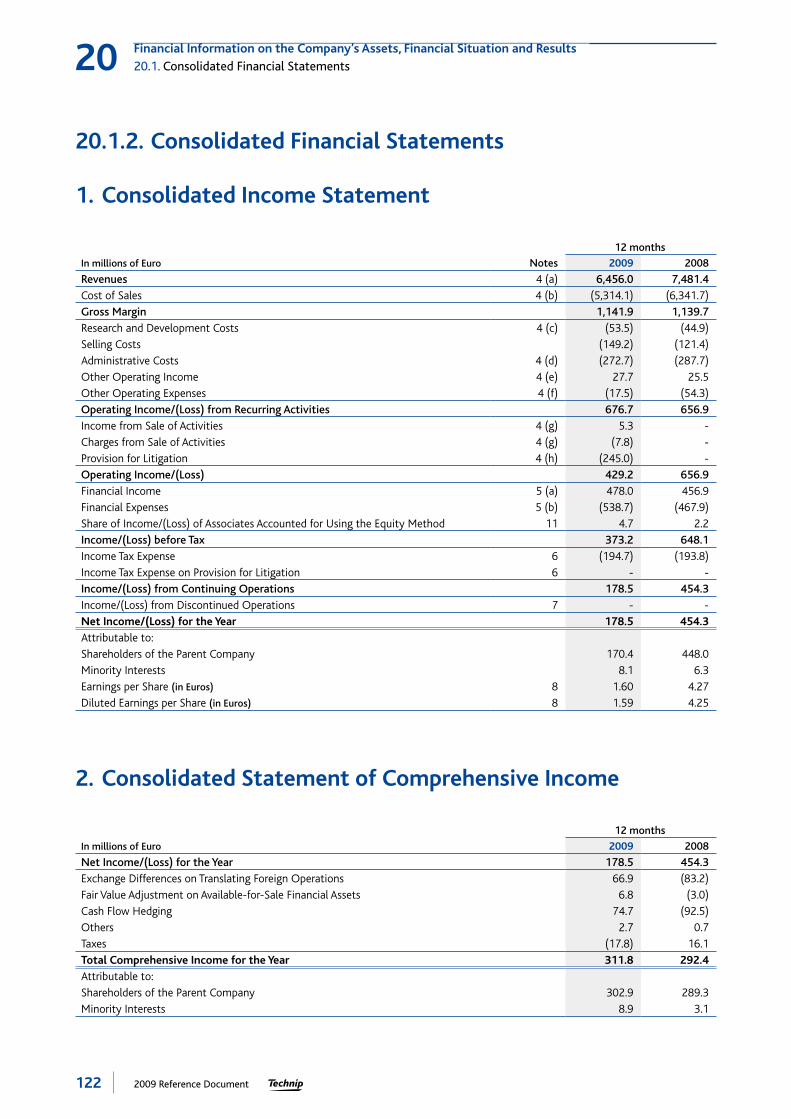
122 2009 Reference Document
Financial Information on the Company’s Assets, Financial Situation and Results
20.1. Consolidated Financial Statements20
20.1.2. Consolidated Financial Statements
1. Consolidated Income Statement
12 months
In millions of Euro Notes 2009 2008
Revenues 4 (a) 6,456.0 7,481.4
Cost of Sales 4 (b) (5,314.1) (6,341.7)
Gross Margin 1,141.9 1,139.7
Research and Development Costs 4 (c) (53.5) (44.9)
Selling Costs (149.2) (121.4)
Administrative Costs 4 (d) (272.7) (287.7)
Other Operating Income 4 (e) 27.7 25.5
Other Operating Expenses 4 (f) (17.5) (54.3)
Operating Income/(Loss) from Recurring Activities 676.7 656.9
Income from Sale of Activities 4 (g) 5.3 -
Charges from Sale of Activities 4 (g) (7.8) -
Provision for Litigation 4 (h) (245.0) -
Operating Income/(Loss) 429.2 656.9
Financial Income 5 (a) 478.0 456.9
Financial Expenses 5 (b) (538.7) (467.9)
Share of Income/(Loss) of Associates Accounted for Using the Equity Method 11 4.7 2.2
Income/(Loss) before Tax 373.2 648.1
Income Tax Expense 6 (194.7) (193.8)
Income Tax Expense on Provision for Litigation 6 - -
Income/(Loss) from Continuing Operations 178.5 454.3
Income/(Loss) from Discontinued Operations 7 - -
Net Income/(Loss) for the Year 178.5 454.3
Attributable to:
Shareholders of the Parent Company 170.4 448.0
Minority Interests 8.1 6.3
Earnings per Share (in Euros) 8 1.60 4.27
Diluted Earnings per Share (in Euros) 8 1.59 4.25
2. Consolidated Statement of Comprehensive Income
12 months
In millions of Euro 2009 2008
Net Income/(Loss) for the Year 178.5 454.3
Exchange Differences on Translating Foreign Operations 66.9 (83.2)
Fair Value Adjustment on Available-for-Sale Financial Assets 6.8 (3.0)
Cash Flow Hedging 74.7 (92.5)
Others 2.7 0.7
Taxes (17.8) 16.1
Total Comprehensive Income for the Year 311.8 292.4
Attributable to:
Shareholders of the Parent Company 302.9 289.3
Minority Interests 8.9 3.1

1232009 Reference Document
Financial Information on the Company’s Assets, Financial Situation and Results
20.1. Consolidated Financial Statements 20
3. Consolidated Balance Sheet
AssetsAs of December 31,
In millions of Euro Notes 2009 2008
Property, Plant and Equipment, Net 9 1,194.5 945.0
Intangible Assets, Net 10 2,408.2 2,409.2
Investments in Associates Accounted for Using the Equity Method 11 9.3 6.7
Other Financial Assets 12 22.5 18.6
Deferred Tax Assets 6 (c) 263.8 201.4
Available-for-Sale Financial Assets 13 11.5 8.2
Total Non-Current Assets 3,909.8 3,589.1
Inventories 14 215.4 226.2
Construction Contracts – Amounts in Assets 15 158.0 140.8
Advances Paid to Suppliers 114.5 192.5
Derivative Financial Instruments 26 61.6 40.4
Trade Receivables 16 1,061.4 1,123.5
Current Income Tax Receivables 98.1 82.6
Other Current Receivables 17 294.9 332.1
Cash and Cash Equivalents 18 2,656.3 2,404.7
Total Current Assets 4,660.2 4,542.8
Assets Classifi ed as Held for Sale 19 - -
Total Assets 8,570.0 8,131.9
Equity and LiabilitiesAs of December 31,
In millions of Euro Notes 2009 2008
Common Stock 20 (a) 83.4 83.4
Paid-in-Surplus 1,710.4 1,709.8
Retained Earnings 902.9 469.6
Treasury Shares 20 (c) (143.8) (143.8)
Foreign Currency Translation Reserves (38.5) (113.9)
Fair Value Reserves 20 (d) 1.9 20.3
Net Income 170.4 448.0
Total Equity Attributable to Shareholders of the Parent Company 2,686.7 2,473.4
Minority Interests 30.4 22.3
Total Equity 2,717.1 2,495.7
Other Non-Current Financial Debts 21 844.5 734.2
Provisions 23 100.4 104.2
Deferred Tax Liabilities 6 (c) 96.5 100.8
Other Non-Current Liabilities 25 28.4 41.2
Total Non-Current Liabilities 1,069.8 980.4
Current Financial Debt 21 28.2 25.9
Trade Payables 24 1,476.2 1,703.9
Construction Contracts – Amounts in Liabilities 15 975.6 1,253.0
Derivative Financial Instruments 26 64.0 119.9
Provisions 23 484.1 182.0
Current Income Tax Payables 126.3 99.8
Other Current Liabilities 25 1,628.7 1,271.3
Total Current Liabilities 4,783.1 4,655.8
Total Liabilities 5,853.0 5,636.2
Liabilities Directly Associated with the Assets Classifi ed as Held for Sale 19 - -
Total Equity and Liabilities 8,570.0 8,131.9

124 2009 Reference Document
Financial Information on the Company’s Assets, Financial Situation and Results
20.1. Consolidated Financial Statements20
4. Consolidated Cash Flow Statement
12 months
In millions of Euro Notes 2009 2008
Net Income for the Year (including Minority Interests) 178.5 454.3
Adjustments for:
Amortization and Depreciation of Property, Plant and Equipment 9 201.8 164.9
Amortization and Depreciation of Intangible Assets 10 22.3 23.7
Stock Option and Free Shares Charge 4 (i) 38.6 26.1
Non-Current Provisions (including Employee Benefi ts) (7.4) 6.0
Share of Income/(Loss) of Associates Accounted for Using the Equity Method (2.0) (2.2)
Net (Gains)/Losses on Disposal of Assets and Investments (0.8) 29.0
Deferred Tax 6 (a) (58.4) (20.1)
372.6 681.7
Decrease/(Increase) in Advance to Suppliers 96.4 244.2
Decrease/(Increase) in Construction Contracts (510.2) (443.5)
Decrease/(Increase) in Trade Receivables and Other Receivables 311.7 (562.2)
Decrease/(Increase) in Trade Payables and Other Payables 363.6 534.5
Net Cash Generated from Operating Activities 634.1 454.7
Purchases of Property, Plant and Equipment 9 (413.2) (389.2)
Proceeds from Sales of Property, Plant and Equipment 4 (e) 0.8 3.3
Purchases of Intangible Assets 10 (10.4) (12.1)
Acquisitions of Investments (0.3) (0.1)
Proceeds from Sales of Investments 4 (e) 2.1 1.8
Changes in Scope of Consolidation (8.1) (15.0)
Net Cash Used in Investing Activities (429.1) (411.3)
Increase in Borrowings 110.4 127.8
Decrease in Borrowings (26.3) (49.3)
Capital Increase 0.6 71.3
Share Buy-Back 20 (c) - 0.5
Dividends Paid 20 (g) (127.5) (125.1)
Net Cash (Used in)/Generated from Financing Activities (42.8) 25.2
Net Effects of Foreign Exchange Rate Changes 92.4 (68.5)
Net Increase in Cash and Cash Equivalents 254.6 0.1
Cash and Cash Equivalents as of January 1, 18 2,404.7 2,401.5
Bank Overdrafts as of January 1, (4.2) (1.1)
Cash and Cash Equivalents as of December 31, 18 2,656.3 2,404.7
Bank Overdrafts as of December 31, (1.2) (4.2)
254.6 0.1
Interests paid in 2009 amounted to €43.5 million compared to €34.6 million in 2008.
Interests received in 2009 amounted to €34.1 million compared to €50.6 million in 2008.
Income taxes paid in 2009 amounted to €234.9 million compared to €150.7 million in 2008.

1252009 Reference Document
Financial Information on the Company’s Assets, Financial Situation and Results
20.1. Consolidated Financial Statements 20
5. Consolidated Statement of Changes in Shareholders’ Equity
In millions of EuroCommon
StockPaid-in-Surplus
Retained Earnings
Treasury Shares
Foreign Currency
Translation Reserves
Fair Value
Reserves
Net Income (Parent
Company)
Share-holders’
Equity (Parent
Company)
Share-holders’
Equity (Minority Interests)
Total Share-
holders’ Equity
As of January 1, 2008 81.9 1,640.0 458.0 (144.3) (46.7) 63.2 126.3 2,178.4 18.4 2,196.8
Net Income 2008 - - - - - - 448.0 448.0 6.3 454.3
Other Comprehensive Income - - - - (80.4) (78.3) - (158.7) (3.2) (161.9)
Total ComprehensiveIncome 2008 - - - - (80.4) (78.3) 448.0 289.3 3.1 292.4
Capital Increase 1.5 69.8 - - - - - 71.3 - 71.3
Capital Decrease - - - - - - - - - -
Appropriation of Net Income 2007 - - 126.3 - - - (126.3) - - -
Dividend - - (125.1) - - - - (125.1) - (125.1)
Treasury Shares - - - 0.5 - - - 0.5 - 0.5
Valuation of Stock Option and Free Shares - - - - - 44.5 - 44.5 - 44.5
Others - - 10.4 - 13.2 (9.1) - 14.5 0.8 15.3
As of December 31, 2008 83.4 1,709.8 469.6 (143.8) (113.9) 20.3 448.0 2,473.4 22.3 2,495.7
Net Income 2009 - - - - - - 170.4 170.4 8.1 178.5
Other ComprehensiveIncome - - - - 66.6 65.9 - 132.5 0.8 133.3
Total ComprehensiveIncome 2009 - - - - 66.6 65.9 170.4 302.9 8.9 311.8
Capital Increase - 0.6 - - - - - 0.6 - 0.6
Capital Decrease - - - - - - - - - -
Appropriation of Net Income 2008 - - 448.0 - - - (448.0) - - -
Dividend - - (127.5) - - - - (127.5) - (127.5)
Treasury Shares - - - - - - - - - -
Valuation of Stock Option and Free Shares - - 38.4 - - - - 38.4 - 38.4
Reclassifi cation of Stock Option and Free Shares - - 73.9 - - (73.9) - - - -
Others - - 0.5 - 8.8 (10.4) - (1.1) (0.8) (1.9)
As of December 31, 2009 83.4 1,710.4 902.9 (143.8) (38.5) 1.9 170.4 2,686.7 30.4 2,717.1

126 2009 Reference Document
Financial Information on the Company’s Assets, Financial Situation and Results
20.1. Consolidated Financial Statements20
6. Notes to the Consolidated Financial Statements
Technip’s principal businesses are as follows:
lump sum or cost-to-cost engineering service contracts ■
performed over a short period;
engineering, manufacturing, installation and commissioning ■
service contracts lasting approximately 12 months;
turnkey projects related to complex industrial facilities with ■
engineering, procurement, construction and start-up, in accor-dance with industry standards and a contractual schedule. The average duration of these contracts is three years, but can vary depending on the contract.
The Consolidated Financial Statements of the Group are presented in millions of euros, and all values are rounded to the nearest thousand, except when otherwise indicated. The Consolidated Financial Statements of the Group as of December 31, 2009 were approved by the Board of Directors on February 16, 2010.
Note 1 – Summary of Signifi cant Accounting Principles
A. Accounting Framework
Due to the listing of Technip’s securities on Euronext Paris and in accordance with the European Union’s regulation No. 1606/2002 of July 19, 2002, the Consolidated Financial Statements of Technip SA (“the Group”) for the year 2009 were prepared as of December 31, 2009 in accordance with International Financial Reporting Standards (IFRS) issued by the International Accounting Standard Board (IASB) and endorsed by the European Union as of the date the Board of Directors approved the Consolidated Financial Statements i.e. on February 16, 2010. These standards are available on the website of the European Union (http://ec.europa.eu/internal_market/accounting/ias_fr.htm#adopted-commision).
Standards effective January 1, 2009, that apply to the Group:
The adoption of new standards and interpretations whose applica-tion is mandatory for periods starting after January 1, 2009 has no signifi cant impact on the fi nancial situation and performance of the Group.
IAS 1 revised: Presentation of Financial Statements. The revised standard mainly adds a new statement “Consolidated Statement of Comprehensive Income” which presents the changes in equity during a period resulting from operations or events other than those resulting from transactions with owners in their capacity as owners. The Consolidated Comprehensive Income includes all incomes and expenses as recorded in the Consolidated Income Statement, plus the other elements from the Other Comprehensive Income. Entities can choose either to present one single statement (the statement of comprehensive income) or two statements (the income statement and the statement of comprehensive income). The Group elected to present two statements.
IFRS 8: Operating Segments. This standard concerns additional information related to operating segments that shall be disclosed. The Group opted for the early application of IFRS 8 in its fi nancial statements as of December 31, 2008.
IAS 23 (amendment): Borrowing Costs. This revised standard requires capitalization of borrowing costs that are directly attribut-able to the construction, production or acquisition of a qualifying asset. The Group has applied the amendment to new qualifying assets for which construction began on or after January 1, 2009.
Standards effective January 1, 2009 but currently not relevant to the Group:
IFRS 2 (amendment): Share-based Payment. This amendment clarifi es the defi nition of vesting condition and specifi es the treatment for all cancellations.
IAS 32 (amendment): Financial Instruments: Presentation. This amendment clarifi es the classifi cation of a puttable fi nancial instrument and obligations arising on liquidation.
IFRIC 9: Reassessment of Embedded Derivatives, and IAS 39 (amendment): Financial Instruments: Recognition and Measurement. These amendments clarify the accounting treatment of embedded derivatives for entities using the reclas-sifi cation amendment. This amendment allows entities to reclassify particular fi nancial instruments out of the “fair value through profi t and loss”category in specifi c circumstances.
IFRS 7 (amendment): Financial Instruments: Disclosures. The amendment outlines additional disclosure requirements for fair value measurement and liquidity risk.
Standards adopted by European Union effective after December 31, 2009:
Technip’s financial statements as of December 31, 2009 do not include the possible impact of standards published as of December 31, 2009 and not yet effective.
IFRS 3 Revised: Business Combinations and IAS 27 Amended: Consolidated and separate fi nancial statements.These standards prescribe accounting treatment and fi nancial information to be disclosed in case of business combinations. They are effective for fi nancial years beginning on or after July 1, 2009, which means January 1st, 2010 for the Group.
IFRIC 16: Hedges of a Net Investment in a Foreign Operation.
IFRIC 17: Distribution of Non Cash Assets to Owners.
IFRIC 18: Transfer of Assets from Customers.
IAS 39 (amendment): Financial Instruments: Recognition and Measurement – Eligible Hedged Items.
IAS 32 (amendment): Financial Instruments: Presentation – Classifi cation of Rights Issues.
Technip is currently assessing the potential impact of these new standards on its fi nancial statements. At this stage, Technip does not anticipate any signifi cant impact on the Group’s fi nancial situation and net income.

1272009 Reference Document
Financial Information on the Company’s Assets, Financial Situation and Results
20.1. Consolidated Financial Statements 20
B. Consolidation Principles
Companies controlled by the Group are fully consolidated, in particular when the voting rights exceed 50% or when the Group controls fi nancial and operational policies.
Proportionate consolidation is used for jointly controlled entities. Activities in joint ventures are consolidated using proportionate consolidation.
The equity method is used for investments over which the Group exercises a signifi cant infl uence on operational and fi nancial policies. Unless otherwise indicated, such infl uence is deemed to exist for investments in companies in which the Group’s direct or indirect ownership is between 20% and 50%.
Companies in which the Group’s ownership is less than 20% or that do not represent signifi cant investments (such as dormant companies) are recorded under the “Other Financial Assets (Non-Current)” line item and only impact net income through dividends received. When no active market exists and when no other valuation method can be used, these investments are maintained at historical cost, net of depreciation.
The list of the Group’s consolidated companies and their respec-tive method of consolidation is provided in Note 2-(b) Scope of Consolidation as of December 31, 2009.
The fi nancial statements of main affi liates are prepared for the same reporting period as the parent company, using consistent accounting policies.
The main affi liates of the Group are closing their accounts as at December 31 and all consolidated companies are applying Group accounting standards.
All balances and intercompany transactions, as well as internal income and expenses, are fully eliminated.
Subsidiaries are consolidated from the date of acquisition, being the date when the Group obtains control, and continue to be consolidated until the date when such control ceases.
C. Rules and Estimates
The Consolidated Financial Statements were prepared in accor-dance with the IFRS.
The distinction between current assets and liabilities, and non-current assets and liabilities is based on the operating cycle for contracts. If related to contracts, assets and liabilities are classifi ed as “current”; if not related to contracts, assets and liabilities are classifi ed as “current” if their maturity is less than 12 months or “non-current” if their maturity exceeds 12 months.
All assets are evaluated under the historical cost convention, except for fi nancial assets and derivative fi nancial instruments, which are measured at fair value.
The preparation of fi nancial statements in compliance with IFRS requires the use of certain critical accounting estimates. The areas involving a higher degree of judgment or complexity, or areas where assumptions and estimates are material, are disclosed in the paragraphs below.
(a) Use of Estimates
Preparation of the Consolidated Financial Statements requires the use of estimates and assumptions to be made that may affect the assessment and disclosure of assets and liabilities at the date of the fi nancial statements, as well as the income and the reported expenses regarding this fi nancial year. Estimates may be revised if the circumstances and the assumptions on which they were based change, if new information becomes available, or as a result of greater experience. Consequently, the actual result from these operations may differ from these estimates.
The main assessments and accounting assumptions made in the fi nancial statements of the Group relate to construction contracts, the valuation of Group exposure to litigation with third parties, the valuation of recoverable goodwill and the valuation of income tax assets resulting from carry-forward tax losses (the last are measured in compliance with accounting principles shown in Note 1-C-(u) Deferred Income Tax). Regarding construction contracts, the Group policy is described in Note 1-C-(b) Long- term Contracts. In terms of legal proceedings and claims, the Group regularly draws up lists and performs analyses of signifi cant ongoing litigations, so as to record the adequate provisions when necessary. Possible uncertainties related to ongoing litigations are described in Note 32 − Litigations and Contingent Liabilities.
Goodwill is tested for impairment at least annually and whenever a trigger event is identifi ed. This impairment test determines whether or not the carrying amount exceeds the recoverable amount. Goodwill is allocated to cash-generating units (CGU) for the purpose of impairment testing. These CGUs correspond to the Group’s businesses, which generate independent cash fl ows. The recoverable amount is the higher of either the selling price or values in use of the CGUs. The latter corresponds to the discounted future cash fl ows forecasted for these CGUs.
Technip also performs sensitivity analyses on key assumptions used for impairment tests, in order to make sure that no reasonable change of an assumption on which the Group has based its CGUs’ recoverable value jeopardizes the conclusions of these impairment tests.
(b) Long-Term Contracts
Long-term contracts are recorded in accordance with IAS 11 (“Construction Contracts”) when they include construction and delivery of a complex physical asset, or in accordance with IAS 18 (“Revenue”) in the other cases.
Costs incurred on contracts include the following:
the purchase of material, the subcontracting cost of engineering, ■
the cost of markets, and all other costs directly linked to the contract;
labor costs, related social charges and operating expenses that ■
are directly connected with contracts. Selling costs, research and development costs and the potential charge of “overabsorption” are excluded from those evaluations;
other costs, if any, which could be reinvoiced to the client when ■
specifi ed as such in the contract clauses.
Costs on construction contracts do not include financial expenses.

128 2009 Reference Document
Financial Information on the Company’s Assets, Financial Situation and Results
20.1. Consolidated Financial Statements20
Revenues on contracts at completion include:
the initial selling price; ■
every additional clause, variation order and modification ■
(“changes”) to the initial contract if it is probable that these changes could be reliably measured and that they would be accepted by the client;
financial result on contracts when a contract generates a ■
signifi cant net cash position.
Revenues on ongoing contracts are measured on the basis of costs incurred and of margin recognized at the percentage of completion determined for the contract according to the following method:
for contracts that include construction services subject to ■
performance commitments (turnkey contracts), the percentage of completion is based on technical milestones defi ned for the main components of the contracts once their progress is deemed suffi cient;
for other construction contracts, the percentage of completion ■
is recognized based on the ratio between costs incurred to date and estimated total costs at completion.
As soon as the estimate of the fi nal outcome of a contract indi-cates a loss, a provision is recorded for the entire loss.
The gross margin of long-term contract at completion is based on an analysis of total costs and income at completion, which are reviewed periodically and regularly throughout the life of the contract.
In accordance with IAS 11, construction contracts are presented in the balance sheet as follows: for each construction contract, the accumulated costs incurred, as well as the gross margin recognized at the contract’s percentage of completion (plus accruals for foreseeable losses if needed), after deduction of the payments received from the clients, are shown on the asset side under the “Construction Contracts – Amounts in Assets” line item if the balance of those combined components is a debit; if the balance is a credit, these are shown on the liability side under the “Construction Contracts – Amounts in Liabilities” line item.
A construction contract is considered completed when the last technical milestone is achieved, which occurs upon contractual transfer of ownership of the asset or temporary delivery, even if conditional. Upon completion of the contract:
the balance of “Construction Contracts – Amounts in Assets” ■
which at that time amounts to the total contract’s sale price, less accumulated payments received under this contract at the delivery date, is invoiced to the customer and recorded as current receivables on contracts (see Note 16 – Trade Receivables);
if necessary, a liability may be accrued and recorded in other ■
current payables in the balance sheet in order to cover pending expenses to get the acceptance certifi cate from the client.
As per IAS 18, the other long-term contacts are recorded as follows in the balance sheet: invoicing in advance of revenue to be recog-nized is recorded as advances received in “Other Current Liabilities” (see Note 25 – Other Current and Non-Current Liabilities); invoicing that trails revenues to be recognized is recorded in “Trade Receivables” (see Note 16 – Trade Receivables).
Costs incurred before signature of contract (“bid costs”), when they can be directly linked to a future construction contracts of which the signature is almost certain, are recorded in “Construction Contracts – Amounts in Assets” (see Note 15 – Construction Contracts), and then included in costs of ongoing contracts when contract is obtained. Bid costs are directly recorded into profi t & loss on the line “selling costs” when a contract is not secured.
(c) Foreign Currency Transactions and Financial Instruments
Foreign Currency Transactions ■
Foreign currency transactions are translated into the functional currency at the exchange rate applicable on the transaction date.
At the closing date, monetary assets and liabilities stated in foreign currencies are translated into the functional currency at the exchange rate prevailing on that date. Resulting exchange gains or losses are directly recorded in the income statement, excepting exchange gains or losses on cash accounts eligible for future cash fl ow hedging and for hedging on net foreign currency investments.
Translation of Financial Statements ■
for Foreign Companies
The income statements of foreign subsidiaries are translated into euro at the average rate of exchange prevailing during the year. Balance sheets are translated at the exchange rate at the closing date. Differences arising in the translation of fi nancial statements of foreign subsidiaries are recorded in shareholders’ equity as foreign currency translation reserve. The functional currency of the foreign subsidiaries is most commonlly the local currency.
Derivatives and Hedging Processing ■
Every derivative fi nancial instrument held by the Group is aimed at hedging future infl ows or outfl ows against exchange rate fl uctuations during the period of contract performance. Derivative instruments and in particular forward exchange transactions are aimed at hedging future infl ows or outfl ows against exchange rate fl uctuations in relation with awarded commercial contracts.
Foreign currency treasury accounts designated for a contract and used to fi nance its future expenses in foreign currencies may qualify as a foreign currency cash fl ow hedge.
An economic hedging may occasionally be obtained by offset-ting cash infl ows and outfl ows on a single contract (“natural hedging”).
When implementing hedging transactions, each Group’s subsidiary enters into forward exchange contracts with banks or with Technip Eurocash, the company that performs centralized treasury manage-ment for the Group. However, only instruments that involve a third party to the Group are designated as hedging instruments.

1292009 Reference Document
Financial Information on the Company’s Assets, Financial Situation and Results
20.1. Consolidated Financial Statements 20
A derivative instrument qualifi es for hedge accounting (fair value hedge or cash fl ow hedge) when there is a formal designation and documentation of the hedging relationship, and of the effective-ness of the hedge all along the life of the contract. A fair value hedge aims at reducing risks incurred by changes in the market value of some assets, liabilities or fi rm commitments. A cash fl ow hedge aims at reducing risks incurred by variations in the value of future cash fl ows that may impact net income.
In order for a currency derivative to be eligible for hedge accounting treatment, the following conditions have to be met:
its hedging role must be clearly defi ned and documented at the ■
date of inception;
its effi ciency should be proved at the date of inception and as ■
long as it remains effi cient. If the effi ciency test results in a score between 80 and 125 per cent, changes in fair value of the covered element must be almost entirely offset by the changes in fair value of the derivative instrument.
All derivative instruments are recorded and disclosed in the balance sheet at fair value.
derivative instruments considered hedging are classifi ed as ■
current assets and liabilities, as they follow the operating cycle;
derivative instruments not considered hedging are classifi ed as ■
current assets and liabilities.
Changes in fair value are recognized as follows:
Regarding cash fl ow hedge, the portion of the gain or loss ■
corresponding to the effectiveness of the hedging instrument is recorded directly in equity, and the ineffective portion of the gain or loss on the hedging instrument is recorded in the income statement. The exchange gain or loss on derivative cash fl ow hedging instruments, which is deferred in equity, is reclassifi ed in the net income of the period(s) when the specifi ed hedged transaction affects the income statement.
The changes in fair value of derivative fi nancial instruments ■
that qualify for hedging are recorded as fi nancial income or expenses. The ineffective portion of the gain or loss is immedi-ately recorded in the income statement. The carrying amount of a hedged item is adjusted by the gain or loss on this hedged item allocable to the hedged risk and is recorded in the income statement.
the changes in fair value of derivative fi nancial instruments that ■
do not qualify for hedging are directly recorded in the income statement.
The fair value of derivative fi nancial instruments is estimated on the basis of valuations provided by bank counterparties or fi nancial models commonly used in fi nancial markets, using market data at the balance sheet date.
Bid Contracts in Foreign Currency ■
To hedge its exposure to exchange rate fl uctuations during the bid-period of construction contracts, Technip occasionally enters into insurance contracts under which foreign currencies are exchanged at a specifi ed rate and at a specifi ed future date only if the new contract is awarded. The premium the Group pays to enter into such insurance contract is charged to the income statement when paid. If the commercial bid is not successful, the insurance contract is automatically terminated without any additional cash settlements or penalties.
In some cases, Technip may enter into foreign currency options for some proposals during the bid-period. These options can not be eligible for hedging.
(d) Business Combinations
Assets, liabilities and contingent liabilities acquired within business combinations are recorded and valued at their fair value using the purchase method. The remaining difference between the acquisi-tion cost and the share of the assets, liabilities and contingent liabilities acquired is posted on the “Goodwill” line item when signifi cant, under the “Intangible Assets” category. Goodwill is no longer amortized as per IFRS 3.
The net value of intangible assets is subject to impairment tests performed on a regular basis, using the discounted cash fl ow method on the basis of the estimates of cash fl ows generated by the business segments on which these goodwills are allocated, these estimates correspond to the most likely assumptions adopted by the Board of Directors. Impairment tests are based on estimates in terms of growth rates, operating margin rates, discount rates and corporate tax rates. The assumptions used are based on the three-year business plans for each business segment that have been approved by the Board of Directors.
The goodwill and corresponding assets and liabilities are allocated to the appropriate business segment.
Goodwill impairment analysis is performed annually during the fourth quarter or whenever there is an indication that an asset may be impaired.
Actual fi gures may differ from projections. If calculations show that an asset shall be impaired, an impairment expense is recognized.
(e) Segment Information
IFRS 8 was applied in advance to the Consolidated Financial Statements as of December 31, 2008. See Note 1 − A Summary of Signifi cant Accounting Principles.
Information by Business Segment ■
As per IFRS 8 an operating segment is a component of an entity:
that engages in business activities from which it may earn ■
revenues and incur expenses;
whose operating results are regularly reviewed by the entity’s ■
chief operating decision maker;
for which distinct fi nancial information is available. ■
Operating performance reports to the main operating decision maker, the Group Executive Committee, are organized along four segments:
the Subsea segment, which includes the design, manufacture, ■
procurement and installation of subsea equipment;
the Offshore segment, which includes the design and construc- ■
tion of fi xed or fl oating Facilities and surface installations;
the Onshore segment, which includes the entire engineering ■
and construction business for petrochemical and refi ning plants as well as facilities for developing onshore oil and gas fi elds, including gas treatment units, liquefi ed natural gas (LNG) units and onshore pipelines, it also includes the engineering and construction of non-petroleum facilities;

130 2009 Reference Document
Financial Information on the Company’s Assets, Financial Situation and Results
20.1. Consolidated Financial Statements20
the Corporate segment, which includes holding company activi- ■
ties and central services rendered to Group subsidiaries, of which IT services and reinsurance activity.
Segment information relating to balance sheet and profi t and loss statements are prepared in accordance with IFRS.
The segment result disclosed by Technip in its business segment information is the “Operating Income / (Loss) from Recurring Activities” and the “Operating Income / (Loss)”. Consequently, the segment result does not include fi nancial income and expenses (except fi nancial result on contracts), income tax expense (because of shared treasury and tax management), or the share of income / (loss) of associates accounted for using the equity method. Segment assets do not include asset items related to the latter, such as income tax assets. Similarly, segment liabilities do not include liability items that are not connected to segment result, such as current and deferred income tax liabilities.
Information by Geographical Area ■
From a geographical standpoint, operating activities and perfor-mances of Technip are reported on the basis of fi ve areas, as follows:
Europe, Russia and Central Asia; ■
Africa; ■
Middle East; ■
Asia Pacifi c; ■
Americas. ■
The segment result disclosed by Technip in its geographical segment information is the “Operating Income / (Loss) from Recurring Activities” and the “Operating Income / (Loss)”.
Consequently, the segment result does not include fi nancial income and expenses (except fi nancial result on contracts), income tax expense or the share of income / (loss) of associates accounted for using the equity method. Segment assets do not include asset items related to the latter, such as income tax assets.
Geographical areas are defi ned according to the following criteria: specifi c risks associated with activities performed in a given area, similarity of economic and political framework, regulation of exchange control, and underlying monetary risks.
The split per geographical area is based on the contract delivery within the specifi c country.
(f) Operating Income from Recurring Activities and Operating Income
As per IAS 1, gains and losses from sale of activities are included in operating income. They are disclosed on a separate line (“Income / (Loss) from Sale of Activities”), between Operating Income / (Loss) from Recurring Activities and Operating Income / (Loss). The same applies to other non-current income and expenses.
(g) Financial Result on Contracts
The fi nancial result of treasury management related to construc-tion contracts is recorded together with the revenues. Only the
fi nancial result on treasury not related to long-term contracts is separately disclosed in the consolidated statement of income under the “Financial Income” and “Financial Expenses” line items.
(h) Income / (Loss) from Discontinued Operations
In compliance with IFRS 5, the result incurred by the discontinued operations through sales or disposals is recorded under this line item. Discontinued operations consist of a whole line of business or geographical area.
(i) Earnings per Share
As per IAS 33 “Earnings per Share”, earnings per share are based on the average number of outstanding shares over the period, after deducting treasury shares.
Diluted earnings per share amounts are calculated by dividing the net profi t of the period, restated if need be for the after-tax fi nancial cost of dilutive fi nancial instruments, by the weighted average number of outstanding shares, plus the weighted average number of stock options not yet exercised plus the weighted average number of attributed free shares calculated using the share purchase method, and if need be, the effects of any other dilutive instrument.
In accordance with share purchase method, only dilutive instru-ments are used in calculating EPS. Dilutive instruments are those for which subscription price of the stock options plus the future IFRS 2 expense not yet recognized is lower than the average share price during the EPS calculation period.
(j) Property, Plant and Equipment (Tangible Assets)
In compliance with IAS 16 “Property, Plant and Equipment”, an asset is recognized only if the cost can be measured reliably and if future economic benefi ts are expected from its use.
Property, plant and equipment are carried at their historical cost or at their fair value in case of business combinations.
As per IAS 16, Technip uses different depreciation periods for each of the signifi cant components of a single property, plant and equipment asset when the useful life of the component differs from that of the main asset. Following are the useful lives most commonly applied by the Group:
Buildings 10 to 50 years ■
Vessels 10 to 25 years ■
Machinery and Equipment 6 to 10 years ■
Offi ce Fixtures and Furniture 5 to 10 years ■
Vehicles 3 to 7 years ■
IT Equipment 3 to 5 years ■
If the residual value of an asset is material and can be measured, it is taken into account in defi ning its depreciable amount.
On a regular basis, the Group reviews the useful lives of the assets. That review is based on the effective use of the assets.

1312009 Reference Document
Financial Information on the Company’s Assets, Financial Situation and Results
20.1. Consolidated Financial Statements 20
As per IAS 17, assets at the Group’s disposal through lease contracts are capitalized when almost all risks and benefi ts related to the asset property have been transferred to the Group. This standard was not applicable to the Technip Group’s Consolidated Financial Statements.
As per IAS 16, dry dock expenses are capitalized as a distinct component of the principal asset. They are amortized over a period of 3 to 5 years.
Amortization costs are recorded in the income statement as a function of the fi xed assets’ use, splited between the following line items: cost of sales, research and development costs, selling costs or general administrative costs.
In accordance with IAS 36, the carrying value of property, plant and equipment is reviewed for impairment whenever internal or external events indicate that there may be impairment. If such is the case, an impairment loss is recognized.
Starting in 2009, borrowing costs related to assets under construc-tion are capitalized as part of the value of the asset.
(k) Intangible Assets
Research and Development Costs Generated ■
Internally
Research costs are expensed when incurred. In compliance with IAS 38, development costs are capitalized if all of the following criteria are met:
the projects are clearly identifi ed; ■
the Group is able to measure reliably the expenditure incurred ■
by each project during its development;
the Group is able to demonstrate the technical feasibility of ■
the project;
the Group has the fi nancial and technical resources available ■
to achieve the project;
the Group can demonstrate its intention to complete, to use or ■
to commercialize products resulting from the project;
the Group is able to demonstrate the existence of a market for ■
the output of the intangible asset, or, if it is used internally, the usefulness of the intangible asset.
As not all of these conditions were met at the closing date of these fi nancial statements, no development expenses were capi-talized, except some expenses related to IT projects developed internally.
Other Intangible Assets ■
Patents are amortized over their useful life, generally on a straight line basis over 10 years. Costs related to software rights are capi-talized, as are those related to creating proprietary IT tools, such as the E-procurement platform, or Group management applications which are amortized over their useful life, generally 5 years.
(l) Other Financial Assets
Other fi nancial assets are recorded at fair value or at historical cost, at the transaction date, if there is no way to evaluate them reliably. In the latter case, impairment is recorded if the recoverable value is lower than the historical cost. The estimated recoverable value is computed by type of fi nancial asset based on the future profi tability or the market value of the company considered, as well as its net equity if needed.
Non-Consolidated Investments ■
On initial recognition, non-consolidated investments are recog-nized at their acquisition cost including directly attributable transaction costs.
At closing date, these investments are measured at their fair value. As investments under this category relate to unlisted securities, fair value is determined on the basis of discounted cash fl ows or failing that, based on the Group’s share in the company’s equity.
These companies are mainly entities without any business activity. Therefore, their investments are fully depreciated.
Receivables Related to Investments ■
This category comprises loans and advances through current accounts granted to non-consolidated companies or associates accounted for using the equity method.
Security Deposits and Others ■
This category essentially includes guarantee security deposits and escrow accounts related to litigation or arbitration.
(m) Inventories
Inventories are recognized at the lower of cost or market value with cost being principally determined on a weighted-average cost basis.
Provisions for depreciation are recorded when inventories’ net realizable value is lower than their net book value.
(n) Advances Paid to Suppliers
Advance payments made to suppliers under long-term contracts are shown under the “Advances to Suppliers” line item, on the asset side of the balance sheet.
(o) Trade Receivables
Trade receivables are measured at fair value. A provision for doubtful accounts is recorded when the Group assesses the recoverable value is lower than the fair value.

132 2009 Reference Document
Financial Information on the Company’s Assets, Financial Situation and Results
20.1. Consolidated Financial Statements20
Trade receivables only relate to contracts accounted for as per IAS 18 (See Note 1-C-(b) Construction Contracts) and delivered contracts.
(p) Cash and Cash Equivalents
Cash and cash equivalents consist of cash in bank and in hands, as well as marketable securities fulfi lling the following criteria: a maturity of usually less than three months, highly liquid, a fi xed exchange value and an insignifi cant risk of loss of value. Marketable securities are measured at their market value at period-end. Any change in fair value is recorded in the income statement.
(q) Treasury Shares
Treasury shares are recorded as a deduction to equity at their cost of acquisition. Any gain or loss connected with the sale of treasury shares is recognized directly in equity without affecting the income statement.
(r) Stock Options and Free Share Allocations
In accordance with IFRS 2, stock options and free share allocations constitute a benefi t to the recipients and represent additional compensation paid by the Group. This supplementary benefi t is recognized as follows: the fair value of the granted stock options and shares which correspond to the services rendered by the employees against the options and shares received – is determined at the grant date and recorded as an expense against equity line item.
The fair value of the stock options, the share purchase options or free share allocations is determined using the Cox Ross Rubinstein binomial model. The model takes into account the features of the stock option plan (net price, exercise period) and the market data at the grant date (risk-free rate, volatility, share price).
The IFRS 2 applies to share-based payment plans granted after November 7, 2002 and not vested before January 1, 2005.
(s) Capital Increase Reserved for Employees
In compliance with IFRS 2, the benefi t granted to employees in the form of the price discount on capital increases reserved for employees is recorded by the Group as an expense. See Note 20-(j) Capital Increase reserved for Employees.
(t) Provisions
Accrued liabilities are recognized if and only if the following criteria are simultaneously met:
the Group has a present obligation (legal or constructive) as a ■
result of a past event;
the settlement of the obligation will likely require an outfl ow ■
of resources embodying economic benefi ts;
the amount of the obligation can be reliably estimated; provi- ■
sions are measured according to the risk assessment or the exposed charge, based upon the best-known elements.
Current Provisions ■
Contingencies related to contracts: these provisions relate to litigation on contracts.
Restructuring: once a restructuring plan has been decided and that interested parties have been informed, the plan is scheduled and valued. Restructuring provisions are recognized in compliance with the IAS 37.
Non-Current Provisions ■
Employee benefi ts: the Group is committed in various long-term employee benefi t plans. Those obligations will be settled either at the employee departure dates or later on. The main defi ned benefi t plans can be, depending on the affi liates:
end-of-career benefi ts, which are to be paid at the retirement date; ■
deferred wage benefi ts, which are to be paid when an employee ■
leaves the company;
retirement benefi ts, which are to be paid in the form of a pension. ■
In accordance with IAS 19, the obligations of providing benefi ts under the defi ned benefi t plans are determined by independent actuaries using the projected unit credit actuarial valuation method. The actuarial assumptions used to determine the obliga-tions may vary depending on the country. The actuarial estimation is based on usual parameters such as future wage and salary increases, life expectancy, staff turnover, infl ation rate and rate of return on investment.
The defi ned benefi t liability comprises the present value of the defi ned benefi t obligation less past service costs and actuarial gains and losses not yet recognized and less the fair value of plan assets out of which the obligations are to be settled. Present value of the defi ned benefi t obligation is determined using present value of future cash disbursements based on interest rates of convertible bonds, in the currency used for benefi t payment, and whose life is equal to average expected life of defi ned benefi t plan. Applying the corridor approach, actuarial gains and losses are recognised as income or expenses when the net cumulative unrecognized actuarial gains and losses for each individual plan at the end of the previous reporting period exceed 10% of the higher of the defi ned benefi t obligation and the fair value of plan assets at that date. These gains and losses are amortised over the remaining working lives.
IAS 19 amendment opens the possibility to record actuarial gains and losses directly in equity from January 1, 2006. This option has not been retained by the Group.
(u) Deferred Income Tax
Deferred income taxes are recognized in accordance with IAS 12, using the liability method (use of the last forecast tax rate passed or almost passed into law at the closing date), on all temporary differences at the balance sheet date, between the tax bases of assets and liabilities and their carrying amounts for each Group’s company.
Deferred income taxes are reviewed at each balance sheet date to take into account the effect of any changes in tax law and in the prospects of recovery.

1332009 Reference Document
Financial Information on the Company’s Assets, Financial Situation and Results
20.1. Consolidated Financial Statements 20
Deferred income tax assets are recognized for all deductible temporary differences, unused tax credits carryforwards and unused tax losses carryforwards, to the extent that it is probable that taxable profi t will be available.
To estimate properly the ability for a subsidiary to recover the deferred tax assets, the following items are taken into account:
existence of temporary differences which will cause taxation ■
in the future;
forecasts of taxable results; ■
analysis of the past taxable results; ■
existence of signifi cant and non-recurring income and expenses, ■
included in the past tax results, which should not repeat in the future.
Deferred income tax liabilities are recognized for all taxable temporary differences, except particular circumstances that may justify the non-recognition of this potential debt.
When a tax consolidation mechanism is in place for companies in a given country, the deferred tax calculation takes into account the individual tax situation of each subsidiary located in that country as well as the overall situation of all subsidiaries included in the scope of consolidation.
Assets and liabilities are not discounted except those whose tax base is discounted by nature (for instance, pensions).
(v) Financial Debts (Current and Non-Current)
Current and non-current fi nancial debts include bond loans and other borrowings. Issuance fees and redemption premium on convertible bonds are included in the cost of debt on the liability side of the balance sheet, as an adjustment to the nominal amount of the debt. The difference between the initial debt and the redemption at maturity is amortized at the effective interest rate.
(w) Assets and Liabilities Held for Sale
The Group considers every non-current asset as an asset held for sale if it is very likely that its book value will be recovered principally by a sale transaction rather than by its continued use. Assets classifi ed as held for sale are measured at the lower of either the carrying amount or the fair value less selling costs.
Note 2 – Scope of Consolidation
(a) Changes in Scope of Consolidation
Year Ended December 31, 2009
In 2009 the Group made the following acquisitions:
On February 9, 2009, Technip Maritime do Brasil Ltda acquired ■
TPAR Terminal Portuario de Angra dos Reis S/A, a Brazilian company holding a lease for a port land in Angra Porto. Between February 9, 2009 and December 31, 2009 TPAR generated revenues of €1.6 million and a net loss of €0.1 million. The total balance sheet of the company amounted to €6.8 million as of December 31, 2009. Goodwill amounted to €8.0 million and was accounted for as intangible asset amortized over the 15-year lease period that remains.
On June 12, 2009, Technip Norge AS and Technip Cofl exip Norge ■
AS acquired respectively 90% and 10% of North Ocean III KS, a Norwegian company that owns a vessel under construction (Apache II).
The following subsidiaries were created: Technip Ships Norge AS, 100% owned by Technip and fully consolidated; TSU Niger SARL, 60% owned by Technip and consolidated under the proportionate method; Technip Italy Direzione Lavori, 100% owned by Technip and fully consolidated; Technip Thailand Ltd., 49% owned by Technip and consolidated under the proportionate method; and Technip Operadora Portuaria, 100% owned by Technip and fully consolidated.
During the period, Cofl exip Maritime Inc. was merged into Technip USA Holdings Inc., Gulf Deepwater Yards Inc. was merged into Technip USA Inc. and EPG Holding BV and BV Uitzendbureau UPG were merged into Technip EPG BV.
Two companies, SCI CB3-Défense and Aransas Partners, were closed.
No company included in the scope of consolidation was sold in 2009.
Year Ended December 31, 2008
In 2008, the Group realized the following acquisitions:
On July 1, 2008, Technip Benelux BV acquired EPG Holding BV ■
(and two subsidiaries). The operating entity (Technip EPG BV), a specialized engineering company based in the Netherlands, employs around 120 people and its revenues amounted to €4.4 million for the second half of 2008. EPG is dedicated to the Onshore segment. The goodwill arising from this operation amounted to €3.9 million and, in the absence of any identifi able asset, was allocated entirely to goodwill.
On July 10, 2008, Technip acquired Eurodim an engineering ■
and consulting company based near Paris. Eurodim employees around 20 people and revenues amounted to €1.0 million for the period from July 10, 2008 to December 31, 2008. Eurodim is dedicated to the Offshore segment. Goodwill amounted to €9.8 million, of which €3.7 million was recorded as patents (amortized over 14.5 years on average) and €6.1 million was recorded in this specifi c line item.
On December 31, 2008, Cofl exip Développement acquired ■
Sofremines an engineering company based near Paris. Sofremines, renamed Technip Mines, employs around 20 people and is dedicated to the Onshore segment. In the absence of any identifi able asset, the goodwill arising from this operation amounted to €1.0 million and was allocated entirely to this specifi c line item.
The following subsidiaries were created: Genesis Oil and Gas Consultant Canada, 100% owned by Technip and fully consoli-dated; Techdof, 50% owned by Technip, and TSU Projects, 60% owned by Technip, consolidated under proportionate method.
During the period, Citex was merged into Technip France and RJ Brown Deepwater was merged into Technip USA Holdings Inc.
Technip Biopharm, Technip Upstream Management, Cofl exip Stena Offshore AS, TSKJ-US LLC, TSKJ Italia SRL, TS Usan and Consortio Jantec were closed.
No activity was sold in 2008.

134 2009 Reference Document
Financial Information on the Company’s Assets, Financial Situation and Results
20.1. Consolidated Financial Statements20
(b) Scope of Consolidation as of December 31, 2009
Fully Consolidated Companies CountryDecember 31, 2009
% Control
Technip France Consolidating Entity
Technip France France 100%
Technip Eurocash France 100%
Technip TPS France 100%
T.T.I.L. France 100%
Eurobatch France 100%
SNPE Ingénierie Défense France 100%
Seal Engineering France 100%
Cofri France 100%
Clecel France 100%
Technipnet France 100%
Technip Nouvelle-Calédonie France 100%
Technip Offshore International France 100%
Flexi France France 100%
Middle East Projects International (Technip MEPI) France 100%
Technip Marine France 100%
Angofl ex France 100%
Technip Mines France 100%
Setudi France 100%
Safrel France 100%
Technip Corporate Services France 100%
Eurodim France 100%
Technip Angola Angola 60%
Angofl ex Lda. Angola 70%
Technip Oceania (Pty) Ltd. Australia 100%
Technip CSO Australia (Pty) Ltd. Australia 100%
Technip CSO Oil & Gas (Pty) Ltd. Australia 100%
Genesis Oil & Gas Consultants (Pty) Ltd. Australia 100%
Technip Maritime Overseas Bahamas 100%
Technip Benelux NV Belgium 100%
Technip Capital Belgium 100%
ABAY Engineering Belgium 100%
Technip Brasil Engenharia Brazil 100%
Technip Operadora Portuaria Brazil 100%
TPAR – Terminal Portuario de Angra dos Reis S/A Brazil 70%
Flexibras Tubos Flexiveis Brazil 100%
Technip Maritime Do Brazil Brazil 100%
Brasfl ex Overseas British Virgin Island 100%
Genesis Oil & Gas Canada Consultants Ltd. Canada 100%
Technip Canada Canada 100%
Sea Oil Marine Services Cayman Islands, British West-Indies 100%
CSO Oil & Gas Technology (West Africa) Channel Islands 100%
Technip Engineering Consultant (Shanghai) China 100%
Technip Tianchen Chemical Engineering China 100%
Technip Offshore Finland OY Finland 100%
Technip Germany Germany 100%
Technip Seiffert Germany 100%
M. Seiffert Industrieanlagen Germany 100%
Technipetrol Hellas SA Greece 99%
Technip KT India India 100%
SEAMEC India 75%
PT Technip Indonesia Indonesia 98.40%

1352009 Reference Document
Financial Information on the Company’s Assets, Financial Situation and Results
20.1. Consolidated Financial Statements 20
Fully Consolidated Companies CountryDecember 31, 2009
% Control
Consorzio Technip Italy Procurement Services Italy 100%
Technip Italy Italy 100%
Technip Italy Direzione Lavori Italy 100%
TPL Italy 100%
Stena Offshore (Jersey) Jersey 100%
Technip Far East Malaysia 100%
Technip Geoproduction (M) Malaysia 30%
Asiafl ex Products Malaysia 100%
Cofl exip Stena Offshore (Mauritius) Mauritius 100%
Technip de Mexico S. de R. L. de C.V. Mexico 100%
Technip Servicios de Mexico S.C. Mexico 100%
Flexservice N.V. Netherland Antilles 100%
Sunfl ex Offshore N.V. Netherland Antilles 100%
Technip Benelux BV Netherlands 100%
Technip Holding Benelux BV Netherlands 100%
Technip E.P.G. BV Netherlands 100%
Technipnet BV Netherlands 100%
Technip Oil & Gas BV Netherlands 100%
Technip Offshore NV Netherlands 100%
Technip Offshore Contracting BV Netherlands 100%
Technip Offshore (Nigeria) Nigeria 100%
Neptune Maritime Nigeria Nigeria 66.91%
North Ocean III KS Norway 100%
Technip Norge AS Norway 100%
Technip Cofl exip Norge AS Norway 100%
Technip Ships Norge AS Norway 100%
Technip Overseas Panama 100%
Technip Polska Poland 100%
Technip C.I.S. Russia 70%
Technip Saudi Arabia Saudi Arabia 40%
TPL Arabia Saudi Arabia 90%
Technip Singapore Singapore 97.60%
Cofl exip Singapore Pte. Ltd. Singapore 100%
TP-NPV Singapore Singapore 100%
Technip Iberia Spain 100%
Technip International AG Switzerland 100%
Engineering Re Switzerland 100%
Technip USA U.S.A. 100%
Technip USA Holdings Inc. U.S.A. 100%
DUCO Inc. U.S.A. 100%
Technip Offshore Moorings U.S.A. 100%
Genesis Oil & Gas Consultants Inc. U.S.A. 100%
Deepwater Technologies U.S.A. 75%
Technip Middle East United Arab Emirates 100%
TPG (UK) United Kingdom 100%
Technip Offshore Holdings United Kingdom 100%
Technip UK United Kingdom 100%
Technip Ships One United Kingdom 100%
Technip Ships Three United Kingdom 100%
Technip-Cofl exip UK Holding United Kingdom 100%
Cofl exip UK United Kingdom 100%
DUCO Ltd. United Kingdom 100%
Genesis Oil & Gas Consultants Ltd. United Kingdom 100%
Spoolbase UK United Kingdom 100%

136 2009 Reference Document
Financial Information on the Company’s Assets, Financial Situation and Results
20.1. Consolidated Financial Statements20
Fully Consolidated Companies CountryDecember 31, 2009
% Control
Genesis Oil & Gas Ltd. United Kingdom 100%
Technip Maritime UK United Kingdom 100%
Technip Offshore Manning Services United Kingdom 100%
Subsea Integrity Group United Kingdom 100%
Technip Bolivar Venezuela 100%
TPVI Virgin Island, U.S.A. 100%
Consolidated Companies under Proportionate Method CountryDecember 31, 2009
% Control
Consorcio Intep France 90%
Dalia Floater Angola France 55%
Saibos Akogep France 30%
Yemen Project Coordination Services France 33.33%
TSLNG France 50%
TSU Projects France 60%
TSS Dalia France 55%
SPF-TKP Omifpro/SP-TKP Fertilizer France/Italy 50%
Consorcio Contrina France/Venezuela 34.40%
Technip Subsea 7 Asia Pacifi c (Pty) Ltd. Australia 55%
Petrolinvest Bosnia 33%
FSTP Brasil Ltda. Brazil 25%
Tipiel Colombia 44.10%
ProTek Germany Germany 50%
Technip India India 50%
Consorzio Overseas Bechtel/Technip Italy Italy 50%
Technip Subsea 7 Asia Pacifi c BV Netherlands 55%
TSU Niger SARL Niger 60%
Nigetecsa Free Zone Enterprise Nigeria 50%
Crestech Engineering Nigeria 39%
Doftech DA Norway 50%
Techdof DA Norway 50%
TSKJ Servicos de Engenharia Lda./TSKJ II/LNG Servicos e Gestao de projectos Lda./Bonny Project Management Co./TSKJ Nigeria
Portugal/United Kingdom/U.S.A./Italy/Nigeria 25%
FSTP Pte Ltd. Singapore 25%
Technip Subsea 7 Asia Pacifi c Singapore Pte. Ltd. Singapore 55%
Technip South Africa Pty. Ltd. South Africa 51%
Technip (Thailand) Ltd. Thailand 49%
Technip Zachry-Saipem LNG LP. U.S.A. 43%
Deep Oil Technology U.S.A. 50%
Spars International U.S.A. 50%
C.T.M.E. FZCO United Arab Emirates 50%
Yemgas FZCO United Arab Emirates 33.33%
CTEP FZCO United Arab Emirates 40%
Technip Subsea 7 Asia Pacifi c UK Ltd. United Kingdom 55%
Consolidated Companies Under Equity Method CountryDecember 31, 2009
% Control
Technip KTI and its subsidiaries Italy 25%
All consolidated companies close their accounts on December 31 except Technip KT India, Technip India and Technip South Africa. Technip KT India and Technip India close their accounts on March 31, and Technip South Africa closes its accounts on June 30. However they perform an interim account closing on December 31, of which external auditors perform a limited review.

1372009 Reference Document
Financial Information on the Company’s Assets, Financial Situation and Results
20.1. Consolidated Financial Statements 20
Note 3 – Segment Information
The split by business segment and by geographical segment is done in accordance with IFRS 8. See Note 1-C-(e) Segment Information.
(a) Information by Business Segment
2009
In millions of Euro Subsea Offshore Onshore Corporate
Not Allocable
and Eliminations
Total Continuing Operations
Discontinued Operations Total
Revenues 2,866.1 565.0 3,024.9 - - 6,456.0 - 6,456.0
Gross Margin 715.6 96.8 329.6 (0.1) - 1,141.9 - 1,141.9
Operating Income/(Loss) from Recurring Activities 532.6 39.3 151.7 (46.9) - 676.7 - 676.7
Income / (Loss) from Sale of Activities 5.3 - - - (7.8) (2.5) - (2.5)
Provision for litigation - - - - (245.0) (245.0) - (245.0)
Operating Income/(Loss) 537.9 39.3 151.7 (46.9) (252.8) 429.2 - 429.2
Financial Income/(Expenses) - - - - (60.7) (60.7) - (60.7)
Share of Income/(Loss) of Associates Accounted for Using the Equity Method - - 4.7 - - 4.7 - 4.7
Income Tax Expense - - - - (194.7) (194.7) - (194.7)
Discontinued Operations - - - - - - - -
Net Income/(Loss) for the Year NA NA NA NA NA 178.5 - 178.5
Segment Assets 5,014.4 694.1 2,457.1 37.4 - 8,202.9 - 8,202.9
Investments in Associates Accounted for Using the Equity Method - - 9.3 - - 9.3 - 9.3
Unallocated Assets - - - - 357.8 357.8 - 357.8
Total Assets 5,014.4 694.1 2,466.4 37.4 357.8 8,570.0 - 8,570.0
Segment Liabilities(1) 2,275.5 342.4 2,026.0 748.4 245.0 5,637.3 - 5,637.3
Unallocated Liabilities(2) - - - - 2,932.7 2,932.7 - 2,932.7
Total Liabilities 2,275.5 342.4 2,026.0 748.4 3,177.7 8,570.0 - 8,570.0
Other Segment Information
Backlog(3) 3,053.0 467.9 4,497.4 - - 8,018.3 - 8,018.3
Order Intake(4) 2,480.4 554.1 4,141.2 - - 7,175.7 - 7,175.7
Capital Expenditures:
Property, Plant and Equipment 396.8 7.4 9.0 - - 413.2 - 413.2
Intangible Assets 2.6 0.7 7.1 - - 10.4 - 10.4
Amortization:
Property, Plant and Equipment (110.4) (8.1) (13.2) (0.4) - (132.0) - (132.0)
Intangible Assets (9.9) (11.2) (1.2) - - (22.3) - (22.3)
Impairment of Assets (69.8) - - - - (69.8) - (69.8)
(1) The segment liabilities of the Corporate segment include fi nancial debts such as bond loan and other borrowings.(2) Unallocated liabilities correspond mostly to shareholders’ equity.(3) The backlog corresponds to ongoing contracts still to be delivered. The backlog is defi ned as the difference between the total contractual sale prices of all contracts in force
and the cumulative revenues recognized at that date on these contracts.(4) The order intake corresponds to signed contracts which have come into force.

138 2009 Reference Document
Financial Information on the Company’s Assets, Financial Situation and Results
20.1. Consolidated Financial Statements20
2008
In millions of Euro Subsea Offshore Onshore Corporate
Not Allocable
and Eliminations
Total Continuing Operations
Discontinued Operations Total
Revenues 2,689.0 695.2 4,097.2 - - 7,481.4 - 7,481.4
Gross Margin 711.3 100.8 326.6 1.0 - 1,139.7 - 1,139.7
Operating Income/(Loss) from Recurring Activities 523.2 38.6 153.7 (58.6) - 656.9 - 656.9
Income / (Loss) from Sale of Activities - - - - - - - -
Operating Income/(Loss) 523.2 38.6 153.7 (58.6) - 656.9 - 656.9
Financial Income/(Expenses) - - - (30.1) 19.1 (11.0) - (11.0)
Share of Income/(Loss) of Associates Accounted for Using the Equity Method - - 2.2 - - 2.2 - 2.2
Income Tax Expense - - - - (193.8) (193.8) - (193.8)
Discontinued Operations - - - - - - - -
Net Income/(Loss) for the Year NA NA NA NA NA 454.3 - 454.3
Segment Assets 3,907.8 787.5 2,100.2 220.2 - 7,015.7 - 7,015.7
Investments in Associates Accounted for Using the Equity Method - - 6.7 - - 6.7 - 6.7
Unallocated Assets - - - - 1,109.5 1,109.5 - 1,109.5
Total Assets 3,907.8 787.5 2,106.9 220.2 1,109.5 8,131.9 - 8,131.9
Segment Liabilities (1) 1,727.6 354.7 2,498.5 811.2 - 5,392.0 - 5,392.0
Unallocated Liabilities (2) - - - - 2,739.9 2,739.9 - 2,739.9
Total Liabilities 1,727.6 354.7 2,498.5 811.2 2,739.9 8,131.9 - 8,131.9
Other Segment Information
Backlog(3) 3,495.9 461.1 3,251.4 - - 7,208.4 - 7,208.4
Order Intake(4) 2,854.4 517.6 2,382.7 - - 5,754.7 - 5,754.7
Capital Expenditures:
Property, Plant and Equipment 362.4 11.1 15.5 0.2 - 389.2 - 389.2
Intangible Assets 0.4 0.5 1.7 9.5 - 12.1 - 12.1
Amortization:
Property, Plant and Equipment (116.1) (5.6) (14.6) (2.7) - (139.0) - (139.0)
Intangible Assets (6.0) (2.6) (1.5) (2.0) - (12.1) - (12.1)
Impairment of Assets (29.3) (7.3) - (30.4) - (67.0) - (67.0)
(1) The segment liabilities of the Corporate segment include fi nancial debts such as bond loan and other borrowings.(2) Unallocated liabilities correspond mostly to shareholders’ equity.(3) The backlog corresponds to ongoing contracts still to be delivered. The backlog is defi ned as the difference between the total contractual sale prices of all contracts in force
and the cumulative revenues recognized at that date on these contracts.(4) The order intake corresponds to signed contracts which have come into force.

1392009 Reference Document
Financial Information on the Company’s Assets, Financial Situation and Results
20.1. Consolidated Financial Statements 20
(b) Information by Geographical Segment
2009
In millions of Euro
Europe, Russia,
Central Asia AfricaMiddle
EastAsia
Pacifi c Americas Not Allocable Total
Revenues(1) 1,726.5 942.6 1,467.0 765.7 1,554.2 - 6,456.0
Operating Income/(Loss) from Recurring Activities 220.7 207.3 (63.4) 103.8 255.2 (46.9) 676.7
Operating Income/(Loss) 222.1 208.7 (63.4) 104.3 257.2 (299.7) 429.2
Intangible Assets (excluding Goodwill)(2) 26.3 0.5 - 0.7 11.4 - 38.9
Property, Plant and Equipment(3) 277.0 11.3 1.0 62.2 105.6 737.4 1,194.5
Financial Assets(4) 18.4 3.7 1.5 5.0 14.7 - 43.3
(1) Of which revenues earned in France: € 85.7 million and in Qatar: € 749.5 million.(2) Of which intangible assets in France: € 25.0 million and in Brazil: € 10.8 million.(3) Of which tangible assets in France: € 125.7 million. Besides, the fl eet of vessels (including vessels under construction) that operate in different geographical regions
and therefore cannot be allocated to a specifi c region, is presented in “Not allocable”.(4) Of which fi nancial assets in Italy: € 12.2 million, in the United States: € 11.3 million and in France: € 5.8 million.
2008
In millions of Euro
Europe, Russia,
Central Asia AfricaMiddle
EastAsia
Pacifi c Americas Not Allocable Total
Revenues(1) 1,682.2 780.8 2,213.5 1 034.5 1 770.4 - 7 481.4
Operating Income/(Loss) from Recurring Activities 266.8 158.2 (28.5) 141.2 177.8 (58.6) 656.9
Operating Income/(Loss) 266.8 158.2 (28.5) 141.2 177.8 (58.6) 656.9
Intangible Assets (excluding Goodwill)(2) 26.2 0.5 - 0.7 12.6 - 40.1
Property, Plant and Equipment(3) 253.7 15.2 3.8 41.6 85.8 544.9 945.0
Financial Assets(4) 17.4 3.3 1.1 2.0 9.6 - 33.5
(1) Of which revenues earned in France: € 123.9 million and in Qatar: € 1,292.7 million.(2) Of which intangible assets in France: € 24.5 million and in the United States: € 12.5 million.(3) Of which tangible assets in France: € 112.6 million and in the United Kingdom: € 88.0 million. Besides, the fl eet of vessels (including vessels under construction)
that operate in different geographical regions and therefore cannot be allocated to a specifi c region, is presented in “Not allocable”.(4) Of which fi nancial assets in France: € 6.9 million, in Italy: € 10.1 million and in Nigeria: € 3.3 million.
Note 4 – Operating Income / (Loss)
The breakdown of the different items of “Operating Income / (Loss)” by nature is as follows:
(a) Revenues
Revenues break down as follows:
In millions of Euro 2009 2008
Rendering of Services 6,398.5 7,391.7
Sales of Goods 32.0 43.9
Financial Result on Contracts(1) 25.5 45.8
Revenues 6,456.0 7,481.4
(1) Financial income and expenses arising from cash position of ongoing contracts are included in revenues for € 25.5 million in 2009 vs € 45.8 million in 2008. The decrease is due to the progress on ongoing contracts.
In 2009, the fi ve main customers of the Group represented the following contribution to Group revenues: 11.8%, 6.9%, 6.0%, 4.1% and 3.5%. In 2008, the fi ve main customers of the Group represented 8.5%, 7.6%, 3.9%, 3.9% and 3.4% of Group revenues.

140 2009 Reference Document
Financial Information on the Company’s Assets, Financial Situation and Results
20.1. Consolidated Financial Statements20
(b) Cost of Sales by Nature
The cost of sales comprises the following items:
In millions of Euro 2009 2008
Employee Benefi t Expenses (1,080.3) (1,040.6)
Operating Leases (91.9) (58.0)
Amortization of Intangible Assets (19.6) (10.1)
Amortization and Depreciation of Tangible Assets (195.7) (147.2)
Purchases, External Charges and Other Expenses (3,926.6) (5,085.8)
Total Cost of Sales (5,314.1) (6,341.7)
(c) Research and Development Costs
Research and development costs amounted to €53.5 million in 2009 compared to €44.9 million in 2008. No development costs were capitalized during the periods as the projects did not meet the requirements for capitalization (See Note 1-C-(k) Intangible Assets).
(d) Administrative Costs by Nature
Administrative costs by nature break down as follows:
In millions of Euro 2009 2008
Employee Benefi t Expenses(1) (161.4) (141.3)
Operating Leases (15.6) (38.5)
Amortization of Tangible Assets (5.9) (17.3)
Purchases, External Charges and Other Expenses (89.8) (90.6)
Total Administrative Costs (272.7) (287.7)
(1) Including charges for stock options and allocation of free shares: €38.6 million in 2009 compared to €23.0 million in 2008; and in 2008 charges related to the capital increase reserved for employees: €3.1 million.
(e) Other Operating Income
Other operating income breaks down as follows:
In millions of Euro 2009 2008
Proceeds from Property, Plant and Equipment Sales 0.8 3.3
Proceeds from Financial Asset Sales 2.1 1.8
Reinsurance Income 21.9 17.2
Others 2.9 3.2
Total Other Operating Income 27.7 25.5
(f) Other Operating Expenses
Other operating expenses break down as follows:
In millions of Euro 2009 2008
Net Book Value of Disposed/Written-off Assets(1) (2.0) (34.1)
Depreciation of Intangible Assets(1) - (8.2)
Reinsurance Costs (13.8) (12.0)
Others (1.7) -
Total Other Operating Expenses (17.5) (54.3)
(1) In 2008 mainly included expenses related to cancellation of some software projects.
(g) Income / (Loss) from Sale of Activities
In 2009 income / (loss) from sale of activities amounted to €(2.5) million and was related in part to the partial completion of sales made in previous years for €5.3 million and a net expense of €7.8 million corresponding to a provision recorded to cover a risk on an old contract.
No activity was sold in 2008 and therefore, income / (loss) from sale of activities was zero.

1412009 Reference Document
Financial Information on the Company’s Assets, Financial Situation and Results
20.1. Consolidated Financial Statements 20
(h) Other Non-Current Income and Expenses
Other non-current expenses in 2009 included the provision for litigation on TSKJ. See Note 32 − Litigations and Contingent Liabilities.
(i) Employee Benefi t Expenses
Employee benefi t expenses break down as follows:
In millions of Euro 2009 2008
Wages and Salaries 945.7 901.2
Social Security Costs 178.8 188.0
Pension Costs–Defi ned Contribution Plans 27.0 23.2
Pension Costs–Defi ned Benefi t Plans 18.5 14.9
Stock Options and Free Shares 38.6 23.0
Expenses related to Capital Increase reserved for Employees - 6.2
Others 52.9 33.8
Employee Benefi t Expenses 1,261.5 1,190.3
Employee benefi ts expenses relate only to Group employees. Subcontractors’ costs are excluded.
Note 5 – Financial Income and Expenses
Net fi nancial result breaks down as follows:
(a) Financial Income
In millions of Euro 2009 2008
Interest Income from Treasury Management(1) 35.0 28.8
Dividends from Non-Consolidated Investments - 0.5
Financial Income related to Employee Benefi ts 4.2 5.1
Foreign Currency Translation Gains 438.8 421.6
Ineffi cient Part of Hedging Instruments, Net - 0.9
Total Financial Income 478.0 456.9
(1) Mainly resulting from interest income from short-term security deposits.
(b) Financial Expenses
In millions of Euro 2009 2008
Bond Interest Expense (30.1) (30.1)
Fees Related to Credit Facilities (1.9) (1.2)
Financial Expenses related to Employee Benefi ts (10.9) (10.0)
Interest Expenses on Bank Borrowings and Overdrafts (13.0) (7.6)
Depreciation on Financial Assets, Net (0.7) (7.2)
Foreign Currency Translation Losses (474.1) (400.2)
Changes in Derivative Fair Value (excluding Hedging), Net (2.5) (1.0)
Ineffi cient Part of Hedging Instruments, Net (0.6) -
Others (4.9) (10.6)
Total Financial Expenses (538.7) (467.9)
Net Financial Result (60.7) (11.0)

142 2009 Reference Document
Financial Information on the Company’s Assets, Financial Situation and Results
20.1. Consolidated Financial Statements20
Note 6 – Income Tax
(a) Income Tax Expense
The income tax expense breaks down as follows:
In millions of Euro 2009 2008
Current Income Tax Credit/(Expense) (253.1) (213.9)
Deferred Tax Credit/(Expense) 58.4 20.1
Tax on Net Gains related to Investment Disposals - -
Tax Credit/(Expense) as reported in the Consolidated Income Statement (194.7) (193.8)
Deferred Income Tax related to Items Booked Directly to Opening Equity 34.8 0.1
Deferred Income Tax related to Items Booked to Equity during the Year (18.0) 34.7
Other Equity Operations - -
Income Tax Expense as reported in the Consolidated Equity 16.8 34.8
(b) Income Tax Reconciliation
The reconciliation between the tax calculated using the standard tax rate applicable in France and the amount of tax effectively recognized in the accounts can be detailed as follows:
In millions of Euro 2009 2008
Net Income from Continuing Operations 178.5 454.3
Income/(Loss) from Discontinued Operations - -
Provision for Litigation (245.0) -
Income Tax Credit/(Expense) on Continuing Operations (194.7) (193.8)
Income Before Tax and Provision for Litigation Impact 618.2 648.1
At Parent Company Statutory Income Tax Rate of 34.43% (212.8) (223.1)
Differences between Parent Company and Foreign Income Tax Rates 22.1 39.6
Share of Income/(Loss) of Associates Accounted for Using the Equity Method 1.6 0.8
Territoriality (7.3) (9.5)
Local and Foreign Taxes (17.1) (11.8)
Gains/(Losses) Taxable at a Particular Rate 15.1 7.5
Non-Deductible Expenses (1.5) (11.0)
Deferred Tax Assets not Recognized on Tax Loss of the Year (2.9) (6.2)
Correction of Prior Year Current Taxes 1.9 7.0
Tax Savings/(Expenses) due to Tax Consolidation 3.7 (1.6)
Correction of Prior Year Deferred Taxes 6.6 18.3
Consolidation Adjustments with no Tax Impact (6.0) (1.5)
Other 1.9 (2.3)
Effective Income Tax Credit/(Expense) (194.7) (193.8)
Tax Rate excluding Provision for Litigation Impact 31.5% 29.9%
Income Tax Credit/(Expense) as reported in the Consolidated Income Statement (194.7) (193.8)
The major impact of changes in tax rate was related to deferred taxes on Group activities in Qatar for €(4) million.

1432009 Reference Document
Financial Information on the Company’s Assets, Financial Situation and Results
20.1. Consolidated Financial Statements 20
(c) Deferred Income Tax
The principles described in Note 1-C-(u) Deferred Income Tax result in the following:
As of December 31,
In millions of Euro 2009 2008
Tax Losses Carried Forward 51.3 44.7
Margin Recognition on Construction Contracts 34.4 41.1
Provisions for Employee Benefi ts 28.8 35.7
Contingencies related to Contracts 126.1 67.1
Other Contingencies 37.4 31.1
Temporarily Non-Deductible Expenses 5.2 5.7
Fair Value Losses 18.3 20.6
Other Temporary Differences 5.4 11.0
Total Deferred Income Tax Assets 306.9 257.0
Differences between Taxable and Accounting Depreciation 89.2 102.9
Margin Recognition on Construction Contracts 28.8 44.7
Fair Value Gains 21.6 8.8
Total Deferred Income Tax Liabilities 139.6 156.4
Net Deferred Income Tax Assets/(Liabilities) 167.3 100.6
In order to disclose the details of deferred tax assets and liabilities by nature of temporary differences, it was necessary to split up deferred tax assets and liabilities by subsidiary (every subsidiary shows in its balance sheet a net amount of deferred tax liabilities and assets). The net deferred tax asset of €167.3 million as of December 31, 2009 is broken down into a deferred tax asset of €263.8 million and a deferred tax liability of €96.5 million, as recorded in the balance sheet. The net deferred tax asset of €100.6 million as of December 31, 2008 is broken down into a deferred tax asset of €201.4 million and a deferred tax liability of €100.8 million.
(d) Tax Loss Carry-Forwards and Tax Credits
Tax loss carry-forwards not yet used amounted to €82.7 million as of December 31, 2009. They mainly came from an Australian
entity (€47.1 million), from a German entity (€23.6 million) and from Malaysian entities (€8.7 million). Deferred income tax assets corresponding to these tax loss carry-forwards but not recorded as of December 31, 2009 amounted to €24.9 million. All of these tax loss carry-forwards are reportable over an unlim-ited period of time.
Note 7 – Income / (Loss) from Discontinued Operations
According to IAS 1 income / (loss) from activities closed or sold during the period are reported here.
In 2009 and 2008, no activity was closed or sold, or under selling.

144 2009 Reference Document
Financial Information on the Company’s Assets, Financial Situation and Results
20.1. Consolidated Financial Statements20
Note 8 – Earnings per Share
During the fi scal year 2008 and 2009, the Group attributed free shares and stock options under condition of performance and real-ized a capital increase reserved for the employees which caused a dilution of the earnings per share.
In 2008, because of an average share price of €45.55, 2005 stock option plan parts A and C were anti-dilutive; as were stock options reallocated during the period (parts A, B, C of the 2005 plan).
In 2009, because of an average share price of €36.71, 2005 stock option plan parts A, B and C were anti-dilutive; as were stock options reallocated during the period (parts A, B, C of the 2005 plan).
Note 9 – Property, Plant and Equipment (Tangible Assets)
Diluted earnings per share are computed in accordance with Note 1-C-(i) Earnings per Share. Reconciliation between earnings per share before dilution and diluted earnings per share is as follows:
In millions of Euro 2009 2008
Net Income Attributable to Shareholders of the Parent Company 170.4 448.0
Net Income Attributable to Shareholders of the Parent Company 170.4 448.0
In thousands
Weighted Average Number of Outstanding Shares during the Period (excluding Treasury Shares) used for Basic Earnings per Share 106,259 104,817
Effect of Dilution:
Stock Options ■ 13 66
Free Shares ■ 937 443
Weighted Average Number of Outstanding Shares during the Period (excluding Treasury Shares) Adjusted for Diluted Earnings per Share 107,209 105,326
In Euro
Diluted Earnings per Share 1.59 4.25
Basic Earnings per Share 1.60 4.27
The following tables illustrate the costs, the accumulated amortization and depreciation by type of tangible assets:
In millions of Euro Land Buildings Vessels
Machinery and
Equipment
Offi ce Fixtures
and Furniture
Assets under Construction Others Total
Costs 9.0 187.1 759.6 494.1 152.9 219.4 113.8 1,935.8
Accumulated Amortization - (104.2) (397.3) (288.2) (105.6) - (65.1) (960.6)
Accumulated Impairment Losses (0.9) - (13.4) (15.9) - - - (30.2)
Net Book Value as of December 31, 2008 8.1 82.9 348.9 189.9 47.2 219.4 48.6 945.0
Costs 10.7 222.4 951.3 569.7 171.0 383.3 105.9 2,414.3
Accumulated Amortization - (123.0) (465.6) (349.0) (123.1) - (59.1) (1,119.9)
Accumulated Impairment Losses (0.8) - (70.8) (15.9) - (12.4) - (99.9)
Net Book Value as of December 31, 2009 9.9 99.4 414.9 204.8 47.9 370.9 46.7 1,194.5

1452009 Reference Document
Financial Information on the Company’s Assets, Financial Situation and Results
20.1. Consolidated Financial Statements 20
Changes in net property, plant and equipment during the previous two periods break down as follows:
In millions of Euro Land Buildings Vessels
Machinery and
Equipment
Offi ce Fixtures and
FurnitureAssets under Construction Others Total
Net Book Value as of January 1, 2008 9.9 64.2 354.1 213.4 39.5 89.0 47.9 818.0
Additions–Acquisitions–Internal Developments 0.1 29.1 100.9 50.1 20.7 168.0 20.3 389.2
Disposals (1.4) 2.1 (0.9) (8.8) 7.3 - (3.6) (5.3)
Disposals of Subsidiaries - - - - - - - -
Depreciation Expense for the Year - (13.7) (67.5) (30.3) (19.7) - (7.7) (139.0)
Impairment Losses - - (13.4) (15.9) - - - (29.3)
Net Foreign Exchange Differences (0.5) (3.9) (43.5) (30.2) (1.6) (5.9) (3.6) (89.2)
Others(1) - 5.0 19.3 11.6 0.9 (31.7) (4.7) 0.4
Net Book Value as of December 31, 2008 8.1 82.9 348.9 189.9 47.2 219.4 48.6 945.0
Additions–Acquisitions–Internal Developments 1.3 7.6 78.6 34.7 15.5 259.4 16.1 413.2
Disposals/Write-off - (0.3) (0.4) 4.3 (1.8) - (1.8) (0.1)
Disposals of Subsidiaries - - - - - - - -
Depreciation Expense for the Year - (10.3) (50.7) (43.6) (17.7) - (9.6) (132.0)
Impairment Losses - - (57.4) - - (12.4) - (69.8)
Net Foreign Exchange Differences 0.5 2.8 18.8 15.1 1.2 (2.7) 0.2 35.9
Others(1) - 16.7 77.1 4.5 3.5 (92.8) (6.8) 2.3
Net Book Value as of December 31, 2009 9.9 99.4 414.9 204.8 47.9 370.9 46.7 1,194.5
(1) Includes mainly reclassifi cation of assets under construction to the specifi c category where they will be used when they are delivered.
No assets are subject to a capital lease.
The amount of pledged assets amounted to €60.6 million as of December 31, 2009.
The Group decided to accelerate investments in particular in order to expand the fl eet of vessels (construction and delivery of new vessels). The principal vessels recorded as “Assets under construction” as of December 31, 2009 were as follows:
the ■ Skandi Vitoria, a fl exlay vessel 50% owned by Technip and dedicated to the Brazilian market. Cumulative capital expen-ditures amounted to €92.8 million as of December 31, 2009, of which €66.1 million during the period;
the ■ Deep Energy, a pipelay vessel dedicated to deep water, for which the cumulative capital expenditures amounted to €160.1 million, of which €67.7 million during the period;
the ■ Apache II, a vessel under construction owned by North Ocean III KS, a company acquired during the period – see Note 2-(a)Changes in Scope of Consolidation, for which recorded value amounted to €90.6 million as of December 31, 2009.
In addition the Group continues to build a flexible plant in Malaysia, for which the amount recorded in assets under construc-tion amounted to €48.4 million as of December 31, 2009, of which €25.1 million during the period.
Note 10 – Intangible Assets
Costs, accumulated amortization and depreciation by type of intangible assets are as follows:
In millions of Euro Goodwill
Licenses/Patents/
Trademarks Software Others Total
Costs 2,369.1 93.9 58.1 2.4 2,523.5
Accumulated Amortization - (61.7) (50.8) (1.8) (114.3)
Accumulated Impairment Losses - - - - -
Net Book Value as of December 31, 2008 2,369.1 32.2 7.3 0.6 2,409.2
Costs 2,369.3 108.1 59.6 7.7 2,544.8
Accumulated Amortization - (80.2) (54.2) (2.1) (136.5)
Accumulated Impairment Losses - - - - -
Net Book Value as of December 31, 2009 2,369.3 27.9 5.4 5.6 2,408.2

146 2009 Reference Document
Financial Information on the Company’s Assets, Financial Situation and Results
20.1. Consolidated Financial Statements20
(a) Changes in Net Intangible Assets
Changes in net intangible assets during the previous two periods break down as follows:
In millions of Euro Goodwill
Licenses/Patents/
Trademarks Software Others(1) Total
Net Book Value as of January 1, 2008 2,357.4 35.4 7.6 19.1 2,419.5
Additions–Acquisitions–Internal Developments 11.6 0.1 4.0 8.0 23.7
Additions–Business Combinations - 4.1 - - 4.1
Disposals/Write off - - - (22.2) (22.2)
Amortization Charge for the Year - (7.9) (4.2) - (12.1)
Impairment Losses - - - (8.2) (8.2)
Net Foreign Exchange Differences - 0.5 (0.1) - 0.4
Others - - - 3.9 3.9
Net Book Value as of December 31, 2008 2,369.1 32.2 7.3 0.6 2,409.2
Additions–Acquisitions–Internal Developments - 3.6 1.8 5.0 10.4
Additions–Business Combinations - 8.3 - - 8.3
Disposals/Write off - - - - -
Amortization Charge for the Year - (18.6) (3.7) - (22.3)
Impairment Losses - - - - -
Net Foreign Exchange Differences - 2.4 - - 2.4
Others 0.2 - - - 0.2
Net Book Value as of December 31, 2009 2,369.3 27.9 5.4 5.6 2,408.2
(1) Principally the cost of software projects developed internally. Some of these projects were cancelled in 2008 and previously capitalized costs were recorded as expenses. See Note 4-(f) Other Operating Expenses.
(b) Goodwill
The goodwill arising from an acquisition is the part of the purchase price that exceeds the share of identifi able assets and liabilities of the acquired entity measured at fair value. This goodwill is subject to an impairment test performed annually or whenever a mean-ingful event occurs (See Note 1-C-(d) Business Combinations).
In 2008, the goodwill allocated to the Offshore segment increased by €6.1 million due to the acquisition of Eurodim, and the good-will allocated to the Onshore segment increased by €5.6 million as a result of the acquisitions of EPG (€3.9 million), Sofremines (€1.0 million) renamed Technip Mines, and the allocation of the goodwill generated by the acquisition of Setudi (€0.7 million). See Note 2 − Scope of Consolidation.
There were no signifi cant changes in goodwill amounts in 2009.
The following table shows the detail of goodwill by business segment:
As of December 31,
In millions of Euro 2009 2008
Subsea(1) 1,928.6 1,928.6
Offshore(1) 310.8 310.8
Onshore 129.9 129.7
Total 2,369.3 2,369.1
(1) The goodwill relative to Cofl exip resulting from two parts of the acquisition was assigned – after allocation to identifi able items – to two business segments: Subsea and Offshore.
Impairment tests were performed on the goodwill, using the method described in Note 1-C-(a) Use of Estimates.
By using the discounted cash fl ow method, the impairment tests performed by the Group were based on the most likely assump-tions with respect to activity and result. Assumptions made in 2009 relied on the business plans covering years 2010 to 2012 for each business segment. Beyond 2012, the growth rate taken into account was 3.0%. Cash fl ows were discounted at a rate of 10.0% after tax. The tax rate used in the model was 30.0%.
As of December 31, 2009 the net book value of goodwill was confi rmed by the impairment tests performed. There would have been no impact on the value of goodwill from a 10% decrease in the 2012 operating margin relative to the business plan estimates, or using a growth rate of 2.0%, or a plus or minus 1.0% variation in the discount rate.
No impairment loss was recorded in 2008.

1472009 Reference Document
Financial Information on the Company’s Assets, Financial Situation and Results
20.1. Consolidated Financial Statements 20
Note 11 – Investments in Associates Accounted for Using the Equity Method
As of December 31, 2009 and 2008 only one entity, Technip KTI Spa, is consolidated under the Equity Method.
The main fi nancial data of this company accounted for using the equity method are disclosed hereafter on a 100% basis:
As of December 31, 2009
In millions of Euro TP KTI Spa Total
Country Italy
Percentage of Interest 25%
Carrying Amount of the Investment 9.3 9.3
Financial Data at 100%
Total Assets NC
Total Liabilities (except Equity) NC
Net Assets NC
Revenues NC
Net Income 16.5
As of December 31, 2008
In millions of Euro TP KTI Spa Total
Country Italy
Percentage of Interest 25%
Carrying amount of the Investment 6.7 6.7
Financial Data at 100%
Total Assets 628.0
Total Liabilities (except Equity) 604.0
Net Assets 24.0
Revenues 193.0
Net Income 10.2
Changes in investments in the associate accounted for using the equity method break down as follows:
In millions of Euro 2009 2008
Carrying Amount of Investments as of January 1, 6.7 4.9
Additions 0.5 0.5
Disposals - -
Share of Income/(Loss) of Associates Accounted for Using the Equity Method 4.7 2.2
Paid Dividends (2.8) (0.9)
Foreign Exchange Differences - -
Net Gains/(Losses) from Fair Value Adjustments - -
Reclassifi cations - -
Carrying Amount of Investments as of December 31, 9.3 6.7

148 2009 Reference Document
Financial Information on the Company’s Assets, Financial Situation and Results
20.1. Consolidated Financial Statements20
Note 12 – Other Financial Assets
As per Note 1-C-(l) Other Financial Assets, other fi nancial assets are recorded at their fair value or at their historical cost if there is no way to evaluate them reliably. In this latter case, depreciation is recorded if its recoverable amount is lower than its historical cost.
As of December 31, 2009 impairment tests performed on net book value of other fi nancial assets (non-current) did not lead the Group to account for an impairment loss. The breakdown of this item by nature is presented below:
Carrying Amount Fair Value
As of December 31, As of December 31,
In millions of Euro 2009 2008 2009 2008
Non-Consolidated Investments 3.3 4.3 3.3 4.3
Valuation Allowance (1.3) (1.9) (1.3) (1.9)
Net Value of Non-Consolidated Investments 2.1 2.4 2.1 2.4
Receivables related to Investments 0.2 0.2 0.2 0.2
Valuation Allowance - - - -
Net Value of Receivables Related to Investments 0.2 0.2 0.2 0.2
Loans 9.6 6.5 9.6 6.5
Valuation Allowance - (1.2) - (1.2)
Net Value of Loans 9.6 5.3 9.6 5.3
Security Deposits 11.8 11.2 11.8 11.2
Valuation Allowance (3.4) (3.2) (3.4) (3.2)
Net Value of Security Deposits 8.4 8.0 8.4 8.0
Others 2.2 2.7 2.2 2.7
Total Other Financial Assets (Non-Current), Net 22.5 18.6 22.5 18.6
Note 13 – Available-for-Sale Financial Assets
As of December 31, 2009 and 2008 the Group owned 789,067 shares of Gulf Island Fabricators Inc. (GIFI), a U.S. company listed in New York (NASDAQ).
Carrying Amount Fair Value
As of December 31, As of December 31,
In millions of Euro 2009 2008 2009 2008
Share – Unlisted - - - -
Share – Listed 11.5 8.2 11.5 8.2
Total Available-for-Sale Financial Assets 11.5 8.2 11.5 8.2
An impairment loss is recorded through the income statement when the loss is sustained (more than two quarters) or signifi cant (more than 30%).
In 2009 a depreciation was recorded in the income statement for €3.1 million in the fi rst quarter, an appreciation was then recorded through shareholders’ equity for €6.8 million as of December 31, 2009.
In 2008 a depreciation was recorded through the income statement for €7.3 million.
Note 14 – Inventories
The inventories break down as follows:
As of December 31,
In millions of Euro 2009 2008
Raw Materials 104.1 115.9
Work in Progress 72.8 73.1
Finished Goods and Merchandise 52.1 45.4
Valuation Allowance (13.6) (8.2)
Total Inventories, Net 215.4 226.2
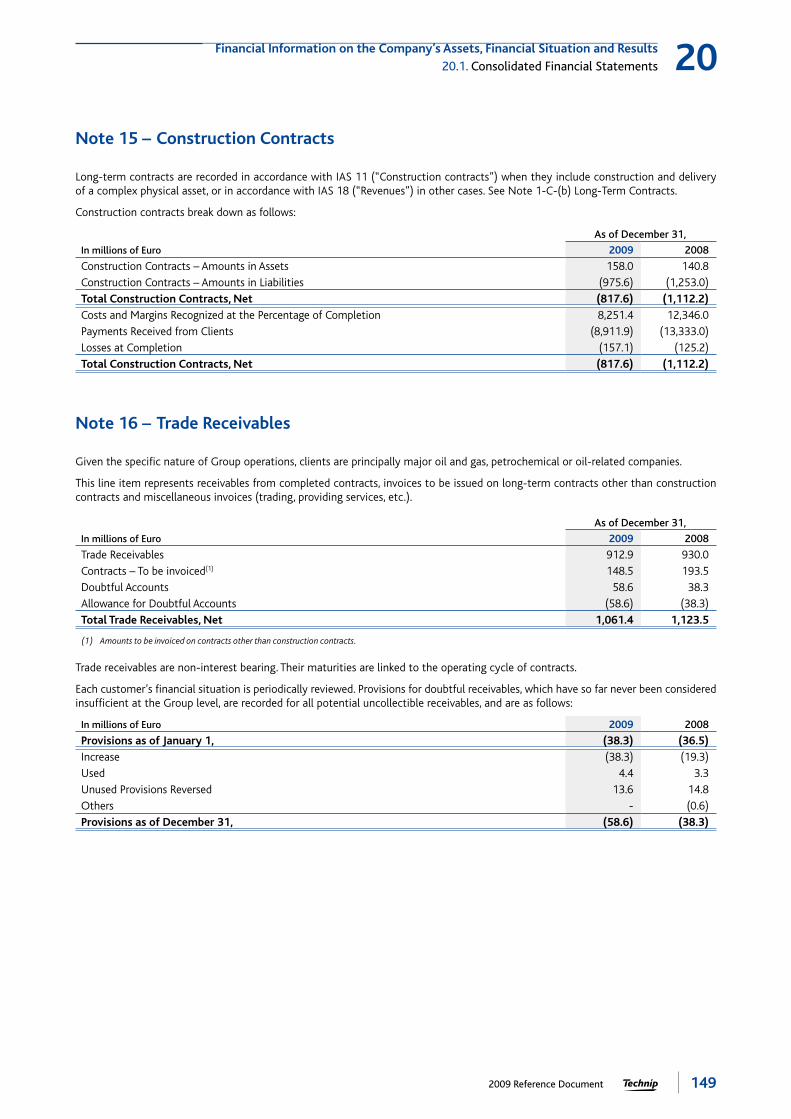
1492009 Reference Document
Financial Information on the Company’s Assets, Financial Situation and Results
20.1. Consolidated Financial Statements 20
Note 15 – Construction Contracts
Long-term contracts are recorded in accordance with IAS 11 (“Construction contracts”) when they include construction and delivery of a complex physical asset, or in accordance with IAS 18 (“Revenues”) in other cases. See Note 1-C-(b) Long-Term Contracts.
Construction contracts break down as follows:
As of December 31,
In millions of Euro 2009 2008
Construction Contracts – Amounts in Assets 158.0 140.8
Construction Contracts – Amounts in Liabilities (975.6) (1,253.0)
Total Construction Contracts, Net (817.6) (1,112.2)
Costs and Margins Recognized at the Percentage of Completion 8,251.4 12,346.0
Payments Received from Clients (8,911.9) (13,333.0)
Losses at Completion (157.1) (125.2)
Total Construction Contracts, Net (817.6) (1,112.2)
Note 16 – Trade Receivables
Given the specifi c nature of Group operations, clients are principally major oil and gas, petrochemical or oil-related companies.
This line item represents receivables from completed contracts, invoices to be issued on long-term contracts other than construction contracts and miscellaneous invoices (trading, providing services, etc.).
As of December 31,
In millions of Euro 2009 2008
Trade Receivables 912.9 930.0
Contracts – To be invoiced(1) 148.5 193.5
Doubtful Accounts 58.6 38.3
Allowance for Doubtful Accounts (58.6) (38.3)
Total Trade Receivables, Net 1,061.4 1,123.5
(1) Amounts to be invoiced on contracts other than construction contracts.
Trade receivables are non-interest bearing. Their maturities are linked to the operating cycle of contracts.
Each customer’s fi nancial situation is periodically reviewed. Provisions for doubtful receivables, which have so far never been considered insuffi cient at the Group level, are recorded for all potential uncollectible receivables, and are as follows:
In millions of Euro 2009 2008
Provisions as of January 1, (38.3) (36.5)
Increase (38.3) (19.3)
Used 4.4 3.3
Unused Provisions Reversed 13.6 14.8
Others - (0.6)
Provisions as of December 31, (58.6) (38.3)

150 2009 Reference Document
Financial Information on the Company’s Assets, Financial Situation and Results
20.1. Consolidated Financial Statements20
Note 17 – Other Current Receivables
The other current receivables break down as follows:
As of December 31,
In millions of Euro 2009 2008
Value Added Tax Receivables 80.6 72.1
Other Tax Receivables 48.4 35.5
Receivables from Personnel 6.8 7.3
Prepaid Expenses 65.7 73.2
Insurance Indemnities to Be Received 13.9 9.0
Others 79.5 135.0
Total Other Receivables, Net 294.9 332.1
Other current receivables are non-interest bearing.
Note 18 – Cash and Cash Equivalents
Cash and Cash Equivalents break down as follows:
As of December 31,
In millions of Euro 2009 2008
Cash at Bank and in Hands 515.7 477.3
Cash Equivalents 2,140.6 1,927.4
Total Cash and Cash Equivalents 2,656.3 2,404.7
Euro 1,046.2 880.4
U.S. Dollar 760.7 844.8
British Pound 76.5 96.3
Japanese Yen 53.8 102.2
Canadian Dollar 28.9 32.6
Australian Dollar 24.7 31.0
Brazilian Real 352.0 136.1
Norwegian Crown 66.3 90.2
Others 247.2 191.1
Total Cash and Cash Equivalents per Currency 2,656.3 2,404.7
Certifi cates of Deposits 501.5 336.4
Fixed Term Deposits 1,558.4 1,489.6
Others 80.7 101.4
Total Marketable Securities 2,140.6 1,927.4
A very large part of cash and marketable securities are recorded or invested in Euro or U.S. Dollar which are frequently used by the Group within the framework of its commercial relations. Cash and cash equivalents in other currencies correspond either to deposits retained by subsidiaries located in countries where such currencies are the national currencies in order to ensure their own liquidity, or to amounts received from customers prior to the payment of expenses in these same currencies or the payment of dividends. The nature of the short-term deposits leads to classify them as cash equivalents along with the other marketable securities.
Note 19 – Assets and Liabilities Held for Sale
As of December 31, 2009 and 2008 there were no assets or liabilities held for sale.

1512009 Reference Document
Financial Information on the Company’s Assets, Financial Situation and Results
20.1. Consolidated Financial Statements 20
Note 20 – Shareholders’Equity
(a) Changes in the Parent Company’s Common Stock
As of December 31, 2009, Technip common stock consisted of 109,343,294 outstanding authorized shares with a par value of €0.7625. Changes since January 1, 2008 break down as follows:
Number of SharesOutstanding
Common Stock(In millions of Euro)
Common Stock as of January 1, 2008 107,353,774 81.9
Capital Increase due to Stock Option Exercised 517,530 0.4
Capital Increase reserved for Employees 1,446,260 1.1
Common Stock as of December 31, 2008 109,317,564 83.4
Capital Increase due to Stock Option Exercised 25,730 -
Capital Increase reserved for Employees - -
Common Stock as of December 31, 2009 109,343,294 83.4
(b) Technip Shareholders as of December 31
Technip’s principal shareholders are as follows:
As of December 31,
2009 2008
Blackrock Inc 5.6% -
Tradewinds NWQ 5.0% 5.7%
Fonds Stratégique d’Investissement 5.0% -
Causeway Capital Management 4.4% 5.4%
Institut Français du Pétrole 2.8% 2.8%
Treasury Shares 2.8% 2.8%
Group Employees 2.4% 2.9%
ING Groep NV - 5.0%
Others 72.0% 75.4%
Total 100.0% 100.0%
The percentages correspond to the disclosure of major holdings as reported to AMF.
(c) Treasury Shares
Treasury shares are as follows:
Number of SharesTreasury Shares
(In millions of Euro)
Treasury Shares as of January 1, 2008 3,066,658 (144.3)
Cancellation of Treasury Shares - -
Increase 27,669 (0.8)
Decrease due to Stock Options Exercised - -
Decrease due to Attribution to Employees (28,183) 1.3
Treasury Shares as of December 31, 2008 3,066,144 (143.8)
Cancellation of Treasury Shares - -
Increase - -
Decrease due to Stock Options Exercised - -
Decrease due to Attribution to Employees (234) -
Treasury Shares as of December 31, 2009 3,065,910 (143.8)
Treasury shares are meant to be used to honor the free share allocation plans granted to employees in 2007, 2008 and 2009 as well as to honor share purchase option plans granted in 2008.

152 2009 Reference Document
Financial Information on the Company’s Assets, Financial Situation and Results
20.1. Consolidated Financial Statements20
(d) Fair Value Reserves
Fair value reserves are as follows:
In millions of EuroConvertible
BondHedging
Reserve(1)
Stock Options and Free Shares
Revaluation of Available-for-Sale Financial Assets(2) Others Total
As of January 1, 2008 14.6 19.1 29.4 2.0 (1.9) 63.2
IAS 32/39 – Net Gains/(Losses) on Cash Flow Hedges - (92.1) - - - (92.1)
Tax Effect on IAS 32/39 - 15.1 - - - 15.1
Stock Options and Free Shares - - 25.9 - - 25.9
Tax Effect on Free shares - - 18.6 - - 18.6
IAS 39: Fair Value Changes on Available-for-Sale Investments - - - (3.0) - (3.0)
Tax Effect on Fair Value Changes on Available-for-Sale Investments - - - 1.0 - 1.0
Others (14.6) - - - 6.2 (8.4)
As of December 31, 2008 - (57.9) 73.9 - 4.3 20.3
IAS 32/39 – Net Gains/(Losses) on Cash Flow Hedges - 74.0 - - - 74.0
Tax Effect on IAS 32/39 - (15.3) - - - (15.3)
Reclassifi cation of Stock Options and Free Shares in Reserves - - (73.9) - - (73.9)
IAS 39: Fair Value Changes on Available-for-Sale Investments - - - 6.8 - 6.8
Tax Effect on Fair Value Changes on Available-for-Sale Investments - - - (2.5) - (2.5)
Others - - - - (7.5) (7.5)
As of December 31, 2009 - 0.8 - 4.3 (3.2) 1.9
(1) Recorded under this heading is the portion of a gain or loss realized on cash fl ow hedging that is considered as effi cient. See Note 1-C-(c) Foreign Currency Transactions and Financial Instruments.
(2) Amounts correspond basically to the revaluation of GIFI shares based on the share price on December 31(See Note 13 - Available for Sale Financial Assets). Gains and losses on these available-for-sale fi nancial assets are normally recorded in equity until they are effectively sold.
(e) Distributable Retained Earnings
The distributable retained earnings of the parent company amounted to €287.9 million as of December 31, 2009.
(f) Statutory Legal Reserve
Under French Law, companies must allocate 5% of their statutory net profi t to their legal reserve fund each year before dividends may be paid in respect of that year. Funds are allocated until the amount in the legal reserve is equal to 10% of the aggregate nominal value of the issued and outstanding share capital. The legal reserve may only be distributed to shareholders upon liquidation of the company. The statutory legal reserve amounted to €9.8 million as of December 31, 2009.
(g) Dividends Paid and Proposed
In 2008, the dividend paid in respect of 2007 amounted to €125.1 million (€1.20 per share) of which €23.0 million was taken from retained earnings.
In 2009, the dividend paid in respect of 2008 amounted to €127.5 million (€1.20 per share).
The recommended dividend in respect of 2009 of €1.35 per share which amounts to €143.8 million will be submitted to a vote of the General Shareholders’ meeting scheduled for April 29, 2010. Given that no decision was taken as of December 31, 2009, no impact was recorded in the 2009 accounts.

1532009 Reference Document
Financial Information on the Company’s Assets, Financial Situation and Results
20.1. Consolidated Financial Statements 20
(h) Executive Stock Option Plans and Share Purchase Option Plans
The 2002 stock option plan (remaining portion of part B) reached its maturity date during the year 2009.
The 2005 stock option plan (part A) was authorized by the General Shareholders’ Meeting held on April 29, 2005 and implemented by the Board of Directors on December 14, 2005. These options are valid up to 6 years from the date of grant.
The 2005 stock option plan (part B) was authorized by the General Shareholders’ Meeting held on April 29, 2005 and implemented by the Board of Directors on July 26, 2006. These options are valid up to 6 years from the date of grant.
The 2005 stock option plan (part C) was authorized by the General Shareholders’ Meeting held on April 29, 2005 and implemented by the Board of Directors on March 12, 2007. These options are valid up to 6 years from the date of grant.
Available stock options from the 2005 stock option plan (parts A and B) were redistributed according to the decision by the Board of Directors meeting of December 12, 2007. These options are valid up to 6 years from the date of grant.
Available stock options from the 2005 stock option plan (parts A, B and C) were redistributed according to the decision by the Board of Directors meeting of June 12, 2008. These options are valid up to 6 years from the date of grant.
A new share purchase option plan was implemented by the Board of Directors on July 1st, 2008. These options are valid up to 6 years from the date of grant.
A new share purchase option plan was implemented by the Board of Directors on June 15, 2009. These options are valid up to 6 years from the date of grant.
After the merger of Technip and Cofl exip SA, Technip took over the stock option plans of Cofl exip. Granted stock option plans are as follows:
Stock option plan 9.3 is no longer valid as the maturity date ■
was reached during the year.
Stock option plan 10 was authorized by the General Shareholders’ ■
Meeting held on June 2, 1999 and implemented by the Board of Directors on December 14, 1999. These options are valid up to 10 years from the date of grant.
Stock option plan 11 was authorized by the General Shareholders’ ■
Meeting held on May 30, 2000 and implemented by the Board of Directors on March 20, 2001. These options are valid up to 10 years from the date of grant.
The Board of Directors decided as of May 14, 2007 to adjust the rights of option recipients in order to take into account the extraordinary dividend deducted from retained earnings and voted by the Combined Shareholders’ Meeting on April 27, 2007. Consequently exercise prices and number of options were recalculated for all plans.
The Board of Directors decided as of May 14, 2008 to adjust the rights of option recipients in order to take into account the extraordinary dividend deducted from retained earnings and voted by the Combined Shareholders’ Meeting on May 6, 2008. Consequently exercise prices and option numbers were recalcu-lated again for all plans.
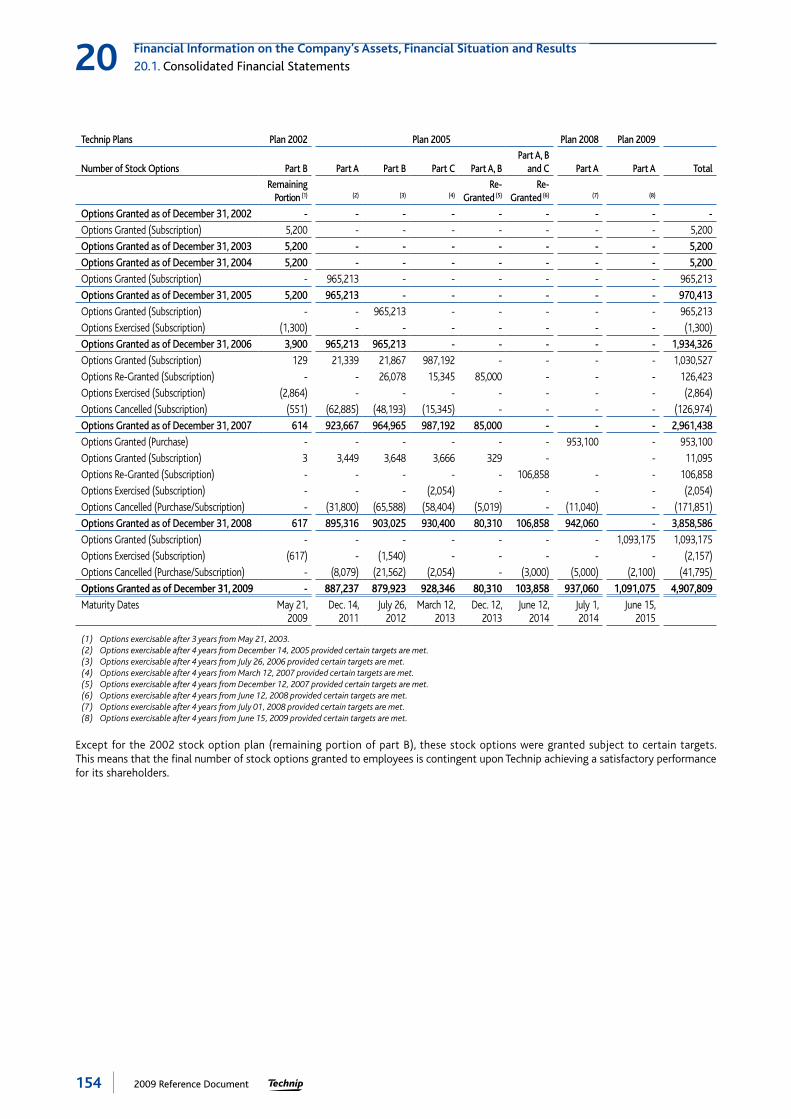
154 2009 Reference Document
Financial Information on the Company’s Assets, Financial Situation and Results
20.1. Consolidated Financial Statements20
Technip Plans Plan 2002 Plan 2005 Plan 2008 Plan 2009
Number of Stock Options Part B Part A Part B Part C Part A, BPart A, B
and C Part A Part A Total
Remaining Portion (1) (2) (3) (4)
Re-Granted (5)
Re-Granted (6) (7) (8)
Options Granted as of December 31, 2002 - - - - - - - - -
Options Granted (Subscription) 5,200 - - - - - - - 5,200
Options Granted as of December 31, 2003 5,200 - - - - - - - 5,200
Options Granted as of December 31, 2004 5,200 - - - - - - - 5,200
Options Granted (Subscription) - 965,213 - - - - - - 965,213
Options Granted as of December 31, 2005 5,200 965,213 - - - - - - 970,413
Options Granted (Subscription) - - 965,213 - - - - - 965,213
Options Exercised (Subscription) (1,300) - - - - - - - (1,300)
Options Granted as of December 31, 2006 3,900 965,213 965,213 - - - - - 1,934,326
Options Granted (Subscription) 129 21,339 21,867 987,192 - - - - 1,030,527
Options Re-Granted (Subscription) - - 26,078 15,345 85,000 - - - 126,423
Options Exercised (Subscription) (2,864) - - - - - - - (2,864)
Options Cancelled (Subscription) (551) (62,885) (48,193) (15,345) - - - - (126,974)
Options Granted as of December 31, 2007 614 923,667 964,965 987,192 85,000 - - - 2,961,438
Options Granted (Purchase) - - - - - - 953,100 - 953,100
Options Granted (Subscription) 3 3,449 3,648 3,666 329 - - 11,095
Options Re-Granted (Subscription) - - - - - 106,858 - - 106,858
Options Exercised (Subscription) - - - (2,054) - - - - (2,054)
Options Cancelled (Purchase/Subscription) - (31,800) (65,588) (58,404) (5,019) - (11,040) - (171,851)
Options Granted as of December 31, 2008 617 895,316 903,025 930,400 80,310 106,858 942,060 - 3,858,586
Options Granted (Subscription) - - - - - - - 1,093,175 1,093,175
Options Exercised (Subscription) (617) - (1,540) - - - - - (2,157)
Options Cancelled (Purchase/Subscription) - (8,079) (21,562) (2,054) - (3,000) (5,000) (2,100) (41,795)
Options Granted as of December 31, 2009 - 887,237 879,923 928,346 80,310 103,858 937,060 1,091,075 4,907,809
Maturity Dates May 21, 2009
Dec. 14, 2011
July 26, 2012
March 12, 2013
Dec. 12, 2013
June 12, 2014
July 1, 2014
June 15, 2015
(1) Options exercisable after 3 years from May 21, 2003.(2) Options exercisable after 4 years from December 14, 2005 provided certain targets are met.(3) Options exercisable after 4 years from July 26, 2006 provided certain targets are met.(4) Options exercisable after 4 years from March 12, 2007 provided certain targets are met.(5) Options exercisable after 4 years from December 12, 2007 provided certain targets are met.(6) Options exercisable after 4 years from June 12, 2008 provided certain targets are met.(7) Options exercisable after 4 years from July 01, 2008 provided certain targets are met.(8) Options exercisable after 4 years from June 15, 2009 provided certain targets are met.
Except for the 2002 stock option plan (remaining portion of part B), these stock options were granted subject to certain targets. This means that the fi nal number of stock options granted to employees is contingent upon Technip achieving a satisfactory performance for its shareholders.

1552009 Reference Document
Financial Information on the Company’s Assets, Financial Situation and Results
20.1. Consolidated Financial Statements 20
For the 2005 plan, this performance will be measured as the increase in Group earnings per share compared with the average earnings per share growth of a panel of competitors. For the 2008 and 2009 plans, this performance will be measured as the increase in Group consolidated net income compared with the average consolidated net income growth of a panel of competitors.
Cofl exip Plans
Number of Stock Options Plan 10 Plan 11 Total
Options Granted in 1999 2001
Purchase Options Granted - 34,415 34,415
Subscription Options Granted 127,386 180,000 307,386
Options Granted as of December 31, 2003 91,384 178,415 269,799
Options Exercised (Subscription) (20,760) - (20,760)
Options Cancelled (Subscription) (1,334) (1,000) (2,334)
Options Granted as of December 31, 2004 69,290 177,415 246,705
Options Exercised (Subscription) (44,245) (24,785) (69,030)
Options Exercised (Purchase) - (34,415) (34,415)
Options Cancelled (Subscription) - (16,915) (16,915)
Options Granted as of December 31, 2005 25,045 101,300 126,345
Options Exercised (Subscription) (6,950) (36,207) (43,157)
Options Granted as of December 31, 2006 18,095 65,093 83,188
Options Granted (Subscription) 356 1,311 1,667
Options Exercised (Subscription) (8,642) (18,845) (27,487)
Options Cancelled (Subscription) - (1,023) (1,023)
Options Granted as of December 31, 2007 9,809 46,536 56,345
Options Granted (Subscription) 37 178 215
Options Exercised (Subscription) (2,110) (9,301) (11,411)
Options Granted as of December 31, 2008 7,736 37,413 45,149
Options Exercised (Subscription) (3,629) (1,803) (5,432)
Options Cancelled (Subscription) (4,107) - (4,107)
Options Granted as of December 31, 2009 - 35,610 35,610
Options Granted as of December 31, 2009 after the 2005 “Share Split” - 142,439 142,439
Maturity Dates Dec. 14, 2009 March 20, 2011
IFRS 2 applies to stock option plans implemented after November 7, 2002 and whose rights were not vested as of January 1, 2005. Consequently, the Group recorded a charge of €13.7 million in 2009 compared with €7.2 million in 2008.
To evaluate these plans, and considering the lack of relevant historical information, the Group used the six general assump-tions common to all options pricing models (exercise price, term, share price at the grant date, expected volatility of share price, estimated dividends and risk-free interest rate for the option life).
Regarding the assessment of volatility, the historical measures performed on the share price show great discrepancies depending upon the periods and the maturity chosen. In order to achieve a reliable measure of the future volatility, Technip decided to use an approach that consists in comparing measures of historical volatility over periods of 1 year, 2 years, 3 years and 5 years on the one hand and the share’s implied volatility on the other hand.

156 2009 Reference Document
Financial Information on the Company’s Assets, Financial Situation and Results
20.1. Consolidated Financial Statements20
The following table illustrates the assumptions used to calculate the charge. The Group uses the Cox Ross Rubinstein binomial model.
Technip Plans Plan 2002 Plan 2005 Plan 2008 Plan 2009
In Euro
Remaining Portion of
Part B Part A Part B Part CPart A and B Re-Granted
Part A, B and C
Re-Granted Part A Part A
Share Price at the Grant Date 18.63 48.87 43.01 50.19 54.21 55.81 58.50 36.41
Exercise Price 18.50 48.19 42.48 50.47 55.88 59.96 58.15 34.83
Dividend Yield 2.7% 2.0% 2.0% 2.0% 2.0% 2.0% 2.0% 3.5%
Turnover Rate 2.0% 5.0% 5.0% 5.0% 2.0% 2.0% 2.0% 2.0%
Volatility 46.2% 28.0% 31.0% 30.3% 32.0% 34.4% 34.4% 32.9%
Annual Risk Free Interest Rate 6 months 2.3% 2.6% 3.3% 4.0% 4.9% 5.1% 5.2% 1.5%
1 year 2.2% 2.8% 3.5% 4.1% 4.9% 5.4% 5.4% 1.7%
3 years 2.4% 2.9% 3.7% 3.9% 4.1% 4.7% 4.7% 2.2%
5 years 3.0% 3.1% 3.8% 4.0% 4.2% 4.8% 4.8% 2.9%
10 years 3.8% 3.3% 4.0% 4.0% 4.4% 4.8% 4.8% 3.9%
Option Fair Value 6.50 10.97 11.22 12.75 13.74 14.90 17.30 8.45
Maturity Dates May 21, 2009
Dec 14, 2011
July 26, 2012
Mar. 12, 2013
Dec. 12, 2013
June 12, 2014
July 1, 2014
June 15, 2015
Average share price amounted to €36.71 in 2009 and €45.55 in 2008.
(i) Free Share Allocation Plans
The following free shares allocation plans have been implemented:
The 2007 (part A) free share allocation plan was authorized ■
by the General Shareholders’ Meeting on April 28, 2006, and implemented by the Board of Directors on March 12, 2007. The vesting period is 3 years and the holding period is 2 years.
The 2007 (part B) free share allocation plan was authorized ■
by the General Shareholders’ Meeting on April 28, 2006, and implemented by the Board of Directors on March 12, 2007. The vesting period is 4 years.
Available shares from parts A and B were re-granted pursuant ■
to a Board of Directors decision taken on December 12, 2007. The vesting period and holding period are the same as in the original plan.
Available shares from parts A and B were re-granted pursuant to ■
a Board of Directors decision taken on July 1, 2008. The vesting period and holding period are the same as in the original plan.
The 2008 free share allocation plan was authorized by the ■
General Shareholders’ Meeting on May 6, 2008, and implemented by the Board of Directors on July 1, 2008 and December 9, 2008 for parts A and B respectively. The vesting period is either 3 years (in which case the holding period is 2 years), or 4 years (in which case there is no holding period).
The 2009 free share allocation plan was authorized by ■
the General Shareholders’ Meeting on April 30, 2009, and implemented by the Board of Directors on June 15, 2009 and October 25, 2009 for parts A and B respectively. The vesting period is either 3 years (in which case the holding period is 2 years), or 4 years (in which case there is no holding period).
Free shares were granted contingent to the same performance conditions described in Note 20-(h) Executive Stock Option Plans and Share Purchase Plans.

1572009 Reference Document
Financial Information on the Company’s Assets, Financial Situation and Results
20.1. Consolidated Financial Statements 20
Changes over the year are as follows:
Plan 2007 Plan 2008 Plan 2009
TotalPart A Part BPart A and B Re-Granted Part A Part B Part C Part A Part B
Shares Granted as of January 1, 2007 - - - - - - - - -
Shares Granted 398,800 711,870 - - - - - - 1,110,670
Shares Re-Granted - - 44,500 - - - - - 44,500
Shares Cancelled (4,600) (39,900) - - - - - - (44,500)
Shares Granted as of December 31, 2007 394,200 671,970 44,500 - - - - - 1,110,670
Shares Granted - - - 859,050 20,100 - - - 879,150
Shares Re-Granted - - 20,300 - - - - - 20,300
Shares Cancelled (13,500) (36,600) (1,800) (11,700) - - - - (63,600)
Shares Granted as of December 31, 2008 380,700 635,370 63,000 847,350 20,100 - - - 1,946,520
Shares Granted - - - - - 191,542 981,175 12,000 1,184,717
Shares Exercised (234) - - - - - - - (234)
Shares Cancelled (2,566) (10,166) (800) (12,060) - (1,100) (2,100) - (28,792)
Shares Granted as of December 31, 2009 377,900 625,204 62,200 835,290 20,100 190,442 979,075 12,000 3,102,211
IFRS 2 applies to the valuation of free share allocations. Consequently, the Group recorded a charge of €24.9 million in 2009 compared to €15.8 million in 2008.
The following table shows assumptions made for the fair value computation of the plans:
Plan 2007 Plan 2008 Plan 2009
Part A Part BPart A and B Re-
Granted Part A Part B Part C Part A Part B
Share Price at the Grant Date 50.19 50.19 54.21 58.50 58.50 23.76 36.41 36.41
Dividend Yield 3.2% 2.9% 2.0% 2.0% 2.0% 3.0% 3.5% 3.5%
Turnover Rate(1) 2.0% 6.0% 2.0%/6.0% 2.0%/6.0% 2.0%/6.0% 2.0%/6.0% 2.0%/6.0% 2.0%/6.0%
Fair Value of Free Shares(1) 45.57 44.57 50.65 55.10/54.00 55.10/54.00 21.72/21.07 32.78/31.65 32.78/31.65
Maturity Dates Mar. 13, 2012
Mar. 13, 2011
Dec. 12, 2011/12 & July 1, 2012/13
July 1, 2012/13
Dec. 9, 2012/13
Feb. 18, 2013/14
June 15, 2013/14
Oct. 25, 2014
(1) The turnover rate and fair value of free shares differ from country to country.
Free shares allocated to employees will be granted using treasury shares.
Average share price amounted to €36.71 in 2009, compared with €45.55 in 2008.
(j) Capital Increase Reserved for Employees
No capital increase reserved for employees was realized in 2009.
Technip realized a capital increase reserved for employees in 2008.
Following this capital increase, the number of shares issued on October 17, 2008 was 1,446,260 shares, the increase in common stock amounted to €1.1 million and the increase in Paid-in-Surplus amounted to €59.8 million, reduced by a €0.9 million net charge for administrative costs linked to this operation, i.e. a total of €60.0 million.
The capital increase was realized by Technip SA, the Group’s parent company. Employees eligible for the offer were those of Technip SA and Technip’s affi liates in 18 countries.
Employees subscribing the capital increase were offered three different plans:
The Technip Classic Plan allows recipients to subscribe ■
Technip shares within an FCPE (Fonds Commun de Placement d’Entreprise). An FCPE is a French collective savings fund allowing employees to hold a portfolio invested in securities. The FCPE is managed by a management company on behalf of the employee investors holding units of the FCPE. Recipients can benefi t from an employer contribution as well as a 20%

158 2009 Reference Document
Financial Information on the Company’s Assets, Financial Situation and Results
20.1. Consolidated Financial Statements20
discount on the subscription price but are fully exposed to the change of the share value on the stock market. The holding period is fi ve years.
The Technip Secure Plan allows employees to subscribe Technip ■
shares within a FCPE and to benefi t from an employer contribu-tion as well as a 20% discount on the subscription price. In addition, at the end of a fi ve-year period they are guaranteed to receive the amount initially invested, plus the greater of either a capitalized annual return of 3.6% or the protected average increase in Technip’s share value relative to the refe-rence price.
The Technip Multiple Plan allows recipients to subscribe Technip ■
shares either within an FCPE or directly and to benefi t from an employer contribution as well as a 20% discount on the subscription price. In addition, at the end of a fi ve-year period they are guaranteed to receive the amount initially invested, plus the greater of either a capitalized annual return of 3.6% or 7.6 times the average increase in Technip’s share value relative to the reference price. In this case, the bank in charge of structuring the operation, fi nances nine Technip’s shares for every one Technip’s share subscribed by the employee.
In some countries, depending on national laws, only one or two of the three plans have been proposed. The terms and conditions of these plans have been adapted to local constraints related to legal, tax or labor matters. In some countries, the Technip Multiple Plan has been replaced by a SAR plan (Stock Appreciation Rights).
The breakdown of the number of shares subscribed by plan is as follows:
2008
Classic Plan 67,503
Multiple Plan 985,155
Secure Plan 93,389
Stock Appreciation Rights (SAR) 300,213
Total of Subscribed Shares 1,446,260
According to IFRS 2, the benefi t given to the employees when shares are granted at a price lower than the market value must be recorded as a charge by the company. The computation of this charge has to take into account the holding period that is to say the fact that employees can not sell its shares during a certain period.
The reference price amounts to €52.66, the subscription price is €42.13 taking into account the 20% discount, and the share price at the end of the cancellation period is €47.80, or a total gross discount of €8.2 million.
In accordance with the computation method as presented in December 2004, by the French accounting standards body, the Conseil National de la Comptabilité (CNC), the holding period discount has been assessed at 14.8% for the Technip Classic Plan and Technip Secure Plan and to 11.8% for the Technip Multiple Plan. The assumptions used for this evaluation are a market interest rate of 3.6% and a credit spread for consumer loans of 2%. Because of the decrease in the market price of Technip shares between the reference period (for computing subscription price) and the end of the cancellation period (when shares are defi nitely subscribed), there is no charge to record for any of these three plans.
In 2008 the charge related to SAR amounted to €3.1 million, due to the lack of a holding period during which the shares are non transferable. This charge was recorded as administrative costs. See Note 4-(d) Administrative Costs by Nature. The total cost for employer contributions to these three plans amounts to €3.1 million recorded as a charge.
In 2009 no charge was recorded because no capital increase reserved for employees was realized.
(k) Capital Management
Shareholders’equity amounts to €2,686.7 million and fi nancial debts amount to €872.7 million. Net cash position of the Group amounts to €1,783.6 million and confi rmed but not used credit lines amount to €1,454.0 million. Technip SA has distributable earnings at its disposal for €287.9 million.

1592009 Reference Document
Financial Information on the Company’s Assets, Financial Situation and Results
20.1. Consolidated Financial Statements 20
Note 21 – Financial Debts (Current and Non-Current)
(a) Financial Debts, Breakdown by Nature
Financial Debts break down as follows:
As of December 31,
In millions of Euro 2009 2008
Bond Loan(1) 650.0 650.0
Bank Borrowings and Credit Lines(2) 194.5 84.2
Refundable Advances (Non-Current) - -
Others - -
Total Non-Current Financial Debts 844.5 734.2
Commercial Papers - -
Bank Overdrafts 9.2 6.2
Accrued Interests Payables 19.0 19.7
Refundable Advances (Current) - -
Total Current Financial Debts 28.2 25.9
Total Financial Debts 872.7 760.1
(1) On May 26, 2004, Technip issued a bond loan for an initial amount of €650 million with a maturity of May 26, 2011. The annual coupon rate is 4.625%, payable on May 26 of each year.
(2) These bank borrowings and credit lines represent notably drawings on subsidized loans granted to one of the Brazilian subsidiaries for the purpose of pre-fi nancing exports and re-fi nancing investments, and drawings on loans granted to a Norwegian subsidiary for fi nancing a new vessel.
(b) Comparison of Carrying Amount and Fair Value of Non-Current Financial Debts
Comparison of carrying amount and fair value of non-current fi nancial debts is as follows:
As of December 31,
2009 2008
In millions of EuroCarrying Amount Fair Value
Carrying Amount Fair Value
Bond Loan (Related Accrued Interests Included) 668.3 688.0 668.3 652.6
Bank Borrowings and Credit Lines 194.5 194.5 84.2 84.2
Refundable Advances (Non-Current) - - - -
Others - - - -
Total Non-Current Financial Debts 862.8 882.5 752.5 736.8
(c) Analysis by Type of Interest Rate
Analysis by type of interest rate is as follows:
As of December 31,
In millions of Euro 2009 2008
Fixed Rates 830.2 668.3
Floating Rates 42.5 91.8
Total Financial Debts 872.7 760.1
As of December 31, 2009 and 2008 the fi xed-rate debt mainly comprises bond loans but also drawings on subsidized loans granted to one of the Brazilian subsidiaries for the purpose of pre-fi nancing exports and re-fi nancing investments and drawings on loans granted to a Norwegian subsidiary for fi nancing a new vessel.
Over the year 2009 the average rate of the fi xed-rate debt was 4.91% compared with 4.62% in 2008. Over the same period, the average rate of the Group’s overall debt (fi xed and fl oating rate) was 5.48% compared with 4.90% per year in 2008. The average rate of debt is calculated by dividing the amount of fi nancial costs for the fi scal year (excluding bank fees not expressly related to the debt) by the average outstanding debt for the fi scal year.

160 2009 Reference Document
Financial Information on the Company’s Assets, Financial Situation and Results
20.1. Consolidated Financial Statements20
(d) Analysis by Currency
Analysis by currency is as follows:
As of December 31,
In millions of Euro 2009 2008
Euro 670.0 669.2
U.S. Dollar 20.8 3.3
Pound Sterling - -
Brazilian Real 121.1 86.6
Norwegian Krone 59.5 -
Others 1.3 1.0
Total Financial Debts 872.7 760.1
(e) Schedule of Financial Debts
The schedule of fi nancial debts is as follows:
In millions of Euro 2009 2010 2011 2012 2013 20142015 and
beyond Total
Fixed Rates 18.3 - 650.0 - - - - 668.3
Floating Rates 7.6 56.0 28.1 0.1 - - - 91.8
Total Financial Debts as of December 31, 2008 25.9 56.0 678.1 0.1 - - - 760.1
Fixed Rates 23.2 653.6 123.0 3.6 3.6 23.2 830.2
Floating Rates 5.0 12.6 11.9 1.5 1.5 10.0 42.5
Total Financial Debts as of December 31, 2009 28.2 666.2 134.9 5.1 5.1 33.2 872.7
As of December 31, 2009 and 2008, no interest rate swap has been subscribed.
(f) Secured Financial Debts
Secured fi nancial debts are as follows:
As of December 31,
2009 2008
In millions of Euro GuaranteeWithout
Guarantee Total GuaranteeWithout
Guarantee Total
Commercial Papers - - - - - -
Bank Overdrafts, Current Facilities and Others 0.4 2.9 3.3 1.0 5.2 6.2
Short-Term Part of Long-Term Debts 6.8 18.1 24.9 - 19.7 19.7
Total Current Financial Debts 7.2 21.0 28.2 1.0 24.9 25.9
Non-Current Financial Debts 53.3 791.2 844.5 1.6 732.6 734.2
Total Financial Debts 60.5 812.2 872.7 2.6 757.5 760.1
Note 22 – Pensions and other Post-Employment Benefi t Plans
In accordance with the laws and practices of each country in which it operates, Technip manages retirement and post retirement benefi t schemes on behalf of its employees.
The Group has assessed its obligations in respect of employee pension plans and other long-term benefi ts such as “jubilee” benefi ts, post-retirement medical benefi ts and special termination benefi ts according to IAS 19. The plan assets are recorded at fair value. Evaluations were coordinated so that liabilities could be measured using recognized and uniform actuarial methods, and were performed by an independent actuary.

1612009 Reference Document
Financial Information on the Company’s Assets, Financial Situation and Results
20.1. Consolidated Financial Statements 20
(a) Description of the Group’s Current Benefi t Plans
Germany
The following plans are offered in Germany:
two pension plans offer a pension payable from age 65: a ■
deffered compensation plan and an early retirement plan (OAPT);
a jubilee plan provides a lump sum payment ranging from one ■
to three months of salary when employees reach 25, 40 and 45 years of service.
Brazil
A jubilee plan provides a lump sum payment of half a month’s salary after 10, 15, 20 and 30 years of service. The plan also pays for a short trip to Brazil or Paris after 20 and 30 years of service.
United Arab Emirates
A retirement benefi t plan provides a payment according to the years of service in the Company: 21 days of salary per year of service up to 5 years and 30 days of salary beyond.
France
The following plans are offered in France:
a retirement benefi t consisting of a capital payment based on ■
years of service and salary at the retirement date;
a post-retirement medical benefi t (closed to new comers); ■
a jubilee plan that provides a lump sum payment after 20, 30, ■
35 and 40 years of services at all companies (minimum number of years spent at Technip required);
an additional defi ned contribution pension plan was set up on ■
January 1, 2005 dedicated to a predetermined and uniform class of top managers. A contribution of 8.0% of gross annual salary within the legal limits, is paid by the Company;
a complementary pension plan was set up on May 1, 2007 for ■
members of the Group’s Executive Committee. It consists of a guaranteed retirement wage of 1.8% of income bracket 4 of annual gross compensation per year of service.
Italy
A cost retirement benefit that provides a capital payment according to the employee’s wage and years of service in the Company is offered. Following the change of Italian law in 2007, this defi ned benefi t plan has been changed into a defi ned contri-bution plan. Consequently, no future right is generated in respect of IAS 19. The amount remaining in the books relates to the rights generated before the change of plan.
Norway
A pension plan offers a guaranteed income from age 67 (maximum 70% of fi nal gross salary, social security included).
Netherlands
The Company has a defi ned benefi t pension plan.
United Kingdom
A pension plan offers an annuity payment. There is also a multi-employer benefi t plan providing employees of the mercantile marine with pensions on retirement and protection on death.
(b) Net Benefi t Expense Recognized in the Income Statement
In millions of Euro 2009 2008
Current Service Cost 10.7 8.5
Financial Cost of Benefi t Obligation 11.2 9.8
Expected Return on Plan Assets (4.5) (5.0)
Net Actuarial (Gain)/Loss Recognized 1.3 1.0
Past Service Cost 0.6 0.6
Special Events (Curtailment) (0.8) -
Net Benefi t Expense as Recorded in the Income Statement 18.5 14.9
In addition to the defi ned benefi t pension plan expense shown in the above table, defi ned contribution plan expenses amounted to €27.0 million in 2009, versus €23.2 million in 2008.
The expected defi ned benefi t plan expense for 2010 calculated on an estimated basis amounts to €17.2 million.
Defi ned contribution plan expenses expected for 2010 amount to €4.9 million.

162 2009 Reference Document
Financial Information on the Company’s Assets, Financial Situation and Results
20.1. Consolidated Financial Statements20
(c) Benefi t Asset/Liability Recognized in the Balance Sheet
The liability as recorded in the balance sheet breaks down as follows:
As of December 31,
In millions of Euro 2009 2008
Provisions (96.1) (98.8)
Accrued Expenses - -
Asset/(Liability) as Recorded in the Balance Sheet (96.1) (98.8)
Defi ned Benefi t Obligation (206.9) (203.2)
Fair Value of Plan Assets 91.5 78.7
Net Defi ned Benefi t Obligation (115.4) (124.5)
Unrecognized Actuarial (Gains)/Losses 10.1 15.6
Unrecognized Past Service Costs 9.2 10.1
Asset/(Liability) as Recorded in the Balance Sheet (96.1) (98.8)
The discounted defi ned benefi t obligation includes €115.7 million for funded plans and €91.2 million for unfunded plan assets.
Changes in unrecognized actuarial gains and losses are as follows:
In millions of Euro 2009 2008
Unrecognized Actuarial (Gains)/Losses as of January 1, 15.6 (8.2)
Amortized during the Year (1.2) 1.0
Amounts Generated during the Year due to Experience (1.0) 9.7
Amounts Generated on Assets (3.9) 8.9
Amounts Generated during the Year due to Changes in Assumptions (0.2) 6.5
Exchange Difference 0.8 (2.3)
Unrecognized Actuarial (Gains)/Losses as of December 31, 10.1 15.6
Changes in the net benefi t asset/(liability) of pensions plans and other post-employment benefi ts are presented below:
In millions of Euro 2009 2008
Net Benefi t Asset/(Liability) as of January 1, (98.8) (103.9)
Exchange Differences on Foreign Plans (0.6) 1.0
Expenses Charged in the Income Statement (18.5) (14.9)
Contributions Paid 22.0 20.5
Disposals of Subsidiaries/Changes in Scope of Consolidation - -
Others (0.2) (1.5)
Net Benefi t Asset/(Liability) as of December 31, (96.1) (98.8)
The change in the DBO (Defi ned Benefi t Obligation) is as follows:
In millions of Euro 2009 2008
Defi ned Benefi t Obligation as of January 1, 203.2 192.8
Current Service Cost 10.7 8.5
Contributions by Employee 0.1 0.2
Financial Cost on Benefi t Obligation 11.2 9.8
Benefi ts Paid (20.2) (16.6)
Actuarial Gains/(Losses) (1.2) 19.0
Curtailment (1.1) -
Exchange Difference 4.0 (8.1)
Others 0.2 (2.4)
Defi ned Benefi t Obligation as of December 31, 206.9 203.2

1632009 Reference Document
Financial Information on the Company’s Assets, Financial Situation and Results
20.1. Consolidated Financial Statements 20
Changes in fair value of plan assets are as follows:
In millions of Euro 2009 2008
Fair Value of Plan Assets as of January 1, 78.7 87.6
Expected Return 4.5 5.0
Contributions by Employer 5.4 6.7
Contributions by Employee 0.1 0.2
Benefi ts Paid (3.7) (2.8)
Actuarial Gains/(Losses) 3.9 (8.9)
Acquisitions and Disposals of Subsidiaries/Changes in Scope of Consolidation - -
Exchange Differences on Foreign Plans 2.6 (5.8)
Others - (3.3)
Fair Value of Plan Assets as of December 31, 91.5 78.7
Below are the details of the principal categories of pension plan by country in terms of the percentage of their total fair value:
In % Bonds Shares Real Estate Cash Total
Norway 63% 17% 16% 4% 100%
Netherlands 73% 27% - - 100%
United Kingdom 16% 79% 3% 2% 100%
France has invested in general funds, so this level of detail is not available. The net expected return on assets amounts to approximately 4.0%.
The expected return on assets is the weighted average of the expected returns. Expected return on assets, by asset class, is as follows:
In % Bonds Shares Real Estate Cash
Norway 4.50% 7.14% 7.14% 1.40%
Netherlands 5.30% 7.22% 7.22% 1.00%
United Kingdom 5.80% 7.47% 7.47% 2.50%
(d) Actuarial Assumptions
The main assumptions made to defi ne the benefi t obligations related to pension plans are detailed in the following table:
As of December 31,
2009 2008
Euroland Others Euroland Others
Discount Rate 5.30% 4.50% to 11.00% 5.40% 4.00% to 11.00%
Expected Return on Plan Assets 1.00% to 7.22% 1.40% to 7.47% 4.50% to 5.30% 4.90% to 6.80%
Future Salary Increase (above Infl ation Rate) 0.25% to 4.00% 0.50% to 2.10% 1.00% to 2.00% 1.00% to 2.00%
Healthcare Cost Increase 3.00% N/A 3.00% N/A
Infl ation Rate 2.00% 2.40% to 4.00% 2.00% 2.50% to 5.00%
A 0.25% decrease in the discount rate would increase the defi ned benefi t obligation by around €3.6 million. Due to the recogni-tion of actuarial profi ts and losses using the so-called “corridor” method, this decrease would not have signifi cant impact on the accrued amount as of December 31, 2009.
A 1.00% decrease in the expected return on plan assets would increase the benefi t expense for 2010 by around €0.2 million.
The effect of a one percentage point increase or decrease in the assumed health care cost trend rate is not material, as it results in a change of plus or minus €0.1 million in the obligation.

164 2009 Reference Document
Financial Information on the Company’s Assets, Financial Situation and Results
20.1. Consolidated Financial Statements20
Note 23 – Provisions
The principles used to evaluate the amounts and types of provisions for liabilities and charges are described in Note 1-C-(t) Provisions.
(a) Changes in Provisions
Changes in provisions over the year 2009 break down as follows:
In millions of Euro
As of January 1,
2009 Increase
Used Provision Reversals
Unused Provision Reversals
Foreign Exchange
Adjustments Others
As of December 31,
2009
Employee Benefi ts(1) 91.4 21.6 (21.0) (3.0) 0.7 (1.0) 88.7
Tax 0.3 0.1 - - - - 0.4
Litigation 3.0 - (3.0) - - - -
Reinsurance(3) 7.8 - - (0.6) - - 7.2
Other Provisions (Non-Current) 1.7 2.7 (0.3) (0.2) 0.2 - 4.1
Total Non-Current Provisions 104.2 24.4 (24.3) (3.8) 0.9 (1.0) 100.4
Employee Benefi ts(1) 7.4 0.8 (0.7) (0.1) - - 7.4
Contingencies related to Contracts 83.0 91.2 (18.3) (41.4) 14.5 - 129.0
Restructuring 1.7 - - - - (0.2) 1.5
Tax 11.3 4.8 (1.3) (2.8) 3.2 - 15.2
Litigation(2) - 245.0 - - - - 245.0
Reinsurance(3) 10.5 1.5 (6.4) (3.8) (0.1) - 1.7
Other Provisions (Current) 68.1 28.6 (11.1) (5.7) 4.7 (0.3) 84.3
Total Current Provisions 182.0 371.9 (37.8) (53.8) 22.3 (0.5) 484.1
Total Provisions 286.2 396.3 (62.1) (57.6) 23.2 (1.5) 584.5
(1) See Note 22 − Pensions and other Post-Employment Benefi t Plans.(2) See Note 32 − Litigation and Contingent Liabilities.(3) Provisions for Reinsurance are recorded at the level of the Group’s captive reinsurer (Engineering RE AG) as per IFRS 4.
(b) Schedule of Provisions
The following table shows the maturity of provisions forecast as of December 31, 2009:
In millions of Euro
As of December 31,
2009 2010 2011 2012 2013 2014 20152016 and
beyond
Employee Benefi ts 88.7 - 1.9 5.6 7.5 5.3 5.2 63.2
Tax 0.4 - 0.4 - - - - -
Litigation - - - - - - - -
Reinsurance 7.2 - - - - - - 7.2
Other Provisions (Non-Current) 4.1 - 3.6 - - - - 0.5
Total Non-Current Provisions 100.4 - 5.9 5.6 7.5 5.3 5.2 70.9
Employee Benefi ts 7.4 7.4 - - - - - -
Contingencies related to Contracts 129.0 61.9 20.4 30.4 16.0 - - 0.3
Restructuring 1.5 0.5 1.0 - - - - -
Tax 15.2 - 0.2 0.1 14.9 - - -
Litigation 245.0 245.0 - - - - - -
Reinsurance 1.7 1.7 - - - - - -
Other Provisions (Current) 84.3 49.5 8.3 6.2 7.0 13.3 - -
Total Current Provisions 484.1 366.0 29.9 36.7 37.9 13.3 - 0.3
Total Provisions 584.5 366.0 35.8 42.3 45.4 18.6 5.2 71.2
The maturity of the provision for litigation is projected.
The criteria for classifying an asset/liability as “current” or “non-current” in the balance sheet is described in Note 1-C Accounting Rules and Estimates.

1652009 Reference Document
Financial Information on the Company’s Assets, Financial Situation and Results
20.1. Consolidated Financial Statements 20
Note 24 – Trade Payables
Trade payables are non-interest bearing. Their maturities are linked to the operating cycle of contracts.
Trade payables amounted to €1,476.2 million as of December 31, 2009 versus €1,703.9 million as of December 31, 2008. The decrease in trade payables is due to the decrease of activity in 2009.
Note 25 – Other Current and Non-Current Liabilities
Other current and non-current liabilities are as follows:
As of December 31,
In millions of Euro 2009 2008
Payroll Costs 178.4 169.1
Social Security Charges 50.5 42.9
Other Tax Payables 114.2 101.1
Deferred Income 15.3 16.5
Accruals on completed contracts(1) 632.0 308.4
Rent to Be Paid - 16.2
Current Accounts on Joint Ventures Contracts 26.2 24.8
Advances Received(2) 521.0 487.6
Others 91.0 104.7
Total Other Current Liabilities 1,628.7 1,271.3
Payables on Fixed Assets 14.7 27.8
Subsidies 13.4 13.4
Others 0.3 -
Total Other Non-Current Liabilities 28.4 41.2
Total Other Liabilities 1,657.1 1,312.5
(1) When the contract is completed, accrued liabilities may be recorded to cover pending expenses until the client signs the fi nal acceptance (See Note 1-C-(b) Long-Term Contracts).
(2) Advances received on contracts recorded in accordance with IAS 18, not identifi ed as construction contracts, are reported here.
The split between current and non-current Liabilities is explained in Note 1-C Accounting Rules and Estimates.

166 2009 Reference Document
Financial Information on the Company’s Assets, Financial Situation and Results
20.1. Consolidated Financial Statements20
Note 26 – Financial Instruments
In compliance with IFRS 7, information disclosed on fi nancial instruments are as follows:
(a) Financial Assets and Liabilities by Category
Financial assets and liabilities break down as follows:
As of December 31, 2009
Value Analysis by Category of Financial Instruments
In millions of EuroCarrying Amount Fair Value
At Fair Value
Through P&L
Loans and Receivables
Available-for-Sale
Assets
Liabilities at
Amortized Cost
Derivative Instruments
Investments in Non-Consolidated Companies 2.1 2.1 2.1 - - - -
Other Non-Current Financial Assets 20.4 20.4 20.4 - - - -
Available-for-Sale Financial Assets 11.5 11.5 - - 11.5 - -
Derivative Financial Instruments 61.6 61.6 - - - - 61.6
Trade Receivables 1,061.4 1,061.4 - 1,061.4 - - -
Current Income Tax Receivables 98.1 98.1 - 98.1 - - -
Other Current Receivables 294.9 294.9 - 294.9 - - -
Cash and Cash Equivalents 2,656.3 2,656.3 2,656.3 - - - -
Total Assets 4,206.3 4,206.3 2,678.8 1,454.4 11.5 - 61.6
Other Non-Current Financial Debts 844.5 864.2 19.7 - - 844.5 -
Other Non-Current Liabilities 28.4 28.4 - - - 28.4 -
Current Financial Debts 28.2 28.2 - - - 28.2 -
Trade Payables 1,476.2 1,476.2 - 1,476.2 - - -
Derivative Financial Instruments 64.0 64.0 - - - - 64.0
Current Income Tax Payables 126.3 126.3 - 126.3 - - -
Other Current Liabilities 1,628.7 1,628.7 - 1,628.7 - - -
Total Liabilities 4,196.3 4,216.0 19.7 3,231.2 - 901.1 64.0
As of December 31, 2008
Value Analysis by Category of Financial Instruments
In millions of EuroCarrying Amount Fair Value
At Fair Value
Through P&L
Loans and Receivables
Available-for-Sale
Assets
Liabilities at
Amortized Cost
Derivative Instruments
Investments in Non-Consolidated Companies 2.4 2.4 2.4 - - - -
Other Non-Current Financial Assets 16.2 16.2 16.2 - - - -
Available-for-Sale Financial Assets 8.2 8.2 - - 8.2 - -
Derivative Financial Instruments 40.4 40.4 - - - - 40.4
Trade Receivables 1,123.5 1,123.5 - 1,123.5 - - -
Current Income Tax Receivables 82.6 82.6 - 82.6 - - -
Other Current Receivables 332.1 332.1 - 332.1 - - -
Cash and Cash Equivalents 2,404.7 2,404.7 2,404.7 - - - -
Total Assets 4,010.1 4,010.1 2,423.3 1,538.2 8.2 - 40.4
Other Non-Current Financial Debts 734.2 718.5 (15.7) - - 734.2 -
Other Non-Current Liabilities 41.2 41.2 - - - 41.2 -
Current Financial Debts 25.9 25.9 - - - 25.9 -
Trade Payables 1,703.9 1,703.9 - 1,703.9 - - -
Derivative Financial Instruments 119.9 119.9 - - - - 119.9
Current Income Tax Payables 99.8 99.8 - 99.8 - - -
Other Current Liabilities 1,271.3 1,271.3 - 1,271.3 - - -
Total Liabilities 3,996.2 3,980.5 (15.7) 3,075.0 - 801.3 119.9

1672009 Reference Document
Financial Information on the Company’s Assets, Financial Situation and Results
20.1. Consolidated Financial Statements 20
The Group uses the following hierarchy for determining and disclosing the fair value of fi nancial instruments depending on the valuation technique:
Level 1: quoted (unadjusted) prices in active markets for identical ■
assets or liabilities;
Level 2: other techniques for which all inputs which have a ■
signifi cant effect on the recorded fair value are observable, either directly or indirectly;
Level 3: techniques which use inputs which have a signifi cant ■
effect on the recorded fair value that are not based on obser-vable market data.
As of December 31, 2009, all Group fi nancial assets and liabilities measured at fair value are classifi ed in Level 2, except Available-for-sale fi nancial assets which are classifi ed in Level 1.
During the reporting period 2009, there were no transfers between Level 1 and Level 2 fair value measurements, and no transfer into or out of Level 3 fair value measurements.
(b) Gains and Losses by Category of Financial Instruments
Gains and losses by category of fi nancial instruments break down as follows:
In millions of Euro
2009
Interest
From Subsequent Valuation
DerecognitionNet Gains /
(Losses)At Fair Value
Currency Translation
Impairment /Reversal of
Impairment
Categories of Financial Instruments
At Fair Value Through P&L 35.0 - - - - 35.0
Loans and Receivables - (33.7) - - - (33.7)
Available-for-Sale Assets - - - (3.1) - (3.1)
Liabilities at Amortized Cost (45.0) - - - - (45.0)
Derivative Financial Instruments - (2.5) - (0.6) - (3.1)
Total Net Gains/(Losses) (10.0) (36.2) - (3.7) - (49.9)
In millions of Euro
2008
Interest
From Subsequent Valuation
DerecognitionNet Gains /
(Losses)At Fair Value
Currency Translation
Impairment /Reversal of
Impairment
Categories of Financial Instruments
At Fair Value Through P&L 28.8 (0.2) - - - 28.6
Loans and Receivables - (19.6) - - - (19.6)
Available-for-Sale Assets - - - (7.3) - (7.3)
Liabilities at Amortized Cost (38.9) - - - - (38.9)
Derivative Financial Instruments - (1.0) - 0.9 - (0.1)
Total Net Gains/(Losses) (10.1) (20.8) - (6.4) - (37.3)
(c) Derivative Financial Instruments
The breakdown by category of derivative fi nancial instruments is as follows:
As of December 31,
2009 2008
In millions of Euro Asset Liability Asset Liability
Forward Foreign Exchange Contracts – Fair Value Hedge 9.6 2.2 9.9 2.9
Forward Foreign Exchange Contracts – Cash Flow Hedge 52.0 61.8 30.5 117.0
Total 61.6 64.0 40.4 119.9
The breakdown of gains and losses on derivative fi nancial instruments that affect shareholders’ equity in fair value reserves is as follows:
In millions of Euro 2009 2008
As of January 1, (74.1) 18.0
Fair Value Gains/(Expenses) on Derivative Financial Instruments – Cash Flow Hedge 74.0 (92.1)
As of December 31, (0.1) (74.1)

168 2009 Reference Document
Financial Information on the Company’s Assets, Financial Situation and Results
20.1. Consolidated Financial Statements20
Note 27 – Payroll Staff
Technip has a regular workforce of 23,000 people (employees on payroll and contracted workers in plants, yards and fl eet). In addition 2,000 external staff reinforce operating teams, bringing the total headcount to 25,000.
Note 28 – Related Party Disclosures
(a) Transactions with Related Parties
The IFP (Institut Français du Pétrole) is represented on Technip’s Board of Directors. Its percentage of ownership amounted to 2.8% as of December 31, 2009 and as of December 31, 2008.
Technip paid IFP a royalty in respect of a agreement for research cooperation on offshore deepwaters. This royalty is calculated under normal competitive conditions and amounted to €3.8 million in 2009 and €1.9 million in 2008, the recorded expense amounted to €3.2 million in 2009 and €3.6 million in 2008.
(b) Assets and Liabilities, Income and Expenses with respect to Associates in Joint Ventures
Credits and debts towards associates in joint ventures are as follows:
As of December 31,
In millions of Euro 2009 2008
Assets 15.2 34.2
Liabilities 53.0 48.8
Net Assets/(Net Liabilities) (37.8) (14.6)
Income and expenses generated with associates in joint ventures are as follows:
In millions of Euro 2009 2008
Income 92.4 103.8
Expenses (137.9) (145.8)
(c) Salary and Benefi ts of the Chief Executive Offi cer
The Company’s Chairman and Chief Executive Officer’s compensation is determined by the Board of Directors, upon the Nominations and Remunerations Committee’s proposal.
The total amount of compensation paid in 2009 by the Company to Thierry Pilenko amounted to €1,823,931.
The variable portion of compensation is based on the fixed compensation for the previous year. For 2009 the target variable portion is equal to 100% of the annual base compensation. 50% of the target variable portion is linked to the fi nancial performance of the Group based on 2009 operating income, 25% is linked to the achievement of individual objectives and 25% to the implementa-tion of Group values and participation in the implementation of measures regarding our economic environment. The share of the variable portion linked to Group fi nancial performance is (i) nil if real performance is below 75% of the budgeted amount (performance fl oor), (ii) between 50% and 100% for a performance equal to 75% to 100% of the budgeted amount and (iii) between 100% and 200% for a performance equal to 100% to 115% of the budgeted amount (outperformance). If achieved fi nancial results are superior to the budgeted objective, a multiplier rate is calculated, up to a maximum of 2. The multiplier is calculated based on the fi nancial portion of the objectives, representing 50% of the variable portion criteria. It is then applied to the other variable portion criteria in order to calculate the fi nal variable portion, which is capped at 200% of the target variable portion. The variable portion to be paid to Thierry Pilenko in 2010 for the 2009 fi nancial year is €1,140,300.
Thierry Pilenko does not receive any directors’ fees for the positions he holds in the Group’s companies or as a Company director.
There is no specifi c retirement plan for the Chairman and Chief Executive Offi cer. The Chairman and Chief Executive Offi cer is a benefi ciary of the supplementary retirement plan for Group executives, with fixed contributions of 8% of gross annual compensation paid up to income bracket 3, i.e., eight times the annual French Social Security limit. The contribution for 2009 amounted to €21,597.
The Chairman and Chief Executive Offi cer also benefi ts from the Company’s existing supplementary retirement plan for Executive Committee members: a retirement income guarantee of 1.8% per year of service, up to a limit of 15 years, on income bracket 4 of gross annual compensation paid, i.e., exceeding eight times the French Social Security limit. The amount of gross compensation to which this retirement income guarantee applies corresponds to the average of the gross base compensation (including variable compensation within the limit of the target variable portion of 100%), received over the fi ve complete fi nancial years prior to the date of departure from the Company. The retirement income guarantee will only be due in the following events: a departure from the Company after his 60th birthday; a departure from the Company as a result of a 2nd or 3rd category disability (as defi ned under French law); a departure from the Company after his 55th birthday provided that such departure is not the result of gross misconduct or negligence on his part and that no salaried activity is resumed between leaving the Company and receiving a pension under the general French Social Security scheme.
Analysis of gains and losses on derivative fi nancial instruments that affect the income statement is as follows:
In millions of Euro 2009 2008
Effectiveness Gains/(Losses) on Fair Value Hedge (0.8) 5.9
Ineffectiveness Gains/(Losses) on Fair Value Hedge 1.2 0.3
Ineffectiveness Gains/(Losses) on Cash Flow Hedge (1.8) 0.6
Total (1.4) 6.8
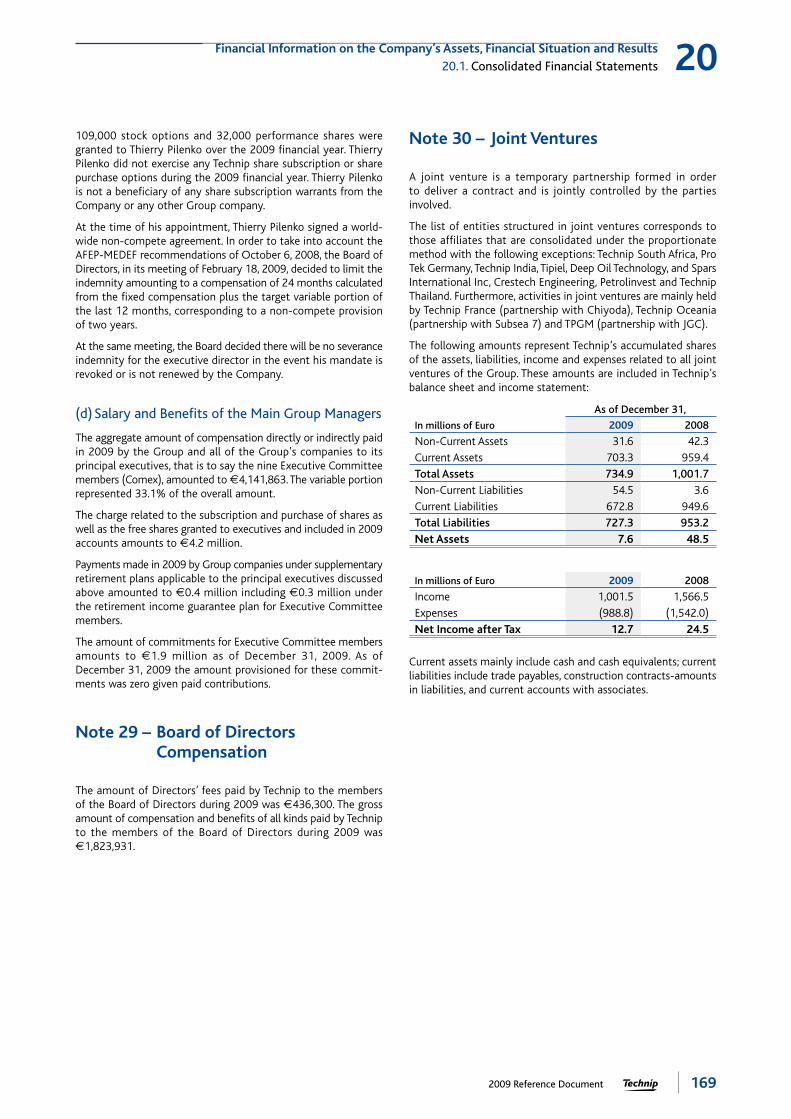
1692009 Reference Document
Financial Information on the Company’s Assets, Financial Situation and Results
20.1. Consolidated Financial Statements 20
109,000 stock options and 32,000 performance shares were granted to Thierry Pilenko over the 2009 fi nancial year. Thierry Pilenko did not exercise any Technip share subscription or share purchase options during the 2009 fi nancial year. Thierry Pilenko is not a benefi ciary of any share subscription warrants from the Company or any other Group company.
At the time of his appointment, Thierry Pilenko signed a world-wide non-compete agreement. In order to take into account the AFEP-MEDEF recommendations of October 6, 2008, the Board of Directors, in its meeting of February 18, 2009, decided to limit the indemnity amounting to a compensation of 24 months calculated from the fi xed compensation plus the target variable portion of the last 12 months, corresponding to a non-compete provision of two years.
At the same meeting, the Board decided there will be no severance indemnity for the executive director in the event his mandate is revoked or is not renewed by the Company.
(d) Salary and Benefi ts of the Main Group Managers
The aggregate amount of compensation directly or indirectly paid in 2009 by the Group and all of the Group’s companies to its principal executives, that is to say the nine Executive Committee members (Comex), amounted to €4,141,863. The variable portion represented 33.1% of the overall amount.
The charge related to the subscription and purchase of shares as well as the free shares granted to executives and included in 2009 accounts amounts to €4.2 million.
Payments made in 2009 by Group companies under supplementary retirement plans applicable to the principal executives discussed above amounted to €0.4 million including €0.3 million under the retirement income guarantee plan for Executive Committee members.
The amount of commitments for Executive Committee members amounts to €1.9 million as of December 31, 2009. As of December 31, 2009 the amount provisioned for these commit-ments was zero given paid contributions.
Note 29 – Board of Directors Compensation
The amount of Directors’ fees paid by Technip to the members of the Board of Directors during 2009 was €436,300. The gross amount of compensation and benefi ts of all kinds paid by Technip to the members of the Board of Directors during 2009 was €1,823,931.
Note 30 – Joint Ventures
A joint venture is a temporary partnership formed in order to deliver a contract and is jointly controlled by the parties involved.
The list of entities structured in joint ventures corresponds to those affi liates that are consolidated under the proportionate method with the following exceptions: Technip South Africa, Pro Tek Germany, Technip India, Tipiel, Deep Oil Technology, and Spars International Inc, Crestech Engineering, Petrolinvest and Technip Thailand. Furthermore, activities in joint ventures are mainly held by Technip France (partnership with Chiyoda), Technip Oceania (partnership with Subsea 7) and TPGM (partnership with JGC).
The following amounts represent Technip’s accumulated shares of the assets, liabilities, income and expenses related to all joint ventures of the Group. These amounts are included in Technip’s balance sheet and income statement:
As of December 31,
In millions of Euro 2009 2008
Non-Current Assets 31.6 42.3
Current Assets 703.3 959.4
Total Assets 734.9 1,001.7
Non-Current Liabilities 54.5 3.6
Current Liabilities 672.8 949.6
Total Liabilities 727.3 953.2
Net Assets 7.6 48.5
In millions of Euro 2009 2008
Income 1,001.5 1,566.5
Expenses (988.8) (1,542.0)
Net Income after Tax 12.7 24.5
Current assets mainly include cash and cash equivalents; current liabilities include trade payables, construction contracts-amounts in liabilities, and current accounts with associates.

170 2009 Reference Document
Financial Information on the Company’s Assets, Financial Situation and Results
20.1. Consolidated Financial Statements20
Note 31 – Off-Balance Sheet Commitments
The off-balance sheet commitments by maturity date are presented as follows:
As of December 31,
2009 2008
Amounts of Commitments per Period
Total TotalIn millions of EuroLess than
1 year 1 to 5 yearsMore than
5 years
Operating Leases 92.1 302.2 327.0 721.3 572.3
Foreign Exchange Rate Financial Instruments 1,735.9 868.3 - 2,604.2 2,060.1
Total Contractual Commitments 1,828.0 1,170.5 327.0 3,325.5 2,632.4
As of December 31,
2009 2008
Amounts of Commitments per Period
Total TotalIn millions of EuroLess than
1 year 1 to 5 yearsMore than
5 years
Parent Company Guarantees 14,911.5 12,407.8 3,053.3 30,372.6 28,190.2
Other Commitments Given 637.5 2,102.5 243.2 2,983.2 3,169.9
Total Commitments Given 15,549.0 14,510.3 3,296.5 33,355.8 31,360.1
As of December 31,
2009 2008
Amounts of Commitments per Period
Total TotalIn millions of EuroLess than
1 year 1 to 5 yearsMore than
5 years
Commitments Received 468.9 269.0 1.5 739.4 1,004.4
Total Commitments Received 468.9 269.0 1.5 739.4 1,004.4
(a) Capital Leases and Operating Leases
The Group rents various equipment, vessels and buildings, mainly under lease contracts that will end during the next ten years. It is likely that the Group will have to renew or to replace them. The Group does not have any assets subject to a capital lease.
At the end of December 2009, the rental expense amounted to €109.7 million against €96.4 million in 2008.
As of December 31, 2009, the Group’s commitments related to operating leases break down as follows:
As of December 31,
In millions of Euro 2009 2008
2009 - 92.1
2010 92.1 83.1
2011 87.8 79.4
2012 75.6 66.2
2013 72.4 65.1
2014 66.4 186.4
2015 and beyond 327.0 NC
Total Net Value of Operating Leases 721.3 572.3
In 2009, in agreement with the lessor, Technip broke a lease contract running through 2015 related to an offi ce building in Paris-La Défense, that houses the Group’s headquarters, and signed a new 12-year lease contract with a commitment of €322 million. The rental expense paid in respect of 2009 was €26 million.
(b) Bank and Commercial Guarantees
Commitments given and received are summarized hereafter:
As of December 31,
In millions of Euro 2009 2008
Parent Company Guarantees 30,372.6 28,190.2
Other Commitments Given 2,983.2 3,169.9
Total Commitments Given 33,355.8 31,360.1
Total Commitments Received 739.4 1,004.4
Parent company guarantees given by Technip SA or its affi liates to clients cover the due and proper performance of the specifi ed construction contracts for which the average expiration period until the release of the commitment guarantees is about 5 years. The amounts disclosed in the parent company guarantees, which stand at €30,372.6 million also include the contract part allocated to the Group’s partners in joint ventures and are not reduced according to the projects’ percentage of completion. They are not reduced by the amount of parent company guarantees received from Technip’s partners in these joint ventures, whereas Technip issues parent company guarantees to these same partners.
The parent company guarantees issued by Technip for contracts not part of a joint venture framework amount to €12,223.9 million as of December 31, 2009.

1712009 Reference Document
Financial Information on the Company’s Assets, Financial Situation and Results
20.1. Consolidated Financial Statements 20
Other commitments given relate mainly to guarantees or counter-guarantees given by banks and insurance companies to various customers in connection with ongoing contracts in order to secure due and proper performance of the contracts or following the payment of retention guarantees and advance billings.
Commitments received relate mainly to similar guarantees obtained from suppliers or subcontractors in connection with ongoing contracts.
The present note does not omit any signifi cant off-balance sheet commitment.
The following table illustrates the breakdown of these €18,148.7 million of parent company guarantees issued by Technip in respect of joint venture contracts, according to the Group’s percentage of ownership in these joint ventures, as of December 31, 2009.
In millions of Euro
As of December 31,
2009 2008
Allocation as per % of Technip’s Ownership in Joint Ventures
Less or equal to 25%
Greater than 25% and less or equal to 40%
Greater than 40% Total Total
Parent Company Guarantees Given within Joint Ventures 2,497.7 11,435.3 4,215.7 18,148.7 18,809.4
Note 32 – Litigations and Contingent Liabilities
(a) Litigations
The main current litigation and risks are as follows:
ITP lawsuit
On December 21, 2001, Interpipe SA (ITP), a French company, fi led a lawsuit with a French Commercial Court (Tribunal de Commerce) against Cofl exip, Cofl exip Stena Offshore Ltd and Cofl exip Stena Offshore International (renamed Technip France and Technip UK Ltd) seeking damages based on alleged breaches of confi dentiality agreements related to “pipe-in-pipe” technology.
This dispute relates to contractual and other relationships among the companies between 1993 and 1998. ITP worked on certain subsea pipeline installation projects managed subsequently by Cofl exip (and then Technip).
On May 16, 2006, the Commercial Court of Paris rendered a ruling partially in favor of ITP, imposing a fi ne of €48,930,000 on Technip. The Court’s decision was not, however, automatically enforceable.
On June 28, 2006, Technip fi led an appeal of this ruling. ITP then amended its complaint by adding grounds of unfair commercial practices and tort liability.
On March 18, 2009, the Appeals Court of Paris ruled in favor of Technip by overruling the Commercial Court’s decision as it related to Technip’s contractual breach and by rejecting ITP’s other complaints.
Technip has always believed ITP’s complaints to be unfounded and that its exposure to this litigation was weak, which was confi rmed by the Court.
Moreoever, the Court, in the same decision, ruled in favor of Technip’s counter-argument by fi nding that ITP had committed
acts of defamation against Technip and by requiring that it pay damages.
An appeal with the highest court (Cour de cassation) has been lodged by ITP against this decision which nevertheless has been executed by ITP thereafter.
ITP had also brought an action against Technip before the Scottish and U.S. courts for infringement of a patent relating to pipe-in-pipe technology. In the meantime, the disputed patent was revoked by the European Patent Offi ce on February 17, 2004, which rendered ITP’s claim on British territory invalid. As a result, the Appeals Court of Edinburgh terminated the proceedings before it on November 19, 2004. In addition, a settlement agreement that was reached in October 2007, requiring no fi nancial compensation, terminated the proceedings before the U.S. court in Alabama.
However, even though the revocation of ITP’s European patent terminated its rights to the patent, it had no effect on the French patent obtained to protect the “pipe-in-pipe” technology.
As a result, on April 27, 2007, Technip brought an action against ITP to nullify its French patent. Technip’s claim was rejected by the Paris Court of fi rst instance on January 28, 2009, which has already been appealed. Technip believes that its exposure in terms of damages is negligible.
Legal risk from an ongoing case
Technip is one of four shareholders of TSKJ, which carried out the construction of a natural gas liquefaction complex in Nigeria for Nigeria LNG Limited (“NLNG”) from 1994 onwards. The compa-nies KBR (formerly a subsidiary of the US Group Halliburton), Snamprogetti Netherlands BV (a subsidiary of the Italian Group ENI) and JGC Corporation (Japan) each hold 25% of TSKJ’s share capital.

172 2009 Reference Document
Financial Information on the Company’s Assets, Financial Situation and Results
20.1. Consolidated Financial Statements20
The United States Securities and Exchange Commission (“SEC”) and the United States Department of Justice (“DOJ”) have since 2004 been conducting formal investigations into payments made in connection with the construction by TSKJ of a natural gas liquefaction complex for NLNG. A similar investigation by a French magistrate against “unidentifi ed persons” which also commenced in 2004 is still ongoing.
During the summer of 2004, the SEC requested Technip (which registered its shares with the SEC between October 2001 and November 2007) to voluntarily provide information relating to the implementation of this Project. Technip has fully cooperated on a voluntary basis with both formal and informal requests from the SEC and the DOJ since this request.
On February 11, 2009 KBR, which was at all relevant times, between 1994 and 2007, a domestic issuer under US securities laws, pleaded guilty to a fi ve count criminal information in the United States District Court involving charges related to the United States Foreign Corrupt Practices Act (“FCPA”) for conduct arising from its participation in TSKJ. In its plea agreement, KBR asserted that it had conspired to pay bribes to Nigerian Government Offi cials. As part of its plea agreement, KBR agreed to pay a criminal fi ne of US$402 million. Contemporaneously, KBR and its former parent company Halliburton also reached a settlement of a related civil complaint fi led by the SEC alleging civil violations of the FCPA. KBR and Halliburton jointly agreed to pay US$177 million in settlement of the civil complaint. The US Government has also brought criminal charges against certain individuals for conduct related to the Project.
A person or entity found in violation of the FCPA could be subject to criminal fi nes and civil penalties of up to US$500,000 per viola-tion and equitable remedies including disgorgement (if applicable) of profi ts including pre-judgment interest on such profi ts. Criminal penalties could range up to US$2 million per violation or twice the pecuniary gain or loss from the violation. The amount of any fi nes or monetary penalties depend on factual fi ndings, including among others, the amount, timing, nature and scope of any improper payment and related business transactions and the level of cooperation provided to the authorities during the investigations. Investigations of this nature and any related settlements could result in (i) third party claims against Technip which could include claims for special, indirect or consequential damages (ii) adverse consequences on Technip’s ability to obtain or continue fi nancing for current or future projects and/ or (iii) damage to Technip’s business or reputation via negative publicity adversely affecting Technip’s prospects in the commercial market place.
French law was modifi ed in September 2000 to attach, for the fi rst time, liability for the corruption of foreign public offi cials. Under that law, criminal fi nes of up to €750,000, the confi scation of the direct and indirect proceeds of the offence and various prohibitions and civil damages may be imposed on a legal entity.
Technip and its counsel have held meetings with the US authorities since July 2008 and have discussed a resolution of the investiga-tion. While these discussions have not concluded, Technip recorded an exceptional charge of €245 million in the fourth quarter 2009 accounts refl ecting the estimated costs of resolution based on the status of ongoing discussions. The potential resolution does not contemplate a criminal conviction for Technip’s role in the TSKJ joint venture and would not affect Technip’s ability to continue its operations in a normal manner. While Technip currently has no reason to believe that the US investigation will not be resolved as anticipated, there can be no assurance that fi nal agreement will be reached with the DOJ and the SEC. If fi nal agreement is not reached, Technip cannot exclude a different conclusion of the investigation which could have a material adverse impact on Technip’s fi nancial position or operations.
(b) Contingent Liabilities
Individual Training Right
The law of May 4, 2004 provides French company employees with the right to receive individual training of at least 20 hours per year that can be accumulated over six years. At the end of the sixth year, the rights will be capped at 120 hours even if the hours have not been spent by the employee. In accordance with Notice 2004-F of October 13, 2004 issued by the Emergency Committee of the French national accounting standards body, the Conseil National de la Comptabilité on accounting for the DIF (Droit individuel à la formation: Individual Training Right) expenses are recognized during the year and do not require the recognition of a liability. They constitute the remuneration of a future service and not a past one. The Group has maintained the French way of accounting under IFRS given that the debt is uncertain. The employee could ask to use this right but is not obliged to; he may never request it.
In some specifi c cases, these expenses could not be considered as a future service: for example when an employee has resigned and asks to use his training rights during his notice period.
In 2009 as in 2008, in French entities of the Group, two resigning employees asked for this right. No employee has a confl ict with the Group on the subject.
Accumulated unused individual staff training rights amounted to 180,000 hours as of December 31, 2009.
In addition, the lifelong professional training agreement of the main French subsidiary offers training opportunities in five different topics: technical skills, offi ce application IT, management and communication, quality and HSE and languages; these train-ings are open to all employees. Technip spends around 3.5% of its payroll on training costs (that is around 2 percentage points more than the 1.6% required by the law). Each year, 60% of employees attend at least one training session.

1732009 Reference Document
Financial Information on the Company’s Assets, Financial Situation and Results
20.1. Consolidated Financial Statements 20
Note 33 – Market Related Exposure
(a) Liquidity Risk
A - Technip Group fi nancing is carried out within the scope of a Group policy implemented by the Financial and Control Department.
B - Cash management is centralized at the head offi ce and coor-dinated through the fi nancial centers located in the Group’s main operating subsidiaries.
The Technip Eurocash SNC (general partnership) acts as a cash pooling entity for the Group’s main entities in respect of the various legislation and regulations in force locally. Thus, the Technip Eurocash SNC entered into cash pooling agreements with the Group’s subsidiaries in order to pool the surplus cash to meet their needs by pooling the Group’s fi nancial resources except when economic and fi nancial conditions lead to giving priority to a local debt. Technip Eurocash’s manage-ment committee, made up of Chief Financial Offi cers of each operating Region of the Group, meets several times per year.
C - In May 2004, Technip issued a €650 million bond (see Note 21 − Financial Debts Current and Non-Current).
D - As of December 31, 2009, the Group has the following unused fi nancing sources:
1/ An authorized €850 million credit facility, which was signed in 2004 and amended in 2005, 2006 and 2007 by Technip (single redemption date: June 20, 2012). The Group has not pledged any of its assets as collateral for this credit line. This credit line comes with the usual covenants binding Technip and the affi liates entitled to borrow, excluding any fi nancial ratios.The amendment signed in June 2005 dealt mainly with an extension of the credit maturity to June 2010 and a decrease in fi nancial conditions. The amendment signed in June 2006 extended the credit maturity to June 2011 and the amendment signed in June 2007 brought maturity to June 2012.
2/ Two credit facilities granted to Technip, for an amount of €125 million each, usable in Euro or in U.S. Dollar. Their expiry dates are respectively May 26, 2012 and June 27, 2012. They have the same covenants as the credit described above.
3/ Two credit facilities were signed in May 2008, usable in U.S. Dollar or in Euro:
the first one for an amount of • €90 million, which reimbursements will begin on May 13, 2011 and end on May 13, 2015;the second one for an amount of • €80 million reimburs-able for the fi rst half in 2012 and the second half in 2013.These two credit facilities include the same covenants as the previous ones, with the exception of any fi nancial ratios to be respected.
4/ Three credit facilities for a total unused amount of US$211 million (out of a total authorized amount of US$241 million) were signed in 2009 and dedicated to fi nancing a vessel under construction:
a credit facility for an unused amount of US$95 million • (out of a total authorized amount of US$125 million of which US$30 million used as of December 31, 2009) granted to Technip, with four half-year milestones from June 15, 2011 to December 15, 2012;a credit facility for an amount of US$88 million granted • to the subsidiary Technip NPV Singapore Ltd, guaran-teed by Technip and secured with an insurance policy from the export credit agency Finnvera (Finland), with seventeen half-year milestones from July 15, 2011 to July 15, 2019; and,a credit facility for an amount of $28 million granted to • the subsidiary Technip NPV Singapore Ltd, guaranteed by Technip and secured with an insurance policy from the export credit agency Coface (France), with fourteen half-year milestones from July 15, 2011 to January 15, 2018.
These floating rate credit lines come with the usual covenants binding Technip and the affi liates entitled to borrow, with the exception of any fi nancial ratios. The Group has not pledged any of its assets as collateral for these credit lines.
5/ Various unused credit facilities amounting to €37.6 million.The credit agreements with respect to these various fi nancing arrangements do not include an early payment clause in case of a deterioration in the borrower’s rating. These credit agreements include a variable interest rate clause in case they are used.
As of December 31, 2009, the amount of credit facilities confi rmed and available is €1,454.0 million of which €1,416.5 million are available beyond December 31, 2010.
Given market conditions, the Group has no commercial paper as of December 31, 2009. The Group has authoriza-tion from Banque de France for a maximum amount of €600 million.
E - Due dates related to fi nancial liabilities:
Payment due dates related to debts include projected interest payments, even if they are not accrued on the closing date. Variable rates used to calculate projected interest payments are the rates in force as of December 31, 2009.
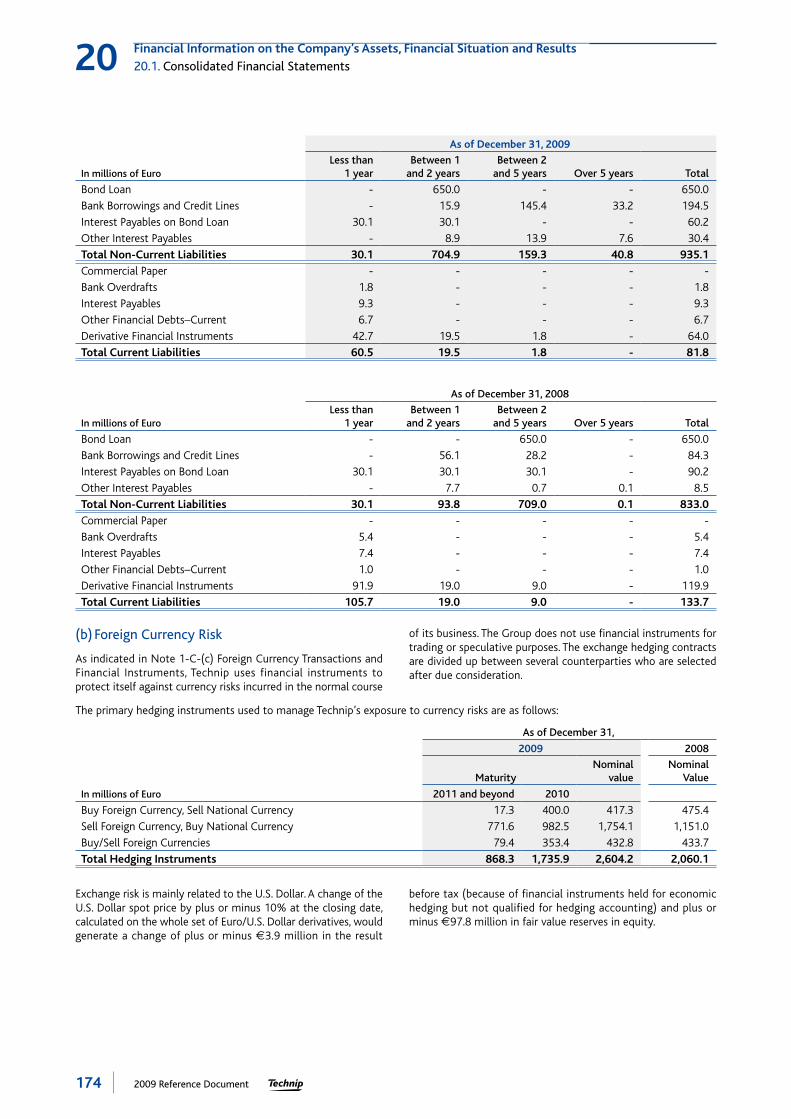
174 2009 Reference Document
Financial Information on the Company’s Assets, Financial Situation and Results
20.1. Consolidated Financial Statements20
In millions of Euro
As of December 31, 2009
Less than 1 year
Between 1 and 2 years
Between 2 and 5 years Over 5 years Total
Bond Loan - 650.0 - - 650.0
Bank Borrowings and Credit Lines - 15.9 145.4 33.2 194.5
Interest Payables on Bond Loan 30.1 30.1 - - 60.2
Other Interest Payables - 8.9 13.9 7.6 30.4
Total Non-Current Liabilities 30.1 704.9 159.3 40.8 935.1
Commercial Paper - - - - -
Bank Overdrafts 1.8 - - - 1.8
Interest Payables 9.3 - - - 9.3
Other Financial Debts–Current 6.7 - - - 6.7
Derivative Financial Instruments 42.7 19.5 1.8 - 64.0
Total Current Liabilities 60.5 19.5 1.8 - 81.8
In millions of Euro
As of December 31, 2008
Less than 1 year
Between 1 and 2 years
Between 2 and 5 years Over 5 years Total
Bond Loan - - 650.0 - 650.0
Bank Borrowings and Credit Lines - 56.1 28.2 - 84.3
Interest Payables on Bond Loan 30.1 30.1 30.1 - 90.2
Other Interest Payables - 7.7 0.7 0.1 8.5
Total Non-Current Liabilities 30.1 93.8 709.0 0.1 833.0
Commercial Paper - - - - -
Bank Overdrafts 5.4 - - - 5.4
Interest Payables 7.4 - - - 7.4
Other Financial Debts–Current 1.0 - - - 1.0
Derivative Financial Instruments 91.9 19.0 9.0 - 119.9
Total Current Liabilities 105.7 19.0 9.0 - 133.7
(b) Foreign Currency Risk
As indicated in Note 1-C-(c) Foreign Currency Transactions and Financial Instruments, Technip uses financial instruments to protect itself against currency risks incurred in the normal course
of its business. The Group does not use fi nancial instruments for trading or speculative purposes. The exchange hedging contracts are divided up between several counterparties who are selected after due consideration.
The primary hedging instruments used to manage Technip’s exposure to currency risks are as follows:
As of December 31,
2009 2008
MaturityNominal
valueNominal
Value
In millions of Euro 2011 and beyond 2010
Buy Foreign Currency, Sell National Currency 17.3 400.0 417.3 475.4
Sell Foreign Currency, Buy National Currency 771.6 982.5 1,754.1 1,151.0
Buy/Sell Foreign Currencies 79.4 353.4 432.8 433.7
Total Hedging Instruments 868.3 1,735.9 2,604.2 2,060.1
Exchange risk is mainly related to the U.S. Dollar. A change of the U.S. Dollar spot price by plus or minus 10% at the closing date, calculated on the whole set of Euro/U.S. Dollar derivatives, would generate a change of plus or minus €3.9 million in the result
before tax (because of fi nancial instruments held for economic hedging but not qualifi ed for hedging accounting) and plus or minus €97.8 million in fair value reserves in equity.

1752009 Reference Document
Financial Information on the Company’s Assets, Financial Situation and Results
20.1. Consolidated Financial Statements 20
(c) Interest Rate Risk
Analysis of the sensitivity of the situation to the change in interest rates
Technip’s variable rate debt amounts to €42.5 million compared with a total net debt of €872.7 million.
Cash is invested short term in order to ensure its liquidity. Financial products are subject to fl uctuations in money market interest rates.
The net short-term cash position of the Group (cash and cash equivalents less short-term fi nancial debts) amounts to €2,628.1 million.
A 1% (100 bp) increase in interest rates would lower the fair value of the fi xed-rate bond by €10.6 million before tax as of December 31, 2009; a 1% (100 bp) decrease in interest rates would raise the fair value by €29.1 million before tax.
A 1% (100 bp) increase in interest rates would generate an addi-tional profi t of €26.3 million before tax in the net cash position; a 1% (100 bp) decrease in interest rate would generate a loss of the same amount.
Interest rate risk monitoring method
Technip regularly analyzes its exposure to interest rate risk. This activity is the responsibility of the Treasury Department, which reports directly to the Deputy CFO.
The Group does not use fi nancial instruments for speculative purposes.
As of December 31, 2009, Technip has not entered into any interest rate swaps (rate swap, forward rate agreement, etc.). The outstanding fi xed-rate debt whose residual maturity is greater than one year amounts to €807.3 million.
(d) Credit Risk
A signifi cant portion of the Group’s activity is concentrated with a limited number of clients because the worldwide market is dominated by a small number of major oil and gas companies. Consequently, the Group regularly performs credit risk analyses before entering into contracts and has set up procedures for monitoring payments made by customers.
The schedule of past due but not impaired trade receivables is the following:
In millions of Euro
As of December 31, 2009
Not impaired on the Reporting Date and Past Due in the Following Periods Total Trade ReceivablesLess than 3 months 3 to 12 months Over 1 year Total
Trade Receivables 219.0 73.7 83.1 375.8 1,061.4
In millions of Euro
As of December 31, 2008
Not impaired on the Reporting Date and Past Due in the Following Periods Total Trade ReceivablesLess than 3 months 3 to 12 months Over 1 year Total
Trade Receivables 188.8 61.2 78.7 328.7 1,123.5
Among past due but not impaired trade receivables, the principal counterparty represents €58.0 million as of December 31, 2009. Part of this trade receivable was paid in early 2010.
As far as cash and cash equivalents are concerned, the principal counterparty stands for 14% of total net cash position as of
December 31, 2009. As far as derivative fi nancial instruments are concerned, the principal counterparty stands for 19% of the Group’s total derivative fi nancial instruments. During the period the Group concentrated its counterparties on bank institutions considered as the safest.

176 2009 Reference Document
Financial Information on the Company’s Assets, Financial Situation and Results
20.1. Consolidated Financial Statements20
Note 34 – Auditors’ Fees and Services
Auditors’ fees and services break down as follows:
In thousands of Euro
Ernst & Young PricewaterhouseCoopers
2009 2008 2009 2008
Amount % Amount % Amount % Amount %
Audit
Auditing, certifi cation of fi nancial statements, examination of Company and Consolidated Financial Statements:
Technip SA ■ 655 17% 812 16% 511 23% 581 24%
Subsidiaries ■ 2,451 65% 3,109 62% 1,504 69% 1,530 63%
Other assignments:
Technip SA ■ 16 1% 301 6% - - 99 4%
Subsidiaries ■ 8 0% 52 1% 40 2% 70 3%
Sub-total 3,130 83% 4,274 85% 2,055 94% 2,280 94%
Other services
Legal and tax:
Technip SA ■ - - - - - - - -
Subsidiaries ■ 661 17% 725 15% 121 6% 148 6%
Sub-total 661 17% 725 15% 121 6% 148 6%
Total 3,791 100 % 4,999 100% 2,176 100% 2,428 100%
Note 35 – Subsequent Events
There are no signifi cant subsequent events.

1772009 Reference Document
Financial Information on the Company’s Assets, Financial Situation and Results
20.2. Statutory Financial Statements 20
20.2.1. Statutory Auditors’ Report on the Financial Statements . . . . . . . . . . . . . . . . . . . . . . . . . . . . . . . . . . . . 178
20.2.2. Statutory Financial Statements. . . . . . . . . . . . . . . . . . . . . . . . . . . . . . . . . . . . . . . . . . . . . . . . . . . . . . . . . . 180
1. Balance Sheet . . . . . . . . . . . . . . . . . . . . . . . . . . . . . . . . . . . . . . . . . . . . . . . . . . . . . . . . . . . . . . . . . . . . . . 180
2. Income Statement . . . . . . . . . . . . . . . . . . . . . . . . . . . . . . . . . . . . . . . . . . . . . . . . . . . . . . . . . . . . . . . . . . 181
3. Cash Flow Statement . . . . . . . . . . . . . . . . . . . . . . . . . . . . . . . . . . . . . . . . . . . . . . . . . . . . . . . . . . . . . . . 182
4. Notes on Accounting Principles . . . . . . . . . . . . . . . . . . . . . . . . . . . . . . . . . . . . . . . . . . . . . . . . . . . . . . . 182
5. Main Events of the Year. . . . . . . . . . . . . . . . . . . . . . . . . . . . . . . . . . . . . . . . . . . . . . . . . . . . . . . . . . . . . . 183
6. Notes to the Financial Statements . . . . . . . . . . . . . . . . . . . . . . . . . . . . . . . . . . . . . . . . . . . . . . . . . . . . 1846.1. Fixed Assets . . . . . . . . . . . . . . . . . . . . . . . . . . . . . . . . . . . . . . . . . . . . . . . . . . . . . . . . . . . . . . . . . . . . . . . . . . . . . . . . . . . . . . . .1846.2. Current Assets . . . . . . . . . . . . . . . . . . . . . . . . . . . . . . . . . . . . . . . . . . . . . . . . . . . . . . . . . . . . . . . . . . . . . . . . . . . . . . . . . . . . . .1856.3. Marketable Securities. . . . . . . . . . . . . . . . . . . . . . . . . . . . . . . . . . . . . . . . . . . . . . . . . . . . . . . . . . . . . . . . . . . . . . . . . . . . . . . .1856.4. Accrued Assets and Redemption Premium . . . . . . . . . . . . . . . . . . . . . . . . . . . . . . . . . . . . . . . . . . . . . . . . . . . . . . . . . . . . . .1856.5. Shareholders’ Equity. . . . . . . . . . . . . . . . . . . . . . . . . . . . . . . . . . . . . . . . . . . . . . . . . . . . . . . . . . . . . . . . . . . . . . . . . . . . . . . . .1856.6. Provisions. . . . . . . . . . . . . . . . . . . . . . . . . . . . . . . . . . . . . . . . . . . . . . . . . . . . . . . . . . . . . . . . . . . . . . . . . . . . . . . . . . . . . . . . . .1886.7. Accrued Charges and Accrued Income Included in Assets and Liabilities. . . . . . . . . . . . . . . . . . . . . . . . . . . . . . . . . . . . .1886.8. Maturity of Assets and Liabilities . . . . . . . . . . . . . . . . . . . . . . . . . . . . . . . . . . . . . . . . . . . . . . . . . . . . . . . . . . . . . . . . . . . . . .1896.9. Trade Bills Included in Assets and Liabilities . . . . . . . . . . . . . . . . . . . . . . . . . . . . . . . . . . . . . . . . . . . . . . . . . . . . . . . . . . . . .1896.10. Revenues . . . . . . . . . . . . . . . . . . . . . . . . . . . . . . . . . . . . . . . . . . . . . . . . . . . . . . . . . . . . . . . . . . . . . . . . . . . . . . . . . . . . . . . . . .1896.11. Financial Result . . . . . . . . . . . . . . . . . . . . . . . . . . . . . . . . . . . . . . . . . . . . . . . . . . . . . . . . . . . . . . . . . . . . . . . . . . . . . . . . . . . . .1906.12. Extraordinary Result . . . . . . . . . . . . . . . . . . . . . . . . . . . . . . . . . . . . . . . . . . . . . . . . . . . . . . . . . . . . . . . . . . . . . . . . . . . . . . . . .1906.13. Income Tax. . . . . . . . . . . . . . . . . . . . . . . . . . . . . . . . . . . . . . . . . . . . . . . . . . . . . . . . . . . . . . . . . . . . . . . . . . . . . . . . . . . . . . . . .1906.14. Related Parties Disclosure . . . . . . . . . . . . . . . . . . . . . . . . . . . . . . . . . . . . . . . . . . . . . . . . . . . . . . . . . . . . . . . . . . . . . . . . . . . .1916.15. Off-Balance Sheet Commitments . . . . . . . . . . . . . . . . . . . . . . . . . . . . . . . . . . . . . . . . . . . . . . . . . . . . . . . . . . . . . . . . . . . . .1916.16. Financial Instruments. . . . . . . . . . . . . . . . . . . . . . . . . . . . . . . . . . . . . . . . . . . . . . . . . . . . . . . . . . . . . . . . . . . . . . . . . . . . . . . .1926.17. Assets used as Collateral . . . . . . . . . . . . . . . . . . . . . . . . . . . . . . . . . . . . . . . . . . . . . . . . . . . . . . . . . . . . . . . . . . . . . . . . . . . . .1926.18. Average Number of Employees . . . . . . . . . . . . . . . . . . . . . . . . . . . . . . . . . . . . . . . . . . . . . . . . . . . . . . . . . . . . . . . . . . . . . . .1926.19. Board of Directors’ Compensation. . . . . . . . . . . . . . . . . . . . . . . . . . . . . . . . . . . . . . . . . . . . . . . . . . . . . . . . . . . . . . . . . . . . .1926.20. Auditors’ fees. . . . . . . . . . . . . . . . . . . . . . . . . . . . . . . . . . . . . . . . . . . . . . . . . . . . . . . . . . . . . . . . . . . . . . . . . . . . . . . . . . . . . . .1936.21. Litigation and Pending Investigations . . . . . . . . . . . . . . . . . . . . . . . . . . . . . . . . . . . . . . . . . . . . . . . . . . . . . . . . . . . . . . . . . .193
7. Subsidiaries and Investments. . . . . . . . . . . . . . . . . . . . . . . . . . . . . . . . . . . . . . . . . . . . . . . . . . . . . . . . . 194
20.2. Statutory Financial Statements
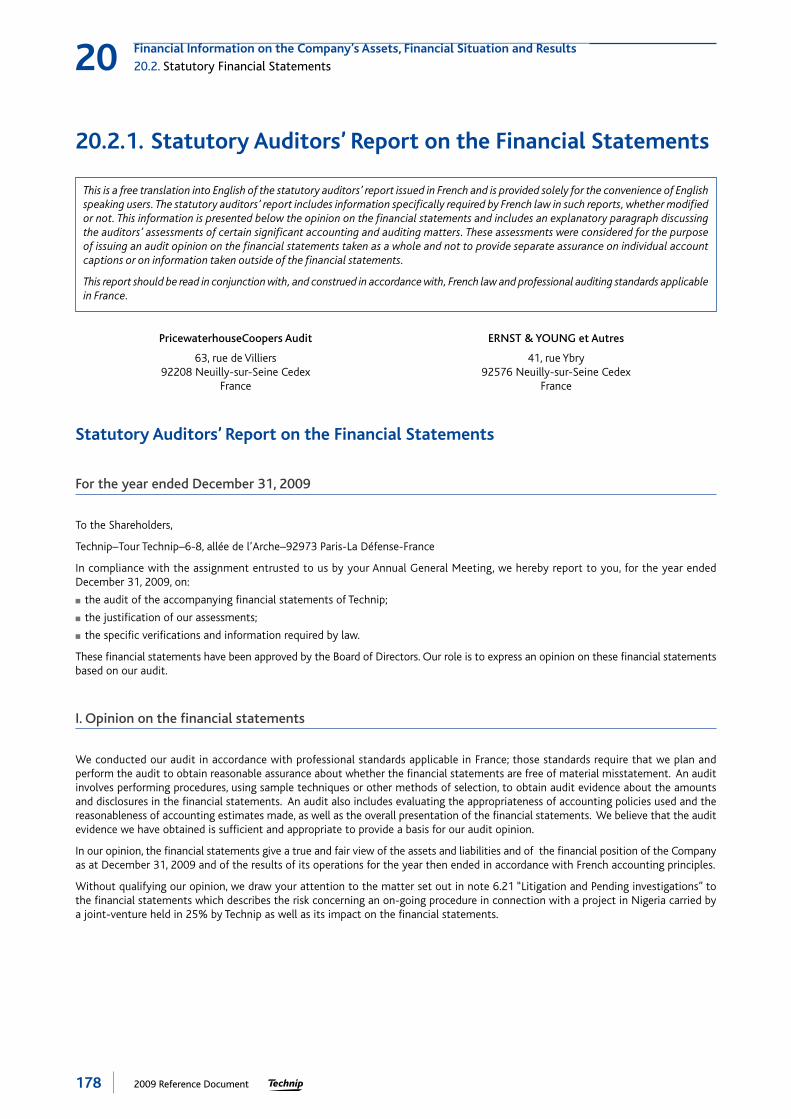
178 2009 Reference Document
Financial Information on the Company’s Assets, Financial Situation and Results
20.2. Statutory Financial Statements20
20.2.1. Statutory Auditors’ Report on the Financial Statements
This is a free translation into English of the statutory auditors’ report issued in French and is provided solely for the convenience of English speaking users. The statutory auditors’ report includes information specifi cally required by French law in such reports, whether modifi ed or not. This information is presented below the opinion on the fi nancial statements and includes an explanatory paragraph discussing the auditors’ assessments of certain signifi cant accounting and auditing matters. These assessments were considered for the purpose of issuing an audit opinion on the fi nancial statements taken as a whole and not to provide separate assurance on individual account captions or on information taken outside of the fi nancial statements.
This report should be read in conjunction with, and construed in accordance with, French law and professional auditing standards applicable in France.
PricewaterhouseCoopers Audit ERNST & YOUNG et Autres
63, rue de Villiers92208 Neuilly-sur-Seine Cedex
France
41, rue Ybry92576 Neuilly-sur-Seine Cedex
France
Statutory Auditors’ Report on the Financial Statements
For the year ended December 31, 2009
To the Shareholders,
Technip–Tour Technip–6-8, allée de l’Arche–92973 Paris-La Défense-France
In compliance with the assignment entrusted to us by your Annual General Meeting, we hereby report to you, for the year ended December 31, 2009, on:
the audit of the accompanying fi nancial statements of Technip; ■
the justifi cation of our assessments; ■
the specifi c verifi cations and information required by law. ■
These fi nancial statements have been approved by the Board of Directors. Our role is to express an opinion on these fi nancial statements based on our audit.
I. Opinion on the fi nancial statements
We conducted our audit in accordance with professional standards applicable in France; those standards require that we plan and perform the audit to obtain reasonable assurance about whether the fi nancial statements are free of material misstatement. An audit involves performing procedures, using sample techniques or other methods of selection, to obtain audit evidence about the amounts and disclosures in the fi nancial statements. An audit also includes evaluating the appropriateness of accounting policies used and the reasonableness of accounting estimates made, as well as the overall presentation of the fi nancial statements. We believe that the audit evidence we have obtained is suffi cient and appropriate to provide a basis for our audit opinion.
In our opinion, the fi nancial statements give a true and fair view of the assets and liabilities and of the fi nancial position of the Company as at December 31, 2009 and of the results of its operations for the year then ended in accordance with French accounting principles.
Without qualifying our opinion, we draw your attention to the matter set out in note 6.21 “Litigation and Pending investigations” to the fi nancial statements which describes the risk concerning an on-going procedure in connection with a project in Nigeria carried by a joint-venture held in 25% by Technip as well as its impact on the fi nancial statements.

1792009 Reference Document
Financial Information on the Company’s Assets, Financial Situation and Results
20.2. Statutory Financial Statements 20
II. Justifi cation of our assessments
In accordance with the requirements of article L.823-9 of the French Commercial Code (code de commerce) relating to the justifi cation of our assessments, we bring to your attention the following matters :
As indicated in the note to the fi nancial statements entitled “Provisions on affi liates”, investments in subsidiaries were valued taking ■
into account the share of adjusted equity they represent as well as the future profi tability outlook. Within the scope of our assessment of the signifi cant estimates used to draw up the fi nancial statements, we reviewed the assumptions used for the forecasting of future fi nancial fl ows upon which these estimates were based and the corresponding fi gures, for the most signifi cant subsidiaries.
As indicated in the note to the fi nancial statements entitled “Treasury shares”, a provision for risks is calculated based on the treasury ■
shares allocated to stock options plans and to free shares plans spread over the maturity dates if the delivery is expected. The assess-ment of delivery is linked to turnover rate and performance conditions, for which a median assumption has been assumed. We have reviewed the relevance of communicated data and hypothesis on which estimates are based on.
We have ensured that the established procedures ensure the collection, evaluation and recording in the accounts of any litigation in ■
satisfactory conditions. We have specifi cally ensured that the litigations identifi ed by Technip while applying these procedures were accurately described within the notes to the fi nancial statements and particularly within Note 6.21.
We carried out an assessment of the reasonableness of these estimates. As forecasts are inherently uncertain, actual fi gures may sometimes vary signifi cantly.
These assessments were made as part of our audit of the fi nancial statements, taken as a whole, and therefore contributed to the opinion we formed which is expressed in the fi rst part of this report.
III. Specifi c verifi cations and information
We have also performed, in accordance with professional standards applicable in France, the specifi c verifi cations required by French law.
We have no matters to report as to the fair presentation and the consistency with the fi nancial statements of the information given in the management report of the Board of Directors, and in the documents addressed to the shareholders with respect to the fi nancial position and the fi nancial statements.
Concerning the information given in accordance with the requirements of article L.225-102-1 of the French Commercial Code (code de commerce) relating to remunerations and benefi ts received by the directors and any other commitments made in their favour, we have verifi ed its consistency with the fi nancial statements, or with the underlying information used to prepare these fi nancial statements and, where applicable, with the information obtained by your company from companies controlling your company or controlled by it. Based on this work, we attest the accuracy and fair presentation of this information.
In accordance with French law, we have verifi ed that the required information concerning the purchase of investments, reciprocal shareholding and the identity of shareholders and holders of the voting rights has been properly disclosed in the management report.
Neuilly-sur-Seine, March 17, 2010
The Statutory Auditors
PricewaterhouseCoopers Audit ERNST & YOUNG et Autres
Louis-Pierre Schneider Nour-Eddine Zanouda

180 2009 Reference Document
Financial Information on the Company’s Assets, Financial Situation and Results
20.2. Statutory Financial Statements20
20.2.2. Statutory Financial Statements
1. Balance SheetAssets
As of December 31,
In millions of Euro Notes 2009 2008
Intangible Assets 0.1 0.3Intangible Assets under Construction - -Total Intangible Assets 0.1 0.3Other Tangible Assets 2.2 3.6Advances Paid to Suppliers - -Total Tangible Assets 2.2 3.6Investments 3,441.4 3,348.6Loans Related to Investments 62.4 50.8Other Financial Assets 127.3 59.0Total Financial Assets 3,631.1 3,458.4Total Fixed Assets (I) 6.1 3,633.4 3,462.3Advances Paid to Suppliers - 0.1Trade Receivables 6.2 163.9 53.1Other Current Receivables 6.2 38.5 49.8Receivables from Group Companies 6.2 3.5 9.6Marketable Securities 6.3 16.5 6.4Cash at Bank and in Hand 2.1 1.7Total Current Assets, Cash and Cash Equivalents (II) 224.5 120.7Accrued Assets (III) 6.4 2.8 4.1Redemption Premiums on Bonds (IV) 6.4 0.4 0.7Unrealized Exchange Losses (V) 3.8 2.5Total Assets (I to V) 3,864.9 3,590.3
Equity and LiabilitiesAs of December 31,
In millions of Euro Notes 2009 2008
Issued Capital 83.4 83.4Share Capital Premiums 1,817.6 1,817.0Reserves:
Legal Reserves ■ 9.8 9.8Regulated Reserves ■ 40.8 40.8Other Reserves ■ 119.0 119.0
Retained Earnings 123.4 -Net Income 45.5 250.9Interim Dividends - -Net equity 6.5 2,239.5 2,320.9Regulated Provisions 6.6 - -Total Shareholder’s Equity (I) 2,239.5 2,320.9Provisions for Risks 349.6 33.3Provisions for Charges - -Total Provisions for Risks and Charges (II) 6.6 349.6 33.3Bonds 650.0 650.0Bank Borrowings and Credit Lines 40.4 18.5Other Financial Debts and Liabilities - -Financial Debts towards Group Companies 472.0 500.1Advances Received from Clients - -Accounts Payables and Related Accounts 40.8 36.2Tax and Social Security Liabilities 70.1 12.2Payable on Assets - 2.6Other Liabilities 0.7 16.3Total Liabilities (III) 6.8 1,274.0 1,235.9Unrealized Exchange Gains (IV) 1.8 0.2Total Equity and Liabilities (I to IV) 3,864.9 3,590.3

1812009 Reference Document
Financial Information on the Company’s Assets, Financial Situation and Results
20.2. Statutory Financial Statements 20
2. Income Statement
12 Months
In millions of Euro Notes 2009 2008
Sales of Goods/Rendering of Services 144.9 138.7
Revenues 6.10 144.9 138.7
Capitalized Expenses - 6.9
Reversals of Operating Provisions and Charges Transferred 6.1 7.4
Other Operating Income 0.3 0.1
Total Operating Income 151.3 153.1
General and Administrative Costs (158.4) (144.5)
Taxes (1.9) (2.0)
Wages and Salaries, Social Security Costs (13.0) (8.5)
Allowances for Provisions and Amortization
on Fixed Assets ■ 6.1 (1.6) (1.8)
on Other Current Assets ■ - (0.3)
for Risks and Charges ■ - (4.9)
Other Operating Expenses (0.7) (0.4)
Total Operating Expenses (175.6) (162.4)
Income from Operating Activities (I) (24.3) (9.3)
Dividends and Interim Dividends 235.2 394.8
Other Financial Income related to Financial Assets and Marketable Securities 1.4 3.5
Financial Interests 97.9 -
Reversals of Provisions and Charges Transferred 122.8 36.8
Exchange Gains Realized 4.5 19.5
Net Gain on Disposal of Marketable Securities - -
Total Financial Income 461.8 454.6
Allowance for Provisions and Amortization (75.9) (108.7)
Interest Charges (51.2) (100.4)
Exchange Loss Realized (5.2) (23.2)
Net Loss on Disposal of Marketable Securities - -
Total Financial Expenses (132.3) (232.3)
Financial Result (II) 6.11 329.5 222.3
Current Income before Tax (I-II) 305.2 213.0
Extraordinary Income from Operating Activities 0.5 2.3
Extraordinary Income from Financing Activities 3.0 0.6
Reversals of Provisions and Charges Transferred 86.2 0.8
Total Extraordinary Incomes 89.7 3.7
Extraordinary Expenses from Operating Activities (0.1) (4.1)
Extraordinary Expenses from Financing Activities (87.0) (17.8)
Allowance for Extraordinary Provisions (245.0) (8.2)
Total Extraordinary Expenses (332.1) (30.1)
Extraordinary Result (III) 6.12 (242.4) (26.4)
Profi t Sharing (IV) - -
Income Tax (V) 6.13 (17.3) 64.3
Income 702.8 611.4
Expenses (657.3) (360.5)
Net Income (I to V) 45.5 250.9

182 2009 Reference Document
Financial Information on the Company’s Assets, Financial Situation and Results
20.2. Statutory Financial Statements20
3. Cash Flow Statement
In millions of Euro 2009 2008
Net Income 45.5 250.9
Amortization and Depreciation of Fixed Assets and Prepaid Expenses(1) 1.6 10.7
Increase (Decrease) in Provisions(2) 130.8 74.0
Net (Gains) Losses on Disposal of Assets and Investments(3) 84.7 17.2
Cash Flow from Operations 262.6 352.8
Changes in Working Capital (41.9) 29.2
Net Cash Generated from Operating Activities 220.7 382.0
(Purchases) Disposals of Intangible Assets - (7.0)
(Purchases) Disposals of Tangible Assets - -
(Purchases) Disposals of Financial Assets(4) (70.0) (104.9)
Net Cash Used in Investing Activities (70.0) (111.9)
(Increase) Decrease in Long-Term Receivables (subsidiaries loans) (11.6) 10.2
Changes in Treasury Shares - (0.1)
Increase (Decrease) in Current Account Cash Pooling (33.7) (226.3)
Increase (Decrease) in Short-Term Debts (Credit Facilities) - 0.2
Increase (Decrease) in Long-Term Debts (Bond) 20.8 -
Capital Increase and Issuance Premium(5) 0.6 71.3
Capital Decrease and Issuance Premium - -
Dividends Paid(6) (127.5) (125.1)
Net Cash Generated from Financing Activities (151.4) (269.8)
Net Increase (Decrease) in Cash and Cash Equivalents (0.7) 0.3
Cash and Cash Equivalents as of January 1 1.5 1.2
Cash and Cash Equivalents as of December 31 0.8 1.5
Cash and Cash Equivalents 2.1 1.7
Bank Overdrafts (1.3) (0.2)
Total 0.8 1.5
(1) In 2008, including the extraordinary amortization related to cancellation of software projects (€8.2 million).(2) In 2008, including the provision for risks regarding free share plans (€26.2 million), provision on treasury shares (€78.3 million), reversal of provisions on current accounts
further to winding up of US subsidiary (€13.1 million), reversal of provisions on investments (€19.4 million).In 2009, including the provision for risks regarding free share plans (€74.0 million), provision on litigation (€245.0 million), reversal of provision on treasury shares (€78.3 million), reversal of provisions on investments (€106.8 million).
(3) In 2008, write-off of software projects (€17.0 million). In 2009, including the winding up of a subsidiary covered by a provision on investments (€86.2 million).
(4) In 2008, including increase and acquisition of shares of French subsidiaries. In 2009, including cash injection of a Belgium subsidiary.
(5) In 2008, capital increase dedicated to employees for €60.0 million and stock option exercised for €11.3 million.(6) In 2008, 2007 dividend for €125.1 million. In 2009, 2008 dividend for €127.5 million.
4. Notes on Accounting Principles
The accounting principles used by Technip in preparing the fi nan-cial statements are in compliance with the generally accepted accounting principles in France.
The statutory fi nancial statements of Technip as of December 31, 2009, were approved by the Board of Directors on February 16, 2010.
Foreign Currency Transactions
Transactions in foreign currencies related to fi nancial revenues or expenses are recorded in accordance with current accounting policies.
At year-end, receivables and liabilities are translated at the exchange rates prevailing at the closing date and any differences are recorded as unrealized exchange gains or losses.
If a potential loss is identifi ed when converting receivables and payables at the closing exchange rate, a provision for exchange risk is booked for the same amount.
Treasury accounts and current accounts of the cash pooling entity of the Group are translated at the exchange rates prevailing at the closing date, and any differences are recorded as fi nancial gains or expenses.

1832009 Reference Document
Financial Information on the Company’s Assets, Financial Situation and Results
20.2. Statutory Financial Statements 20
Provisions on Affi liates
Provisions on investments and related receivables are recognized whenever the gross carrying value of the investment is higher than the share held in the shareholders’ equity, which has been adjusted in order to take into account certain commitments entered into by the parent company and the prospects for development of the subsidiary.
For the main subsidiaries, these prospects are assessed on the basis of forecast future cash fl ows, based on the most likely scenarios adopted by the management.
All provisions booked to cover affi liate risks are fully recorded under fi nancial expenses whether they cover write-downs of investments in affi liated companies, related receivables, or the booking of additional provisions for risks.
Subsidies and waivers of debts granted to subsidiaries are accounted in the fi nancial result.
Treasury Shares
1. The Company has applied the recommendations of the French accounting standards body, the Comité de Réglementation Comptable (CRC), dated December 2008 regarding accounting principles to be used for stock options plans and free shares plans granted to employees.
The treasury shares allocated to Company employees are classifi ed under marketable securities. A provision for risks is calculated based on the treasury shares allocated to stock options plans and to free share plans spread over the maturity dates if the delivery is expected. The assessment of delivery is linked to performance conditions (for which a median hypothesis has been assumed) and turnover rate. Regarding the stock options plans, the assessment of delivery is also linked to a fair value at the closing date (if the exercise price of the stock option is less than the market value of Technip share). When the delivery is not expected, a provision on marketable securities is recognized for the difference between the market value (based upon the average of share price for the last month of the year) and the gross carrying amount of the treasury shares.
2. The other treasury shares, especially those allocated to stock options plans and free share plans granted to subsidiaries’ employees, are classifi ed under other fi nancial assets. At year-end, if the market value of Technip’s share (computed on the basis of the average price for the last month of the year) is less than the gross carrying amount of treasury shares, a provision for depreciation is recognized for the difference. Moreover, for free shares granted to subsidiaries’ employees, a provision for risks is booked, based upon the net book value of the treasury shares, taking into account the performance conditions and turnover rate.
Due to the Stock Incentive Plan Recharge Master Agreement (see Note 5) put in force with subsidiaries, the Company books fi nancial revenues equal to the provision for risks.
3. Treasury shares held by the Company are recorded at the acquisition cost, and gain/(loss) on sales of treasury shares are booked according to the FIFO method (First In, First Out).
Intangible Assets and Property, Plants and Equipment
Intangible assets include software, which is amortized over a period of 3 to 5 years, and software development costs, when they fulfi ll the eligibility criteria provided by the French Accounting Standards.
Fixed assets are carried at their acquisition cost, their production cost, or at their fair value in case of business combinations.
Tangible assets mainly relate to Adria Tower equipment and furni-ture. Amortization lifetimes, principally straight line, represent the useful lives estimated to be likely by the Company:
Offi ce fi xtures and furniture 8 to 10 years ■
IT equipment 3 years ■
Trade Receivables
Trade receivables are valued at their nominal value. A provision for doubtful accounts is recorded when receivables are highly likely to be uncollectible.
5. Main Events of the Year
Technip’s activities consist in holding interests in affi liates, and receiving dividends, and centralizing and reinvoicing both manage-ment fees and other organizational costs, such as insurance and fi nancing costs on guarantees.
In March 2009, Technip bought additional shares of Technip ■
Tianchen for €2.8 million. The percentage of company owner-ship is now 100%.
In May 2009, Technip paid a dividend of ■ €127.5 million, or €1.20 per share.
In October 2009, the subsidiary SCI CB3 was liquidated. ■
Considering the reversal of provisions previously booked, there is no impact on the Company profi t and loss statement.
In December 2009, Technip recapitalized Technip Capital for ■
€70.0 million. The percentage of company ownership remains unchanged (100%).
In December 2009, Technip granted a subsidy of ■ €13.1 million to Technip Marine (M) SDN BHD, located in Malaysia, pursuant to a decision of the Technip Board on December 9, 2008.
The number of treasury shares is 3,065,910 as of December 31, ■
2009. 382,500 of these shares are allocated to executive stock options plans and free share plans granted to the Company employees; 2,683,410 shares are allocated to free share plans granted to subsidiaries employees.
In 2009, the Company implemented the Stock Incentive Plan ■
Recharge Master Agreement with all relevant Group subsidiaries for free shares granted to their employees.
Technip has booked a ■ €245.0 million provision for TSKJ litigation (see Note 6.21).

184 2009 Reference Document
Financial Information on the Company’s Assets, Financial Situation and Results
20.2. Statutory Financial Statements20
6. Notes to the Financial Statements
6.1. Fixed Assets
(a) Charges over the past year
In millions of Euro Intangible Assets Tangible Assets Financial Assets Fixed Assets
Gross value
As of January 1, 2008 23.7 12.8 3,560.4 3,596.9
Acquisitions(1) 7.0 - 174.7 181.7
Disposals(2) (18.8) - (90.4) (109.2)
As of December 31, 2008 11.9 12.8 3,644.7 3,669.4
Acquisitions(3) - - 120.9 120.9
Disposals(4) - - (129.6) (129.6)
As of December 31, 2009 11.9 12.8 3,636.0 3,660.7
Amortization and Depreciation
As of January 1, 2008 (4.7) (7.8) (128.1) (140.6)
Allowance(5) (8.7) (1.4) (77.6) (87.7)
Reversal(6) 1.8 - 19.4 21.2
As of December 31, 2008 (11.6) (9.2) (186.3) (207.1)
Allowance (0.2) (1.4) - (1.6)
Reversal(7) - - 181.4 181.4
As of December 31, 2009 (11.8) (10.6) (4.9) (27.3)
Net book value as of December 31, 2009 0.1 2.2 3,631.1 3,633.4
(1) Increase of intangible assets due to software projects; increase in fi nancial assets due to acquisitions and capital increases of subsidiaries (€105.5 million), increases in loans granted to subsidiaries (€68.4 million) and increases in the number of treasury shares (€ 0.8 million).
(2) Decrease in intangible assets due to software projects written off; decrease in fi nancial assets due to disposals of shares in subsidiaries (€0.2 million), repayments of loans by affi liates (€78.6 million), decrease in treasury shares (€1.4 million) and reclassifi cation of treasury shares to marketable securities (€10.1 million).
(3) Increase in fi nancial assets due to acquisitions and capital increases of subsidiaries (€73.0 million), and to increases in loans granted to subsidiaries (€47.9 million).(4) Decrease in fi nancial assets due to disposals of shares in subsidiaries (€87.0 million), repayments of loans by affi liates (€36.2 million) and reclassifi cation of treasury shares
to marketable securities (€6.4 million).(5) Allowance of extraordinary amortization on software projects (€8.2 million); allowance for provision on treasury shares (€74.6 million).(6) Reversal of provisions on investments (€19.4 million).(7) Reversal of provisions on investments (€106.8 million) and reversal of provisions on treasury shares (€74.6 million).
(b) Financial Assets
Financial assets break down as follows:
As of December 31,
In millions of Euro Gross value 2009 Provisions 2009 Net value 2009 Net value 2008
Investments 3,445.2 (3.8) 3,441.4 3,348.6
Loans Related to Investments 63.5 (1.1) 62.4 50.8
Treasury Shares 127.3 - 127.3 59.0
Total Financial Assets 3,636.0 (4.9) 3,631.1 3,458.4
The detail of investments is given in Note 7.
Investments are recorded at their acquisition cost excluding directly attributable transaction costs.
Loans related to investments mainly consist in loans granted to subsidiaries held both directly and indirectly.
During the year, Technip sold 234 treasury shares. In addition, 146,400 treasury shares were reclassifi ed as marketable securi-ties. As of December 31, 2009, the balance of treasury shares (2,683,410) included shares bought from 2006 to 2008 and allocated to free share plans granted to subsidiaries employees.

1852009 Reference Document
Financial Information on the Company’s Assets, Financial Situation and Results
20.2. Statutory Financial Statements 20
6.2. Current Assets
Current assets break down as follows:
As of December 31,
In millions of Euro Gross value 2009 Provisions 2009 Net value 2009 Net value 2008
Trade Receivables 164.0 (0.1) 163.9 53.1
Other Receivables, Income Tax and VAT 26.6 - 26.6 45.7
Other Current Receivables 12.0 (0.1) 11.9 4.1
Total Other Current Receivables 38.6 (0.1) 38.5 49.8
Current Accounts with subsidiaries 6.5 (3.0) 3.5 9.6
The increase in trade receivables between 2008 and 2009 is mostly due to the invoicing of the Stock Incentive Plan to the subsidiaries (see Note 5).
6.3. Marketable Securities
6.4. Accrued Assets and Redemption Premium
Accrued Assets (€2.4 million as of December 31, 2009)
They mostly include insurance costs.
Deferred Charges (€0.4 million as of December 31, 2009)
They include issuing fees (for a gross amount of €2.2 million) related to a €650 million corporate bond issued in May 2004, to be amortized over seven years. Annual amortization amounted to €0.3 million in 2009, and the net value is €0.4 million as of December 31, 2009.
Redemption Premium (€0.4 million as of December 31, 2009)
This relates to the €650 million bond and is amortized on a straight line basis over seven years.
6.5. Shareholders’ Equity
(a) Changes in Shareholders’ Equity
Changes in shareholders’ equity are as follows:
In millions of Euro 2009 2008
As of January 1 2,320.9 2,123.9
Stock Options Exercised 0.6 11.3
Capital Increase Reserved for Employees - 60.0
Net Income 45.5 250.9
Dividends (127.5) (125.1)
As of December 31 2,239.5 2,320.9
Marketable securities correspond to treasury shares allocated to executive stock options plans and free share plans granted to Company employees. Their variations break down as follows:
In millions of Euro 2009 2008
Gross value
As of January 1 10.1 -
Transfer from Financial Assets 6.4 10.1
Disposals - -
As of December 31 16.5 10.1
Depreciation
As of January 1 (3.7) -
Allowance - (3.7)
Reversal 3.7 -
As of December 31 - (3.7)
Net book value as of December 31 16.5 6.4
As of December 31, 2009, the balance of treasury shares (382,500) was bought in 2006.

186 2009 Reference Document
Financial Information on the Company’s Assets, Financial Situation and Results
20.2. Statutory Financial Statements20
(b) Changes in Common Stock
Changes in common stock are as follows:
2009 2008
Number of Shares as of January 1 109,317,564 107,353,774
Increase Related to Capital Increase Reserved for Employees 0 1,446,260
Increase Related to Stock Options Exercised 25,730 517,530
Cancellation - -
Number of Shares as of December 31 109,343,294 109,317,564
Share Nominal Value in Euro 0.7625 0.7625
Common Stock as of December 31, in millions of Euro 83.4 83.4
The number of shares that carry double voting rights is 5,037,614 as of December 31, 2009.
(c) Stock Options and Free Share Plans
1. Technip Stock Options Plans
The details of Technip’s stock options plans are as follows:
Year of the Plan 2005
Part A Part B Part CRe-Granting Part A and B
Re-Granting Part A, B and C
Date of the Shareholders’ MeetingApril 29,
2005April 29,
2005April 29,
2005April 29,
2005April 29,
2005
Date of the Board of Directors Meeting that Implemented the Plan
December 14, 2005
July 26, 2006
March 12, 2007
December 12, 2007
June 12, 2008
Term 6 years 6 years 6 years 6 years 6 years
Remaining Number of Options to be Exercised 887,237 879,923 928,346 80,310 103,858
Current Exercise Price in Euros 46.9 41.4 49.2 55.7 60.0
Year of the Plan 2009
Part 1
Date of the Shareholders’ Meeting April 30, 2009
Date of the Board of Directors Meeting that Implemented the Plan June 15, 2009
Term 6 years
Remaining Number of Options to be Exercised 1,091,075
Current Exercise Price in Euros 34.7
These stock options were granted subject to certain performance targets. The fi nal number of stock options granted to employees is contingent upon Technip achieving a satisfactory performance for its shareholders. For 2005 the stock option plan, performance will be based on the Company’s earnings per share relative to the average earnings per share of a panel of competitors. For the 2009 stock option plan, performance will be based on the Group’s consolidated result relative to the average consolidated result of a panel of competitors.
2. Cofl exip Stock Options Plans
Details of the Cofl exip stock options plans are as follows:
Plan Numbers 11
Date of the Shareholders’ Meeting May 30, 2000
Date of the Board of Directors Meeting that Implemented the Plan March 20, 2001
Term 10 years
Remaining Number of Options to be Exercised 142,439
Current Exercise Price in Euros 33.4

1872009 Reference Document
Financial Information on the Company’s Assets, Financial Situation and Results
20.2. Statutory Financial Statements 20
3. Technip Stock Options Purchase Plans
The details of Technip’s stock options purchase plans are as follows:
Year of the Plan 2008
Date of the Shareholders’ Meeting May 6, 2008
Date of the Board of Directors Meeting that Implemented the Plan July 1, 2008
Term 6 years
Remaining Number of Options to be Exercised 937,060
Current Exercise Price in Euro 58.2
These stock options were granted subject to certain performance targets. For the 2008 stock option plan, performance will be based on Group’s consolidated result relative to the average consolidated result of a panel of competitors.
4. Free Share Plans
Free shares plans have been implemented since 2007. Details are as follows:
Year of the Plan 2007
Part 1 Part 2 Re-Granting Re-Granting
Date of the Shareholders’ Meeting April 28, 2006 April 28, 2006 April 28, 2006 April 28, 2006
Date of the Board of Directors Meeting that Implemented the Plan
March 12, 2007
March 12, 2007
December 12, 2007
July 1,2008
Term 5 years 4 years 4 or 5 years 4 or 5 years
Remaining Number of Shares to be Exercised 377,900 625,204 41,900 20,300
Year of the Plan 2008
Part 1List 1
Part 1List 2
Part 2List 1
Part 2List 2
Part 3List 1
Part 3List 2
Date of the Shareholders’ Meeting May 6, 2008 May 6, 2008 May 6, 2008 May 6, 2008 May 6, 2008 May 6, 2008
Date of the Board of Directors Meeting that Implemented the Plan
July 1,2008
July 1,2008
December 9, 2008
December 9, 2008
Febuary 18, 2009
Febuary 18, 2009
Term 5 years 4 years 5 years 4 years 5 years 4 years
Remaining Number of Shares to be Exercised 366,300 468,990 18,300 1,800 84,642 105,800
Year of the Plan 2009
Part 1List 1
Part 1List 2
Part 2List 1
Date of the Shareholders’ Meeting April 30, 2009 April 30, 2009 April 30, 2009
Date of the Board of Directors Meeting that Implemented the Plan June 15, 2009 June 15, 2009 October 24, 2009
Term 5 years 4 years 5 years
Remaining Number of Shares to be Exercised 429,575 549,500 12,000
These free shares were granted subject to performance conditions. For the 2007 free share plan, performance will be measured based on the Company’s earnings per share relative to the average earnings per share of a panel of competitors. For the 2008 and 2009 free share plans, performance will be based on the Group’s consolidated result relative to the average consolidated result of a panel of competitors.
(d) Distributable Retained Earnings
As of December 31, 2009, the distributable retained earnings of Technip amount to €287.9 million after estimated due taxes.

188 2009 Reference Document
Financial Information on the Company’s Assets, Financial Situation and Results
20.2. Statutory Financial Statements20
6.6. Provisions
(a) Nature of Provisions for Risks and Charges
(b) Changes in Provisions
Changes in provisions are as follows:
December 31
In millions of Euro 2008 Allowance
Used Provisions Reversals
Unused Provisions Reversals 2009
Regulated Provisions - - - - -
Provisions for Risks 33.3 320.3 4.0 - 349.6
Provisions for Charges - - - - -
Total Provisions in Liabilities 33.3 320.3 4.0 - 349.6
Provisions on Investments 110.6 - 86.2 20.6 3.8
Provisions on Loans 1.1 - - - 1.1
Provisions on Treasury Shares 78.3 - - 78.3 -
Provisions on Current Assets 0.3 - 0.2 - 0.1
Provisions on other Current Assets 0.1 - - - 0.1
Provisions on Current Accounts 3.1 - - 0.1 3.0
Total Provisions on Assets 193.5 - 86.4 99.0 8.1
Total Provisions 226.8 320.3 90.4 99.0 357.7
(c) Breakdown of Provision Changes
Allowances and reversals of provisions break down as follows:
In millions of Euro 2009 2008
Operating Allowance - 5.2
Financial Allowance 75.3 107.6
Extraordinary Allowance 245.0 -
Total Allowance 320.3 112.8
Operating Reversal 4.2 1.5
Financial Reversal 99.0 36.7
Extraordinary Reversal 86.2 0.7
Total Reversal 189.4 38.9
Operating Charges Transferred 1.9 5.9
Financial Charges Transferred 23.8 -
Total Reversal of Provisions and Charges Transferred 215.1 44.8
6.7. Accrued Charges and Accrued Income Included in Assets and Liabilities
Accrued income included in assets amounts to €162.3 million as of December 31, 2009, against €31.3 million as of December 31, 2008.
Accrued charges included in liabilities amount to €71.3 million as of December 31, 2009, and €13.9 million as of December 31, 2008.
As of December 31, 2009, provisions for risks mostly include €3.8 million of provisions for foreign exchange losses, €100.2 million of provisions for risks on treasury shares allocated to stock options plans and free share plans granted to Company
employees (booked as marketable securities) and granted to subsidiaries’ employees (booked as financial assets), and a €245.0 million provision for TSKJ litigation (Note 6.21).

1892009 Reference Document
Financial Information on the Company’s Assets, Financial Situation and Results
20.2. Statutory Financial Statements 20
6.8. Maturity of Assets and Liabilities
The maturity of assets (net of provisions) and liabilities breaks down as follows:
As of December 31, 2009
In millions of Euro Total Less than 1 Year More than 1 Year
Financial Assets(1) 62.3 3.2 59.1
Trade Receivables 163.9 135.0 28.9
Receivables from Group Companies 3.5 3.5 -
Other Current Receivables 38.5 38.5 -
Accrued Assets 2.8 2.7 0.1
Total Assets 271.0 182.9 88.1
(1) Without investments and treasury shares.
As of December 31, 2009
In millions of Euro Total Less than 1 YearBetween 1 Year
and 5 YearsMore than
5 Years
Bond(1) 650.0 - 650.0 -
Bank Borrowings/Credit Lines 40.4 19.6 20.8 -
Other Financial Debts and Liabilities - - - -
Financial Debts and Liabilities with Group Companies(2) 472.0 6.1 465.9 -
Accounts Payables 40.8 40.8 - -
Tax and Social Security Liabilities 70.1 70.1 - -
Payable on Assets - - - -
Other Liabilities 0.7 0.7 - -
Total Liabilities 1,274.0 137.3 1,136.7 -
(1) On May 26, 2004, Technip issued a corporate bond for an amount of €650.0 million.The main characteristics of this bond (listed on the Luxembourg Stock Exchange on May 26, 2004), are as follows:– issue price of €997.07 per bond (650,000 bonds issued);– the coupon payable on May 26 of each year amounts to 4.625% per year of the bond’s nominal value;– redemption date: May 26, 2011;– gross rate of yield at the issuance date for the bondholder: 4.675% per annum.
(2) Including current account with the Group cash pooling entity: €465.9 million.
The invoices due dates break down as follows:
As of December 31, 2009
In millions of Euro Total Not Due Due 0-60 days Due > 60 days
French Suppliers 31.4 0.8 30.6 -
Foreign Suppliers 3.0 1.1 1.9 -
Accruals 6.4 n/a n/a n/a
Total 40.8 1.9 32.5 -
6.9. Trade Bills Included in Assets and Liabilities
Technip does not have any outstanding trade bills as of December 31, 2009 and 2008.
6.10. Revenues
Revenues amounted to €144.9 million in 2009, versus €138.7 million in 2008. In 2009, €69.2 million of this was generated in France.
Revenues mostly consist in reinvoicing management fees and insurance costs to other Goup entities.
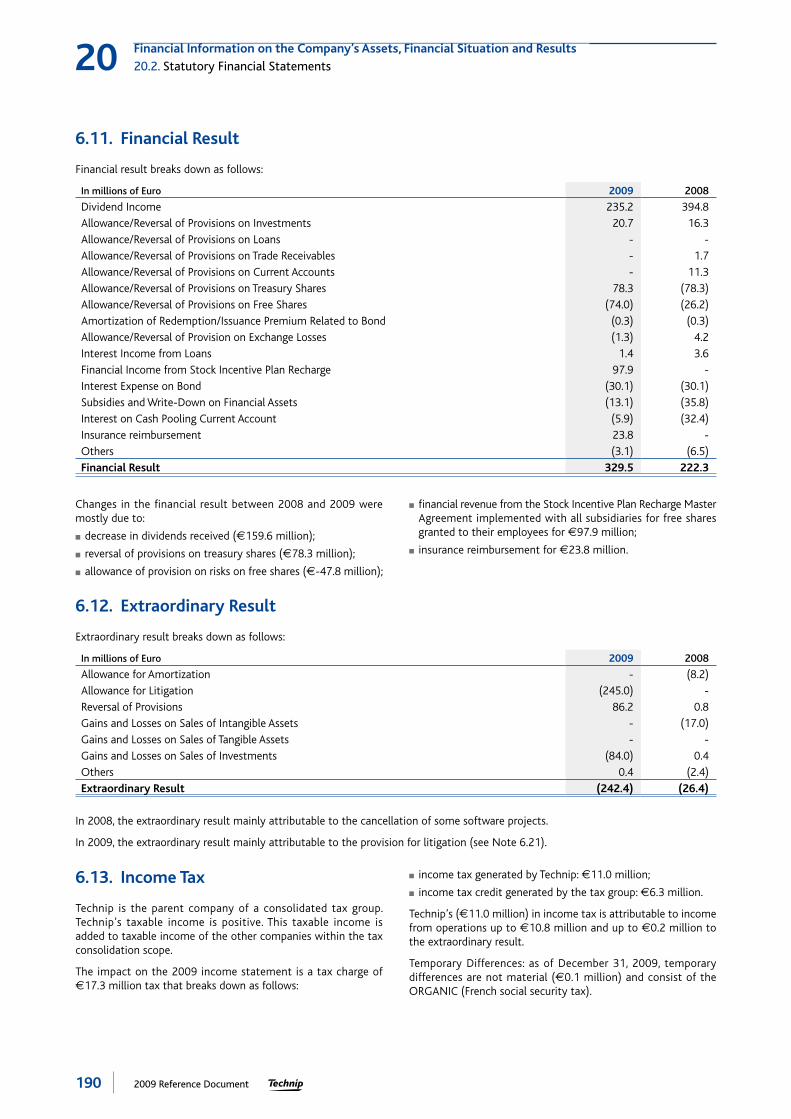
190 2009 Reference Document
Financial Information on the Company’s Assets, Financial Situation and Results
20.2. Statutory Financial Statements20
6.11. Financial Result
Financial result breaks down as follows:
In millions of Euro 2009 2008
Dividend Income 235.2 394.8
Allowance/Reversal of Provisions on Investments 20.7 16.3
Allowance/Reversal of Provisions on Loans - -
Allowance/Reversal of Provisions on Trade Receivables - 1.7
Allowance/Reversal of Provisions on Current Accounts - 11.3
Allowance/Reversal of Provisions on Treasury Shares 78.3 (78.3)
Allowance/Reversal of Provisions on Free Shares (74.0) (26.2)
Amortization of Redemption/Issuance Premium Related to Bond (0.3) (0.3)
Allowance/Reversal of Provision on Exchange Losses (1.3) 4.2
Interest Income from Loans 1.4 3.6
Financial Income from Stock Incentive Plan Recharge 97.9 -
Interest Expense on Bond (30.1) (30.1)
Subsidies and Write-Down on Financial Assets (13.1) (35.8)
Interest on Cash Pooling Current Account (5.9) (32.4)
Insurance reimbursement 23.8 -
Others (3.1) (6.5)
Financial Result 329.5 222.3
6.13. Income Tax
Technip is the parent company of a consolidated tax group. Technip’s taxable income is positive. This taxable income is added to taxable income of the other companies within the tax consolidation scope.
The impact on the 2009 income statement is a tax charge of €17.3 million tax that breaks down as follows:
income tax generated by Technip: ■ €11.0 million;
income tax credit generated by the tax group: ■ €6.3 million.
Technip’s (€11.0 million) in income tax is attributable to income from operations up to €10.8 million and up to €0.2 million to the extraordinary result.
Temporary Differences: as of December 31, 2009, temporary differences are not material (€0.1 million) and consist of the ORGANIC (French social security tax).
Changes in the fi nancial result between 2008 and 2009 were mostly due to:
decrease in dividends received ( ■ €159.6 million);
reversal of provisions on treasury shares ( ■ €78.3 million);
allowance of provision on risks on free shares ( ■ €-47.8 million);
fi nancial revenue from the Stock Incentive Plan Recharge Master ■
Agreement implemented with all subsidiaries for free shares granted to their employees for €97.9 million;
insurance reimbursement for ■ €23.8 million.
6.12. Extraordinary Result
Extraordinary result breaks down as follows:
In millions of Euro 2009 2008
Allowance for Amortization - (8.2)
Allowance for Litigation (245.0) -
Reversal of Provisions 86.2 0.8
Gains and Losses on Sales of Intangible Assets - (17.0)
Gains and Losses on Sales of Tangible Assets - -
Gains and Losses on Sales of Investments (84.0) 0.4
Others 0.4 (2.4)
Extraordinary Result (242.4) (26.4)
In 2008, the extraordinary result mainly attributable to the cancellation of some software projects.
In 2009, the extraordinary result mainly attributable to the provision for litigation (see Note 6.21).

1912009 Reference Document
Financial Information on the Company’s Assets, Financial Situation and Results
20.2. Statutory Financial Statements 20
6.14. Related Parties Disclosure
The following amounts represent Technip’s accumulated shares in the assets, liabilities, and fi nancial income and expense of companies in which Technip directly or indirectly holds more than half of the share capital.
As of December 31,
In millions of Euro 2009 2008
Financial Assets 3,506.0 3,506.9
Current Assets, Receivables from Group Companies 177.9 64.7
Total Assets 3,683.9 3,571.6
Financial Debts (Group and Affi liates) 472.0 500.1
Current Liabilities 30.2 29.5
Total Liabilities 502.2 529.6
Financial Charges 19.0 46.4
Financial Income 233.0 385.3
6.15. Off-Balance Sheet Commitments
Off-balance sheet commitments break down as follows:
As of December 31,
In millions of Euro 2009 2008
Parent Company Guarantees(1) 29,140.7 27,009.5
Commitments Given(2) 1,040.4 805.8
Commitments Received None None
Trade Bills Discounted before Maturity None None
(1) Parent company guarantees given by Technip to clients cover the proper performance of the specifi ed contracts for which the average period until the release of the commitment guarantees is around 5 years. Parent company guarantee regarding joint ventures include the entire amount of the contract and are not reduced according to the projects’ percentage of completion.
(2) These commitments are given on behalf of Group companies and mainly relate to:- guarantees given to third parties;- guarantees or counter-guarantees given to banks;- guarantees given to various customers or partners for the realization of contracts.
Moreover, Technip has the following commitments:
In 2007, Technip granted a ■ €37.6 million subsidy to Technip Saudi Arabia, with a conditional clause under which Technip Saudi Arabia will reimburse Technip, if its results are positive, until the subsidy is totally reimbursed.
Adria Tower
In 2009, Technip signed a new 12-year long-term lease contract on the Adria Tower for the period from April 1, 2009, to March 31, 2021.
In millions of Euro Operating Leases
2010 26.0
2011 28.0
2012 29.0
2013 29.0
2014 and beyond 210.3
Total(1) 322.3
(1) Provisional amount, as the rent amount varies according to the INSEE Construction cost index.
Technip did not enter into any signifi cant leasing contracts in 2009 and 2008.

192 2009 Reference Document
Financial Information on the Company’s Assets, Financial Situation and Results
20.2. Statutory Financial Statements20
6.16. Financial Instruments
Technip holds no fi nancial instruments as of December 31, 2009, or as of December 31, 2008.
6.17. Assets used as Collateral
Technip has not pledged any of its assets as collateral for material liabilities.
6.18. Average Number of Employees
The average number of employees was to 8 people in 2009 and 7 people in 2008.
6.19. Board of Directors’ Compensation
The amount of director’s fees paid by Technip to the members of the Board of Directors during 2009 was €436,300.
No loan were granted to Board members during the year.
The compensation of the Company’s Chairman and Chief Executive Offi cer is determined by the Board of Directors, upon the proposal of the Nominations and Remunerations Committee.
The total amount of compensation paid in 2009 by the Company to Thierry Pilenko amounted to €1,823,931.
The variable portion of compensation is based on the fixed compensation for the previous year. For 2009 the target variable portion is equal to 100% of the annual base compensation. 50% of the target variable portion is linked to the fi nancial performance of the Group based on 2009 operating income, 25% is linked to the achievement of individual objectives and 25% to the implementa-tion of Group values and participation in the implementation of measures regarding our economic environment. The share of the variable portion linked to Group fi nancial performance is (i) nil if real performance is below 75% of the budgeted amount (performance fl oor), (ii) between 50% and 100% for a performance equal to 75% to 100% of the budgeted amount and (iii) between 100% and 200% for a performance equal to 100% to 115% of the budgeted amount (outperformance). If achieved fi nancial results are superior to the budgeted objective, a multiplier rate is calculated, up to a maximum of 2. The multiplier is calculated based on the fi nancial portion of the objectives, representing 50% of the variable portion criteria. It is then applied to the other variable portion criteria in order to calculate the fi nal variable portion, which is capped at 200% of the target variable portion. The variable portion to be paid to Thierry Pilenko in 2010 for the 2009 fi nancial year is €1,140,300.
Thierry Pilenko does not receive any directors’ fees for the positions he holds in the Group’s companies or as a Company director.
There is no specifi c retirement plan for the Chairman and Chief Executive Offi cer. The Chairman and Chief Executive Offi cer is a benefi ciary of the supplementary retirement plan for Group execu-tives, with fi xed contributions of 8% of gross annual compensation paid up to income bracket 3, i.e., eight times the annual French Social Security limit. The contribution for 2009 amounted to €21,597.
The Chairman and Chief Executive Offi cer also benefi ts from the Company’s existing supplementary retirement plan for Executive Committee members: a retirement income guarantee of 1.8% per year of service, up to a limit of 15 years, on income bracket 4 of gross annual compensation paid, i.e., exceeding eight times the French Social Security limit. The amount of gross compensation to which this retirement income guarantee applies corresponds to the average of the gross base compensation (including variable compensation within the limit of the target variable portion of 100%), received over the fi ve complete fi nancial years prior to the date of departure from the Company. The retirement income guarantee will only be due in the following events: a departure from the Company after his 60th birthday; a departure from the Company as a result of a 2nd or 3rd category disability (as defi ned under French law); a departure from the Company after his 55th birthday provided that such departure is not the result of gross misconduct or negligence on his part and that no salaried activity is resumed between leaving the Company and receiving a pension under the general French Social Security scheme.
109,000 stock options and 32,000 performance shares were granted to Thierry Pilenko over the 2009 fi nancial year. Thierry Pilenko did not exercise any Technip share subscription or share purchase options during the 2009 fi nancial year. Thierry Pilenko is not a benefi ciary of any share subscription warrants from the Company or any other Group company.
At the time of his appointment, Thierry Pilenko signed a world-wide non-compete agreement. In order to take into account the AFEP-MEDEF recommendations of October 6, 2008, the Board of Directors, in its meeting of February 18, 2009, decided to limit the indemnity amounting to a compensation of 24 months calculated from the fi xed compensation plus the target variable portion of the last 12 months, corresponding to a non-compete provision of two years.
At the same meeting, the Board decided there will be no severance indemnity for the executive director in the event his mandate is revoked or is not renewed by the Company.

1932009 Reference Document
Financial Information on the Company’s Assets, Financial Situation and Results
20.2. Statutory Financial Statements 20
6.20. Auditors’ fees
The auditors’ fees break down as follow:
ERNST & YOUNG PricewaterhouseCoopers
In thousands of Euro 2009 2008 2009 2008
Audit Fees
Auditing, certifi cation of fi nancial statements, examination of Company and Consolidated Financial Statements
654.8 812.0 511.0 581.0
Other assignments 16.0 301.2 - 99.0
Total 670.8 1,113.2 511.0 680.0
6.21. Litigation and Pending Investigations
Technip is one of four shareholders of TSKJ, which carried out the construction of a natural gas liquefaction complex in Nigeria for Nigeria LNG Limited (“NLNG”) from 1994 onwards. The compa-nies KBR (formerly a subsidiary of the US Group Halliburton), Snamprogetti Netherlands BV (a subsidiary of the Italian Group ENI) and JGC Corporation (Japan) each hold 25% of TSKJ’s share capital.
The United States Securities and Exchange Commission (“SEC”) and the United States Department of Justice (“DOJ”) have since 2004 been conducting formal investigations into payments made in connection with the construction by TSKJ of a natural gas liquefaction complex for NLNG. A similar investigation by a French magistrate against “unidentifi ed persons” which also commenced in 2004 is still ongoing.
During the summer of 2004, the SEC requested Technip (which registered its shares with the SEC between October 2001 and November 2007) to voluntarily provide information relating to the implementation of this Project. Technip has fully cooperated on a voluntary basis with both formal and informal requests from the SEC and the DOJ since this request.
On February 11, 2009 KBR, which was at all relevant times, between 1994 and 2007, a domestic issuer under US securities laws, pleaded guilty to a fi ve count criminal information in the United States District Court involving charges related to the United States Foreign Corrupt Practices Act (“FCPA”) for conduct arising from its participation in TSKJ. In its plea agreement, KBR asserted that it had conspired to pay bribes to Nigerian Government Offi cials. As part of its plea agreement, KBR agreed to pay a criminal fi ne of US$402 million. Contemporaneously, KBR and its former parent company Halliburton also reached a settlement of a related civil complaint fi led by the SEC alleging civil violations of the FCPA. KBR and Halliburton jointly agreed to pay US$177 million in settlement of the civil complaint. The US Government has also brought criminal charges against certain individuals for conduct related to the Project.
A person or entity found in violation of the FCPA could be subject to criminal fi nes and civil penalties of up to US$500,000 per viola-tion and equitable remedies including disgorgement (if applicable) of profi ts including pre-judgment interest on such profi ts. Criminal penalties could range up to US$2 million per violation or twice the pecuniary gain or loss from the violation. The amount of any fi nes or monetary penalties depend on factual fi ndings, including among others, the amount, timing, nature and scope of any improper payment and related business transactions and the level of cooperation provided to the authorities during the investigations. Investigations of this nature and any related settlements could result in (i) third party claims against Technip which could include claims for special, indirect or consequential damages (ii) adverse consequences on Technip’s ability to obtain or continue fi nancing for current or future projects and/ or (iii) damage to Technip’s business or reputation via negative publicity adversely affecting Technip’s prospects in the commercial market place.
French law was modifi ed in September 2000 to attach, for the fi rst time, liability for the corruption of foreign public offi cials. Under that law, criminal fi nes of up to €750,000, the confi scation of the direct and indirect proceeds of the offence and various prohibitions and civil damages may be imposed on a legal entity.
Technip and its counsel have held meetings with the US authorities since July 2008 and have discussed a resolution of the investiga-tion. While these discussions have not concluded, Technip recorded an exceptional charge of €245 million in the fourth quarter 2009 accounts refl ecting the estimated costs of resolution based on the status of ongoing discussions. The potential resolution does not contemplate a criminal conviction for Technip’s role in the TSKJ joint venture and would not affect Technip’s ability to continue its operations in a normal manner. While Technip currently has no reason to believe that the US investigation will not be resolved as anticipated, there can be no assurance that fi nal agreement will be reached with the DOJ and the SEC. If fi nal agreement is not reached, Technip cannot exclude a different conclusion of the investigation which could have a material adverse impact on Technip’s fi nancial position or operations.

194 2009 Reference Document
Financial Information on the Company’s Assets, Financial Situation and Results
20.2. Statutory Financial Statements20
7. Subsidiaries and Investments
In millions of Euro Country
Percentage of
Ownership (%)
Share Capital
Reserves and
Retained Earnings
Before Allocation
Share Book ValueOutstanding
Loans and Advances
Bonds Posted and Guarantees
GivenRevenues
2009
Net Income
2009
Dividends Received
2009Gross Net
A. Detailed informations concerning investments for which gross-value exceeds 1% of Technip’s share capital
Subsidiaries with more than 50% of issued capital held by Technip
Technip France France 77.79% 22.7 27.8 43.5 43.5 - 9,803.8 1,725.4 104.5 4.6
Technip Offshore International France 100.00% 6.9 1,068.2 2,960.5 2,960.5 17.2 - - 182.9 149.6
Technipnet France 100.00% 2.0 0.2 2.0 2.0 - 2.2 25.7 0.3 -
Seal Engineering France 100.00% 0.1 0.5 1.1 1.1 - - 4.6 1.5 0.8
Eurodim France 99.92% 0.2 1.8 11.5 11.5 - - 2.3 0.3 -
Technip International AG Switzerland 99.94% 3.4 (2.7) 3.1 - - - 0.4 (0.4) -
Engineering Re Switzerland 99.50% 1.4 5.5 1.7 1.7 - 12.1 6.8 6.6 -
Technip Italy Italy 100.00% 25.8 47.9 22.1 22.1 - 5,375.9 606.1 46.5 37.0
TPL - Tecnologie Progetti Lavori Italy 100.00% 9.0 0.1 7.8 7.8 - - - (0.3) -
Technip Iberia Spain 99.99% 0.6 1.0 0.8 0.8 - - 26.0 1.9 2.4
Technip Capital Belgium 100.00% 89.2 0.4 89.3 89.3 - - - - -
Technip Far East Malaysia 100.00% 6.1 (2.9) 5.9 5.9 - 8.5 12.4 2.9 -
Technip Holding Benelux BV Netherlands 100.00% 9.1 0.7 26.7 26.7 - - - 18.4 20.0
Technip Germany Germany 100.00% 12.8 4.6 100.2 100.2 - 225.1 100.1 2.4 4.1
Technip Tianchen China 100.00% 0.8 3.4 3.3 3.3 - - 13.3 2.5 -
Investments between 10% and 50% of issued capital held by Technip
TPG (M) Malaysia 10.00% 0.2 14.1 0.4 0.4 0.8 549.5 116.6 3.3 -
Technip USA Holding Inc USA 30.75% - 0.3 160.0 160.0 - - - 0.8 10.8
B. Other Subsidiaries and Investments
Other Subsidiaries
French Subsidiaries n/a n/a n/a 2.1 1.7 1.0 66.2 n/a n/a 2.3
Foreign Subsidiaries n/a n/a n/a 1.7 1.5 2.1 0.2 n/a n/a -
Other Investments
French Investments n/a n/a n/a - - - - n/a n/a -
Foreign Investments n/a n/a n/a 1.4 1.3 0.4 2,537.7 n/a n/a 2.9
Total n/a n/a n/a 3,445.0 3,441.2 21.5 18,581.2 n/a n/a 234.5

1952009 Reference Document
Financial Information on the Company’s Assets, Financial Situation and Results
20.4. Legal and Arbitration Procedures 20
20.3. Dividend Distribution Policy
The Combined Shareholders’ Meeting of April 30, 2009 approved the payment to shareholders of an ordinary dividend of €1.20 per share for the year ended December 31, 2008.
For the past three years, the amount of dividends eligible for the 40% French tax credit (avoir fi scal) were as follows:
Year Dividend per share Amount of the distribution eligible for the 40% tax credit
2006 €1.05 €1.05
€2.10 €2.10
2007 €1.20 €1.20
2008 €1.20 €1.20
Confi dent of Technip’s ability to create long-term shareholder value in a challenging environment, the Board of Directors will propose at the Shareholders’ Meeting to be held on April 29, 2010, a 12.5% increase in the dividend, to €1.35 per share.
This dividend would be paid on May 11, 2010.
The payment of dividends, which is handled by Société Générale, is made to the fi nancial intermediary account holders through Euroclear France’s direct payment procedure.
Deutsche Bank will handle the payment of dividends to ADR holders.
Dividends that are not claimed within fi ve years of their date of payment revert to the French State.
20.4. Legal and Arbitration Procedures
ITP disputeOn December 21, 2001, Interpipe S.A. (“ITP”), a French company, fi led a complaint with the Commercial Court of Versailles (Tribunal de Commerce de Versailles) against Coflexip, Coflexip Stena Offshore Ltd. and Cofl exip Stena Offshore International (now Technip France and Technip UK Ltd) seeking damages based on alleged breaches of several confi dentiality agreements related to “pipe-in-pipe” technology.
This dispute relates to contractual and other relationships among the companies between 1993 and 1998. ITP worked on certain Subsea pipeline installations projects managed subsequently by Cofl exip (and then Technip).
On May 16, 2006, the Commercial Court of Paris (Tribunal de Commerce de Paris) rendered a ruling partially in favor of ITP, imposing a fi ne of €48,930,000 on Technip. The Court’s decision was not, however automatically enforceable.
On June 28, 2006, Technip fi led an appeal of this ruling. ITP then amended its complaint by adding grounds of unfair commercial practices and tort liability.
On March 18, 2009, the Appeals Court of Paris (Cour d’Appel de Paris) ruled in favor of Technip by overruling the Commercial Court’s decision as it related to Technip’s contractual breach and by rejecting all ITP’s complaints.
Technip has always believed ITP’s complaints to be unfounded and that its exposure to this litigation was weak, which was confi rmed by the Court.
Moreover the Court, in the same decision, ruled in favor of Technip’s counter-argument by fi nding that ITP had committed acts of defamation against Technip and by requiring that it pays damages.
An appeal with the highest Court (Cour de Cassation) has been lodged by ITP against this decision which nevertheless was subsequently executed by ITP.
ITP had also brought actions before the Scottish and US courts for infringement of a patent relating to “pipe-in-pipe” technology. Concurrently, on February 17, 2004, the European Patent Offi ce (“EPO”) revoked the disputed patent, which rendered ITP’s claim on British territory. As a result, the Appeals Court of Edinburgh terminated the proceeding before it on November 19, 2004. In addition, a settlement agreement was reached in October 2007 which ended the proceedings before the US court of Alabama, without any fi nancial compensation.
However, even though the revocation of ITP’s European patent terminated its rights to the patent, it had no effect on the French patent obtained to protect the “pipe-in-pipe” technology.
As a result, on April 27, 2007, Technip brought an action against ITP to nullify its French patent. Technip’s claim was rejected by the Tribunal de Grande Instance de Paris on January 28, 2009, which has already been appealed. Technip believes that its exposure in terms of damages is negligible.
196 2009 Reference Document
Financial Information on the Company’s Assets, Financial Situation and Results
20.5. Signifi cant Changes in the Financial or Commercial Position20
TSKJTechnip is one of four shareholders of TSKJ, which carried out the construction of a natural gas liquefaction complex in Nigeria for Nigeria LNG Limited (“NLNG”) from 1994 onwards. The compa-nies KBR (formerly a subsidiary of the US Group Halliburton), Snamprogetti Netherlands BV (a subsidiary of the Italian Group ENI) and JGC Corporation (Japan) each hold 25% of TSKJ’s share capital.
The United States Securities and Exchange Commission (“SEC”) and the United States Department of Justice (“DOJ”) have since 2004 been conducting formal investigations into payments made in connection with the construction by TSKJ of a natural gas liquefaction complex for NLNG. A similar investigation by a French magistrate against “unidentifi ed persons” which also commenced in 2004 is still ongoing.
During the summer of 2004, the SEC requested Technip (which registered its shares with the SEC between October 2001 and November 2007) to voluntarily provide information relating to the implementation of this Project. Technip has fully cooperated on a voluntary basis with both formal and informal requests from the SEC and the DOJ since this request.
On February 11, 2009 KBR, which was at all relevant times, between 1994 and 2007, a domestic issuer under US securities laws, pleaded guilty to a fi ve count criminal information in the United States District Court involving charges related to the United States Foreign Corrupt Practices Act (“FCPA”) for conduct arising from its participation in TSKJ. In its plea agreement, KBR asserted that it had conspired to pay bribes to Nigerian Government Offi cials. As part of its plea agreement, KBR agreed to pay a criminal fi ne of US$402 million. Contemporaneously, KBR and its former parent company Halliburton also reached a settlement of a related civil complaint fi led by the SEC alleging civil violations of the FCPA. KBR and Halliburton jointly agreed to pay US$177 million in settlement of the civil complaint. The US Government has also brought criminal charges against certain individuals for conduct related to the Project.
A person or entity found in violation of the FCPA could be subject to criminal fi nes and civil penalties of up to US$500,000 per violation and equitable remedies including disgorgement
(if applicable) of profi ts including pre-judgment interest on such profi ts. Criminal penalties could range up to US$2 million per violation or twice the pecuniary gain or loss from the violation. The amount of any fi nes or monetary penalties depend on factual fi ndings, including among others, the amount, timing, nature and scope of any improper payment and related business transactions and the level of cooperation provided to the authorities during the investigations. Investigations of this nature and any related settle-ments could result in (i) third party claims against Technip which could include claims for special, indirect or consequential damages (ii) adverse consequences on Technip’s ability to obtain or continue fi nancing for current or future projects and/or (iii) damage to Technip’s business or reputation via negative publicity adversely affecting Technip’s prospects in the commercial market place.
French law was modifi ed in September 2000 to attach, for the fi rst time, liability for the corruption of foreign public offi cials. Under that law, criminal fi nes of up to €750,000, the confi scation of the direct and indirect proceeds of the offence and various prohibitions and civil damages may be imposed on a legal entity.
Technip and its counsel have held meetings with the US authorities since July 2008 and have discussed a resolution of the investiga-tion. While these discussions have not concluded, Technip recorded an exceptional charge of €245 million in the fourth quarter 2009 accounts refl ecting the estimated costs of resolution based on the status of ongoing discussions. The potential resolution does not contemplate a criminal conviction for Technip’s role in the TSKJ joint venture and would not affect Technip’s ability to continue its operations in a normal manner. While Technip currently has no reason to believe that the US investigation will not be resolved as anticipated, there can be no assurance that fi nal agreement will be reached with the DOJ and the SEC. If fi nal agreement is not reached, Technip cannot exclude a different conclusion of the investigation which could have a material adverse impact on Technip’s fi nancial position or operations.
As of the date of this Reference Document, there have been no other governmental, legal or arbitration proceedings (including any such proceedings that are pending or threatened of which the Company is aware) over the previous 12 months, which may have, or have had a signifi cant impact on the Group’s fi nancial position or profi tability.
20.5. Signifi cant Changes in the Financial or Commercial Position
There has been no signifi cant change in the Company’s fi nancial and commercial position since December 31, 2009.

1972009 Reference Document
21
21.1. Share capital . . . . . . . . . . . . . . . . . . . . . . . . . . . . . . . . . . . . . . . . . . . . . . . . . . . . . . . . . . . . . . . . . . . . . . . . . . . . . . . . . . . . . . . . . . . . . . . . . . . . . . . . . . . . . . . . . . . . . . . . . . . . . . . . 19721.1.1. Amount of share capital . . . . . . . . . . . . . . . . . . . . . . . . . . . . . . . . . . . . . . . . . . . . . . . . . . . . . . . . . . . . . . . . . . . . . . . . . . . . . . . . . . . . . . . . . . . . . . . . . . . . . . . . . . . . . . . . . . . . . . . .19721.1.2. Non-equity securities . . . . . . . . . . . . . . . . . . . . . . . . . . . . . . . . . . . . . . . . . . . . . . . . . . . . . . . . . . . . . . . . . . . . . . . . . . . . . . . . . . . . . . . . . . . . . . . . . . . . . . . . . . . . . . . . . . . . . . . . . . . .19721.1.3. Treasury shares and share repurchased programs . . . . . . . . . . . . . . . . . . . . . . . . . . . . . . . . . . . . . . . . . . . . . . . . . . . . . . . . . . . . . . . . . . . . . . . . . . . . . . . . . .19721.1.4. Potential capital. . . . . . . . . . . . . . . . . . . . . . . . . . . . . . . . . . . . . . . . . . . . . . . . . . . . . . . . . . . . . . . . . . . . . . . . . . . . . . . . . . . . . . . . . . . . . . . . . . . . . . . . . . . . . . . . . . . . . . . . . . . . . . . . . . . . .19921.1.5. Information on the terms applicable to rights and obligations attached to subscribed,
but unpaid, capital or on any company intending to increase share capital . . . . . . . . . . . . . . . . . . . . . . . . . . . . . . . . . . . . . . . . . .20121.1.6. Information on the share capital of any Group member, which is subject to an option
or to a conditional or unconditional agreement for transformation to an option, and details regarding these options (including the identity of the persons to which they belong) . . . . . . . . . . . . . . . . . . . . . . . . . .201
21.1.7. Changes in share capital . . . . . . . . . . . . . . . . . . . . . . . . . . . . . . . . . . . . . . . . . . . . . . . . . . . . . . . . . . . . . . . . . . . . . . . . . . . . . . . . . . . . . . . . . . . . . . . . . . . . . . . . . . . . . . . . . . . . . . . .201
21.2. Articles of Association . . . . . . . . . . . . . . . . . . . . . . . . . . . . . . . . . . . . . . . . . . . . . . . . . . . . . . . . . . . . . . . . . . . . . . . . . . . . . . . . . . . . . . . . . . . . . . . . . . . . . . . . . . . . . . 20221.2.1. Corporate purpose (Article 3 of the Articles of Association) . . . . . . . . . . . . . . . . . . . . . . . . . . . . . . . . . . . . . . . . . . . . . . . . . . . . . . . . . . . . . . . . . .20221.2.2. Members of Administrative, Executive and Supervisory Bodies . . . . . . . . . . . . . . . . . . . . . . . . . . . . . . . . . . . . . . . . . . . . . . . . . . . . . . . . . . . . .20221.2.3. Rights and duties attached to the shares (Article 11 of the Articles of Association) . . . . . . . . . . . . . . . . . . . . . . . . . . . . .20321.2.4. Amendment of Shareholders’ Rights . . . . . . . . . . . . . . . . . . . . . . . . . . . . . . . . . . . . . . . . . . . . . . . . . . . . . . . . . . . . . . . . . . . . . . . . . . . . . . . . . . . . . . . . . . . . . . . . . . . . .20321.2.5. Shareholders’ Meeting (Article 23 of the Articles of Association) . . . . . . . . . . . . . . . . . . . . . . . . . . . . . . . . . . . . . . . . . . . . . . . . . . . . . . . . . .20321.2.6. Provisions in the Articles of Association that may impact a change in control . . . . . . . . . . . . . . . . . . . . . . . . . . . . . . . . . . . . .20421.2.7. Crossing of thresholds (Article 13, Paragraphs 2 and 3 of the Articles of Association) . . . . . . . . . . . . . . . . . . . . . . . . . .20421.2.8. Specifi c provisions related to changes in share capital . . . . . . . . . . . . . . . . . . . . . . . . . . . . . . . . . . . . . . . . . . . . . . . . . . . . . . . . . . . . . . . . . . . . . . . . . .204
Additional Information
21.1. Share capital
21.1.1. Amount of share capitalAs of January 1, 2009, the start of the fi scal year, Technip’s share capital amounted to €83,354,642.55, divided into 109,317,564 fully paid-up ordinary shares.
At the end of the fi scal year, i.e., December 31, 2009, Technip’s share capital amounted to €83,374,261.68, divided into 109,343,294 fully paid-up ordinary shares.
As of February 28, 2010, Technip’s share capital amounted to €83,386,421.26, divided into 109,359,241 shares.
21.1.2. Non-equity securitiesNone.
21.1.3. Treasury shares and share repurchased programs
Over the course of the fi nancial year ended December 31, 2009, no share was purchased. Over the same fi nancial year, 234 shares
were transferred with no value. Furthermore, transaction fees amounted to €0.
Use of treasury sharesAll treasury shares held at December 31, 2009 and at February 28, 2010, i.e., 3,065,910 shares, with a par value per share of €0.7625 and a purchase price value of €143.8 million, which represented 2.80% of the Company’s share capital at these two dates, were used to satisfy obligations related to stock option plans or other grants of shares in favor of the Company’s employees and directors and offi cers.
At December 31, 2009 and February 28, 2010,
1,110,670 shares were used for the Plan 2007 performance ■
share program, implemented by the Board of Directors at its meetings on March 12, 2007, December 12, 2007 and July 1, 2008; and
1,070,692 shares were used for the Plan 2008 performance ■
share program implemented by the Board of Directors at its meetings on July 1, 2008, December 9, 2008 and February 18, 2009.

198 2009 Reference Document
Additional Information
21.1. Share capital21
Moreover, 953,100 shares were used for the Plan 2008 perfor- ■
mance share program implemented by the Board of Directors at its meeting on July 1, 2008; and
993,175 and 1,093,175 shares at December 31, 2009 and ■
February 28, 2010 respectively were used for the Plan 2009 performance share program implemented by the Board of Directors at its meetings on June 15, 2009, October 24-25, 2009 and February 16, 2010.
The potential dilutive effect amounts to 3.76% of the Company’s share capital at February 28, 2010.
Renewal of the Company’s share repurchase programA proposal will be submitted to the Shareholders’ Meeting of April 29, 2010 (11th resolution) to authorize the Board of Directors to repurchase Technip shares in an amount of up to 10% of the share capital as of the date of such meeting. The maximum purchase price will be proposed to be set at €80 (excluding costs) per share.
Legal frameworkThe implementation of this plan is subject to the approval of Technip’s Shareholders’ Meeting of April 29, 2010 through the 11th resolution, which reads as follows:
“The Shareholders’ Meeting, acting under the conditions of quorum and majority required for Ordinary Shareholders’ Meetings, having reviewed the report of the Board of Directors, authorizes the Board of Directors to purchase shares of the Company, in accordance with the provisions of Articles L. 225-209 et seq. of the French Commercial Code, on one or more occasions, for the following primary purposes:
to honor commitments related to stock-option plans or other ■
share grants to employees or directors or offi cers (mandataires sociaux) of the Company or its affi liates;
to use shares in payment or in exchange in connection with ■
external growth transactions;
to promote share trading, in order, in particular, to ensure liqui- ■
dity with an investment services provider pursuant to a liquidity contract in compliance with the ethics charter approved by the French Financial Market Authority (Autorité des Marchés Financiers);
to cancel such shares; ■
to deliver shares upon the exercise of rights attached to securi- ■
ties giving access to the share capital;
to implement any such market practice which would become ■
recognized from time to time by law or by the French Financial Market Authority (Autorité des Marchés Financiers).
The purchase, holding, sale or transfer of the purchased shares may be carried out, depending on the case, on one or more occa-sions, in any manner on the market (regulated or not), through multilateral trade facilities (“MTFs”), via systematic internalizers or through negotiated transactions, in particular, through the acquisition or sale of blocks, or by using fi nancial derivatives and warrants, in compliance with applicable regulations. The portion of the repurchase program that may be carried out by negotiation of blocks may be as large as the entire program.
The Shareholders’ Meeting sets the maximum purchase price at €80 (before charges) per share and decides that the maximum
number of shares that may be acquired may not exceed 10% of the shares comprising the share capital as of the date of this Shareholders’ Meeting.
In the event of a share capital increase by incorporation of premiums, reserves and benefi ts, resulting in either an increase in the nominal value, or in a free grant of shares, and in the event of a split or reverse split of shares or any other transaction affecting the share capital, the Board of Directors may adjust the aforementioned purchase price to take into account the effect of those transactions on the value of the shares.
Full powers are granted to the Board of Directors, with power of delegation to the Chief Executive Offi cer or, with his consent, to one or more executive vice presidents (directeurs généraux délégués), to place, at any time, except during the period of a public offering on the Company’s securities, any orders on a secu-rities exchange or through negotiated transactions, to allocate or re-allocate repurchased shares to the primary repurchase purposes in accordance with applicable law and regulations, to enter into any agreements, specifi cally for the keeping of purchase and sale registers, to draft any documents, to carry out any formalities, to make any declarations and communications to any agencies, particularly to the French Financial Market Authority (Autorité des Marchés Financiers), concerning the transactions carried out pursuant to this resolution, to set the terms and conditions to preserve, as necessary, any rights of holders of securities giving access to the Company’s share capital and any rights of benefi -ciaries of options in accordance with applicable regulations and, generally, to take any necessary action. The Shareholders’ Meeting also grants full powers to the Board of Directors, if applicable laws or the French Financial Market Authority (Autorité des Marchés Financiers) were to extend or supplement the primary purposes authorized for share repurchase programs, to inform the public according to applicable regulations of potential modifi cations to the repurchase program pertaining to the amended purposes.
This authorization invalidates any previous authorization for the same purpose and, in particular, the fourteenth resolution of the Ordinary Shareholders’ Meeting of April 30, 2009. It is granted for a period of 18 months from the date of this Shareholders’ Meeting.
In its report to the Annual Shareholders’ Meeting, the Board of Directors shall provide the shareholders with information relating to the purchases and sales of shares carried out pursuant to this resolution.”
TermsThe maximum number of shares that may be acquired cannot exceed 10% of the share capital as of the day of the Shareholders’ Meeting.
Acquisitions made by the Company can in no case result in its holding, directly or indirectly, more than 10% of the share capital.
Under the terms of the authorization submitted for approval by the Shareholders’ Meeting to be held on April 29, 2010, and on the basis of the treasury shares held and share capital at February 28, 2010 (i.e., 3,065,910 shares and 109,359,241 shares, respecti-vely), the maximum number of shares that may be repurchased would amount to 10,629,333 shares, which would represent a maximum theoretical investment of €850,346,640, based on the maximum purchase price of €80.

1992009 Reference Document
Additional Information
21.1. Share capital 21
21.1.4. Potential capital
Summary of authorizations granted by the Combined Shareholders’ Meeting, which expired or were in effect in 2009The table below summarizes the resolutions adopted by the Combined Shareholders’ Meeting authorizing the Board of Directors to increase the share capital, and presents the Board’s implementation of such authorizations in 2009:
Purpose Validity LimitUse during the
2009 fi nancial year
Share capital increase with preferential subscription rights
Extraordinary Shareholders’ Meeting of April 27, 2007
20th resolutionTerm: 26 months
Expires: June 26, 2009
Par value: €37,5 million (1)
€2.5 billion for securities representing debt certifi cates
granting access to share capital (2)
None
Share capital increase without preferential subscription rights
Extraordinary Shareholders’ Meeting of April 27, 2007
21st resolutionTerm: 26 months
Expires: June 26, 2009
Par value: €15 million (1)
€2.5 billion for securities representing debt certifi cates
granting access to share capital (2)
None
Share capital increase through incorporation of reserves, profi ts or premiums or other sums for which capitalization would be accepted
Extraordinary Shareholders’ Meeting of April 27, 2007
23rd resolutionTerm: 26 months
Expires: June 26, 2009
€75 million None
Share capital increase through the issue of shares or securities granting access to the share capital in favor of Company Savings Plan members
Extraordinary Shareholders’ Meeting of April 27, 2007
25th resolutionTerm: 26 months
Expires: June 26, 2009
3% of the share capital None
Free grant of existing shares to be issued to eligible employees and directors or offi cers of the Company or other associated companies
Extraordinary Shareholders’ Meeting of May 6, 2008
8th resolutionTerm: 24 months
Expires: May 5, 2010
1% of the share capital None
Free grant of existing shares to be issued to Chairman and Chief Executive Offi cer of the Company, executive director of the Company
Extraordinary Shareholders’ Meeting of May 6, 2008
9th resolutionTerm: 24 months
Expires: May 5, 2010
0.03% of the share capital None
Grant of stock options to be issued to eligible employees and directors or offi cers of the Company or other associated companies
Extraordinary Shareholders’ Meeting of May 6, 2008
10th resolutionTerm: 24 months
Expires: May 5, 2010
1% of the share capital None
Grant of stock options to be issued to the Chairman and Chief Executive Offi cer of the Company, executive director of the Company
Extraordinary Shareholders’ Meeting of May 6, 2008
11th resolutionTerm: 24 months
Expires: May 5, 2010
0.10% of the share capital None
Share capital increase with preferential subscription rights
Extraordinary Shareholders’ Meeting of April 30, 2009
15th resolutionTerm: 26 months
Expires: June 29, 2011
Par value: €37.5 million (3)
€2.5 billion for securities representing debt certifi cates
granting access to share capital (4)
None
Share capital increase without preferential subscription rights
Extraordinary Shareholders’ Meeting of April 30, 2009
16th resolutionTerm: 26 months
Expires: June 29, 2011
Par value: €12 million (3)
€2.5 billion for securities representing debt certifi cates
granting access to share capital (4)
None
Share capital increase in favor of employees adhering to a company savings plan
Extraordinary Shareholders’ Meeting of April 30, 2009
17th resolutionTerm: 26 months
Expires: June 29, 2011
2% of the share capital (3) None
200 2009 Reference Document
Additional Information
21.1. Share capital21
Purpose Validity LimitUse during the
2009 fi nancial year
Grant of stock options to be issued to eligible employees and directors or offi cers of the Company or other associated companies
Extraordinary Shareholders’ Meeting of April 30, 2009
20th resolutionTerm: 24 months
Expires: April 29, 2011
1% of the share capital 0.9%
Grant of stock options to be issued to the Chairman and Chief Executive Offi cer of the Company, executive director of the Company
Extraordinary Shareholders’ Meeting of April 30, 2009
21st resolutionTerm: 24 months
Expires: April 29, 2011
0.10% of the share capital 0.09%
(1) Share capital increases carried out pursuant to the 20th and 21st resolutions of the Extraordinary Shareholders’ Meeting of April 27, 2007 must not exceed a total nominal
value of €37.5 million.
(2) The total amount of debt securities granting access to the share capital, issued pursuant to the 20th and 21st resolutions of the Extraordinary Shareholders’ Meeting of
April 27, 2007, must not exceed €2.5 billion.
(3) Share capital increases carried out pursuant to the 15th, 16th and 17th resolutions of the Extraordinary Shareholders’ Meeting of April 30, 2009 must not exceed a total
nominal value of €37.5 million.
(4) The total amount of debt securities granting access to the share capital, issued pursuant to the 15th and 16th resolutions of the Extraordinary Shareholders’ Meeting of
April 30, 2009, must not exceed €2.5 billion.
With a certain number of these authorizations reaching expira-tion, the Combined Shareholders’ Meeting of April 29, 2010 is being requested to authorize the Board of Directors:
to grant, on one or more occasions over a period of 24 months, ■
existing shares free of charge (“performance shares”) in an amount of up to 0.9% of the share capital as of the date of the aforementioned Shareholders’ Meeting (i) to the employees of Technip and, (ii) to employees and directors and offi cers (mandataires sociaux) of companies related to the Company within the meaning of Article L. 225-197-2 of the French Commercial Code (13th resolution);
subject to the adoption of the 13 ■th resolution, to grant, on one
or more occasions over a period of 24 months, existing shares free of charge (“performance shares”) in an amount of up to 0.03% of the share capital as of the date of the aforementioned Shareholders’ Meeting in favor of the Chairman and Chief Executive Offi cer (mandataire social) (14th resolution);
to grant, on one or more occasions over a period of 24 months, ■
share purchase or share subscription options in an amount of up to 1.1% of the share capital as of the date of the aforemen-tioned Shareholders’ Meeting in favor of Technip’s employees and directors (mandataires sociaux) and to those of companies related to the Company (15th resolution);
subject to the adoption of the 15 ■th resolution, to grant, on one
or more occasions over a period of 24 months, share purchase or share subscription options in an amount of up to 0.10% of the share capital on the date of the aforementioned Shareholders’ Meeting, in favor of the Chairman and Chief Executive Offi cer (mandataire social) (16th resolution);
to increase the share capital, on one or more occasions over a ■
period of 26 months, in favor of members of savings plan of the Company and the French and foreign companies related to the Company in accordance with Article L. 225-180 of the French Commercial Code and Article L. 3344-1 of the French Labor Code, in an amount of up to 1% of the share capital on the date of the implementation of such increase (17th resolution).
Authorization to reduce share capitalThe Combined Shareholders’ Meeting of April 29, 2005 authorized the Board of Directors to cancel shares purchased under share repurchase programs carried out by the Company in an amount of up to 10% of the share capital per 24-month period. This authorization was granted for a period of fi ve years pursuant to the following resolution (11th resolution):
“The Shareholders’ Meeting, acting under the conditions of quorum and majority required for Extraordinary Shareholders’ Meetings, and having reviewed:
the Board of Directors’ report; and ■
the Statutory Auditors’ Special Report; ■
and in accordance with Article L. 225-209 of the French Commercial Code:
1. Authorizes the Board of Directors to reduce the share capital, on one or more occasions, by cancelling all or part of the shares repurchased pursuant to share repurchase programs authorized by the Shareholders’ Meeting in an amount of up to 10% of the share capital per 24-month period and to allocate the difference between the repurchase value of the cancelled shares and their par value to the premiums and available reserves.
2. The Board of Directors will have all the powers required to determine the terms and conditions of this or these cancel-lations and to proceed with the resulting amendment of the articles of association and to carry out all the necessary formalities.
3. This authorization is granted for a period of fi ve years. It inva-lidates any previous authorization for the same purpose.”
The Company did not cancel any shares pursuant to this autho-rization in 2009.
The Combined General Meeting dated April 29, 2010 will propose to authorize the Board of Directors to reduce the Company’s share capital up to the limit of 10% per 24-month period for another period of fi ve years (12th resolution).

2012009 Reference Document
Additional Information
21.1. Share capital 21
21.1.5. Information on the terms applicable to rights and obligations attached to subscribed, but unpaid, capital or on any company intending to increase share capital
None.
21.1.6. Information on the share capital of any Group member, which is subject to an option or to a conditional or unconditional agreement for transformation to an option, and details regarding these options (including the identity of the persons to which they belong)
See Section 17.2.2.
21.1.7. Changes in share capital
Change in share capital over the three previous years
Date of Board of Directors’ meeting recording the share capital variation Type of operation
Number of shares
issued/ cancelled
Nominal amount of the
share capital increase/ reduction
Global issuance premium
Successive amounts of
share capital
Total number of
shares
Par value of the shares
02/21/2007 Stock options exercised 298,397 €227,527,72 - €80,914,345,18 106,117,174 €0.7625
05/14/2007 Recording of the share capital increase under the Group savings plan 516,207 €393,607.84 - €81,307,953.02 106,633,381 €0.7625
05/14/2007 Stock options exercised 188,876 €144,017.95 - €81,451,970.96 106,822,257 €0.7625
07/25/2007 Stock options exercised 296,059 €225,744.99 - €81,677,715.95 107,118,316 €0.7625
11/14/2007 Stock options exercised 102,987 €78,527.59 - €81,756,243.54 107,221,303 €0.7625
02/20/2008 Stock options exercised 132,471 €101,009.14 - €81,857,252.68 107,353,774 €0.7625
05/14/2008 Stock options exercised 20,830 €15,882.87 - €81,873,135.55 107,374,604 €0.7625
07/30/2008 Stock options exercised 210,489 €160,497.86 - €82,033,633.41 107,585,093 €0.7625
11/12/2008 Stock options exercised 178,199 €135,876.74 - €82,169,510.15 107,763,292 €0.7625
11/12/2008 Recording of the share capital increase under the Group savings plan 1,446,260 €1,102,773.25 - €83,272,283.40 109,209,552 €0.7625
02/18/2009 Stock options exercised 108,012 €82,359.15 - €83,354,642.55 109,317,564 €0.7625
Change in share capital over the period from January 1, 2010 to February 28, 2010
Date of Board of Directors’ meeting recording the share capital variation
Type of operation
Number of shares
issued/ cancelled
Nominal amount of the
share capital increase/ reduction
Global issuance premium
Successive amounts
of share capital
Total number
of sharesPar value
of the shares
02/16/10 Levée d’options de souscription d’actions
25,730 €19,619.13 - €83,374,261.68 109,343,294 €0.7625

202 2009 Reference Document
Additional Information
21.2. Articles of Association21
21.2. Articles of Association
21.2.1. Corporate purpose (Article 3 of the Articles of Association)
The company has the following purpose in all countries:
all engineering studies and services, and construction of complex ■
industrial plants, in particular, for hydrocarbons, as well as all fi elds of industry, notably chemicals and life sciences;
the conception, manufacturing, purchase, sale, construction, ■
assembly and installation of materials, products, equipment and systems intended for said installations, in particular, fi xed or fl oating platforms and pipelines for the development of oil fi elds at sea;
the provision of all services related to these products, equip- ■
ment and installations;
the development and implementation of all processes and ■
products for practical use in industry of the results of research carried out by the Company or by any other individual or entity;
the registration, acquisition, obtaining, direct or indirect use, ■
sale or purchase of all brands, processes, patents, and licenses for the use of patents;
the direct or indirect participation by the Company in all opera- ■
tions of the said type, either by way of formation of companies, contributions to existing companies or mergers with such companies, transfer to companies of all or part of its assets or rights in real and personal property, subscriptions, purchases and sales of securities and corporate interests, partnerships, advances, loans or otherwise;
the investment, by any means and in any form, in companies ■
or industrial, commercial, fi nancial and real property enter-prises, whether French or foreign, regardless of legal form or organization and, where necessary, the disposition of these investments;
more generally, all transactions of a commercial, fi nancial, ■
industrial or civil nature or in real or personal property, related directly or indirectly to any of the purposes listed above and to any similar or related purposes, both on its own behalf or on behalf of third parties, and more generally all transactions facilitating or related to the realization of these purposes.
21.2.2. Members of Administrative, Executive and Supervisory Bodies
Composition of the Board of Directors (Article 14 of the Articles of Association–excerpts)The Company is regulated by a Board of Directors with no fewer than three and no more than 18 members, subject to exceptions provided for by law.
Each director shall hold at least 400 Company’s shares in regis-tered form.
Individuals or legal entities may be directors.
Members of the Board of Directors are appointed by the Ordinary Shareholders’ Meeting for a term of four years to expire at the end of the Ordinary Shareholders’ Meeting convened to approve the fi nancial statements for the preceding fi nancial year, and held in the fi nancial year during which the term expires.
The Board of Directors will be renewed on a rolling basis every two years as concerns one-half of the members of the Board of Directors if the Board of Directors is comprised of an even number of directors, or one-half of the members plus one if the Board of Directors is comprised of an odd number of directors. For purposes of this provision, the order of the termination of offi ce will be decided by the Board of Directors on the date of its fi rst meeting following the adoption of this provision, unanimously approved by the directors present or represented or, failing that, by a random draw. The terms of offi ce of directors thus chosen or drawn will automatically become null.
The number of directors who are over the age of 70 may not exceed one-third of the number of directors in offi ce at the end of the fi scal year.
Operation of the Board of DirectorsDeliberations of the Board of Directors (Article 16 of the Articles of Association–excerpts)
At least one-half of the members of the Board of Directors must be present in person for meetings to be valid.
In accordance with the conditions and limits set by applicable regulations, directors who are not physically present, but participate in meetings of the Board of Directors by means of videoconference or other telecommunications, will be considered present for purposes of quorum and majority requirements.
Decisions are adopted by a majority of the members present in person or represented. The Chairman shall have the casting vote in the event of a tie.
Powers of the Board of Directors (Article 17 of the Articles of Association)The Board of Directors shall set the guidelines for the business of the Company and shall see to it that they are implemented.
Subject to the powers expressly assigned to Shareholders’ Meetings, and within the scope of the corporate purpose, it shall take up any and all issues affecting the proper operation of the Company and shall decide in its meetings any business concerning the Company.
In relationships with third parties, the Company shall be bound even by actions of the Board of Directors which are not related to the corporate purpose, unless it can prove that the third party knew that the action exceeded such purpose or that it could not be unaware of it given the circumstances; publication of the articles of association shall not in and of itself constitute proof.
The Board of Directors shall undertake any and all audits and controls it may deem appropriate. The Chairman or the Company’s Chief Executive Offi cer is responsible for communicating to each director all necessary documentation and information so that they may accomplish their duties.

2032009 Reference Document
Additional Information
21.2. Articles of Association 21
21.2.3. Rights and duties attached to the shares (Article 11 of the Articles of Association)
Each share shall give a right to the corporate assets, to the distribution of the profi ts and to any liquidation surplus (boni de liquidation), in proportion to the number of shares issued.
The shareholders shall be liable only up to the amount of their capital contributions.
Share ownership automatically implies adherence to the Company’s articles of association and to the decisions of the General Shareholders’ Meetings.
The rights and duties attached to each share shall pass with the title of the share, to whomever becomes the owner thereof.
Whenever it is necessary to own a certain number of shares in order to exercise a right of any kind, in particular, in the event of an exchange, consolidation or allotment of shares, or following an increase in or reduction of share capital–whatever the terms and conditions thereto may be–a merger or any other transaction, shareholders holding a number of shares fewer than that required may exercise their rights only on condition that they make their own personal arrangements with regard to consolidation and, where applicable, to the purchase or sale of the number of shares or rights forming the necessary fractional share.
Double voting rights (Article 12 of the Articles of Association)Since November 24, 1995, double voting rights, taking into account the fraction of the share capital that they represent, have been attributed to all fully paid-up shares which can be proved to have been registered in the name of the same shareholder for at least two years.
In the event of an increase of share capital by capitalization of reserves, profi ts or premiums, double voting rights shall also be granted as from the time of their issue to registered shares granted free of charge to a shareholder in respect of existing shares entitling such shareholder to the benefi t of the said right.
Registered shares benefi ting from double voting rights that are converted into bearer form for any reason whatsoever shall lose such double voting rights.
Identifi able bearer shares (Article 13, Paragraph 1 of the Articles of Association)In accordance with applicable laws and regulations, the Company may at any time ask the body responsible for clearing securities for information enabling it to identify the holders of shares carrying immediate or future voting rights at Shareholders’ Meetings, as well as the number of shares held by each of them and, where applicable, any restrictions that may affect such shares.
Distribution of profi ts (Article 27 of the Article of Association)From distributable profi t, as defi ned by law, the General Shareholders’ Meeting may withhold any sums it thinks fi t to allocate to any optional reserve fund or to carry it forward.
The balance, if any, shall be divided between all the shareholders in proportion to the number of shares that they own.
In addition, the Shareholders’ Meeting may decide to distribute sums withheld from the reserve funds at its disposal, by indicating expressly the particular reserve funds from which the deductions should be made. However, the dividends must be withheld fi rst from the distributable profi ts for the fi scal year.
21.2.4. Amendment of Shareholders’ Rights
In the absence of any provisions regarding changes to sharehol-ders’ rights in the Company’s articles of association, any changes to shareholders’ rights are subject to applicable law.
21.2.5. Shareholders’ Meeting (Article 23 of the Articles of Association)
Convening and Holding of Shareholders’ Meetings–DeliberationsShareholders’ Meetings shall be convened in accordance with the conditions set out by applicable laws and regulations. Shareholders’ Meetings shall meet at the registered offi ce or at any other place specifi ed in the notice convening the meeting.
Shareholders’ Meetings shall be chaired by the Chairman of the Board of Directors or, in his absence, by a director so appointed by the Board of Directors, or failing this, the Shareholders’ Meeting shall appoint a Chairman.
The vote tellers’ functions are performed by two shareholders who are present and who agree to perform these duties, and who have by themselves or as proxies the largest number of votes.
The presiding committee appoints a secretary, who can be chosen from outside of the Meeting’s members.
AttendanceEvery shareholder has the right, after proof of identity, to partici-pate in Shareholders’ Meetings, either physically, or by proxy given to another shareholder or to his or her spouse, or by sending a proxy to the Company without indication of a mandate, provided the shares are registered in the name of the shareholder or his or her intermediary listed pursuant to Article L. 228-1 of the French Commercial Code as of midnight of the third business day prece-ding the Shareholders’ Meeting in accordance with applicable regulations.
Any legal entity shareholder may participate in the Shareholders’ Meetings through its legal representatives or by any other person appointed by it for this purpose.
The shareholders may, subject to the conditions set forth under the applicable laws and regulations, send their proxy and mail voting forms for any Shareholders’ Meeting either on paper or by electronic means.
The Board of Directors may decide that the shareholders may participate in and vote at any Shareholders’ Meeting by video-conferencing means in the conditions set forth by law. In such a case, any shareholder participating by any of the referred means shall be deemed to be present for the purposes of quorum and majority.

204 2009 Reference Document
Additional Information
21.2. Articles of Association21
21.2.6. Provisions in the Articles of Association that may impact a change in control
To the Company’s knowledge, neither the Company’s Articles of Association nor its internal charter contains any provisions that could delay or prevent a change in control.
The Company’s Articles of Association provide for double voting rights as described above in Section 21.2.3 (Article 12 of the Articles of Association).
21.2.7. Crossing of thresholds (Article 13, Paragraphs 2 and 3 of the Articles of Association)
Any shareholder acting alone or in a group (de concert), in addi-tion to the thresholds referred to in Article L. 233-7 of the French Commercial Code, who comes to hold or ceases to hold, directly or indirectly, 1% of the Company’s share capital or voting rights, or a multiple of said percentage less than or equal to 33%, shall notify the Company within fi ve trading days of having crossed any one of these thresholds, by registered letter with return receipt requested, of the aggregate number of shares, voting rights or securities giving rights to the Company’s share capital, which it holds, directly or indirectly, alone or in a group (de concert).
Any failure to comply with the notifi cation of the crossing of a statutory threshold shall give rise to forfeiture of those voting rights exceeding the fraction that was required to have been declared pursuant to the provisions detailed above, for all Shareholders’ Meetings that may be held during a period of two years following the curing of a failure to notify, at the request of one or more shareholders, together holding at least 1% of the Company’s share capital or voting rights, such request being recorded in the minutes of the Shareholders’ Meetings.
21.2.8. Specifi c provisions related to changes in share capital
In the absence of any provisions regarding changes to the share capital in the Company’s articles of association, any changes to the share capital are subject to applicable law.

2052009 Reference Document
22
22.1. Bond issue 2004-2011 . . . . . . . . . . . . . . . . . . . . . . . . . . . . . . . . . . . . . . . . . . . . . . . . . . . . . . . . . . . . . . . . . . . . . . . . . . . . . . . . . . . . . . . . . . . . . . . . . . . . . . . . . . . . . 205
22.2. Deep Energy Financing . . . . . . . . . . . . . . . . . . . . . . . . . . . . . . . . . . . . . . . . . . . . . . . . . . . . . . . . . . . . . . . . . . . . . . . . . . . . . . . . . . . . . . . . . . . . . . . . . . . . . . . . . . . . . . 205
22.3. Skandi Arctic Financing . . . . . . . . . . . . . . . . . . . . . . . . . . . . . . . . . . . . . . . . . . . . . . . . . . . . . . . . . . . . . . . . . . . . . . . . . . . . . . . . . . . . . . . . . . . . . . . . . . . . . . . . . . . . . 205
22.4. BNDES Financing . . . . . . . . . . . . . . . . . . . . . . . . . . . . . . . . . . . . . . . . . . . . . . . . . . . . . . . . . . . . . . . . . . . . . . . . . . . . . . . . . . . . . . . . . . . . . . . . . . . . . . . . . . . . . . . . . . . . . . . . 205
22.5. Revolving Credit Agreement and Bilateral Lines . . . . . . . . . . . . . . . . . . . . . . . . . . . . . . . . . . . . . . . . . . . . . . . . . . . . . . . . . . . . . . 206
22.6. Private Placement with Deferred Payment. . . . . . . . . . . . . . . . . . . . . . . . . . . . . . . . . . . . . . . . . . . . . . . . . . . . . . . . . . . . . . . . . . . . . . . . 206
Signifi cant Contracts
22.1. Bond issue 2004-2011
The €650 million bond issue is described in Section 4.6 of this Reference Document. The Standard and Poor’s credit rating of the issuer is BBB/positive/A-2 as of December 31, 2009.
22.2. Deep Energy Financing
The credit facilities for a global amount of US$241 million to be used for the fi nancing of Deep Energy–formally called the New Pipelay Vessel–currently under construction are described in Section 4.6 of this Reference Document.
22.3. Skandi Arctic Financing
The fi nancing with an original amount of 500 million Norwegian crowns corresponding to the 50% share of the Group in the Skandi Arctic Diving Support vessel is described in Section 4.6 of this Reference Document.
22.4. BNDES Financing
The three different BNDES facility agreements signed by the Brazilian subsidiary Flexibras with three different commercial banks on behalf of BNDES amounting to 300 million Brazilian reals are described in Section 4.6 of this Reference Document.

206 2009 Reference Document
Signifi cant Contracts
22.5. Revolving Credit Agreement and Bilateral Lines22
22.5. Revolving Credit Agreement and Bilateral Lines
The €850 million revolving syndicated agreement and the four bilateral facility agreements are described in Section 4.6 of this Reference Document.
22.6. Private Placement with Deferred Payment
The contract entered into between Technip and an international bank establishing the terms on which Technip agrees to issue in July 2010 €200 million of Notes and the obligation of the inter-national bank to fi nd a private investor to subscribe for the debt
(pursuant to a similar agreement with the international bank) or, falling which, for the international bank to subscribe the Notes itself, is described in Section 4.6 of this Reference Document.

2072009 Reference Document
23Information from Third Parties, Declarations Filed by Experts and Declarations of Interest
To the Company’s knowledge, the sources referred to in this Reference Document were accurately reproduced and no fact has been omitted, which would render the reproduced information, in any signifi cant way, inaccurate or false.

208 2009 Reference Document
Publicly Available Documents
Throughout this Reference Document’s period of validity, a copy of the articles of association, the Statutory Auditors’ reports and the fi nancial statements for the preceding three fi nancial years, as well as all reports, correspondence and other documents, historical fi nancial information for the Company and its subsidiaries relating to the preceding three fi nancial years, assessments and declarations drawn up by an expert at the request of the issuer, part of which is included or discussed in this Reference Document, and all other documents provided for under law may be consulted in accordance with the applicable legal and regulatory conditions at the Company’s registered offi ce, 6-8, allée de l’Arche, Faubourg de l’Arche, ZAC Danton, 92400 Courbevoie (France).
Persons Responsible for Financial Information ReleasesInvestor and Analyst Relations6-8, allée de l’Arche–92973 Paris-La Défense Cedex–FranceFax: +33 (0)1 47 78 67 58
Kimberly StewartPhone: +33 (0)1 47 78 66 74E-mail: [email protected]
Antoine d’AnjouPhone: +33 (0)1 47 78 30 18E-mail: [email protected]
24

2092009 Reference Document
25Information on Equity Interests
See Section 7.2 of this Reference Document and the List of Subsidiaries and Investments as disclosed in Note 7 of the Company’s Statutory Financial Statements for the fi nancial year ended December 31, 2009, included in Section 20.2 of this Reference Document.
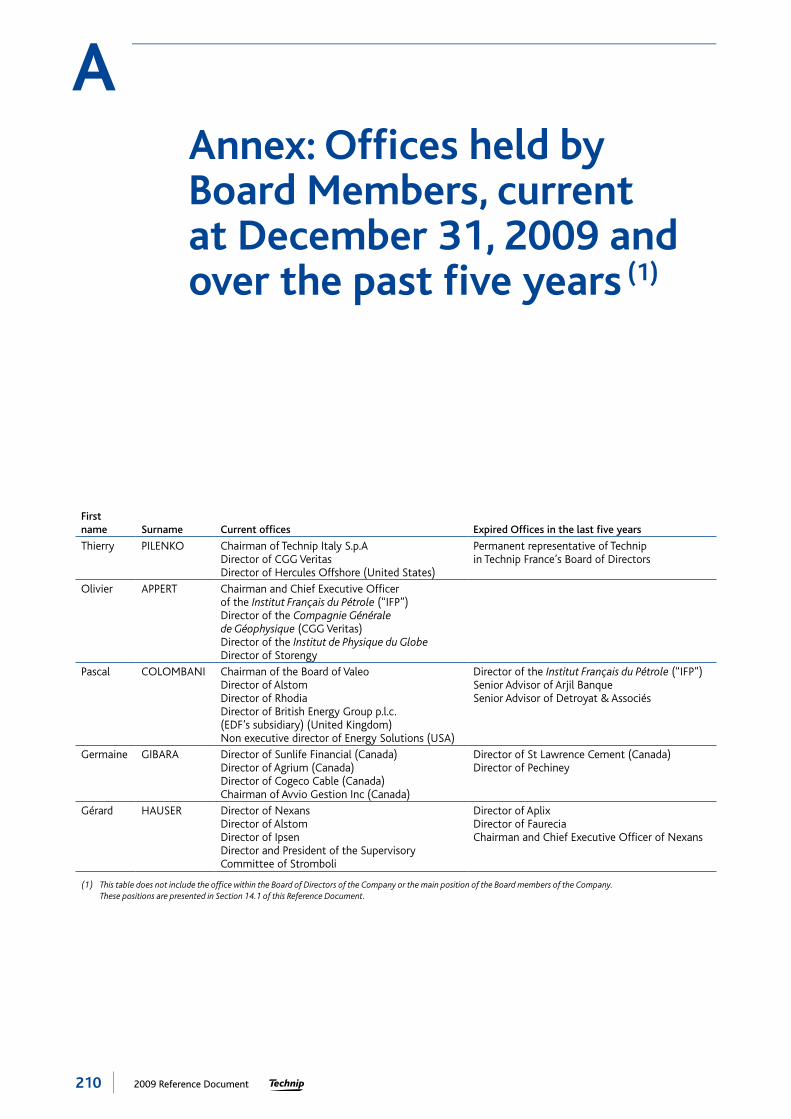
210 2009 Reference Document
Annex: Offi ces held by Board Members, current at December 31, 2009 and over the past fi ve years (1)
A
First name Surname Current offi ces Expired Offi ces in the last fi ve years
Thierry PILENKO Chairman of Technip Italy S.p.ADirector of CGG VeritasDirector of Hercules Offshore (United States)
Permanent representative of Technip in Technip France’s Board of Directors
Olivier APPERT Chairman and Chief Executive Offi cer of the Institut Français du Pétrole (“IFP”)Director of the Compagnie Générale de Géophysique (CGG Veritas)Director of the Institut de Physique du GlobeDirector of Storengy
Pascal COLOMBANI Chairman of the Board of ValeoDirector of AlstomDirector of RhodiaDirector of British Energy Group p.l.c. (EDF’s subsidiary) (United Kingdom)Non executive director of Energy Solutions (USA)
Director of the Institut Français du Pétrole (“IFP”)Senior Advisor of Arjil BanqueSenior Advisor of Detroyat & Associés
Germaine GIBARA Director of Sunlife Financial (Canada)Director of Agrium (Canada)Director of Cogeco Cable (Canada)Chairman of Avvio Gestion Inc (Canada)
Director of St Lawrence Cement (Canada)Director of Pechiney
Gérard HAUSER Director of NexansDirector of AlstomDirector of IpsenDirector and President of the Supervisory Committee of Stromboli
Director of AplixDirector of FaureciaChairman and Chief Executive Offi cer of Nexans
(1) This table does not include the offi ce within the Board of Directors of the Company or the main position of the Board members of the Company. These positions are presented in Section 14.1 of this Reference Document.

2112009 Reference Document
Annex: Offi ces held by Board Members, current at December 31, 2009 and over the past fi ve years A
First name Surname Current offi ces Expired Offi ces in the last fi ve years
Marwan LAHOUD Member of the Supervisory Board of BPCEMember of the Executive Committee and of the Board of the GIFASVice President and director of CEPSMember of Shareholders’ Committee of AirbusMember of the Supervisory Committee of EurocopterPermanent representative of Eurotradia InternationalMember of the Executive Committee of EADS NV (Netherlands)Chairman of EADS UK (United Kingdom)Director of EADS Casa (Spain)Director of EADS North America Holdings (USA)
Jean-Pierre
LAMOURE Chairman of Solétanche FreyssinetManager of ClamarDirector of VinciDirector of Solétanche BachyChairman of PsilaChairman of Solétanche Bachy EntrepriseManager of ComemiChairman of the Supervisory Board of Atlantic SFDTChairman of the Management Board of SedecoMember of the Supervisory Board of Fortis Banque FranceSecretary director of the Fédération Nationale des Travaux PublicsDirector of Bachy Solétanche Holdings Ltd. (United Kingdom)
Director of the Institut Français du Pétrole (“IFP”)Co-manager of HIGBManager of the Compagnie du SolChairman of Solétanche Bachy SA
Daniel LEBÈGUE Director of SCOR SA Director of Crédit Agricole SADirector of Alcatel Lucent
John O’LEARY Director of Vantage Drilling Company (United States)Member of the Supervisory Board of Huisman-Itrec (The Netherlands)Member of the Supervisory Board of Jumbo Shipping (The Netherlands)Board Member of MIS (UAE)
Joseph RINALDI
Bruno WEYMULLER Director of Elf Aquitaine Director of Sanofi
(1) This table does not include the offi ce within the Board of Directors of the Company or the main position of the Board members of the Company. These positions are presented in Section 14.1 of this Reference Document.

212 2009 Reference Document
Annex: Financial Results of the Last Five Years as of December 31, 2009
B
Financial Results of the Last Five Years as of December 31, 2009
As of December 31,
In millions of Euro 2005 2006 2007 2008 2009
I. Year End Financial Position
A) Called up Capital 75.4 80.9 81.9 83.4 83.4
B) Outstanding Shares (a) 98,874,172 (b) 106,117,174 107,353,774 109,317,564 109,343,294
C) Convertible Debentures 3,601,411 - - - -
II. Overall Operating Result
A) Net Revenues 103.7 105.4 113.3 138.7 144.9
B) Income before Tax, Depreciation and Provisions 82.6 138.6 51.4 271.5 195.9
C) Income Tax (27.2) (34.0) (31.4) (64.3) 17.3
D) Net Income 105.7 148.8 91.5 250.9 45.5
E) Dividends Paid 89.3 (c) 327.1 125.1 127.5 143.5 (d)
III. Operating Income per Share (in Euro)
A) Net Income before Depreciation and Provisions 1.1 (b) 1.6 0.8 3.1 1.6
B) Net Income 1.1 (b) 1.4 0.9 2.3 0.4
C) Dividends Paid per Share 0.9 (b) 3.2 1.2 1.2 1.35 (d)
IV. Staff
A) Number of Employees 9 6 7 7 8
B) Wages and Salaries 6.7 6.8 8.4 8.5 13.0
(a) Does not include the exercise of options arising from the current stock option plan. Includes 3,065,910 treasury shares held as of December 31, 2009.(b) The Board of Directors decided on April 29, 2005 to divide by four the nominal amount of the shares and to multiply by four the number of shares issued.(c) Dividends paid were €91 million less €1.7 million from treasury shares regularization.(d) This amount corresponds to the dividend proposed by the Board of Directors, before approval by the Shareholders Meeting: €1.35 per share.

2132009 Reference Document
Annex: Report of the Chairman of the Board of Directors to the Shareholders’ Meeting on the Composition, Conditions of the Preparation and Organization of the Board of Directors’ Work, the Internal Control Procedures and Risk Management Procedures Put in Place by the Company (Article L. 225-37 of the French Commercial Code)
C
1. Composition and conditions of the preparation and organization of the Board of Directors’ work. . . . 2141.1. Composition of the Board of Directors and its specialized Committees . . . . . . . . . . . . . . . . . . . . . . . . . . . . . . . . . . . . . . . . . . . . . . . . . .2141.2. Company shares held by the directors. . . . . . . . . . . . . . . . . . . . . . . . . . . . . . . . . . . . . . . . . . . . . . . . . . . . . . . . . . . . . . . . . . . . . . . . . . . . . . .2161.3. Role and Practices of the Board of Directors. . . . . . . . . . . . . . . . . . . . . . . . . . . . . . . . . . . . . . . . . . . . . . . . . . . . . . . . . . . . . . . . . . . . . . . . . .2171.4. Specifi c provisions regarding the participation in general shareholders’ meeting. . . . . . . . . . . . . . . . . . . . . . . . . . . . . . . . . . . . . . . . . . .218
2. Rules and principles determined by the Board of Directors for the compensation
and benefi ts awarded to the corporate representatives . . . . . . . . . . . . . . . . . . . . . . . . . . . . . . . . . . . . . . . . 2192.1. Compensation of the Chairman and Chief Executive Offi cer . . . . . . . . . . . . . . . . . . . . . . . . . . . . . . . . . . . . . . . . . . . . . . . . . . . . . . . . . . .2192.2. Directors’ fees granted to members of the Board of Directors . . . . . . . . . . . . . . . . . . . . . . . . . . . . . . . . . . . . . . . . . . . . . . . . . . . . . . . . . .219
3. Information pursuant to the provisions of Article L. 225-100-3 of the French Commercial Code . . . . . 220
4. Internal control procedures and risk management procedures put in place by the Company . . . . . . . . 2204.1. Internal control framework . . . . . . . . . . . . . . . . . . . . . . . . . . . . . . . . . . . . . . . . . . . . . . . . . . . . . . . . . . . . . . . . . . . . . . . . . . . . . . . . . . . . . . . .2204.2. General organization of the internal control procedures within the Group. . . . . . . . . . . . . . . . . . . . . . . . . . . . . . . . . . . . . . . . . . . . . . . .2204.3. Internal Control procedures related to the establishment and issuance of fi nancial and accounting information. . . . . . . . . . . . . . .226

214 2009 Reference Document
Annex: Report of the Chairman of the Board of Directors to the Shareholders’ Meeting
1. Composition and conditions of the preparation and organization of the Board of Directors’ workC
This report was prepared pursuant to the provisions of Article L. 225-37 of the French Commercial Code as amended by the French Act no 2008-649 of July 3, 2008. Its purpose is to describe the composition, the conditions of the preparation and the organization of the Board of Directors’ work, to present the rules and principles determined by the Board of Directors for the compensation and benefi ts awarded to the corporate representa-tives, as well as internal control procedures and risk management procedures implemented by the Group, in particular describing the procedures relating to the preparation and processing of accounting and fi nancial information for the annual and consoli-dated accounts.
This report aims to provide a description of the work conducted, undertaken or scheduled by the Company. It does not in any case intend to demonstrate that the Company has control over all the risks it faces.
This report refers to the management report which is contained in the Reference Document of the Company for the year ending
December 31, 2009, regarding the publication of the information mentioned in Article L. 225-100-3 of the French Commercial Code on the structure of the Company’s capital and on data which may have an impact in case of public offer.
This report has been prepared by the Group Internal Control Department together with the Corporate Secretary’s Offi ce. Its outline has been presented to the Internal Control Steering Committee and reviewed by the various departments of the Group Finance and Control Division. The report has been examined by the Audit Committee on February 15, 2010, and approved by the Board of Directors of the Group held on February 16, 2010.
When used in this report, the terms “Technip” and “Group” refer collectively to Technip SA and to all its directly and indirectly consolidated subsidiaries located in France and outside France.
The term “Company” refers exclusively to Technip SA, the Company’s parent company.
1. Composition and conditions of the preparation and organization of the Board of Directors’ work
Code of referenceIn accordance with Article 26 of the French Act No. 2008-649 dated July 3, 2008 regarding the adaptation of several provisions of company law to European law, the Company declares to voluntarily refer to and enforce the AFEP-MEDEF corporate governance code on listed companies of December 2008 resulting from the consolidation of the AFEP-MEDEF report of October 2003 and the AFEP-MEDEF recommendations of January 2007 and October 2008 concerning the compensation of executive directors of listed companies (hereinafter the “AFEP-MEDEF Code”). The AFEP-MEDEF Code is available on MEDEF’s internet site (www.medef.fr).
France Proxy, an independent corporate governance consultant fi rm, reviewed this Report of the Chairman of the Board of Directors, following the Company’s request, and confi rms that the Company complies with the AFEP-MEDEF Code provisions.
1.1. Composition of the Board of Directors and its specialized Committees
At December 31, 2009, the Board of Directors was made up of 11 members. It does not include any directors representing employees or employee shareholders. Three directors are of a nationality other than French.
Pursuant to Article 14-4 of the Company’s Articles of Association, the term of Board members is set at four years. This duration respects the recommendations of the AFEP-MEDEF Code.
In accordance with the recommendations of the AFEP-MEDEF Code, in order to foster smooth renewal of the Board and to prevent “renewal en masse”, and resulting from the resolution adopted at the Company’s Combined Shareholders’ Meeting on April 27, 2007, the Board of Directors, at its meeting on the same day, introduced a rolling renewal system, pursuant to which one-half of its members’ terms of offi ce should be renewed every two years.
In accordance with the recommendations of the AFEP-MEDEF Code, the characterization of “independent director” of Board members of
the Company is discussed and reviewed every year by the Board of Directors upon the Nominations and Remunerations Committee’s proposal.
At its meeting on February 16, 2009, the Nominations and Remunerations Committee examined the characterization of “inde-pendent director” of the Company’s Board members which were in offi ce at the date of this Committee with regard to the defi nition and criteria used in the AFEP-MEDEF Code.
Therefore a director is independent when he or she has no relation-ship of any kind whatsoever with the corporation, its group or the management of either that is such as to colour his or her judgment. This means besides:
not to be an employee or executive director of the corporation, or an ■
employee or director of its parent or a company that it consolidates, and not having been in such a position for the previous fi ve years;
not to be an executive director of a company in which the corpo- ■
ration holds a directorship, directly or indirectly, or in which an employee appointed as such or an executive director of the corpo-ration (currently in offi ce or having held such offi ce going back fi ve years) is a director;
not to be a customer, supplier, investment banker or commercial ■
banker: that is material for the corporation or its group; or for a signifi -cant part of whose business the corporation or its group accounts;
not to be related by close family ties to an executive director; ■
not to have been an auditor of the corporation within the previous ■
fi ve years;
not to have been a director of the corporation for more than 12 years. ■
As a practical guideline, loss of the status of independent director on the basis of this criterion should occur only upon expiry of the term of offi ce during which the 12-year limit is reached.
The Committee presented its conclusions to the Board of Directors which adopted them at its meeting on February 18, 2009.
At December 31, 2009, the Board of Directors was composed of eight independent members. It therefore exceeds the recommendations of the AFEP-MEDEF Code, which stipulates that one-half of the Board members must be independent in companies where the share capital is widely held and with no controlling shareholders.

2152009 Reference Document
Annex: Report of the Chairman of the Board of Directors to the Shareholders’ Meeting
1. Composition and conditions of the preparation and organization of the Board of Directors’ work C
At December 31, 2009, the members of the Board of Directors were the following:
NameMain positionProfessional addressAge, Nationality
Position within the Board of Directors Term
Thierry PilenkoTechnip’s Chairman and Chief Executive Offi cer6-8, allée de l’Arche – Faubourg de l’Arche – 92400 Courbevoie52 – French
Technip’s Chairman and Chief Executive Offi cer
Date of fi rst appointment: April 27, 2007Expiry of the current term of offi ce: ordinary shareholders’ meeting convened to approve the fi nancial statements for the year ending December 31, 2010.
Olivier AppertChairman of the Institut Français du Pétrole («IFP»)Institut Français de Pétrole – 1 et 4, avenue de Bois-Préau – 92852 Rueil-Malmaison Cedex60 – French
Director Date of fi rst appointment: May 21, 2003.Date of last appointment: April 27, 2007.Expiry of the current term of offi ce: ordinary shareholders’ meeting convened to approve the fi nancial statements for the year ending December 31, 2010.
Pascal ColombaniChairman of the Board of Directors of Valeo43, rue Bayen – 75017 Paris64 – French
Independent Director Date of fi rst appointment: April 27, 2007.Expiry of the current term of offi ce: ordinary shareholders’ meeting convened to approve the fi nancial statements for the year ending December 31, 2010.
Germaine GibaraChairman of Avvio Management Inc. strategic consultancy fi rmAvvio Management – 1470 Peel Street – Suite 200 – Montreal H3A 1T1 – Canada65 – Canadian
Independent Director Date of fi rst appointment: April 27, 2007.Expiry of the current term of offi ce: ordinary shareholders’ meeting convened to approve the fi nancial statements for the year ending December 31, 2010.
Gérard Hauser6-8, allée de l’Arche – Faubourg de l’Arche – 92400 Courbevoie68 – French
Independent Director Date of fi rst appointment: April 30, 2009.Expiry of the current term of offi ce: ordinary shareholders’ meeting convened to approve the fi nancial statements for the year ending December 31, 2012.
Marwan LahoudChief Strategy & Marketing Offi cer of EADS37, boulevard de Montmorency – 75781 Paris Cedex 1643 – French
Independent Director Date of fi rst appointment: April 30, 2009.Expiry of the current term of offi ce: ordinary shareholders’ meeting convened to approve the fi nancial statements for the year ending December 31, 2012.
Jean-Pierre LamoureChairman of Solétanche FreyssinetSolétanche Freyssinet – 133, boulevard National – 92500 Rueil-Malmaison60 – French
Independent Director Date of fi rst appointment: March 13, 1998.Date of last appointment: April 30, 2009.Expiry of the current term of offi ce: ordinary shareholders’ meeting convened to approve the fi nancial statements for the year ending December 31, 2012.
Daniel LebègueChairman of the Institut Français des AdministrateursIFA – Institut Français des Administrateurs – 7, rue Balzac – 75382 Paris Cedex 0866 – French
Independent Director Date of fi rst appointment: April 11, 2003.Date of last appointment: April 30, 2009.Expiry of the current term of offi ce: ordinary shareholders’ meeting convened to approve the fi nancial statements for the year ending December 31, 2012.
John O’LearyChairman and Chief Executive Offi cer of Strand Energy (Dubai)Strand Energy – PO Box 28717 – Dubai Investment Park – Dubai – UAE54 – Irish
Independent Director Date of fi rst appointment: April 27, 2007.Expiry of the current term of offi ce: ordinary shareholders’ meeting convened to approve the fi nancial statements for the year ending December 31, 2010.
Joseph RinaldiPartner in Davis Polk & WardwellDavis Polk & Wardwell – 450 Lexington Avenue – New York NY 10017 – USA52 – Australian and Italian
Independent Director Date of fi rst appointment: April 30, 2009.Expiry of the current term of offi ce: ordinary shareholders’ meeting convened to approve the fi nancial statements for the year ending December 31, 2012.
Bruno Weymuller12, rue Christophe Colomb – 75008 Paris61 – French
Director Date of fi rst appointment: February 10, 1995.Date of last appointment: April 30, 2009.Expiry of the current term of offi ce: ordinary shareholders’ meeting convened to approve the fi nancial statements for the year ending December 31, 2012.

216 2009 Reference Document
Annex: Report of the Chairman of the Board of Directors to the Shareholders’ Meeting
1. Composition and conditions of the preparation and organization of the Board of Directors’ work C
The other offi ces held by Board members are indicated in Annex A to the Reference Document of the Company for year ending December 31, 2009.
In order to assist it in exercising its duties, the Board of Directors has established four specialized Committees: an Audit Committee and a Nominations and Remunerations Committee, thereby complying with the recommendations made in the AFEP-MEDEF Code; a Strategic Committee and an Ethics and Governance Committee in order to meet specifi c concerns as permitted by the AFEP-MEDEF Code.
On December 31, 2009, the members of the four Committees were, respectively:
Audit Committee
Member Title Date of 1st appointment
Daniel LEBÈGUE Chairman May 21, 2003
Gérard HAUSER Member April 30, 2009
John O’LEARY Member April 27, 2007
Bruno WEYMULLER Member April 30, 2009
All members of the Audit Committee are competent in fi nance and accounting and three quarters were independent directors.
Nominations and Remunerations Committee
Member Title Date of 1st appointment
Bruno WEYMULLER Chairman May 21, 2003
Pascal COLOMBANI Member April 27, 2007
Germaine GIBARA Member April 27, 2007
Jean-Pierre LAMOURE Member May 21, 2003
The majority of the members of the Nominations and Remunerations Committee were independent directors.
Strategic Committee
Member Title Date of 1st appointment
Germaine GIBARA Chairman April 27, 2007
Pascal COLOMBANI Vice-President April 27, 2007
Olivier APPERT Member May 21, 2003
Gérard HAUSER Member April 30, 2009
Marwan LAHOUD Member April 30, 2009
The majority of the members of the Strategic Committee were independent directors.
Ethics and Governance Committee
Member Title Date of 1st appointment
Pascal COLOMBANI President December 9, 2008
Olivier APPERT Member December 9, 2008
Joseph RINALDI Member April 30, 2009
The majority of the Ethics and Governance Committee members were independent directors.
General management of the CompanyThe Combined Shareholders’ Meeting of April 27, 2007 appointed Thierry Pilenko to the Board of Directors for a four-year term expiring after the Shareholders’ Meeting convened to approve the fi nancial statements for the year ending December 31, 2010.
In its meeting on April 27, 2007, the Board of Directors appointed Thierry Pilenko as Chairman of the Board of Directors. At the same meeting, the Board of Directors in accordance with Article 18 of the Company’s Articles of Association, selected the combination of the offi ces of Chairman and Chief Executive Offi cer of the Company, which form of organization it determined as the best fi t for the Company, and appointed Thierry Pilenko as Chairman and Chief Executive Offi cer for the duration of his term of offi ce with the Board of Directors (i.e., until the end of the Shareholders’ Meeting convened to approve the fi nancial statements for the year ending December 31, 2010).
At December 31, 2009, the Board of Directors had appointed no Executive Vice President.
1.2. Company shares held by the directorsPursuant to the provisions of Article 14 of the Articles of Association in force at December 31, 2009, each director is required to hold at least 400 Company shares in registered form.
At December 31, 2009, to the Company’s knowledge, each of the Board members holds the following number of shares in registered form:
Members of the Board of Directors Number of Technip shares held at December 31, 2009
Thierry PILENKO 3,400
Olivier APPERT 560
Pascal COLOMBANI 400
Germaine GIBARA 400
Gérard HAUSER 900
Marwan LAHOUD 400
Jean-Pierre LAMOURE 2,004
Daniel LEBÈGUE 400
John O’LEARY 800
Joseph RINALDI 400
Bruno WEYMULLER 400
Total 10,064

2172009 Reference Document
Annex: Report of the Chairman of the Board of Directors to the Shareholders’ Meeting
1. Composition and conditions of the preparation and organization of the Board of Directors’ work C
1.3. Role and Practices of the Board of Directors
1.3.1. Role and powers of the Board of DirectorsThe Board of Directors determines the direction of the Company’s activities and oversees its implementation. Subject to the powers expressly assigned to the Shareholders’ Meetings, and within the scope of the corporate purpose, it shall take up any and all issues affecting the Company’s proper operation and shall decide in its meetings any issues concerning it.
The Board of Directors’ functioning is ruled by an internal charter which was adopted on May 21, 2003 by the Board of Directors, and is periodically updated.
In accordance with Article 17-3 of the Articles of Association of the Company, the Board of Directors conducts suitable controls and verifi cations.
It ensures, with the assistance of the Audit Committee in particular, that internal control entities are functioning properly, that the Statutory Auditors are carrying out their work in a satisfactory manner and that the specialized committees it has created are functioning properly.
The Board may establish specialized committees and determine their composition and responsibilities. These committees exercise their activities under the responsibility of the Board of Directors.At December 31, 2009, the Board was assisted by four Committees: the Audit Committee, the Nominations and Remunerations Committee, the Strategic Committee and the Ethics and Governance Committee.
The internal charter of the Board provides that it formally evalu-ates, at regular intervals of no more than three years, its operating policies. In addition, it holds a discussion regarding its operations once a year.
1.3.2. Practices of the Board of Directors
1.3.2.1. Meetings and reports of the Board of Directors
The Chairman of the Board of Directors organizes and runs the work of the Board of Directors, on which he gives a report at the Shareholders’ Meeting.
The Board of Directors meets at least four times per year, or more frequently as may be required by the circumstances. During the 2009 fi nancial year, the Board met nine times. The attendance rate for all directors was 92%.
With the exception of the Board meeting held on October 24 and 25, 2009 in a two-day Strategic Seminar in Doha (Qatar), the average duration of a Board of Directors’ meeting was approxi-mately four hours.
After examining the reports of the Audit Committee, the Strategic Committee, the Nominations and Remunerations Committee and the Ethics and Governance Committee regarding the issues within the scope of their missions, the matters on which the Board of Directors worked in 2009 included, in particular, the following:
Financial and accounting matters: ■
review and closing of the annual accounts and consolidated -fi nancial statements for the 2008 fi nancial year, the half-year
consolidated fi nancial statements and quarterly information for 2009, upon the Audit Committee’s recommendation and the Statutory Auditors’ observations;review of the press release on the fi nancial results for the -period examined;approval procedure for the engagements carried out by the -Statutory Auditors;review of the half-year fi nancial report and interim fi nancial -information;assessment of the provisional management accounts. -
Preparation for the Annual Shareholders’ Meeting: ■
Notice of the meeting, agenda and draft resolutions; -Reference Document including the Management Report of -the Board of Directors and Annual Financial Report.
Decisions, in particular, regarding: ■
the list of independent directors; -the distribution of directors’ fees; -the implementation of the AFEP-MEDEF Code; -the update of the internal charters of the Audit Committee, -the Strategic Committee and the Nominations and Remune-rations Committee;the 2010 budget; -the approval of a share subscription plan and the grant of the -fi rst tranche of this plan; the approval of a performance share plan and the grant of two tranches of this plan; the grant of a third tranche of the 2008 performance share Plan;record of the share capital increase resulting from exercises of -share subscription options.
Review, in particular, of: ■
the Group’s strategic policy over a two-day seminar; -information on the Group’s activities; -treasury forecasts; -the remuneration of the Chairman of the Board and the Chief -Executive Offi cer and of his objectives for 2009.
1.3.2.2. Board of Directors’ assessmentIn 2009, the Board of Directors implemented the measures intended to improve its operation, detailed on December 9, 2008 following the in-depth evaluation carried out in 2008.
The main consequences of these measures focused on:
the appointment of three new Board members on April 30, 2009; ■
a strategic seminar for the Board of Directors which took place ■
in Doha (Qatar) on October 24 and 25, 2009;
the updates of the internal charters of the Board of Directors’ ■
Committees on February 18, 2009.
1.3.2.3. Right to information and communication for directors
The Chairman of the Board of Directors monitors the proper func-tioning of the Company’s bodies and ensures, in particular, that directors are in a position to perform their duties. The Chairman and Chief Executive Offi cer must send to each director all docu-ments which are necessary to perform their duties.
Directors receive all the information which is useful to the exercise of their duties in accordance with the agenda prior to each Board meeting. For these purposes, the Company applies its own rule, according to which documents that will be examined in a Board meeting are circulated the week before the meeting.

218 2009 Reference Document
Annex: Report of the Chairman of the Board of Directors to the Shareholders’ Meeting
1. Composition and conditions of the preparation and organization of the Board of Directors’ work C
The Directors’ Charter adopted on May 21, 2003 and amended on December 9, 2008, provides that each director carefully prepares for Board meetings and Committees’ meetings where he or she is a member by studying the communicated documents. He can ask the Chairman of the Company, the Chief Executive Offi cer and the executive vice presidents, for all additional information that he or she deems necessary or useful. If he or she believes this is necessary, a director can ask for training on the specifi cs of the Company, its work and its business sector.
1.3.2.4. Limitation of the powers of the Chief Executive Offi cer
In accordance with Article 19-1 of the Articles of Association of the Company, the Board of Directors delegated to the Chairman and Chief Executive Offi cer all powers given by French legislation with the power to delegate these powers in specifi c areas.
1.4. Specifi c provisions regarding the participation in general shareholders’ meeting
Shareholders’ Meetings (Article 23 of the Articles of Association)
Convening and holding of Shareholders’ Meetings – DeliberationsShareholders’ Meetings shall be convened in accordance with applicable laws and regulations. Shareholders’ Meetings shall meet at the registered offi ce or at any other place specifi ed in the notice.
Shareholders’ Meetings shall be chaired by the Chairman of the Board of Directors or, in his absence, by a director so appointed by the Board of Directors, or failing which, the Shareholders’ Meeting shall appoint a Chairman.
The vote tellers’ functions are performed by two shareholders who are present and who agree to perform these duties, and who have by themselves or by proxy the largest number of votes.
The presiding committee appoints a secretary, who needs not to chosen from the members of the Meeting.
ParticipationEvery shareholder has the right, after proof of identity, to partici-pate in a the Shareholders’ Meeting, either personally, via an absentee vote, or by proxy given to another shareholder or to his or her spouse, or by sending a proxy to the Company without other instruction provided the shares are registered in the books in the shareholder’s name or in the name of the agent registered on the shareholder’s behalf pursuant to Article L. 228-1 of the French Commercial Code as of midnight of the third business day preceding the Shareholders’ Meeting in accordance with applicable regulations.
Shareholders that are legal entities are represented at Shareholders’ Meetings by their legal representatives or by any person appointed for this purpose by the latter.
Shareholders may, in accordance with applicable laws and regula-tions, send their proxy and voting forms for any Shareholders’ Meeting either on paper or by electronic means.
Any shareholder may also, provided the Board has so decided at the same time notifi cation of the meeting is given, take part in the Shareholders’ Meeting by videoconference or by telephone, in accordance with applicable regulations. Any shareholder partici-pating through one of the aforementioned means will be deemed to be present for purposes of calculating quorum and majority.
Double voting rights (Article 12 of the Articles of Association)Since November 24, 1995, double voting rights, taking into account the fraction of the share capital that they represent, have been attributed to all fully paid-up shares which can be proven to have been registered in the name of the same shareholder for at least two years.
In the event of an increase in share capital by capitalization of reserves, profi ts or premiums, double voting rights shall also be granted as from the time of their issue to registered shares granted free of charge to a shareholder in respect of the existing shares entitling such shareholder to the benefi t of such right.
Registered shares benefi ting from double voting rights that are converted into bearer form for any reason whatsoever shall lose such double voting rights.

2192009 Reference Document
Annex: Report of the Chairman of the Board of Directors to the Shareholders’ Meeting
2. Rules and principles determined by the Board of Directors for the compensation and benefi ts awarded to the corporate representatives
C
2. Rules and principles determined by the Board of Directors for the compensation and benefi ts awarded to the corporate representatives
2.1. Compensation of the Chairman and Chief Executive Offi cer
The Company’s Chairman and Chief Executive Offi cer’s compen-sation is determined by the Board of Directors, on the proposal of the Nominations and Remunerations Committee. It is composed of a fi xed portion and a variable portion.
The fi xed portion is composed of the annual base compensation on 12 months, and of a fi xed amount for travelling equal to 20% of the annual base compensation.
The variable portion of compensation is based on the fi xed compensation for the previous year. For 2009 the target variable portion was equal to 100% of the annual base compensation. 50% of the target variable portion is linked to the fi nancial performance of the Group based on 2009 operating income, 25% is linked to the achievement of individual objectives and 25% to the implementation of Group values and participation in the implementation of measures regarding Technip’s economic environment. The share of the variable portion linked to Group fi nancial performance is (i) nil if real performance is below 75% of the budgeted amount (performance fl oor), (ii) between 50% and 100% for a performance equal to 75% to 100% of the budgeted amount and (iii) between 100% and 200% for a performance equal to 100% to 115% of the budgeted amount (outperform-ance). If achieved fi nancial results are superior to the budgeted objective, a multiplier rate is calculated, up to a maximum of 2. The multiplier is calculated based on the fi nancial portion of the objectives, representing 50% of the variable portion criteria. It is then applied to the other variable portion criteria in order to calculate the fi nal variable portion, which is capped at 200% of the target variable portion.
The Chairman and Chief Executive Offi cer does not receive any directors’ fees for the positions he holds in the Group’s companies or as a Company director.
There is no specifi c retirement plan for the Chairman and Chief Executive Offi cer. The Chairman and Chief Executive Offi cer is a benefi ciary of the supplementary retirement plan for Group executives, with fi xed contributions of 8% of gross annual compensation paid up to income bracket 3, i.e., eight times the annual French Social Security limit.
The Chairman and Chief Executive Offi cer also benefi ts from the Company’s existing supplementary retirement plan for Executive
Committee members: a retirement income guarantee of 1.8% per year of service, up to a limit of 15 years, on income bracket 4 of gross annual compensation paid, i.e., exceeding eight times the French Social Security limit. The amount of gross compensation to which this retirement income guarantee applies corresponds to the average of the gross base compensation (including variable compensation within the limit of the target variable portion of 100%), received over the fi ve complete fi nancial years prior to the date of departure from the Company.
At the time of his appointment, Thierry Pilenko signed a world-wide non-compete agreement. In order to take into account the AFEP-MEDEF recommendations of October 6, 2008, the Board of Directors, in its meeting of February 18, 2009, decided to limit the indemnity amounting to a compensation of 24 months calculated from the fi xed compensation plus the target variable portion of the last 12 months, corresponding to a non-compete provision of two years.
At the same meeting, the Board decided there will be no severance indemnity for the executive director in the event his mandate is revoked or is not renewed by the Company.
The Chairman and Chief Executive Offi cer has a company car corresponding to a benefi t-in-kind.
2.2. Directors’ fees granted to members of the Board of Directors
The Combined Shareholders’ Meeting on April 30, 2009 deter-mined an amount of €440,000 to be allocated to Board members as directors’ fees for 2009 fi nancial year.
The Board of Directors determines the terms of payment of directors’ fees (jetons de présence). On the proposal of the Nominations and Remunerations Committee, the Board of Directors fi nalized the distribution of directors’ fees for 2009 as follows:
a fi xed portion and a variable portion paid according to the rate ■
of attendance at Board and Committees meetings;
directors living outside France and Chairmen of the Committees ■
receive additional fi xed compensation.
Directors (other than the Chairman and Chief Executive Offi cer) do not receive any other compensation from the Company or companies of the Group.

220 2009 Reference Document
Annex: Report of the Chairman of the Board of Directors to the Shareholders’ Meeting
3. Information pursuant to the provisions of Article L. 225-100-3 of the French Commercial CodeC
3. Information pursuant to the provisions of Article L. 225-100-3 of the French Commercial Code
Information pursuant to the provisions of Article L. 225-100-3 of the French Commercial Code are reported in the following sections of the Reference Document of the Company for the year ended December 31, 2009: Sections 4, 7.2, 14.1.1, 15, 18,
21.1.3, 21.2.2, 21.2.3, 21.2.6, and Note 7 of the Statutory Financial Statements as of December 31, 2009 included in Section 20.2 of the abovementioned Reference Document.
4. Internal control procedures and risk management procedures put in place by the Company
The scope of this report refers to the Company and all of its consolidated entities (the “Group”).
The Group’s internal control framework is derived from the Reference Framework on internal control, published by the AMF.
The attribute common to all business segments of the Group is the ability to carry out projects that are awarded by its customers, under optimal cost conditions, deadlines, reliability and safety.
In order to confront the risks inherent in its business, the Group is, and has been from the outset, equipped with an internal control structure and tools that have been developed over time based around the fundamental concept of a Project.
The Chairman and Chief Executive Offi cer, assisted by the Chief Financial Offi cer (CFO), ensures that effective control measures are deployed within the Group and that possible dysfunctions related to internal controls are subject to appropriate corrective measures. The Audit Committee of the Company monitors the assessment of internal control procedures, as well as all measures adopted to correct any signifi cant issues encountered.
4.1. Internal control frameworkThe internal control system as defi ned by the Group is based on the framework of the Committee of Sponsoring Organizations of Treadway Commission (“COSO”), and is accordingly in line with the internal control framework recommended by the Autorité des Marchés Financiers (AMF). The Group defi nes internal controls as a process implemented by the Executive Committee, the different departments/divisions of the Group and each and every employee with the objective of giving reasonable assurance that:
the Group’s corporate objectives as defi ned by corporate ■
bodies, applicable laws and regulations and the Group’s Values, standards and internal Charters are being complied with;
the accounting, fi nancial and management information ■
submitted to the Group’s corporate bodies by its affi liates as well as fi nancial reporting and consolidation, refl ect the Group’s position in a true and fair manner;
Operations are effective and resources are used in an effi cient ■
manner.
In this respect, the internal control framework that the Group has implemented contributes to managing the management of the Group’s business. However, it cannot give an absolute guarantee that risks are completely eliminated or entirely covered.
The Group’s internal control framework on the basis of the COSO defi nes internal controls according to control environment, risk assessment, control activities, information and communication and monitoring. These elements are explained hereafter.
4.2. General organization of the internal control procedures within the Group
4.2.1. Control Environment
The Board of DirectorsThe Board of Directors of the Group, assisted by its four specialized committees (Audit Committee, Nominations and Remunerations Committee, Strategic Committee and Ethics and Governance Committee) approves the main direction of the Group’s business activities and ensures its implementation. Within the scope of the Company’s objects as stated in its Articles of Association, it deals with all matters relating to the conduct of the Group’s business other than those expressly provided for by law under the powers of the shareholders’ meeting.
At December 31, 2009, the four specialized Committees instituted by the Board of Directors have their own charter describing their particular duties, responsibilities and practices.
Each of them is made up of at least three directors appointed by the Board of Directors.
They present their work to the Board of Directors in a written report.

2212009 Reference Document
Annex: Report of the Chairman of the Board of Directors to the Shareholders’ Meeting
4. Internal control procedures and risk management procedures put in place by the Company C
The Audit CommitteeThe Audit Committee’s duty is to assist the Board of Directors in ensuring the quality of internal controls and the integrity of the disclosure made to the Company’s shareholders and to the fi nancial markets.
The Audit Committee ensures the follow-up of issues regarding the generating and the control of accounting and fi nancial infor-mation and, in this respect, is mainly responsible for:
recommending the appointment and compensation of ■
Statutory Auditors to the Board of Directors, as well as ensuring their independence;
analyzing the assumptions used in the closing of accounts and ■
reviewing the Company’s fi nancial statements and the consoli-dated annual and interim fi nancial statements or information prior to the Board of Directors’ review by remaining informed of the fi nancial situation, liquidity and commitments of the Company;
evaluating the internal control procedures as well as any other ■
measures adopted to correct any signifi cant problems encoun-tered in the internal control;
evaluating the relevance of the risk analysis procedures; ■
examining the procedures required to be implemented regarding ■
the receipt, retention and treatment of complaints regarding accounting, internal accounting controls or auditing matters, as well as documents sent anonymously and confi dentially by employees raising concerns regarding questionable accounting or auditing matters.
The Audit Committee may interview the Chairman and Chief Executive Offi cer and interview or visit any operational or functional business heads in order to carry out its duties. The Committee may in particular interview any person involved in the fi nancial statements preparation or control processes (Finance and Control Heads, Internal Control Head, General Counsel).
The Committee also interviews the Statutory Auditors. It may do so without the presence of the management of the Company.
The Committee meets at least four times per year. The Committee met fi ve times during the 2009 fi nancial year and had an attend-ance rate of 100% for all members.
The Nominations and Remunerations CommitteeIn accordance with the recommendations of the AFEP-MEDEF Code, the Chairman and Chief Executive Offi cer, the only execu-tive offi cer, is not a member of the Committee.
The Nominations and Remunerations Committee conducts preparatory work on appointments of Board members and corpo-rate offi cers, compensation policy and the policy for granting share subscription or share purchase options.
This Committee is mainly responsible for the following:
making recommendations to the Board of Directors for the ■
appointment of directors, the Chairman, the Chief Executive Offi cer and other executive vice presidents (directeurs généraux délégués), as necessary;
examining executive compensation policies implemented in ■
the Group and the compensation of senior management, proposing the compensation of the Chairman, the Chief Executive Offi cer and other executive vice presidents, as appro-priate, and preparing a report on the foregoing.
This Committee proposes to the Board of Directors, on an annual basis, a list of directors qualifi ed as “independent” directors” pursuant to applicable rules and recommendations.
The Committee may seek proposals from the Company’s Chairman and Chief Executive Offi cer.
The Chairman and Chief Executive Offi cer of the Company participates in all the meetings but not the deliberations that relate to him.
Subject to confi dentiality requirements in respect of its work, the Committee can ask the Chairman and Chief Executive Offi cer for the assistance of any executives whose expertise may be relevant to the Committee’s agenda.
The Committee meets at least twice a year. The Committee met six times during 2009 fi nancial year. Its attendance rate was 92%.
The Strategic CommitteeThe Strategic Committee assists the Board of Directors in exam-ining and making decisions on major transactions related to the Group’s main strategic objectives.
In this context, the review of the Group’s investment budget as well as the examination of any major asset acquisitions or dispo-sitions belong to missions of this Committee.
The Committee may seek proposals from the Company’s Chairman. The Chairman and Chief Executive Offi cer participates in the meetings.
The Committee can ask the Chairman and Chief Executive Offi cer for the assistance of any executive whose expertise may be relevant to the Committee’s agenda.
The Committee meets at least twice a year. The Committee met three times during the 2009 fi nancial year. The attendance rate was 100% for all members.
The Ethics and Governance CommitteeThe Committee assists the Board of Directors in promoting within the Group best practices regarding governance and ethics.
Directors who are not members of this Committee can freely participate in the Committee’s meetings.
The Committee can ask the Chairman and Chief Executive Offi cer for the assistance of any executives whose expertise may be relevant to the Committee’s agenda.
The Committee meets at least twice a year. The Committee met three times during the 2009 fi nancial year. The attendance rate was 100%.
The executive managementThe Chairman and Chief Executive Offi cer implements the orientations determined by the Board of Directors. The Chairman and Chief Executive Offi cer is at the head of the Group’s corpo-rate management and is assisted by the Executive Committee (EXCOM).
The Chairman and Chief Executive Offi cer and the EXCOM have a central coordination role that signifi cantly infl uences the control environment and provides the “tone at the top”. Through their responsibilities, they ensure that the internal control system is in place and operative.

222 2009 Reference Document
Annex: Report of the Chairman of the Board of Directors to the Shareholders’ Meeting
4. Internal control procedures and risk management procedures put in place by the CompanyC
The EXCOM is assisted by two specialized committees:
the Committee on Sustainable Development: in charge of ■
driving and measuring the Group’s progress in its sustainable development strategy; and
the Disclosure Committee: in charge of assisting the Chairman ■
and Chief Executive Offi cer and the CFO in their duties to ensure the respect of the laws and regulations applicable to listed companies in order to give a true and fair view of the fi nancial statements.
All the Group’s activities are governed by the rules set out in the statement of the Group’s Values. The Values of the Group refer to integrity, professional excellence, protection of health, safety, and the environment, as well as civic and social responsibility. The Group is furthermore committed to support and promote the principles of the United Nations Global Compact regarding human rights, labor, environment and ethics within its sphere of infl uence. The Group’s core Values are set out in six Charters: Ethics Charter, Social Charter, Environmental Charter, Health and Safety Charter, Quality Charter and Security Charter.
The Group is committed to translating the Group’s Values and the Ethics Charter in particular into operational reality for all staff and its relationship with its stakeholders such as contractors, suppliers and partners in all countries where the Group operates.
The Ethics and Compliance Committee reports directly to the Chairman and CEO of Technip. It ensures that the Group’s Ethics Charter and all internal regulations derived therefrom are prop-erly adhered to. The Ethics and Compliance Committee makes proposals to the Chairman and Chief Executive Offi cer of the Group and the Board of Directors of the Company concerning ethics and compliance. The Ethics and Compliance Committee also organizes reports from the managers of the Regions on how the Charter is being applied. In addition, any employee can refer an issue to the Ethics and Compliance Committee on any subject relative to the principles set forth in the Ethics Charter. A whistle-blowing procedure provides a structure to report confl icting / non-complying situations in the fi nancial, accounting and anti-bribery areas. The Ethics and Compliance Committee is chaired by the Group Compliance Offi cer.
At the executive level, directors and senior managers have signed the Code of Ethics applicable to the Group’s Directors, Executive Management and Senior Financial Offi cers. Senior Management has circulated a “No Gift Instruction” to employees worldwide and communicates “Rules of Good Conduct relating to the communication and the use of privileged information’’.
Finally, annual employee appraisals refer to ‘‘analysis of skills and professional behavior’’ with individual commitment to ethical values.
Applying the Group’s strategic directions, a new organizational structure was decided with effect as of October 1, 2007 and is based on seven regions with full P&L accountability and a vertically integrated Subsea business unit. This organization has been set out by the Chairman and Chief Executive Offi cer of the Company in an organization note defi ning the strategic frame-work, the organizational objectives and principles.
4.2.2. Risk ManagementAll risks the Group faces (risks related to the Group and its activi-ties, to the Group’s industry, regulatory and legal risks, industrial and environmental risks, credit/counter-party risks, liquidity risks and market risks as detailed in Section 4 of this Reference Document) are subject to risk assessment and risk management measures at the different levels of the organization from the Corporate Divisions down to the Regions, entities and Projects.
Regional OrganizationThis organization is based on the “Principle of Regionality”, which is the principle of delegation of management responsibility to the appropriate level whereas all day to day operations are under the responsibility of the Regions.
As the Group’s core operational unit, the Region is defi ned by a territory, its operational resources (commercial and performance) and its projects. It is in charge of customer relations, the comple-tion of its projects and their fi nancial performance.
Seven Regions have been defi ned with their respective activities, headquarters and current operating centers:
Regions Headquarters Business Segments
Region A:Western Europe, Africa, India, Pakistan
Paris SubseaOnshoreOffshore
Region B:Italy, Greece, Eastern Europe/Russia/CIS, South America
Rome Onshore
Asia-Pacifi c Kuala Lumpur SubseaOnshoreOffshore
North Sea, Canada Aberdeen Subsea
North America Houston SubseaOnshoreOffshore
Brazil Rio de Janeiro SubseaOffshoreOnshore
Middle East:United Arab Emirates, Qatar, Oman, Yemen, Saudi Arabia, Jordan, Syria, Iraq, Bahrain, Kuwait
Abu Dhabi SubseaOnshoreOffshore

2232009 Reference Document
Annex: Report of the Chairman of the Board of Directors to the Shareholders’ Meeting
4. Internal control procedures and risk management procedures put in place by the Company C
In addition, the Product Business Units (PBUs) are entities that work toward the growth and development of technologies and expertise throughout the Group. They take part in the preparation of sales proposals and assist the Regions. They are not directly responsible for a specifi c profi t account but must have a global vision of the operations and their profi tability in order to establish benchmarks and propose mid- to long-term strategies.
The Subsea business segment, an integrated business (Research and Development, design/engineering, manufacturing and instal-lation with its own assets), calls for a unique structure. Strategic management of R&D operations, the fl eet, the plants and their scheduled expansion has been entrusted to an integrated Business Unit that reports directly to the Chief Operating Offi cer (COO). Project management is handled by the Regions.
The Middle East Region has been operational since March 31, 2009. It was created to better respond to the Middle East Onshore and Offshore market with respect to business develop-ment, proposal and project execution activities. The Middle East Region manages autonomously small and medium size projects while large size projects are managed in coordination with the Region A and Region B.
Group DivisionsUnder the authority of the Chairman and Chief Executive Offi cer of the Company, the Group is organized around Corporate Divisions. Each division helps to assess and mitigate the risks the Group is subject to in its respective scope of responsibility.
In an effort to assess and manage risks with respect to the operations of the Group, the COO is in charge of the entire operational structure, business and realization resources. This includes commercial operations, Business Development, Projects, engineering and construction resources, support and technology development resources.
The General Counsel, to whom the Legal Division and the Group ■
Corporate Secretary Offi ce report, is responsible for all legal matters within the Group and for the defi nition of the Group’s legal strategy and policy and prepares and oversees, among others, the Group’s contracting policies, assesses the terms and legal risks of contracts, manages any litigation arising from the performance of contracts and is in charge of the subscription and renewal of insurance policies in order to minimize the contractual risks to which the Group is subject.
The Group Compliance Offi cer reports to the General Counsel ■
and the Board of Directors through the Ethics and Governance Committee. He is responsible for ensuring the application of the Ethics Charter and the effective implementation and enforce-ment of applicable anti-corruption and compliance policies. He may raise some issues to the Chairman of the Technip Ethics and Governance Committee.
The Human Resources Division is responsible for managing the ■
Group’s human resources (recruitment, training, career and skill management, and remuneration) in order to ensure that the Group attracts, retains the necessary personnel and participates in its professional development.
The Communication Division, except fi nancial communica- ■
tions, both within and outside the Group, was until June 2009, managed by the Human Resources and Communications Division. This Division now reports directly to the Chairman and the CEO.
The Global Processes and Development Division was responsible ■
until March 2009, for of assessing and mitigating risks related to Health, Safety and the Environment, Quality and Methods, Security, Information Technology and Procurement. In addition, the Global Processes and Development Division was respon-sible for the Operational Audit Function (see below) and was involved in merger and acquisition operations.
Since April 2009, HSE and Security report to the Chairman and ■
CEO directly, Quality and Methods and Global Procurement to the COO, Information Technology, Operational Audit (now integrated in the Internal Audit) and Strategy, to the CFO.
The Finance and Control Division, under the supervision of the ■
Chief Financial Offi cer (CFO), monitors the fi nancial market risks concerning the Group’s fi nancing and the fi nancial engineering of Projects, prepares individual and consolidated fi nancial statements as well as management accounts, is in charge of tax management, internal audit, fi nancial communications and investor relations. It also supervises the Strategy Division.
The Department of New Technologies is in charge of identifying ■
future technologies and proposing actions for development in order to develop differentiated know-how and technologies, while anticipating the developments necessary to meet future challenges in gas, heavy oil, ultra-deepwater subsea production and ever increasing scale of infrastructure.
Group Internal AuditThe Internal Audit assists the Chief Financial Offi cer in evaluating and improving the effectiveness of risk management, control and governance process. It carries out its duties within the framework defi ned by Technip in the Internal Audit Charter and in compliance with the Internal Audit Plan issued at the beginning of each year, which takes into consideration mapping of activities and risks, as well as the rotation of audits performed.
Moreover the Internal Audit monitors the implementation of the corrective action plans defi ned accordingly to its audits.
Corporate Risk ManagementDirectly reporting to the Chairman and Chief Executive Offi cer, the Senior Vice President Corporate Risk Management is respon-sible for the monitoring of risk processes, tools and evaluation for the Group. The fi rst phase of his mission was focused on Project risks with the objective of ensuring that appropriate tools and processes are defi ned, reviewed and implemented consistently across the Group and in all segments of activity. This phase is now complete and operating in all Group entities. As a second phase, Portfolio and Enterprise Risk Management processes are being reviewed and rolled out across the Group.
Risk Management of ProjectsRisk assessment is directed by the Group Divisions across the Regions and the other structures of the Group down to the level of each individual Project.
Before bidding, Technip estimates its costs and analyzes the technical, commercial, fi nancial and legal aspects of the project.
Furthermore, in each Project where the services of a local partner are needed, Technip Compliance Policy requires an investigation into the background and reputation of its prospective partners to give it a factual basis for concluding that the partner is capable

224 2009 Reference Document
Annex: Report of the Chairman of the Board of Directors to the Shareholders’ Meeting
4. Internal control procedures and risk management procedures put in place by the CompanyC
of performing the services and will do so in a manner that fully complies with Technip’s Anti-Corruption Policy.
Each bid must be authorized by management through an Authorization to Tender (“ATT”). Once the bid is submitted, the previous cost evaluation and fi nancial and legal analysis are updated. The contract cannot be entered into without an Authorization to Commit (“ATC”). Regional Bid Authorization procedures have been issued to defi ne the authority threshold and approval levels within the Regions’ scope of responsibility.
In addition to the risk assessment process at tender stage, risks are regularly assessed during the Project execution including through Project reviews.
4.2.3. Control ActivitiesIn order to prevent and mitigate risks related to fi nancial reporting, operations and the Group’s assets, control activities occur at all levels and in all functions throughout the Group. These activi-ties include a range of controls such as checking the accuracy, completeness, authorization, validation and recording of transac-tions and ensuring the duties are segregated among different people to reduce the risk of error or fraud.
Control activities are foremost organized at Group, regional, subsidiary, and/or Project levels in different areas including:
Organizational structures and responsibilities are defi ned and ■
documented, business objectives are reviewed, key perform-ance indicators are monitored, tenders and newly appointed partners are duly authorized, regular Project and asset reviews are organized at entity/regional/Group level, and invoicing to clients is monitored and approved;
Segregation of incompatible duties is monitored with respect to ■
custody of assets, authorization of transactions, and recording and control procedures;
Budgets and forecasts are reviewed according to Group objectives; ■
Reconciliations are performed between physical assets with ■
corresponding accounting records and signifi cant variances are investigated and appropriate adjustments performed;
The principle of double signature on disbursements vis-à-vis ■
third parties is respected;
Reporting instructions and rules exist to minimize biases that may ■
affect signifi cant accounting estimates and other judgments;
Project cost control data is regularly reconciled with accounting ■
records;
Closing entries and IFRS adjustments are duly checked, margin ■
recognition calculations approved and consolidation packages reviewed.
Competency and experience requirements for key personnel are defi ned and documented and standards and procedures are applied for the entire employment contract cycle. Training/orien-tation is provided to newly hired personnel. Personnel turnover is monitored. Checks and reconciliations are performed in the payroll chain from timesheets over payroll preparation, pay slip issuance to payment.
Delegations of authority for decision-making and commitment of the Group vis-à-vis third parties are formalized, reviewed regularly and updated. Permanent procedures are managed, adjusted and reviewed.
Prospective suppliers are qualifi ed and selected on the basis of bid tabulations approved by authorized personnel according to power reserve lists. Commitments are duly authorized, invoices recon-ciled with work done /goods delivered and approved. Payments verifi ed and accounting records checked.
Concerning IT security, controls exist to ensure that data is acces-sible to authorized persons, data is not changed by uncontrolled actions, actions are logged and the respective persons identifi ed and data is not seen by unauthorized persons. Controls ensure that key users validate changes and are the only ones authorized to request release to production.
In the framework of the internal control evaluation, control activi-ties are subject to updated internal control documentation and testing according to a self-assessment approach throughout the different organizations of the Group, from the Group Divisions, to the Regions, entities and projects and in the following areas:
Control Environment: Business & Organization, Finance, Human ■
Resources, Permanent Procedures & Policies, Corporate Bodies, Ethics & Integrity, Internal Audit;
Business processes: revenues, purchasing, procurement, payroll, ■
capital expenditure, inventories, manufacturing, subcontracting, cost control, treasury, fi nancial control, consolidation, tax;
Information Technology: safety, operations and change ■
management.
4.2.4. Information and CommunicationInformation & Communication is an integral part of the Group’s internal control framework as the Group is committed to trans-late its Values and internal control practices into the operational reality for all staff and its relation with stakeholders such as suppliers and partners in all countries where the Group operates.
The management of the Group reference framework and its related documentation is coordinated by the Group Quality function. Permanent procedures and policies are categorized according to four different levels: the Golden Book, Group Operating Principles and Standards and Group Instructions, Group Business Guidelines and Regions’ Management Principles and Responsibilities.
The Golden Book is intended to give a comprehensive overview of the Group’s management principles and responsibilities:
the Group’s Core Values encompassing its Ethics, Social, Environ- ■
mental, Health and Safety, Security and Quality Charters;
the Core Management Principles and structure of the Group ■
including the mission of the Regions; and
the mission of Corporate Functions. ■
The management principles in this Golden Book are valid for all entities controlled by the Group and are applied throughout the Group.

2252009 Reference Document
Annex: Report of the Chairman of the Board of Directors to the Shareholders’ Meeting
4. Internal control procedures and risk management procedures put in place by the Company C
The Group Operating Principles and Standards (GOPS) and Group Instructions are the collection of all general instructions, rules and procedures which are applicable throughout the Group. The GOPS are classifi ed into sections, each section being related to one corporate function. In addition, to the GOPS, Group Instructions may be issued from time to time by the members of the Executive Committee or people acting on their behalf. Group Instructions are more detailed instructions for application of business matters on a day-to-day basis and are aimed at specialized areas.
To facilitate compliance with the GOPS, Corporate Functions issue and communicate Group Business Guidelines, that are recommended for support purposes but not mandatory, in order to capitalize on “best practices” and support Operating Centers to improve the operational performance.
The requirements stated in the Golden Book, GOPS and Group Instructions are mandatory across the Group and provide the overreaching framework within which the Regions exercise their operational autonomy. Regions issue as well their own detailed Management Principles and Responsibilities as they see fi t, as do the sub-divisions of the Regions (Business Units/Projects).
The dissemination of information within the Group (except for fi nancial communication) as well as public relations was coor-dinated until June 2009 by the former Human Resources and Communications Division. Since June 2009, public relations and internal communications have been coordinated and monitored by the newly created Communication Department.
The Investor Relations Department centralizes fi nancial commu-nications and oversees that investors and the public receive fair, complete and accurate information on the Group’s fi nancial and operating performance in accordance with the French legisla-tion and the French Financial Market Authority’s (AMF) General Regulations.
Another point in the internal control framework of the Group with respect to the development of the Group’s knowledge and talent is Technip University. The Technip University strives to promote expertise and capitalize on know-how, develop managerial skills, share a multicultural environment and facilitate integration.
The Information Technology (IT) Department has the responsibility among others, to improve IT and communication tools, to ensure the systems and data security, and to ensure the convergence of IT systems in all units.
4.2.5. Monitoring
Audit CommitteeThe Audit Committee has a central oversight role in order to ensure that the internal control system is in place and opera-tive as it enables the Board of Directors to ensure the quality of internal controls as well as the integrity of the information disclosed to shareholders and fi nancial markets.
The yearly Internal Control assessment report and the report of the Chairman of the Board of Directors to the shareholders meeting on the internal control procedures and risk management procedures put in place by the Company were presented to the Audit Committee in 2009.
ManagementThe Group’s Management is responsible for the implementation and evaluation of internal control mechanisms. In this regard, management, at different levels of the decision-making process, maintains internal control documentation which corresponds to the operational realities of their activities. In addition, management is responsible for ensuring that the controls are operating effectively and for monitoring their operation on a self-assessment basis. This self-assessment of internal controls is based on questionnaires regarding the control environment and on risk and control matrices for controls related to IT (Information Technologies) and transactions.
As part of the annual evaluation process, each Regions’ Senior Vice President and CFO, as well as the managers of the Corporate function, are required to confi rm, in a representation letter, that, to their knowledge the internal control system has functioned effectively during the reporting period. In addition, each signatory is required to confi rm at the end of the third quarter of every year that the action plans defi ned following the previous year’s assessment have been implemented.
Group Internal AuditThe function of Group Internal Audit to ensure the proper opera-tion of the Group and to recommend improvements.
The scope of the internal audit function encompasses the evaluation of the effectiveness of the system of internal controls through audits of specifi c Projects, Regions, Processes and overlapping subjects on Group level. On December 31, 2009, the Group Internal Audit Department was composed of a staff of nine persons.
Internal Control FunctionThe Internal Control Function’s objective is to ensure that processes designed to avoid potential misstatements in fi nancial statements, errors and fraud are properly conducted in compli-ance with rules, procedures and instructions.
The Internal Control Function’s principal objective is helping Regions and Group Functions improve their controls, including where possible the underlying processes, and ensuring that the Regions and Group Functions have appropriate and robust verifi -cation and certifi cation procedures. Specifi c tasks carried out by the Internal Control Function are further described in Section 4.3.3 of this Report of the Chairman of the Board of Directors to the Shareholders’ Meeting.

226 2009 Reference Document
Annex: Report of the Chairman of the Board of Directors to the Shareholders’ Meeting
4. Internal control procedures and risk management procedures put in place by the CompanyC
GROUP INTERNAL CONTROL ■
The Group Internal Control Department, with a staff of fi ve employees. It assists in the implementation of Group procedures and guidelines to address structural/systemic internal control issues at the Group level and, contributes to the sharing of best practices among the different organizations of the Group.
Furthermore the Internal Control Department coordinates a coherent assessment of internal controls throughout the Group based on a risk map of the control environment, business processes and information technologies. It is also responsible for coordinating the implementation and follow up of action plans with the support of the regional internal controllers and IT internal control correspondents for IT issues.
The progress and results of the internal control evaluation are regularly presented to a dedicated Group Internal Control Steering Committee composed of members of the Group Divisions and Regional Management. It is chaired by the CFO. The Group Internal Control Steering Committee met three times in 2009.
The rigorousness and level of detail in the evaluation is adapted to the size and importance of each entity. Entities with the most contribution and/or risk must provide more information and answer more questions in the self-assessment process than those with less contribution or risk.
Where the results of the self-assessment indicate that controls are not at the required level either in design, operation or docu-mentation, corrective action plans are required to be put in place. Each action plan must have a detailed timetable to complete the action and update the required control. The progress of action plans is regularly followed.
The Group’s long-term objective is two-fold: continuous analysis and improvement of internal control mechanisms. An important step was taken in 2009 towards embedding internal control evalu-ations directly into our tailored IT tool. The computerization of the process allows each organization within the Group to monitor its internal control processes, to assess them on a regular basis and to report them to the Group Internal Control Department.
REGIONAL INTERNAL CONTROL ■
In an effort to further embed internal control within the Regions and the Group Functions, seven Regional internal controllers have been appointed in 2009, among an already existing network of 39 Internal Control correspondents appointed by each entity within the scope of the evaluation.
The Regional Internal Controller is in charge of coordinating and planning the self-assessment internal control testing with the specifi c departments and entities of the Regions. He also moni-tors the implementation of remediation plans.
4.3. Internal Control procedures related to the establishment and issuance of fi nancial and accounting information
The objective of the internal control procedures regarding fi nan-cial and accounting information is to ensure that the accounting, fi nancial and management information submitted to the Group’s corporate bodies by its affi liates as well as group fi nancial reporting and consolidation, refl ect the Group’s position in a true and fair manner.
Under the responsibility of the CFO production of fi nancial infor-mation is organized by the Group Consolidation and Accounting Department and relies on the different fi nance and control func-tions located in every entity.
4.3.1. Accounting standardsThe consolidated fi nancial statements comply with IFRS. At the corporate level, all teams responsible for the preparation of fi nan-cial information are informed of changes in IFRS and regulatory issues. Changes in accounting methods from comparison with the last closing period are highlighted at the beginning of the quarterly closing instructions sent to each entity.
A Group Chart of Accounts Manual is updated every year and communicated to all participants in the consolidation process. In addition, GOPS relating to IFRS are updated regularly and are available on the Group’s intranet.
4.3.2. Accounts closing processIt is the responsibility of the local CFO to supervise the fi nancial reporting process and the preparation of quarterly consolidation. The CFOs of the Regions monitor the fi nancial reporting process for the entities within their scope of responsibility.
The accounts of the subsidiaries are prepared according to the Group accounting standards. An integrated IT application is used to consolidate the fi nancial statements of the Group. When reporting packages are submitted for consolidation, each entity acknowledges the receipt of instructions, the package approval by the local CFO, the application of the Group Chart of Accounts Manual as well as of Group Accounting Principles.
Beginning with the preparation of the fi nancial statements for the year ended December 31, 2009, the Region CFOs are required to confi rm by email that to the best of their knowledge the contribu-tion to the Group’s consolidated income from companies in their scope of consolidation as recorded in the consolidation software (HFM), as well as the management accounts as they appear in the internal reporting software system (Together), constitute a complete and accurate presentation of the operating results and order intake of the Region. This sign off procedure applies to annual and half-yearly closings.

2272009 Reference Document
Annex: Report of the Chairman of the Board of Directors to the Shareholders’ Meeting
4. Internal control procedures and risk management procedures put in place by the Company C
On a quarterly basis, the Group Consolidation and Accounting Department establishes the consolidated fi nancial statements, i.e. the consolidated balance sheet, the consolidated income statement, consolidated statements of changes in equity and consolidated cash fl ow. For annual information, a full set of fi nancial accounts, including notes is issued.
For the preparation of consolidated fi nancial statements, the Group Consolidation Department relies foremost on the input of the departments of Corporate Business Finance, Financial Control of the Subsea Division, Group Tax and Legal Entities and Treasury.
The Corporate Business Finance Department together with Financial Control of the Subsea Division, ensures a full analysis of project results and their impact on the fi nancial statements. The Treasury Department analyzes the Group’s cash position and the Group Tax and Legal Entities Department calculates the recorded taxes, deferred tax assets and liabilities and monitors the tax proof process.
The external auditors perform a review of the quarterly fi nan-cial information with cut-off dates of March 31, June 30 and September 30. The limited examination of the half-year accounts as of June 30 is subject to a report of the external auditors with respect to the fi nancial information of the fi rst six months of the year.
The fi nancial statements as of December 31 are subject to detailed audit procedures that are foremost formalized by the Report of the external auditors.
The quarterly fi nancial statements, the half-year accounts and the fi nancial statements at the year ending December 31 are presented to the Audit Committee and approved by the Board of Directors.
4.3.3. Annual assessment process of procedures for the production of the Group fi nancial statements and other accounting and fi nancial information
The assessment of the effectiveness of the internal controls and procedures for the preparation of accounting and fi nancial infor-mation is part of the annual Group internal control appraisal.
The tasks carried out consist of:
selecting and identifying the entities and processes that make ■
a signifi cant contribution to the preparation of the Group’s accounting and fi nancial information;
documenting processes considered important for the prepara- ■
tion of the fi nancial statements;
identifying the risks associated with these processes to help ■
improve fraud prevention;
defi ning and documenting the existence of key controls to ■
cover these major risks;
assessing the effectiveness and implementation of the controls ■
through the analysis carried out by the Group internal control on test results obtained through the self-assessment internal control testing.
These actions gave us the support process to conduct an in-depth assessment of our internal control system over fi nancial reporting.

228 2009 Reference Document
Annex: Statutory Auditors’ report, prepared in accordance with article L. 225-235 of the French Commercial Code on the report prepared by the Chairman of the Board of Technip
D
This is a free translation in English of the Statutory Auditors’ report issued in the French language and is provided solely for the convenience of English speaking readers. This report should be read in conjunction with, and construed with, French law and professional auditing standards applicable in France.
PricewaterhouseCoopers Audit
63, rue de Villiers92208 Neuilly-sur-Seine Cedex
France
ERNST & YOUNG et Autres
41, rue Ybry92576 Neuilly-sur-Seine Cedex
France
Statutory Auditors’ report, prepared in accordance with article L. 225-235 of the French Commercial Code on the report prepared by the Chairman of the Board of Technip
For the Year Ended December 31, 2009To the Shareholders,
In our capacity as Statutory Auditors of Technip, and in accordance with article L. 225-235 of the French Commercial Code (Code de commerce), we hereby report to you on the report prepared by the Chairman of your company in accordance with article L. 225-37 of the French Commercial Code for the year ended December 31, 2009.
It is the Chairman’s responsibility to prepare, and submit to the Board of Directors for approval, a report describing the internal control and risk management procedures implemented by company and providing the other information required by articles L. 225-37 of the French Commercial Code in particular relating to corporate governance.

2292009 Reference Document
Annex: Statutory Auditors’ report, prepared in accordance with article L. 225-235 of the French Commercial Code on the report prepared by the Chairman of the Board of Technip D
It is our responsibility:
to report you on the information set out in the Chairman’s report on internal control procedures relating to the preparation and ■
processing of fi nancial and accounting information; and
to attest that the report sets out the other information required by article L. 225-37 of the French Commercial Code, it being specifi ed ■
that it is not our responsibility to assess the fairness of this information.
We conducted our work in accordance with professional standards applicable in France.
Information concerning the internal control procedures relating to the preparation and processing of fi nancial and accounting informationThe professional standards require that we perform procedures to assess the fairness of the information on internal procedures relating to the preparation and processing of fi nancial and accounting information set out in the Chairman’s report. These procedures mainly consisted of:
obtaining an understanding of the internal control procedures to assess the fairness of the information on internal procedures relating ■
to the preparation and processing of fi nancial and accounting information on which the information presented in the Chairman’s report is based, and the existing documentation;
obtaining an understanding of the work performed to support the information given in the report and of the existing documentation; ■
determining if any material weaknesses in the internal control procedures relating to the preparation and processing of fi nancial and ■
accounting information that we may have identifi ed in the course of our work are properly described in the Chairman’s report.
On the basis of our work, we have no matters to report on the information given on internal control procedures relating to the prepara-tion and processing of fi nancial and accounting information, set out in the Chairman of the Board’s report, prepared in accordance with article L. 225-37 of the French Commercial Code.
Other informationWe attest that Chairman’s report sets out the other information required by article L. 225-37 of the French Commercial Code.
Neuilly-sur-Seine, March 17, 2010
The Statutory Auditors
PricewaterhouseCoopers Audit
Louis-Pierre Schneider
ERNST & YOUNG et Autres
Nour-Eddine Zanouda

230 2009 Reference Document
1. Agenda . . . . . . . . . . . . . . . . . . . . . . . . . . . . . . . . . . . . . . . . . . . . . . . . . . . . . . . . . . . . . . . . . 230Within the Authority of the Ordinary Shareholders’ Meeting . . . . . . . . . . . . . . . . . . . . . . . . . . . . . . . . . . . . . .230Within the Authority of the Extraordinary Shareholders’ Meeting . . . . . . . . . . . . . . . . . . . . . . . . . . . . . . . . . .230Within the Authority of the Combined Shareholders’ Meeting . . . . . . . . . . . . . . . . . . . . . . . . . . . . . . . . . . . . .231
2. Presentation of the Resolutions . . . . . . . . . . . . . . . . . . . . . . . . . . . . . . . . . . . . . . . . . . . . 2312.1. Presentation of resolutions relevant to the Ordinary Shareholders’ Meeting . . . . . . . . . . . . . . . . . . . . . . . . .2312.2. Presentation of resolutions relevant to the Extraordinary Shareholders’ Meeting . . . . . . . . . . . . . . . . . . . . . . . 232
3. Proposed Resolutions. . . . . . . . . . . . . . . . . . . . . . . . . . . . . . . . . . . . . . . . . . . . . . . . . . . . . 236Within the authority of the Ordinary Shareholders’ Meeting . . . . . . . . . . . . . . . . . . . . . . . . . . . . . . . . . . . . . .236Within the authority of the Extraordinary Shareholders’ Meeting . . . . . . . . . . . . . . . . . . . . . . . . . . . . . . . . . .238Within the authority of the Combined Shareholders’ Meeting . . . . . . . . . . . . . . . . . . . . . . . . . . . . . . . . . . . . .242
Annex: Agenda, Presentation of the Resolutions and Proposed Resolutions
E
1. Agenda
Within the Authority of the Ordinary Shareholders’ Meeting1. Approval of the statutory fi nancial statements for the fi scal
year ended December 31, 2009.
2. Allocation of earnings for the fi scal year ended December 31, 2009, setting the dividend amount and the dividend payment date.
3. Approval of the consolidated fi nancial statements for the fi scal year ended December 31, 2009.
4. Special report of the Statutory Auditors on the regulated agreements and commitments referred to in Articles L. 225-38 et seq. of the French Commercial Code.
5. Directors’ attendance fees.
6. Appointment of a Statutory Auditor.
7. Appointment of a Statutory Auditor.
8. Appointment of an Alternate Statutory Auditor.
9. Appointment of an Alternate Statutory Auditor.
10. Ratifi cation of transfer of Registered Offi ce.
11. Authorization granted to the Board of Directors for the repur-chase of Company shares.
Within the Authority of the Extraordinary Shareholders’ Meeting12. Authorization granted to the Board of Directors to reduce the
share capital by canceling shares that have previously been repurchased.
13. Authorization granted to the Board of Directors to allocate performance shares to (i) Technip’s employees, and (ii) the employees and directors and offi cers (mandataires sociaux) of companies related to the Company within the meaning of Article L. 225-197-2 of the French Commercial Code.
14. Authorization granted to the Board of Directors to allocate performance shares to the Chairman of the Board of Directors and/or the Chief Executive Offi cer of Technip (mandataire social).
15. Authorization granted to the Board of Directors to grant options for the purchase or subscription of shares to (i) Technip’s employees, and (ii) the employees and directors and offi cers (mandataires sociaux) of the companies related to the Company within the meaning of Article L. 225-180 of the French Commercial Code.
16. Authorization granted to the Board of Directors to grant options for the purchase or subscription of shares to the Chairman of the Board of Directors and/or the Chief Executive Offi cer of Technip (mandataire social).

2312009 Reference Document
Annex: Agenda, Presentation of the Resolutions and Proposed Resolutions
2. Presentation of the Resolutions E
17. Authorization granted to the Board of Directors to increase the share capital in favor of employees adhering to a company savings plan.
Within the Authority of the Combined Shareholders’ Meeting18. Powers for formalities
2. Presentation of the Resolutions
First, second and third resolutions
Approval of the statutory fi nancial statements and allocation of earnings
The purpose of the fi rst resolution is to approve Technip SA’s statutory fi nancial statements for the 2009 fi scal year.
The purpose of the second resolution is to determine the allocation of Technip SA’s earnings and set the dividend for the 2009 fi scal year at €1.35 per share and the payment date on May 11, 2010. The following dates shall apply for the payment of dividends:
Ex-Date: May 6, 2010 (morning); ■
Record Date: May 10, 2010 after close of market. ■
Pursuant to Article 243 bis of the French General Tax Code, the amount of distributed dividends are eligible for the 40% deduction in favour of tax payers in France, as provided for in Article 158-3 of the French General Tax Code.
The purpose of the third resolution is to approve the Technip Group’s consolidated fi nancial statements for the 2009 fi scal year.
Fourth resolution
Special report of the Statutory Auditors
The fourth resolution approves the special report of the Statutory Auditors reporting the absence of any new regulated agreements entered into in 2009 and the continuation in 2009 of such agreements made during previous fi scal years.
Fifth resolution
Directors’ Attendance Fees
The recent inclusion of Technip in the CAC 40 index (September 21, 2009) substantially changes the positioning of the Company with respect to the Board’s exposure and the Board members recruitment. Directors’ fees lagging last year more than 40% behind the average of the companies included in the CAC 40 are still 25% below this average. The needed adjustment should be such that the matter would also be settled for the next coming years.A true involvement is requested from Technip directors. In 2009 for instance, the Board met nine times and the Committees of the Board met 16 times. Four hours in average were spent on each Board meeting and even one of these meetings consisting in a two days Strategic Seminar in Qatar gave in addition the opportunity of a one day visit of the four work sites of the Group in progress in Ras Laffan.Moreover it is important to maintain the attractiveness of the company vis-à-vis non French directors. Indeed the differential even with European countries adversely affects the current international standing of the Board and deprives the Company from access to sources of independence and diversity for further recruitments.It is accordingly proposed to increase the annual amount of €440,000 to €600,000 for 2010, and to keep this amount for each of 2011 and 2012 fi scal years.As a reminder, the Chairman and Chief Executive Offi cer does not receive any attendance fee and the aforementioned amount then is divided between ten Directors.
Sixth to ninth resolution
Appointment of two Statutory Auditors and two Alternate Statutory Auditors
The terms of the Statutory Auditors expiring at the time of this Shareholders’ Meeting, the purpose of these resolu-tions is to appoint for six years, according to the law:
Statutory Auditors: ERNST & YOUNG ET AUTRES ■
Statutory Auditors: PRICEWATERHOUSECOOPERS AUDIT ■
Alternate Statutory Auditors: AUDITEX ■
Alternate Statutory Auditors: Yves NICOLAS ■
2.1. Presentation of resolutions relevant to the Ordinary Shareholders’ Meeting

232 2009 Reference Document
Annex: Agenda, Presentation of the Resolutions and Proposed Resolutions
2. Presentation of the ResolutionsE
Tenth resolution
Transfer of Registered Offi ce
Since the end of 2007, the structure of the Group organization is based on geographical and decentralized Regions.In France, this leads to a separation of the Head Offi ce of Technip holding from that of Technip France, main opera-tional unit of Region A knowing that both where historically located in the same building in the Paris business district in La Défense. The move which will not generate additional costs thanks to favourable market conditions will allow the relocation in a single building the teams of Technip France currently present on three sites.The proposal is to ratify the transfer of the Registered Offi ce of Technip, decided by the Board of Directors on February 16, 2010 from Technip Tower in La Defense to offi ces in Paris, Porte Maillot, with effect from the date of the fi tting out of the new offi ces and at the latest on December 31, 2010 and to ratify accordingly the relevant modifi ca-tion of Article 4 of Articles of Association.The staff of the holding and of the corporate services (around 250 persons) will be based at the new address on the basis of a commercial lease.
Eleventh resolution
Repurchase of Company Shares
The eleventh resolution is part of the policy aimed at avoiding dilutive measures while implementing means to motivate and promote loyalty among the teams by having at its disposal a reserve of performance shares and stock options.Therefore, the purpose of this resolution is to renew the authorization to buy shares of the Company granted to the Board of Directors by the Shareholders’ Meeting of April 30, 2009, and which expires on October 30, 2010.The purchase of shares may be carried out at any time, except during tender offers on the Company’s share capital, in accordance with applicable regulations.The proposed authorization is for an 18-month period, at a maximum purchase price of €80 and up to a maximum legal limit of 10% of the total number of shares comprising the share capital.As of December 31, 2009, the Company’s share capital was divided into 109,343,294 shares. On this basis, the maximum number of shares that the Company would be able to repurchase amounts to 7,868,419 shares (taking into account 3,065,910 treasury shares).
2.2. Presentation of resolutions relevant to the Extraordinary Shareholders’ Meeting
Twelfth resolution
Cancellation of Company Shares
The purpose of the twelfth resolution is the renewal of the authorization to the Board of Directors to cancel all or part of the treasury shares. Such authorization granted by the Shareholders’ Meeting of April 29, 2005 expires on April 29, 2010.In order to keep the availability of this relutive potential, it is proposed to renew the possibility to cancel shares up to a limit of 10% of the share capital over a period of 24 months. Moreover the cancellation of shares is one of the optional use – and in certain circumstances, compulsory – of the shares purchased by the Company further to the eleventh resolution. This thus implies the adoption of the twelfth resolution.
Thirteenth, fourteenth, fi fteenth and sixteenth resolutions
Grant of performance shares and grant of stock options
A. General presentationPursuant to the AFEP-MEDEF Code (Article 20.2.3), Technip policy relies on yearly grants to be made at the same calendar periods (June) just after and according to the Annual Shareholders’ Meeting decisions.The proposed resolutions strictly correspond to the needs for 2010, i.e. 0.9% of the share capital for performance shares and 1.1% for stock options.A bottom up census by Regions gives the size of the plan proposed based upon specifi c guidelines given by the Corporate Management to focus on:
key people; ■
high potential young staff; ■
newly recruited and promoted individuals; ■
new benefi ciaries: 25% at least of the selected population should never had incentives before (actually the rates ■
reached 39.2% for the stock option plan in 2009).It is worth knowing that these guidelines exclude EXCOM members (either Corporate or Region levels) from the benefi t of the last tranche of performance share 2009 Plan.There are several reasons to support these resolutions:
The fi rst reason is the crucial need for loyalty and motivation initiatives for employees to face the strong employment ■
market volatility in the petroleum industry, in particular in the context of major contractual challenges, especially those contracts that are in essential performance phases in the Middle East, Africa, Brazil and Asia.It is clear that these tools will permit to foster loyalty and motivate employees as evidenced, for instance, by a comparison of the respective rates of turnover in the Group over the period 2006-2009 between the benefi ciaries of such incentives (1.2%) and the other members of the staff (8.1%).

2332009 Reference Document
Annex: Agenda, Presentation of the Resolutions and Proposed Resolutions
2. Presentation of the Resolutions E
The differences in the regulatory and tax environments that prevail in different countries under consideration require the ■
use of both stock options and performance shares as a tool in order to achieve the loyalty and motivation objectives.In the absence of these tools, the Group would have to use other means as a substitute, which would be much more ■
expensive.As a matter of fact one should keep in mind that far from being the privilege of happy few, these plans benefi ted each year to 10 to 20% of the total staff over the last three years.
B. Terms of the stock options and performance share plans1. Provisions included in the resolutions
In order to comply with the most demanding governance standards, performance conditions relate to all grants in favor of the mandataire social (Chairman and Chief Executive Offi cer). According to the AFEP-MEDEF Code dated December 2008 to which the Company refers, this rule was already implemented on this basis in the resolutions submitted to the Shareholders’ Meeting of April 30, 2009.The terms of the resolutions presented are essentially the same as the last years:
No discount on the purchase price; ■
No possibility to modify the initial terms; ■
Loss of options in the event of resignation or dismissal for wrongful or gross misconduct ( ■ faute grave or faute lourde);Grants to the Chairman and Chief Executive Offi cer are decided by the Board of Directors (majority of ■
independent directors) upon a proposal by the Nominations and Remunerations Committee (majority of independent directors);Grants to members of the Executive Committee are decided by the Board of Directors pursuant to the recom- ■
mendations formulated within the context of the plan by the Nominations and Remunerations Committee;A resolution for the Chairman and Chief Executive Offi cer ( ■ mandataire social) that is distinct from that of other benefi ciaries;Ceiling of 0.10% of share capital on grants of stock options and of 0.03% of share capital on grants of ■
performance shares to the Chairman and Chief Executive Offi cer (mandataire social);Ceiling of 20% of the relevant plan on grants made to the management team (Executive Committee, including ■
the Chairman and Chief Executive Offi cer);Rigorous performance conditions detailed in each resolution for stock options as well as for performance shares; ■
The defi nitive acquisition of performance shares and the exercise of the options will be subject to the ■
Company having achieved a level of performance, to be measured by the evolution over several years of the Consolidated Operating Income (1) in relation to a representative sample of the Group’s competitors and that is based on the following scale:
if the evolution of the Group’s Consolidated Operating Income is greater than or equal to that of the sample, -all of the options/shares will be exercisable/acquired according to the terms and conditions provided in the plan’s regulations,if the evolution of the Group’s Consolidated Operating Income falls between 80% and 100% of that of the -sample, the portion of the options/shares lost will be determined by linear interpolation between 50% and 100%,if the evolution of the Group’s Consolidated Operating Income is less than 80% of that of the sample, 50% -of the options/shares will be lost;
Each authorization is granted for a period of 24 months; ■
Grants to the Chairman and Chief Executive Offi cer ( ■ mandataire social) will be canceled if the evolution of Technip’s Consolidated Operating Income is below the evolution of each of the companies in the sample;The extension of the same “full risk” provision to all benefi ciaries (and not only to the Chairman and CEO) has been considered and disregarded for the following reasons:
Technip complies with the recommendations of the AFEP-MEDEF Code which limits this rule to the Chairman -and CEO;To Technip’s knowledge none of its competitors applies the rule beyond the Chairman and CEO; -The extension of the rule would have a counter productive effect knowing that: -
the variable portion of a manager’s salary is itself contingent up to 50% upon the Group results,• the de facto impossibility to defi ne beforehand those projects and Regions which will infl uence the Group • results hinders any such identifi cation of those to whom the extension would apply,for those of the benefi ciaries having less infl uence on the Group results, the loyalty tool would most likely • have a demotivating effect;
The same performance criteria has been maintained for the proposed plans as the one used for the previous -plans during which Technip widely over performed its competitors. This means that the performance criteria will be in itself substantially more diffi cult to achieve.
(1) The Consolidated Operating Income is one of the audited accounting items which the Group discloses regularly, in particular at the time of each publication of its fi nancial results.

234 2009 Reference Document
Annex: Agenda, Presentation of the Resolutions and Proposed Resolutions
2. Presentation of the ResolutionsE
2. Provisions included in the plansIn order to provide an overall view of the implementation conditions of the requested authorizations, it has been decided to give further detailed information regarding the methods used to determine the achievement of performance conditions.The following indications are with reference to previous plans that are still outstanding, which generally represent Technip’s policy in this area, although they may not be exactly the same in all respects as the conditions that would apply to the implementation of the authorizations being sought from the next Shareholders’ Meeting:
Composition of the sample: since 2005 the sample has been comprised of Acergy, Saipem, Fluor, JGC, Chiyoda, ■
McDermott. Extending the number of companies is under consideration for the sake of representativity;Applicable period for performance conditions: the applicable period is equal to the Acquisition Period, ■ i.e., three years (performance shares) or four years (stock options);A fi nancial institution has been entrusted with the mission of acting as an independent expert to carry out ■
calculations, comparisons and determinations of benefi ciaries’ rights based on the recorded results.
C. Specifi c data addressing Riskmetrics’ governance policy criteriaThe following paragraphs were drafted to take into account the analysis carried out by Riskmetrics which would not support a resolution in favour of a stock option or performance share plan if the aggregate of existing performance shares and stock options plus those that are the subject of the authorizations being requested from the next Shareholders’ Meeting, are in excess of:
5% of the share capital for a “Mature” company; ■
10% of the share capital for a “Growth” company. ■
1. Regarding the qualifi cation to be applied to TechnipThe nature of Technip’s business (oil services) with almost no recurrent market share (in particular in Onshore and Offshore segments) is subject to demand that varies signifi cantly in terms of geography, which requires, depending on the case, a presence in a given country in circumstances that resemble those that apply to “start-up” companies:
immediate set-up for a project; ■
creation of a local engineering offi ce with local engineers; ■
strong and rapid buildup in labor and equipment, often prior to obtaining a contract; ■
importance of technological content in the services provided; ■
uncertainty driven by a project-by-project approach. ■
This approach, which is imposed by market conditions, may result in a long-term presence where successful (Malaysia, Brazil), but may also result in a signifi cant decrease or disappearance from certain markets (Iran, ex-USSR, Algeria).
2. Dilution limitsBased on our understanding of available data on Riskmetrics policy and past analysis by Riskmetrics on our previous proposed stock options and performance shares plans the current status of outstanding and proposed dilutive instruments fall within the 5% limit.a) The actual potential for dilution which arises for grants in the form of options to subscribe shares as opposed
to grants in the form of options to obtain shares purchased by the Company, resulting from both existing dilutive options and the authorizations being submitted to a vote at the next Shareholders’ Meeting, is equal to 4.89% of the share capital.The calculation is, on the basis of the number of shares comprising the share capital as of December 31, 2009 (i.e., 109,343,294), as follows:
Potential dilution of 4,142,115 existing options, ■ i.e.: 3.79%
Potential dilution of options from the next Shareholders’ Meeting, assuming that all of the ■
stock options proposed (i.e. 1.1%) are granted in the form of options to subscribe shares, which are dilutive, i.e.: 1.10%
4.89%

2352009 Reference Document
Annex: Agenda, Presentation of the Resolutions and Proposed Resolutions
2. Presentation of the Resolutions E
b) The impact of the aggregate outstanding and proposed plans where attribution for performance shares and stock options is assured, is 4.41% of the share capital.
(i) Actual existing dilutive elements (see (a) above) less the shares not granted due to the performance conditions:
2005 Stock Options Plan:
Tranche 1 at 97.75% ■ 865,114
Tranche 2 at 50% ■ 439,961
Tranche 3 at 50% ■ 464,173
Tranche 4 at 50% ■ 40,155
Tranche 5 at 50% ■ 51,929
2009 Plan at 50%: 545,537
11 CSO Plan at 100%: 136,528
2,543,397
i.e.: 2.33%
(ii) Existing shares options for which attribution is assured (authorized by the 2008 Shareholders’ Meeting):
50% of 937,060 = 468,530, i.e. 0.43%
(iii) Options for the subscription of shares proposed to the next Shareholders’ Meeting less options for which attribution is not assured due to the performance conditions (50% for benefi ciaries excepted for the Chairman and Chief Executive Offi cer):
50% of 1,093,432 = 546,716, i.e. 0.50%
(iv) Existing performance shares for which attribution is assured:
2007 Plan (authorized by the 2006 Shareholders’ Meeting)
50% of 698,370 = 349,185, i.e. 0.32%
2008 and 2009 Plans (authorized by the 2008 Shareholders’ Meeting):
50% of 867,450 = 433,725, i.e. 0.40%
(v) Performance shares proposed to the next Shareholders’ Meeting less shares for which attribution is not assured due to the performance conditions (50% for benefi ciaries excepted for the Chairman and Chief Executive Offi cer):
50% of 951,287 = 475,643, i.e. 0.43%
4.41%
3.94%*
* The 4.41% fi gure includes 51,929 subscription options mentioned in (i) which can be exercised on June 13, 2012 at €59.96 and 468,530 options to purchase shares which can be exercised on July 2, 2012 at €58.15 totalling 520,459 options representing 0.47%.It could be argued that these options, “under water” cannot fairly be included in any calculation because there is no certainty that they will ever be exercised. In these circumstances, the total would be reduced to 3.94%.
Seventeenth resolution
Share capital increase reserved for employees
Pursuant to Article L. 225-129-6 of the French Commercial Code, because the Shareholders’ Meeting is being convened to examine authorizations to increase the Company’s share capital, a resolution for share capital increases reserved for employees must also be presented to the Shareholders’ Meeting. The purpose of the seventeenth resolution is to propose such an authorization, with the following conditions:1. the maximum limit of the increase is 1% of the share capital as of the date of the Shareholders’ Meeting;2. the subscription price of the shares is equal to 80% of the average share price of the last 20 trading days;3. the implementation of the authorization is subject to a waiver by the shareholders of their preferential subscription
rights in favour of the employees adhering to a company savings plan.The authorization thus granted is valid for a period of 26 months, expiring on June 29, 2012 and cancels the corre-sponding authorization granted by the Shareholders’ Meeting of April 30, 2009.

236 2009 Reference Document
Annex: Agenda, Presentation of the Resolutions and Proposed Resolutions
3. Proposed ResolutionsE
Within the authority of the Ordinary Shareholders’ Meeting
First resolutionApproval of the statutory fi nancial statements for the fi scal year ended December 31, 2009
The Shareholders’ Meeting, acting under the conditions of quorum and majority required for ordinary shareholders’ meetings, having reviewed the report of the Board of Directors on the activity and condition of the Company over the 2009 fi scal year and the report of the Statutory Auditors on the performance of their mission over the course of the 2009 fi scal year hereby approves the statu-tory fi nancial statements for the fi scal year ended December 31, 2009, as presented, showing profi ts of €45,508,413.78. The Shareholders’ Meeting also approves the transactions evidenced in these statements or summarized in these reports.
Second resolutionAllocation of earnings for the fi scal year ended December 31, 2009, setting the dividend amount and the dividend payment date
The Shareholders’ Meeting, acting under the conditions of quorum and majority required for ordinary shareholders’ meetings, acknowledges that the profi ts for the fi scal year ended December 31, 2009 amount to €45,508,413.78, that there shall be no allocation to the legal reserve, which has already reached one-tenth of the share capital and that distributable profi ts amount to €168,887,854.65, taking into account the available retained earnings of €123,379,440.87.
The Shareholders’ Meeting therefore decides to allocate as a divi-dend an amount of €1.35 per share, representing a total amount of €143,474,468.40, with the remaining amount allocated to retained earnings.
Treasury shares on the date of payment of the dividend shall be excluded from the benefi t of this distribution, and the corre-sponding amounts shall be allocated to retained earnings.
The dividend will be paid on May 11, 2010 in cash. The amount of the dividends that will be paid corresponds in full to distribu-tions eligible for the 40% abatement referred to in paragraph 2 of Section 3 of Article 158 of the French General Tax Code.
The Shareholders’ Meeting recalls that the amount of distributed dividends and the distributions eligible for the 40% abatement were as follows for the last three fi scal years:
Fiscal YearDividend per Share
Amount of distributions eligible for the 40% abatement
2006 €1.05 €1.05
€2.10 €2.10
2007 €1.20 €1.20
2008 €1.20 €1.20
Third resolutionApproval of the consolidated fi nancial statements for the fi scal year ended December 31, 2009
The Shareholders’ Meeting, acting under the conditions of quorum and majority required for ordinary shareholders’ meetings, having reviewed the report of the Board of Directors on the activity and condition of the Group over the 2009 fi scal year, and the report of the Statutory Auditors on the consolidated fi nancial state-ments, hereby approves the consolidated fi nancial statements for the fi scal year ended December 31, 2009, as presented, as well as the transactions evidenced in these statements or summarized in these reports.
Fourth resolutionSpecial report of the Statutory Auditors on the regulated agree-ments and commitments referred to in Articles L. 225-38 et seq. of the French Commercial Code
The Shareholders’ Meeting, acting under the conditions of quorum and majority required for ordinary shareholders’ meetings, having reviewed the special report of the Statutory Auditors on the agreements referred to in Articles L. 225-38 et seq. of the French Commercial Code, hereby approves the report stating that no new agreement and commitments enter into in 2009.
Fifth resolutionDirectors’ attendance fees
The Shareholders’ Meeting, acting under the conditions of quorum and majority required for ordinary shareholders’ meetings, decides to set the attendance fees to be allocated per fi scal year to the Board of Directors at €600,000 for 2010, and at the same amount for each of 2011 and 2012 fi scal years.
The Shareholders’ Meeting grants full powers to the Board of Directors to allocate all or part of these attendance fees in accord-ance with such terms and conditions that it will determine.
Sixth resolutionAppointment of a Statutory Auditor
The Shareholders’ Meeting, acting under the conditions of quorum and majority required for ordinary shareholders’ meetings, having reviewed the report of the Board of Directors, decides to appoint ERNST & YOUNG ET AUTRES as Statutory Auditor for a term of six years, to expire at the end of the Shareholders’ Meeting convened to approve the statutory fi nancial statements for the fi scal year ending December 31, 2015.
Seventh resolutionAppointment of a Statutory Auditor
The Shareholders’ Meeting, acting under the conditions of quorum and majority required for ordinary shareholders’ meetings, having reviewed the report of the Board of Directors, decides to appoint PRICEWATERHOUSECOOPERS AUDIT as Statutory Auditor for
3. Proposed Resolutions

2372009 Reference Document
Annex: Agenda, Presentation of the Resolutions and Proposed Resolutions
3. Proposed Resolutions E
a term of six years, to expire at the end of the Shareholders’ Meeting convened to approve the statutory fi nancial statements for the fi scal year ending December 31, 2015.
Eighth resolutionAppointment of an Alternate Statutory Auditor
The Shareholders’ Meeting, acting under the conditions of quorum and majority required for ordinary shareholders’ meetings, having reviewed the report of the Board of Directors, decides to appoint AUDITEX as Alternate Statutory Auditor for a term of six years, to expire at the end of the Shareholders’ Meeting convened to approve the statutory fi nancial statements for the fi scal year ending December 31, 2015.
Ninth resolutionAppointment of an Alternate Statutory Auditor
The Shareholders’ Meeting, acting under the conditions of quorum and majority required for ordinary shareholders’ meetings, having reviewed the report of the Board of Directors, decides to appoint Yves NICOLAS as Alternate Statutory Auditor for a term of six years, to expire at the end of the Shareholders’ Meeting convened to approve the statutory fi nancial statements for the fi scal year ending December 31, 2015.
Tenth resolutionRatifi cation of transfer of Registered Offi ce
The Shareholders’ Meeting, acting under the conditions of quorum and majority required for ordinary shareholders’ meetings, having reviewed the report of the Board of Directors, decides to ratifi es the transfer of the Registered Offi ce, decided by the Board of Directors on February 16, 2010, from 6-8, allée de l’Arche – Faubourg de l’Arche – ZAC Danton 92400 Courbevoie to 89, avenue de la Grande-Armée 75116 PARIS, with effect from the date of instal-lation of offi ces and at the latest on December 31, 2010 and the relevant modifi cation of Article 4 of Articles of Association.
Eleventh resolutionAuthorization granted to the Board of Directors for the repurchase of Company shares
The Shareholders’ Meeting, acting under the conditions of quorum and majority required for ordinary shareholders’ meetings, having reviewed the report of the Board of Directors, authorizes the Board of Directors to purchase shares of the Company, in accordance with the provisions of Articles L. 225-209 et seq. of the French Commercial Code, on one or more occasions, for the following primary purposes:
to honor commitments related to stock option plans or other ■
share grants to employees or directors or offi cers (mandataires sociaux) of the Company or its affi liates;
to use shares in payment or in exchange in connection with ■
external growth transactions;
to promote share trading, in order, in particular, to ensure ■
liquidity with an investment services provider pursuant to a liquidity contract in compliance with the ethics charter approved by the French Financial Market Authority (Autorité des Marchés Financiers);
to cancel such shares; ■
to deliver shares upon the exercise of rights attached to securi- ■
ties giving access to the share capital;
to implement any such market practice which would becomes ■
recognized from time to time by law or by the French Financial Market Authority (Autorité des Marchés Financiers).
The purchase, holding, sale or transfer of the purchased shares may be carried out, depending on the case, on one or more occa-sions, in any manner on the market (regulated or not), through multilateral trade facilities (“MTFs”), via systematic internalizers or through negotiated transactions, in particular, through the acquisition or sale of blocks, or by using fi nancial derivatives and warrants, in compliance with applicable regulations. The portion of the repurchase program that may be carried out by negotiation of blocks may be as large as the entire program.
The Shareholders’ Meeting sets the maximum purchase price at €80 (before charges) per share and decides that the maximum number of shares that may be acquired may not exceed 10% of the shares comprising the share capital as of the date of this Shareholders’ Meeting.
In the event of a share capital increase by incorporation of premiums, reserves and benefi ts, resulting in either an increase in the nominal value, or in a free grant of shares, and in the event of a split or reverse split of shares or any other transaction affecting the share capital, the Board of Directors may adjust the aforementioned purchase price to take into account the effect of those transactions on the value of the shares.
Full powers are granted to the Board of Directors, with power of delegation to the Chief Executive Offi cer or, with his consent, to one or more executive vice presidents (directeurs généraux délégués), to place, at any time, except during the period of a public offering on the Company’s securities, any orders on a secu-rities exchange or through negotiated transactions, to allocate or re-allocate repurchased shares to the primary repurchase purposes in accordance with applicable law and regulations, to enter into any agreements, specifi cally for the keeping of purchase and sale registers, to draft any documents, to carry out any formalities, to make any declarations and communications to any agencies, particularly to the French Financial Market Authority (Autorité des Marchés Financiers), concerning the transactions carried out pursuant to this resolution, to set the terms and conditions to preserve, as necessary, any rights of holders of securities giving access to the Company’s share capital and any rights of benefi -ciaries of options in accordance with applicable regulations and, generally, to take any necessary action. The Shareholders’ Meeting also grants full powers to the Board of Directors, if applicable laws or the French Financial Market Authority (Autorité des Marchés Financiers) were to extend or supplement the primary purposes authorized for share repurchase programs, to inform the public according to applicable regulations of potential modifi cations to the repurchase program pertaining to the amended purposes.
This authorization invalidates any previous authorization for the same purpose and, in particular, the fourteenth resolution of the ordinary shareholders’ meeting of April 30, 2009. It is granted for a period of 18 months from the date of this Shareholders’ Meeting.
In its report to the Annual Shareholders’ Meeting, the Board of Directors shall provide the shareholders with information relating to the purchases and sales of shares carried out pursuant to this resolution.

238 2009 Reference Document
Annex: Agenda, Presentation of the Resolutions and Proposed Resolutions
3. Proposed ResolutionsE
Within the authority of the Extraordinary Shareholders’ Meeting
Twelfth resolutionAuthorization granted to the Board of Directors to reduce the share capital by canceling shares that have previously been repurchased
The Shareholders’ Meeting, acting under the conditions of quorum and majority required for extraordinary shareholders’ meetings, having reviewed the report of the Board of Directors and the special report of the Statutory Auditors, and pursuant to article L. 225-209 of the Commercial Code:
1. Authorizes the Board of Directors to reduce the share capital by canceling all or some of the shares acquired under share repurchase programs authorized by the Shareholders’ Meeting, on one or more occasions, up to a limit of 10% of the share capital by periods of twenty-four months and to charge the difference between the repurchase value of the canceled shares and their par value to the available reserves and premiums.
2. The Board of Directors shall have the necessary powers to set the terms and conditions of this or these cancellations and to make the corresponding amendment to the bylaws and accomplish any necessary formalities.
3. This authorization is given for a period of fi ve years. It invali-dates any previous authorization for the same purpose.
Thirteenth resolutionAuthorization granted to the Board of Directors to allocate perform-ance shares to (i) Technip’s employees, and (ii) the employees and directors and offi cers (mandataires sociaux) of companies related to the Company within the meaning of Article L. 225-197-2 of the French Commercial Code
The Shareholders’ Meeting, acting under the conditions of quorum and majority required for extraordinary shareholders’ meetings, after having reviewed the report of the Board of Directors, and the special report of the Statutory Auditors, and pursuant to Articles L. 225-197-1 et seq. of the French Commercial Code:
1. Authorizes the Board of Directors to grant, on one or more occasions, existing shares free of charge (“the performance shares”) (i) to employees of Technip (“the Company”) and, (ii) to employees and directors and offi cers (mandataires sociaux) of companies related to the Company within the meaning of Article L. 225-197-2 of the French Commercial Code.
2. Decides that the grant of performance shares carried out by the Board of Directors pursuant to this resolution may not apply to more than 0.9% of the Company’s share capital as of the date of this Shareholders’ Meeting, it being specifi ed that this amount does not take into account any adjustments that may be made in compliance with applicable laws or regulations, and as the case may be, applicable contractual provisions providing for other cases of adjustments.
The performance shares granted to the members of the Executive Committee pursuant to this resolution and, specifi -cally, to the Chairman of the Board of Directors and/or the Chief Executive Offi cer, the Company’s managing agent (mandataire social), pursuant to the fourteenth resolution, (i.e., including the performance shares that would be granted to the Chairman of the Board of Directors and/or the Chief
Executive Offi cer within the maximum limit of 0.03% of the share capital), may not represent, as a whole, more than 20% of the total number of performance shares authorized by this resolution.
3. Decides that the grant of shares to their benefi ciaries will become defi nitive at the end of an acquisition period whose length will be set by the Board of Directors, with the under-standing that this period may not be less than two years, as from the decision by the Board of Directors to grant shares.
The benefi ciaries must hold these shares for a time period set by the Board of Directors, with the understanding that the holding period may not be less than two years as from the defi nitive acquisition of these shares.
Nonetheless, the Shareholders’ Meeting authorizes the Board of Directors, insomuch as the acquisition period for all or part of one or more grants is at least four years long, to not impose a holding period for those shares.
4. Decides that in the event of a benefi ciary’s disability corre-sponding (or comparable outside France) to the second and third categories of classifi cation provided for in Article L. 341-4 of the French Social Security Code, the shares will be defi nitively granted to the benefi ciary before the end of the remainder of the acquisition period. These shares may be freely transferred or sold as from their delivery.
5. Notes that the rights of benefi ciaries to acquire shares will be lost in the event of resignation or dismissal for wrongful or gross misconduct (faute grave or faute lourde) during the acquisition period.
6. The Board of Directors will grant performance shares and determine the identity of their benefi ciaries.
A defi nitive grant of the shares will be subject to the Company’s having achieved a level of performance to be measured by the evolution over several years of the Consolidated Operating Income in relation to a representative sample of the Group’s competitors and based on the following scale:if the evolution of the Group’s Consolidated Operating -Income is greater than or equal to that of the sample, all of the shares will be granted according to the terms and conditions provided in the plan’s regulations;
if the evolution of the Group’s Consolidated Operating -Income is greater than or equal to 80% and less than 100% of that of the sample, the portion of the shares lost will be determined by linear interpolation between 50% and 100% and according to the terms and conditions provided in the plan’s regulations;
if the evolution of the Group’s Consolidated Operating -Income is less than 80% of that of the sample, 50% of the shares will be lost according to the terms and conditions provided in the plan’s regulations.
The Board of Directors will determine the other terms and conditions and, as applicable, the criteria for the grant of the shares.
7. The Board of Directors will have the necessary powers to implement this authorization, in accordance with the terms described above and subject to applicable legal provisions, and to do all that is useful and necessary in accordance with applicable laws and regulations.
The Board of Directors will inform the Shareholders’ Meeting each year of the actions carried out pursuant to this resolution, in accordance with legal and regulatory requirements and particu-larly Article L. 225-197-4 of the French Commercial Code.

2392009 Reference Document
Annex: Agenda, Presentation of the Resolutions and Proposed Resolutions
3. Proposed Resolutions E
The authorization granted to the Board of Directors by the present resolution is valid for a period of 24 months following the date of this Shareholders’ Meeting and invalidates any previous authorization for the same purpose.
Fourteenth resolutionAuthorization granted to the Board of Directors to allocate performance shares to the Chairman of the Board of Directors and/or the Chief Executive Offi cer of Technip (mandataire social)
The Shareholders’ Meeting, acting under the conditions of quorum and majority required for extraordinary shareholders’ meetings, after having reviewed the report of the Board of Directors, and the special report of the Statutory Auditors, and pursuant to Articles L. 225-197-1 et seq. of the French Commercial Code:
1. Authorizes, subject to the condition precedent of the adop-tion of the thirteenth resolution, the Board of Directors to grant, on one or more occasions, existing shares free of charge (“the performance shares”) to the Chairman of the Board of Directors and/or the Chief Executive Offi cer of Technip (“the Company”), the Company’s managing agent (mandataire social).
2. Decides that the grant performance shares carried out by the Board of Directors pursuant to this authorization may not apply to more than 0.03% of the Company’s share capital as of the date of this Shareholders’ Meeting, it being specifi ed that this amount does not take into account any adjustments that may be made in compliance with applicable laws or regulations and, as the case may be, applicable contractual provisions providing for other cases of adjustments.
The performance shares allocated to the members of the Executive Committee pursuant to the thirteenth resolution and, specifi cally, to the Chairman of the Board of Directors and/or the Chief Executive Offi cer, the Company’s managing agent, pursuant to this resolution (i.e., including the shares that would be allocated to the Chairman of the Board of Directors and/or the Chief Executive Offi cer within a maximum limit of 0.03% of the share capital), shall not represent, as a whole, more than 20% of the total allocations of performance shares authorized by the thirteenth resolution.
3. Decides that the grant of shares to the benefi ciary will become defi nitive at the end of an acquisition period whose length will be set by the Board of Directors, with the understanding that this period may not be less than two years, as from the decision by the Board of Directors to grant shares.
The benefi ciary must hold these shares for a time period set by the Board of Directors, with the understanding that the holding period may not be less than two years as from the defi nitive acquisition of these shares, without prejudice to the provisions in Article L. 225-197-1, II, last paragraph, of the French Commercial Code.
4. Decides that in the event of a benefi ciary’s disability corre-sponding to the second and third categories of classifi cation provided for in Article L. 341-4 of the French Social Security Code, the shares will be defi nitively granted to the benefi ciary before the end of the remainder of the acquisition period. These shares may be freely transferred or sold as from their delivery.
5. Notes that the rights of the benefi ciary to acquire the shares will be lost in the event of resignation or removal for wrongful or gross misconduct (faute grave or faute lourde) during the acquisition period.
6. A defi nitive grant of the shares will be subject to the Company’s having achieved a level of performance to be measured by the evolution over several years of the Consolidated Operating Income in relation to a representative sample of the Group’s competitors and based on the following scale:if the evolution of the Group’s Consolidated Operating -Income is greater than or equal to that of the sample, all of the shares will be granted according to the terms and conditions provided in the plan’s regulations;
if the evolution of the Group’s Consolidated Operating -Income is greater than or equal to 80% and less than 100% of that of the sample, the portion of the shares lost will be determined by linear interpolation between 50% and 100% and according to the terms and conditions provided in the plan’s regulation;
if the evolution of the Group’s Consolidated Operating -Income is less than 80% of that of the sample, 50% of the shares will be lost according to the terms and conditions provided in the plan’s regulations.
Moreover, as a departure from the scale described above, no shares, under any circumstances, will be granted to the Company’s Chairman of the Board of Directors and/or the Chief Executive Offi cer if the evolution of the Group’s Operating Income is less than that of each of the companies included in the sample.
The Board of Directors will determine the other terms and conditions and, as applicable, the criteria for the grant of the shares.
7. The Board of Directors will have the necessary powers to implement this authorization, in accordance with the terms described above and subject to applicable legal provisions, and to do all that is useful and necessary in accordance with applicable laws and regulations.
The Board of Directors will, each year, inform the Shareholders’ Meeting of the actions carried out pursuant to this resolution, in accordance with legal and regulatory requirements and particularly Article L. 225-197-4 of the French Commercial Code.
The authorization granted to the Board of Directors by the present resolution is valid for a period of 24 months following the date of this Shareholders’ Meeting and invalidates any previous authorization for the same purpose.
Fifteenth resolutionAuthorization granted to the Board of Directors to grant options for the purchase or subscription of shares to (i) Technip’s employees, and (ii) the employees and directors and offi cers (mandataires sociaux) of the companies related to the Company within the meaning of Article L. 225-180 of the French Commercial Code
The Shareholders’ Meeting, acting under the conditions of quorum and majority required for extraordinary shareholders’ meetings, after having reviewed, the report of the Board of Directors, and the special report of the Statutory Auditors and pursuant to Articles L. 225-177 et seq. of the French Commercial Code:
1. Authorizes the Board of Directors to allocate, on one or more occasions, (i) to employees of Technip (“the Company”) and, (ii) to employees and directors and offi cers (mandataires sociaux) of the companies related to the Company within the meaning of Article L. 225-180 of the French Commercial Code, or certain categories among them, options to subscribe new shares to be issued by the Company through share capital

240 2009 Reference Document
Annex: Agenda, Presentation of the Resolutions and Proposed Resolutions
3. Proposed ResolutionsE
increases or to purchase existing shares of the Company resulting from repurchases carried out by the Company in accordance with legal provisions.
2. Decides that the options that may be allocated by the Board of Directors pursuant to this authorization may not give the right to purchase or subscribe a total number of shares greater than 1.1% of the share capital as of the date of this Shareholders’ Meeting. This amount does not take into account the adjust-ments that may be carried out in accordance with legislative and regulatory provisions.
The options granted to the members of the Executive Committee pursuant to this resolution and, specifi cally, to the Chairman of the Board of Directors and/or the Chief Executive Offi cer, the Company’s managing agent (mandataire social), pursuant to the sixteenth resolution, (i.e., including the options that would be granted to the Chairman of the Board of Directors and/or the Chief Executive Offi cer within the maximum limit of 0.10% of the share capital), shall not represent more than 20%, as a whole, of the total number of options authorized by this resolution.
3. Decides that the exercise price will be set by the Board of Directors on the date that the options are granted and that (i) for options to subscribe shares, this price will be undis-counted and equal to the average of the share’s listed price on Euronext Paris over the 20 trading days preceding the date of the grant, and (ii) for options to purchase shares, this price will be undiscounted and equal to the higher of the following: (a) the average purchase price of the shares indicated in Article L. 225-179 of the French Commercial Code, and (b) the average indicated in (i) above.
The exercise price, as determined above, may not be modifi ed except in the event that measures necessary for the protec-tion of the interests of the benefi ciaries of the options are implemented pursuant to Article L. 225-181 of the French Commercial Code and in accordance with legal and regulatory conditions.
The exercise of the options will be subject to the Company’s having achieved a level of performance to be measured by the evolution over several years of its Consolidated Operating Income in relation to a representative sample of the Group’s competitors and based on the following scale:
if the evolution of the Group’s Consolidated Operating -Income is greater than or equal to that of the sample, all of the options will be granted according to the terms and condi-tions provided in the plan’s regulations;if the evolution of the Group’s Consolidated Operating -Income is greater than or equal to 80% and less than 100% of that of the sample, the portion of the options lost will be determined by linear interpolation between 50% and 100% and according to the terms and conditions provided in the plan’s regulations;if the evolution of the Group’s Consolidated Operating -Income is less than 80% of that of the sample, 50% of the options will be lost according to the terms and conditions provided in the plan’s regulations.
4. Acknowledges that no option may be granted less than twenty trading days following the detachment from the shares of a coupon giving right to a dividend or a capital increase.
5. Acknowledges that no option can be granted during (i) the ten trading days preceding and following the date on which the consolidated fi nancial statements or, in the absence of these, the annual statutory fi nancial statements, are made public, and (ii) the period between the date on which the Company’s
management bodies receive information that, if it were made public, could have a signifi cant impact on the Company’s share price, and the tenth trading day following the date on which this information is made public.
6. Decides that the options must be exercised within a maximum period of six years as from the date of grant by the Board of Directors; nevertheless, the Board of Directors may set a shorter exercise period for all or part of the options and/or for all or certain of the benefi ciaries.
7. Notes that this resolution automatically acts, in favor of the benefi ciaries of the options to subscribe shares, as an express waiver by the shareholders of their preferential subscription rights with respect to the shares that will be issued as options are exercised.
8. The benefi ciaries’ right to exercise the options will be lost in the event of resignation or dismissal for wrongful or gross misconduct (faute grave or faute lourde).
9. Gives all powers to the Board of Directors for the purpose of:
determining the list of the option benefi ciaries and the -number of options granted to each of them;setting the conditions applicable to the exercise and grant -of the options; the Board of Directors may, in particular, (a) restrict, suspend, limit or prohibit (1) the exercise of options or (2) the sale or conversion into bearer form of the shares obtained through the exercise of the options during certain periods or starting from certain events; its decision may apply to all or part of the options or shares and concern all or certain benefi ciaries, and (b) accelerate the dates or the periods for the exercise of options, maintain their exercisable nature or modify the dates or periods during which the shares obtained from the exercise of options shall not be sold or converted into bearer form; its decision may apply to all or part of the options or shares and concern all or certain benefi ciaries;allow for, as applicable, a lock-up period or a period of non- -delivery to the benefi ciary of the shares obtained from the exercise of the options; such period may not exceed three years as from the exercise of the option.
This delegation to the Board of Directors is granted for a period of 24 months following the date of this Shareholders’ Meeting and invalidates any previous authorization for the same purpose.
In accordance with the provisions of Article L. 225-184 of the French Commercial Code, each year the Board of Directors will inform the Shareholders’ Meeting of the transactions carried out pursuant to the present resolution.
Sixteenth resolutionAuthorization granted to the Board of Directors to grant options for the purchase or subscription of shares to the Chairman of the Board of Directors and/or the Chief Executive Offi cer of Technip (mandataire social)
The Shareholders’ Meeting, acting under the conditions of quorum and majority required for extraordinary shareholders’ meetings, after having reviewed the report of the Board of Directors, and the special report of the Statutory Auditors, and pursuant to Articles L. 225-177 et seq. of the French Commercial Code:
1. Authorizes, subject to the condition precedent of the adop-tion of the fi fteenth resolution, the Board of Directors to allocate, on one or more occasions, to the Chairman of the Board of Directors and/or the Chief Executive Offi cer of Technip (“the Company”), the Company’s managing agent (mandataire social), options to subscribe to new shares to

2412009 Reference Document
Annex: Agenda, Presentation of the Resolutions and Proposed Resolutions
3. Proposed Resolutions E
be issued by the Company through share capital increases or to purchase existing shares of the Company resulting from repurchases carried out by the Company in accordance with legal provisions.
2. Decides that the options that may be allocated by the Board of Directors pursuant to this authorization may not give the right to purchase or subscribe a total number of shares greater than 0.10% of the share capital as of the date of this Shareholders’ Meeting. This amount does not take into account the adjust-ments that may be carried out in accordance with legislative and regulatory provisions.
The options granted to the members of the Executive Committee pursuant to the fi fteenth resolution and, specifi -cally, to the Chairman of the Board of Directors and/or the Chief Executive Offi cer, the Company’s managing agent, pursuant to this resolution (i.e., including the options that would be granted to the Chairman of the Board of Directors and/or the Chief Executive Offi cer within a maximum of 0.10% of the share capital), shall not represent more than 20%, as a whole, of the total number of options authorized by the fi fteenth resolution.
3. Decides that the exercise price will be set by the Board of Directors on the date that the options are granted and that (i) for options to subscribe shares, this price will be undis-counted and equal to the average of the share’s listed price on Euronext Paris over the 20 trading days preceding the date of the grant, and (ii) for options to purchase shares, this price will be undiscounted and equal to the higher of the following: (a) the average purchase price of the shares indicated in Article L. 225-179 of the French Commercial Code, and (b) the average indicated in (i) above.
The exercise price, as determined above, may not be modifi ed except in the event that measures necessary for the protection of the interests of the benefi ciaries of the options are implemented pursuant to Article L. 225-181 of the French Commercial Code and in accordance with legal and regulatory conditions.
The exercise of the options will be subject to the Company’s having achieved a level of performance, to be measured by the evolution over several years of its Consolidated Operating Income in relation to a representative sample of the Group’s competitors and based on the following scale:
if the evolution of the Group’s Consolidated Operating -Income is greater than or equal to that of the sample, all of the options will be exercisable according to the terms and conditions provided in the plan’s regulations;if the evolution of the Group’s Consolidated Operating -Income is greater than or equal to 80% and less than 100% of that of the sample, the portion of the options lost will be determined by linear interpolation between 50% and 100% and according to the terms and conditions provided in the plan’s regulations;if the evolution of the Group’s Consolidated Operating -Income is less than 80% of that of the sample, 50% of the options will be lost according to the terms and conditions provided in the plan’s regulations.Moreover, as a departure from the scale described above, no options, under any circumstances, can be exercised by the Company’s Chairman of the Board of Directors and/or the Chief Executive Offi cer if the progression of the Group’s Operating Income is less than that of each of the companies included in the sample.
4. Acknowledges that no option may be granted less than twenty trading days following the detachment from the shares of a coupon giving right to a dividend or a capital increase.
5. Acknowledges that no option can be granted during (i) the ten trading days preceding and following the date on which the consolidated fi nancial statements or, in the absence of these, the annual statutory fi nancial statements, are made public, and (ii) the period between the date on which the Company’s management bodies receive information that, if it were made public, could have a signifi cant impact on the Company’s share price, and the tenth trading day following the date on which this information is made public.
6. Decides that the options must be exercised within a maximum period of six years as from the date of grant by the Board of Directors; nevertheless, the Board of Directors may set a shorter exercise period for all or part of the options and/or for all or certain of the benefi ciaries.
7. Notes that this resolution automatically acts, in favor of the benefi ciaries of the options to subscribe shares, as an express waiver by the shareholders of their preferential subscription rights with respect to the shares that will be issued as options are exercised.
8. Acknowledges that the benefi ciary’s right to exercise the options will be lost in the event of removal or dismissal for wrongful or gross misconduct (faute grave or faute lourde).
9. Gives all powers to the Board of Directors for the purpose of:
determining the number of options granted to the benefi ciary; -setting the conditions applicable to the grant and exercise -of the options; the Board of Directors may, in particular, (a) restrict, suspend, limit or prohibit (1) the exercise of options or (2) the sale or conversion into bearer form of the shares obtained through the exercise of the options during certain periods or starting from certain events; its decision may apply to all or part of the options or shares, and (b) accelerate the dates or the periods for the exercise of options, maintain their exercisable nature or modify the dates or periods during which the shares obtained from the exercise of options shall not be sold or converted into bearer form; its decision may apply to all or part of the options or shares, within the limits set by the applicable legal provisions;allow for, as applicable, a lock-up period or a period of non- -delivery to the benefi ciary of the shares obtained from the exercise of the options, without prejudice to the provisions of Article L. 225-185, paragraph 4 of the French Commercial Code.
This delegation to the Board of Directors is granted for a period of 24 months following the date of this Shareholders’ Meeting and invalidates any previous authorization for the same purpose.
In accordance with the provisions of Article L. 225-184 of the French Commercial Code, the Board of Directors will inform the Shareholders’ Meeting each year of the transactions carried out pursuant to the present resolution.
Seventeenth resolutionAuthorization granted to the Board of Directors to increase the share capital in favor of employees adhering to a company savings plan
The Shareholders’ Meeting, acting under the conditions of quorum and majority required for extraordinary shareholders’ meetings, after having reviewed the report of the Board of Directors, and the special report of the Statutory Auditors, and pursuant to the

242 2009 Reference Document
Annex: Agenda, Presentation of the Resolutions and Proposed Resolutions
3. Proposed ResolutionsE
provisions of Articles L. 3332-1 et seq. of the French Labor Code and Article L. 225-138-1 of the French Commercial Code, and in accordance with the provisions of Article L. 225-129-6 of the French Commercial Code:
1. Authorizes the Board of Directors to increase, on one or more occasions, the Company’s share capital by a maximum nominal amount not exceeding 1% of the share capital as of the date this authorization is used, through the issuance of shares or securities giving access to the Company’s share capital, reserved for members of a company savings plan of the Company or of the French or foreign companies that are related to the Company in accordance with Article L. 225-180 of the French Commercial Code and Article L. 3344-1 of the French Labor Code.
2. Decides that the subscription price of the new shares will be equal to 80% of the average of the Company’s share prices on the regulated market, Euronext Paris, over the 20 trading days preceding the date of the decision setting the opening date of the subscription period. However, the Shareholders’ Meeting expressly authorizes the Board of Directors to reduce the aforementioned discount, should it deem appropriate, in order to take into account, as the case may be, the legal, accounting, tax and social charges regimes applicable in the countries of residence of the members of a company savings plan who benefi t from the share capital increase. The Board of Directors may also substitute all or part of the discount with a grant of shares for free or other existing or new securities giving access to the Company’s share capital, it being specifi ed that the total amount of the benefi t granted together with, as applicable, the discount, may not exceed the benefi t of a 20% discount.
3. Decides, pursuant to Article L. 3332-21 of the French Labor Code, that the Board of Directors may also decide to grant, for free, existing or new shares, or other existing or new securities giving access to the Company’s share capital, as a matching contribution, provided that their cash value, as compared to the subscription price, does not exceed the limits set forth in Article L. 3332-11 of the French Labor Code.
4. Decides to eliminate the preferential subscription rights of shareholders with respect to the new shares to be issued or other securities giving access to the share capital and to the securities to which such securities give right, which are issued pursuant to this resolution in favor of members of a company savings plan.
5. Decides that the characteristics of the other securities giving access to the Company’s share capital will be determined by the Board of Directors in accordance with the conditions provided for by applicable regulations.
6. Decides that the Board of Directors shall have all powers, with the option to delegate or to sub-delegate, in accordance with applicable legal and regulatory provisions, to implement this resolution, in particular, to set the terms and conditions of transactions, the dates and methods of the issuances that will be carried out pursuant to this resolution, the opening and closing dates of subscription periods, the price, the dividend entitlement dates of securities issued, the methods of paying for shares and other securities giving access to the Company’s share capital, to grant additional time for the payment of the shares and other securities giving access to the Company’s share capital, to request admission to trading of the securities created, to acknowledge the share capital increases in amounts corresponding to the shares that will actually be subscribed, to carry out, personally or through a third party, all transac-tions and formalities related to the share capital increases, to make any necessary changes to the by-laws, and at the Board’s sole discretion and if the Board deems appropriate, to allocate the cost of the share capital increases to the amount of the related premiums and to deduct from such amount the amounts necessary to increase the legal reserve to one-tenth of the new share capital after each increase.
7. Decides that the maximum nominal amount of the share capital increases that may be carried out pursuant to this resolution will be applied toward the maximum nominal amount of €37.5 million set forth in the fi fteenth resolution of the Shareholders’ Meeting of April 30, 2009.
8. Decides that this resolution voids the authorization granted by the Shareholders’ Meeting of April 30, 2009 in its seventeenth resolution.
The authorization granted to the Board of Directors by the present resolution is valid for a period of 26 months following the date of this Shareholders’ Meeting.
Within the authority of the Combined Shareholders’ Meeting
Eighteenth resolutionPowers for formalities
The Shareholders’ Meeting, acting under the conditions of quorum and majority required for combined shareholders’ meet-ings, grants full powers to the bearer of an original, a copy or a certifi ed extract of the minutes of this Shareholders’ Meeting for the purpose of carrying out any legal formalities such as registra-tion, publicity or others.

2432009 Reference Document
Annex: Annual Information Document
Technip
A French société anonyme with a share capital of €83,386,421.26
6-8, allée de l’Arche
Faubourg de l’Arche – ZAC Danton
92400 Courbevoie
France
Nanterre Trade Register No. 589.803.261
Annual Information Document
Prepared in accordance with article 222-7 of the General Regulations of the French fi nancial market authority (Autorité des marchés fi nanciers, or “AMF”)
Covering the period from March 1, 2009 to February 28, 2010In accordance with article 222-7 of the AMF’s General Regulations, the Company, listed on Euronext Paris by Euronext (Code Euroclear France: 13170, Code ISIN: FR0000131708), prepared an annual information document referencing all information published or made public in France over the past 12 months in compliance with legal or regulatory requirements in regards to fi nancial instruments, issuers of fi nancial instruments, and markets for fi nancial instruments.
F

244 2009 Reference Document
Annex: Annual Information DocumentF
This document, which contains the following information, will be posted on the AMF’s website.
Information made public Where the information may be obtained
Periodic information
Press releases on the Company’s fi nancial results ■
Financial results for the 1st quarter 2009(April 30, 2009)
www.amf-france.orgwww.technip.com
Financial results for the 1st half 2009(July 23, 2009)
www.amf-france.orgwww.technip.com
Financial results for the 3rd quarter 2009(November 13, 2009)
www.amf-france.orgwww.technip.com
2009 full year results(February 18, 2010)
www.amf-france.orgwww.technip.com
Quarterly fi nancial information ■
1st quarter 2009 www.technip.comApril 30, 2009
1st half 2009 Financial Report www.technip.comJuly 23, 2009
3rd quarter 2009 www.technip.comNovember 13, 2009
Annual fi nancial statements ■
Approval of the Company’s annual and consolidated fi nancial statements by the Shareholders’ Meeting of April 30, 2009
www.balo.journal-offi ciel.gouv.frNotice No. 0903020 of May 13, 2009
Reference Document ■
Reference Document for the fi scal year ended December 31, 2008 www.amf-france.orgFiling No. D.09-0152 on March 25, 2009
www.technip.com
Information on share capital
Share capital and voting rights ■
Publication of the total number of Technip’s voting rights as of the date of the Shareholders’ Meeting of April 30, 2009
www.balo.journal-offi ciel.gouv.frNotice No. 0903245 of May 15, 2009
Monthly publications on Technip’s share capital and voting rights www.amf-france.orgwww.technip.com
Transactions involving treasury shares ■
Transaction involving Technip’s treasury shares (completed on June 10, 2009) www.technip.comJune 10, 2009
Capital increases
Notice of capital increase following the exercise of share subscription options Register of the Nanterre Commercial CourtNotice No. 9703 of April 2, 2009
Les Petites Affi chesNotice No. 011928 of March 31, 2009
Shareholders’ Meeting
Notice of Shareholders’ Meeting as notice to convene dated March 25, 2009 www.balo.journal-offi ciel.gouv.frNotice No. 0901435 of March 25, 2009
www.technip.com
Notice to convene the Shareholders’ Meeting of April 30, 2009 Les Petites Affi chesNotice No. 013843 of April 15, 2009
www.technip.com
Statutory Auditors’ Reports www.technip.com
2008 Activity and Sustainable Development Report www.technip.com
Statement of Statutory Auditors’ Fee www.technip.com
Annual Information Document (from March 1, 2008 to February 28, 2009) www.technip.com
Chairman’s report on Internal Control www.technip.com
Statutory Auditors’ report on Chairman’s report www.technip.com
Minutes of the Shareholders’ Meeting of April 30, 2009 www.amf-france.orgwww.technip.com
Notice of appointment of three new directors Les Petites Affi chesNotice n°021153 of June 12, 2009
Other press releases (See list attached hereto)

2452009 Reference Document
Annex: Annual Information Document F
Annex to Annual Information Document
2010 Press Releases
February 26, 2010 Technip/Chiyoda awarded a contract for PMP Onshore facilities in QatarFebruary 23, 2010 Technip awarded two contracts for fi eld developments in UK North SeaFebruary 18, 2010 2009 fourth quarter and full year resultsFebruary 15, 2010 Technip awarded Subsea Contract in the Mediterranean seaFebruary 12, 2010 Technip: Charge for potential resolution of the TSKJ Nigeria matter in the US; Q4-09 operating performance
above expectationsFebruary 3, 2010 Release date of 4th quarter and full year 2009 results and conference callJanuary 27, 2010 Technip awarded augmentation pipeline contract at the Broom fi eld in UK North SeaJanuary 25, 2010 Technip and Subsea 7 awarded subsea installation contract for the CWLH redevelopment project in AustraliaJanuary 20, 2010 Technip awarded a subsea contract in West AfricaJanuary 5, 2010 Technip awarded a front end engineering design contract in Venezuela2009 Press Releases
December 21, 2009 Technip awarded a FEED contract for a proposed fl oating LNG unit in BrazilDecember 15, 2009 Technip awarded two contracts for the Schiehallion fi eld in the North SeaDecember 14, 2009 Technip awarded contract for the Wheatstone project processing platform in AustraliaDecember 10, 2009 Technip awarded a subsea contract in EgyptDecember 8, 2009 Technip awarded contract for the Åsgard gas transfer project in NorwayNovember 20, 2009 Technip awarded gas facilities contract in Abu DhabiNovember 19, 2009 Technip and Schlumberger announce joint development agreementNovember 18, 2009 Technip and Saudconsult to establish an engineering center in the Kingdom of Saudi ArabiaNovember 13, 2009 2009 third quarter resultsNovember 9, 2009 Technip awarded a subsea contract for the Appaloosa development fi eld in the Gulf of MexicoOctober 26, 2009 Technip awarded contract for the Goliat fi eld development in NorwayOctober 22, 2009 Technip awarded two contracts for the development of the Jubilee fi eld in GhanaSeptember 25, 2009 Technip awarded a subsea contract for the Isabela development in the Gulf of MexicoSeptember 23, 2009 Technip awarded contract for the Oselvar fi eld development in NorwaySeptember 21, 2009 Technip joins the CAC 40 IndexSeptember 11, 2009 Technip joins StatoilHydro in announcing the inauguration of the world’s fi rst full-scale fl oating wind turbineSeptember 9, 2009 Technip welcomes the FSI as shareholderAugust 25, 2009 Technip awarded a subsea contract for the Ozona project in the Gulf of Mexico August 18, 2009 Technip awarded contract for an oil recovery trial project in Indonesia July 31, 2009 Technip awarded contract by EDF for a gas storage project in Germany July 28, 2009 Shell awards fl oating LNG contracts to Technip and Samsung July 23, 2009 2009 second quarter resultsJuly 17, 2009 Technip awarded two subsea contracts for the Caesar/Tonga fi eld in the Gulf of MexicoJuly 10, 2009 Technip awarded two major contracts for the new Jubail export refi nery in Saudi Arabia July 8, 2009 Release date of 2nd quarter 2009 results and conference callJune 22, 2009 Technip appoints Thierry Parmentier Group Human Resources DirectorJune 22, 2009 Technip awarded contract for a 800,000 tons/year liquefi ed natural gas plant in China June 15, 2009 Technip acquires a new construction support vessel June 4, 2009 Technip awarded a services contract for a proposed new nitrogen complex in Peru June 2, 2009 Technip awarded a contract for the K2 fi eld in the Gulf of Mexico May 28, 2009 Technip expands its technological leadership in ethylene by acquiring intellectual property rights from Heliswirl May 26, 2009 Technip awarded a contract for the Angostura gas project in the Caribbean SeaMay 12, 2009 Technip awarded two contracts by Bluewater Industries in the Gulf of Mexico May 5, 2009 Technip awarded a subsea contract for the Daniel Boone fi eld in the Gulf of Mexico April 30, 2009 Technip post AGMApril 30, 2009 2009 fi rst quarter resultsApril 6, 2009 Chiyoda and Technip join Qatargas 2 in announcing the inauguration of the world’s largest LNG trainsMarch 26, 2009 Technip publishes its “Document de Référence 2008”March 20, 2009 Technip awarded an installation contract for the “Ekofi sk VA” subsea water injection project
at the Ekofi sk fi eld in NorwayMarch 18, 2009 Technip sets world records for ultra deep water pipeline installation March 2, 2009 Technip awarded a services contract for refi nery units in Bulgaria

246 2009 Reference Document
GAnnex: Reconciliation Tables (Annual Financial Report – Management Report)
Annual Financial Report
In order to facilitate reading this document, the reconciliation table hereafter identifi es the location of information comprising the Annual Financial Report, required to be published by listed companies pursuant to article L. 451-1-2 of the French Monetary and Financial Code and article 222-3 of the AMF’s General Regulations, in this Reference Document.
Annual Financial Report Reference Document
1. Company annual fi nancial statements Section 20.2
2. Consolidated fi nancial statements Section 20.1
3. Management report (within the meaning of the French Monetary and Financial Code) See Reconciliation tables below
4. Statement of persons responsible for the annual fi nancial report Section 1.2
5. Statutory Auditors’ reports on the Company’s annual fi nancial statements and the consolidated fi nancial statements
Sections 20.1.1 and 20.2.1
6. Communication relating to the Statutory Auditors’ fees Section 2.3 andSection 20.1.2 Note 34
Section 20.2.6 Note 6.20
7. Report of the Chairman of the Board of Directors on internal control procedures Annex C
8. Statutory Auditors’ report on the report of the Chairman of the Board of Directors on internal control procedures
Annex D

2472009 Reference Document
Annex: Reconciliation Tables G
Management Report
In order to facilitate reading this document, the reconciliation table hereafter identifi es the location of information comprising the Management Report, pursuant to article L. 225-100 et seq. of the French Commercial Code, in this Reference Document.
Management Report Reference Document
1. Position and activity of the Company during the past fi nancial year Sections 3-6.1 and 6.4
2. Advances made or diffi culties encountered Section 6.2
3. Results relating to the Company activity and to the activity of the Company controlled companies
Sections 3.2-20.1.2-20.2.2 and 9.1 to 9.5
4. Research and Development activities Sections 11 and 9.3
5. Forecasted developments in the Company’s position and outlook Section 12.1
6. Landmark events that occurred between the balance sheet date and the elaborating of this Reference Document
Sections 6.1.3 and 20.5
7. Body chosen to serve as the Company’s Management Section 14.2 and Annex C Section 1.1
8. Objective and exhaustive review of the assets and liabilities, fi nancial position and fi nancial results of the Company (in particular their loans relating to the volume and complexity of the business) and the key performance indicators of a fi nancial nature and, where applicable, non-fi nancial nature (particularly concerning the environment and employees)
Sections 9.1 to 9.5 and 10
9. Description of the main risks and uncertainties faced by the Company, and notes concerning the Company’s use of fi nancial instruments, when the use of such instruments is pertinent to the evaluation of its assets, liabilities, fi nancial position, and profi ts or losses
Section 4
10. Company and Company’s controlled companies’ policy regarding fi nancial risk management Section 4.8.9
11. Company and Company’s controlled companies’ exposure to currency, credit, liquidity and tresory risks
Sections 4.5-4.6-4.7
12. List of offi ces or positions held by each of the Directors in all companies during the accounting period
Annex A
13. Report on employee mandatory profi t sharing (as well as those for executives, as the case may be) operations that took place as part of stock options reserved for employees and executives, operations that took place as part of a granting of free shares to employees and executives
Sections 15.1.1-17.2and 17.3
14. Company subsidiaries’ activity and Company controlled companies Section 7
15. Disposal of shares in order to equalize crossed equity interests None
16. Purchase of signifi cant shareholdings in companies based in France or purchase of control of these companies
Sections 7.2 and 20.2 Note 7
17. Information relating to breakdown of the share capital Section 18.1.1
18. Dividends distributed during the last three years Section 20.3
19. Compensation and other Benefi ts granted to Company’s Directors Section 15.1
20. In the event of stock options being granted, mention of the information according to which the Board of Directors decides:
either to prevent executives from exercising their options before they cease to work ■
for the Company;or to impose them to keep part or all of the shares resulting from the options already ■
exercised until they cease to work for the Company
Sections 15.1.1 and 17.2.2
21. In the event of free shares being granted, mention of the information according to which the Board of Directors decides:
either to prevent executives from selling their free shares before they cease to work ■
for the Company;or to set the quantity of free shares that they are obliged to keep until they cease to work ■
for the Company
Sections 15.1.1 and 17.2.2Section 20.1.2
Notes 26 and 33
22. Changes made to the format of the fi nancial statements or to the valuation methods used Section 20.1.2 Note 1
23. Injunctions or fi nancial penalties for antitrust practices None
24. Information on how the Company takes into account the environmental and social impact of its activity
Sections 4.4-6.6 and 17.1
25. Information relating to the risks encountered in the event of fl uctuations of the interest rate, the exchange rate, as well as changes in market price
Section 4.7
26. Information required by article L. 225-211 of the French Commercial Code in cases of transactions carried out by the Company with its treasury shares
Sections 21.1.3 and 21.1.4

248 2009 Reference Document
Annex: Reconciliation Tables G
Management Report Reference Document
27. Summary statement of the transactions relating to shares held by executives Sections 15.1.1 and 17.2.1
28. Table of Company’s results of the last fi ve years Annex B
29. Summary table on ongoing authorizations granted to increase the share capital and implementation of these authorizations in 2009
Section 21.1.4
30. Calculation keys and results relating to possible adjustments of conversion bases and conditions to subscribe or exercise securities which allow an access to the share capital or share subscription and share repurchases or of fi nancial operations
Section 20.1 Note 20-(h)
31. Information required by article L. 225-100 of the French Commercial Code that may have an impact on a public offer
Sections 14.4.2-18.3-18.4 and 21.2
32. Social information Section 17.1
33. Information relating to suppliers’ and clients’ terms of payment Section 20.1.2 Note 16Section 20.2.6 Note 6.8

2492009 Reference Document
HAnnex: Glossary
Biodiesel or Diester Obtained by the transesterifi cation (chemical reaction during which a fat or oil is reacted with an alcohol in the presence of a catalyst) of vegetable oils, is used in a mixture with diesel engines. Biodiesel represents a clean and renewable energy.
Biofuels Fuels produced from biomass (rapeseed, sunfl ower, beets...).
Carbon Dioxide (CO2)
Colorless gas naturally produced in the atmosphere. Human activities, notably the combustion of fossil fuels, can increase the level of carbon dioxide. This phenomenon is believed to have an infl uence on the climate. Carbon dioxide is the main greenhouse gas because of the large quantities released into the atmosphere.
Charter Document which explains Technip’s Values and objectives and provides guidelines for relations with stake-holders as well as the professional conduct of individual employees.
Cracking coils Furnaces in which is realized the cracking process. The latter consist in breaking long-chain hydrocarbons into short-chain hydrocarbons.
Cryogenic fl exible pipe
A thermally insulated fl exible pipe used for the transfer of LNG at a temperature of -162°C, and for the return of the gas, between the terminal or treatment unit (liquefaction or regasifi cation) either onshore, offshore and the transport vessel.
Cryomax® A Technip’s trademark applying to a family of patented processes for cryogenic gas fractionation to recover C2+ (Ethane+) or C3+ (Propane+) hydrocarbons from natural gas and refi nery off-gases.
Delayed coking unit Unit of Thermal conversion of crude residue to produce distillates (naphtha and gas oil) and petroleum coke.
Development (of a gas or oil fi eld)
All operations associated with the exploitation of an oil or gas fi eld.
Engineering All of the detailed studies and design activities required for the execution of an industrial project.
Environmental Impact Assessment
Study which assesses and measures the impact of each major type of pollution (air, water, noise, waste) for all industrial installations prior to start-up.
EP Engineering and procurement.
EPC Engineering, procurement and construction.
EPCI Engineering, procurement, construction and installation.
EPCM Engineering, procurement, construction and management.
Floatover Installation method of an integrated production deck (topsides) on a fi xed or fl oating offshore structure without heavy lift operations.
Flowline A fl exible or rigid pipe, laid on the seabed, which allows the transportation of oil/gas production or injection of fl uids. Its length can vary from a few hundred meters to several kilometers.
FPSO (Floating, Production, Storage and Offl oading)
A converted ship or custom-built vessel used to process oil and gas and for temporary storage of the oil prior to transport.
Gas-to-liquids Conversion of natural gas into liquid carburants (Fisher Tropsch technology).
GK6 technology Technip proprietary technology that allows the furnace to operate on a range of feedstocks from naphta to heavy oils, with a very high selectivity and a long on-stream time. The GK6 technology is used in all Technip steamcracking units operating on liquid feedstocks, as well as in upgrading existing furnaces.
Global Compact International initiative of the United Nations, launched in 2000. It unites businesses, United Nations bodies, labor groups and civil society around 10 universal principles relating to human rights, labor and the environ-ment. Technip has been an offi cial member of the Global Compact since 2003.
HSE (Health, Safety and Environment)
Defi nes all measures taken by Technip to guarantee the occupational health and safety of individuals and the protection of the environment during the performance of it business activities, whether in offi ces or on construction sites.
Hybrid riser A riser confi guration combining both fl exible and rigid pipe technologies.
Hywind wind turbine
Hywind is the fi rst full-scale fl oating wind turbine and has a capacity of 2.3 MW.
Jumper A short section of pipe for the connection of two Subsea or surface structures.
Liquefaction Transformation of natural gas into liquefi ed natural gas by cooling it to a temperature of -162°C.
250 2009 Reference Document
Annex: GlossaryH
Liquefi ed Natural Gas (LNG)
Natural gas, liquefi ed by cooling its temperature to -162°C, thus reducing its volume 600 times, allowing its transport by boat.
Nitrogen Oxides (NOx)
Nitrogen forms a number of oxides such as nitrogen dioxide (NO2), nitric oxide (NO), and nitrous oxide (N2O). Human activity, in particular industrial processes and the combustion of fossil fuels, releases large quantities of nitrogen oxides into the atmosphere which contribute to the formation of smog and ozone at the ground level.
PiP (Pipe-in-Pipe or Flowline)
Steel pipes assembly consisting of a standard production pipe surrounded by a so-called carrier pipe. The gap between the carrier and production pipes is fi lled with an insulation material. As the insulation is protected from the external pressure by the carrier pipe, a high thermal performance material can be used.
PLET Pipeline End Termination.
Polymer A polymer is a material made from a group of macromolecules which have the same chemical nature. It is composed of repeating structural units typically connected by covalent chemical bonds.
Polyolefi ns Polymers made from light olefi ns (linear unsaturated hydrocarbons). The most common polyolefi ns are poly-ethylene and polypropylene.
Polystyrene Polymers made from the monomer styrene.Polystyrene is a thermoplastic resin and is used in many applications such as packaging, toys, construction, electronics…
Refi ning All physical and chemical operations which allow the production of commercial products (gasoline, diesel fuel, lubricants, etc.) from crude oil.
Reeled lay An installation method based on the onshore assembly of rigid steel pipelines made of long sections (typi-cally 1 km) assembled onshore then welded together and spooled onto a vessel-mounted reel for transit and subsequent cost-effective unreeling onto the seabed. Minimum welding is done at sea.
Riser Pipe or assembly of fl exible or rigid pipes used to transfer produced fl uids from the seabed to surface facilities, and transfer injection or control fl uids from the surface facilities to the seabed.
SMAHT Small Amplitude Helical Tubing.
Solvent deasphalting
Extraction process in which heavy gas oil is dissolved in a solvent and heavier matter is separated as asphalt. Feedstock for solvent deasphalting can be atmospheric resid or vacuum resid or a mixture of both.
Spar A cylindrical, partially submerged offshore drilling and production platform that is particularly well-adapted to deep water.
Spool Short length pipe connecting a subsea pipeline and a riser, or a pipe and a subsea structure.
Spoolbase Assembling base for rigid pipeline installed by the reel lay method.
Steamcracker Petrochemical installation using steam to crack hydrocarbon molecules in order to produce ethylene and propylene.
Steel catenary riser A deepwater steel riser suspended in a single catenary from a platform (typically a fl oater) and connected horizontally on the seabed. This confi guration is only possible in very deep water (typically beyond 1,000 m).
Synthesis gas Gas mixture that primarily contains varying amounts of hydrogen and carbon monoxide and often some carbon dioxide.
TPG500 Self-installing fi xed platform which is built equipped and tested onshore before being towed to the production site. Once at the offshore fi eld, the legs of the platform are automatically lowered to the seafl oor. The hull is then raised to its fi nal position by means of a jacking system. While the TPG 500 is a fi xed structure, its installation can easily be reversed and the platform re-installed at a new site.
Topsides Platform surface installations allowing the drilling and/or production and/or processing of hydrocarbons offshore.
Trenching Burying of offshore or onshore pipelines in a trench in order to protect them.
UmbilicalAn assembly of hydraulic hoses, which can also include electrical cables or optic fi bers, used to control subsea structures from a platform or a vessel.


This document is published by the Technip Group Legal Division.
Design: - Paris
Print: April 2010


Société Anonyme with a capital of € 83,386,421.26
Registered Office 6-8, allée de l’Arche,Faubourg de l’Arche, ZAC Danton92400 Courbevoie France
589 803 261 RCS Nanterre Siret 589 803 261 00215
Phone: +33 (0) 1 47 78 21 21Fax: +33 (0) 1 47 78 33 40
www.technip.com