Embed Size (px)
Citation preview
Drägerwerk AG & Co. KGaACapital Markets Presentation
November, 2016
Interim financial reports as well as preliminaries are not audited.
Disclaimer
This presentation contains forward-looking statements regarding the future development of the Dräger Group. These forward-looking statements are based on the current expectations, presumptions, and forecasts of the Executive Board as well as the information available to it to date, and have been made to the best of its knowledge and belief. No guarantee or liability for the occurrence of the future developments and results specified can be assumed in respect of such forward-looking statements. Rather, the future developments and results are dependent on a number of factors; they entail risks and uncertainties beyond our control and are based on assumptions which could prove to be incorrect. Notwithstanding any legal requirements to adjust forecasts, we assume no obligation to update the forward-looking statements contained in this presentation.
This presentation does not constitute an offer of securities for sale or a solicitation of an offer to purchase any securities. No money, securities or other consideration is being solicited by this presentation.
2
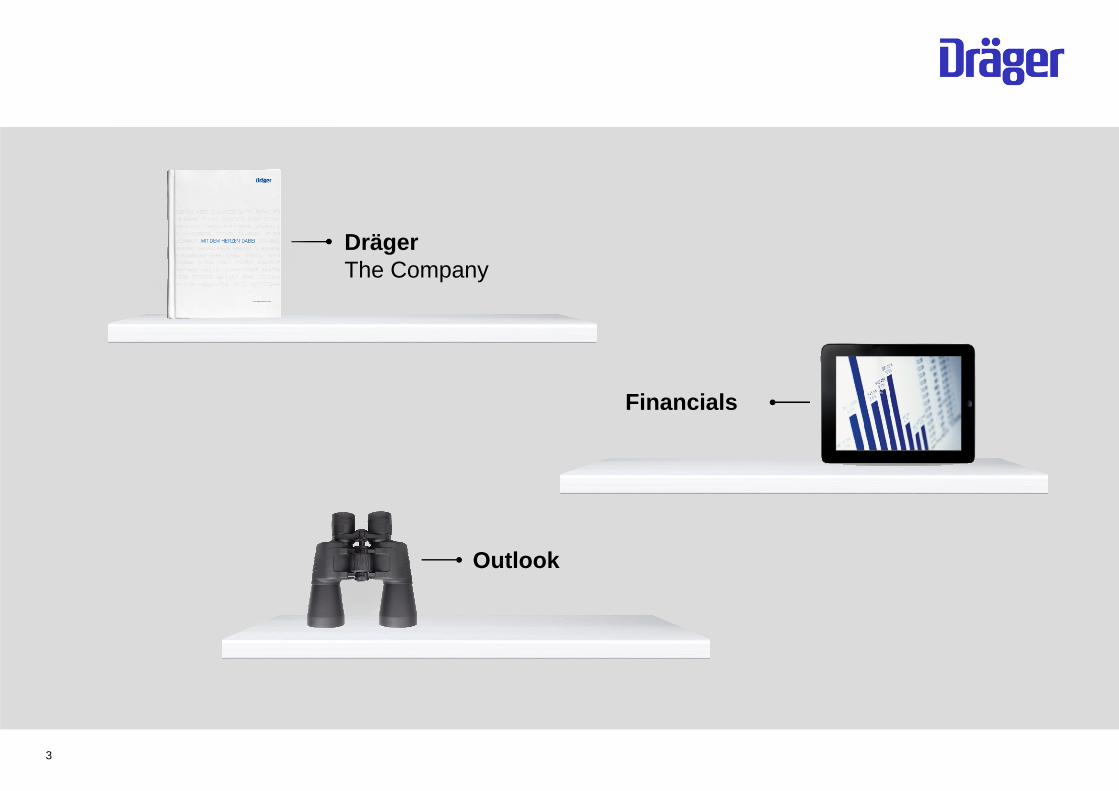
Outlook
DrägerThe Company
Financials
3

DrägerThe Company
4

protectDräger products
supportsave
lives,
and
.
5

Net sales developmentStrong growth independent of the global economy
Source: International Monetary Fund, World Economic Outlook Database
Net sales developmentDräger net sales in EUR million
Global gross domestic product
2,500
2,000
1,500
1,000
500
0
1982
1983
1984
1985
1986
1987
1988
1989
1990
1991
1992
1993
1994
1995
1996
1997
1998
1999
2000
2001
2002
2003
2004
2005
2006
2007
2008
2009
2010
2011
2012
2013
2014
2015
Stock-market crash
Stock-market crash
Stock-market crash
GulfWarGulfWarGulfWar
Mexican pesocrisis
Mexican pesocrisis
Mexican pesocrisis
Russianfinancial
crisis
Russianfinancial
crisis
Russianfinancial
crisis
Stock-marketcrash
Stock-marketcrash
Stock-marketcrash
IraqWarIraqWarIraqWar
Financialcrisis
Financialcrisis
Financialcrisis
6
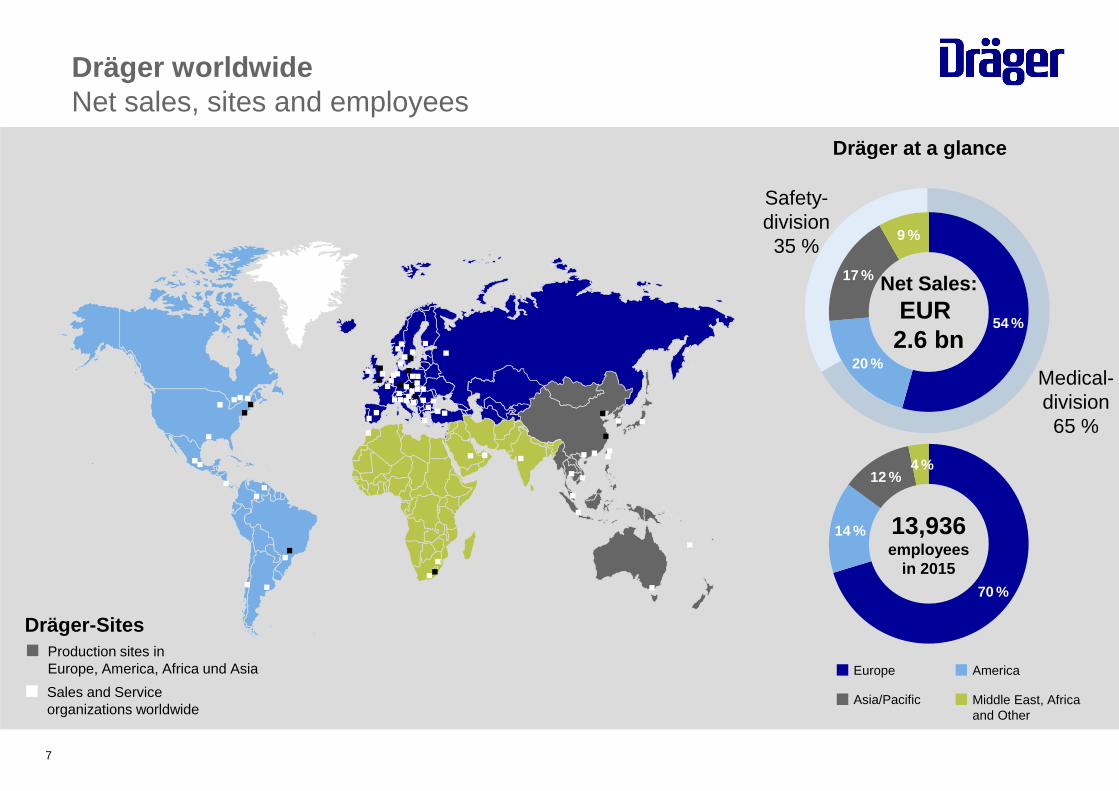
Dräger worldwideNet sales, sites and employees
54 %
20 %
17 %
9 %
70 %
14 %
12 %4 %
AmericaEurope
Middle East, Africaand Other
Asia/Pacific
Dräger at a glance
Net Sales:EUR 2.6 bn
13,936employees
in 2015
Production sites inEurope, America, Africa und Asia
Sales and Service organizations worldwide
Dräger-Sites
Safety-division35 %
Medical-division65 %
7
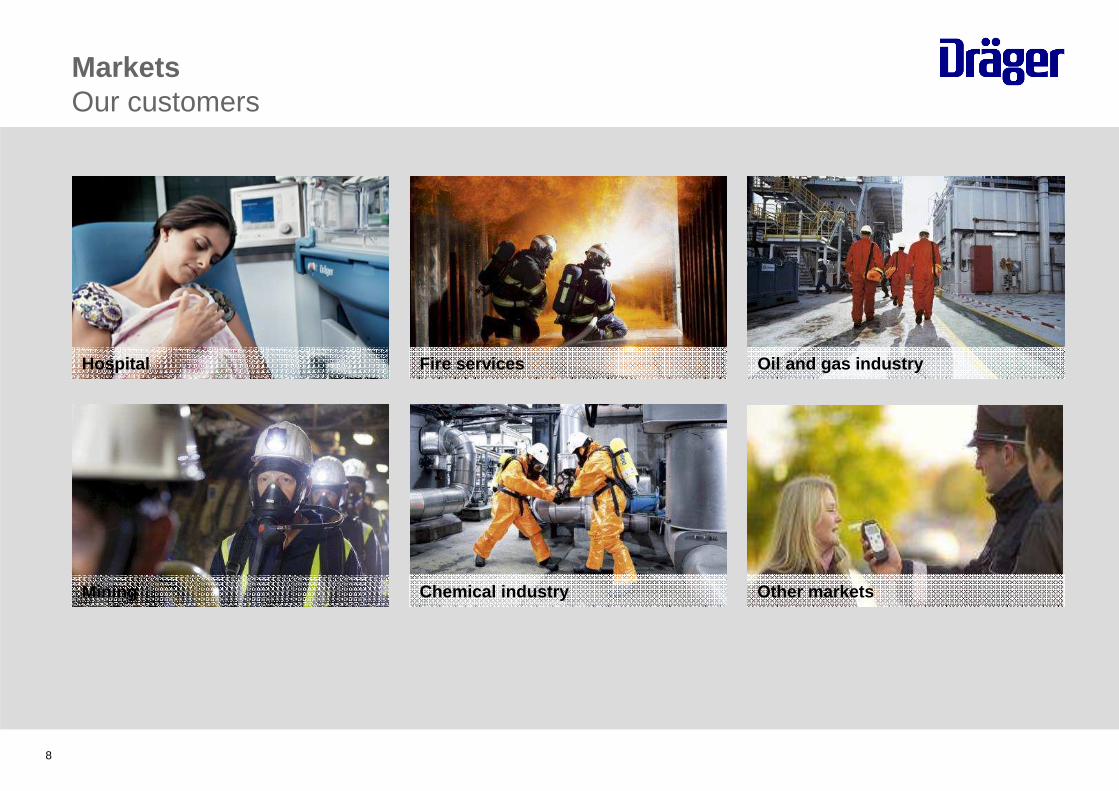
MarketsOur customers
Fire services Oil and gas industry
Mining Chemical industry
Hospital
8
Other markets
9
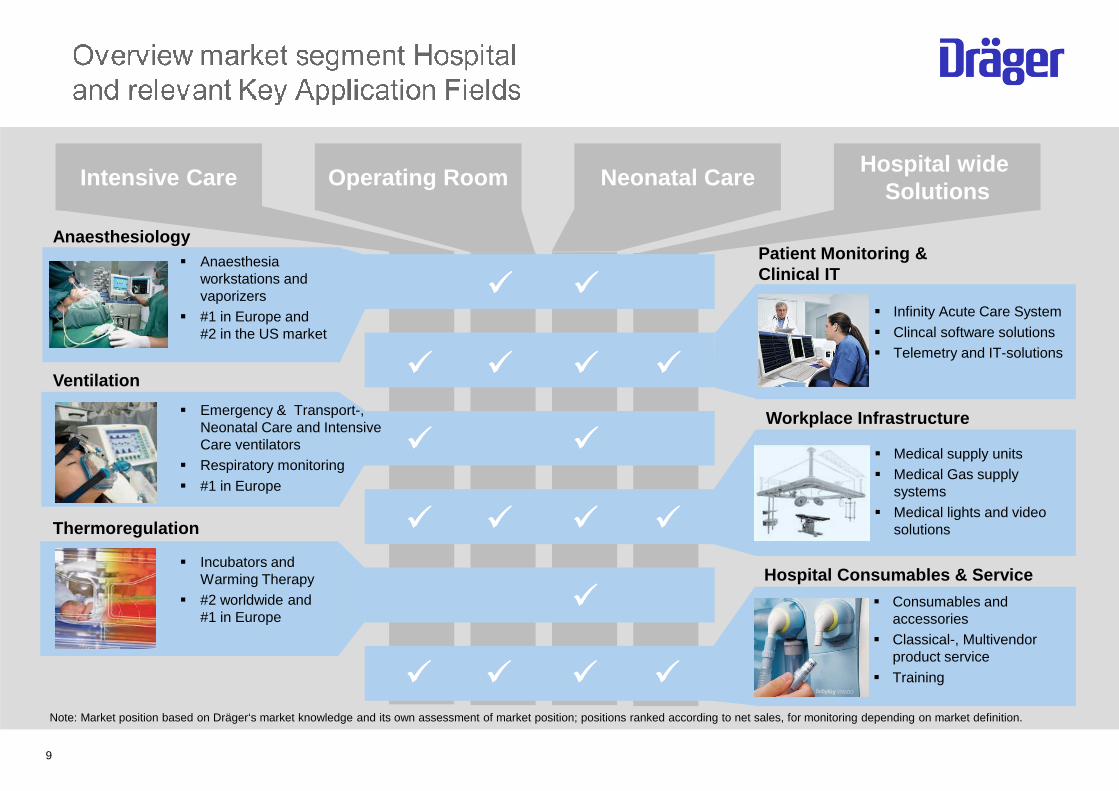
� Infinity Acute Care System � Clincal software solutions� Telemetry and IT-solutions
� Medical supply units� Medical Gas supply
systems � Medical lights and video
solutions
� Consumables and accessories
� Classical-, Multivendor product service
� Training
Anaesthesiology
Ventilation
Thermoregulation
Patient Monitoring & Clinical IT
Workplace Infrastructure
Hospital Consumables & Service
Intensive Care Operating Room Neonatal CareHospital wide
Solutions
�� ��
�� �� �� ��
�� ��
�� �� �� ��
��
�� �� �� ��
Note: Market position based on Dräger‘s market knowledge and its own assessment of market position; positions ranked according to net sales, for monitoring depending on market definition.
� Anaesthesia workstations and vaporizers
� #1 in Europe and #2 in the US market
� Emergency & Transport-, Neonatal Care and Intensive Care ventilators
� Respiratory monitoring� #1 in Europe
� Incubators and Warming Therapy
� #2 worldwide and #1 in Europe

10
Breathing Systems
Gas Detection Systems
Personal Protection Equipment
Impairment Check Equipment
Engineered Solutions
Service
� Fixed and mobile gas detection systems
� #1 worldwide and #1 in Europe
� Alcohol- and drugscreening devices
� Interlock devices� #1 worldwide and
#1 in Europe
� Protection equipment for hazardous working environments
� Body and Head protection, rescue and escape devices, Masks and Filters, etc.
� Self-containedBreathing Appartus forfire fighters
� #2 worldwide and #1 in Europe
� Customer specific solutions
� mobile and stationary firefighting training systems
� Rescue chambers
� Spareparts and consumables
� Classical-, Multivendor-Product Service
� Shutdown and Rental Service
Note: Market positions based on Dräger‘s market knowledge and its own assessment of market position; positions ranked according to net sales.
Fire Service
�� �� �� ��
Oil & Gas Chemical Mining Other Markets
��
�� �� �� �� ��
�� �� �� �� ��
�� �� �� �� ��
��
�� �� �� �� ��
11
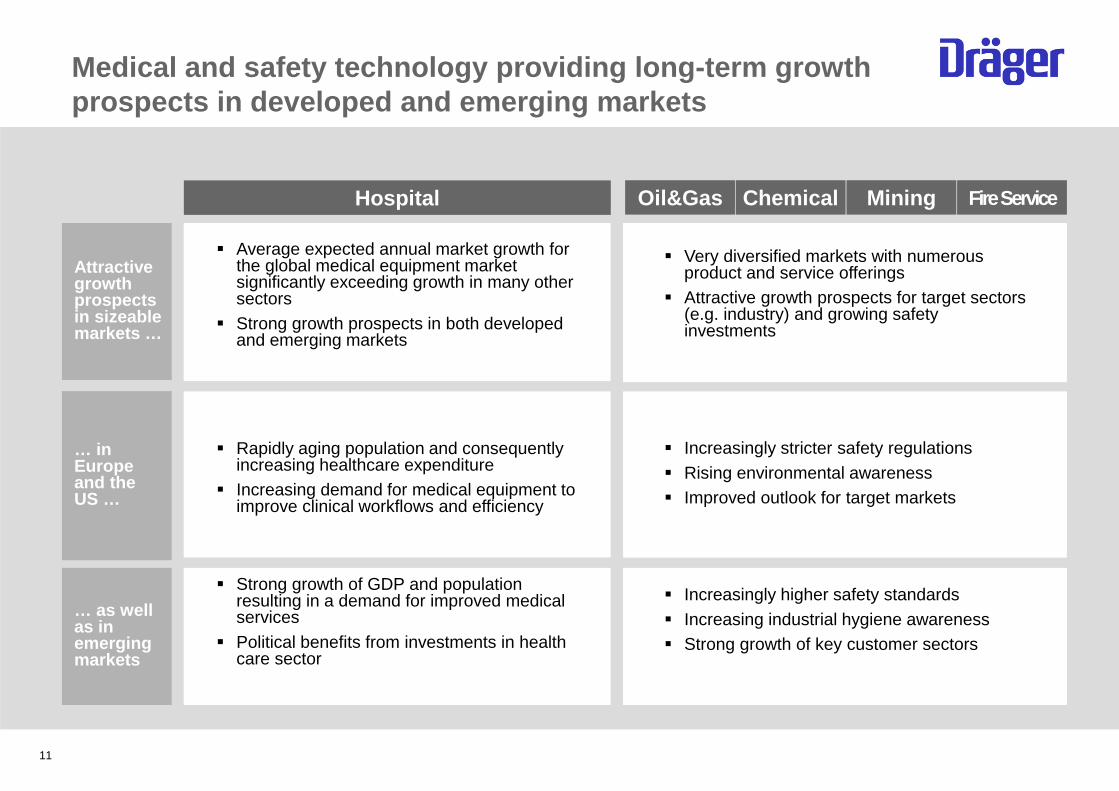
Medical and safety technology providing long-term g rowth prospects in developed and emerging markets
Hospital
Attractive growth prospects in sizeable markets …
… in Europe and the US …
… as well as in emerging markets
Oil&Gas Chemical Mining FireService
� Average expected annual market growth for the global medical equipment market significantly exceeding growth in many other sectors
� Strong growth prospects in both developed and emerging markets
� Very diversified markets with numerous product and service offerings
� Attractive growth prospects for target sectors (e.g. industry) and growing safety investments
� Rapidly aging population and consequently increasing healthcare expenditure
� Increasing demand for medical equipment to improve clinical workflows and efficiency
� Increasingly stricter safety regulations� Rising environmental awareness� Improved outlook for target markets
� Strong growth of GDP and population resulting in a demand for improved medical services
� Political benefits from investments in health care sector
� Increasingly higher safety standards� Increasing industrial hygiene awareness� Strong growth of key customer sectors

12
Management of innovation rate through continuous improvements in quality and R&D processes
Expansion of market positions in attractive markets . Special focus on profitable growth in developing co untries
Expansion of service and consumables business
FIT FOR GROWTH efficiency program
1
2
3
4
Strategy for profitable growth

13
1
Strong R&D focus Innovation to enhance future growth (examples)
Clinical Apps
Software based decision support to improve medical
outcomes. E.g. Smart Pilot View,
Sepsis-Guard
� Approximately 1,400 employees in R&D around the globe
� EUR 231 million spent for R&D activities in 2015 (8.9 % of net sales)
� Tradition of innovation and quality leadership
� Very close collaboration with customers to develop new and improve existing products
� R&D focus on integration of products and services to provide solutions which support customer workflows
� R&D strives to leverage advantage of using same technology for different market segments and products (e.g. in gas sensors)
� Technological competency and high quality standards result in leading market positions and high barriers to entry
Technology and innovation leadership to drive profi table growth
Sensor Portfolio
Permanent expansion of the sensor portfolio:
broad spectrum of detectible gases,
low concentration, high reliability, long
life time
Integration Monitoring and
Anesthesia Device
Anesthesia device Perseus A500 with IACS Monitoring
integration for optimized workflow
in the OR

14
Investments in profitable
growth in developing countries
2
� Focus on the specific needs of customer in developing countries� Identify growth potential in strong growing markets like China, Brazil and India� Capitalize on the significant investments into the Sales & Service infrastructure and
specific market knowledge, especially in our Regions Asia / Pacific, Central- and South-America
� Enhance engagement with partners in developing countries to expand local presence with R&D, manufacturing, sales and after sales business
2
Net sales 2015
Developed Markets
76 %
Newly industrialized
countries24 %
Focused product range
Exploit growth potentials in developing countries
Fabius Plus XLVista 120Savina Color
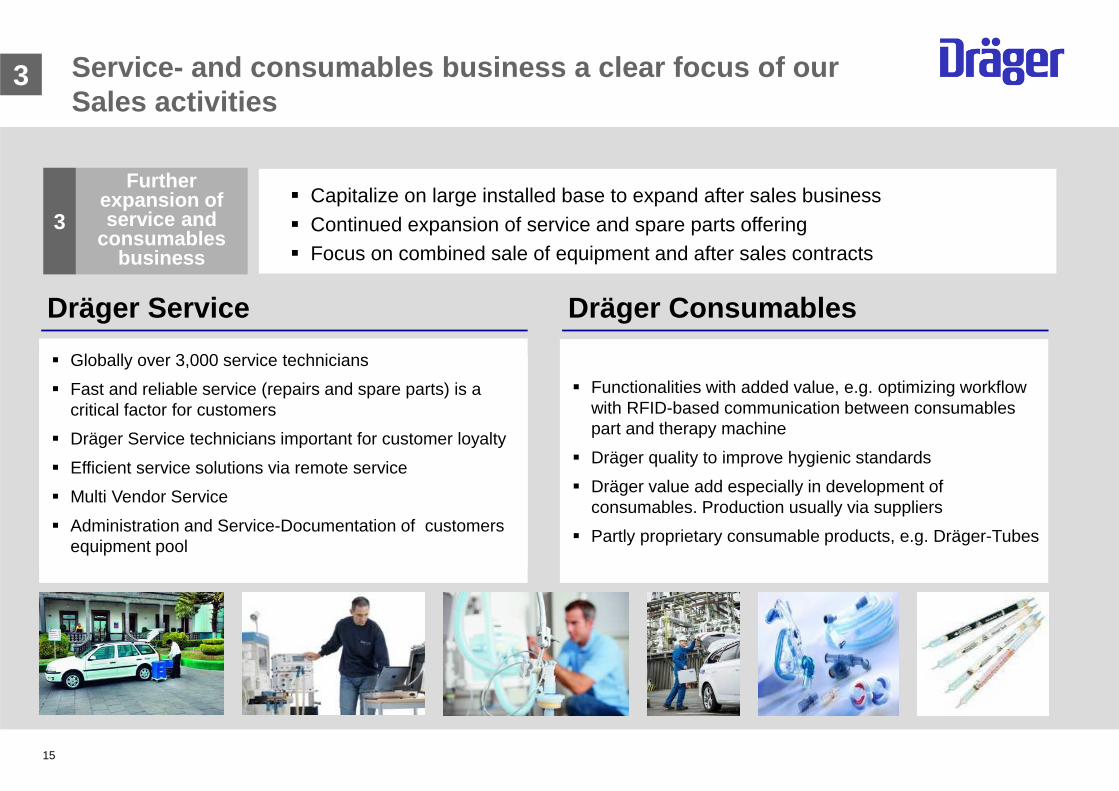
15
Further expansion of service and
consumables business
3
Service- and consumables business a clear focus of o ur Sales activities
3
Dräger Service Dräger Consumables
� Functionalities with added value, e.g. optimizing workflow with RFID-based communication between consumables part and therapy machine
� Dräger quality to improve hygienic standards
� Dräger value add especially in development of consumables. Production usually via suppliers
� Partly proprietary consumable products, e.g. Dräger-Tubes
� Globally over 3,000 service technicians
� Fast and reliable service (repairs and spare parts) is a critical factor for customers
� Dräger Service technicians important for customer loyalty
� Efficient service solutions via remote service
� Multi Vendor Service
� Administration and Service-Documentation of customers equipment pool
� Capitalize on large installed base to expand after sales business� Continued expansion of service and spare parts offering� Focus on combined sale of equipment and after sales contracts

FIT FOR GROWTH Overview Initiatives
� Legal entity consolidation within sales organization� Streamlining, standardization and pooling of central, regional and local tasks and
processes� Effective expense management� Reduction of SGA ratio* to ~30% in 2017
Improve SG & A expense ratio and
working capital
SHAPE Optimize global Sales, Marketing & Administration set-up
Bring customer value faster to the market
and increase innovation share
Fit!
Improve workflow and delivery times
and reduce production cost
Global footprint
� E.g. Improve competency-, capability- and technology management, strengthen system and platform based development, increase global standardization, reengineer launch process to improve ramp-up speed, expand product portfolio targeted at Emerging Markets,…
� Improve “Time to market” by 50% until 2019 and increase innovation share
Optimize innovation set-up
� Investment into „Zukunftsfabrik“ in Lübeck, Germany
� Transfer of production with high labor content to Chomutov, Czech Republic
� Consolidation of US-facilities (closure of Pittsburgh site)
Optimize production set-up
4
16
* at comparable FX rates Jan. 2015 and before possible on-off expenses for restructuring or similar
Financials
17

Business developmentDräger Group
18
Note: 2015 EBIT includes approx. EUR 35 million restructuring charges
2011 2012 2013 9M 2015 9M 2016
million € million € million € million €
Order Intake 2,293.2 2,405.5 1,895.1 1,849.1 -2.4
Net Sales 2,255.8 2,373.5 1,783.6 1,704.3 -4.4 % growth 3.6% 5.2% 7.1% -4.4%% growth (FX adjusted) 4.4% 2.5% 2.3% -2.6%
Gross Profit 1,108.3 1,167.0 793.5 747.6 -5.8 Gross margin 49.1% 49.2% 44.5% 43.9% -0,6pp
Functional Expenses -894.5 -935.4 -787.5 -720.5 -8.5 % of Net Sales -39.7% -39.4% -44.2% -42.3%
EBIT 213.8 230.3 0.2 28.1 >100EBIT Margin 9.5% 9.7% 0.0% 1.6% +1.6pp
Interest Result -33.0 -32.8 -14.4 -12.3 14.6
Net Profit 125.1 135.7 -11.1 12.5 >100
DVA 134.6 150.0 -11.8 6.7 >100
million €
200.8 8.5%
119.9
-23.5
113.9
-942.2 -39.7%
2,384.6
2,374.2 0.0%3.1%
1,147.6 48.3%
104.7
178.6
-25.0
4.0%
1,138.0
81.6
-967.8
7.3%
46.7%
-39.7%
2014 Change
million € %
2,415.5
2,434.7 2.5%
2015
million €
2,532.2
2,608.9 7.2%2.9%
1,171.7 44.9%
-1,098.4 -42.1%
66.7 2.6%
-17.2
33.3
-46.3

Key figures
19
2011 2012 9M 2015 9M 2016
million € million € million € million €
Cashflow (from operating activities) 161.7 176.8 -7.2 90.9 >100
Investments 78.1 78.2 156.7 71.1 -54.6
Cash and cash equivalents1 412.3 332.4 128.7 173.9 35.1
Net financial debt1 39.8 56.8 165.5 121.0 -26.9 Net financial debt 1 /EBITDA 2 0.1 0.2 0.91 0.68
Capital employed 1 880.0 901.9 1,256.4 1,238.7 -1.4 ROCE (EBIT 2 /Capital employed 1 ) 24.3% 25.5% 7.8% 7.6%
Net Working Capital1 362.8 404.1 592.4 553.1 -6.6
Headcount1 11,924 12,516 14,014 13,292 -5.2 1 Values as of reporting date2 EBITDA and accordingly EBIT of the last twelve months
13,334
110.0 0.4
1,052.9 19.1%
524.3
2013
million €
68.3
110.6
232.1
16.1%
0.04
1,107.2
million €
188.0
124.7
296.9
%
10.7
13,737
539.4
Change2014 2015
million €
39.9
196.8
172.8
145.3 0.96
1,269.3 5.3%
582.3
13,936

Outlook
20
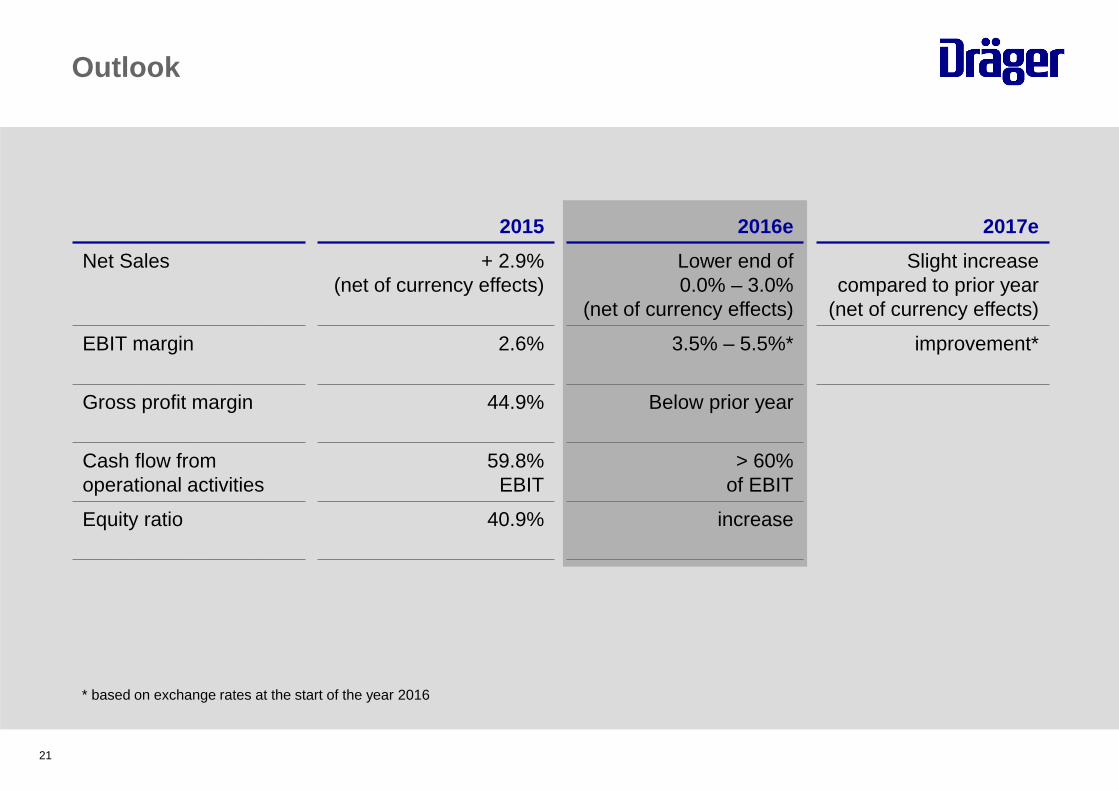
Outlook
2015 2016e 2017e
Net Sales + 2.9%(net of currency effects)
Lower end of0.0% – 3.0%
(net of currency effects)
Slight increasecompared to prior year
(net of currency effects)
EBIT margin 2.6% 3.5% – 5.5%* improvement*
Gross profit margin 44.9% Below prior year
Cash flow fromoperational activities
59.8% EBIT
> 60% of EBIT
Equity ratio 40.9% increase
* based on exchange rates at the start of the year 2016
21
Guiding philosophyWhat we stand for
22

23

Dräger management
Fifth generation of the Dräger family to lead the company
Chairman of the Executive Board (Chief Executive Officer)
At Dräger since 1992
Stefan Dräger
Vice Chairman of the Executive BoardExecutive Board member for Finance and IT
At Dräger since 2008
Gert-Hartwig Lescow
Executive Board member for Purchasing, Production and Logistics
At Dräger since 2015
Rainer Klug Dr. Reiner Piske
Chief Human Resources Officer
At Dräger since 2015
Executive Board member for Innovation and Quality
At Dräger since 2010
Anton Schrofner
Responsible for the Americas region
Responsible for the Europe region
Responsible for the Africa, Asia and Australia regions
24
Guidance 2016
25
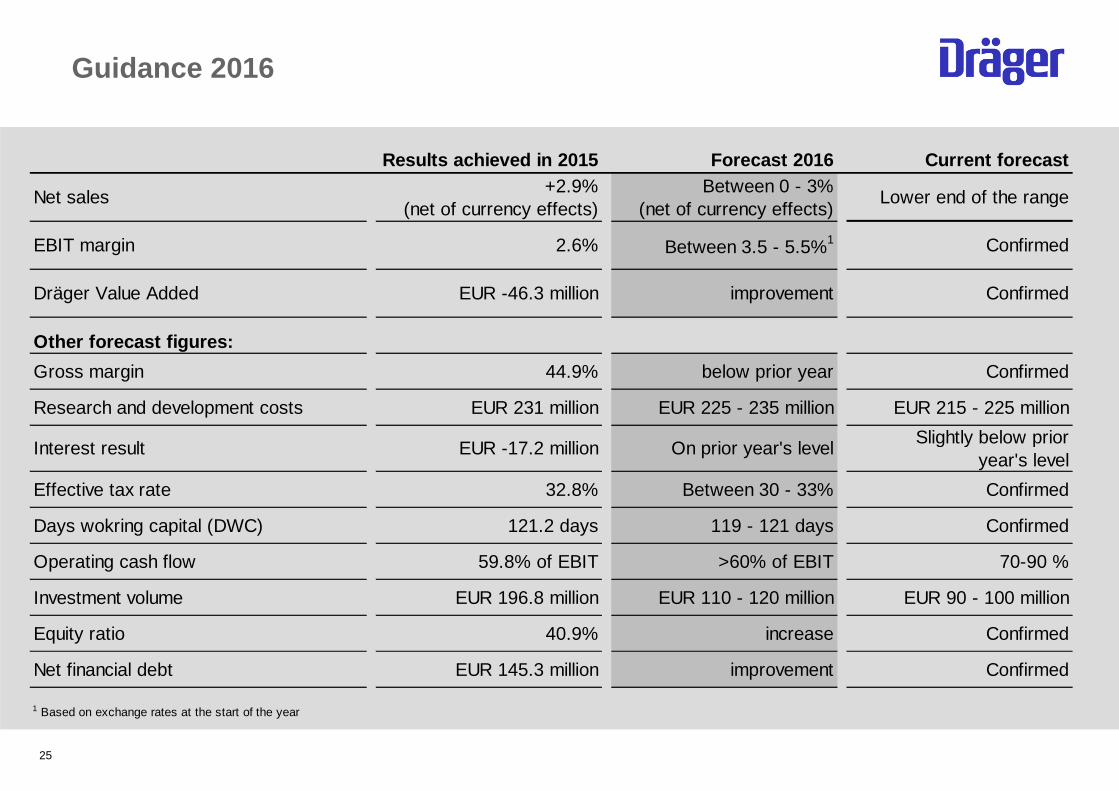
Results achieved in 2015 Forecast 2016 Current foreca st
Net sales+2.9%
(net of currency effects)Between 0 - 3%
(net of currency effects)Lower end of the range
EBIT margin 2.6% Between 3.5 - 5.5%1 Confirmed
Dräger Value Added EUR -46.3 million improvement Confirmed
Other forecast figures:
Gross margin 44.9% below prior year Confirmed
Research and development costs EUR 231 million EUR 225 - 235 million EUR 215 - 225 million
Interest result EUR -17.2 million On prior year's levelSlightly below prior
year's level
Effective tax rate 32.8% Between 30 - 33% Confirmed
Days wokring capital (DWC) 121.2 days 119 - 121 days Confirmed
Operating cash flow 59.8% of EBIT >60% of EBIT 70-90 %
Investment volume EUR 196.8 million EUR 110 - 120 million EUR 90 - 100 million
Equity ratio 40.9% increase Confirmed
Net financial debt EUR 145.3 million improvement Confirmed
1 Based on exchange rates at the start of the year

26
Shareholder structure
ShareholdingCommon shares
67.2 %
28.8%
4.0%
Dr. Heinrich Dräger GmbH
Free float
Members of the Dräger family
10,160,000 common shares (28.8 % free float)7,600,000 preferred shares (100.0 % free float)
ShareholdingDr. Heinrich Dräger GmbH
Stefan Dräger GmbH
Dräger Foundation
Successors of Dr. Heinrich Dräger
58.7%
23.2%
18.1%

Business developmentSegments
27
Europa Amerika Afrika, Asien, Australien Dräger Konzern
Q3 2015 Q3 2016 Q3 2015 Q3 2016 Q3 2015 Q3 2016 Q3 2015 Q3 2016
million € million € million € million € million € million € million € million €
Order entry 345.1 336.7 129.0 134.7 171.6 156.6 645.7 628.0
Net Sales 339.3 325.0 115.8 119.7 149.0 148.2 604.0 592.9
EBITDA 14.7 25.8 -10.3 5.9 -5.1 11.5 -0.7 43.2
EBIT 3.0 15.5 -15.7 0.3 -9.9 6.8 -22.6 22.5
EBIT-margin 0.9 4.8 -13.5 0.2 -6.6 4.6 -3.7 3.8
Capital Employed1 597.3 572.5 270.5 298.5 388.7 367.7 1,256.4 1,238.7
ROCE1,2 15.2 10.7 -5.8 -1.5 5.7 10.3 7.8 7.6
DVA 39.5 20.8 -39.9 -24.9 -11.4 10.8 -11.8 6.7 1 Values at due date2 EBIT of the last twelve months

Business developmentSegments
28
Europa Amerika Afrika, Asien, Australien Dräger Konzern
9M 2015 9M 2016 9M 2015 9M 2016 9M 2015 9M 2016 9M 2015 9M 2016
million € million € million € million € million € million € million € million €
Order entry 1,024.2 1,009.9 368.2 371.2 502.7 468.0 1,895.1 1,849.1
Net Sales 985.6 949.2 348.5 335.9 449.4 419.3 1,783.6 1,704.3
EBITDA 55.3 56.2 -6.8 7.6 13.5 25.9 62.0 89.7
EBIT 23.8 25.7 -22.8 -8.7 -0.9 11.0 0.2 28.1
EBIT-margin 2.4 2.7 -6.5 -2.6 -0.2 2.6 0.0 1.6
Capital Employed1 597.3 572.5 270.5 298.5 388.7 367.7 1,256.4 1,238.7
ROCE1,2 15.2 10.7 -5.8 -1.5 5.7 10.3 7.8 7.6
DVA 39.5 20.8 -39.9 -24.9 -11.4 10.8 -11.8 6.7 1 Values at due date2 EBIT of the last twelve months
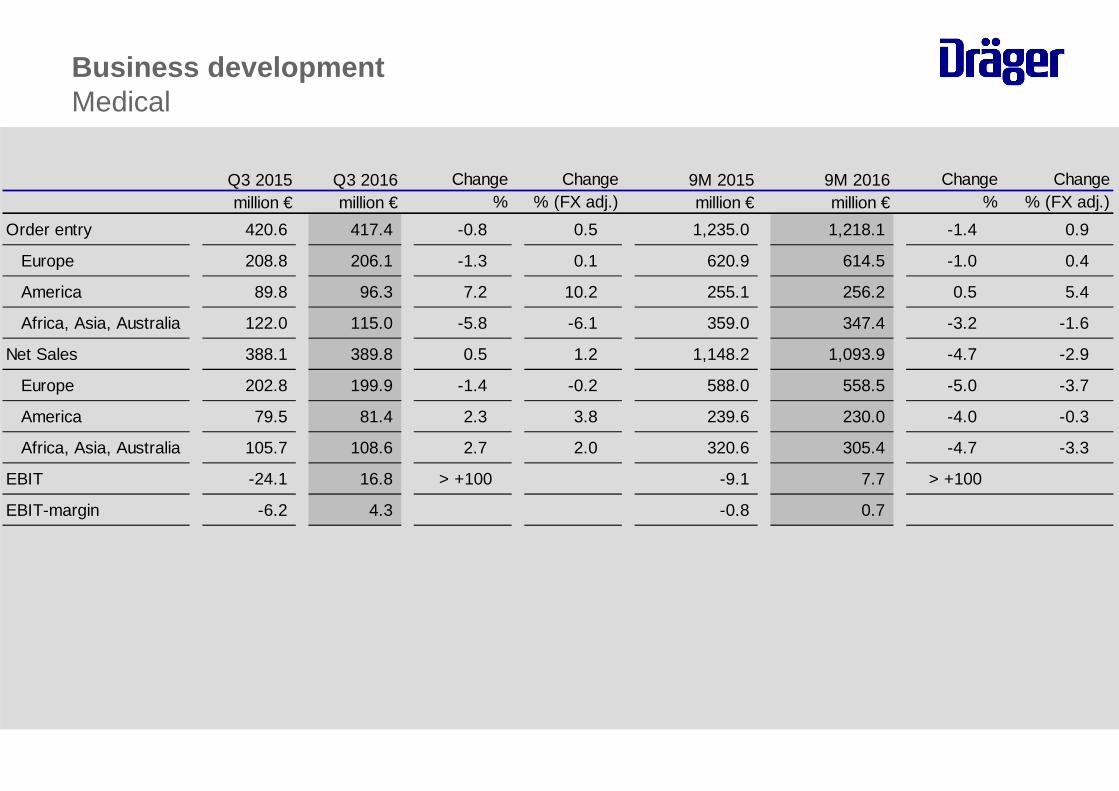
Business developmentMedical
Q3 2015 Q3 2016 9M 2015 9M 2016million € million € million € million €
Order entry 420.6 417.4 -0.8 0.5 1,235.0 1,218.1 -1.4 0.9
Europe 208.8 206.1 -1.3 0.1 620.9 614.5 -1.0 0.4
America 89.8 96.3 7.2 10.2 255.1 256.2 0.5 5.4
Africa, Asia, Australia 122.0 115.0 -5.8 -6.1 359.0 347.4 -3.2 -1.6
Net Sales 388.1 389.8 0.5 1.2 1,148.2 1,093.9 -4.7 -2.9
Europe 202.8 199.9 -1.4 -0.2 588.0 558.5 -5.0 -3.7
America 79.5 81.4 2.3 3.8 239.6 230.0 -4.0 -0.3
Africa, Asia, Australia 105.7 108.6 2.7 2.0 320.6 305.4 -4.7 -3.3
EBIT -24.1 16.8 > +100 -9.1 7.7 > +100
EBIT-margin -6.2 4.3 -0.8 0.7
Change% (FX adj.)
Change% %
Change% (FX adj.)
Change
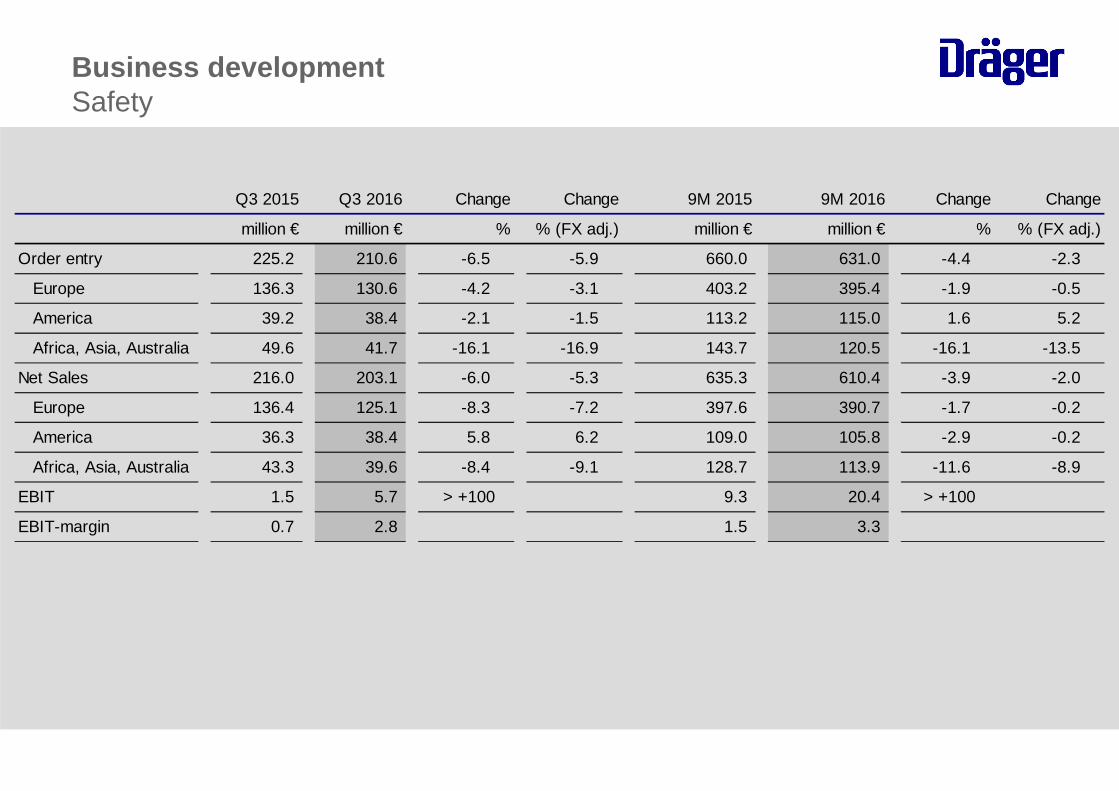
Business developmentSafety
Q3 2015 Q3 2016 9M 2015 9M 2016
million € million € million € million €
Order entry 225.2 210.6 -6.5 -5.9 660.0 631.0 -4.4 -2.3
Europe 136.3 130.6 -4.2 -3.1 403.2 395.4 -1.9 -0.5
America 39.2 38.4 -2.1 -1.5 113.2 115.0 1.6 5.2
Africa, Asia, Australia 49.6 41.7 -16.1 -16.9 143.7 120.5 -16.1 -13.5
Net Sales 216.0 203.1 -6.0 -5.3 635.3 610.4 -3.9 -2.0
Europe 136.4 125.1 -8.3 -7.2 397.6 390.7 -1.7 -0.2
America 36.3 38.4 5.8 6.2 109.0 105.8 -2.9 -0.2
Africa, Asia, Australia 43.3 39.6 -8.4 -9.1 128.7 113.9 -11.6 -8.9
EBIT 1.5 5.7 > +100 9.3 20.4 > +100
EBIT-margin 0.7 2.8 1.5 3.3
Change
% (FX adj.)
Change
%
Change Change
% % (FX adj.)

Functional Expenses
31
2011 2012 9M 2015 9M 2016
million € million € million € million €
R&D -160.5 -197.3 -174.9 -163.4 -6.6 % of Net Sales -7.1% -8.3% -9.8% -9.6%
SG&A -724.8 -735.4 -610.4 -554.5 -9.1 % of Net Sales -32.1% -31.0% -34.2% -32.5%
Functional Expenses total -894.5 -935.4 -787.5 -720.5 -8.5 % of Net Sales -39.7% -39.4% -44.2% -42.3%
-861.2 -33.0%
-1,098.4 -42.1%
-231.1 -8.9%
2015
million €
Change
-30.8%
-967.8 -39.7%
million €
2014
-8.7%
-749.2
-212.0
%
2013
-39.7%
million €
-201.5 -8.5%
-738.4 -31.1%
-942.2
2,311.4
1,400.9
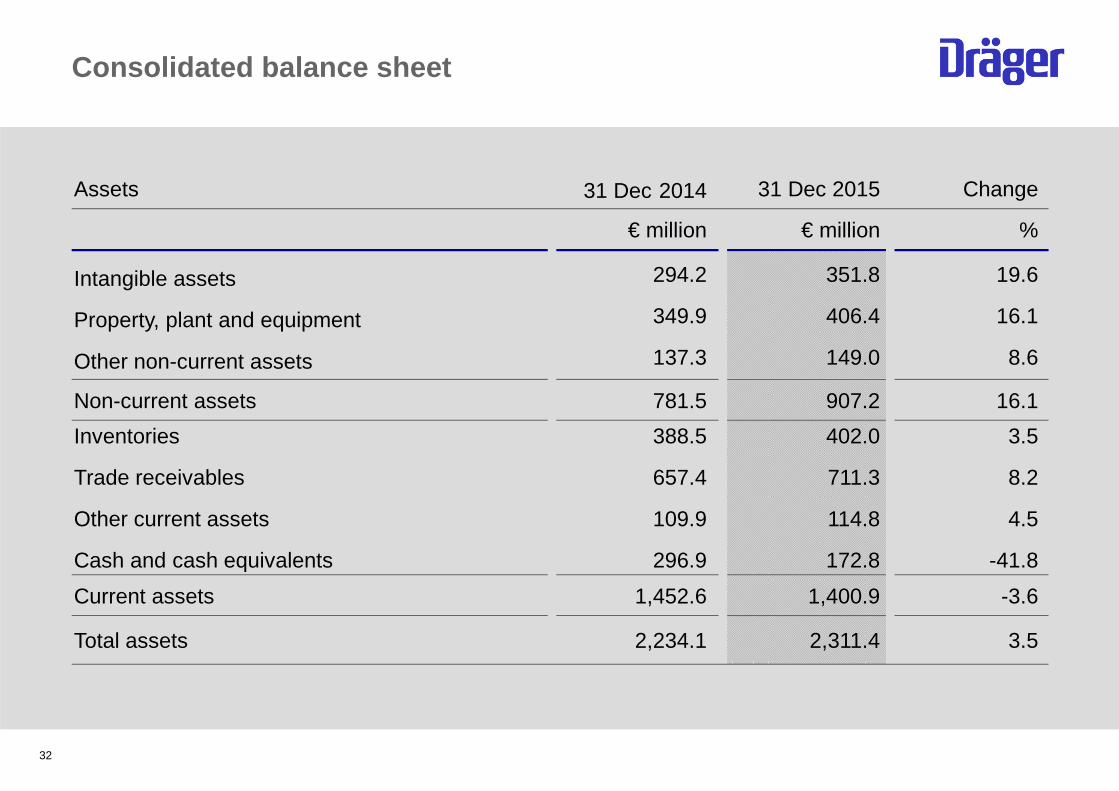
Consolidated balance sheet
€ million
Change31 Dec 201531 Dec 2014Assets
-3.61,452.6Current assets
3.5
8.2
4.5
-41.8
402.0
711.3
114.8
172.8
388.5
657.4
109.9
296.9
Inventories
Trade receivables
Other current assets
Cash and cash equivalents
16.1907.2781.5Non-current assets
19.6
16.1
8.6
351.8
406.4
149.0
294.2
349.9
137.3
Intangible assets
Property, plant and equipment
Other non-current assets
%€ million
3.52,234.1Total assets
32
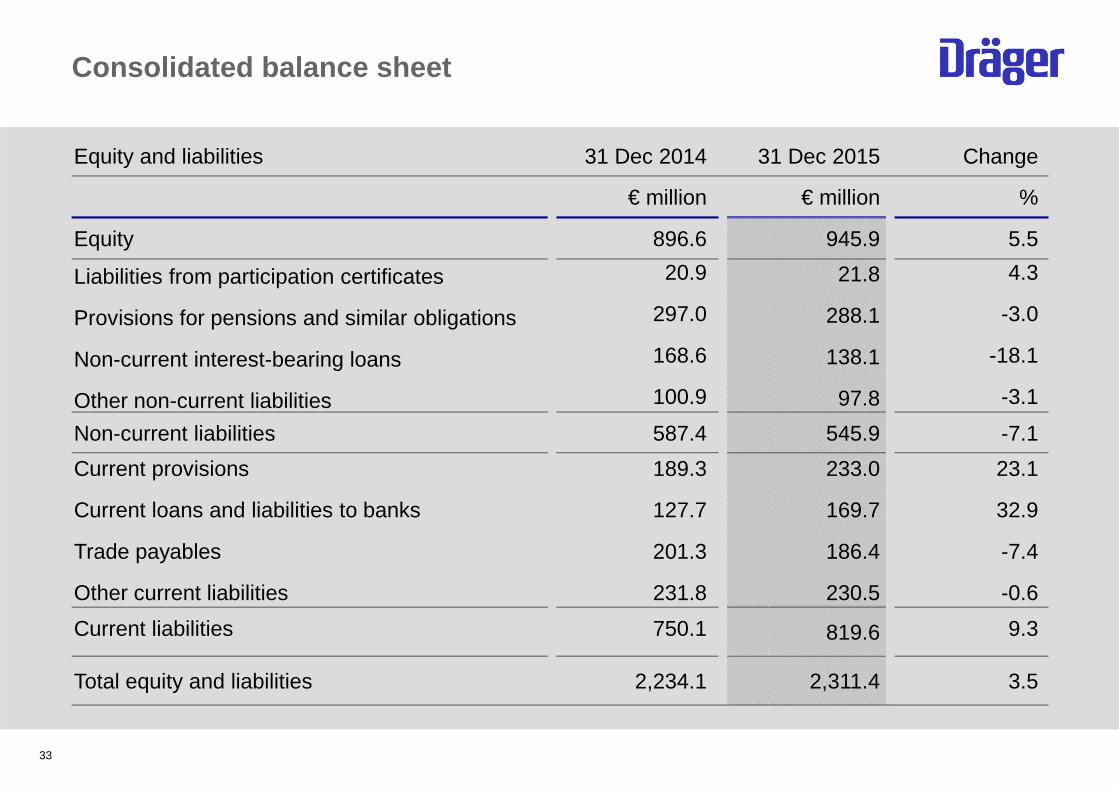
2,311.4
21.8
288.1
138.1
97.8
Consolidated balance sheet
€ million
Change31 Dec 201531 Dec 2014Equity and liabilities
9.3819.6750.1Current liabilities
23.1
32.9
-7.4
-0.6
233.0
169.7
186.4
230.5
189.3
127.7
201.3
231.8
-7.1545.9587.4Non-current liabilities
4.3
-3.0
-18.1
-3.1
20.9
297.0
168.6
100.9
Liabilities from participation certificates
Provisions for pensions and similar obligations
Non-current interest-bearing loans
Other non-current liabilities
5.5945.9896.6Equity
%€ million
3.52,234.1Total equity and liabilities
Current provisions
Current loans and liabilities to banks
Trade payables
Other current liabilities
33
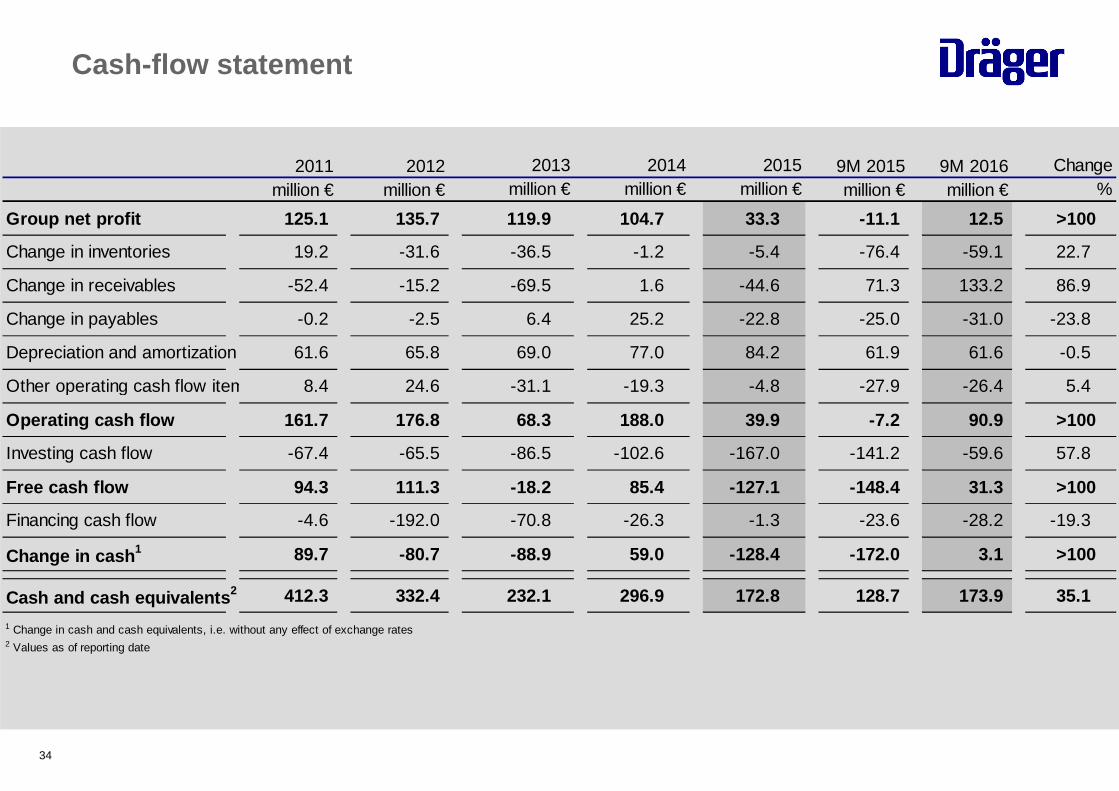
Cash-flow statement
34
2011 2012 9M 2015 9M 2016million € million € million € million €
Group net profit 125.1 135.7 119.9 104.7 33.3 -11.1 12.5 >100
Change in inventories 19.2 -31.6 -36.5 -1.2 -5.4 -76.4 -59.1 22.7
Change in receivables -52.4 -15.2 -69.5 1.6 -44.6 71.3 133.2 86.9
Change in payables -0.2 -2.5 6.4 25.2 -22.8 -25.0 -31.0 -23.8
Depreciation and amortization 61.6 65.8 69.0 77.0 84.2 61.9 61.6 -0.5
Other operating cash flow items 8.4 24.6 -31.1 -19.3 -4.8 -27.9 -26.4 5.4
Operating cash flow 161.7 176.8 68.3 188.0 39.9 -7.2 90.9 >100
Investing cash flow -67.4 -65.5 -86.5 -102.6 -167.0 -141.2 -59.6 57.8
Free cash flow 94.3 111.3 -18.2 85.4 -127.1 -148.4 3 1.3 >100
Financing cash flow -4.6 -192.0 -70.8 -26.3 -1.3 -23.6 -28.2 -19.3
Change in cash 1 89.7 -80.7 -88.9 59.0 -128.4 -172.0 3.1 >100
Cash and cash equivalents 2 412.3 332.4 232.1 296.9 172.8 128.7 173.9 35.1
1 Change in cash and cash equivalents, i.e. without any effect of exchange rates2 Values as of reporting date
2015million €
2014 Changemillion € %
2013million €
35
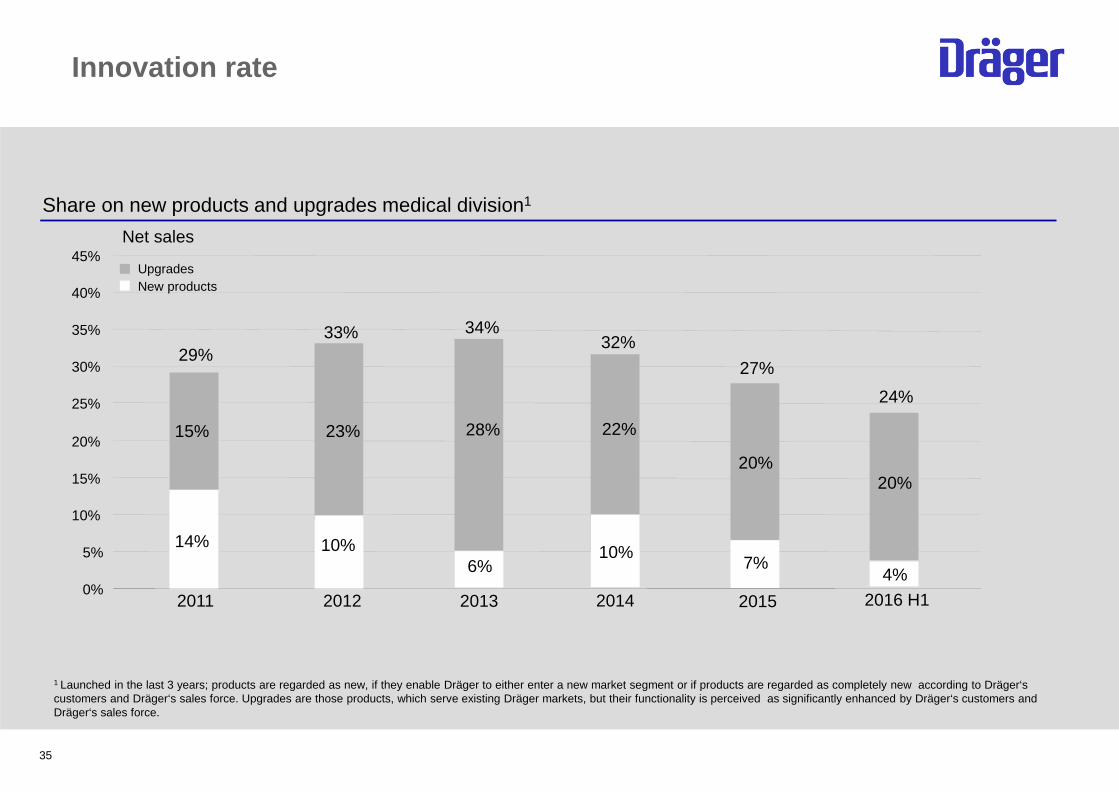
Innovation rate
Share on new products and upgrades medical division1
1 Launched in the last 3 years; products are regarded as new, if they enable Dräger to either enter a new market segment or if products are regarded as completely new according to Dräger‘s customers and Dräger‘s sales force. Upgrades are those products, which serve existing Dräger markets, but their functionality is perceived as significantly enhanced by Dräger‘s customers and Dräger‘s sales force.
New productsUpgrades
Net sales
20%
15% 23%
14%7%
20152011 20120%
5%
10%
15%
20%
25%
30%
35%
40%
45%
10%
27%
33%29%
28%
2013
6%
34%
22%
2014
10%
32%
20%
4%
2016 H1
24%

March 8, 2017 - Accounts press conference, Lübeck- Analysts meeting
May 4, 2017 - Report for the first three months 2017 Conference call, Lübeck
May 10, 2017 - Annual shareholders' meeting, Lübeck
July 27, 2017 - Report for the first six months 2017 Conference call, Lübeck
November 2, 2017 - Report for the first nine months 2017 Conference call, Lübeck
Financial calendar 2017
36

37
Melanie Kamann Thomas FischlerCorporate Communications Investor Relations
Drägerwerk AG & Co. KGaA Drägerwerk AG & Co. KGaAMoislinger Allee 53−55 Moislinger Allee 53−5523558 Lübeck, Germany 23558 Lübeck, Germany
Tel +49 451 882-3998 Tel +49 451 882-2685 Fax +49 451 882-3944 Fax +49 451 882-3296
Mobile +49 170 8558152 Mobile +49 151 12245295
[email protected] [email protected] www.draeger.com
Contact