Embed Size (px)
Citation preview

PAGE 1
Drilling for Innovation: Funding Clean Energy R&D with Oil and Gas Revenue BY MEGAN NICHOLSON AND MATTHEW STEPP | JUNE 2013
The United States faces at least two ostensibly contradictory energy challenges. It must reduce carbon emissions to address global climate change, but new drilling technologies are allowing more domestic oil and natural gas production than ever before. It must significantly invest more public dollars, especially in R&D, to drive down the cost of clean energy, but federal investments in clean energy innovation have remained stagnant since the Stimulus expired. Congress can reconcile these challenges by generating new revenue from oil and gas drilling by opening new lands in exchange for raising drilling fees on federal leases. These new revenues should be directed to fully support key clean energy innovation programs like the Advanced Research Projects Agency-Energy (ARPA-E). Redirecting revenues from drilling to invest in the future of clean energy offers a bipartisan solution to expanding the nation’s energy supply while also mitigating global warming.
INTRODUCTION In 2011, ITIF proposed using a portion of U.S. oil and gas drilling revenue from federal lands to fund critical clean energy innovation programs. The proposal expanded on a similar idea made in 2008 by House Republicans in the American Energy Act, which called for using revenue from expanded drilling to support both fossil fuel and clean energy programs.1 In 2013, Alaska Republican Senator Lisa Murkowski reinvigorated the idea by
PAGE 2 THE INFORMATION TECHNOLOGY & INNOVATION FOUNDATION | JUNE 2013
calling for the creation of an “Advanced Energy Trust Fund” backed by revenue from expanded oil and gas drilling to support a broad set of policies including clean energy innovation.2 Shortly thereafter, Securing America’s Future Energy (SAFE) proposed a scaled-down version that would use a smaller share of oil and gas revenues to support the development of low-carbon and natural gas-based transportation technologies.3 President Obama ultimately made SAFE’s proposal a key part of his second-term energy strategy during his State of the Union address.4
There is already significant precedent in the United States for directing federal revenues toward programs that improve public goods. The federal government uses a federal gas tax to support the Highway Trust Fund that funds surface transportation infrastructure. It also taxed interstate transport of natural gas to fund the Gas Research Institute, which played a critical role in developing the advanced natural gas drilling technologies that underpin today’s gas revolution.5 Over 20 states utilize “system benefit charges” or small fees on utilities or on consumer energy bills to support a clean energy fund to invest in local energy projects.6 And a small amount of federal oil and gas revenue is already dedicated to supporting the Land and Water Conservation Fund, which creates and maintains public recreation areas and facilities on federal lands.
Supporting clean energy innovation by raising revenue from fossil fuel drilling has the makings of a successful innovation policy, backed by both historical perspective and potential bipartisan appeal. New revenues will not be large enough to triple the energy innovation budget as leading experts advocate, but they could be used to target individual, high-impact energy innovation programs that provide a significant bang for the taxpayer’s buck.
Congress can raise a billion dollars in new revenue for strengthening the U.S. innovation ecosystem and fully-funding high-impact research programs like the Department of Energy’s ARPA-E with modest increases to drilling fees and royalty revenues, in exchange for expanding drilling in the Outer Continental Shelf. Part one of this report lays out the challenges impacting public investments in energy innovation. Part two provides details on how oil and gas revenues are collected and distributed today and discusses the policy levers Congress can use to increase government revenue. Part three discusses how Congress can use new revenue to support energy innovation programs within the Department of Energy.
THE UNITED STATES NEEDS TO BOOST PUBLIC INVESTMENTS IN CLEAN ENERGY INNOVATION As one of the leading challenges of the 21st century, mitigating climate change requires the United States and other countries to replace fossil fuels with clean energy technologies. But existing clean energy technologies, which remain dependent on government subsidies and mandates, are not yet cost and performance competitive with fossil fuels, limiting the potential for widespread deployment. To seriously address global climate change, clean energy must be cheap enough to replace all carbon-based fuel in the United States as well as around the world.
Supporting clean energy innovation by raising revenue from fossil fuel drilling has the makings of a successful innovation policy, backed by both historical perspective and bipartisan appeal.

PAGE 3 THE INFORMATION TECHNOLOGY & INNOVATION FOUNDATION | JUNE 2013
In most cases reaching this goal will take more than incremental improvements in the technology, more than subsidies for existing technology, and more than support for uncompetitive technologies like Solyndra. Significant innovation-based breakthroughs are necessary, which demands substantial and strategic investments in basic and applied science, development, testing, prototyping, demonstration, and temporary support of early-stage deployment of clean energy technologies.7
Unfortunately, the United States has failed to create a comprehensive energy policy that provides robust and consistent support for innovation. The current energy innovation ecosystem is underfunded by both private and public sectors. According to a 2010 report by the Breakthrough Institute, “U.S. energy firms reinvest well below one percent of their revenues in R&D, with much of that amount chiefly spent on improving current technologies instead of developing new ones.”8 Significant capital investment and long development timescales make major investments in energy innovation too risky for the private sector.
Figure 1: Actual RD&D investment vs. leading experts’ recommendations for RD&D investment9
According to ITIF’s Energy Innovation Tracker, public investments in research, development, demonstration, and early-stage deployment are significantly below what leading thinkers and experts argue today’s climate and energy challenges merit.10 Figure 1 shows the recent trend in federal investment in basic science, research, development, and demonstration of clean energy technologies during the past four fiscal years. These levels are in stark contrast to the recommendations of climate and energy leaders in industry, academia, nonprofits, and the public sector. These leaders have called for, on average, tripling clean energy RD&D investment (orange bar in Figure 1). The necessary investment levels are even greater when considering early-stage deployment incentives that
$0
$2
$4
$6
$8
$10
$12
$14
$16
2009 2010 2011 2012 Recommended
Billions
American Recovery and Reinvestment Act
Actual Basic Science and RD&D Investment
Recommended Basic Science and RD&D Investment
PAGE 4 THE INFORMATION TECHNOLOGY & INNOVATION FOUNDATION | JUNE 2013
drive innovation (such as Department of Defense procurement), bringing recommended investments to $25-$30 billion per year. Even the American Recovery and Reinvestment Act (ARRA)—which boosted funding for energy innovation in 2009 and 2010 (light blue bars in Figure 1)—only modestly increased public investments. More so, its impact was only temporary as many ARRA projects have since concluded or expired. For example, public investments in clean energy demonstration projects have fallen from 6 percent of total clean energy spending in 2011 to 0.2 percent in 2012; likewise, federal investments in clean energy manufacturing declined 92 percent between 2009 and 2012.11 The federal government’s breakthrough clean energy research program ARPA-E is operating at less than one-third of its recommended budget of $1 billion a year.12 And the Department of Energy’s (DOE) Office of Science, which invests in basic energy research, is almost 25 percent below the funding trajectory legislated in the America COMPETES Act, which called for its budget to double by 2018.13
This kind of boom and bust funding cycle does little to foster the level of revolutionary clean energy development necessary to lead the country—and the rest of the world—toward a carbon-free future. Constructing a successful and enduring energy innovation ecosystem requires significant public investment and a substantial, long-term policy commitment to the energy innovation ecosystem that the annual budget appropriations process has failed to provide.
A PRIMER ON OIL AND GAS DRILLING REVENUES The United States has collected revenues from oil and gas drilling on federal lands for over one hundred years. This revenue is distributed by the Treasury to different funds marked for specific purposes or available to Congress to appropriate as it sees fit. If directed by Congress, revenue from oil and gas drilling on federal lands could support consistent investment in energy innovation.
Sources of Oil and Gas Revenue The federal government collects revenue from oil and gas extraction from drilling on onshore and offshore federal lands. Revenues are collected at multiple stages throughout the development and production process.
The process begins when the government makes new parcels of onshore and offshore land—called leases—available for drilling, and in response, interested parties make “bonus bids” to secure the lease. The highest bidder is awarded the rights to lease the land.14 Once the lease is signed, but before the land begins to produce oil or gas, the leaseholder must pay yearly “rent” per acre to maintain the lease, typically while the leaseholder explores and prepares for drilling. When the land becomes productive (i.e., produces oil or gas), the leaseholder is required to pay a percentage of the cash value of oil or gas produced and sold, called the “royalty rate.”15 Throughout the process the government collects additional revenue from leaseholders in the form of interest payments on royalties, inspection fees, corporate taxes, and other administrative costs (hereafter called “other” revenue).
Boom and bust funding cycles do little to foster the kinds of revolutionary clean energy development necessary to lead the country—and the rest of the world—toward a carbon-free future.

PAGE 5 THE INFORMATION TECHNOLOGY & INNOVATION FOUNDATION | JUNE 2013
The majority—$6.6 billion in FY2012—of federal drilling revenue comes from offshore acres leased by drilling companies from the federal government. In comparison, drilling revenue from onshore leases usually totals about $4.1 billion per year.16 The following sections summarize how much revenue each stage of the drilling process generates.
Bonus Bids The U.S. Bureau of Ocean Energy Management (BOEM), which oversees the development of offshore natural resources, found that there are three important determinants of the size of a bonus bid on an oil or gas lease: (1) the potential productivity of a particular lease; (2) expected future oil and gas prices; and (3) the government’s system of sharing risks and profits between public and private entities throughout the exploration and development process.17 In other words, there is no guaranteed income for the leaseholder after a bonus bid is paid. Instead, the bonus bid reflects the opportunity cost of exploration and production on federal lands.18
Figure 2: Onshore and offshore drilling revenue from bonus bids
For most years, there is a significant difference between the size of total onshore and offshore bonus bids. Onshore bonus bids have averaged about $551 million annually in total revenue during the last 10 years, while offshore bonus bids have averaged nearly $1.5 billion per year. Eighty-two percent of offshore bonus bid revenue comes from leases in the Gulf of Mexico, where average bonus bids for a lease can be as low as $250,000 or as high as $100 million for leases in deep-water areas. In comparison, onshore bonus bids range from $50 to $600 per lease.19 This difference depends on estimates of possible oil and gas production capacities based on geology, technology capabilities, and price volatility.
In recent years the volatility of oil and gas production and prices has significantly impacted bonus bid revenue. The spike in bonus bid revenue in 2008 (shown in Figure 2) reflects the dramatic increase in oil prices, which reached $147 per barrel. 20 High commodity prices prompted very high bonus bids for only four new leases made available by the Department of the Interior, in the Gulf of Mexico and Alaska’s Chukchi Sea. Late in 2008,
$0
$2,000
$4,000
$6,000
$8,000
$10,000
1982 1987 1992 1997 2002 2007 2012
Millions
Total Offshore Bonus Bids
Total Onshore Bonus Bids
The majority—$6.6 billion in FY2012—of federal drilling revenue comes from offshore acres leased by drilling companies from the federal government. In comparison, drilling revenue from onshore leases usually totals about $4.1 billion per year.

PAGE 6 THE INFORMATION TECHNOLOGY & INNOVATION FOUNDATION | JUNE 2013
Hurricanes Ike and Gustav slowed offshore production, and the impacts of the global recession reduced demand for oil—prices fell 45 percent between 2008 and 2009.21 Slow offshore development and exploration continued into 2009 while producers in the Gulf of Mexico continued to repair storm-damaged infrastructure. Consequently, disrupted development and low prices drove bonus bid revenue back to average levels after 2008.
Figure 3: Offshore drilling bonus bid revenue by region Rents As soon as a leaseholder signs a lease, they must pay the federal government rent per acre of land each year until the lease becomes productive. The Department of Interior determines the rent based on the estimated value of the leased land, which considers the geological capacity for oil or gas production, as well as the risk of exploration to the leaseholder. While bonus bid revenue received within a single year can differ by hundreds of dollars by location, rents on federal land differ by only a few dollars per acre (Table 1).
Average Bonus Bids Average Rents
Onshore $50-$100 per acre < $1.00 per acre
Offshore – Alaska $100-$200 per acre $1-2 per acre
Offshore – Gulf of Mexico $400-$800 per acre $6.75 per acre
Table 1: Comparison of bonus bids vs. rents per acre by drilling location and depth22
The rental period is temporary by nature, since paying rent ideally encourages the leaseholder to explore and develop the land as quickly as possible, although weather and other economic factors can change the pace at which this is accomplished. As a result, revenues from rents vary (Figure 4). Onshore rental revenue decreased by about 50 percent from the mid-1980s to 2012, while rental revenues from offshore leases grew 10 times during the same time period. Offshore lands—especially deep-water leases—require more intensive exploration and development, which demands longer rental periods. But despite
$0
$2,000
$4,000
$6,000
$8,000
$10,000
1982 1987 1992 1997 2002 2007 2012
Millions
Atlantic
Pacific
Alaska
Gulf of Mexico
PAGE 7 THE INFORMATION TECHNOLOGY & INNOVATION FOUNDATION | JUNE 2013
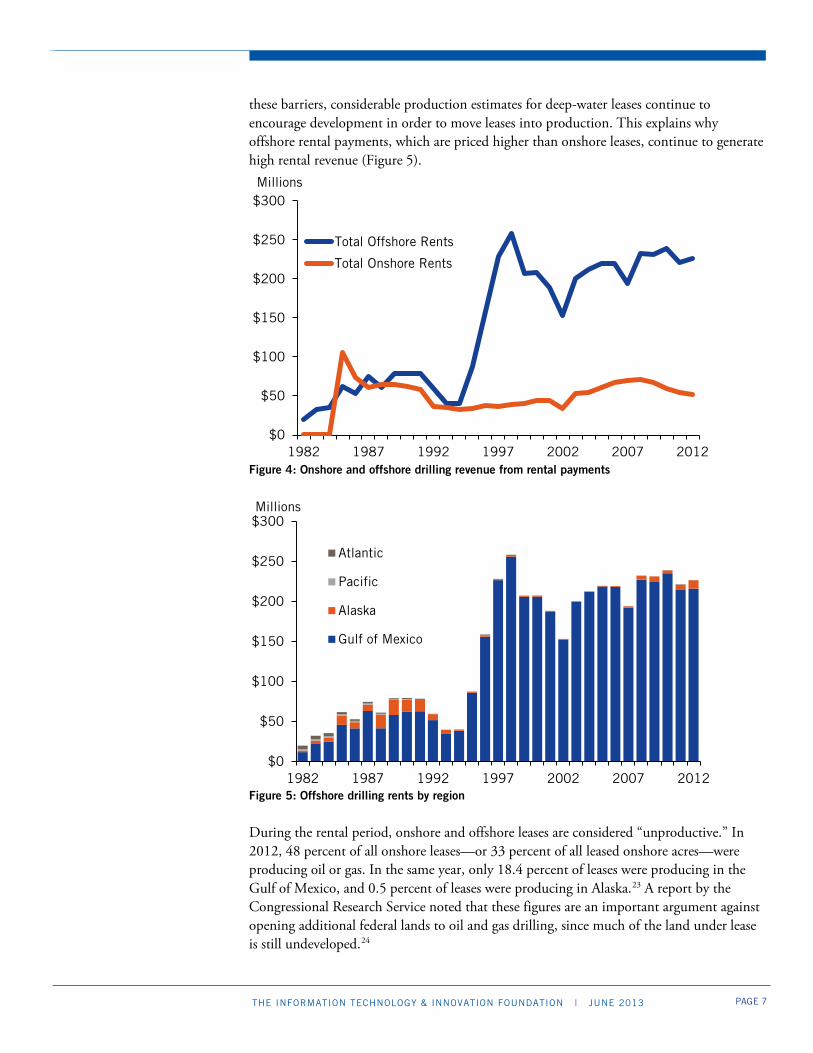
these barriers, considerable production estimates for deep-water leases continue to encourage development in order to move leases into production. This explains why offshore rental payments, which are priced higher than onshore leases, continue to generate high rental revenue (Figure 5).
Figure 4: Onshore and offshore drilling revenue from rental payments
Figure 5: Offshore drilling rents by region
During the rental period, onshore and offshore leases are considered “unproductive.” In 2012, 48 percent of all onshore leases—or 33 percent of all leased onshore acres—were producing oil or gas. In the same year, only 18.4 percent of leases were producing in the Gulf of Mexico, and 0.5 percent of leases were producing in Alaska.23 A report by the Congressional Research Service noted that these figures are an important argument against opening additional federal lands to oil and gas drilling, since much of the land under lease is still undeveloped.24
$0
$50
$100
$150
$200
$250
$300
1982 1987 1992 1997 2002 2007 2012
Millions
Total Offshore Rents
Total Onshore Rents
$0
$50
$100
$150
$200
$250
$300
1982 1987 1992 1997 2002 2007 2012
Millions
Atlantic
Pacific
Alaska
Gulf of Mexico

PAGE 8 THE INFORMATION TECHNOLOGY & INNOVATION FOUNDATION | JUNE 2013
Royalty Revenues Royalty revenue is a percentage of the cash value of the oil and gas sold from a productive lease; therefore it is specifically tied to commodity prices and levels of production.25 Figure 6 shows royalty revenue generated from both onshore and offshore leases. In total, between 2003 and 2012, onshore and offshore oil and gas royalties amounted to $88.2 billion, making it by far the largest source of government revenue from drilling. On average, royalty revenue makes up about 76 percent of all collected revenue from offshore leases and 84 percent of all onshore leases.
According to the Office of Natural Resource Revenue (ONRR), onshore gas development grew slowly in the early- to mid-2000s because much of the stores on federal lands were found in remote locations—production in these places could not proceed without significant infrastructure development.26 In its “2007 Year in Review,” ONRR noted that demand for natural gas was expected to increase, however significant infrastructure investment would be necessary to access federal lands for onshore gas production.27 By 2011 leaseholders completed many of these infrastructure improvements, increasing both onshore production and federal revenue.28
Figure 6: Onshore and offshore drilling revenue from royalties
Other Revenues The federal government collects revenue from a number of “other” sources as well, including—but not limited to—minimum royalty payments, settlement agreements, and interest.29 Minimum royalty payments are payments made at the end of the year if production royalties do not exceed the minimum royalty required by the lease.30 Additionally, the federal government collects revenue in the event of a settlement agreement, which can occur when a state or tribal group has a dispute with the oil producer over the terms of lease.31 The federal government also collects interest payments on expected revenue beginning 60 days after the first sale until the royalty payment is made.32
$0
$2,000
$4,000
$6,000
$8,000
1982 1987 1992 1997 2002 2007 2012
Millions
Total Offshore RoyaltyRevenuesTotal Onshore RoyaltyRevenues
PAGE 9 THE INFORMATION TECHNOLOGY & INNOVATION FOUNDATION | JUNE 2013
These payments vary year to year, but usually average about $50 million annually for both onshore and offshore drilling.
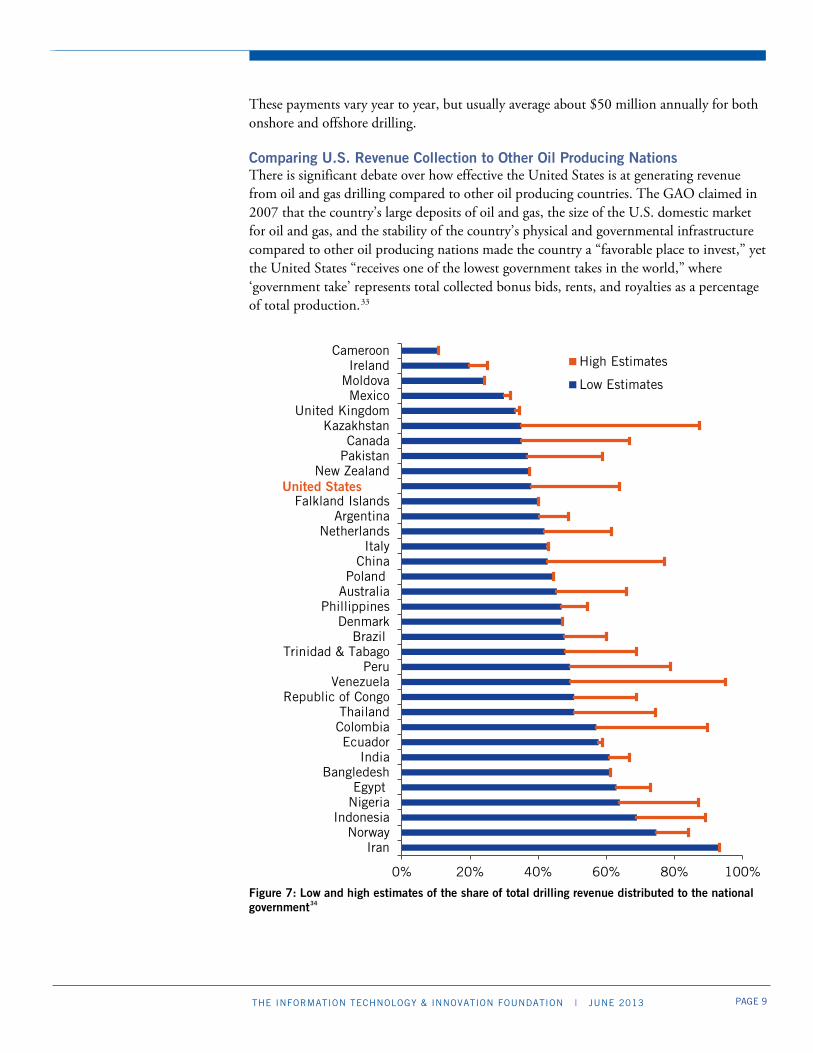
Comparing U.S. Revenue Collection to Other Oil Producing Nations There is significant debate over how effective the United States is at generating revenue from oil and gas drilling compared to other oil producing countries. The GAO claimed in 2007 that the country’s large deposits of oil and gas, the size of the U.S. domestic market for oil and gas, and the stability of the country’s physical and governmental infrastructure compared to other oil producing nations made the country a “favorable place to invest,” yet the United States “receives one of the lowest government takes in the world,” where ‘government take’ represents total collected bonus bids, rents, and royalties as a percentage of total production.33
Figure 7: Low and high estimates of the share of total drilling revenue distributed to the national government34
0% 20% 40% 60% 80% 100%
IranNorway
IndonesiaNigeriaEgypt
BangledeshIndia
EcuadorColombiaThailand
Republic of CongoVenezuela
PeruTrinidad & Tabago
BrazilDenmark
PhillippinesAustraliaPoland
ChinaItaly
NetherlandsArgentina
Falkland Islands
New ZealandPakistanCanada
KazakhstanUnited Kingdom
MexicoMoldovaIreland
CameroonHigh Estimates
Low Estimates
United States

PAGE 10 THE INFORMATION TECHNOLOGY & INNOVATION FOUNDATION | JUNE 2013
Figure 7 shows high and low estimates of U.S. total government take compared to other oil producing countries. The United States has a large range of estimates because drilling revenue policies vary by geographical region. For example, government take from onshore and offshore drilling in Alaska can be as high as 62 percent of total production, while government take from deep-water leases is only between 38-42 percent.35 But even high U.S. estimates are low compared to many other developed and developing countries, suggesting that higher federal fees on drilling would not negatively impact oil and gas production.
Distribution of Oil and Gas Revenue The difference between onshore and offshore drilling is not only important because of how much revenue is generated, but also because of how revenues are distributed (Table 2).
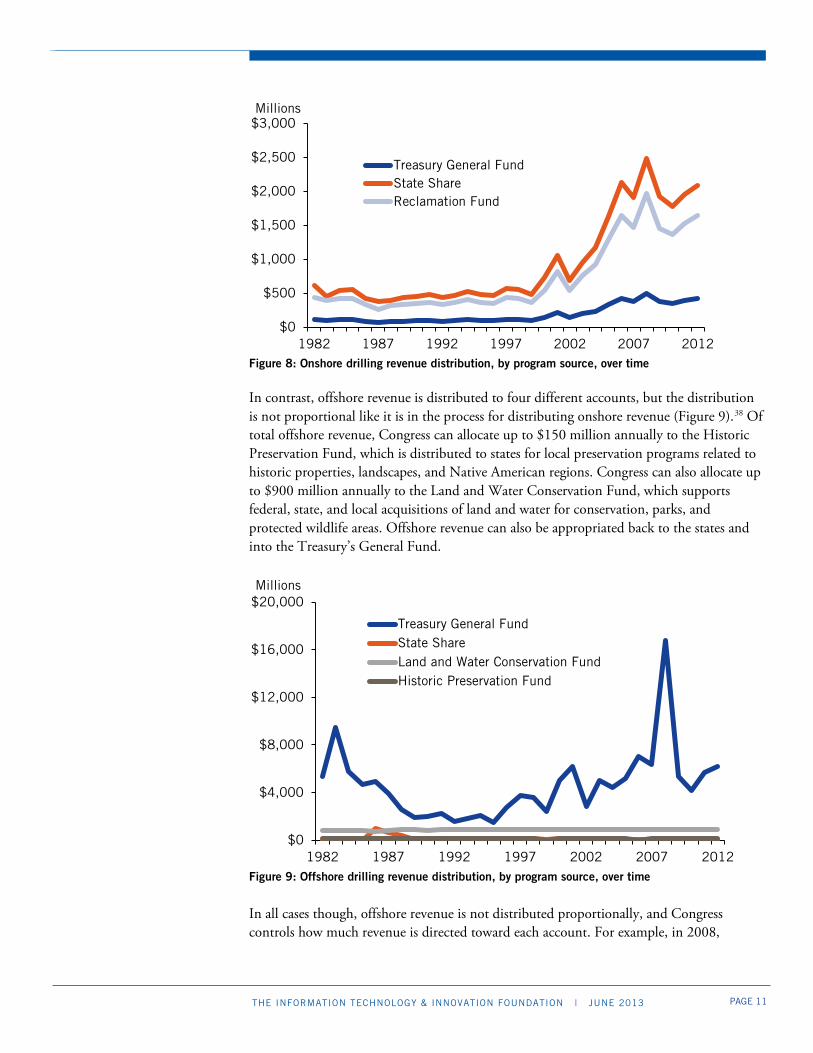
The federal government distributes onshore drilling revenues into three funds (Figure 8).36 Half of the revenue is given to the state where the drilling occurs, and 40 percent goes into the Federal Reclamation Fund. Congress uses this fund to support the Bureau of Reclamation within the Department of Interior, which manages continental water supply, hydropower generation, and irrigation supply for farmers in the Western United States.
Onshore Drilling Revenues FY2012 Revenue
State Share 50% $2,088,316,005
Reclamation Fund 40% $1,646,314,405
Treasury’s General Fund 10% $419,621,394
Offshore Drilling Revenues FY2012 Revenue
Historic Preservation Fund
Up to $150 million annually
$150,000,000
Land and Water Conservation Fund
Up to $900 million annually
$897,141,112
State Share Varies annually $36,972,094
Treasury’s General Fund Varies annually $6,195,729,336
Table 2: Distribution sources for oil and gas drilling revenue as dictated by federal law
The remaining 10 percent of revenue goes into the Treasury’s General Fund and is used as part of Congress’s annual appropriation process. The Department of the Treasury defines the General Fund as the “account credited with all receipts not earmarked by law for a specific purpose.” 37 In other words, Congress appropriates revenue directed to the General Fund as it sees fit each fiscal year. The amount of revenue distributed to these three sources is dependent on the size of revenue generated from onshore leases. This means that in a year of high revenue, the states are proportionally compensated for the production of oil and gas within their borders, the Bureau of Reclamation benefits from a bigger budget, and the Treasury Department brings in more revenue for the General Fund.
PAGE 11 THE INFORMATION TECHNOLOGY & INNOVATION FOUNDATION | JUNE 2013
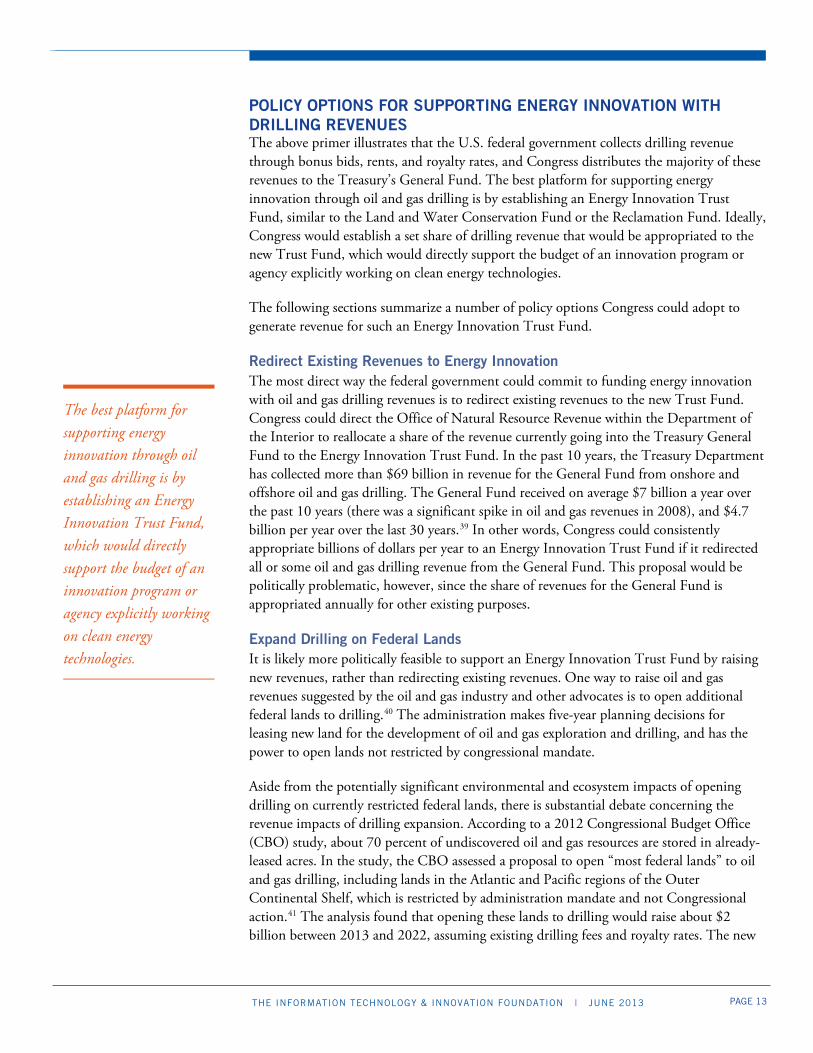
Figure 8: Onshore drilling revenue distribution, by program source, over time In contrast, offshore revenue is distributed to four different accounts, but the distribution is not proportional like it is in the process for distributing onshore revenue (Figure 9).38 Of total offshore revenue, Congress can allocate up to $150 million annually to the Historic Preservation Fund, which is distributed to states for local preservation programs related to historic properties, landscapes, and Native American regions. Congress can also allocate up to $900 million annually to the Land and Water Conservation Fund, which supports federal, state, and local acquisitions of land and water for conservation, parks, and protected wildlife areas. Offshore revenue can also be appropriated back to the states and into the Treasury’s General Fund.
Figure 9: Offshore drilling revenue distribution, by program source, over time
In all cases though, offshore revenue is not distributed proportionally, and Congress controls how much revenue is directed toward each account. For example, in 2008,
$0
$500
$1,000
$1,500
$2,000
$2,500
$3,000
1982 1987 1992 1997 2002 2007 2012
Millions
Treasury General FundState ShareReclamation Fund
$0
$4,000
$8,000
$12,000
$16,000
$20,000
1982 1987 1992 1997 2002 2007 2012
Millions
Treasury General FundState ShareLand and Water Conservation FundHistoric Preservation Fund

PAGE 12 THE INFORMATION TECHNOLOGY & INNOVATION FOUNDATION | JUNE 2013
Congress allocated 95 percent of offshore drilling revenue to the Treasury’s General Fund, since total revenue was exceptionally large and the required allotment for the Historic Preservation Fund and the Land and Water Conservation Fund remained consistent with previous funding levels.
CURRENT POLICY DEBATE: MURKOWSKI/ LANDRIEU FAIR ACT In March 2013, U.S. Senators Lisa Murkowski (R-AK) and Mary Landrieu (D-LA) introduced the Fixing America’s Inequities with Revenues (FAIR) Act (S. 630), which mandates allocating 37.5 percent of all offshore revenues annually to states subject to offshore drilling within their coastal boarders. This new revenue sharing model would vastly increase the average annual state share of revenues from offshore drilling. Using historical revenue distribution data from ONRR, ITIF estimates that between 26 and 43 times more revenue would be distributed to the states under the FAIR Act compared to current law.
Figure 10. Offshore Revenue Distribution Comparing 10-year Average Annual Revenue with Potential Revenue Distribution under the FAIR Act. ‘Other Funds’ Include the Historic Preservation Fund and the Land and Water Conservation Fund
In order to receive the full 37.5 percent share under the FAIR Act, states would need to create specific funds to support projects that support alternative and renewable energy, energy R&D, energy efficiency, or conservation. Many states already have clean energy trust funds, and the additional revenue from oil and gas could strengthen, enhance, and broaden innovation programs within these established institutions—changes that could be informed further with guidance on states’ collaboration on a regional or national energy innovation strategy.
$6.61
$0.07
$1.05
$3.79
$2.89
$1.05
$0
$1
$2
$3
$4
$5
$6
$7
General Fund State Share Other Funds
Billions
Current Policy
Fixing America's Inequities withRevenues (FAIR) Act
PAGE 13 THE INFORMATION TECHNOLOGY & INNOVATION FOUNDATION | JUNE 2013
POLICY OPTIONS FOR SUPPORTING ENERGY INNOVATION WITH DRILLING REVENUES The above primer illustrates that the U.S. federal government collects drilling revenue through bonus bids, rents, and royalty rates, and Congress distributes the majority of these revenues to the Treasury’s General Fund. The best platform for supporting energy innovation through oil and gas drilling is by establishing an Energy Innovation Trust Fund, similar to the Land and Water Conservation Fund or the Reclamation Fund. Ideally, Congress would establish a set share of drilling revenue that would be appropriated to the new Trust Fund, which would directly support the budget of an innovation program or agency explicitly working on clean energy technologies.
The following sections summarize a number of policy options Congress could adopt to generate revenue for such an Energy Innovation Trust Fund.
Redirect Existing Revenues to Energy Innovation The most direct way the federal government could commit to funding energy innovation with oil and gas drilling revenues is to redirect existing revenues to the new Trust Fund. Congress could direct the Office of Natural Resource Revenue within the Department of the Interior to reallocate a share of the revenue currently going into the Treasury General Fund to the Energy Innovation Trust Fund. In the past 10 years, the Treasury Department has collected more than $69 billion in revenue for the General Fund from onshore and offshore oil and gas drilling. The General Fund received on average $7 billion a year over the past 10 years (there was a significant spike in oil and gas revenues in 2008), and $4.7 billion per year over the last 30 years.39 In other words, Congress could consistently appropriate billions of dollars per year to an Energy Innovation Trust Fund if it redirected all or some oil and gas drilling revenue from the General Fund. This proposal would be politically problematic, however, since the share of revenues for the General Fund is appropriated annually for other existing purposes.
Expand Drilling on Federal Lands It is likely more politically feasible to support an Energy Innovation Trust Fund by raising new revenues, rather than redirecting existing revenues. One way to raise oil and gas revenues suggested by the oil and gas industry and other advocates is to open additional federal lands to drilling.40 The administration makes five-year planning decisions for leasing new land for the development of oil and gas exploration and drilling, and has the power to open lands not restricted by congressional mandate.
Aside from the potentially significant environmental and ecosystem impacts of opening drilling on currently restricted federal lands, there is substantial debate concerning the revenue impacts of drilling expansion. According to a 2012 Congressional Budget Office (CBO) study, about 70 percent of undiscovered oil and gas resources are stored in already-leased acres. In the study, the CBO assessed a proposal to open “most federal lands” to oil and gas drilling, including lands in the Atlantic and Pacific regions of the Outer Continental Shelf, which is restricted by administration mandate and not Congressional action.41 The analysis found that opening these lands to drilling would raise about $2 billion between 2013 and 2022, assuming existing drilling fees and royalty rates. The new
The best platform for supporting energy innovation through oil and gas drilling is by establishing an Energy Innovation Trust Fund, which would directly support the budget of an innovation program or agency explicitly working on clean energy technologies.

PAGE 14 THE INFORMATION TECHNOLOGY & INNOVATION FOUNDATION | JUNE 2013
revenue would mostly come from bonus bids, since production on these lands would probably not begin until after 2022. More revenue is expected when these leases move toward production.42
The study also estimated that opening the Arctic National Wildlife Refuge (ANWR), which is statutorily prohibited to drilling by Congress, would likely yield about $5 billion in new revenue between 2013 and 2022.43 Much of this new revenue would derive from bonus bids on new leases. The study suggested that when ANWR leases become productive, potentially between 2023 and 2035, they would likely bring in between $25-50 billion in new royalty revenues (between $2-4 billion per year). This new revenue would inevitably be shared between the federal government and the state of Alaska; under current law the state would receive 90 percent of federal receipts, and the remaining 10 percent would be retained by the Treasury.44 The study concluded that “legislation to require immediate leasing of [protected] areas would accelerate development but probably would not affect the total amount of development in [protected] areas over the next decade.”45 BOEM estimates that ANWR holds a particularly large amount of oil, and considering the advances in drilling technology achieved in the past decade, these estimates are likely low.46
The CBO’s baseline findings suggest conservative estimates for collecting drilling revenues from currently inaccessible lands, and conclude that while there is significant potential for generating new revenue with expanded drilling, it would be several years before these new revenues are seen by the federal government. Lands that have been restricted for extended periods of time—such as ANWR—must be re-explored and reassessed for value, and developers need time to build the necessary infrastructure to support large-scale production. New royalty revenue would not be significant for at least another decade, which is a problem as the United States cannot wait another 10 years for significant breakthroughs in clean energy—the federal government needs to support energy innovation as quickly as possible.
Raising Drilling Fees on Federal Lands Despite the drawbacks of expanding drilling, opening restricted territories, such as the administration-blocked Outer Continental Shelf (OCS), to drilling and exploration could be a powerful bargaining chip in negotiating higher federal fees on oil and gas, which could raise new revenue immediately for an Energy Innovation Trust Fund. This section explores several options for changing the current oil and gas revenue system to generate new federal revenue for an Energy Innovation Trust Fund.47
Establish a Bonus Bid Minimum While bonus bids do not account for the largest piece of annual drilling revenue, when oil and gas prices are high or when new federal lands are made available in productive areas, bonus bids often spike. The Department of the Interior (DOI) uses competitive auctions to lease the rights to drilling on federal lands, although policies surrounding regulation of these auctions have evolved with the growth of offshore drilling, especially within the last 30 years.
Opening new OCS lands to drilling leases would raise about $2 billion between 2013 and 2022. More revenue is expected when these leases move toward production, after this 10-year exploratory period.
PAGE 15 THE INFORMATION TECHNOLOGY & INNOVATION FOUNDATION | JUNE 2013
After the Deepwater Horizon oil spill in 2011, the advocacy organization Taxpayers for Common Sense (TCS) drafted a letter to the BOEM arguing that the oil and gas industry had a responsibility to the taxpayer to pay what it “rightfully owed” during a boom in oil prices.48 One of the policies suggested by TCS was raising the minimum bonus bid on deep-water tracts from the standard $37.50 to $100 an acre, reasoning, “…the current minimum bid was established more than a decade ago when the price of oil was about $20 a barrel. Since its 1999 adoption, oil prices have increased by more than five times and so too should minimum bids.”49 A bonus bid minimum insures that even if commodity prices fall, bonus bids do not dramatically fall as well. BOEM adopted this policy in 2011 and completed a study suggesting that increasing minimum bonus bids on offshore leases would likely decrease rental payments and slow the development of offshore drilling, however all effects of this change have been small in magnitude.50 Even so, increasing bonus bid minimums further would have a modest impact on generating new revenue, creating, by order of magnitude, between $50 million and $100 million per year.
Charge a Flat Rental Fee for Leased Unproductive Acres As mentioned previously, oil and gas leaseholders must pay the federal government rent after the acquisition of the lease until production of oil or gas begins. This period is usually designated for exploration and development of necessary drilling infrastructure, however in some cases the rental period lasts for much longer than necessary, causing a lag in the development of production.
The Congressional Research Service reported that when gasoline prices spiked between 2006 and 2008, several members of Congress urged the administration to open additional federal lands to drilling.51 Members of Congress opposing this brought attention to the significant number of unproductive acres—around 70 percent of total leased acreage—that the federal government had already leased to developers. To encourage development of already leased land, members suggested a flat fee of $4 per acre annually on unproductive acres onshore.52 The Department of the Interior predicted that this fee, only applied to onshore acres, would produce $760 million in new revenue over 10 years.53
Rent for onshore and offshore leases is determined by a number of variables concerning location, drilling depth, and assessed property value, which complicates changing the rental structure to increase revenues. One way around changing the formula would be charging a flat fee on unproductive acreage based on regional average rents.54 Table 3 offers hypothetical assessments of possible new revenue that would be generated in the case of applying a flat fee on unproductive acres regionally, based on previous years’ reports of unproductive acres and average regional rents from the Bureau of Land Management (BLM) and BOEM.55
Levying a flat fee on currently unproductive acres leased onshore and offshore could raise hundreds of millions of dollars in new annual revenue.56 According to estimates from BLM and BOEM, less than half of all onshore leases were productive in 2012, and only about one-third of all onshore acres under lease were productive in 2012. Based on these numbers, a flat rate between $4 and $12 applied to all unproductive onshore acres would generate between $100 million and $300 million in new revenue. The government could

PAGE 16 THE INFORMATION TECHNOLOGY & INNOVATION FOUNDATION | JUNE 2013
achieve similar results by levying a flat rate on unproductive acres in the Gulf, where less than 20 percent of all leases and less than 17 percent of total leased acres were productive in 2012.
Onshore Offshore Alaska Offshore Gulf of
Mexico Total
Unproductive acres (FY2012)
25,279,238 3,713,041 26,981,834 55,974,113
$4 fee $101,116,952 $14,852,164 $107,927,336 $223,896,452
$8 fee $202,233,904 $29,704,328 $215,854,672 $447,792,904
$12 fee $303,350,856 $44,556,492 $323,782,008 $671,689,356
Table 3: Additional revenue generated by the application of a flat rental fee to leased, unproductive acres in onshore and offshore regions, based on FY2012 rents and records of unproductive acres57
This new rental fee structure would likely encourage leaseholders to accelerate the exploration and development of leased acres, which would move more acres into production and subsequently boost royalty revenue in the long term.
Increase Royalty Rates Raising royalty rates on both onshore and offshore oil and gas drilling offers an opportunity to generate substantially more revenue than changing bonus bid and rental policy.58 Table 4 depicts potential new revenue from increasing the royalty rate based on the reported average revenues from royalty payments from 2003-2012.
Onshore Offshore Pacific Offshore Gulf
of Mexico Total
Current rate 12.5% 16.67% 18.75% -
14% rate $420,360,482 - - $420,360,482
16% rate $980,841,125 - - $980,841,126
18% rate $1,54,1321,769 $16,332,968 - $1,557,654,738
20% rate $2,101,802,412 $40,893,823 $681,504,006 $2,824,200,242
22% rate $2,662,283,055 $65,454,678 $1,261,242,749 $3,988,980,483
Table 4: Additional revenue generated by increasing the royalty rate on all onshore and offshore leases based on reported FY2012 revenues
The expected increase in revenues is calculated by estimating average revenue from royalties between 2003 and 2012 for onshore leases, offshore leases in the Pacific, and offshore leases in the Gulf of Mexico, since leases in these regions are subject to different royalty rates. The average annual royalty revenue for each region is divided by the region’s expected royalty rate (12.5 percent for onshore leases, 16.67 percent for leases in the offshore Pacific region,
PAGE 17 THE INFORMATION TECHNOLOGY & INNOVATION FOUNDATION | JUNE 2013
and 18.75 percent for leases in the offshore Gulf) to estimate the average annual drilling revenue for each region, and then multiplied by the new royalty rate. The table reflects the new revenue from the policy change, using average annual revenue by region as the baseline.
The Energy Information Administration estimates that revenue from onshore drilling will grow slowly in the future, since much of onshore drilling exploration and development has shifted from public to private lands, which might affect future revenue from onshore drilling.59 Offshore drilling, on the other hand, is expected to continue growing at a steady pace, since new technology is making deep-water areas previously thought to be inaccessible to drilling development viable for production.60 Our projections, which offer only a rough prediction of the future potential for raising revenue, estimate that marginal to significant increases in current royalty rates could generate between $0.4 billion and $4 billion in new revenue per year
TURNING OIL AND GAS REVENUE INTO ENERGY INNOVATION With bipartisan support, the debate over generating new federal revenue has moved away from discussing the merit of leveraging oil and gas drilling, to discussing how to implement it and what the new funds can support. This report assesses the potential drilling policies that can be used to raise revenue, and how much new revenue each can create. Based on this assessment, it is clear that oil and gas drilling cannot fully support increasing the federal energy innovation budget to recommended levels of $15-$30 billion per year.61 Rather, oil and gas drilling can raise enough revenue for targeted investments in particular energy innovation programs.
Already this year, Republicans and Democrats proposed similar ideas. Senator Lisa Murkowski’s Advanced Energy Security Trust, which advocates opening restricted federal lands to drilling, would direct a portion of new revenues to finance the development of renewable power, energy efficiency, and advanced vehicles.62 President Obama’s Energy Security Trust Fund opposes expansion of drilling, but advocates for increasing drilling fees in a number of ways and directs new revenues more purposefully to supporting research and development of clean energy transportation.63 On both sides of the aisle, it is clear that more can be done to ensure that leveraging oil and gas drilling towards energy innovation has maximum impact.
As a result, we propose a natural compromise: expand safe and environmentally manageable drilling on federal lands such as in the OCS, which is prohibited by an administrative moratorium, while also implementing new fees on all unproductive acres and raising royalty rates for onshore leases to at least the level of the lowest royalty rates for offshore leases. On the one hand, increasing fees and boosting onshore royalty rates will immediately generate enough new revenue to fully fund high-risk, high-reward energy research at the ARPA-E at the recommended level of $1 billion per year. On the other hand, expanding oil and gas drilling on some federal lands, while not offering enough immediate revenue for energy innovation, provides a political compromise that could directly impact the development of the technology alternatives that will dramatically reduce the need to drill in the first place.
ITIF projections estimate that marginal to significant increases in current royalty rates could generate between $0.4 billion and $4 billion in new revenue per year.
PAGE 18 THE INFORMATION TECHNOLOGY & INNOVATION FOUNDATION | JUNE 2013
The central tenant of such a compromise is fully funding ARPA-E, the Department of Energy’s breakthrough energy technology program, which invests in risky, next-generation clean energy technologies that could fundamentally change the energy market.64 Modeled after the Department of Defense’s DARPA program that invested in the underlying technologies that make up the Internet among other breakthroughs, ARPA-E is largely considered the most important clean energy research program in the federal government and receives significant support from industry, academia, and Congress. Its mission—to invest in transformative technologies that allow scientists to re-envision entire energy systems—makes the program a complementary piece of the U.S. energy innovation ecosystem that enhances and supports the work of all other programs at the Department of Energy.
Unfortunately, ARPA-E is significantly under-funded. Its FY2013 budget is set at $265 million, not even 30 percent of the $1 billion proposed by the National Academies of Science and the President’s Council of Advisors on Science and Technology.65 Furthermore, ARPA-E’s budget has been plagued by uncertainty. It was initially funded at $400 million through the Stimulus in 2009, only to be cut through budget appropriations to $200 million in 2010. Its funding dipped further to $181 million in 2011, and was increased as part of the FY2012 budget Omnibus appropriations to $275 million.66
Fully funding ARPA-E with $1 billion from new oil and gas revenue would not only be significant for providing the critical funding the program needs to succeed, but it would
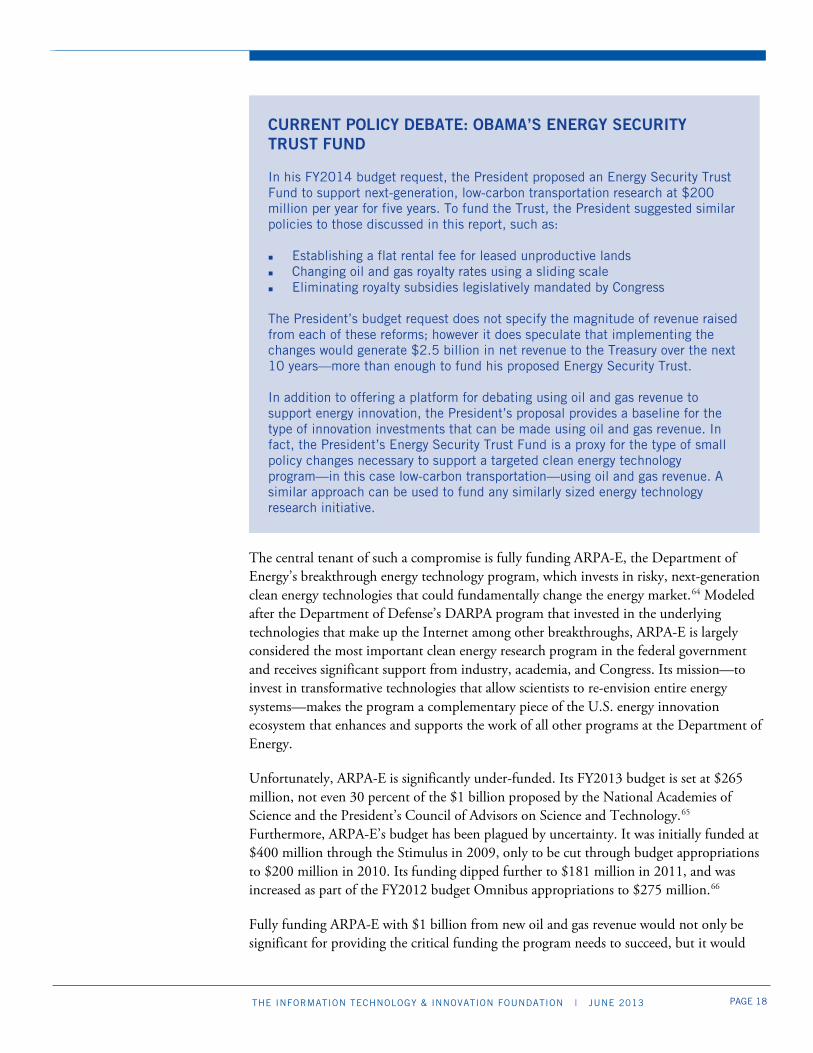
CURRENT POLICY DEBATE: OBAMA’S ENERGY SECURITY TRUST FUND In his FY2014 budget request, the President proposed an Energy Security Trust Fund to support next-generation, low-carbon transportation research at $200 million per year for five years. To fund the Trust, the President suggested similar policies to those discussed in this report, such as: Establishing a flat rental fee for leased unproductive lands Changing oil and gas royalty rates using a sliding scale Eliminating royalty subsidies legislatively mandated by Congress The President’s budget request does not specify the magnitude of revenue raised from each of these reforms; however it does speculate that implementing the changes would generate $2.5 billion in net revenue to the Treasury over the next 10 years—more than enough to fund his proposed Energy Security Trust. In addition to offering a platform for debating using oil and gas revenue to support energy innovation, the President’s proposal provides a baseline for the type of innovation investments that can be made using oil and gas revenue. In fact, the President’s Energy Security Trust Fund is a proxy for the type of small policy changes necessary to support a targeted clean energy technology program—in this case low-carbon transportation—using oil and gas revenue. A similar approach can be used to fund any similarly sized energy technology research initiative.

PAGE 19 THE INFORMATION TECHNOLOGY & INNOVATION FOUNDATION | JUNE 2013
also ensure a level of annual budget certainty that directly impacts its ability to invest in breakthrough technologies as well as attract top program manager talent from the energy industry.67 It would also do more to develop cost-competitive clean energy technologies than the more limited Energy Security Trust proposed by the administration.
To commit to funding ARPA-E at $1 billion annually, Congress could raise royalty rates on onshore leases to 16 percent—still below rates for offshore leases—or it could raise onshore royalty rates to 14 percent and also establish an $8-12 flat fee on unproductive acres both onshore and offshore. In exchange for greater investment in next-generation clean energy technologies, the administration could remove its moratorium on drilling in the OCS.68
CONCLUSION Generating new revenue for public investments in energy innovation from oil and gas drilling is fertile ground for high-impact, bipartisan policymaking. Proposals on the left raise drilling fees to invest in limited clean energy technology efforts; proposals on the right demand expanded drilling but keep rates and fees relatively low. A compromise between these proposals is not difficult to imagine: expand drilling in specific offshore territories while moderately increasing fees and royalty rates, and direct the new revenue toward R&D efforts that will eventually eliminate the country’s fossil fuel dependence.
Congress would do well to link investment in next-generation clean energy with the production of today’s generation of fossil fuel energy. This proposal recognizes that fossil fuels will remain the dominant energy source in the United States until there are cheap and viable low-carbon alternatives, which requires significantly more investment in innovation. And it ties the development of next-generation technologies to the production of existing fossil fuels, similar to how the United States successfully supported shale natural gas technologies and how many state governments are supporting their clean energy programs. In other words, funding clean energy innovation programs, such as ARPA-E, with oil and gas revenue is an energy and climate policy approach that just makes sense.

PAGE 20 THE INFORMATION TECHNOLOGY & INNOVATION FOUNDATION | JUNE 2013
ENDNOTES
1. American Energy Act, H.R. 6566, 110th Cong. (July 2008), http://www.govtrack.us/congress/bills/110/hr6566/text.
2. Lisa Murkowski, A Vision for America’s Energy Future (Office of U.S. Senator Lisa Murkowski, 113th Cong., February 2013), http://www.energy.senate.gov/public/index.cfm/files/serve?File_id=099962a5-b523-4551-b979-c5bac6d45698.
3. Energy Security Leadership Council, A National Strategy for Energy Security: Harnessing American Resources and Innovation (Securing America’s Energy Future, 2013), http://www.secureenergy.org/policy/national-strategy-energy-security-2013.
4. Barack Obama, “Remarks by the President in the State of the Union Address,” White House Office of the Press Secretary, February 12, 2013, http://www.whitehouse.gov/the-press-office/2013/02/12/remarks-president-state-union-address.
“In fact, much of our new-found energy is drawn from lands and waters that we, the public, own together. So tonight, I propose we use some of our oil and gas revenues to fund an Energy Security Trust that will drive new research and technology to shift our cars and trucks off oil for good. If a nonpartisan coalition of CEOs and retired generals and admirals can get behind this idea, then so can we. Let’s take their advice and free our families and businesses from the painful spikes in gas prices we’ve put up with for far too long.”
5. Alex Trembath et al., Where the Shale Gas Revolution Came From: Government’s Role in the Development of Hydraulic Fracturing in Shale (Oakland, CA: Breakthrough Institute, May 2012), http://thebreakthrough.org/blog/Where_the_Shale_Gas_Revolution_Came_From.pdf.
6. Lewis Milford et al., Leveraging State Clean Energy Funds for Economic Development, (Washington, DC: Brookings-Rockefeller, January 2012), http://www.brookings.edu/~/media/research/files/papers/2012/1/11%20states%20energy%20funds/0111_states_energy_funds.pdf.
7. Matthew Stepp, “Better clean energy choices for America,” Washington Post, November 2, 2012, http://articles.washingtonpost.com/2012-11-02/opinions/35507053_1_climate-change-policy-climate-change-clean-energy.
8. Steven Hayward et al., Post-Partisan Power: How a Limited and Direct Approach to Energy Innovation Can Deliver Clean, Cheap Energy, Economic Productivity and National Prosperity (American Enterprise Institute, Brookings Institution, and the Breakthrough Institute, October 2010), http://thebreakthrough.org/blog/Post-Partisan%20Power.pdf.
9. Investment data for FY2009-FY2012 from Energy Innovation Tracker: http://energyinnovation.us/; investment recommendations from: Energy Innovation Tracker, “Federal Energy Innovation Spending: Gaps Analysis,” December 2010, http://energyinnovation.us/wordpress/wp-content/uploads/2010/12/EIT-GapsAnalysis.pdf.
10. Energy Innovation Tracker, accessed May 1, 2013, http://energyinnovation.us/ 11. Megan Nicholson and Matthew Stepp, Breaking Down Federal Investments in Clean Energy (Washington,
DC: ITIF, March 2013), http://www2.itif.org/2013-breaking-down-investment-energy.pdf. 12. Matt Hourihan and Matthew Stepp, A Model for Innovation: ARPA-E Merits Full Funding (Washington,
DC: ITIF, July 2011), http://www.itif.org/files/2011-arpa-e-brief.pdf. 13. Stephen Ezell and Robert Atkinson, 25 Recommendations for the Reauthorization of the 2013 America
COMPETES Act (Washington, DC: ITIF, April 2013), http://www2.itif.org/2013-twenty-five-policy-recs-competes-act.pdf.
14. “Oil and Gas Industry: Oil and Gas Handbook,” IRS.gov, accessed April 25, 2013, http://www.irs.gov/irm/part4/irm_04-041-001.html.
15. Gene L. Dodaro, “Opportunities to Reduce Potential Duplication in Government Programs, Save Tax Dollars, and Enhance Revenue” (testimony before the House Committee on Oversight and Government Reform, Government Accountability Office, March 3, 2011), http://www.gao.gov/assets/130/125629.pdf.
16. All data on the collection and redistribution of oil and gas drilling revenues was collected from the Office of Natural Resource Revenue (ONRR) Statistical Information resource. The data presented represents totals by sales year, which is recommended for demonstrating historical trends. Sales year data represents

PAGE 21 THE INFORMATION TECHNOLOGY & INNOVATION FOUNDATION | JUNE 2013
transactions for sales that took place in a given fiscal year and do not include adjusted or corrected transactions for sales that took place in previous fiscal years. For more information, see: http://statistics.onrr.gov/Information.aspx.
17. Irena Agalliu, “Comparative Assessment of the Federal Oil and Gas Fiscal System” (technical report, Bureau of Ocean Energy Management and HIS-CERA, Cambridge, MA, October 2011).
18. Ibid. 19. Agalliu, “Comparative Assessment of the Federal Oil and Gas Fiscal System.” 20. Congressional Budget Office, “Potential Budgetary Effects of Immediately Opening Most Federal Lands
to Oil and Gas Leasing,” CBO, August 2012, http://www.cbo.gov/sites/default/files/cbofiles/attachments/08-09-12_Oil-and-Gas_Leasing.pdf.
21. Office of Natural Resource Revenue, “Fiscal Year 2009 in Review” (technical report, ONRR, 2009), http://statistics.onrr.gov/PDF/YearInReview%20FY2009.pdf.
22. Agalliu, “Comparative Assessment of the Federal Oil and Gas Fiscal System.” 23. No rental revenue was collected from the offshore Pacific region in 2012; 87 percent of leases, or 90
percent of all leased acres, were under production in the offshore Pacific. For more information on specific lease/acre productivity, see the Bureau of Land Management (for information on onshore leases) or the Bureau of Ocean Energy Management (for information on offshore leases in the Gulf, Alaska, and the Pacific): http://www.boem.gov/uploadedFiles/BOEM/Oil_and_Gas_Energy_Program/Leasing/Combined_Leasing_Status_Report/2012-AnnualLeaseStats.pdf.
24. Marc Humphries, “U.S. Crude Oil and Natural Gas Production in Federal and Non-Federal Areas,” Congressional Research Service Rep No. 7-5700 (2013), http://energycommerce.house.gov/sites/republicans.energycommerce.house.gov/files/20130228CRSreport.pdf.
25. Dodaro, “Opportunities to Reduce Potential Duplication in Government Programs.” 26. Office of Natural Resource Revenue, “Fiscal Year 2006 in Review” (technical report, ONRR, 2006),
http://statistics.onrr.gov/PDF/YearInReview%20FY2006.pdf. 27. Office of Natural Resource Revenue, “Fiscal Year 2007 in Review” (technical report, ONRR, 2007),
http://statistics.onrr.gov/PDF/YearInReview%20FY2007.pdf. 28. Office of Natural Resource Revenue, “Fiscal Year 2011 in Review” (technical report, ONRR, 20011),
http://statistics.onrr.gov/PDF/YearInReview%20FY2011.pdf. 29. For more information on drilling revenue collection and distribution, see ONRR’s Statistics FAQs:
http://statistics.onrr.gov/PDF/FAQs.pdf. 30. “Reporting Overview,” ONRR.gov, accessed May 16, 2013,
http://www.onrr.gov/FM/PDFDocs/Binder6.pdf. 31. For more on settlement agreements, see the website of the Bureau of Land Management (BLM):
http://www.blm.gov/wo/st/en.html; and the extensive documentation on the Deep-water Horizon settlements: http://www.deepwaterhorizonsettlements.com/Economic/SettlementAgreement.aspx.
32. “Statutes Relating to Interest Payment on Oil and Gas Production,” SWKROA, accessed May 16, 2013, http://swkroa.com/docs/InterestPmts.pdf.
33. Government Accountability Office, “Oil and Gas Royalties: A Comparison of the Share of Revenue Received from Oil and Gas Production by the Federal Government and Other Resource Owners,” GAO Rep No. 07-676R (2007), http://www.gao.gov/new.items/d07676r.pdf.
34. Data compiled using three different studies completed between 1997 and 2006. For more information on the studies and for a full list of countries and territories surveyed, see: Government Accountability Office, “Oil and Gas Royalties: A Comparison of the Share of Revenue Received from Oil and Gas Production by the Federal Government and Other Resource Owners.”
35. Government Accountability Office, “Oil and Gas Royalties: A Comparison of the Share of Revenue Received from Oil and Gas Production by the Federal Government and Other Resource Owners.”
36. Office of Natural Resource Revenue, accessed May 16, 2013, http://www.onrr.gov/About/default.htm. 37. U.S. Department of the Treasury, “Responsibilities Relating to Non-Credit Reform Borrowing
Accounts,” Department of the Treasury Operating Circular, January 2011, http://www.treasurydirect.gov/govt/apps/tbp/new/ncroperatingcircular.pdf.
38. Ibid.

PAGE 22 THE INFORMATION TECHNOLOGY & INNOVATION FOUNDATION | JUNE 2013
39. “Oil and Gas Industry: Oil and Gas Handbook,” IRS.gov, accessed April 25, 2013, http://www.irs.gov/irm/part4/irm_04-041-001.html.
40. For an extensive overview of the further economic impacts of oil and gas development of federal lands, such as effects on GDP, employment, and wages, see: Joseph Mason and Herman Moyse Jr., Beyond the Congressional Budget Office: The Additional Economic Effects of Immediately Opening Federal Lands to Oil and Gas Leasing (Washington, DC: Institute for Energy Research, February 2013), http://www.instituteforenergyresearch.org/wp-content/uploads/2013/02/IER_Mason_Report_NoEMB.pdf.
41. Congressional Budget Office, “Potential Budgetary Effects of Immediately Opening Most Federal Lands to Oil and Gas Leasing.”
42. According to the 2012 CBO study, almost 90 percent of the 2011 OCS production was from leases issued before 2001, which “reflects the long lead times associated with exploring and developing oil and gas fields.” It is difficult to predict the development patter for new leases on the OCS because of this factor, among others.
43. Congressional Budget Office, “Potential Budgetary Effects of Immediately Opening Most Federal Lands to Oil and Gas Leasing.”
44. Ibid. 45. Ibid. 46. Mason and Moyse Jr., Beyond the Congressional Budget Office: The Additional Economic Effects of
Immediately Opening Federal Lands to Oil and Gas Leasing. 47. The analysis presented here is not dynamic; with any policy change there could be some elastic reactions
to total federal oil and gas revenues, however outcomes dependent on policy changes are variable and depend on policy levers used and the magnitude of the policy change. For more on predicted outcomes of policy change, see: Economic Analysis, Inc. and Marine Policy Center, “Policies to Affect the Pace of Leasing and Revenues in the Gulf of Mexico Summary Report,” Bureau of Ocean Energy Management, Regulation and Enforcement, August 2009, https://www.google.com/url?sa=t&rct=j&q=&esrc=s&source=web&cd=1&ved=0CDAQFjAA&url=http%3A%2F%2Fwww.boem.gov%2FBOEM-Newsroom%2FLibrary%2FPublications%2F2011%2F2011-013-Part1.aspx&ei=SPSwUfzgA7K44AP73YH4CQ&usg=AFQjCNFXIIpD2jF0qdnSrpALnImAG51Vbw&sig2=2wggc-uuXL2HHvhaEi_Ibw&bvm=bv.47534661,d.dmg; Agalliu, “Comparative Assessment of the Federal Oil and Gas Fiscal System.”
48. Autumn Hannah, “Comment to the Bureau of Ocean Energy Management on Outer Continental Shelf Oil and Gas Lease Sale 218” (letter to Steve Textoris, Acting Chief of the Leasing Division of the Bureau of Ocean Energy Management, October 18, 2011), http://www.taxpayer.net/library/article/tcs-comments-on-ocs-oil-and-gas-lease-sale.
49. Ibid. 50. Economic Analysis, Inc. and Marine Policy Center, “Policies to Affect the Pace of Leasing and Revenues
in the Gulf of Mexico Summary Report.” 51. Humphries, “U.S. Crude Oil and Natural Gas Production in Federal and Non-Federal Areas.” 52. Ibid. 53. Dodaro, “Opportunities to Reduce Potential Duplication in Government Programs.” 54. A study conducted by BOEM based on a model of leases in the Gulf of Mexico determined that the
effects of higher rental rates on total revenue are extremely difficult to predict based on the interim nature of rental revenues. For more on increasing rental rates, see: Economic Analysis, Inc. and Marine Policy Center, “Policies to Affect the Pace of Leasing and Revenues in the Gulf of Mexico Summary Report.”.
55. Data for productive and unproductive acres for onshore leases are found through the Bureau of Land Management Oil and Gas Statistics site: http://www.blm.gov/wo/st/en/prog/energy/oil_and_gas/statistics.html. Data for productive and unproductive acres for offshore leases are found through the Bureau of Ocean Energy Management Oil and Gas Energy Programs: http://www.boem.gov/Oil-and-Gas-Energy-Program/Leasing/Regional-Leasing/Index.aspx. Data for productive onshore acres and leases is available for the years 1988-2012, while data for productive offshore acres and leases is only available for the past two years, which is reflected in the data captured in the tables.

PAGE 23 THE INFORMATION TECHNOLOGY & INNOVATION FOUNDATION | JUNE 2013
56. Although BOEM reports leased acres in the Pacific, ONRR did not report any rental revenue from the Pacific in FY2011 or FY2012, suggesting that all leased acres in the offshore Pacific region are currently under production.
57. Rental payments vary significantly by region—rents for onshore leases on federal lands are around $1 per acre, rents for offshore leases in Alaska are between $1 and $2 per acre, and rents for offshore leases in the Gulf of Mexico are about $6.75 per acre on average.
58. Many studies have attempted to model the consequences of raising royalty rates, but there is no consensus on its impact. When Congress raised royalty rates on new deep-water leases in the Gulf from 12.5 percent to 16.67 percent, the GAO reported that the change would generate $4.5 billion in new revenues over 20 years, but that it would also adversely affect bonus bids and rental revenue and cause a decline in production of 5 percent (Government Accountability Office, “Oil and Gas Royalties: A Comparison of the Share of Revenue Received from Oil and Gas Production by the Federal Government and Other Resource Owners”). BOEM’s 2010 study predicted that increasing the royalty rate in the Gulf to 35 percent (from 18.75 percent) would lead to a 50 percent increase in royalty payments, but only a 6 percent increase in total government take due to less production (Economic Analysis, Inc. and Marine Policy Center, “Policies to Affect the Pace of Leasing and Revenues in the Gulf of Mexico Summary Report”). Another study by BOEM in 2011 suggested that “any increase of the already high royalty rate levied in the Gulf of Mexico will increase the risk of system instability. Any potential gains from the higher royalty rate are likely to be offset by reduced revenue from bonus bids and rents resulting from a slower pace of leasing” (Agalliu, “Comparative Assessment of the Federal Oil and Gas Fiscal System”).
59. U.S. Energy Information Administration, Annual Energy Outlook 2013 (Washington, DC: EIA, March 2013), http://www.eia.gov/forecasts/aeo/pdf/0383(2013).pdf.
60. Kevin Bullis, “The Amount of Oil We Can Recover Keeps Growing,” MIT Technology Review, May 3, 2013, http://www.technologyreview.com/view/514556/the-amount-of-oil-we-can-recover-keeps-growing/.
61. For a comparison of energy experts’ opinions on recommended funding for energy R&D, see: Energy Innovation Tracker, “Federal Energy Innovation Spending: Gaps Analysis.”
62. Clifton Yin, “Highlights of Senator Murkowski’s Energy 20/20 Policy Blueprint,” Innovation Files (blog), ITIF, February 6, 2013, http://www.innovationfiles.org/highlights-of-senator-murkowskis-energy-2020-policy-blueprint/.
63. Clifton Yin, “Energy Security Trust Fund an Important Policy Pilot for Supporting Innovation,” Innovation Files (blog), ITIF, March 19, 2013, http://www.innovationfiles.org/energy-security-trust-fund-an-important-policy-pilot-for-supporting-innovation/.
64. Hourihan and Stepp, A Model for Innovation: ARPA-E Merits Full Funding. 65. National Academy of Sciences, National Academy of Engineering, Institute of Medicine, Rising Above the
Gathering Storm: Energizing and Employing America for a Brighter Economic Future (Washington, DC: National Academies Press, 2005); President’s Council of Advisors on Science and Technology, Report to the President on Ensuring American Leadership in Advanced Manufacturing (Washington, DC: Executive Office of the President, June 2011), http://www.whitehouse.gov/sites/default/files/microsites/ostp/pcast-advanced-manufacturing-june2011.pdf.
66. Matthew Stepp, “2012 Federal Budget: Omnibus Halts Further Cuts to Energy Innovation Investments,” Innovation Files (blog), ITIF, December 2011, http://www.innovationfiles.org/2012-federal-budget-omnibus-halts-further-cuts-to-energy-innovation-investments/.
67. Hourihan and Stepp, A Model for Innovation: ARPA-E Merits Full Funding. 68. On June 4, 2013, Rep. Doc Hastings (R-WA) introduced to the House Natural Resources Committee
H.R. 2231, the “Offshore Energy and Jobs Act,” which increases energy exploration and production on the Outer Continental Shelf and creates a similar revenue sharing system for coastal states as that proposed by Sen. Lisa Murkowski (D-AK). At the time of this report’s completion, the bill was still undergoing committee hearings.
PAGE 24 THE INFORMATION TECHNOLOGY & INNOVATION FOUNDATION | JUNE 2013
ACKNOWLEDGEMENTS The authors would like to thank Kathryn Angstadt, William Dube, and Bethany Imondi of ITIF, and Elizabeth Stewart for editorial and production assistance. Any errors or omissions are the authors’ alone. ABOUT THE AUTHORS Megan Nicholson is a policy analyst at ITIF specializing in clean energy policy and the federal energy budget. She graduated magna cum laude from Mount Holyoke College in May of 2011 with a B.A. in Economics and Environmental Studies. Before joining ITIF, Megan interned at the Global Environmental Facility, where she assisted with the research and writing of a publication on the organization's 20-year contribution to eliminating barriers to energy efficiency investment in developing countries. Matthew Stepp is a senior analyst specializing in climate change and clean energy policy. Prior to joining ITIF, Stepp served as a fellow at the Breakthrough Institute, a California think tank focused on energy policy issues. There, he coauthored a report aimed at presenting an alternative strategy for building a green U.S. economy through innovation-focused policies. He earned a B.S. in Meteorology from Millersville University and an M.S. in Science, Technology, and Public Policy from the Rochester Institute of Technology. ABOUT ITIF The Information Technology and Innovation Foundation (ITIF) is a Washington, D.C.-based think tank at the cutting edge of designing innovation strategies and technology policies to create economic opportunities and improve quality of life in the United States and around the world. Founded in 2006, ITIF is a 501(c) 3 nonprofit, non-partisan organization that documents the beneficial role technology plays in our lives and provides pragmatic ideas for improving technology-driven productivity, boosting competitiveness, and meeting today’s global challenges through innovation. FOR MORE INFORMATION, GO TO WWW.ITIF.ORG.