Embed Size (px)
Citation preview
Depa
rtmen
t of P
ublic
Util
ities
Post
Office
Box 1
5225
Ches
apea
ke, V
A 233
28
City of ChesapeakeDepartment of Public Utilities
2014 Data
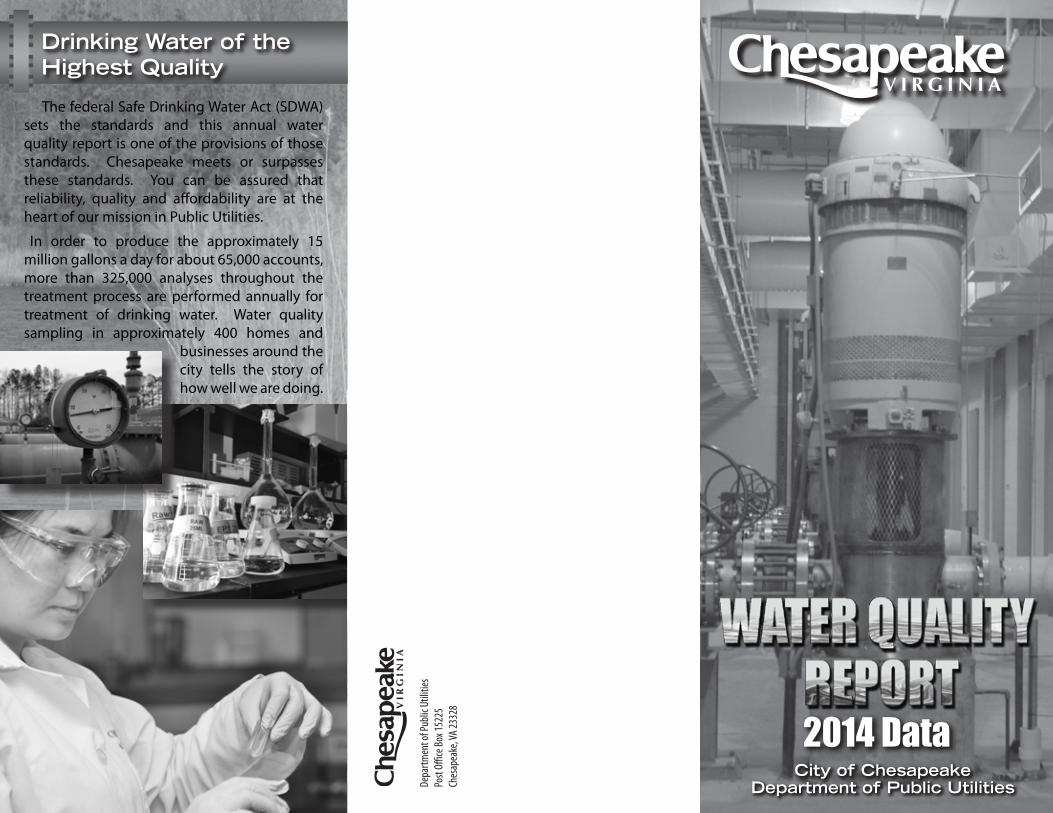
Drinking Water of the Highest Quality
The federal Safe Drinking Water Act (SDWA) sets the standards and this annual water quality report is one of the provisions of those standards. Chesapeake meets or surpasses these standards. You can be assured that reliability, quality and affordability are at the heart of our mission in Public Utilities.
In order to produce the approximately 15 million gallons a day for about 65,000 accounts, more than 325,000 analyses throughout the treatment process are performed annually for treatment of drinking water. Water quality sampling in approximately 400 homes and
businesses around the city tells the story of how well we are doing.
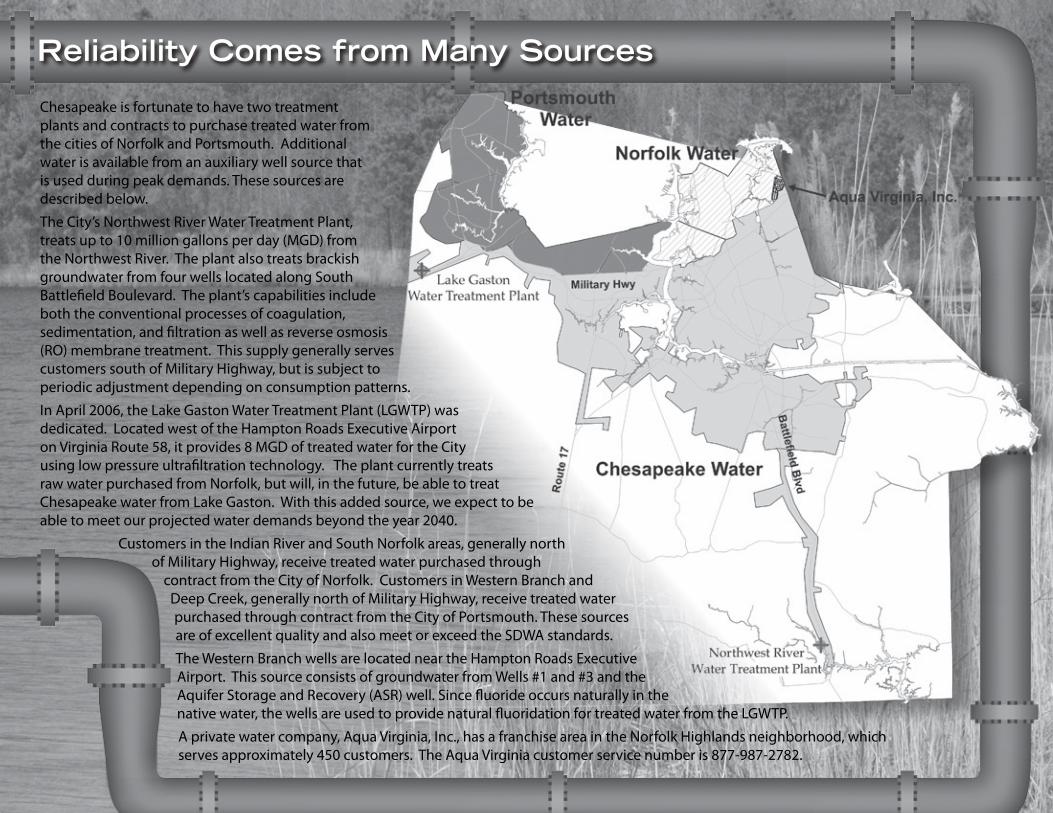
Reliability Comes from Many Sources
Chesapeake is fortunate to have two treatment plants and contracts to purchase treated water from the cities of Norfolk and Portsmouth. Additional water is available from an auxiliary well source that is used during peak demands. These sources are described below.
The City’s Northwest River Water Treatment Plant, treats up to 10 million gallons per day (MGD) from the Northwest River. The plant also treats brackish groundwater from four wells located along South Battlefield Boulevard. The plant’s capabilities include both the conventional processes of coagulation, sedimentation, and filtration as well as reverse osmosis (RO) membrane treatment. This supply generally serves customers south of Military Highway, but is subject to periodic adjustment depending on consumption patterns.
In April 2006, the Lake Gaston Water Treatment Plant (LGWTP) was dedicated. Located west of the Hampton Roads Executive Airport on Virginia Route 58, it provides 8 MGD of treated water for the City using low pressure ultrafiltration technology. The plant currently treats raw water purchased from Norfolk, but will, in the future, be able to treat Chesapeake water from Lake Gaston. With this added source, we expect to be able to meet our projected water demands beyond the year 2040.
Customers in the Indian River and South Norfolk areas, generally north of Military Highway, receive treated water purchased through
contract from the City of Norfolk. Customers in Western Branch and Deep Creek, generally north of Military Highway, receive treated water purchased through contract from the City of Portsmouth. These sources are of excellent quality and also meet or exceed the SDWA standards.
The Western Branch wells are located near the Hampton Roads Executive Airport. This source consists of groundwater from Wells #1 and #3 and the Aquifer Storage and Recovery (ASR) well. Since fluoride occurs naturally in the native water, the wells are used to provide natural fluoridation for treated water from the LGWTP.
A private water company, Aqua Virginia, Inc., has a franchise area in the Norfolk Highlands neighborhood, which serves approximately 450 customers. The Aqua Virginia customer service number is 877-987-2782.
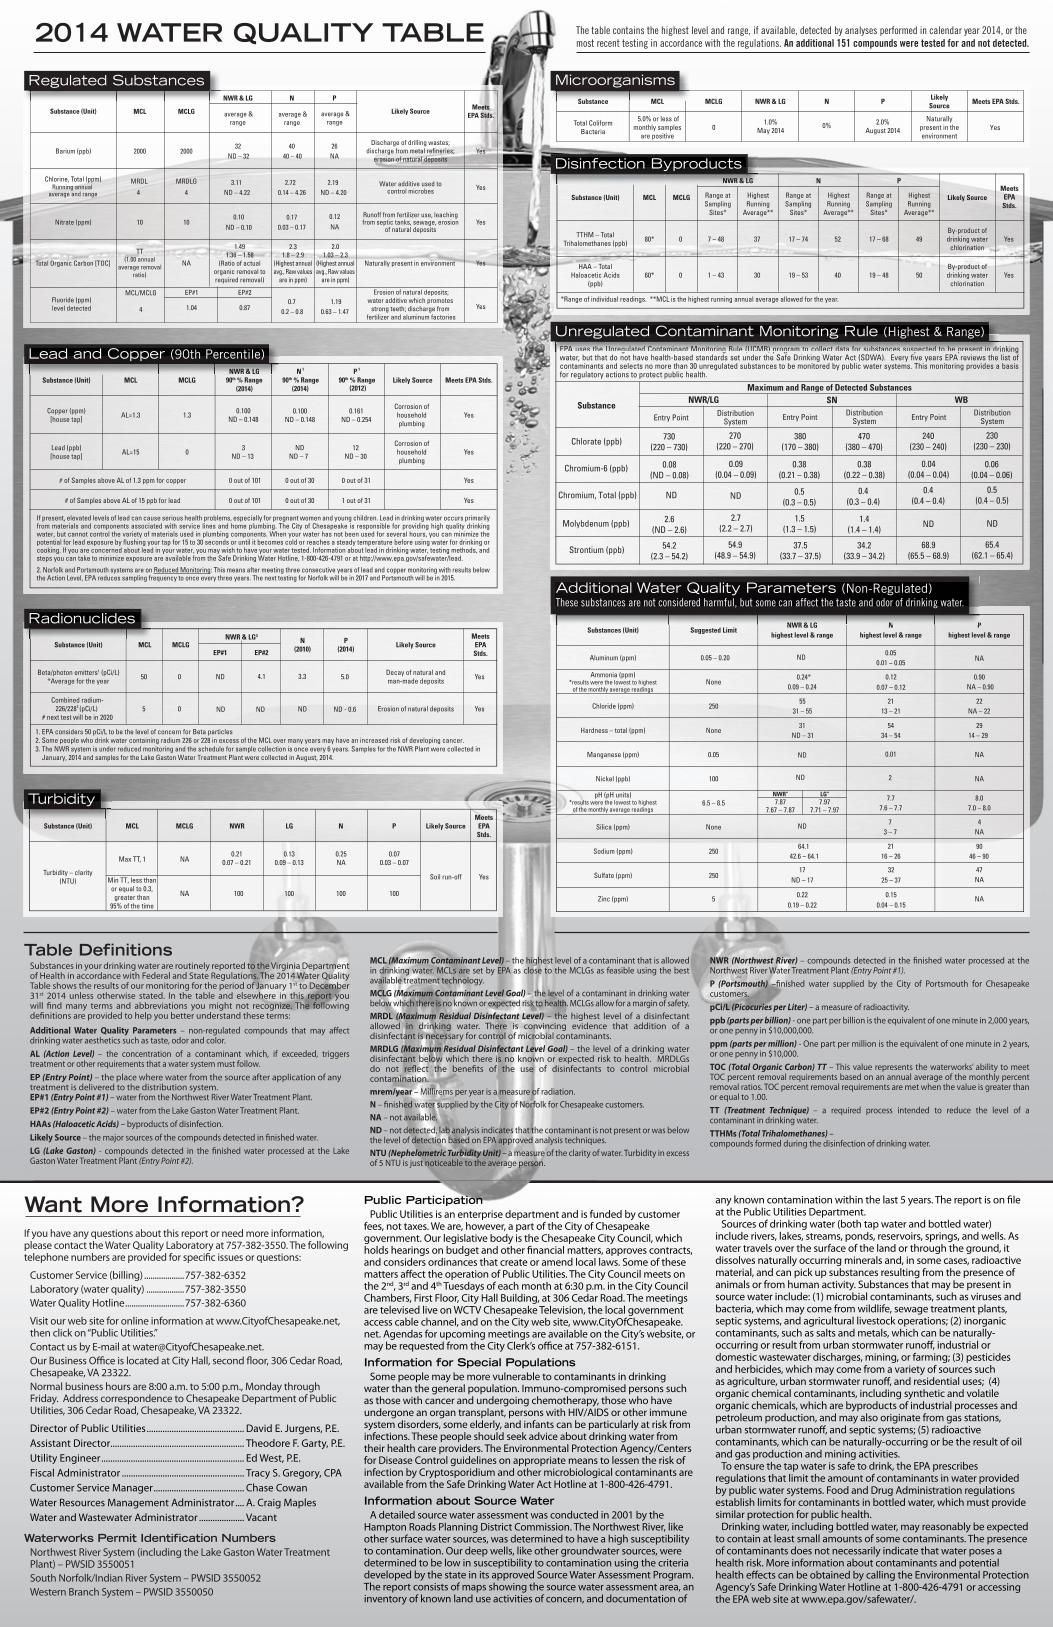
2014 WATER QUALITY TABLE The table contains the highest level and range, if available, detected by analyses performed in calendar year 2014, or the most recent testing in accordance with the regulations. An additional 151 compounds were tested for and not detected.
Substances in your drinking water are routinely reported to the Virginia Department of Health in accordance with Federal and State Regulations. The 2014 Water Quality Table shows the results of our monitoring for the period of January 1st to December 31st 2014 unless otherwise stated. In the table and elsewhere in this report you will fi nd many terms and abbreviations you might not recognize. The following defi nitions are provided to help you better understand these terms:
Additional Water Quality Parameters – non-regulated compounds that may aff ect drinking water aesthetics such as taste, odor and color.AL (Action Level) – the concentration of a contaminant which, if exceeded, triggers treatment or other requirements that a water system must follow.EP (Entry Point) – the place where water from the source after application of any treatment is delivered to the distribution system.EP#1 (Entry Point #1) – water from the Northwest River Water Treatment Plant.EP#2 (Entry Point #2) – water from the Lake Gaston Water Treatment Plant.HAAs (Haloacetic Acids) – byproducts of disinfection.Likely Source – the major sources of the compounds detected in fi nished water.LG (Lake Gaston) - compounds detected in the fi nished water processed at the Lake Gaston Water Treatment Plant (Entry Point #2).
MCL (Maximum Contaminant Level) – the highest level of a contaminant that is allowed in drinking water. MCLs are set by EPA as close to the MCLGs as feasible using the best available treatment technology.MCLG (Maximum Contaminant Level Goal) – the level of a contaminant in drinking water below which there is no known or expected risk to health. MCLGs allow for a margin of safety.MRDL (Maximum Residual Disinfectant Level) – the highest level of a disinfectant allowed in drinking water. There is convincing evidence that addition of a disinfectant is necessary for control of microbial contaminants.MRDLG (Maximum Residual Disinfectant Level Goal) – the level of a drinking water disinfectant below which there is no known or expected risk to health. MRDLGs do not refl ect the benefi ts of the use of disinfectants to control microbial contamination.mrem/year – Millirems per year is a measure of radiation.N – fi nished water supplied by the City of Norfolk for Chesapeake customers.NA – not available.ND – not detected, lab analysis indicates that the contaminant is not present or was below the level of detection based on EPA approved analysis techniques.NTU (Nephelometric Turbidity Unit) – a measure of the clarity of water. Turbidity in excess of 5 NTU is just noticeable to the average person.
NWR (Northwest River) – compounds detected in the fi nished water processed at the Northwest River Water Treatment Plant (Entry Point #1).P (Portsmouth) –fi nished water supplied by the City of Portsmouth for Chesapeake customers.pCi/L (Picocuries per Liter) – a measure of radioactivity.ppb (parts per billion) - one part per billion is the equivalent of one minute in 2,000 years, or one penny in $10,000,000.ppm (parts per million) - One part per million is the equivalent of one minute in 2 years, or one penny in $10,000.TOC (Total Organic Carbon) TT – This value represents the waterworks’ ability to meet TOC percent removal requirements based on an annual average of the monthly percent removal ratios. TOC percent removal requirements are met when the value is greater than or equal to 1.00.TT (Treatment Technique) – a required process intended to reduce the level of a contaminant in drinking water.TTHMs (Total Trihalomethanes) –compounds formed during the disinfection of drinking water.
Table Defi nitions
Want More Information?
Substance (Unit) MCL MCLG
NWR & LG N P
Likely Source Meets EPA Stds.
Barium (ppb) 2000 200032
ND – 3240
40 – 4026NA
Discharge of drilling wastes;
discharge from metal refineries;erosion of natural deposits
Yes
Chlorine, Total (ppm)Running annual
average and range
MRDL MRDLG
43.11
ND – 4.222.72
0.14 – 4.26 2.19
ND – 4.20Water additive used to
control microbes Yes
Nitrate (ppm) 10 100.10
ND – 0.100.17
0.03 – 0.17
Runoff from fertilizer use, leaching from septic tanks, sewage, erosion Yes
Total Organic Carbon [TOC]
TT(1.00 annual
average removal ratio)
NA Naturally present in environment Yes
Fluoride (ppm)level detected
MCL/MCLG
4
EP#1
1.040.7
0.2 – 0.81.19
0.63 – 1.47
Yes
4
0.12NA
average &range
EP#2
0.87
of natural deposits
1.491.36 – 1.58
(Ratio of actualorganic removal torequired removal)
2.31.8 – 2.9
(Highest annualavg., Raw values
are in ppm)
2.01.03 – 2.3
(Highest annualavg., Raw values
are in ppm)
Erosion of natural deposits;water additive which promotes
strong teeth; discharge from fertilizer and aluminum factories
average &range
average &range
Regulated Substances
Substance (Unit) MCL MCLGNWR & LG
90th % RangeN 1
90th % Range(2014)
P 1
90th % Range Likely Source Meets EPA Stds.
Copper (ppm)[house tap] AL=1.3 1.3 0.100
ND – 0.148
Corrosion of household plumbing
Yes
Lead (ppb)[house tap] AL=15 0 3
ND – 13ND
ND – 712
ND – 30
Corrosion of household plumbing
Yes
# of Samples above AL of 1.3 ppm for copper 0 out of 101 0 out of 30 0 out of 31 Yes
# of Samples above AL of 15 ppb for lead 0 out of 101 0 out of 30 1 out of 31 Yes
(2014) (2012)
0.100ND – 0.148
0.161ND – 0.254
If present, elevated levels of lead can cause serious health problems, especially for pregnant women and young children. Lead in drinking water occurs primarily from materials and components associated with service lines and home plumbing. The City of Chesapeake is responsible for providing high quality drinking water, but cannot control the variety of materials used in plumbing components. When your water has not been used for several hours, you can minimize the potential for lead exposure by flushing your tap for 15 to 30 seconds or until it becomes cold or reaches a steady temperature before using water for drinking or cooking. If you are concerned about lead in your water, you may wish to have your water tested. Information about lead in drinking water, testing methods, and steps you can take to minimize exposure are available from the Safe Drinking Water Hotline, 1-800-426-4791 or at http://www.epa.gov/safewater/lead.
2. Norfolk and Portsmouth systems are on Reduced Monitoring: This means after meeting three consecutive years of lead and copper monitoring with results below the Action Level, EPA reduces sampling frequency to once every three years. The next testing for Norfolk will be in 2017 and Portsmouth will be in 2015.
Substance (Unit) MCL MCLGNWR & LG3
N(2010)
P(2014) Likely Source
Meets EPA Stds.EP#1 EP#2
Beta/photon emitters1 (pCi/L)*Average for the year 50 0 ND 3.3 5.0 Decay of natural and
man-made deposits Yes
Combined radium-226/2282 (pCi/L)
# next test will be in 20205 0 Erosion of natural deposits Yes
1. EPA considers 50 pCi/L to be the level of concern for Beta particles2. Some people who drink water containing radium 226 or 228 in excess of the MCL over many years may have an increased risk of developing cancer.3. The NWR system is under reduced monitoring and the schedule for sample collection is once every 6 years. Samples for the NWR Plant were collected in January, 2014 and samples for the Lake Gaston Water Treatment Plant were collected in August, 2014.
4.1
ND ND ND ND - 0.6
Substance (Unit) MCL MCLG NWR LG N P Likely SourceMeets
EPA Stds.
Turbidity – clarity(NTU)
Max TT, 1 NA0.21
0.07 – 0.21
Soil run-off Yes
NA 100 100 100 100
0.130.09 – 0.13
0.25NA
0.070.03 – 0.07
Min TT, less thanor equal to 0.3,greater than
95% of the time
ND
Substances (Unit) Suggested LimitNWR & LG
highest level & rangeN
highest level & rangeP
highest level & range
Aluminum (ppm) 0.05 – 0.20 ND0.05
0.01 – 0.05
Ammonia (ppm)*results were the lowest to highest
of the monthly average readingsNone
0.24*0.09 – 0.24
0.120.07 – 0.12
0.90NA – 0.90
Chloride (ppm) 25055
31 – 5521
13 – 2122
NA – 22
Hardness – total (ppm) None31
ND – 3154
34 – 5429
14 – 29
Manganese (ppm) 0.05 0.01 NA
Nickel (ppb) 100 NA
6.5 – 8.57.7
7.6 – 7.78.0
7.0 – 8.0
Sulfate (ppm) 250
Sodium (ppm) 25064.1
42.6 – 64.121
16 – 26 46 – 9090
Zinc (ppm) 5 NA
NWR*
7.877.67 – 7.87
LG*
7.977.71 – 7.97
17ND – 17
3225 – 37
0.220.19 – 0.22
0.150.04 – 0.15
NA
ND
2
pH (pH units)*results were the lowest to highest
of the monthly average readings
Silica (ppm)7
3 – 7 NA4
NA47
None ND
SubstanceNWR/LG
Chlorate (ppb)240
(230 – 240)
Chromium-6 (ppb)
Chromium, Total (ppb) ND
Molybdenum (ppb)
Strontium (ppb) 68.9(65.5 – 68.9)
0.09(0.04 – 0.09)
2.7(2.2 – 2.7) ND
0.4(0.4 – 0.4)
0.04(0.04 – 0.04)
EPA uses the Unregulated Contaminant Monitoring Rule (UCMR) program to collect data for substances suspected to be present in drinking water, but that do not have health-based standards set under the Safe Drinking Water Act (SDWA). Every five years EPA reviews the list of contaminants and selects no more than 30 unregulated substances to be monitored by public water systems. This monitoring provides a basis for regulatory actions to protect public health.
380(170 – 380)
37.5(33.7 – 37.5)
0.38(0.21 – 0.38)
470(380 – 470)
34.2(33.9 – 34.2)
1.4(1.4 – 1.4)
0.38(0.22 – 0.38)
230(230 – 230)
65.4(62.1 – 65.4)
ND
0.5(0.4 – 0.5)
0.06(0.04 – 0.06)
SN WB
Entry Point DistributionSystem Entry Point Distribution
System Entry Point DistributionSystem
730(220 – 730)
54.2(2.3 – 54.2)
2.6(ND – 2.6)
0.08(ND – 0.08)
ND 0.5(0.3 – 0.5)
270(220 – 270)
54.9(48.9 – 54.9)
1.5(1.3 – 1.5)
0.4(0.3 – 0.4)
Maximum and Range of Detected Substances
Substance MCL MCLG NWR & LG N P LikelySource Meets EPA Stds.
Total Coliform Bacteria
5.0% or less of monthly samples
are positive0
1.0%May 2014
Naturally present in the environment
Yes0% 2.0%August 2014
Substance (Unit) MCL MCLG
NWR & LG N P
Likely SourceRange at Sampling
Sites*
Highest Running
Average**
Range at Sampling
Sites*
Highest Running
Average**
Range at Sampling
Sites*
Highest Running
Average**
TTHM – TotalTrihalomethanes (ppb) 80* 0 7 – 48 37 17 – 74 52 17 – 68 49
By-product of drinking water
chlorinationYes
HAA – TotalHaloacetic Acids
(ppb)60* 0 1 – 43 30 19 – 53 40 19 – 48 50
By-product of drinking water
chlorinationYes
*Range of individual readings. **MCL is the highest running annual average allowed for the year.
Meets EPA Stds.
NWR NWR NWR & LG& LG& LG
Lead and Copper (90th Percentile)
Radionuclides
Turbidity
Substance MCL
Microorganisms
NNNWR & LG& LGL
Disinfection Byproducts
EPA uses the Unregulated Contaminant Monitoring Rule (UCMR) program to collect data for substances suspected to be present in dr
Unregulated Contaminant Monitoring Rule (Highest & Range)
NWRNWRNWR & LG& LG& LG N P
Additional Water Quality Parameters (Non-Regulated)These substances are not considered harmful, but some can affect the taste and odor of drinking water.
If you have any questions about this report or need more information, please contact the Water Quality Laboratory at 757-382-3550. The following telephone numbers are provided for specifi c issues or questions:
Customer Service (billing) ...................757-382-6352Laboratory (water quality) ..................757-382-3550Water Quality Hotline ............................757-382-6360
Visit our web site for online information at www.CityofChesapeake.net, then click on “Public Utilities.” Contact us by E-mail at [email protected]. Our Business Offi ce is located at City Hall, second fl oor, 306 Cedar Road, Chesapeake, VA 23322. Normal business hours are 8:00 a.m. to 5:00 p.m., Monday through Friday. Address correspondence to Chesapeake Department of Public Utilities, 306 Cedar Road, Chesapeake, VA 23322.
Director of Public Utilities ........................................... David E. Jurgens, P.E.Assistant Director ........................................................... Theodore F. Garty, P.E.Utility Engineer ............................................................... Ed West, P.E.Fiscal Administrator ...................................................... Tracy S. Gregory, CPACustomer Service Manager ........................................ Chase CowanWater Resources Management Administrator .... A. Craig MaplesWater and Wastewater Administrator .................... Vacant
Waterworks Permit Identifi cation Numbers Northwest River System (including the Lake Gaston Water Treatment Plant) – PWSID 3550051South Norfolk/Indian River System – PWSID 3550052Western Branch System – PWSID 3550050
Public ParticipationPublic Utilities is an enterprise department and is funded by customer
fees, not taxes. We are, however, a part of the City of Chesapeake government. Our legislative body is the Chesapeake City Council, which holds hearings on budget and other financial matters, approves contracts, and considers ordinances that create or amend local laws. Some of these matters affect the operation of Public Utilities. The City Council meets on the 2nd, 3rd and 4th Tuesdays of each month at 6:30 p.m. in the City Council Chambers, First Floor, City Hall Building, at 306 Cedar Road. The meetings are televised live on WCTV Chesapeake Television, the local government access cable channel, and on the City web site, www.CityOfChesapeake.net. Agendas for upcoming meetings are available on the City’s website, or may be requested from the City Clerk’s office at 757-382-6151.
Information for Special PopulationsSome people may be more vulnerable to contaminants in drinking
water than the general population. Immuno-compromised persons such as those with cancer and undergoing chemotherapy, those who have undergone an organ transplant, persons with HIV/AIDS or other immune system disorders, some elderly, and infants can be particularly at risk from infections. These people should seek advice about drinking water from their health care providers. The Environmental Protection Agency/Centers for Disease Control guidelines on appropriate means to lessen the risk of infection by Cryptosporidium and other microbiological contaminants are available from the Safe Drinking Water Act Hotline at 1-800-426-4791.
Information about Source WaterA detailed source water assessment was conducted in 2001 by the
Hampton Roads Planning District Commission. The Northwest River, like other surface water sources, was determined to have a high susceptibility to contamination. Our deep wells, like other groundwater sources, were determined to be low in susceptibility to contamination using the criteria developed by the state in its approved Source Water Assessment Program. The report consists of maps showing the source water assessment area, an inventory of known land use activities of concern, and documentation of
any known contamination within the last 5 years. The report is on file at the Public Utilities Department.
Sources of drinking water (both tap water and bottled water) include rivers, lakes, streams, ponds, reservoirs, springs, and wells. As water travels over the surface of the land or through the ground, it dissolves naturally occurring minerals and, in some cases, radioactive material, and can pick up substances resulting from the presence of animals or from human activity. Substances that may be present in source water include: (1) microbial contaminants, such as viruses and bacteria, which may come from wildlife, sewage treatment plants, septic systems, and agricultural livestock operations; (2) inorganic contaminants, such as salts and metals, which can be naturally-occurring or result from urban stormwater runoff, industrial or domestic wastewater discharges, mining, or farming; (3) pesticides and herbicides, which may come from a variety of sources such as agriculture, urban stormwater runoff, and residential uses; (4) organic chemical contaminants, including synthetic and volatile organic chemicals, which are byproducts of industrial processes and petroleum production, and may also originate from gas stations, urban stormwater runoff, and septic systems; (5) radioactive contaminants, which can be naturally-occurring or be the result of oil and gas production and mining activities.
To ensure the tap water is safe to drink, the EPA prescribes regulations that limit the amount of contaminants in water provided by public water systems. Food and Drug Administration regulations establish limits for contaminants in bottled water, which must provide similar protection for public health.
Drinking water, including bottled water, may reasonably be expected to contain at least small amounts of some contaminants. The presence of contaminants does not necessarily indicate that water poses a health risk. More information about contaminants and potential health effects can be obtained by calling the Environmental Protection Agency’s Safe Drinking Water Hotline at 1-800-426-4791 or accessing the EPA web site at www.epa.gov/safewater/.