Embed Size (px)
Citation preview
SAFEGUARDING YOUR DRINKING WATER QUALITY
DRINKING WATER QUALITY IN SCOTLAND 2011ANNUAL REPORT BY THE DRINKING WATER QUALITY REGULATOR FOR SCOTLAND
The DWQR may be contacted either by writing to:
Drinking Water Quality Regulator for ScotlandPO Box 23598EDINBURGHEH6 6WW
or via our website: www.DWQR.org.uk
or telephoning 0131 244 0224
DRINKING WATER QUALITY IN SCOTLAND 2011
ANNUAL REPORT BY THE DRINKING WATER QUALITY REGULATOR FOR SCOTLAND

© Crown copyright 2012
The maps presented in this publication are based on Ordnance Survey material with the permission of Ordnance Survey on behalf of the Controller of Her Majesty’s Stationery Office © Crown copyright 2012. Unauthorised reproduction infringes Crown copyright and may lead to prosecution or civil proceedings. Scottish Government Licence number: 100024655, 2012.
Published on behalf of the Drinking Water Quality Regulator for Scotland, September 2012.
Produced for the Drinking Water Quality Regulator by APS Group Scotland DPPAS12684 (08/12) Further copies are available from DWQR at www.DWQR.org.uk or 0131 244 0190. The text pages of this document are printed on 100% recyclable paper.

Drinking Water QUaLitY in Scotland 2011annual report by the drinking Water Quality regulator for Scotland
DRINKING WATER QUALITYIN SCOTLAND 2011
CONTENTS
ANNUAL REPORT BY THE DRINKING WATER QUALITY REGULATOR 2_3
foreWord 4
eXecutiVe SuMMary 6
1. public Water SupplieS 201.1 Catchment 221.2 Water Treatment 281.3 Distribution Systems 461.4 Consumers 60
2. priVate Water SupplieS 82
3. drinking Water Quality by local authority 96
anneXeS 130A Summary of Events and Incidents 132B Audit and Inspection 136C Undertakings and Enforcement Notices 137D Summary of Improvement Programmes 139E The Regulatory Framework 142F Index of Information Letters 146G Categories of Drinking Water Quality Contacts 147H Statistical Methods Used in the Report 150

DRINKING WATER QUALITYIN SCOTLAND 2011
It is 10 years since the Water Industry (Scotland) Act 2002 created not only the role of the Drinking Water Quality Regulator for Scotland (DWQR), but also formed Scottish Water from three separate water authority areas. There has been significant improvement in the quality of public drinking water supplies over the past 10 years, 99.28% of samples taken from consumers’ taps achieved the standards in 2002, and this has now improved to 99.84% in 2011.
The 2010 report highlighted concern over the continued number of failures of the standards for trihalomethanes (THMs). THMs are formed when naturally occurring organic substances found in source waters combine with chlorine. I am pleased to report in 2011 the number of THM sample failures reduced significantly as a result of continued investment in improving water quality and disinfection control at water treatment works. This will continue to be an area of focus for Scottish Water’s investment programme over the coming years.
I am disappointed to note a deterioration in 2011 in compliance with microbiological standards for coliform bacteria in samples taken from water treatment works and service reservoirs. Testing for the presence of microbiological parameters indicates how well Scottish Water is meeting its duties to disinfect the water it supplies, and to assess the integrity of the service reservoirs used to store water.
All sample failures are investigated by Scottish Water, but a significant number of those conducted during 2011 either failed to find a cause, or the cause was deemed to be inadequate sampling facilities. The results of this monitoring and any subsequent investigation are crucial in giving confidence to consumers, DWQR and health professionals and more rigorous investigation is needed to ensure effective remedial action is taken when necessary. The quality of sampling facilities is within Scottish Water’s control and they must be fit for purpose. I have discussed these matters with Scottish Water and they are committed to making improvements.
Previous reports on drinking water quality in Scotland have stressed the importance of risk assessment and the development of water safety plans in managing drinking water supplies. I am pleased to report that Scottish Water has now completed water safety plans for each of its supply systems and these plans are regularly reviewed and updated. They are now being used to identify investment needs and operational changes for the future as part of the current review of charges.
In addition to regulating public supplies, I also have a role overseeing the quality of private supplies, which are regulated by local authorities. Around 3% of Scotland’s population rely upon a private water supply for their drinking water, and
FOREWORDi am pleased to publish this annual report on the quality of Scotland’s drinking water during 2011. My report provides a comprehensive commentary on the quality of both public and private drinking water supplies and documents the work of my staff in assessing that Scottish Water is delivering water that is safe and clean. Scrutiny of private water supplies is the responsibility of local authorities with the role of the Drinking Water Quality regulator being principally of a supervisory nature.
ANNUAL REPORT BY THE DRINKING WATER QUALITY REGULATOR 4_5
these supplies are also consumed by visitors and tourists. The responsibility for the operation and maintenance of these supplies rests with their owners and users.
Environmental Health teams of local authorities carry out risk assessments and sampling of private water supplies, and give advice to owners and users on minimising risk. A non-means tested grant of up to £800 per property to improve private water supplies is available from local authorities, with £2.1 million of improvement grants awarded during the financial year 2011/12.
Comprehensive data on the quality of private water supplies has been reported to DWQR by local authorities since 2008 and the quality of private supplies continues to be of concern. 18% of those supplies sampled showed the presence of E. coli and overall compliance with regulatory standards was 91.54%.
A significant number of failures occurred on supplies reported to have a disinfection process in place, demonstrating the criticality of adequate design, installation and maintenance of treatment processes.
DWQR staff will be working closely with local authorities and health professionals in the coming months to develop an improvement strategy for private water supplies which ensures risks are proactively identified and effectively managed.
Overall, it is good to report on improvements that have been made in the quality of Scotland’s drinking water over the past 10 years. I would now like to look forward to even more improvements in drinking water quality as a more proactive approach develops through the use of Water Safety Plans to manage the risks to water quality and minimise the risk of failures.
Sue petch
DRINKING WATER QUALITYIN SCOTLAND 2011
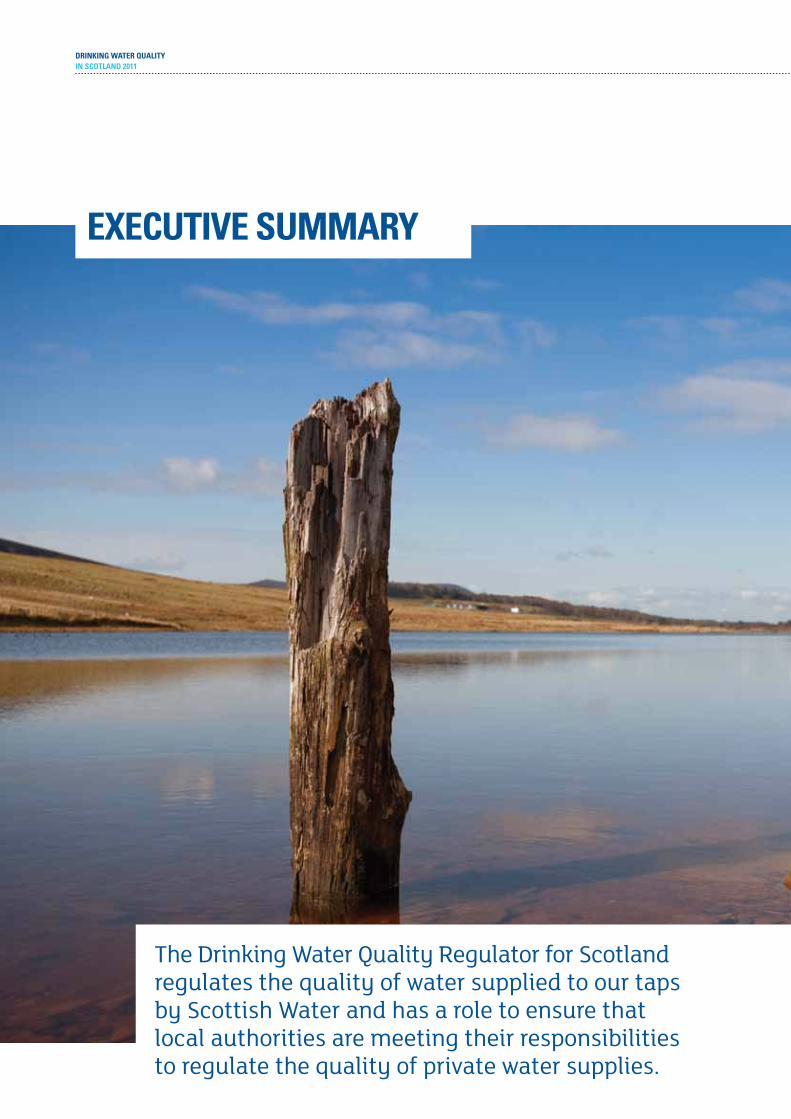
the Drinking Water Quality regulator for Scotland regulates the quality of water supplied to our taps by Scottish Water and has a role to ensure that local authorities are meeting their responsibilities to regulate the quality of private water supplies.
ExECUTIvE SUmmARY
ANNUAL REPORT BY THE DRINKING WATER QUALITY REGULATOR 6_7
The role of the Drinking Water Quality Regulator (DWQR or the Regulator) was created by the Water Industry (Scotland) Act 2002, which gives the Regulator various powers to enter premises as part of an investigation, to obtain information and to take enforcement action. This report fulfils the requirement under the Act that the DWQR shall publish a report on the exercise of the Regulator’s functions during the previous year. This report relates to the calendar year 2011.
The quality standards that drinking water supplies must meet are set out in Regulations and the function of the DWQR is to ensure that these Regulations are complied with. In Scotland the Regulations relating to the quality of water supplied by Scottish Water is the Water Supply (Water Quality) (Scotland) Regulations 2001. Private water supplies have equivalent Regulations – the Private Water Supply (Scotland) Regulations 2006 – which are enforced by local authorities. Quality Standards in both Regulations are derived from the European Drinking Water Directive 98/83/EC.
DRINKING WATER QUALITYIN SCOTLAND 2011
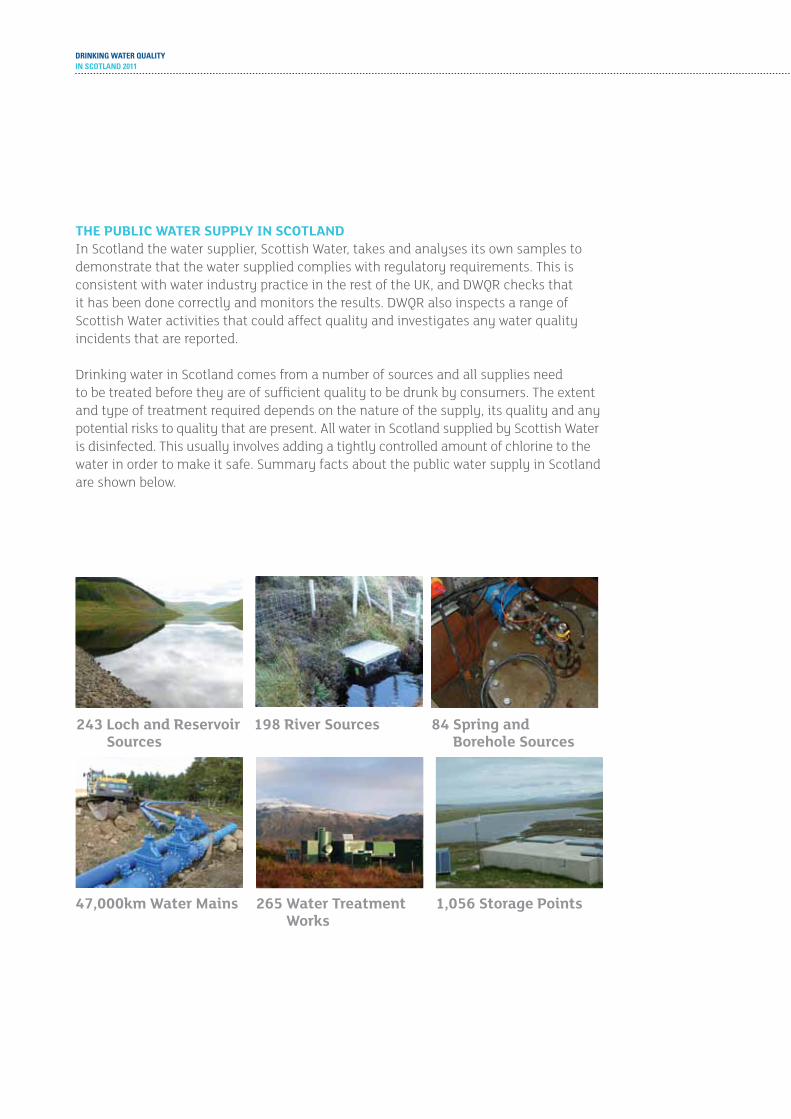
the public Water Supply in ScotlandIn Scotland the water supplier, Scottish Water, takes and analyses its own samples to demonstrate that the water supplied complies with regulatory requirements. This is consistent with water industry practice in the rest of the UK, and DWQR checks that it has been done correctly and monitors the results. DWQR also inspects a range of Scottish Water activities that could affect quality and investigates any water quality incidents that are reported.
Drinking water in Scotland comes from a number of sources and all supplies need to be treated before they are of sufficient quality to be drunk by consumers. The extent and type of treatment required depends on the nature of the supply, its quality and any potential risks to quality that are present. All water in Scotland supplied by Scottish Water is disinfected. This usually involves adding a tightly controlled amount of chlorine to the water in order to make it safe. Summary facts about the public water supply in Scotland are shown below.
265 Water treatment Works
198 river Sources243 loch and reservoir Sources
47,000km Water Mains
84 Spring and borehole Sources
1,056 Storage points
ANNUAL REPORT BY THE DRINKING WATER QUALITY REGULATOR 8_9
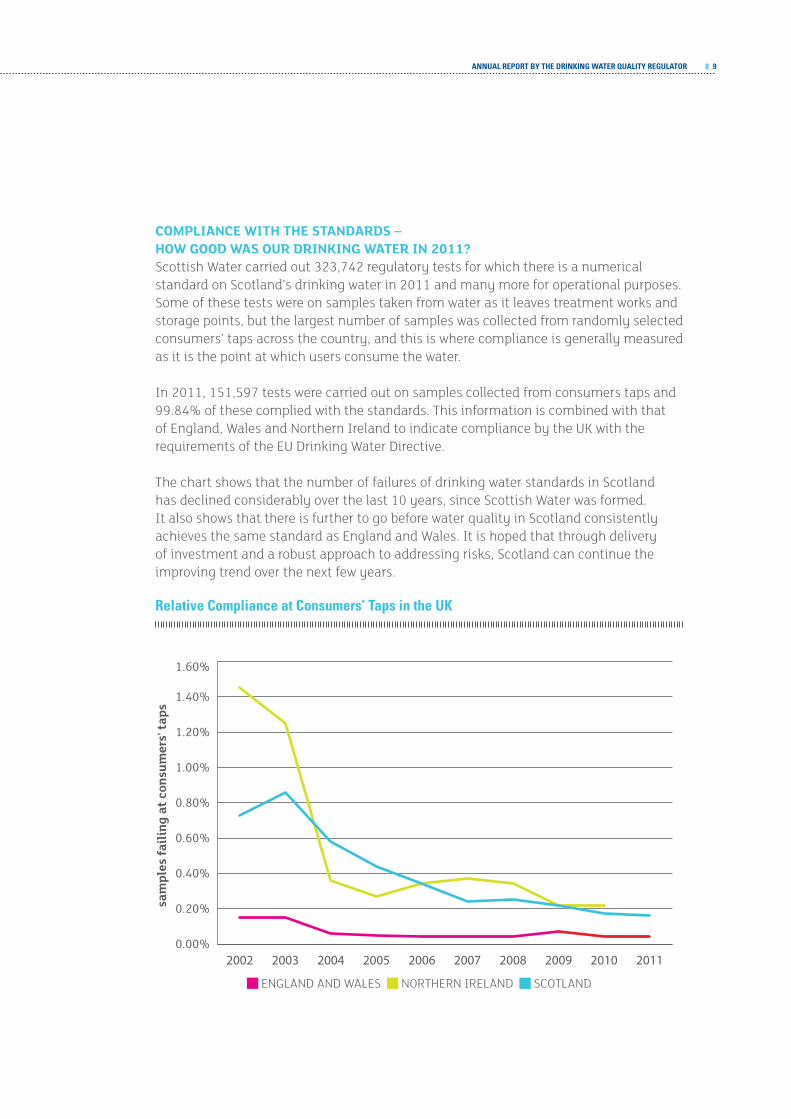
coMpliance With the StandardS – hoW good WaS our drinking Water in 2011?Scottish Water carried out 323,742 regulatory tests for which there is a numerical standard on Scotland’s drinking water in 2011 and many more for operational purposes. Some of these tests were on samples taken from water as it leaves treatment works and storage points, but the largest number of samples was collected from randomly selected consumers’ taps across the country, and this is where compliance is generally measured as it is the point at which users consume the water.
In 2011, 151,597 tests were carried out on samples collected from consumers taps and 99.84% of these complied with the standards. This information is combined with that of England, Wales and Northern Ireland to indicate compliance by the UK with the requirements of the EU Drinking Water Directive.
The chart shows that the number of failures of drinking water standards in Scotland has declined considerably over the last 10 years, since Scottish Water was formed. It also shows that there is further to go before water quality in Scotland consistently achieves the same standard as England and Wales. It is hoped that through delivery of investment and a robust approach to addressing risks, Scotland can continue the improving trend over the next few years.
Relative Compliance at Consumers’ Taps in the UK
0.00%
0.20%
0.40%
0.60%
0.80%
1.00%
1.20%
1.40%
1.60%
2011201020092008200720062005200420032002
sam
ples
faili
ng a
t con
sum
ers'
taps
ENGLAND AND WALES NORTHERN IRELAND SCOTLAND
DRINKING WATER QUALITYIN SCOTLAND 2011
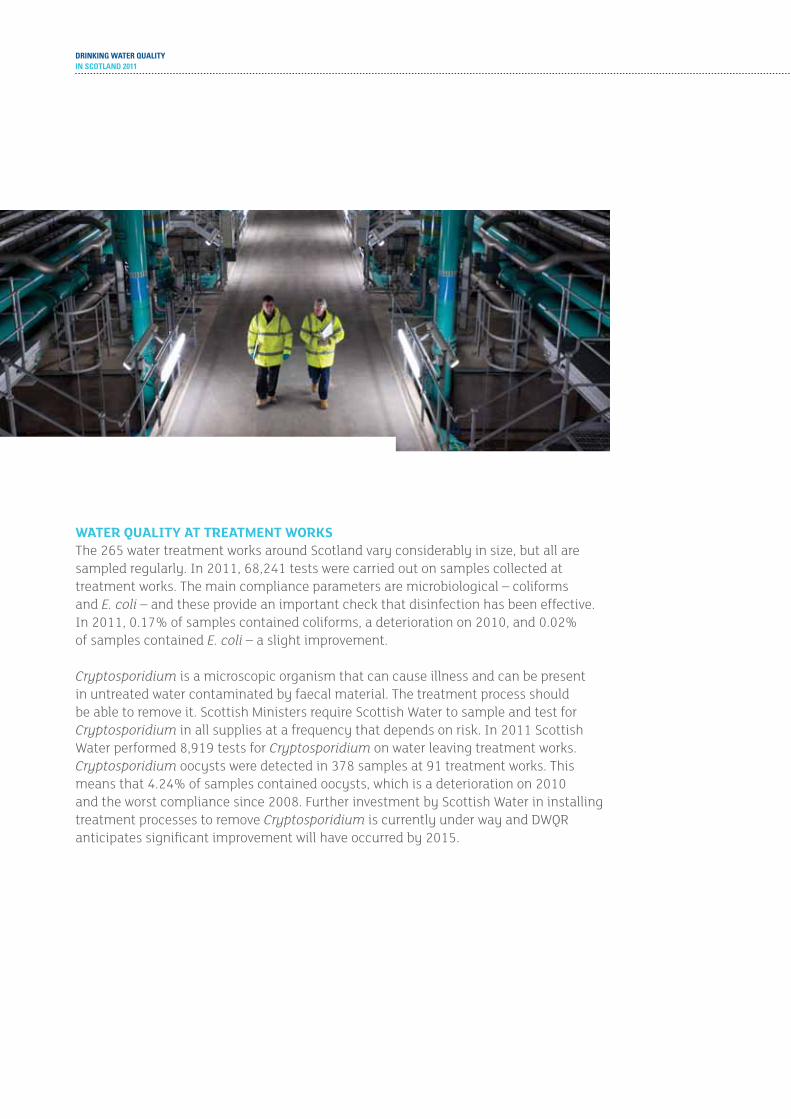
Water Quality at treatMent WorkSThe 265 water treatment works around Scotland vary considerably in size, but all are sampled regularly. In 2011, 68,241 tests were carried out on samples collected at treatment works. The main compliance parameters are microbiological – coliforms and E. coli – and these provide an important check that disinfection has been effective. In 2011, 0.17% of samples contained coliforms, a deterioration on 2010, and 0.02% of samples contained E. coli – a slight improvement.
Cryptosporidium is a microscopic organism that can cause illness and can be present in untreated water contaminated by faecal material. The treatment process should be able to remove it. Scottish Ministers require Scottish Water to sample and test for Cryptosporidium in all supplies at a frequency that depends on risk. In 2011 Scottish Water performed 8,919 tests for Cryptosporidium on water leaving treatment works. Cryptosporidium oocysts were detected in 378 samples at 91 treatment works. This means that 4.24% of samples contained oocysts, which is a deterioration on 2010 and the worst compliance since 2008. Further investment by Scottish Water in installing treatment processes to remove Cryptosporidium is currently under way and DWQR anticipates significant improvement will have occurred by 2015.

ANNUAL REPORT BY THE DRINKING WATER QUALITY REGULATOR 10_11
It is disappointing that water quality at water treatment works has not shown improvement in 2011 in spite of continued investment. Inspections of works by the DWQR have generally shown staff to be performing to a high standard, although the overall condition of the treatment asset itself indicates that maintenance investment may be required. In some cases there may be evidence that the quality of raw water entering the works has deteriorated to an extent that the treatment process is unable to consistently produce water of satisfactory quality and plans are being developed to address this.
Scottish Water is expected to manage risks to water quality via the Water Safety Plan (WSP) approach to ensure future investment is targeted at appropriate areas. Sufficient provision must also be made to maintain existing assets. Although good, water quality at treatment works can and must improve further.
68,241 tests at WtW
79 failures

DRINKING WATER QUALITYIN SCOTLAND 2011
Water Quality in diStribution SySteMSThe distribution system comprises the network of pipes delivering water to consumers’ homes as well as any storage points such as water towers and service reservoirs. Scottish Water has over a thousand storage points and more than 47,000km of water mains and it must ensure that the condition of these does not cause water quality to deteriorate.
Scottish Water must sample every storage point once each week and test for E. coli and coliform bacteria. According to the Regulations, 5% of samples from a storage point may contain coliforms before it is considered to have failed to meet the standard, however, all detections should be investigated. In 2011, 13 samples contained E. coli and five storage points failed to meet the 95% requirement for coliforms. Both of these results compare unfavourably with 2010, which again, is a disappointment. More must be done to undertake a meaningful investigation when microbiological failures occur in order to pinpoint and address root causes. Scottish Water has recently enhanced its programme of cleaning and inspecting storage points, and it is hoped this will bear fruit in reducing failures.
Although they are measured at consumer’s taps, iron and manganese compliance provides an indication of the condition of the distribution system and any sediment within it. Both substances can cause discoloration that can greatly inconvenience consumers and lead to complaints. In 2011, compliance for iron deteriorated against 2010’s result. Manganese compliance improved slightly. Scottish Water has investment plans to improve compliance for both parameters.
0.91% of tests failed for iron
ANNUAL REPORT BY THE DRINKING WATER QUALITY REGULATOR 12_13
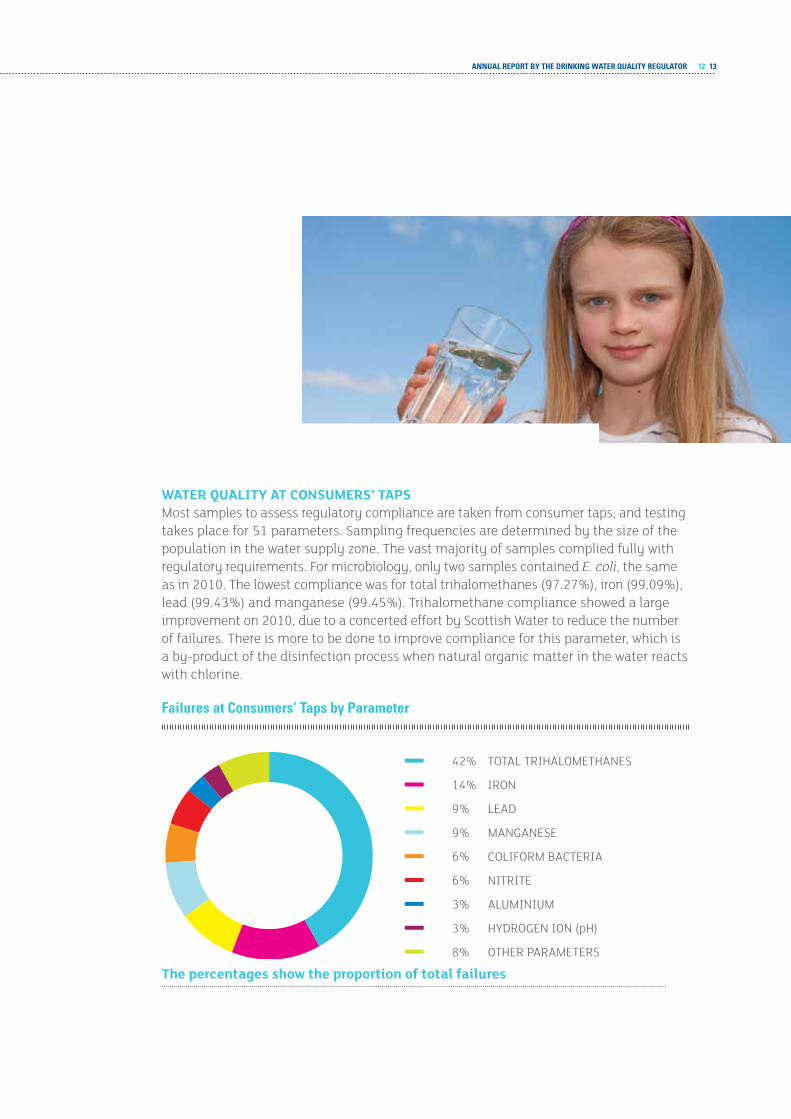
Water Quality at conSuMerS’ tapSMost samples to assess regulatory compliance are taken from consumer taps, and testing takes place for 51 parameters. Sampling frequencies are determined by the size of the population in the water supply zone. The vast majority of samples complied fully with regulatory requirements. For microbiology, only two samples contained E. coli, the same as in 2010. The lowest compliance was for total trihalomethanes (97.27%), iron (99.09%), lead (99.43%) and manganese (99.45%). Trihalomethane compliance showed a large improvement on 2010, due to a concerted effort by Scottish Water to reduce the number of failures. There is more to be done to improve compliance for this parameter, which is a by-product of the disinfection process when natural organic matter in the water reacts with chlorine.
Failures at Consumers’ Taps by Parameter
42% TOTAL TRIHALOMETHANES
14% IRON
9% LEAD
9% MANGANESE
6% COLIFORM BACTERIA
6% NITRITE
3% ALUMINIUM
3% HYDROGEN ION (pH)
8% OTHER PARAMETERS
the percentages show the proportion of total failures
DRINKING WATER QUALITYIN SCOTLAND 2011
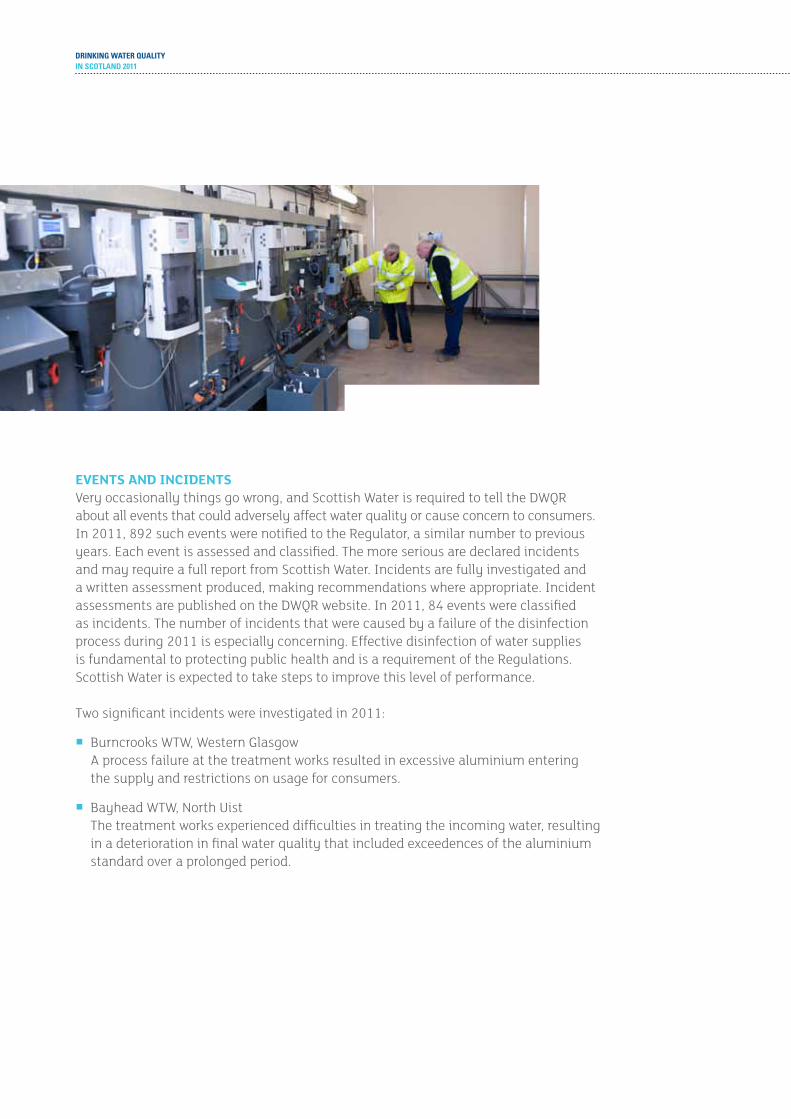
eVentS and incidentSVery occasionally things go wrong, and Scottish Water is required to tell the DWQR about all events that could adversely affect water quality or cause concern to consumers. In 2011, 892 such events were notified to the Regulator, a similar number to previous years. Each event is assessed and classified. The more serious are declared incidents and may require a full report from Scottish Water. Incidents are fully investigated and a written assessment produced, making recommendations where appropriate. Incident assessments are published on the DWQR website. In 2011, 84 events were classified as incidents. The number of incidents that were caused by a failure of the disinfection process during 2011 is especially concerning. Effective disinfection of water supplies is fundamental to protecting public health and is a requirement of the Regulations. Scottish Water is expected to take steps to improve this level of performance.
Two significant incidents were investigated in 2011:
¡¡ Burncrooks WTW, Western Glasgow A process failure at the treatment works resulted in excessive aluminium entering the supply and restrictions on usage for consumers.
¡¡ Bayhead WTW, North Uist The treatment works experienced difficulties in treating the incoming water, resulting in a deterioration in final water quality that included exceedences of the aluminium standard over a prolonged period.
ANNUAL REPORT BY THE DRINKING WATER QUALITY REGULATOR 14_15
audit and inSpectionAudit and Inspection is a key part of DWQR’s role and a number of inspections across Scotland are undertaken every year, auditing against regulatory requirements and industry best practice. This enables the Regulator to monitor Scottish Water’s performance and hear about issues first hand from operational staff as well as comparing practices in different parts of Scotland. Where deficiencies are noted, recommendations are made, the resolution of which is tracked. Elements of best practice are also noted.
In 2011 the following inspections were undertaken:
¡¡ 6 water treatment works
¡¡ 7 distribution activities
¡¡ 23 consumer contacts about quality to Scottish Water
The audits of treatment works and distribution systems showed a number of positive elements as well as areas where improvement was necessary. In treatment works the key issue is ensuring instrument calibrations are undertaken consistently and that routine maintenance tasks are carried out. The hygienic storage of materials and equipment in temporary compounds, site containers and vehicles was the common issue across contractors working on water mains rehabilitation projects. Within the contact centre, call agents gathered customer information well and used various support tools and systems to prompt appropriate questioning of consumer issues.
DRINKING WATER QUALITYIN SCOTLAND 2011
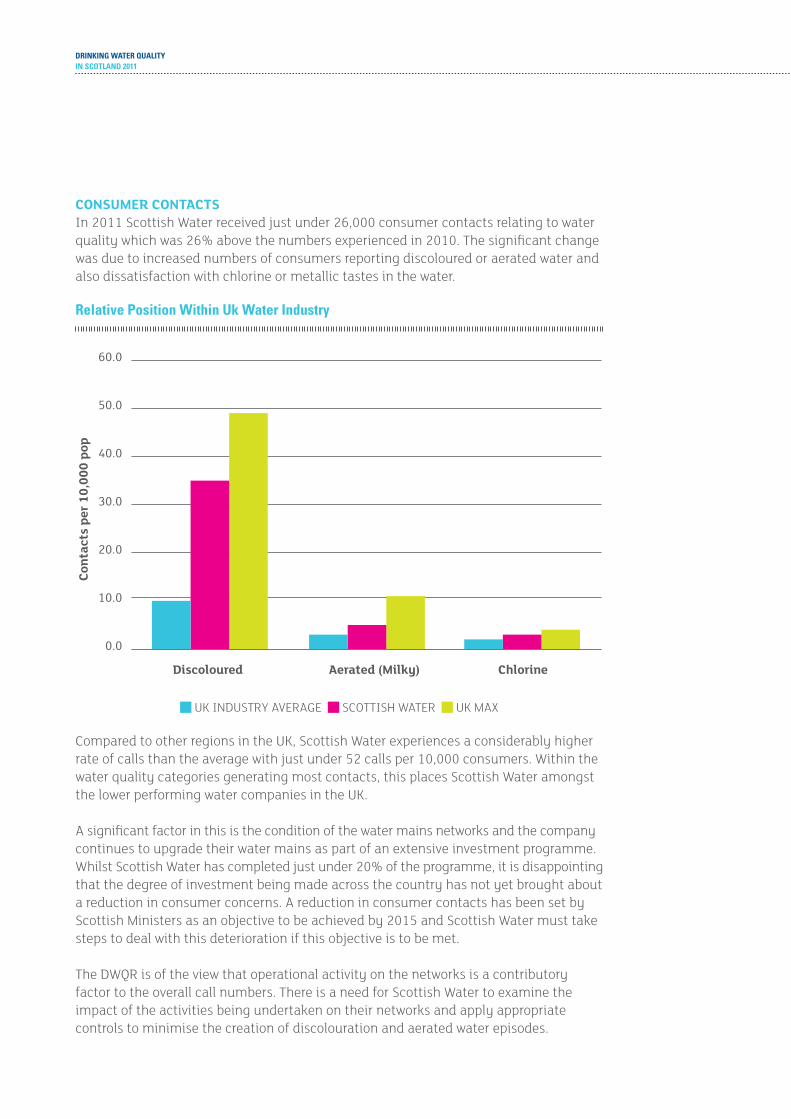
conSuMer contactSIn 2011 Scottish Water received just under 26,000 consumer contacts relating to water quality which was 26% above the numbers experienced in 2010. The significant change was due to increased numbers of consumers reporting discoloured or aerated water and also dissatisfaction with chlorine or metallic tastes in the water.
Relative Position Within Uk Water Industry
0.0
10.0
20.0
30.0
40.0
50.0
60.0
ChlorineAerated (Milky)Discoloured
Cont
acts
per
10,
000
pop
UK INDUSTRY AVERAGE SCOTTISH WATER UK MAX
Compared to other regions in the UK, Scottish Water experiences a considerably higher rate of calls than the average with just under 52 calls per 10,000 consumers. Within the water quality categories generating most contacts, this places Scottish Water amongst the lower performing water companies in the UK.
A significant factor in this is the condition of the water mains networks and the company continues to upgrade their water mains as part of an extensive investment programme. Whilst Scottish Water has completed just under 20% of the programme, it is disappointing that the degree of investment being made across the country has not yet brought about a reduction in consumer concerns. A reduction in consumer contacts has been set by Scottish Ministers as an objective to be achieved by 2015 and Scottish Water must take steps to deal with this deterioration if this objective is to be met.
The DWQR is of the view that operational activity on the networks is a contributory factor to the overall call numbers. There is a need for Scottish Water to examine the impact of the activities being undertaken on their networks and apply appropriate controls to minimise the creation of discolouration and aerated water episodes.
DWQr carried out
36
ANNUAL REPORT BY THE DRINKING WATER QUALITY REGULATOR 16_17
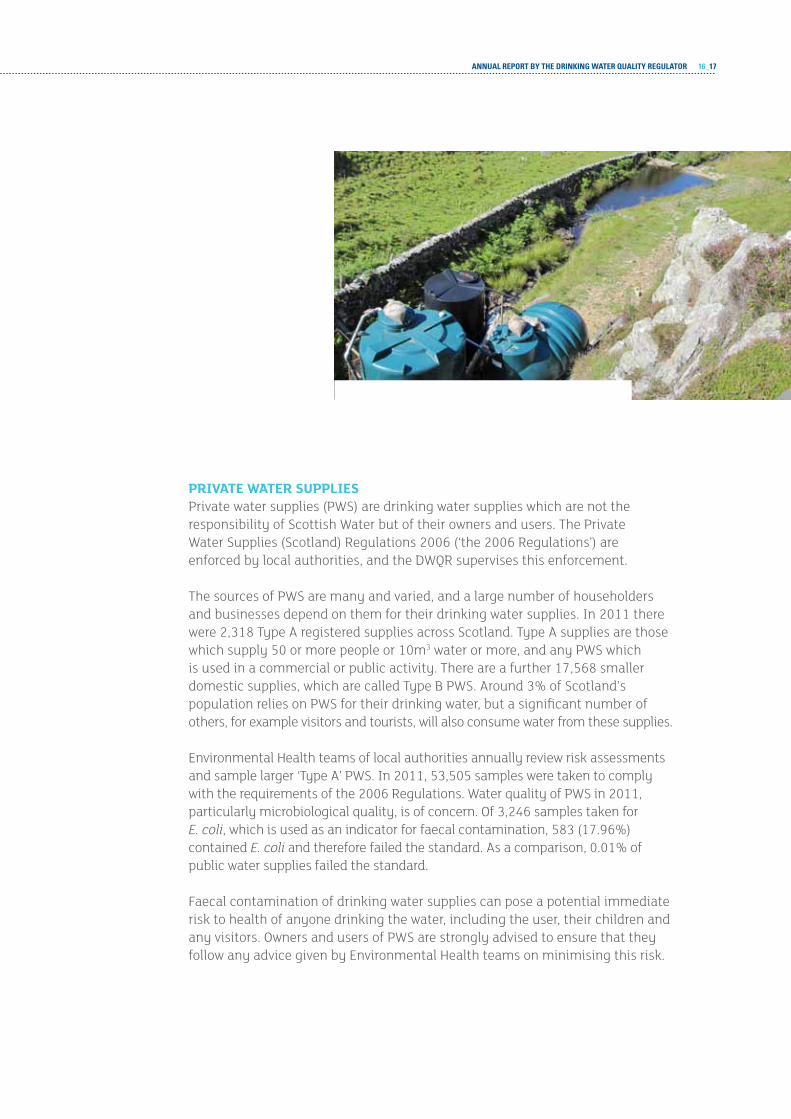
priVate Water SupplieSPrivate water supplies (PWS) are drinking water supplies which are not the responsibility of Scottish Water but of their owners and users. The Private Water Supplies (Scotland) Regulations 2006 (‘the 2006 Regulations’) are enforced by local authorities, and the DWQR supervises this enforcement.
The sources of PWS are many and varied, and a large number of householders and businesses depend on them for their drinking water supplies. In 2011 there were 2,318 Type A registered supplies across Scotland. Type A supplies are those which supply 50 or more people or 10m3 water or more, and any PWS which is used in a commercial or public activity. There are a further 17,568 smaller domestic supplies, which are called Type B PWS. Around 3% of Scotland’s population relies on PWS for their drinking water, but a significant number of others, for example visitors and tourists, will also consume water from these supplies.
Environmental Health teams of local authorities annually review risk assessments and sample larger ‘Type A’ PWS. In 2011, 53,505 samples were taken to comply with the requirements of the 2006 Regulations. Water quality of PWS in 2011, particularly microbiological quality, is of concern. Of 3,246 samples taken for E. coli, which is used as an indicator for faecal contamination, 583 (17.96%) contained E. coli and therefore failed the standard. As a comparison, 0.01% of public water supplies failed the standard.
Faecal contamination of drinking water supplies can pose a potential immediate risk to health of anyone drinking the water, including the user, their children and any visitors. Owners and users of PWS are strongly advised to ensure that they follow any advice given by Environmental Health teams on minimising this risk.
iMage 351? not Sure Where thiS iS froM

DRINKING WATER QUALITYIN SCOTLAND 2011
A significant number of microbiological failures occurred at PWS despite it being reported that there is a disinfection process on the supply. It is critical that any water treatment processes which are installed on PWS are carefully operated and maintained in accordance with manufacturers’ instructions to ensure that they are effective on an ongoing basis and that the risk to health is minimised.
20.92% of samples failed the colour standard. Colour is often caused by naturally occurring organic matter from the water supply’s catchment area. It can give an aesthetically unacceptable appearance to the water, but can also interfere with disinfection systems. Ultraviolet light (UV) is often used to disinfect PWS to kill microorganisms which may be a risk to health. Colour can absorb UV and make the disinfection process significantly less effective. Additionally, if chlorine is used as a disinfectant, the presence of the compounds that cause colour can lead to the information of trihalomethanes, which can also pose a risk to health. 21.78% of samples failed the standards for pH, which measures how acidic or alkaline water is. While pH may not pose a risk to health in itself, failures of the standards can cause metals from plumbing materials to dissolve into drinking water. 29.33% of copper samples failed the standard. There were also a number of lead failures in PWS, with 6.35% of samples failing the standard. The current standard of 25µg/l is changing to 10µg/l at the end of 2013, based on World Health Organization guidance. Using this tighter standard, the failure rate would almost double to 11.98%. The most effective method of minimising exposure to lead is to replace lead pipes and storage tanks and ensure that lead free solder is used on drinking water systems.
Non-means tested grants of up to £800 to improve PWS are available from local authorities to all who own or use a PWS. During 2011/12 around £2.1 million of improvement grants were awarded to owners and users of PWS.
ANNUAL REPORT BY THE DRINKING WATER QUALITY REGULATOR 18_19
DRINKING WATER QUALITYIN SCOTLAND 2011
1_ PUBLIC WATER SUPPLY
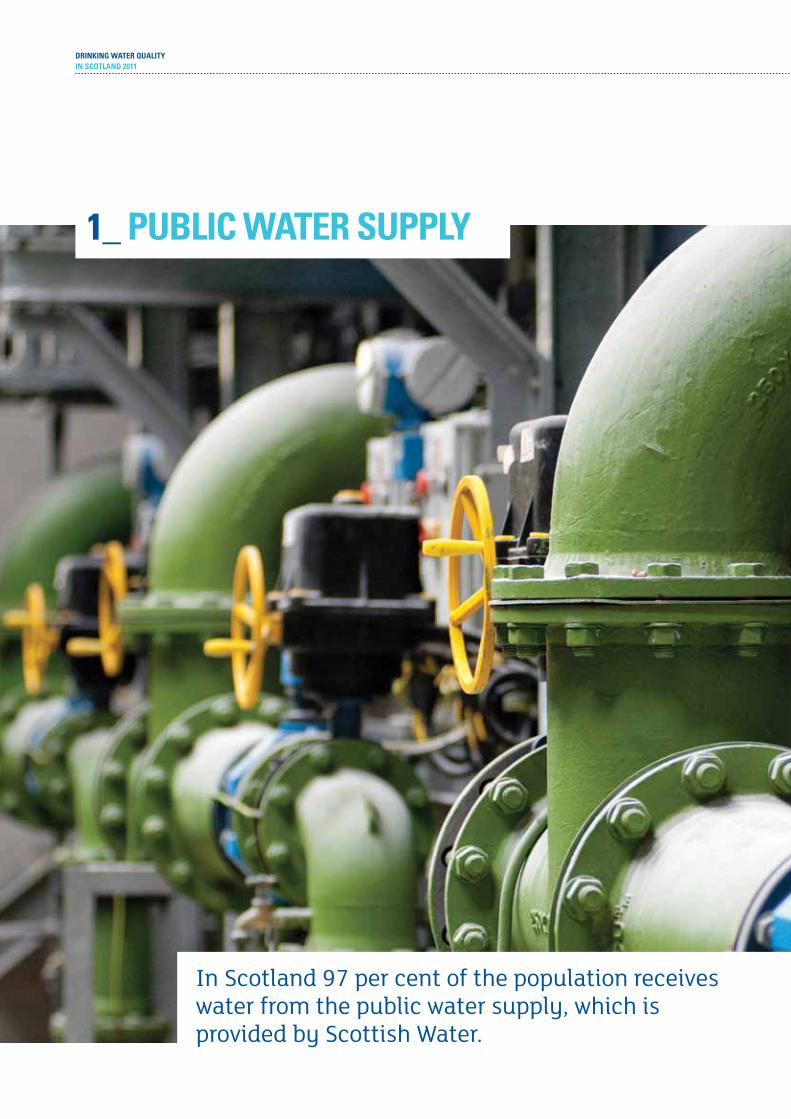
in Scotland 97 per cent of the population receives water from the public water supply, which is provided by Scottish Water.
ANNUAL REPORT BY THE DRINKING WATER QUALITY REGULATOR 20_21
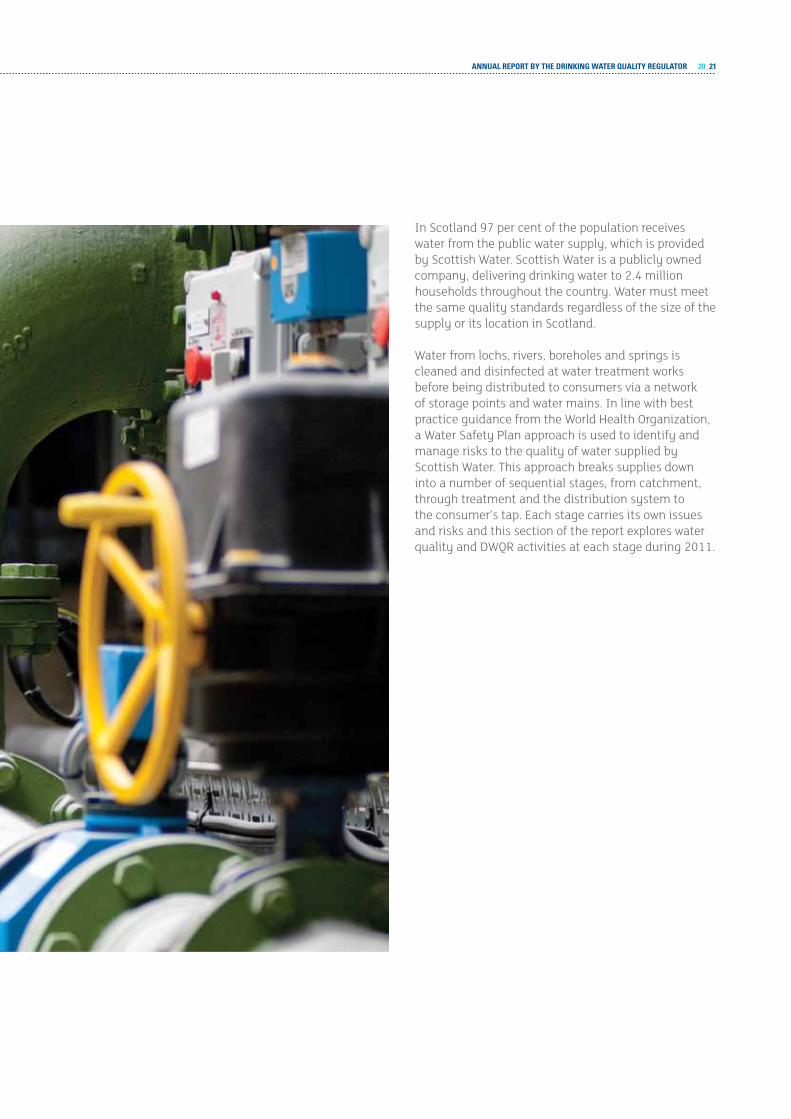
In Scotland 97 per cent of the population receives water from the public water supply, which is provided by Scottish Water. Scottish Water is a publicly owned company, delivering drinking water to 2.4 million households throughout the country. Water must meet the same quality standards regardless of the size of the supply or its location in Scotland.
Water from lochs, rivers, boreholes and springs is cleaned and disinfected at water treatment works before being distributed to consumers via a network of storage points and water mains. In line with best practice guidance from the World Health Organization, a Water Safety Plan approach is used to identify and manage risks to the quality of water supplied by Scottish Water. This approach breaks supplies down into a number of sequential stages, from catchment, through treatment and the distribution system to the consumer’s tap. Each stage carries its own issues and risks and this section of the report explores water quality and DWQR activities at each stage during 2011.

DRINKING WATER QUALITYIN SCOTLAND 2011
1.1_CATCHmENT
Scotland’s water resources used for public water supplies are generally of very high quality.

ANNUAL REPORT BY THE DRINKING WATER QUALITY REGULATOR 22_23
Scotland’s water resources used for public water supplies are generally of very high quality. There are basically three types of sources used for public water supplies. Impounding reservoirs are man made, formed by the construction of a dam across a river valley. These make up roughly a third of Scotland’s water resources. Just over another third comes from taking water directly from rivers and burns. Natural lochs make up 15% of total resources with the remaining 16% coming from boreholes and naturally occurring springs.
The groundwater taken from boreholes and springs is usually more consistent in quality requiring less intensive treatment than water taken from a surface supply. Impounding reservoirs and natural lochs tend to be the next best quality as the process of storing the water in large volumes has the benefit of dampening out the fluctuations in quality of the waters. Water taken from rivers and burns is the poorest quality out of the three types since it is the most affected by changing weather patterns and land management practices.

DRINKING WATER QUALITYIN SCOTLAND 2011
1.1.1_ potential contaMinantS Within catchMentSScottish Water is required to produce Water Safety Plans (WSPs) for all of its water supplies which consider the risks to drinking water quality from source through treatment and distribution to tap. These plans should take into account any risks presented by the quality of the source water and identify ways to mitigate them.
Water quality can vary considerably between sources but can also vary with time, especially during severe weather. The types of sources are depicted in the chart below.
Source Type Description
46% LOCHS AND RESERVOIRS
38% RIVERS AND BURNS
16% BOREHOLES AND SPRINGS
Scottish Water must therefore ensure that its treatment works are sufficiently robust in order to consistently produce clean, safe drinking water regardless of the variability in raw water quality encountered at those works. Scottish Water must also routinely sample the water sources intended for the abstraction of drinking water.
Some substances, such as manganese, are naturally occurring, while others like nitrate and pesticides are present because of land based activity such as agriculture, leisure and forestry. It can be expensive to remove nitrate and pesticides from our drinking water – fortunately these substances are not present in many Scottish supplies because 490 out of the 525 sources in Scotland (about 93%) are derived from upland catchments where agricultural activity is limited.
ANNUAL REPORT BY THE DRINKING WATER QUALITY REGULATOR 24_25
It is worth highlighting the large amounts of naturally occurring iron and manganese in the raw waters and the importance of adequate treatment to bring these substances down to acceptable levels. To give an idea of the scale of the issue, approximately 40% of samples taken from our sources have higher than acceptable levels of iron and the equivalent figure for manganese is about 50%.
The greatest risk to public health is associated with the consumption of drinking water that is contaminated with human and animal faecal material. Many raw water sources contain significant numbers of bacteria, which serves to demonstrate the importance of adequate treatment, especially disinfection, in order to ensure our water is safe to drink.
Microbiological bacteria such as coliforms and E. coli are present in large numbers in the gut of all warm-blooded animals and in the environment. Rain washes bacteria off the land and into drinking water resources. However, well designed, operated and maintained disinfection systems at water treatment works ensure that microbiological contamination is removed to make our water safe to drink.
Cryptosporidium is a microscopic protozoan parasite that can also contaminate water resources. Cryptosporidium oocysts can survive in the environment for long periods. A large number of animals, such as cattle, sheep and deer are known to harbour the parasite. The parasite Cryptosporidium was first discovered to infect humans in 1976, and waterborne transmission was confirmed for the first time in 1984.
The Cryptosporidium (Scottish Water) Directions 2003 require Scottish Water to sample all drinking water sources designated as high risk for Cryptosporidium. Not all sources are sampled for the presence or absence of Cryptosporidium in raw waters as this depends on the volume of water being supplied and the catchment risk score which take into account such things as density and type of animals on the catchment, agricultural practices and the type of water source. In 2011, 82 out of 265 drinking water sources were sampled for Cryptosporidium across Scotland and 22% of these contained Cryptosporidium oocysts.

DRINKING WATER QUALITYIN SCOTLAND 2011
1.1.2_ catchMent ManageMentUltimately, reducing the risk of contamination of drinking water resources is as much about reducing the occurrence in the catchment as it is about improving treatment. Improved liaison between Scottish Water and stakeholders such as the Scottish Environmental Protection Agency (SEPA), livestock farmers and landowners should result in a more joined-up approach to the protection of drinking water sources in line with the European Union’s Water Framework Directive.
In its Final Determination for the strategic review of charges for 2010-2015, the Water Industry Commission for Scotland allowed Scottish Water to invest £3 million per year to identify and operate sustainable land management (SLM) measures in five water catchments. The catchments which were identified in 2010 in agreement with DWQR and SEPA were Cargen and Terregles water treatment works which are just south and west, respectively, of Dumfries, Amlaird water treatment works which is to the north of Kilmarnock, Forehill water treatment works which supplies Peterhead and the surrounding area and Clatto water treatment works which supplies Dundee. A further three potential catchments have been identified by Scottish Water but held in reserve.
These catchments were chosen on the basis that there was potential to influence and change current land management practice to mitigate the impact of potentially polluting contaminants (colour, pesticides, nutrients such as phosphorous and nitrates) at source, thereby avoiding the costs of installing expensive treatment to take these contaminant(s) out at the water treatment works. During 2011 Scottish Water worked with SEPA and land managers such as farmers to better understand what is happening in each of the catchments in order to determine the effectiveness of SLM in reducing the level of purification treatment required in the production of drinking water.
ANNUAL REPORT BY THE DRINKING WATER QUALITY REGULATOR 26_27
Scottish Water is implementing a programme of detailed monitoring in these catchments to better understand the sources and pathways of diffuse pollution. This will also provide them with a starting point to measure the success of any measures introduced to improve the quality of the source water.
Scottish Water has also developed an incentive scheme to help land managers finance measures aimed at reducing the level of diffuse pollution. In addition, Scottish Water is working closely with a number of different agencies including SEPA to deliver SLM measures with the aim of ensuring that drinking water sources are protected at the same time as keeping customers’ charges as low as possible with the added benefit of improving the environment.
1.1.3_ eVentS and incidentS in catchMentS
South Moorehouse A routine sample taken within the distribution zone in Giffnock failed the pesticide standard of 0.1µg/l. A level of 0.192µg/l of MCPA was recorded in the sample and further samples taken in the wider distribution, although not as high, continued to fail the standard for 3 weeks. South Moorehouse Water Treatment Works (WTW) is supplied with raw water equally from two sources, Loch Bennan and Loch Craig and investigations showed the contamination to be arising from the Loch Bennan catchment. The supply from this source was isolated some 4 weeks following the initial detections. The investigation however was unable to identify the origin of the MCPA herbicide.
Although the pesticide standard is set with a very wide margin of safety, the presence and use of pesticides within catchments is an important issue and any deviation from normal levels merits urgent attention. In this instance, Scottish Water failed to react with sufficient urgency to investigate the elevated levels of MCPA in distribution. The elevated levels of MCPA had clearly arisen from the use of the herbicide within the catchment although investigations had been unable to identify any spillage or concentrated use. With two possible catchments to consider, there was undue delay in carrying out the necessary sampling of raw waters to determine the extent and location of the contaminant for what could have been a serious contamination event. This in turn led to a delay in isolating Loch Bennan. The rigour with which the investigation was pursued with catchment stakeholders was considered by DWQR to have been inadequate.
Scottish Water identified nine actions and DWQR made two further recommendations in relation to this incident.
DRINKING WATER QUALITYIN SCOTLAND 2011
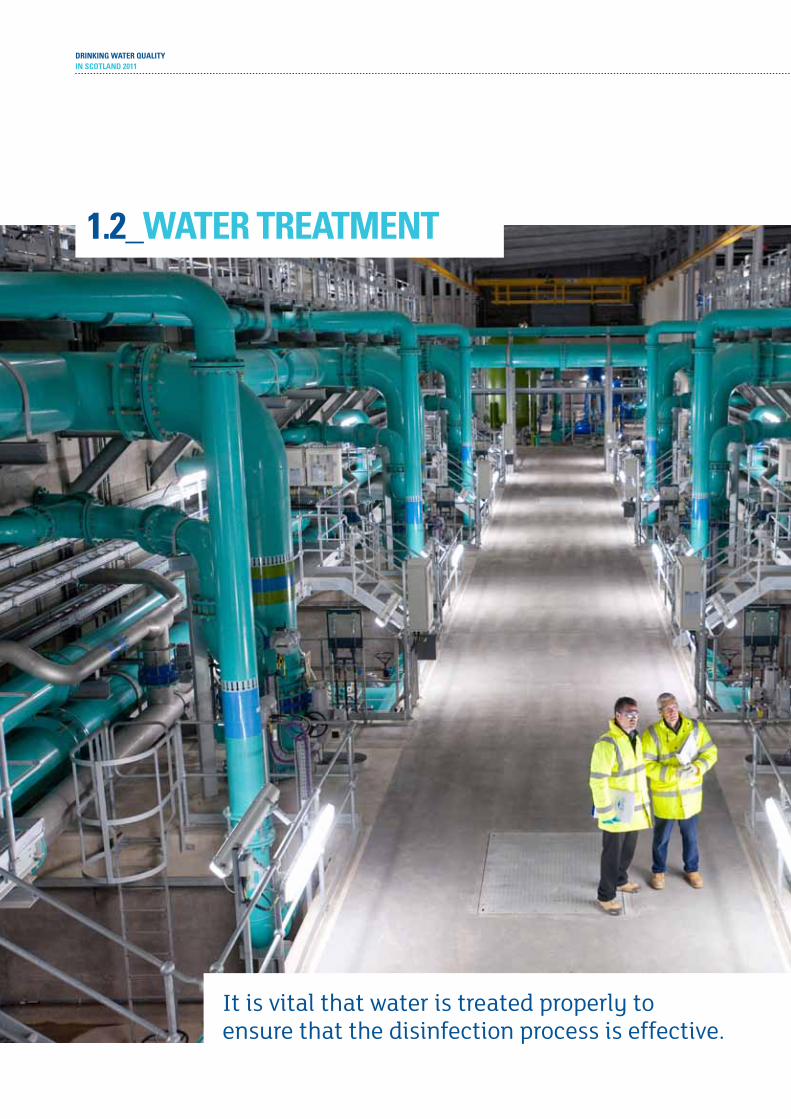
it is vital that water is treated properly to ensure that the disinfection process is effective.
1.2_ WATER TREATmENT

ANNUAL REPORT BY THE DRINKING WATER QUALITY REGULATOR 28_29
Scottish Water has 265 water treatment works (WTW) that treat water to ensure that it is safe to drink and complies with the standards set out in the regulations. Treatment works in Scotland range from large supplies serving whole cities to very small plants that supply small communities consisting of a few properties. Regardless of size, Scottish Water is expected to ensure that its works are capable of treating the range of raw water quality which may be found in source waters.
Scottish Water uses drinking water safety plans to assess risks to raw water quality and the ability of treatment works to deal with these. Where risks are identified that are not adequately addressed by the current treatment process, Scottish Water should decide how these risks are best managed. This may involve promoting the site for capital investment, or addressing the risks via operational means.
It is vital that water is treated properly to ensure that the disinfection process is effective. In order to prepare water for disinfection, particulate material needs to be removed along with naturally occurring organic compounds in the water. These include the compounds that cause water to be coloured and can react with chlorine to form trihalomethanes (THMs) later in the process. Treatment of surface waters commonly consists of a flocculation stage to collect particulate material together, followed by a clarification stage such as sedimentation or flotation. Water is then filtered to remove any remaining particulate and coagulant material to ensure that water is as clean as possible prior to disinfection with chlorine.
The majority of regulatory analysis takes place on samples collected from consumers’ taps, but some important sampling also takes place on water as it leaves each treatment works. The number of samples which need to be collected each year varies depending on the volume of water supplied by the treatment works.
it is vital that water is treated properly to ensure that the disinfection process is effective.

DRINKING WATER QUALITYIN SCOTLAND 2011
1.2.1_ Microbiological Quality at treatMent WorkSDisinfection is used to remove pathogens from the water so that it is safe to drink. Chlorine, or compounds based on chlorine, are an effective means of achieving disinfection and have been used for this purpose in drinking water for over one hundred years. Scottish Water is expected to add sufficient chlorine to kill pathogens and leave a small residual amount to keep the water safe as it travels through distribution pipework to consumers. Although it is normal for consumers to be able to detect a slight taste and smell of chlorine in water from their taps, Scottish Water needs to control chlorine concentrations carefully to ensure that no more is used than necessary.
Coliforms and E. coli are two parameters measured in water leaving treatment works in order to verify that disinfection has been successful. Coliforms are a group of bacteria, of which E. coli is one species, that are found commonly in the environment. Not all coliforms cause illness, but they are used as indicators that disinfection has not been successful or that water may have become contaminated after treatment. While many detections of coliforms are probably due to issues associated with sampling, such as the condition of the tap, all failures must be fully investigated by Scottish Water and reported to DWQR, the local NHS board and local authority. E. coli is detected less frequently than coliforms, however this organism does have the potential to cause illness and it originates from faecal material, indicating the possibility of serious contamination that must be investigated immediately and the risk to consumers assessed.
When investigating analytical failures at treatment works, Scottish Water should be considering a number of factors, such as changes in the quality of the incoming raw water, issues or unexpected changes in the treatment process, the circumstances of sampling, including the condition of the sample line and sample tap, and evidence from samples taken downstream in the distribution system. Consideration should be given to taking additional samples, including between stages of the treatment process to establish whether there is a genuine problem and where this might be. Data for on-line monitoring can also yield very useful information on quality around the time of the failure.
Colony counts are also monitored at water treatment works, although there is no numerical standard for these. They are a useful indicator of microbiological activity, and again provide a measure of the effectiveness of the disinfection process, especially when trended over time.
ANNUAL REPORT BY THE DRINKING WATER QUALITY REGULATOR 30_31
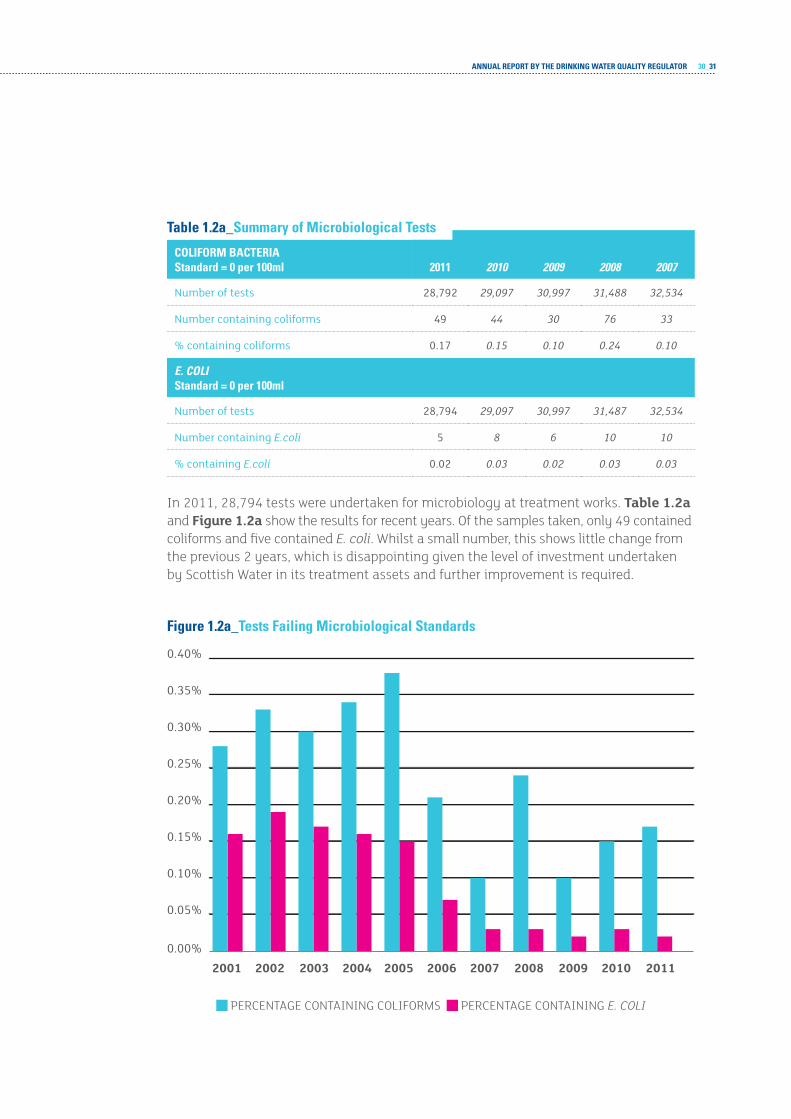
2011 2010 2009 2008 2007COLIFORm BACTERIAStandard = 0 per 100ml
number of tests 28,792 29,097 30,997 31,488 32,534
number containing coliforms 49 44 30 76 33
% containing coliforms 0.17 0.15 0.10 0.24 0.10
E. coliStandard = 0 per 100ml
number of tests 28,794 29,097 30,997 31,487 32,534
number containing E.coli 5 8 6 10 10
% containing E.coli 0.02 0.03 0.02 0.03 0.03
In 2011, 28,794 tests were undertaken for microbiology at treatment works. table 1.2a and figure 1.2a show the results for recent years. Of the samples taken, only 49 contained coliforms and five contained E. coli. Whilst a small number, this shows little change from the previous 2 years, which is disappointing given the level of investment undertaken by Scottish Water in its treatment assets and further improvement is required. Figure 1.2a_Tests Failing microbiological Standards
0.00%
0.05%
0.10%
0.15%
0.20%
0.25%
0.30%
0.35%
0.40%
20112010200920082007200620052004200320022001
PERCENTAGE CONTAINING COLIFORMS PERCENTAGE CONTAINING E. COLI
Table 1.2a_Summary of microbiological Tests

DRINKING WATER QUALITYIN SCOTLAND 2011
Six coliform detections occurred at Alnwickhill WTW, which served part of Edinburgh in 2011 but has since been replaced by the new treatment works at Glencorse. Five other treatment works each recorded two samples containing coliforms. The five E. coli detections were at different works; Fairmilehead, Amlaird, North Lochs, Kirbister and North Ronaldsay. A number of microbiological failures are reported as having no obvious cause by Scottish Water. The DWQR is keen to see this number reduced by more rigorous investigation of failures, especially important where a works is recording a number of failures.
1.2.2_ cheMical Quality at treatMent WorkSWater is tested for two chemical parameters in samples taken from treatment works. These are summarised in tables 1.2b and 1.2c. Nitrite is a compound of nitrogen that can occur in supplies where ammonia is added to chlorine in a process called chloramination. This process needs to be tightly managed, and the presence of nitrite in significant quantities can indicate that it is not controlled as it should be. Only one failure occurred during 2012. This was at the small treatment works at Kirkmichael in Perthshire, where issues with the addition of ammonia have now been resolved.
Table 1.2b_Summary of Nitrite Tests
2011 2010 2009 2008 2007NITRITEIndicator Standard = 0.1mg/l at WTW
number of tests 2,910 2,859 2,993 3,028 3,182
number of tests exceeding standard 1 3 4 2 3
% of tests exceeding standard 0.03 0.1 0.13 0.07 0.09
number of treatment works not meeting regulatory requirements 1 2 3 2 2
% of treatment works not meeting regulatory requirements 0.38 0.74 1.06 0.68 0.65
ANNUAL REPORT BY THE DRINKING WATER QUALITY REGULATOR 32_33
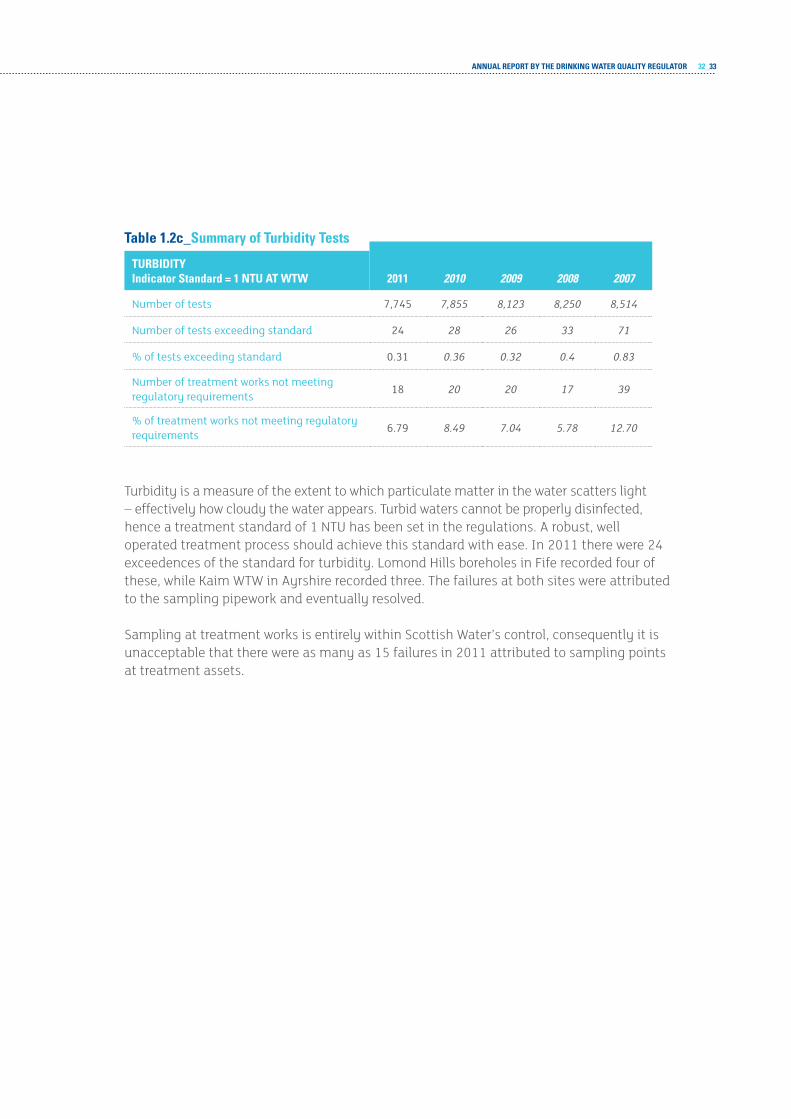
Table 1.2c_Summary of Turbidity Tests
2011 2010 2009 2008 2007TURBIDITYIndicator Standard = 1 NTU AT WTW
number of tests 7,745 7,855 8,123 8,250 8,514
number of tests exceeding standard 24 28 26 33 71
% of tests exceeding standard 0.31 0.36 0.32 0.4 0.83
number of treatment works not meeting regulatory requirements 18 20 20 17 39
% of treatment works not meeting regulatory requirements 6.79 8.49 7.04 5.78 12.70
Turbidity is a measure of the extent to which particulate matter in the water scatters light – effectively how cloudy the water appears. Turbid waters cannot be properly disinfected, hence a treatment standard of 1 NTU has been set in the regulations. A robust, well operated treatment process should achieve this standard with ease. In 2011 there were 24 exceedences of the standard for turbidity. Lomond Hills boreholes in Fife recorded four of these, while Kaim WTW in Ayrshire recorded three. The failures at both sites were attributed to the sampling pipework and eventually resolved.
Sampling at treatment works is entirely within Scottish Water’s control, consequently it is unacceptable that there were as many as 15 failures in 2011 attributed to sampling points at treatment assets.
DRINKING WATER QUALITYIN SCOTLAND 2011
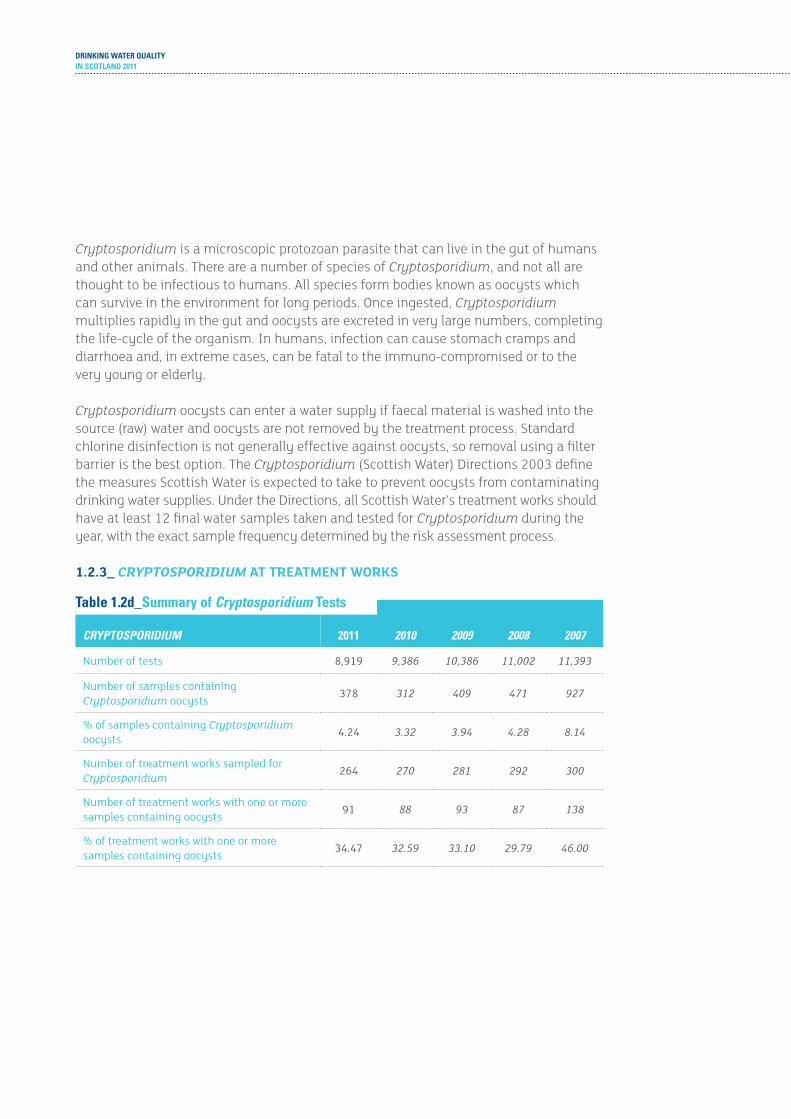
Cryptosporidium is a microscopic protozoan parasite that can live in the gut of humans and other animals. There are a number of species of Cryptosporidium, and not all are thought to be infectious to humans. All species form bodies known as oocysts which can survive in the environment for long periods. Once ingested, Cryptosporidium multiplies rapidly in the gut and oocysts are excreted in very large numbers, completing the life-cycle of the organism. In humans, infection can cause stomach cramps and diarrhoea and, in extreme cases, can be fatal to the immuno-compromised or to the very young or elderly.
Cryptosporidium oocysts can enter a water supply if faecal material is washed into the source (raw) water and oocysts are not removed by the treatment process. Standard chlorine disinfection is not generally effective against oocysts, so removal using a filter barrier is the best option. The Cryptosporidium (Scottish Water) Directions 2003 define the measures Scottish Water is expected to take to prevent oocysts from contaminating drinking water supplies. Under the Directions, all Scottish Water’s treatment works should have at least 12 final water samples taken and tested for Cryptosporidium during the year, with the exact sample frequency determined by the risk assessment process.
1.2.3_ CRYPTOSPORIDIUM at treatMent WorkS
2011 2010 2009 2008 2007cRYPToSPoRiDiUM
number of tests 8,919 9,386 10,386 11,002 11,393
number of samples containing Cryptosporidium oocysts 378 312 409 471 927
% of samples containing Cryptosporidium oocysts 4.24 3.32 3.94 4.28 8.14
number of treatment works sampled for Cryptosporidium 264 270 281 292 300
number of treatment works with one or more samples containing oocysts 91 88 93 87 138
% of treatment works with one or more samples containing oocysts 34.47 32.59 33.10 29.79 46.00
Table 1.2d_Summary of cryptosporidium Tests
ANNUAL REPORT BY THE DRINKING WATER QUALITY REGULATOR 34_35
table 1.2d shows the results of tests for Cryptosporidium in samples taken at water treatment works in the context of previous years. Out of 8,919 samples from treatment works, 378 contained oocysts. The number of treatment works from which at least one positive sample was taken was 91 in 2011. It can be seen that there has been little in the way of improvement this year, with the percentage of samples that contained oocysts the highest since 2008 and the percentage of treatment works recording a Cryptosporidium detection was the highest since 2007.
A number of small treatment works recorded oocysts in a very large proportion of samples, due to Cryptosporidium being common in the catchment and the treatment works presenting little in the way of a barrier to oocysts. Samples from Shieldaig in Torridon and Craignure on Mull both recorded oocysts in every sample that was taken. Elphin, near Ullapool, was little better with only one clear sample. All three treatment works are scheduled for urgent upgrading or replacement and there is a specific programme in the current investment period to upgrade smaller works to deal with Cryptosporidium.
Also of concern are the number of treatment works with membrane treatment that are recording Cryptosporidium detections. Ultrafiltration and nanofiltration membrane treatment should easily be capable of removing oocysts, and these detections suggest that the integrity of the membrane has been breached. Scottish Water has responded to this issue by introducing a co-ordinated programme of membrane maintenance and replacement. This programme is an essential and much needed aspect of membrane filtration efficiency.
Out of 8,919 samples from treatment works, 378 contained
Cryptosporidium oocysts.
DRINKING WATER QUALITYIN SCOTLAND 2011
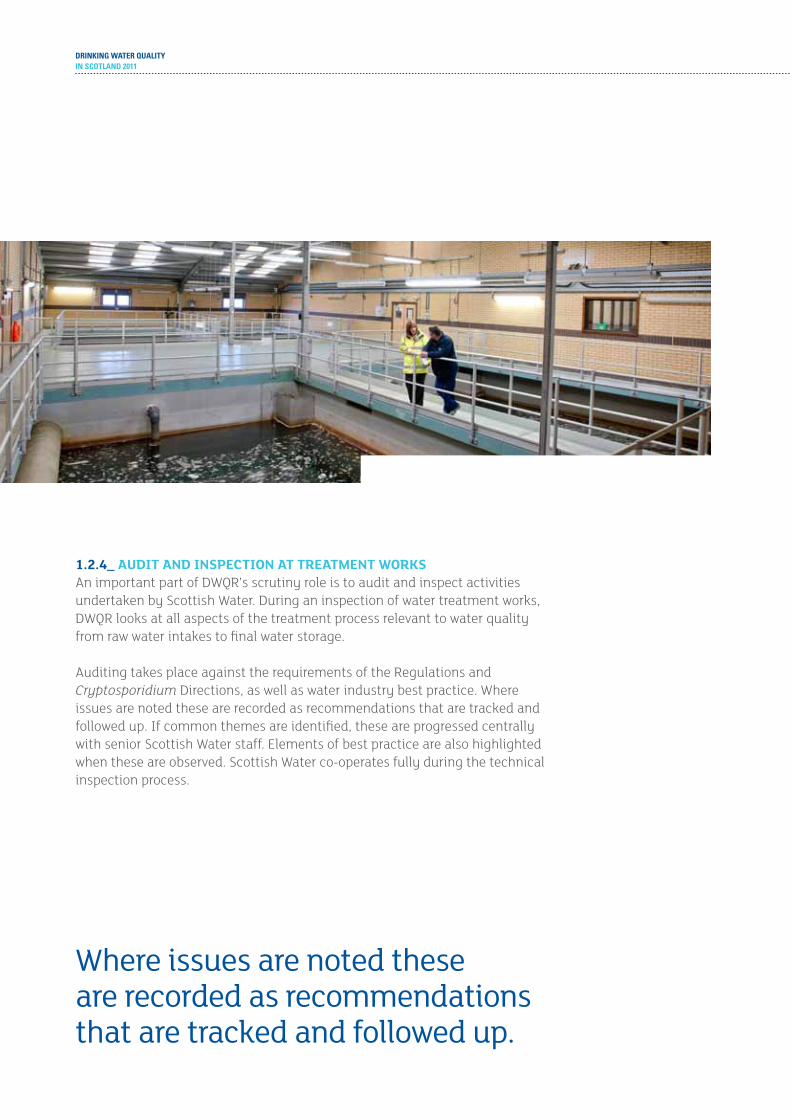
1.2.4_ audit and inSpection at treatMent WorkSAn important part of DWQR’s scrutiny role is to audit and inspect activities undertaken by Scottish Water. During an inspection of water treatment works, DWQR looks at all aspects of the treatment process relevant to water quality from raw water intakes to final water storage.
Auditing takes place against the requirements of the Regulations and Cryptosporidium Directions, as well as water industry best practice. Where issues are noted these are recorded as recommendations that are tracked and followed up. If common themes are identified, these are progressed centrally with senior Scottish Water staff. Elements of best practice are also highlighted when these are observed. Scottish Water co-operates fully during the technical inspection process.
Where issues are noted these are recorded as recommendations that are tracked and followed up.
ANNUAL REPORT BY THE DRINKING WATER QUALITY REGULATOR 36_37
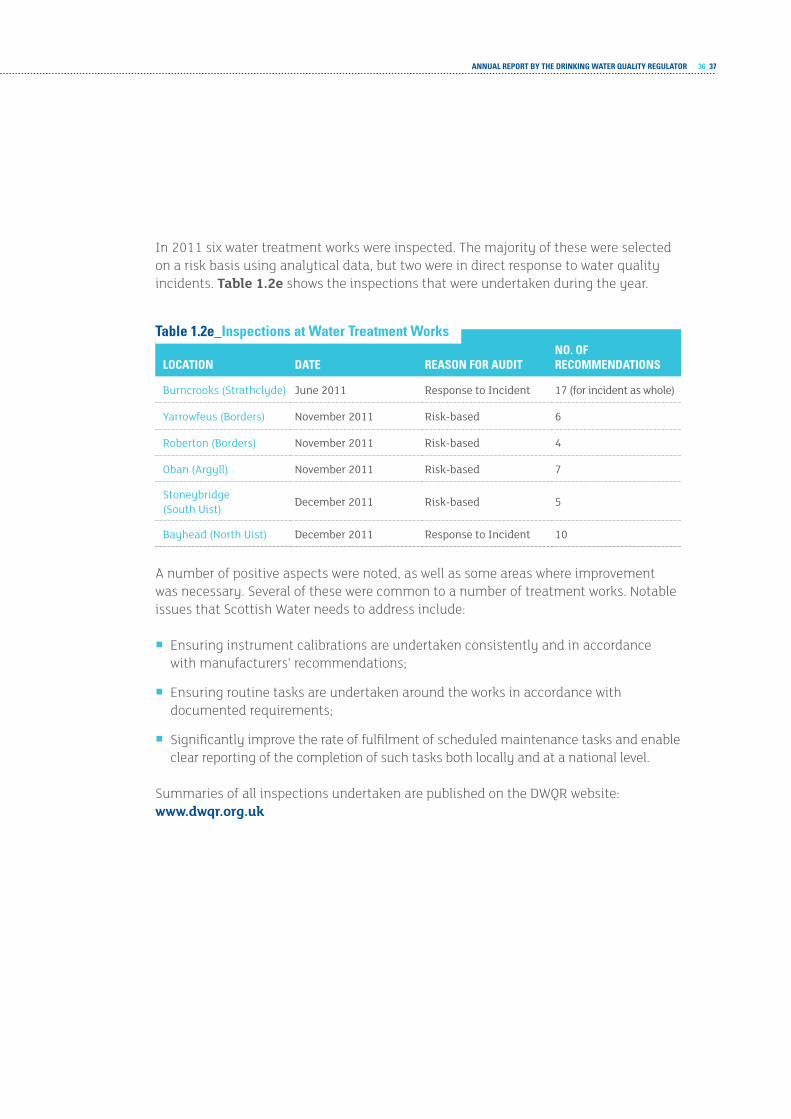
In 2011 six water treatment works were inspected. The majority of these were selected on a risk basis using analytical data, but two were in direct response to water quality incidents. table 1.2e shows the inspections that were undertaken during the year.
DATE REASON FOR AUDITNO. OF RECOmmENDATIONSLOCATION
Burncrooks (Strathclyde) June 2011 response to incident 17 (for incident as whole)
Yarrowfeus (Borders) november 2011 risk-based 6
roberton (Borders) november 2011 risk-based 4
Oban (argyll) november 2011 risk-based 7
Stoneybridge(South Uist) December 2011 risk-based 5
Bayhead (north Uist) December 2011 response to incident 10
A number of positive aspects were noted, as well as some areas where improvement was necessary. Several of these were common to a number of treatment works. Notable issues that Scottish Water needs to address include:
¡¡ Ensuring instrument calibrations are undertaken consistently and in accordance with manufacturers’ recommendations;
¡¡ Ensuring routine tasks are undertaken around the works in accordance with documented requirements;
¡¡ Significantly improve the rate of fulfilment of scheduled maintenance tasks and enable clear reporting of the completion of such tasks both locally and at a national level.
Summaries of all inspections undertaken are published on the DWQR website: www.dwqr.org.uk
Table 1.2e_Inspections at Water Treatment Works

DRINKING WATER QUALITYIN SCOTLAND 2011
1.2.5_ eVentS and incidentS at treatMent WorkSScottish Water is required to tell the DWQR about all events that could affect water quality or cause concern to consumers. This includes all regulatory sample failures that are significant or unexpected and any failure of a treatment process. Each event is reviewed and the most serious classified as incidents. Where further information is required a full report will be requested from Scottish Water. Incidents are fully investigated and a written assessment produced, making recommendations where appropriate. Incident assessments are published on the DWQR website. For the most serious incidents, enforcement action or even prosecution may be considered.
In 2011, 892 events were reported to the DWQR, of which 426 related to water treatment works. Turriff WTW in Aberdeenshire recorded the largest number of events in 2011, with 15, although four of these related to raw water issues outside Scottish Water’s control. The majority of events reported at Turriff related to Cryptosporidium detections in the final water, and this prompted an inspection. Glendye WTW in Aberdeenshire, now removed from supply, and Amlaird WTW in Ayrshire both generated 10 events. At Amlaird, half of the events concerned elevated iron concentrations in the final water due to difficulties the plant is experiencing in treating the incoming raw water, and this prompted a site inspection by the DWQR in early 2012.
each event is reviewed and the most serious classified as incidents.
ANNUAL REPORT BY THE DRINKING WATER QUALITY REGULATOR 38_39
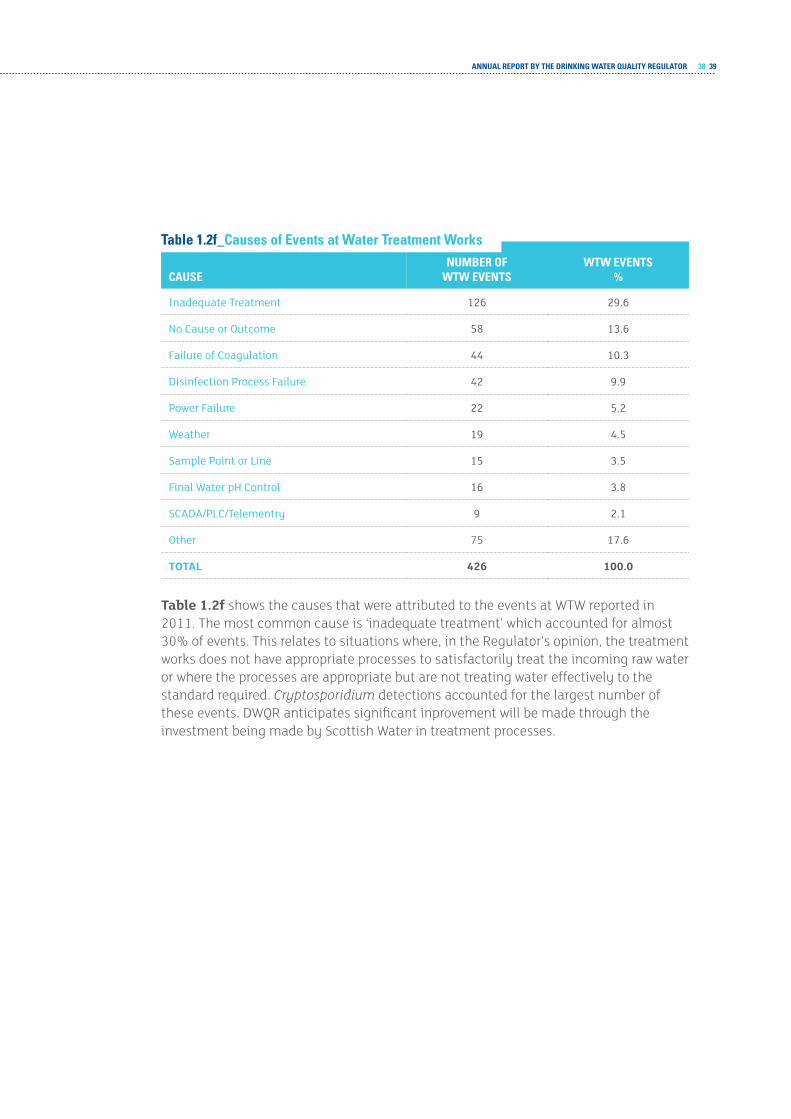
NUmBER OF WTW EvENTS
WTW EvENTS%CAUSE
inadequate treatment 126 29.6
no Cause or Outcome 58 13.6
Failure of Coagulation 44 10.3
Disinfection Process Failure 42 9.9
Power Failure 22 5.2
Weather 19 4.5
Sample Point or Line 15 3.5
Final Water pH Control 16 3.8
SCaDa/PLC/telementry 9 2.1
Other 75 17.6
total 426 100.0
table 1.2f shows the causes that were attributed to the events at WTW reported in 2011. The most common cause is ‘inadequate treatment’ which accounted for almost 30% of events. This relates to situations where, in the Regulator’s opinion, the treatment works does not have appropriate processes to satisfactorily treat the incoming raw water or where the processes are appropriate but are not treating water effectively to the standard required. Cryptosporidium detections accounted for the largest number of these events. DWQR anticipates significant inprovement will be made through the investment being made by Scottish Water in treatment processes.
Table 1.2f_Causes of Events at Water Treatment Works

DRINKING WATER QUALITYIN SCOTLAND 2011
annex a lists incidents declared in 2011. 49 occurred at treatment works and this accounts for 58% of all incidents. figure 1.2b shows the nature of incidents at treatment works broken down by Scottish Water operational area. It can be seen that the majority of incidents were declared in the North and East areas, partly reflecting the larger number of treatment works in these areas. Cryptosporidium, THM and bacteriological issues were particularly prevalent in these areas – investment is ongoing to upgrade treatment works to provide an effective barrier against Cryptosporidium and minimise formation of THMs.
Iron is a major cause of incidents in the West area, partly reflecting corrosion of old cast-iron water mains and partly due to problems at the Amlaird WTW in Ayrshire. Although not a health issue, iron can cause discolouration of water supplies, greatly inconveniencing consumers.
Figure 1.2b _Breakdown of Nature of Incident at WTW by Scottish Water Area
0
2
4
6
8
10
12
14
16
18
20
WestEastSouthNorth
0
2
4
6
8
10
12
14
16
18
20
WestEastSouthNorth
NO SPECIFIC PARAMETER
OTHER CHEMICAL PARAMETER
THM
IRON & MANGANESE
CryptOspOrIdIum
ALUMINIUM
BACTERIOLOGICAL / LOW CHLORINE
figure 1.2c shows a summary of the causes of incidents at treatment works in 2011. It can be seen that the Inadequate Treatment and Disinfection Failure categories make up a far higher proportion of the total than these categories did for events, reflecting that issues caused by these factors tend to be more serious in nature. As the capital investment during the period 2010 – 2015 begins to bear fruit, the number of incidents caused by prolonged issues with THMs and Cryptosporidium should start to reduce significantly.

ANNUAL REPORT BY THE DRINKING WATER QUALITY REGULATOR 40_41
Figure 1.2c_Cause of Incident at WTW
44% INADEQUATE TREATMENT
24% DISINFECTION PROCESS
12% FAILURE OF COAGULATION
2% FINAL pH CONTROL
4% POWER FAILURE
4% SAMPLING
4% SCADA/PLC/TELEMETRY
4% MAINS CONDITION
2% WEATHER
The high proportion of incidents involving disinfection failure is of concern due to the obvious implications for public health. Most treatment assets in Scotland now have modern disinfection systems – failure of these tends to be due to a deficiency in the back-up processes designed to ensure disinfection continues and that staff are alerted should one part of the disinfection system fail.
The third largest cause of incidents was failure of the coagulation process, accounting for 13% of the total number. Coagulation is vital in ensuring that particulate material is removed from the water to prepare it for disinfection. Additionally, a failure of the process can often result in high concentrations of aluminium and, less commonly in Scotland, iron, in water leaving the treatment works. The coagulation process requires the pH of the water to be within a specific range, and incidents are often associated with a failure of this aspect. With use of modern technology and a robust approach to maintenance it should be possible for Scottish Water to greatly reduce the numbers of such failures.
The following incidents are of particular note and required significant investigation:

DRINKING WATER QUALITYIN SCOTLAND 2011
burncrooks incident, March 2011This incident was the result of a series of events which occurred on the evening of 17 March 2011 at Burncrooks WTW which serves the North-western side of Glasgow. Control of the treatment process was lost for approximately 4 hours before being regained, but staff failed to realise the full implications of the interruption on the treatment process in terms of an envelope of extremely low pH water passing through the works. This low pH water had the effect of dissolving any aluminium floc or sludge it came into contact with on its route through the treatment process and treated water storage tanks. As a result, water leaving the treatment works exceeded the 200ug/l regulatory standard for aluminium for a period of 24 hours, with concentrations exceeding 4000ug/l for approximately 6 hours.
Initial actions taken by Scottish Water staff did not improve the situation and inadequacies in on-site monitoring of water quality made it difficult for staff to regain control of the process. Once the process began to recover, some 12 hours after the initial problem occurred, aluminium concentrations began to fall slowly but a considerable quantity of water containing elevated concentrations of aluminium had entered the distribution system and continued to do so for a number of hours.
In response to the high aluminium concentrations leaving the works, a ‘Do Not Drink/ Do Not Use for Cooking’ notice was agreed with the Consultant in Public Health Medicine (CPHM) at NHS Greater Glasgow on 18 March. On the basis of on-site tests undertaken overnight, the CPHM agreed that the restrictions could be lifted early on 19 March.
Scottish Water identified 22 actions that it intends to undertake in order to prevent a recurrence of this incident. In addition, DWQR visited the site and made 17 further recommendations to Scottish Water. The Regulator considered preparing a case for prosecution against Scottish Water for supplying water unfit for human consumption, however, based on limited medical evidence of adverse health effects and the short duration of the incident, it was decided that this was not appropriate. Scottish Water is expected to complete all actions thoroughly to ensure that there can be no repeat of this incident.
ANNUAL REPORT BY THE DRINKING WATER QUALITY REGULATOR 42_43
bayhead incident, autumn 2011Bayhead is a small treatment works serving the western side of North Uist. The treatment process consists of coagulation followed by filtration by two Dynasand fluidised bed filters and disinfection.
Throughout Autumn 2011, Bayhead WTW encountered a series of problems, resulting in a prolonged exceedence of the regulatory standard for aluminium in water supplied to consumers. These culminated in a ‘Do Not Drink, Do Not Use for Cooking’ notice being placed on the supply at the request of the Health Board. Scottish Water implemented a large number of actions at the site in order to improve performance. These had some effect, however the treatment process continued to show some instability into early 2012. The site was audited by DWQR in December 2011. In Spring 2012 a third Dynasand unit was installed to increase the capacity of the plant.
blairnamarrow incident, october 2009This incident occurred in October 2009, when sodium carbonate was overdosed into the water supply serving the village of Tomintoul in Moray over a 3-day period. Local people bathing in the water reported skin irritation due its high alkalinity and a ‘Do Not Use’ notice was issued, resulting in the temporary closure of a number of local businesses.
The Regulator investigated the incident and prepared the case for prosecution. On 20 January 2012 the case was heard at Elgin Sheriff Court. Scottish Water plead guilty to the offence of supplying water unfit for human consumption under Section 76C of the Water (Scotland) Act 1980 and was fined £1,000 for the offence. The conviction marks the first against Scottish Water for a drinking water offence since the company was created in 2002.

DRINKING WATER QUALITYIN SCOTLAND 2011
1.2.6_ inVeStMent at treatMent WorkSScottish Water has been directed by Scottish Ministers to undertake a number of different projects to improve and protect drinking water quality across Scotland during the period of 1 April 2010 to 31 March 2015. These projects include the establishment of a Water Safety Plan, as promoted by the World Health Organization, for all public water supplies in Scotland. These plans should consider the risks to drinking water quality from source through treatment and distribution to customers’ taps. Scottish Water was directed to complete half of these plans during the previous investment period (2006-2010) with the remainder to be completed in the current period (2010-2015). During 2011 Scottish Water managed to complete this task early allowing the water company now to concentrate on analysing all of the risks identified in these plans and to make a start on deciding whether or not improvement programmes are required to mitigate these risks in the next investment period beyond 2015.
In addition, disinfection control was improved at four water treatment works during the course of 2011; Ardfern, Diabeg, Earlish and Kinlochleven. This should improve the consistency of chlorine dosing, making the taste and odour of the water being supplied from these works more acceptable to consumers.
There are a number of water treatment works which have more extensive works planned for investment during the period leading up to 2015, but these have yet to be completed.

ANNUAL REPORT BY THE DRINKING WATER QUALITY REGULATOR 44_45
DRINKING WATER QUALITYIN SCOTLAND 2011
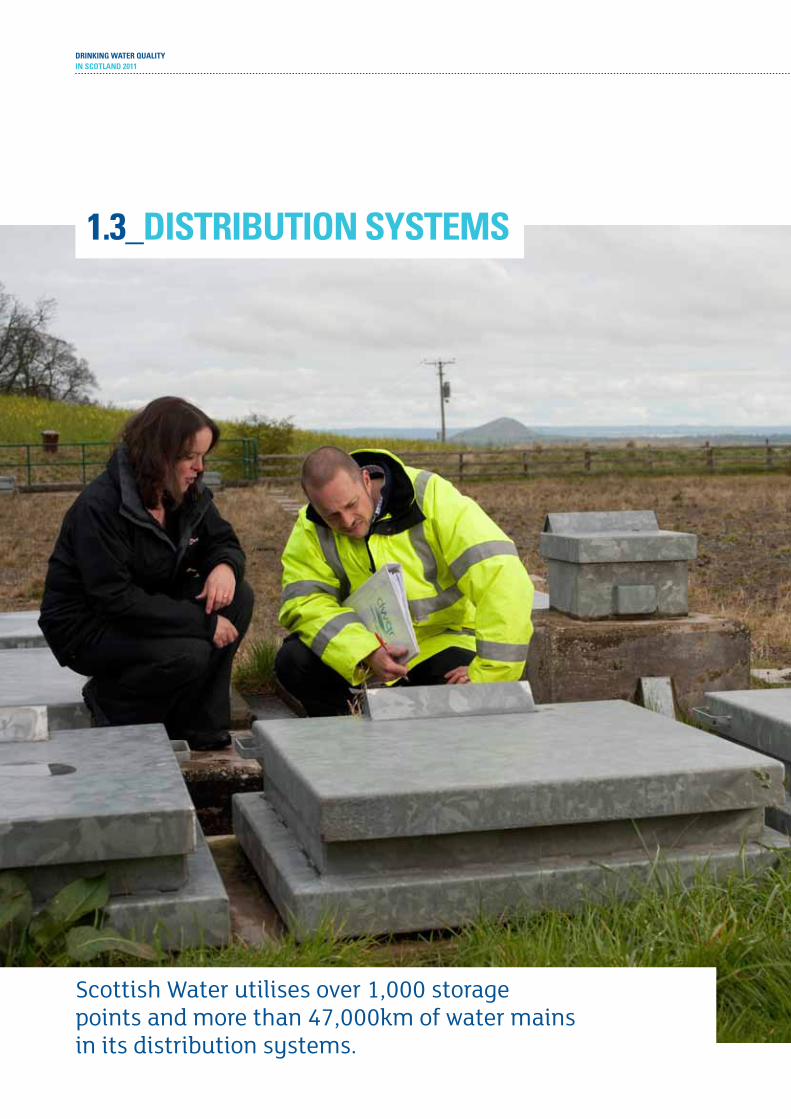
Scottish Water utilises over 1,000 storage points and more than 47,000km of water mains in its distribution systems.
1.3_DISTRIBUTION SYSTEmS
ANNUAL REPORT BY THE DRINKING WATER QUALITY REGULATOR 46_47
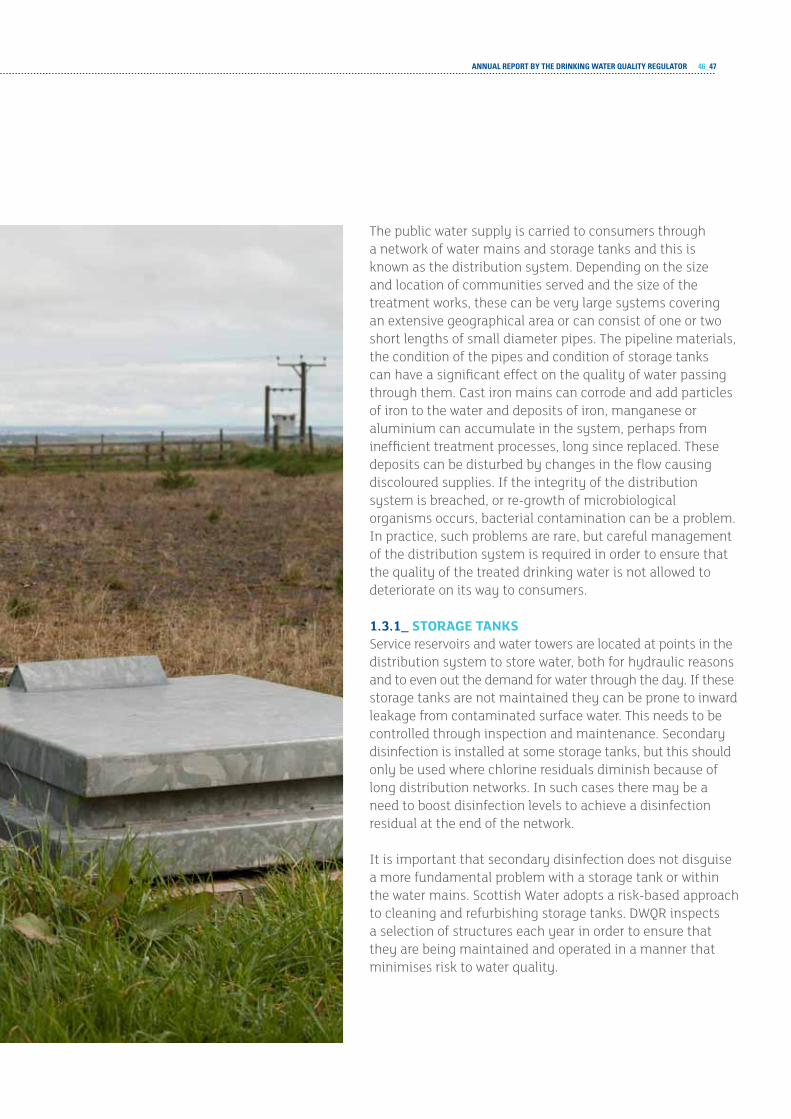
The public water supply is carried to consumers through a network of water mains and storage tanks and this is known as the distribution system. Depending on the size and location of communities served and the size of the treatment works, these can be very large systems covering an extensive geographical area or can consist of one or two short lengths of small diameter pipes. The pipeline materials, the condition of the pipes and condition of storage tanks can have a significant effect on the quality of water passing through them. Cast iron mains can corrode and add particles of iron to the water and deposits of iron, manganese or aluminium can accumulate in the system, perhaps from inefficient treatment processes, long since replaced. These deposits can be disturbed by changes in the flow causing discoloured supplies. If the integrity of the distribution system is breached, or re-growth of microbiological organisms occurs, bacterial contamination can be a problem. In practice, such problems are rare, but careful management of the distribution system is required in order to ensure that the quality of the treated drinking water is not allowed to deteriorate on its way to consumers.
1.3.1_ Storage tankSService reservoirs and water towers are located at points in the distribution system to store water, both for hydraulic reasons and to even out the demand for water through the day. If these storage tanks are not maintained they can be prone to inward leakage from contaminated surface water. This needs to be controlled through inspection and maintenance. Secondary disinfection is installed at some storage tanks, but this should only be used where chlorine residuals diminish because of long distribution networks. In such cases there may be a need to boost disinfection levels to achieve a disinfection residual at the end of the network.
It is important that secondary disinfection does not disguise a more fundamental problem with a storage tank or within the water mains. Scottish Water adopts a risk-based approach to cleaning and refurbishing storage tanks. DWQR inspects a selection of structures each year in order to ensure that they are being maintained and operated in a manner that minimises risk to water quality.
DRINKING WATER QUALITYIN SCOTLAND 2011
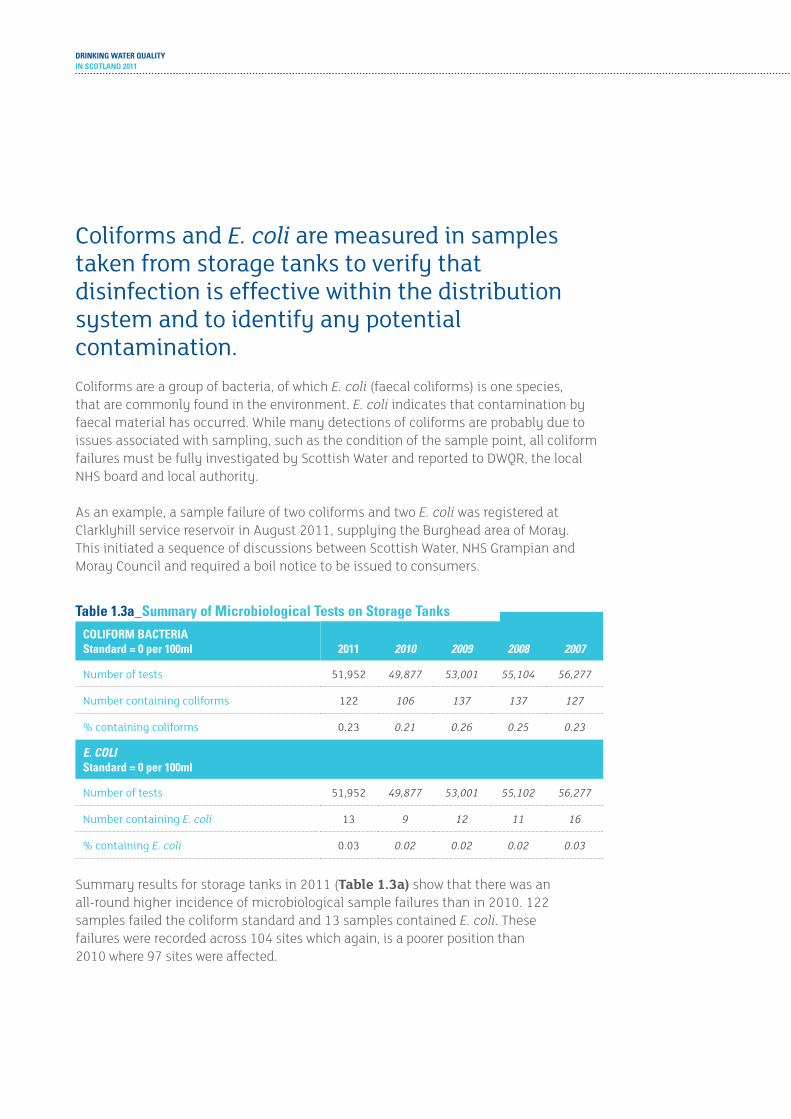
Coliforms and E. coli are measured in samples taken from storage tanks to verify that disinfection is effective within the distribution system and to identify any potential contamination.Coliforms are a group of bacteria, of which E. coli (faecal coliforms) is one species, that are commonly found in the environment. E. coli indicates that contamination by faecal material has occurred. While many detections of coliforms are probably due to issues associated with sampling, such as the condition of the sample point, all coliform failures must be fully investigated by Scottish Water and reported to DWQR, the local NHS board and local authority.
As an example, a sample failure of two coliforms and two E. coli was registered at Clarklyhill service reservoir in August 2011, supplying the Burghead area of Moray. This initiated a sequence of discussions between Scottish Water, NHS Grampian and Moray Council and required a boil notice to be issued to consumers.
2011 2010 2009 2008 2007COLIFORm BACTERIAStandard = 0 per 100ml
number of tests 51,952 49,877 53,001 55,104 56,277
number containing coliforms 122 106 137 137 127
% containing coliforms 0.23 0.21 0.26 0.25 0.23
E. coliStandard = 0 per 100ml
number of tests 51,952 49,877 53,001 55,102 56,277
number containing E. coli 13 9 12 11 16
% containing E. coli 0.03 0.02 0.02 0.02 0.03
Summary results for storage tanks in 2011 (table 1.3a) show that there was an all-round higher incidence of microbiological sample failures than in 2010. 122 samples failed the coliform standard and 13 samples contained E. coli. These failures were recorded across 104 sites which again, is a poorer position than 2010 where 97 sites were affected.
Table 1.3a_Summary of microbiological Tests on Storage Tanks
ANNUAL REPORT BY THE DRINKING WATER QUALITY REGULATOR 48_49
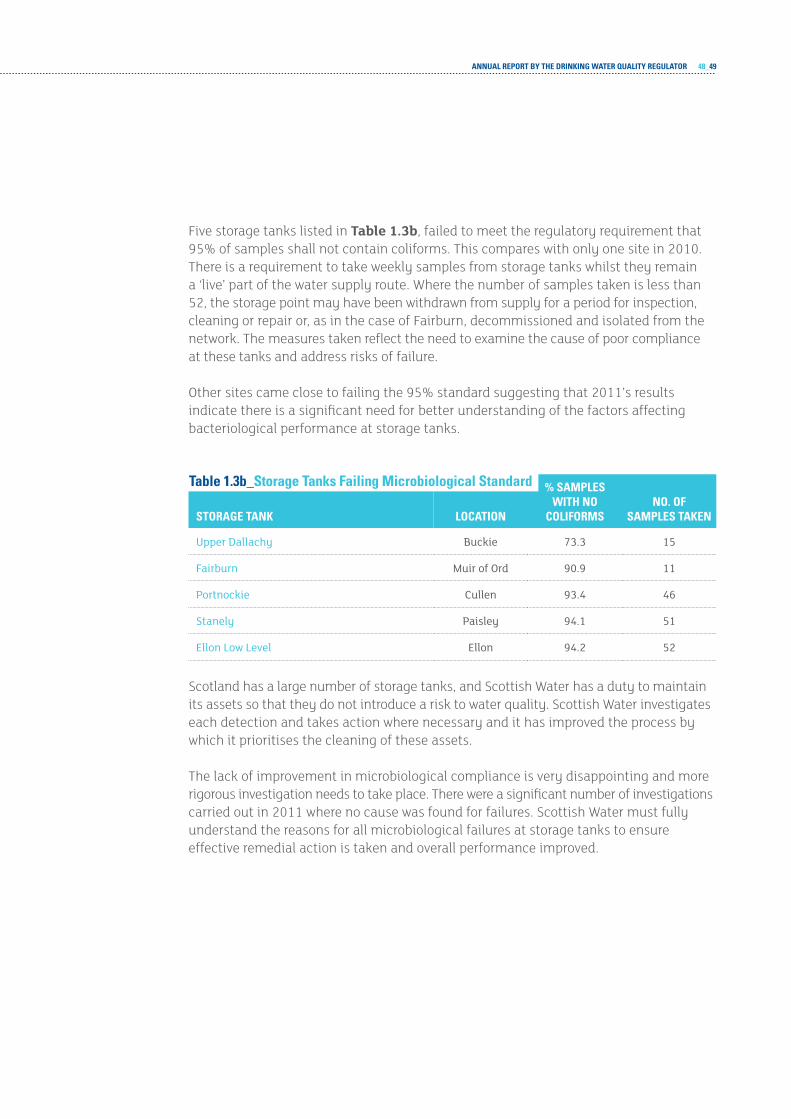
Five storage tanks listed in table 1.3b, failed to meet the regulatory requirement that 95% of samples shall not contain coliforms. This compares with only one site in 2010. There is a requirement to take weekly samples from storage tanks whilst they remain a ‘live’ part of the water supply route. Where the number of samples taken is less than 52, the storage point may have been withdrawn from supply for a period for inspection, cleaning or repair or, as in the case of Fairburn, decommissioned and isolated from the network. The measures taken reflect the need to examine the cause of poor compliance at these tanks and address risks of failure.
Other sites came close to failing the 95% standard suggesting that 2011’s results indicate there is a significant need for better understanding of the factors affecting bacteriological performance at storage tanks.
LOCATION
% SAmPLES WITH NO
COLIFORmS NO. OF
SAmPLES TAKEN STORAGE TANK
Upper Dallachy Buckie 73.3 15
Fairburn Muir of Ord 90.9 11
Portnockie Cullen 93.4 46
Stanely Paisley 94.1 51
ellon Low Level ellon 94.2 52
Scotland has a large number of storage tanks, and Scottish Water has a duty to maintain its assets so that they do not introduce a risk to water quality. Scottish Water investigates each detection and takes action where necessary and it has improved the process by which it prioritises the cleaning of these assets.
The lack of improvement in microbiological compliance is very disappointing and more rigorous investigation needs to take place. There were a significant number of investigations carried out in 2011 where no cause was found for failures. Scottish Water must fully understand the reasons for all microbiological failures at storage tanks to ensure effective remedial action is taken and overall performance improved.
Table 1.3b_Storage Tanks Failing microbiological Standard
DRINKING WATER QUALITYIN SCOTLAND 2011
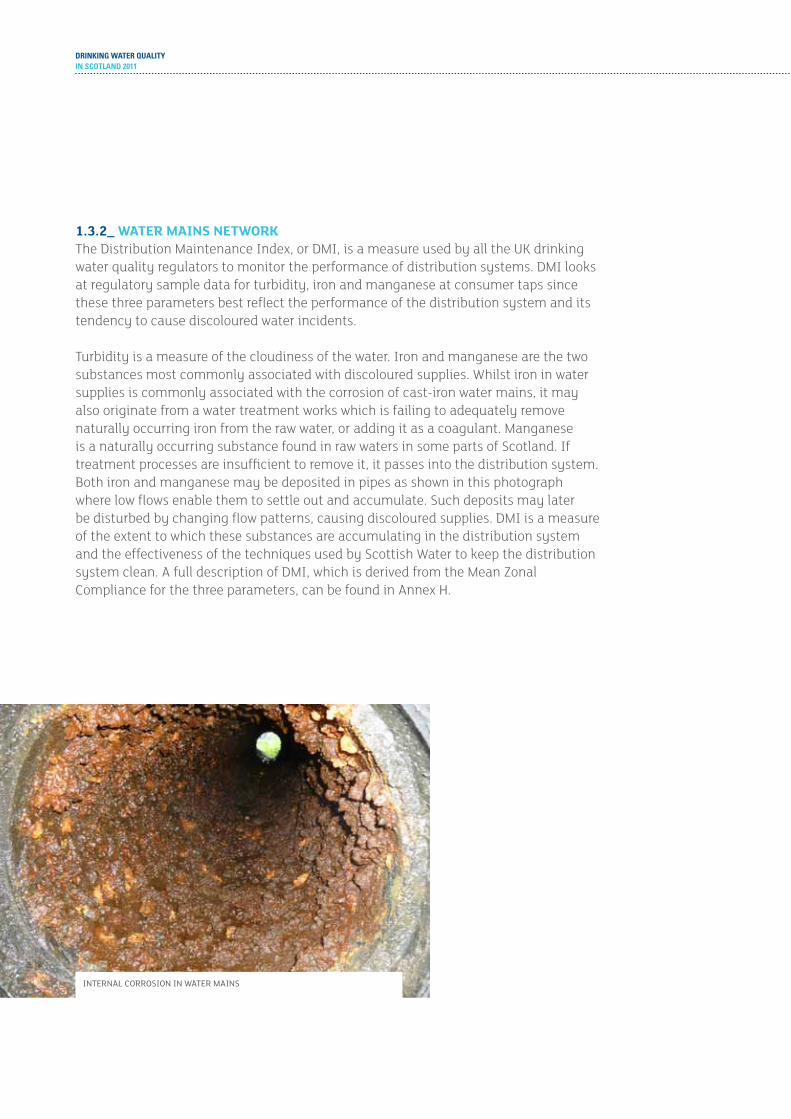
1.3.2_ Water MainS netWorkThe Distribution Maintenance Index, or DMI, is a measure used by all the UK drinking water quality regulators to monitor the performance of distribution systems. DMI looks at regulatory sample data for turbidity, iron and manganese at consumer taps since these three parameters best reflect the performance of the distribution system and its tendency to cause discoloured water incidents.
Turbidity is a measure of the cloudiness of the water. Iron and manganese are the two substances most commonly associated with discoloured supplies. Whilst iron in water supplies is commonly associated with the corrosion of cast-iron water mains, it may also originate from a water treatment works which is failing to adequately remove naturally occurring iron from the raw water, or adding it as a coagulant. Manganese is a naturally occurring substance found in raw waters in some parts of Scotland. If treatment processes are insufficient to remove it, it passes into the distribution system. Both iron and manganese may be deposited in pipes as shown in this photograph where low flows enable them to settle out and accumulate. Such deposits may later be disturbed by changing flow patterns, causing discoloured supplies. DMI is a measure of the extent to which these substances are accumulating in the distribution system and the effectiveness of the techniques used by Scottish Water to keep the distribution system clean. A full description of DMI, which is derived from the Mean Zonal Compliance for the three parameters, can be found in Annex H.
internaL COrrOSiOn in Water MainS

ANNUAL REPORT BY THE DRINKING WATER QUALITY REGULATOR 50_51
figure 1.3a shows the DMI trend since its introduction as a measure in 2005, together with the Mean Zonal Compliance of the three index parameters.
Figure 1.3a_Distribution maintenance Index
96.0%
96.5%
97.0%
97.5%
98.0%
98.5%
99.0%
99.5%
100.0%
2011201020092008200720062005
DMI IRON (MZC) MANGANESE (MZC) TURBIDITY (MZC)
in 2011 there were 77 failures of the standards that comprise the
distribution maintenance index, with almost 60% of those being for iron.

DRINKING WATER QUALITYIN SCOTLAND 2011
figure 1.3a shows an improving situation over the past few years but the loss of ground in 2011, with 46 failures of the iron standard, is of concern when it could reasonably be expected that the degree of investment being made in the rehabilitation of water mains would have led to further improvement. Work to rehabilitate old cast-iron water mains and install treatment for manganese is however continuing, following detailed studies to identify the areas experiencing the worst problems. Hopefully we will see the expected reduction in the number of failing samples and a restoration of water quality in the affected zones.
The mean DMI for all zones was 99.60%, which is slightly poorer than in the previous year with 41 supply zones recording a failure of an index parameter. This is nine more than in 2010. figure 1.3b shows the regional breakdown of the number of zones with iron and manganese failures.
Figure 1.3b_Regional Breakdown of Iron and manganese Failures
0.0
2.0
4.0
6.0
8.0
10.0
12.0
14.0
16.0
WestEastSouthNorth
Num
ber o
f zon
es w
ith
fails
ScottiSh Water region
IRON ONLY MANGANESE ONLY BOTH
The impact of iron and manganese in the water main network is that consumers receive discoloured water and this is discussed more fully within the Water Quality at Consumers’ taps section of this report. Failures of these parameters may be related to the condition of the water supply network but they may also be caused by operational activity causing flow changes within the water mains, i.e. operation of valves or burst mains.
ANNUAL REPORT BY THE DRINKING WATER QUALITY REGULATOR 52_53
Many of the worst affected areas are the larger zones covering a wide geographical area and this reflects the extensive supply route to consumers. Of particular note is Amlaird water supply zone, covering parts of Ayrshire, where eight failures of the iron standard were recorded and consumers experienced discoloured supplies. A major factor in the discoloration of the supply from this works is the significant changes in the raw water quality over the past few years. Scottish Water has carried out a full process review focussing on the potential causes of the variation in raw water quality along with performance audits within the treatment works. Various actions have been carried out to improve treatment works performance and to identify a longer-term strategy for supplies in the area. DWQR carried out an audit of the treatment works in February 2012 and made a number of recommendations.
1.3.3_ audit and inSpection of diStribution SySteMSAn important part of DWQR’s scrutiny role is to audit and inspect activities undertaken by Scottish Water. During an inspection of water supply networks, all aspects of the operation and maintenance of the assets and the management processes governing activity upon the network are reviewed. Auditing takes place against the requirements of the Regulations, Scottish Water’s Distribution and Operation Maintenance Strategy (DOMS) as well as water industry best practice. Where issues are noted these are recorded as recommendations that are tracked and followed up. If common themes are identified, these are progressed centrally with senior Scottish Water staff. Elements of best practice are also highlighted when these are spotted.
DRINKING WATER QUALITYIN SCOTLAND 2011
In 2011, a number of inspections were carried out on Scottish Water’s networks and also on the activities of different contractors carrying out water mains rehabilitation.
table 1.3c shows the inspections that were undertaken during the year.
Table 1.3c_Distribution Inspections
DATE SCOPE OF AUDITNO. OF
RECOmmENDATIONSLOCATION
Fort William april 2011 Full networks 8
Spynie June 2011 Full networks and rehab works 6
Cumnock July 2011 rehab works 2
Sandsend, Dunoon august 2011 rehab works 1
nemphlar, Lanark July 2011 rehab works 2
Bothwell, Lanark July 2011 rehab works 3
In the full distribution system audits, it was noted that risks were being managed appropriately with many examples of good practice. The hygienic storage of materials and equipment in temporary compounds, site containers and vehicles was the common issue identified across contractors working on water mains rehabilitation projects.
Summaries of all inspections undertaken are published on the DWQR website www.dwqr.org.uk
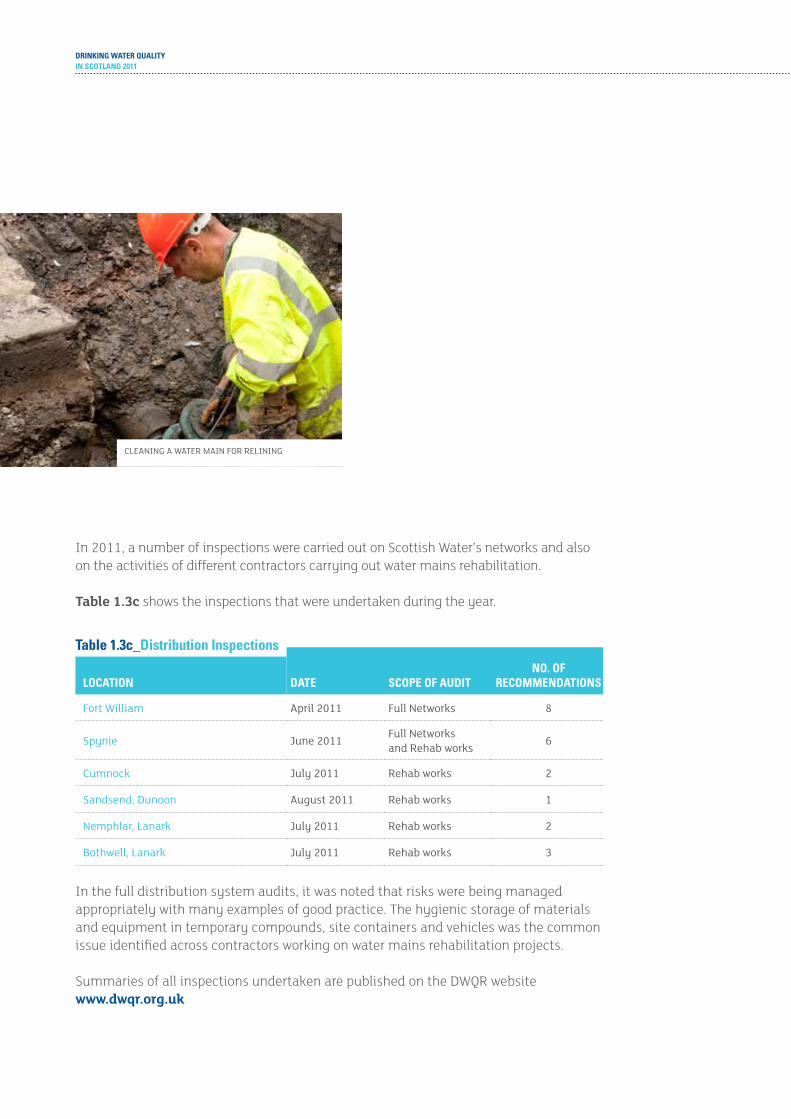
CLeaning a Water Main FOr reLining

ANNUAL REPORT BY THE DRINKING WATER QUALITY REGULATOR 54_55
1.3.4_ eVentS and incidentS in diStribution SySteMSIn 2011, 892 events were reported to the DWQR, of which 466 related to networks. Of those, 35 were declared incidents, meaning 42% of all incidents occurred within the water supply network.
Table 1.3d_Distribution Systems Events
NO. OF NETWORK EvENTS % OF NETWORK EvENTSCAUSE
no cause or outcome 166 35.5
Mains condition 115 24.6
Domestic plumbing 77 16.5
treatment issues 49 10.5
Low chlorine 19 4.1
ingress 12 2.6
Sample point or line 11 2.4
Sampling or laboratory error 8 1.7
Other 9 2.1
total 466 100
table 1.3d shows the causes that were attributed to the networks related events reported in 2011. A relatively small proportion of events (10.5%) are a direct consequence of some treatment issue which has had an impact within distribution. The most common attributable cause however, is the condition of the water mains. Sample failures generally arise from the disturbed deposits within the pipes which can be a reflection of the condition of the iron pipeline material but also of accumulations from historical treatment failures or process effectiveness.
For 166 events, however, it has not been possible to attribute a cause or outcome. Some 92% of events in this category are due to a bacteriological failure taken from storage tanks or consumers’ taps. Very often they are low level failures and follow up sampling at the same point or neighbouring properties do not fail. Again it is possible that the condition of the water mains, the deposits within them and their local configuration may lie at the root of the failures, or they may be related to the condition of the tap or the sampling process itself, but this has not been proven.
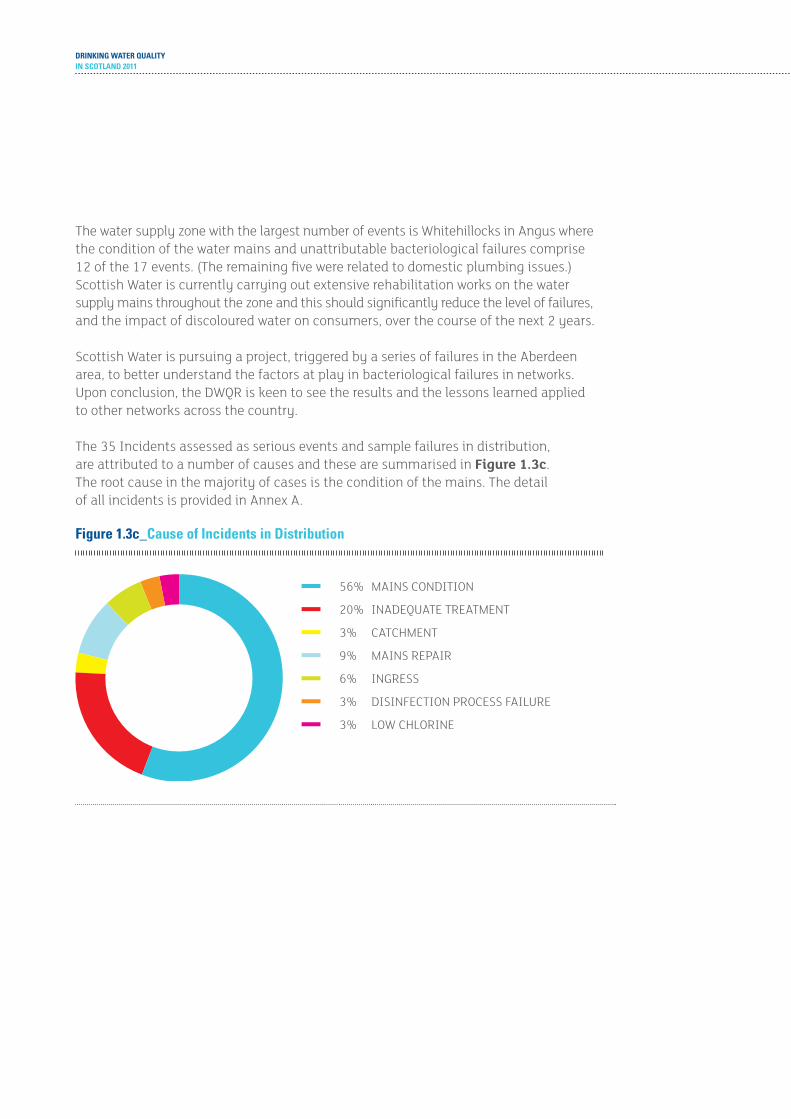
DRINKING WATER QUALITYIN SCOTLAND 2011
The water supply zone with the largest number of events is Whitehillocks in Angus where the condition of the water mains and unattributable bacteriological failures comprise 12 of the 17 events. (The remaining five were related to domestic plumbing issues.) Scottish Water is currently carrying out extensive rehabilitation works on the water supply mains throughout the zone and this should significantly reduce the level of failures, and the impact of discoloured water on consumers, over the course of the next 2 years.
Scottish Water is pursuing a project, triggered by a series of failures in the Aberdeen area, to better understand the factors at play in bacteriological failures in networks. Upon conclusion, the DWQR is keen to see the results and the lessons learned applied to other networks across the country.
The 35 Incidents assessed as serious events and sample failures in distribution, are attributed to a number of causes and these are summarised in figure 1.3c. The root cause in the majority of cases is the condition of the mains. The detail of all incidents is provided in Annex A.
Figure 1.3c_Cause of Incidents in Distribution
56% MAINS CONDITION
20% INADEQUATE TREATMENT
3% CATCHMENT
9% MAINS REPAIR
6% INGRESS
3% DISINFECTION PROCESS FAILURE
3% LOW CHLORINE

ANNUAL REPORT BY THE DRINKING WATER QUALITY REGULATOR 56_57
figure 1.3d shows the nature of the incidents declared in distribution systems and it can be seen that the key issue across the breadth of the country is iron, which is most prevalent in the East Region. In this region three of the four issues are related to disinfection – bacteriological, nitrite and THM failures which, together with the iron failures, reflect the condition of the mains and the extensive nature of the distribution systems.
Figure 1.3d_Nature of Incidents in Distribution Systems
0.0
2.0
4.0
6.0
8.0
10.0
12.0
14.0
WestSouthNorthEast
THM PESTICIDES pH NITRITE MANGANESE IRON BACTERIOLOGICAL
Summaries of all incident investigations are published on the DWQR website www.dwqr.org.uk
DRINKING WATER QUALITYIN SCOTLAND 2011
fairburn Service reservoirThis incident covered a period of nearly 2 weeks where repeated detections of coliforms occurred in samples taken from the Service Reservoir (SR). These detections were low in number and of no direct concern for public health, however, their presence did indicate the possibility of microbiological contamination, especially as they occurred in water containing a relatively high concentration of chlorine.
The detections followed work by Scottish Water’s Instrumentation Control Automation and Telemetry (ICAT) team to investigate and repair a faulty pressure transducer at the SR. This had necessitated opening a high-level hatch on a number of occasions, potentially dislodging bird droppings that were present. Additionally, the replacement pressure transducer was not disinfected in any way prior to introduction to the water, a clear violation of hygiene procedures. The coliform detections occurred over a number days, with Scottish Water’s response being to add chlorine to the tank and collect a further sample. After 24 days, and although clear samples had been obtained, the tank was removed from service with the area being supplied via a pressure sustaining pump.
Inadequate training of the ICAT team in matters relating to water hygiene meant that usual procedures designed to safeguard water quality were not applied. An apparent lack of communication meant that operational staff did not fully appreciate the intrusive nature of the maintenance work in the early days of the incident and the consequent potential for the introduction of contaminants.
The Regulator is of the opinion that greater care should have been taken by the ICAT team to avoid contamination in the first place, and Scottish Water should certainly have ensured that anyone accessing treated water in this manner was aware of, and using, the relevant hygiene procedures. Although the relatively trivial nature of the failures meant that public health was unlikely to have been at risk, it is disappointing that Scottish Water failed to respond effectively to them and resolve the issue promptly.
Scottish Water identified three actions and the DWQR made a further recommendation in relation to the incident.
ANNUAL REPORT BY THE DRINKING WATER QUALITY REGULATOR 58_59
1.3.5_ inVeStMent in the diStribution SySteMScottish Water has been directed by Scottish Ministers to achieve a number of different objectives to improve and protect drinking water quality across Scotland during the period of 1 April 2010 to 31 March 2015.
During 2011, Scottish Water completed the construction of eight emergency tanker fill points at strategic positions within distribution systems throughout Scotland. If the piped supply fails or becomes contaminated for any reason, these facilities will assist Scottish Water in complying with their duty to supply at least 10 litres of alternative water per head during such an emergency.
Also during 2011, Scottish Water completed the installation of backflow prevention devices on the incoming water mains at 95 wastewater treatment works (WWTW). These will protect the public water supply from any contamination that could have been caused by the backflow of dirty water from the WWTW as a result of a sudden loss of pressure in the mains water, for example due to a burst pipe.
Finally, during 2011 Scottish Water carried out studies on 45 distribution zones to determine the extent of water mains rehabilitation required to reduce the number of discoloration events and customer contacts. In addition, following studies previously undertaken, Scottish Water carried out water main rehabilitation works in 14 of its water supply zones to reduce the risk of water quality being degraded by the condition of the distribution system.
DRINKING WATER QUALITYIN SCOTLAND 2011
in 2011, 151,597 tests were carried out on samples taken at consumers’ taps.
1.4_CONSUmERS

ANNUAL REPORT BY THE DRINKING WATER QUALITY REGULATOR 60_61
1.4.1_ Water Quality at conSuMerS’ tapSMost samples to assess regulatory compliance are taken from consumer taps, and testing takes place for 57 parameters. Sampling frequencies are determined by the size of the population in the water supply zone.
In 2011, 151,597 tests were carried out on samples taken at consumers’ taps. Of these, 245 failed to meet the standard set out in the Regulations. This means that 99.84% of tests complied with the standards.
The number of tests complying with the standards has increased every year since 2003, although the rate of improvement has levelled off in recent years.
Scottish Water’s supply area is divided into 315 water supply zones. In 2011, 112 zones had a sample taken that failed to meet one or more of the standards. Scottish Water’s figure for Mean Zonal Compliance in 2011 was 99.81%.
table 1.4a shows the test results of samples taken from randomly selected consumers’ taps. This is the primary means by which compliance with the water quality regulations is measured.
A number of key parameters are considered here in more detail. The graphs show the percentage of samples that failed to meet each standard.
99.84% of tests complied with the standards.
in 2011, 151,597 tests were carried out on samples taken at consumers’ taps.
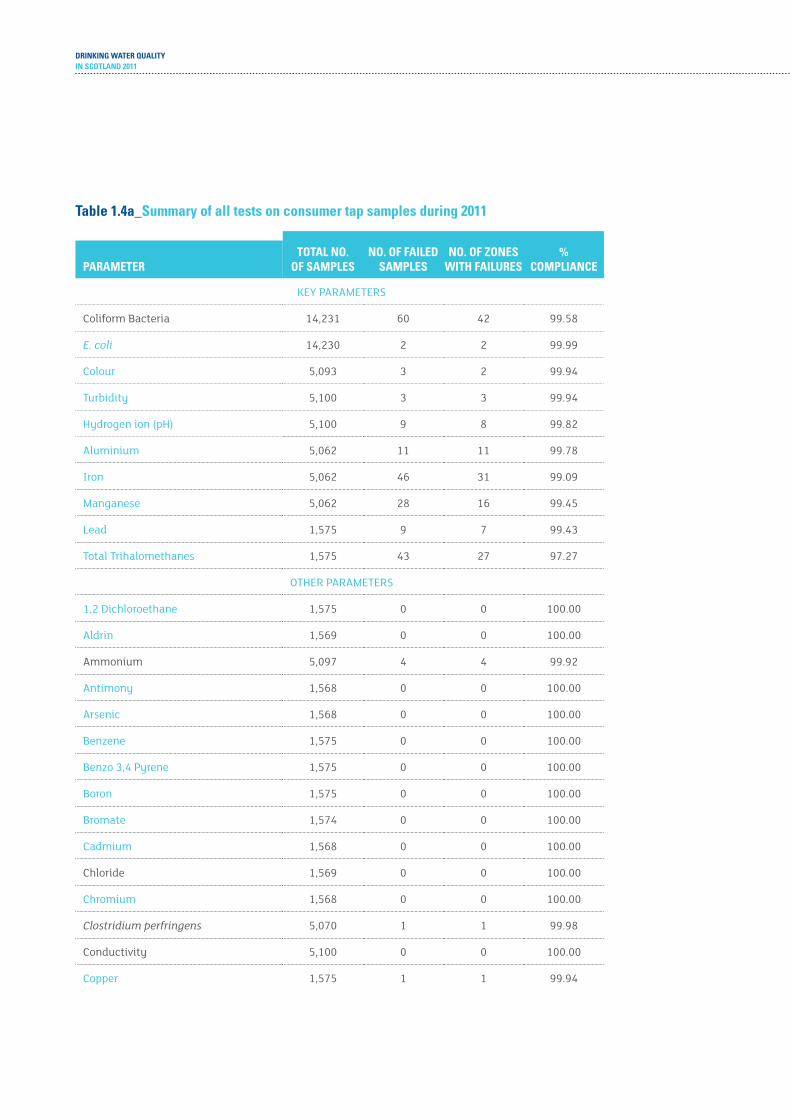
DRINKING WATER QUALITYIN SCOTLAND 2011
Table 1.4a_Summary of all tests on consumer tap samples during 2011
TOTAL NO. OF SAmPLES
NO. OF FAILED SAmPLES
NO. OF zONES WITH FAILURES
% COmPLIANCEPARAmETER
keY ParaMeterS
Coliform Bacteria 14,231 60 42 99.58
E. coli 14,230 2 2 99.99
Colour 5,093 3 2 99.94
turbidity 5,100 3 3 99.94
Hydrogen ion (pH) 5,100 9 8 99.82
aluminium 5,062 11 11 99.78
iron 5,062 46 31 99.09
Manganese 5,062 28 16 99.45
Lead 1,575 9 7 99.43
total trihalomethanes 1,575 43 27 97.27
OtHer ParaMeterS
1,2 Dichloroethane 1,575 0 0 100.00
aldrin 1,569 0 0 100.00
ammonium 5,097 4 4 99.92
antimony 1,568 0 0 100.00
arsenic 1,568 0 0 100.00
Benzene 1,575 0 0 100.00
Benzo 3,4 Pyrene 1,575 0 0 100.00
Boron 1,575 0 0 100.00
Bromate 1,574 0 0 100.00
Cadmium 1,568 0 0 100.00
Chloride 1,569 0 0 100.00
Chromium 1,568 0 0 100.00
Clostridium perfringens 5,070 1 1 99.98
Conductivity 5,100 0 0 100.00
Copper 1,575 1 1 99.94

ANNUAL REPORT BY THE DRINKING WATER QUALITY REGULATOR 62_63
Table 1.4a Cont.
TOTAL NO. OF SAmPLES
NO. OF FAILED SAmPLES
NO. OF zONES WITH FAILURES
% COmPLIANCEPARAmETER
Cyanide 1,574 0 0 100.00
Dieldrin 1,569 0 0 100.00
Enterococci 1,575 1 1 99.94
Fluoride 1,576 0 0 100.00
Heptachlor 1,569 0 0 100.00
Heptachlor epoxide 1,568 0 0 100.00
Mercury 1,568 0 0 100.00
nickel 1,567 1 1 99.94
nitrate 2,404 0 0 100.00
nitrite 2,405 9 6 99.63
nitrite/nitrate formula 2,403 0 0 100.00
Odour 5,093 0 0 100.00
PaH - Sum of 4 Substances 1,575 0 0 100.00
Pesticides - total Substances 2,623 0 0 100.00
all Other individual Pesticides 13,363 12 4 99.92
Selenium 1,568 0 0 100.00
Sodium 1,575 0 0 100.00
Sulphate 1,575 0 0 100.00
taste 5,090 2 2 99.96
tetrachloroethene/trichloroethene - Sum 1,566 0 0 100.00
tetrachloromethane 1,575 0 0 100.00
total for all paraMeterS 151,597 245 112 99.84
Only parameters in schedule 1 of the regulations (Blue) are used in the calculation of overall compliance. the measures of compliance are more fully explained in Annex H.
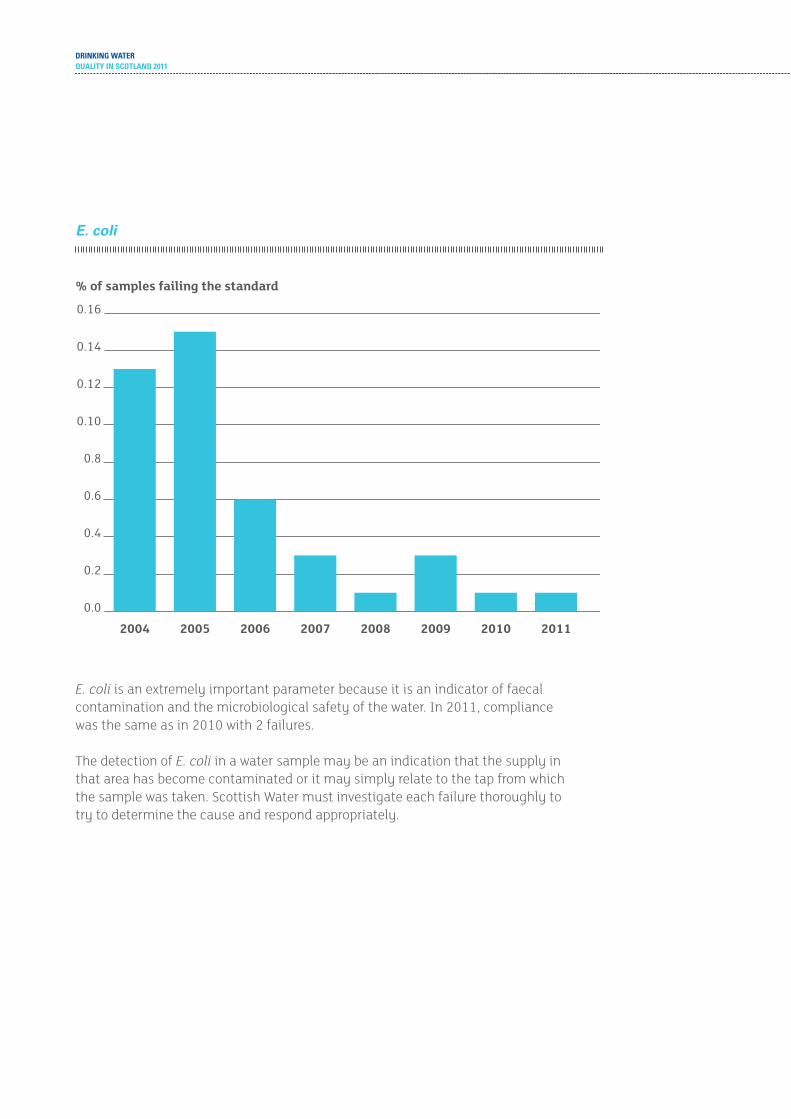
DRINKING WATERQUALITY IN SCOTLAND 2011
E. coli
0.0
0.2
0.4
0.6
0.8
0.10
0.12
0.14
0.16
% of samples failing the standard
20112010200920082007200620052004
E. coli is an extremely important parameter because it is an indicator of faecal contamination and the microbiological safety of the water. In 2011, compliance was the same as in 2010 with 2 failures.
The detection of E. coli in a water sample may be an indication that the supply in that area has become contaminated or it may simply relate to the tap from which the sample was taken. Scottish Water must investigate each failure thoroughly to try to determine the cause and respond appropriately.
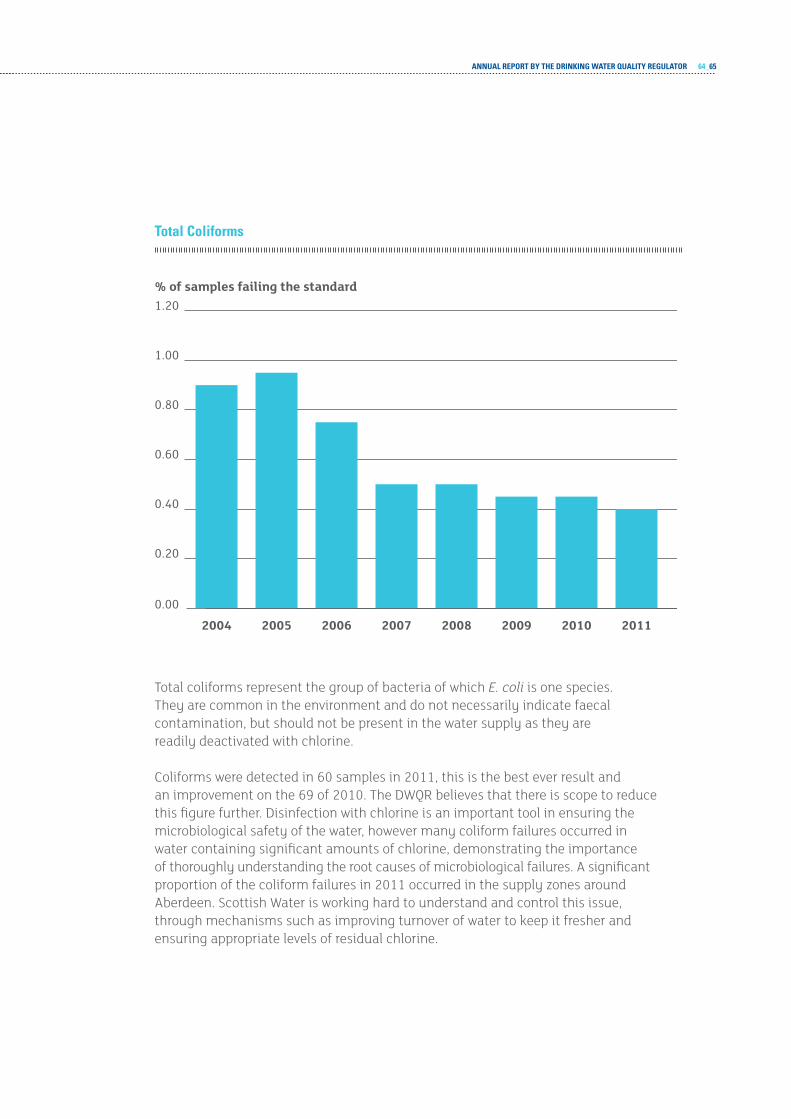
ANNUAL REPORT BY THE DRINKING WATER QUALITY REGULATOR 64_65
Total Coliforms
0.00
0.20
0.40
0.60
0.80
1.00
1.20
20112010200920082007200620052004
% of samples failing the standard
Total coliforms represent the group of bacteria of which E. coli is one species. They are common in the environment and do not necessarily indicate faecal contamination, but should not be present in the water supply as they are readily deactivated with chlorine.
Coliforms were detected in 60 samples in 2011, this is the best ever result and an improvement on the 69 of 2010. The DWQR believes that there is scope to reduce this figure further. Disinfection with chlorine is an important tool in ensuring the microbiological safety of the water, however many coliform failures occurred in water containing significant amounts of chlorine, demonstrating the importance of thoroughly understanding the root causes of microbiological failures. A significant proportion of the coliform failures in 2011 occurred in the supply zones around Aberdeen. Scottish Water is working hard to understand and control this issue, through mechanisms such as improving turnover of water to keep it fresher and ensuring appropriate levels of residual chlorine.
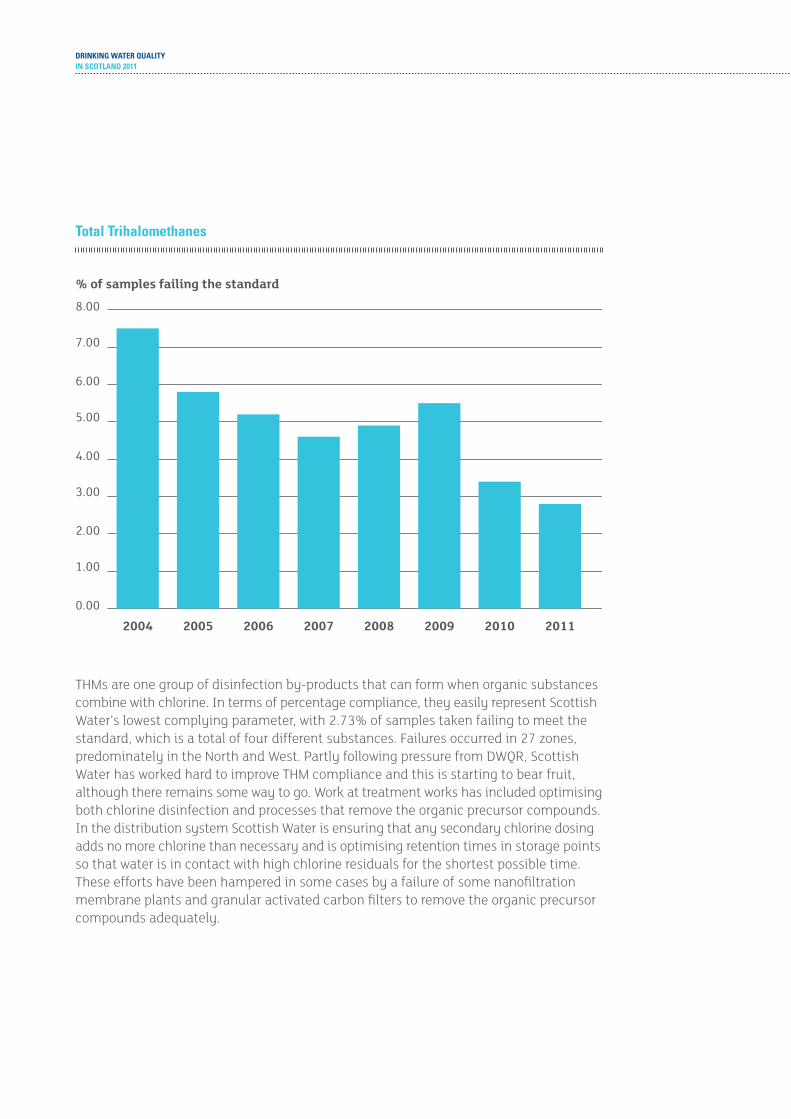
DRINKING WATER QUALITYIN SCOTLAND 2011
Total Trihalomethanes
0.00
1.00
2.00
3.00
4.00
5.00
6.00
7.00
8.00
20112010200920082007200620052004
% of samples failing the standard
THMs are one group of disinfection by-products that can form when organic substances combine with chlorine. In terms of percentage compliance, they easily represent Scottish Water’s lowest complying parameter, with 2.73% of samples taken failing to meet the standard, which is a total of four different substances. Failures occurred in 27 zones, predominately in the North and West. Partly following pressure from DWQR, Scottish Water has worked hard to improve THM compliance and this is starting to bear fruit, although there remains some way to go. Work at treatment works has included optimising both chlorine disinfection and processes that remove the organic precursor compounds. In the distribution system Scottish Water is ensuring that any secondary chlorine dosing adds no more chlorine than necessary and is optimising retention times in storage points so that water is in contact with high chlorine residuals for the shortest possible time. These efforts have been hampered in some cases by a failure of some nanofiltration membrane plants and granular activated carbon filters to remove the organic precursor compounds adequately.
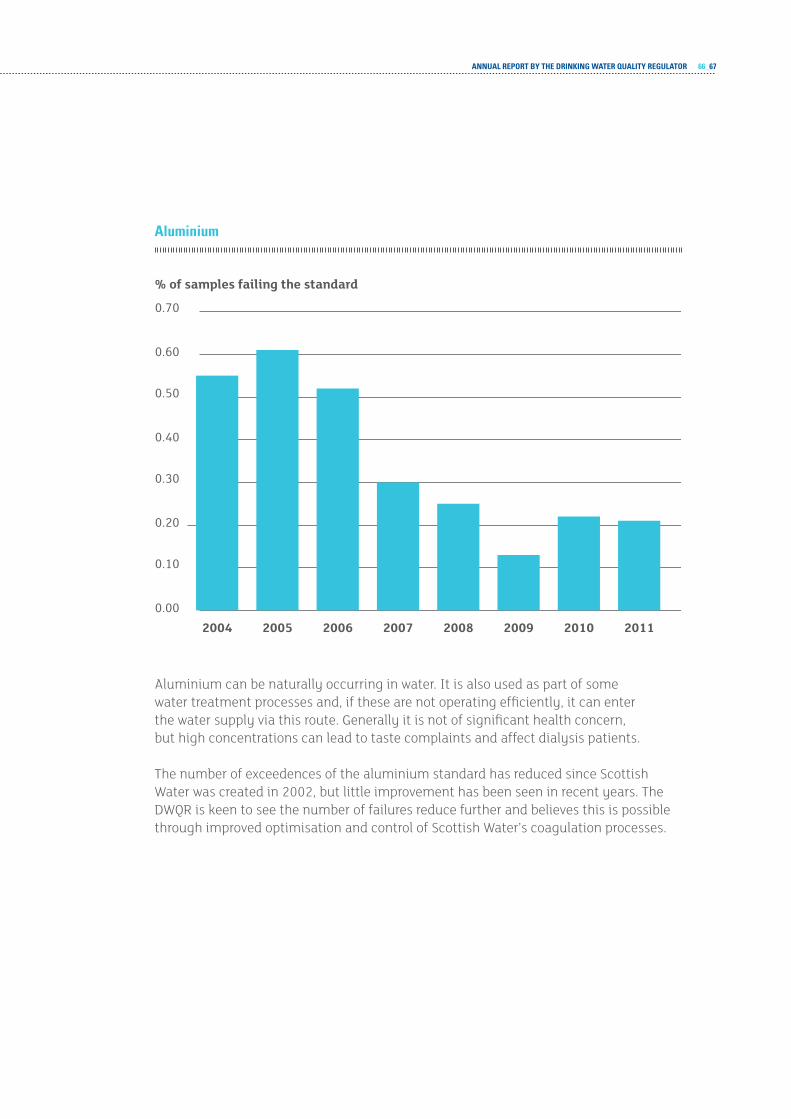
ANNUAL REPORT BY THE DRINKING WATER QUALITY REGULATOR 66_67
Aluminium
0.00
0.10
0.20
0.30
0.40
0.50
0.60
0.70
20112010200920082007200620052004
% of samples failing the standard
Aluminium can be naturally occurring in water. It is also used as part of some water treatment processes and, if these are not operating efficiently, it can enter the water supply via this route. Generally it is not of significant health concern, but high concentrations can lead to taste complaints and affect dialysis patients.
The number of exceedences of the aluminium standard has reduced since Scottish Water was created in 2002, but little improvement has been seen in recent years. The DWQR is keen to see the number of failures reduce further and believes this is possible through improved optimisation and control of Scottish Water’s coagulation processes.
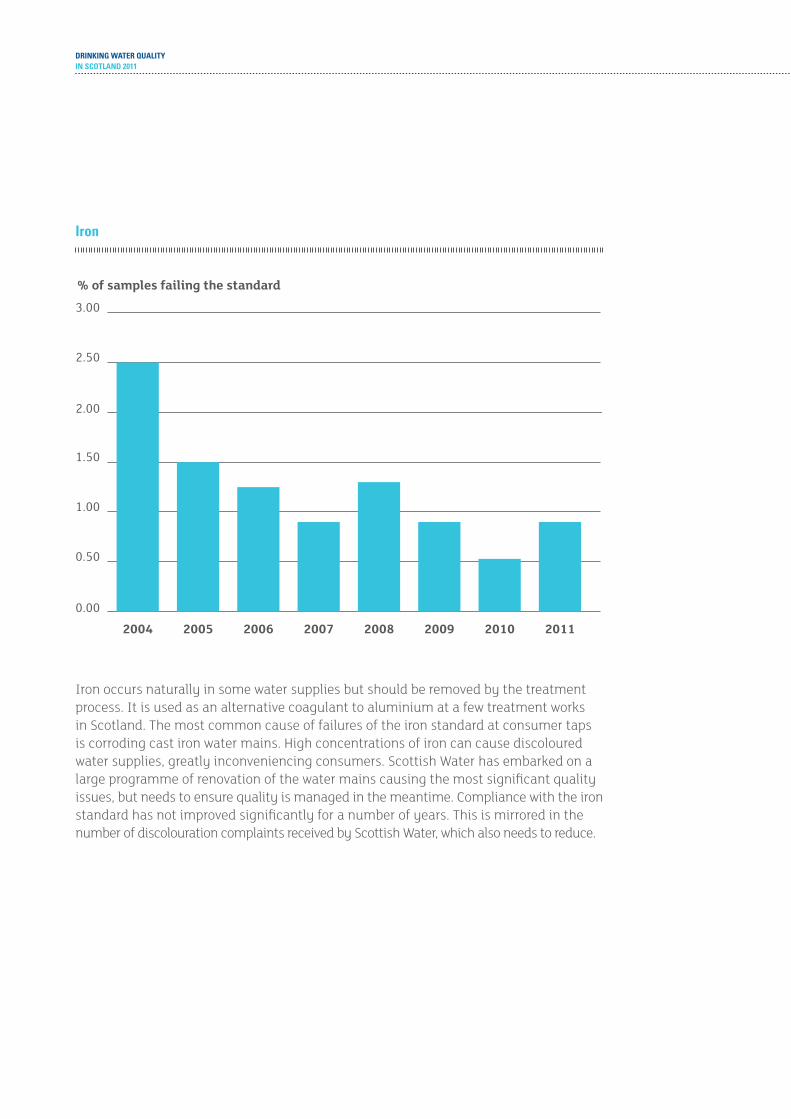
DRINKING WATER QUALITYIN SCOTLAND 2011
Iron
0.00
0.50
1.00
1.50
2.00
2.50
3.00
20112010200920082007200620052004
% of samples failing the standard
Iron occurs naturally in some water supplies but should be removed by the treatment process. It is used as an alternative coagulant to aluminium at a few treatment works in Scotland. The most common cause of failures of the iron standard at consumer taps is corroding cast iron water mains. High concentrations of iron can cause discoloured water supplies, greatly inconveniencing consumers. Scottish Water has embarked on a large programme of renovation of the water mains causing the most significant quality issues, but needs to ensure quality is managed in the meantime. Compliance with the iron standard has not improved significantly for a number of years. This is mirrored in the number of discolouration complaints received by Scottish Water, which also needs to reduce.
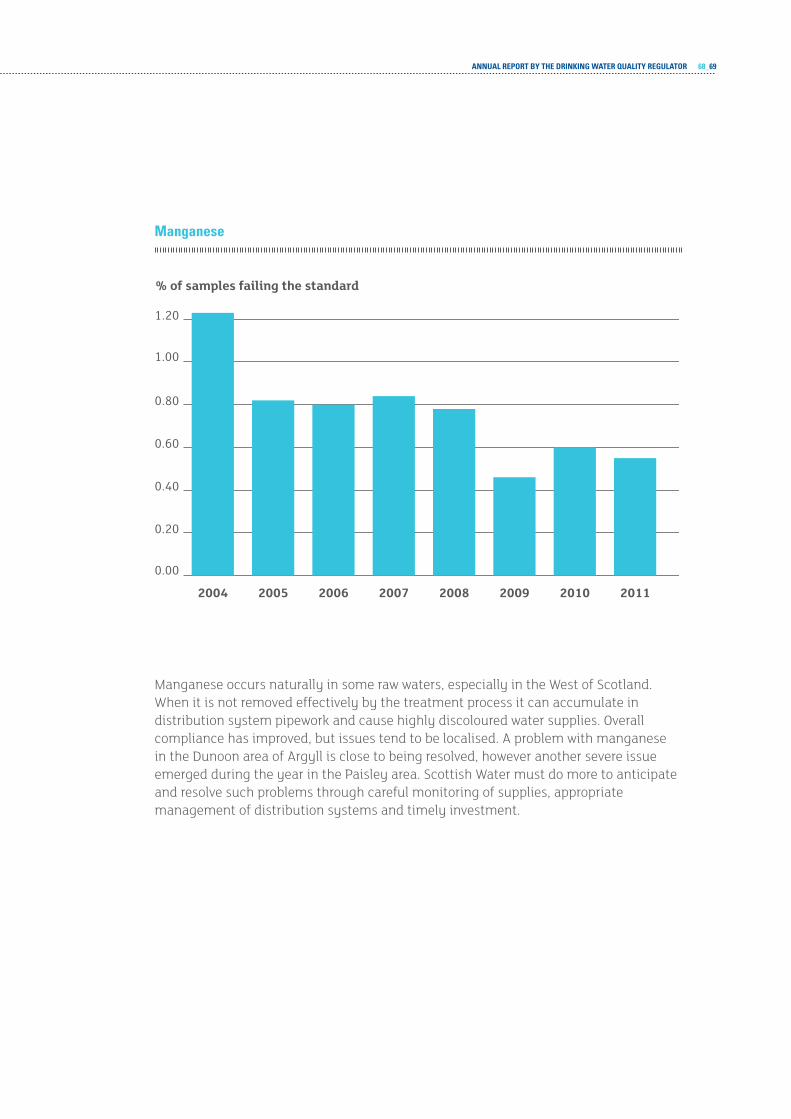
ANNUAL REPORT BY THE DRINKING WATER QUALITY REGULATOR 68_69
manganese
0.00
0.20
0.40
0.60
0.80
1.00
1.20
20112010200920082007200620052004
% of samples failing the standard
Manganese occurs naturally in some raw waters, especially in the West of Scotland. When it is not removed effectively by the treatment process it can accumulate in distribution system pipework and cause highly discoloured water supplies. Overall compliance has improved, but issues tend to be localised. A problem with manganese in the Dunoon area of Argyll is close to being resolved, however another severe issue emerged during the year in the Paisley area. Scottish Water must do more to anticipate and resolve such problems through careful monitoring of supplies, appropriate management of distribution systems and timely investment.
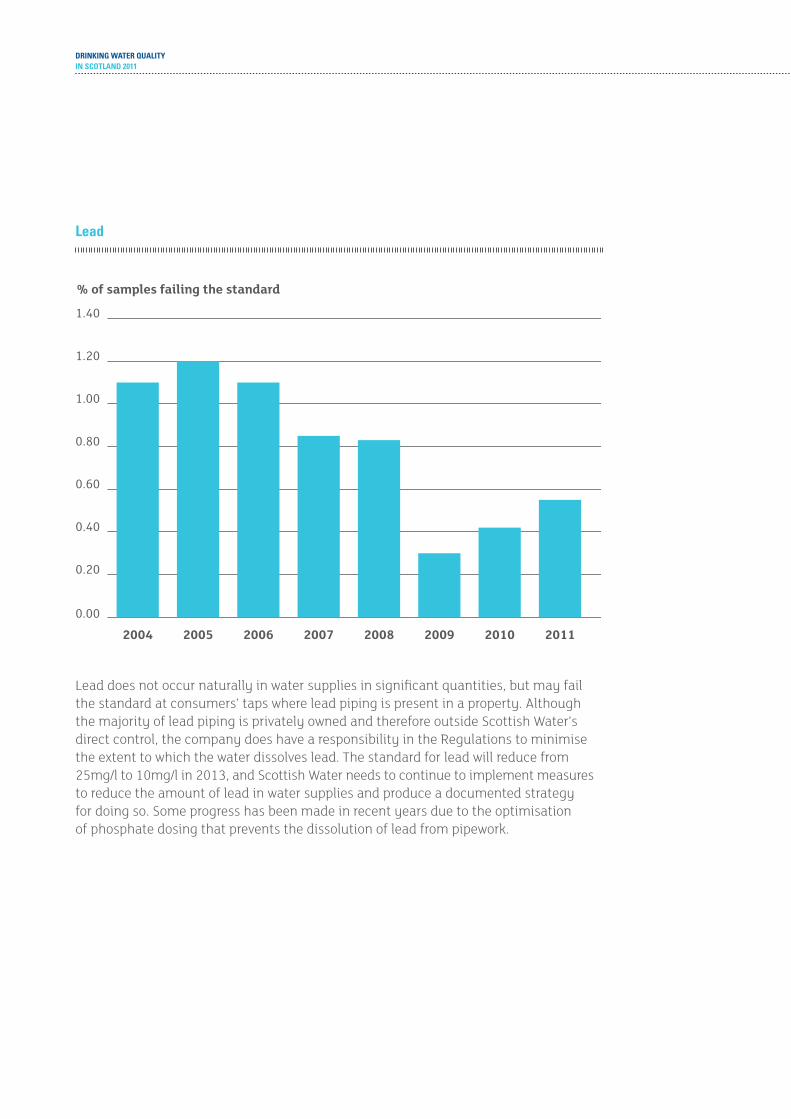
DRINKING WATER QUALITYIN SCOTLAND 2011
Lead
0.00
0.20
0.40
0.60
0.80
1.00
1.20
1.40
20112010200920082007200620052004
% of samples failing the standard
Lead does not occur naturally in water supplies in significant quantities, but may fail the standard at consumers’ taps where lead piping is present in a property. Although the majority of lead piping is privately owned and therefore outside Scottish Water’s direct control, the company does have a responsibility in the Regulations to minimise the extent to which the water dissolves lead. The standard for lead will reduce from 25mg/l to 10mg/l in 2013, and Scottish Water needs to continue to implement measures to reduce the amount of lead in water supplies and produce a documented strategy for doing so. Some progress has been made in recent years due to the optimisation of phosphate dosing that prevents the dissolution of lead from pipework.
ANNUAL REPORT BY THE DRINKING WATER QUALITY REGULATOR 70_71
other notable paraMeterS
ammonium and nitriteThese two parameters are related, and occur when nitrifying bacteria act on ammonia that is added to chlorine in a process known as chloramination. If the process is not tightly controlled and nitrifying bacteria are allowed to persist in the distribution system, failures of these parameters can result.
In 2011 a number of failures occurred for both these parameters, many of them in the Aberdeen area. Although the numbers showed some improvement when compared to 2010, there is further work that must be done to control nitrification.
pesticidesThe standard for individual pesticides is set with a large margin of safety, consequently a failure does not usually imply a risk to health, however, Scottish Water is expected to meet the standard.
Nine exceedences occurred in 2011, a significant increase on previous years. Most, but not all, of these were on the Forehill supply serving Peterhead in the North East, where a number of different pesticides were detected in small quantities. These substances entered the River Ugie from the intensive agricultural activity in the catchment, and there is currently no treatment process at Forehill WTW to remove them. To date attempts have been made to achieve a reduction in the amount of pesticide entering the river through good farming practice, however, it is now evident that a treatment process will also be required and plans to design and construct this are well under way.
DRINKING WATER QUALITYIN SCOTLAND 2011
1.4.2_ public buildingSThe European Drinking Water Directive requires that member states have regulations to deal with the monitoring of water quality in buildings to which the public have access. In order to fully transpose this requirement into Scottish law, the Water Quality (Scotland) Regulations 2010 (the 2010 Regulations) were laid. The measures introduced by the 2010 Regulations are the minimum considered necessary to complete the transposition of the Drinking Water Directive in Scotland.
In relation to water quality failures in public buildings, the 2010 Regulations place a general duty on local authorities to:
¡¡ immediately investigate a water quality failure arising from the domestic distribution system in a public building to determine its cause and to report their findings to the Scottish Ministers (in practice the Drinking Water Quality Regulator for Scotland);
¡¡ ensure that remedial action is taken as soon as possible to restore water quality and that priority is given to enforcement action having had regard amongst other things to the potential danger to human health;
¡¡ in relation to water constituting a risk to human health to prohibit, restrict the use of, or take such other action as is necessary to protect human health; and
¡¡ to inform affected consumers promptly and give them the necessary advice in relation to any risk to their health (in practice ‘health’ advice is likely to be given following advice from the local NHS Board Consultant in Public Health Medicine (CPHM)).
The 2010 Regulations also require local authorities to serve a notice of improvement under section 76FB of the 1980 Act on the person responsible for the domestic distribution system (the responsible person) to ensure that remedial action is taken to restore a wholesome supply of water.
It is anticipated that the 2010 Regulations largely reflect what already happens in practice and that they will have minimal impact on the role or functions of either Scottish Water or local authorities in relation to water quality. The Regulations do not define what constitutes a public building – it is left to local authorities to exercise their professional judgement in this matter.
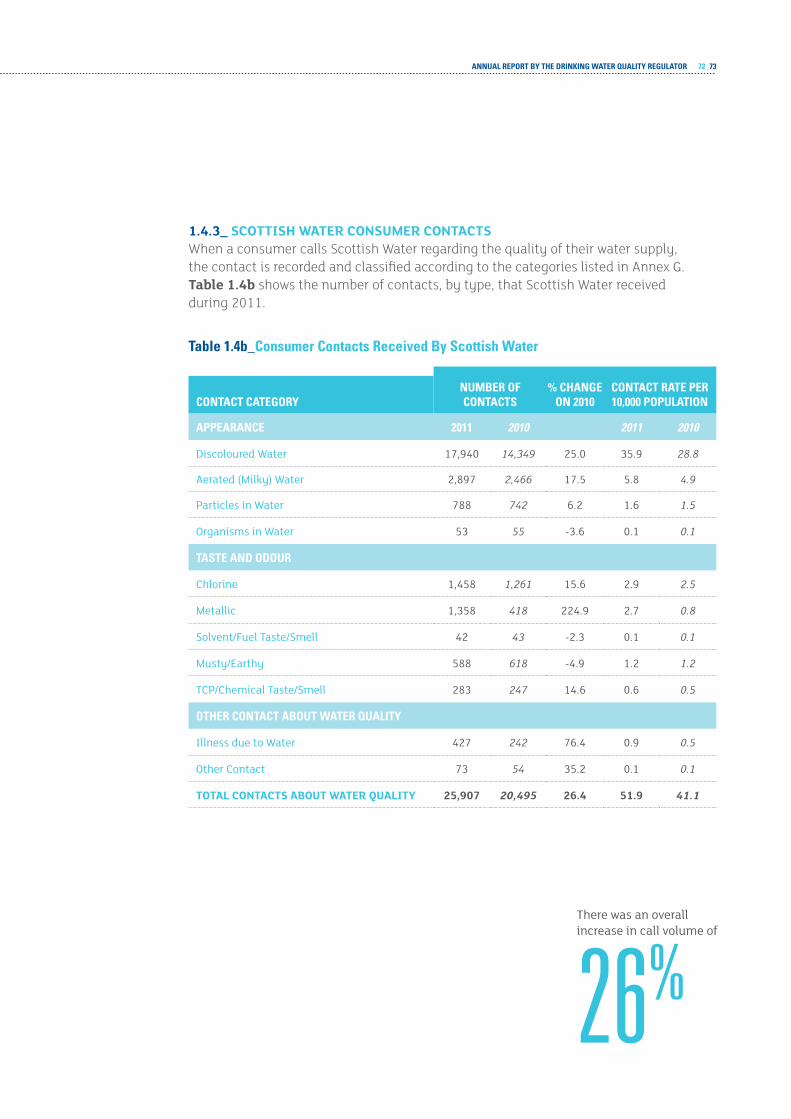
ANNUAL REPORT BY THE DRINKING WATER QUALITY REGULATOR 72_73
1.4.3_ ScottiSh Water conSuMer contactSWhen a consumer calls Scottish Water regarding the quality of their water supply, the contact is recorded and classified according to the categories listed in Annex G. table 1.4b shows the number of contacts, by type, that Scottish Water received during 2011.
Table 1.4b_Consumer Contacts Received By Scottish Water
NUmBER OF CONTACTS
% CHANGE ON 2010
CONTACT RATE PER 10,000 POPULATIONCONTACT CATEGORY
APPEARANCE 2011 2010 2011 2010
Discoloured Water 17,940 14,349 25.0 35.9 28.8
aerated (Milky) Water 2,897 2,466 17.5 5.8 4.9
Particles in Water 788 742 6.2 1.6 1.5
Organisms in Water 53 55 -3.6 0.1 0.1
TASTE AND ODOUR
Chlorine 1,458 1,261 15.6 2.9 2.5
Metallic 1,358 418 224.9 2.7 0.8
Solvent/Fuel taste/Smell 42 43 -2.3 0.1 0.1
Musty/earthy 588 618 -4.9 1.2 1.2
tCP/Chemical taste/Smell 283 247 14.6 0.6 0.5
OTHER CONTACT ABOUT WATER QUALITY
illness due to Water 427 242 76.4 0.9 0.5
Other Contact 73 54 35.2 0.1 0.1
total contactS about Water Quality 25,907 20,495 26.4 51.9 41.1
there was an overall increase in call volume of
26%
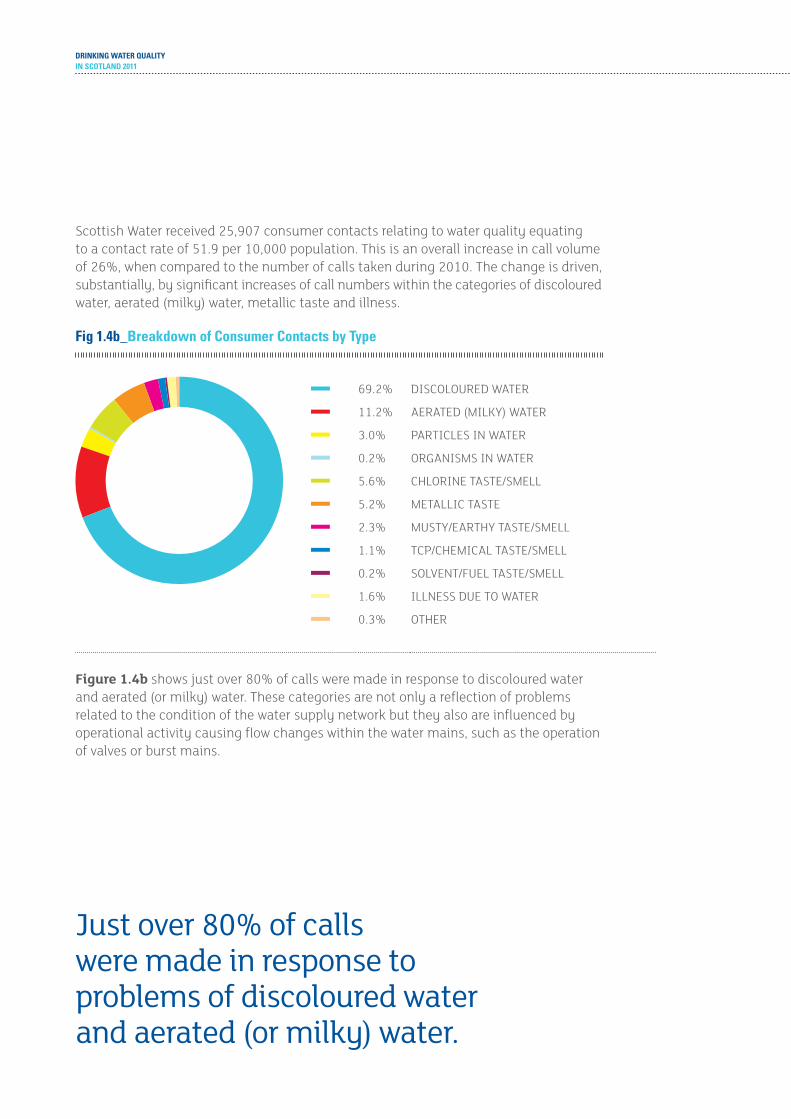
DRINKING WATER QUALITYIN SCOTLAND 2011
Scottish Water received 25,907 consumer contacts relating to water quality equating to a contact rate of 51.9 per 10,000 population. This is an overall increase in call volume of 26%, when compared to the number of calls taken during 2010. The change is driven, substantially, by significant increases of call numbers within the categories of discoloured water, aerated (milky) water, metallic taste and illness.
Fig 1.4b_Breakdown of Consumer Contacts by Type
69.2% DISCOLOURED WATER
11.2% AERATED (MILKY) WATER
3.0% PARTICLES IN WATER
0.2% ORGANISMS IN WATER
5.6% CHLORINE TASTE/SMELL
5.2% METALLIC TASTE
2.3% MUSTY/EARTHY TASTE/SMELL
1.1% TCP/CHEMICAL TASTE/SMELL
0.2% SOLVENT/FUEL TASTE/SMELL
1.6% ILLNESS DUE TO WATER
0.3% OTHER
figure 1.4b shows just over 80% of calls were made in response to discoloured water and aerated (or milky) water. These categories are not only a reflection of problems related to the condition of the water supply network but they also are influenced by operational activity causing flow changes within the water mains, such as the operation of valves or burst mains.
Just over 80% of calls were made in response to problems of discoloured water and aerated (or milky) water.
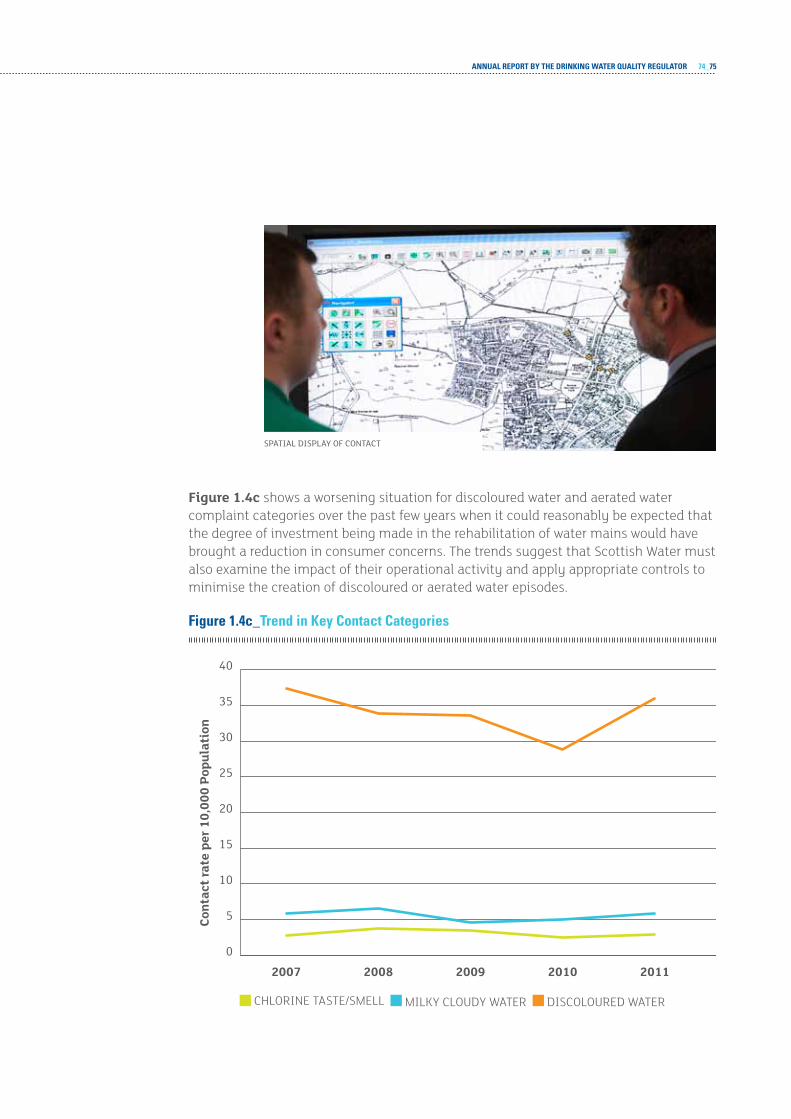
ANNUAL REPORT BY THE DRINKING WATER QUALITY REGULATOR 74_75
figure 1.4c shows a worsening situation for discoloured water and aerated water complaint categories over the past few years when it could reasonably be expected that the degree of investment being made in the rehabilitation of water mains would have brought a reduction in consumer concerns. The trends suggest that Scottish Water must also examine the impact of their operational activity and apply appropriate controls to minimise the creation of discoloured or aerated water episodes.
Figure 1.4c_Trend in Key Contact Categories
0
5
10
15
20
25
30
35
40
20112010200920082007
Cont
act r
ate
per 1
0,00
0 Po
pula
tion
CHLORINE TASTE/SMELL MILKY CLOUDY WATER DISCOLOURED WATER
SPatiaL DiSPLaY OF COntaCt
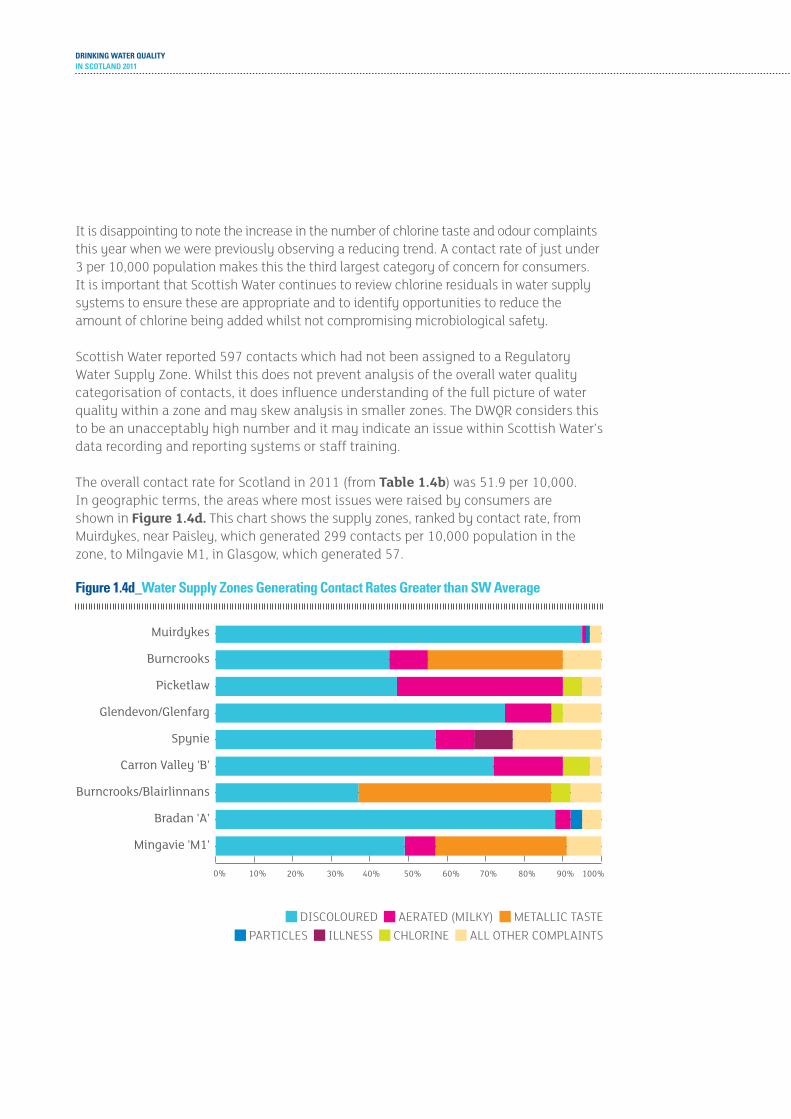
DRINKING WATER QUALITYIN SCOTLAND 2011
It is disappointing to note the increase in the number of chlorine taste and odour complaints this year when we were previously observing a reducing trend. A contact rate of just under 3 per 10,000 population makes this the third largest category of concern for consumers. It is important that Scottish Water continues to review chlorine residuals in water supply systems to ensure these are appropriate and to identify opportunities to reduce the amount of chlorine being added whilst not compromising microbiological safety.
Scottish Water reported 597 contacts which had not been assigned to a Regulatory Water Supply Zone. Whilst this does not prevent analysis of the overall water quality categorisation of contacts, it does influence understanding of the full picture of water quality within a zone and may skew analysis in smaller zones. The DWQR considers this to be an unacceptably high number and it may indicate an issue within Scottish Water’s data recording and reporting systems or staff training.
The overall contact rate for Scotland in 2011 (from table 1.4b) was 51.9 per 10,000. In geographic terms, the areas where most issues were raised by consumers are shown in figure 1.4d. This chart shows the supply zones, ranked by contact rate, from Muirdykes, near Paisley, which generated 299 contacts per 10,000 population in the zone, to Milngavie M1, in Glasgow, which generated 57.
Figure 1.4d_Water Supply zones Generating Contact Rates Greater than SW Average
0% 10% 20% 30% 40% 50% 60% 70% 80% 90% 100%
Mingavie 'M1'
Bradan 'A'
Burncrooks/Blairlinnans
Carron Valley 'B'
Spynie
Glendevon/Glenfarg
Picketlaw
Burncrooks
Muirdykes
DISCOLOURED AERATED (MILKY) METALLIC TASTE PARTICLES ILLNESS CHLORINE ALL OTHER COMPLAINTS
ANNUAL REPORT BY THE DRINKING WATER QUALITY REGULATOR 76_77
MuirdykesThere were 2,416 contacts from consumers in the Muirdykes zone and these were predominantly reporting discoloured water. The treatment works is unable to effectively remove manganese from the raw water collected in the catchment and this has led to a build up of manganese in the water mains. These deposits are easily disturbed by even minor changes in flows and can cause very dark or black coloured water being supplied to consumers. The DWQR sought an Undertaking from Scottish Water and in August 2011 Scottish Water committed to implementing improvement measures within the catchment, at the works and within the distribution system. Regular progress reports are received from Scottish Water against the various elements in the Undertaking which can be viewed on the DWQR website.
burncrooksA significant contributor to call volumes was the water quality incident at Burncrooks treatment works in March 2011. The incident is outlined in the Water Treatment Works section of this report and the assessment can be viewed on the DWQR website. The incident generated a number of complaints and enquiries not only from within the directly affected supply zones but also in neighbouring zones as consumers sought clarification of their concerns. The incident generated the most significant element of contacts reporting metallic taste complaints across the country in 2011 and contributed to Burncrooks zone recording the second highest overall contact rate at 276 per 10,000 population, with 785 contacts in total. It also contributed significantly to the total call volumes experienced in the adjacent Burncrooks/Blairlinnans and Milngavie M1 zones.
SpynieIn August 2011, a water quality incident due to bacteriological failures in samples taken from Clarklyhill service reservoir caused a significant degree of consumer concern at Burghead in Moray. The incident necessitated issuing a boil notice to consumers and it also generated a significant level of complaints and enquiries around the health implications of the failures, accounting for almost all the 65 contacts received in this category.
DRINKING WATER QUALITYIN SCOTLAND 2011
1.4.4_ conSuMer contactS to dWQrScottish Water has a responsibility to investigate water quality complaints and supply issues and DWQR guides consumers to report any concerns to Scottish Water in the first instance to enable their investigation and resolution. Where consumers are dissatisfied with Scottish Water’s response, then the DWQR carries out an investigation of the issues.
The DWQR is committed to ensuring consumer complaints are properly investigated and has entered into an agreement with the Scottish Public Services Ombudsman (SPSO) on the arrangements and processes required to provide a fair and transparent assessment of water quality complaints.
table 1.4c shows the various categories of consumer contacts received by the DWQR in 2011. Overall, 153 contacts were received and this is in line with numbers over recent years. 64 contacts raised specific concerns about the quality of public water supplies and again this is a similar level to those received in 2009 and 2010.
Complaints relating to discoloured water and the level of chlorine in the public water supply were the cause of most concern to consumers and this broadly reflects the situation in the records of consumer complaints made directly to Scottish Water.
In DWQR’s 2010 report, we highlighted concern around the need for Scottish Water to be more consistently attentive to gaining a clear understanding of consumer complaints and to maintaining a focus throughout the company to resolving their problems. Whilst there are again examples where the company has clearly pursued the root cause of complaints and gone the extra mile to resolve matters, there are others which continue to highlight issues around:
¡¡ Responsiveness to the consumer issue
¡¡ Quality of investigation into complaints and underlying issues
¡¡ Data quality and transfer of information
¡¡ Internal communications.
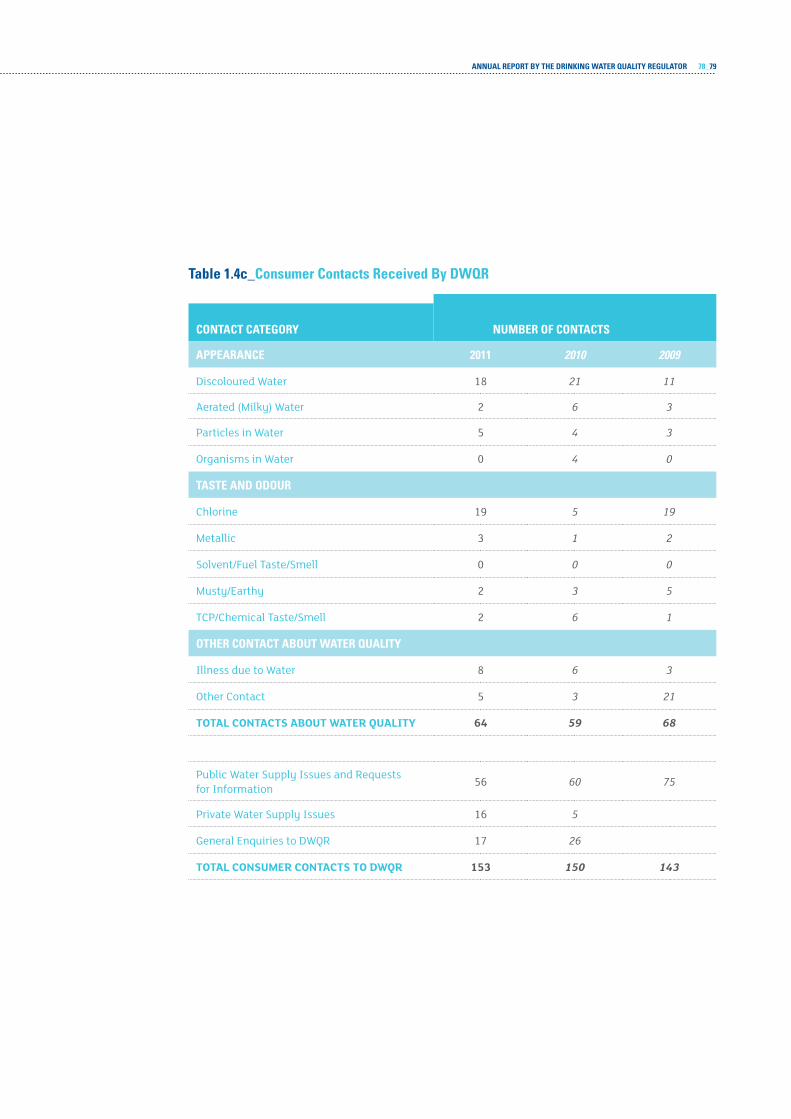
ANNUAL REPORT BY THE DRINKING WATER QUALITY REGULATOR 78_79
Table 1.4c_Consumer Contacts Received By DWQR
NUmBER OF CONTACTSCONTACT CATEGORY
APPEARANCE 2011 2010 2009
Discoloured Water 18 21 11
aerated (Milky) Water 2 6 3
Particles in Water 5 4 3
Organisms in Water 0 4 0
TASTE AND ODOUR
Chlorine 19 5 19
Metallic 3 1 2
Solvent/Fuel taste/Smell 0 0 0
Musty/earthy 2 3 5
tCP/Chemical taste/Smell 2 6 1
OTHER CONTACT ABOUT WATER QUALITY
illness due to Water 8 6 3
Other Contact 5 3 21
total contactS about Water Quality 64 59 68
Public Water Supply issues and requests for information 56 60 75
Private Water Supply issues 16 5
general enquiries to DWQr 17 26
total conSuMer contactS to dWQr 153 150 143
DRINKING WATER QUALITYIN SCOTLAND 2011
1.4.5_ audit and inSpectionThe annual inspection programme for 2011 included an inspection of the way in which Scottish Water handles contacts from consumers. It is important that advice given to consumers is accurate and that concerns about drinking water quality are followed up and dealt with appropriately by the company. Occasionally, a consumer contact may be the first indication of a problem with the water supply and it is vital that such issues are spotted and that they trigger prompt action.
An audit of Scottish Water’s contact centre was carried out in August 2011 in which the use made of corporate systems to record and access information during calls, the reference made to field staff knowledge and call agent experience were addressed. The DWQR is satisfied that Scottish Water is able to deal satisfactorily with consumer telephone calls. Whilst there has been continual improvement in all sections of the audit this year, there remains an opportunity to improve on the overall customer experience through accessibility to better general and area specific information on water quality issues. This is particularly relevant to complaints of discoloured water where agents can struggle to respond adequately to consumer concerns.
The audit findings are published on the DWQR website www.dwqr.org.uk
1.4.6_ eVentS and incidentSIn 2011, 892 events were reported to the DWQR, of which 80 were specifically related to domestic plumbing issues. Consumers can have a direct influence in these cases and failures may reflect the hygienic condition of the kitchen tap when bacteriological samples were taken or may reflect the presence of lead piping in the supply route which is the responsibility of the property owner. Of the 80 events, 35 were bacteriological and 31 were caused by failures of the lead standard.
In 2011, one incident was declared due to domestic plumbing issues. In this case, microbiological failures of samples taken from a property in Lenzie, Kirkintilloch were probably caused by the hygienic condition of the kitchen tap although low chlorine levels in the supply were a secondary factor.
The DWQR also declared an incident for an event concerning highly discoloured water to a property within the Milngavie water supply zone in Glasgow. Whilst it reflects the condition of a water supply main in the zone, the incident illustrated significant failings in Scottish Water’s consumer complaint processes:
ANNUAL REPORT BY THE DRINKING WATER QUALITY REGULATOR 80_81
Maryhill, glasgowAs a result of a complaint of discoloration and taste from a consumer, samples taken from the kitchen tap showed a very high level of iron and manganese in the water supply to the property. Investigations within the neighbourhood found that due to closure of commercial properties, the complainant’s property was the only one drawing its supply from an old cast iron water main and the condition of the main was poor. Following attempts to provide an improved supply by flushing the main, it was decided to provide a new water connection from a different main where these problems would not be present. The new connection work was not completed however, until some 7 months after the initial complaint.
This event was declared as an incident due to the length of time the consumer was without an acceptable water supply and Scottish Water failed in providing adequate control over the process of providing the new water connection to the property. Whilst they did provide an alternative water supply for drinking and cooking in the form of bottled water, this cannot be considered to be acceptable for extended periods and be relied on to accommodate deferred implementation of agreed works. Scottish Water lost sight of the need to adhere to agreed delivery dates and of the overall extended period of inconvenience to this consumer.
One recommendation was made by DWQR in relation to the incident.
1.4.7_ inVeStMent Scottish Water has been directed by Scottish Ministers to undertake a number of different projects to improve and protect drinking water quality across Scotland during the period of 1 April 2010 to 31 March 2015.
During 2011, Scottish Water has undertaken studies to determine the location and number of lead communication pipes in Scottish Water’s ownership. The communication pipe is the name given to that part of the pipe that delivers water from the water main in the road to the property boundary and is connected to what is called the supply pipe which is owned by the property owner and which runs on and into the property itself. These studies should help Scottish Water develop its longer-term strategy to ensure that it complies with the standard for lead which will reduce from its current level of 25 µg/l at present to 10 µg/l from the end of 2013.
In the short term, during 2011, Scottish Water investigated seven water supply zones for the presence of lead communication pipes. Where there was no lead present, no action was taken but where lead was found, these pipes would be replaced with plastic pipes.
As already referred to in the water treatment section of this report, Scottish Water improved the control of disinfection at four water treatment works during 2011. This work should improve the consistency of chlorine dosing, making the taste and odour of the water being supplied from these works more acceptable to consumers.
DRINKING WATER QUALITYIN SCOTLAND 2011
2_ PRIvATE WATER SUPPLIES
Private water supplies are regulated by local authorities and are the responsibility of their owners and users.

ANNUAL REPORT BY THE DRINKING WATER QUALITY REGULATOR 82_83
Private water supplies (PWS) are drinking water supplies which are not provided by Scottish Water as part of their core function and are the responsibility of the owners and users of the supplies. For the purposes of The Private Water Supplies (Scotland) Regulations 2006 (the 2006 Regulations) supplies are classified as either Type A or Type B supplies. Type A supplies are those which supply 50 or more people, produce 10 cubic metres a day or more of water or supply a commercial or public activity. Type B supplies are all other domestic supplies.
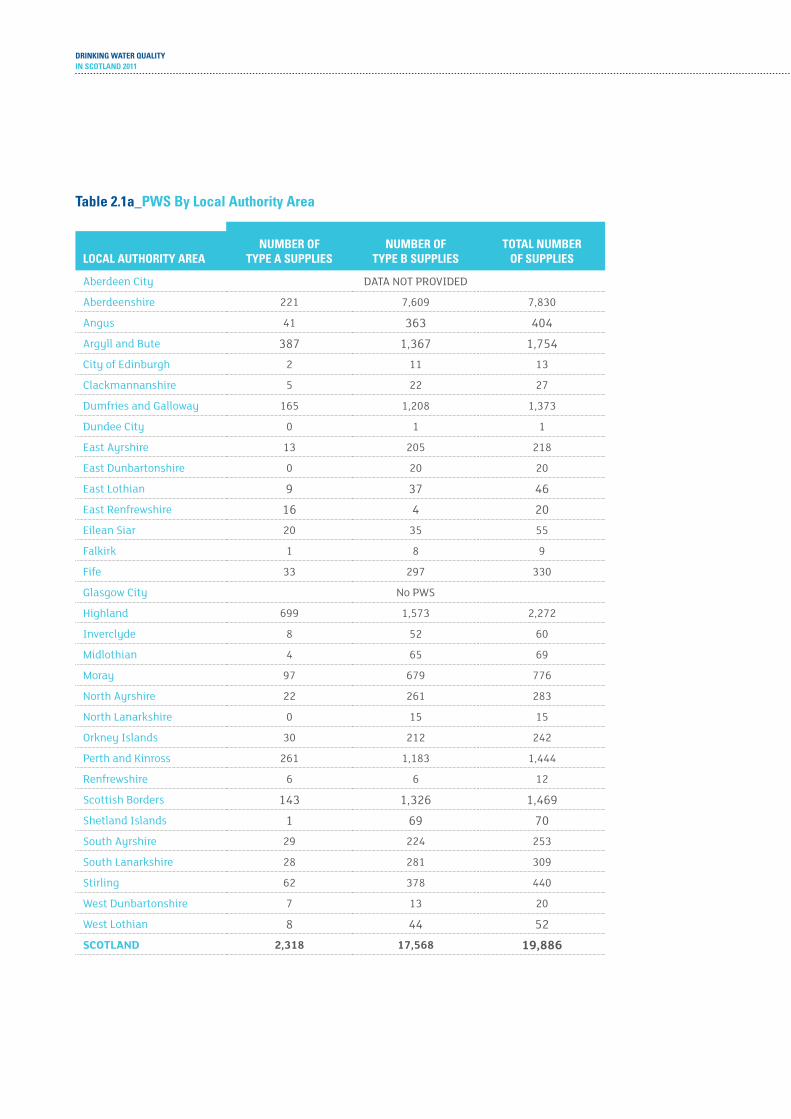
DRINKING WATER QUALITYIN SCOTLAND 2011
Table 2.1a_PWS By Local Authority Area
LOCAL AUTHORITY AREANUmBER OF
TYPE A SUPPLIESNUmBER OF
TYPE B SUPPLIESTOTAL NUmBER
OF SUPPLIES
aberdeen City Data nOt PrOViDeD
aberdeenshire 221 7,609 7,830
angus 41 363 404argyll and Bute 387 1,367 1,754City of edinburgh 2 11 13
Clackmannanshire 5 22 27
Dumfries and galloway 165 1,208 1,373
Dundee City 0 1 1
east ayrshire 13 205 218
east Dunbartonshire 0 20 20
east Lothian 9 37 46east renfrewshire 16 4 20eilean Siar 20 35 55
Falkirk 1 8 9
Fife 33 297 330
glasgow City no PWS
Highland 699 1,573 2,272
inverclyde 8 52 60
Midlothian 4 65 69
Moray 97 679 776
north ayrshire 22 261 283
north Lanarkshire 0 15 15
Orkney islands 30 212 242
Perth and kinross 261 1,183 1,444
renfrewshire 6 6 12
Scottish Borders 143 1,326 1,469Shetland islands 1 69 70South ayrshire 29 224 253
South Lanarkshire 28 281 309
Stirling 62 378 440
West Dunbartonshire 7 13 20
West Lothian 8 44 52Scotland 2,318 17,568 19,886
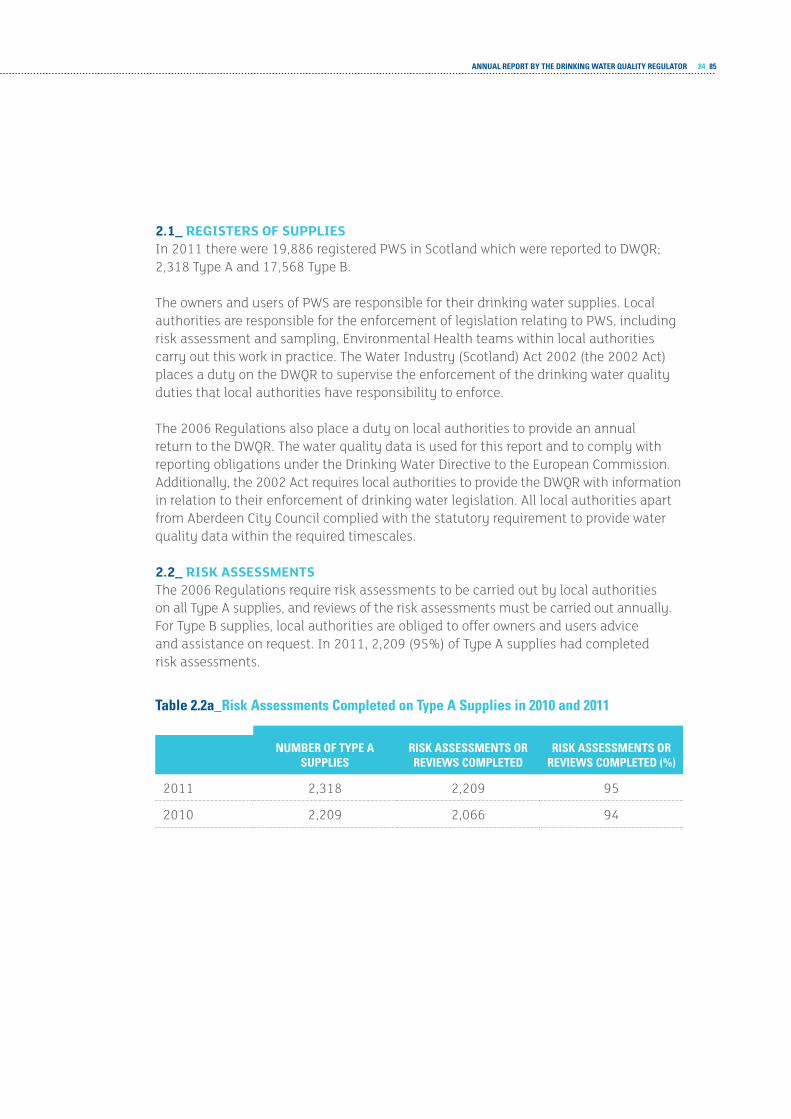
ANNUAL REPORT BY THE DRINKING WATER QUALITY REGULATOR 84_85
2.1_ regiSterS of SupplieSIn 2011 there were 19,886 registered PWS in Scotland which were reported to DWQR; 2,318 Type A and 17,568 Type B.
The owners and users of PWS are responsible for their drinking water supplies. Local authorities are responsible for the enforcement of legislation relating to PWS, including risk assessment and sampling, Environmental Health teams within local authorities carry out this work in practice. The Water Industry (Scotland) Act 2002 (the 2002 Act) places a duty on the DWQR to supervise the enforcement of the drinking water quality duties that local authorities have responsibility to enforce.
The 2006 Regulations also place a duty on local authorities to provide an annual return to the DWQR. The water quality data is used for this report and to comply with reporting obligations under the Drinking Water Directive to the European Commission. Additionally, the 2002 Act requires local authorities to provide the DWQR with information in relation to their enforcement of drinking water legislation. All local authorities apart from Aberdeen City Council complied with the statutory requirement to provide water quality data within the required timescales.
2.2_ riSk aSSeSSMentS The 2006 Regulations require risk assessments to be carried out by local authorities on all Type A supplies, and reviews of the risk assessments must be carried out annually. For Type B supplies, local authorities are obliged to offer owners and users advice and assistance on request. In 2011, 2,209 (95%) of Type A supplies had completed risk assessments.
Table 2.2a_Risk Assessments Completed on Type A Supplies in 2010 and 2011
NUmBER OF TYPE A SUPPLIES
RISK ASSESSmENTS OR REvIEWS COmPLETED
RISK ASSESSmENTS OR REvIEWS COmPLETED (%)
2011 2,318 2,209 95
2010 2,209 2,066 94
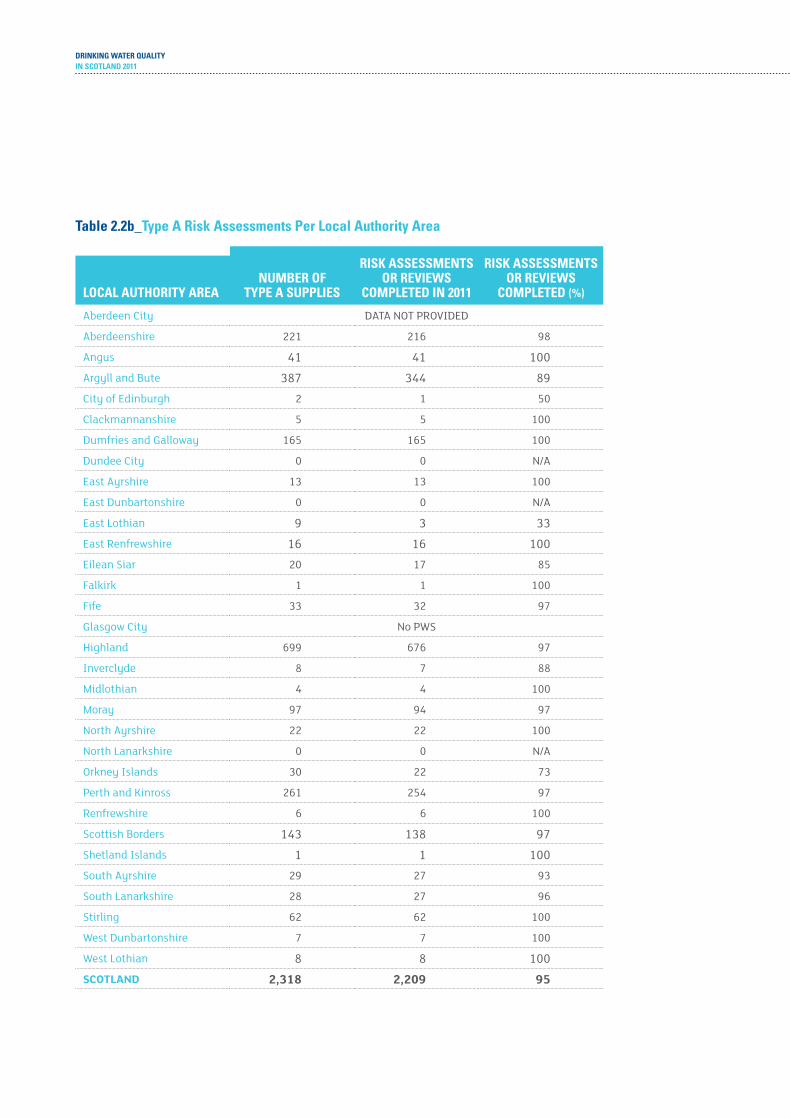
DRINKING WATER QUALITYIN SCOTLAND 2011
Table 2.2b_Type A Risk Assessments Per Local Authority Area
NUmBER OF TYPE A SUPPLIES
RISK ASSESSmENTS OR REvIEWS
COmPLETED IN 2011
RISK ASSESSmENTS OR REvIEWS
COmPLETED (%)LOCAL AUTHORITY AREA
aberdeen City Data nOt PrOViDeD
aberdeenshire 221 216 98
angus 41 41 100argyll and Bute 387 344 89City of edinburgh 2 1 50
Clackmannanshire 5 5 100
Dumfries and galloway 165 165 100
Dundee City 0 0 n/a
east ayrshire 13 13 100
east Dunbartonshire 0 0 n/a
east Lothian 9 3 33east renfrewshire 16 16 100eilean Siar 20 17 85
Falkirk 1 1 100
Fife 33 32 97
glasgow City no PWS
Highland 699 676 97
inverclyde 8 7 88
Midlothian 4 4 100
Moray 97 94 97
north ayrshire 22 22 100
north Lanarkshire 0 0 n/a
Orkney islands 30 22 73
Perth and kinross 261 254 97
renfrewshire 6 6 100
Scottish Borders 143 138 97Shetland islands 1 1 100South ayrshire 29 27 93
South Lanarkshire 28 27 96
Stirling 62 62 100
West Dunbartonshire 7 7 100
West Lothian 8 8 100Scotland 2,318 2,209 95

ANNUAL REPORT BY THE DRINKING WATER QUALITY REGULATOR 86_87
2.3_ Water Quality of pWS in ScotlandLocal authorities are responsible for the sampling and analysis of PWS in accordance with the 2006 Regulations. Requirements can vary depending on the classification of the supply (i.e. whether it is Type A or Type B), the size of the supply and the results of risk assessments.
Type A supplies are subject to the requirements of European Directive 98/83/EC (the Drinking Water Directive), which is reflected in the requirements of the 2006 Regulations. These supplies must be sampled at least annually for microbiological and chemical parameters which are set out in the 2006 Regulations.
Check monitoring, as set out in Schedule 2, Table A of the 2006 Regulations, is required for all Type A supplies, and is intended to monitor the microbiological quality of the water as well as the organoleptic quality, i.e. its taste and appearance. Audit monitoring, in Schedule 2, Table B of the 2006 Regulations, covers a wide range of different chemical and also some microbiological parameters. Analysis can have financial implications for owners and users of supplies and to minimise costs the 2006 Regulations allow this monitoring to be based on the findings of risk assessments carried out on individual supplies, or based on previous analysis of the supply.
The 2006 Regulations require Type B monitoring to be carried out at the request of owners or users of the supplies, against a smaller suite of national parameters.
LaBOratOrY anaLYSiS OF Water SaMPLeS

DRINKING WATER QUALITYIN SCOTLAND 2011
In 2011 a total of 53,505 tests were carried out on samples taken for the purposes of the 2006 Regulations. table 2.3a shows a summary of compliance of the tests for regulatory samples across Scotland.
Table 2.3a_Summary of Compliance of Type A Regulatory PWS Samples and Type B Samples
PARAmETER NAmETOTAL NUmBER
OF TESTSTOTAL NUmBER
OF FAILSOvERALL COmPLIANCE
(%)
Coliform Bacteria 3,253 1,114 65.75
E. coli 3,246 583 82.04
Colour 1,965 411 79.08
turbidity 2,906 94 96.77
Hydrogen ion (pH) 3,216 700 78.23
aluminium 665 28 95.79
iron 1,621 195 87.97
Manganese 1,438 117 91.86
Lead (25) 2,060 131 93.64
total trihalomethanes 53 4 92.45
Other Parameters 33,082 1,151 96.52
all teStS 53,505 4,528 91.54

ANNUAL REPORT BY THE DRINKING WATER QUALITY REGULATOR 88_89
figure 2.3a shows the proportion of failing parameters on Type A and Type B PWS across Scotland. Compliance with the Coliform bacteria standard was lowest, with 29.29% of Type A and 41.62% of Type B supplies failing the standard. Failures of the Coliform bacteria standard do not necessarily indicate that there is risk to health but indicate that there is no disinfection, that disinfection has been compromised or that there has been contamination of a disinfected supply.
Figure 2.3a_Proportion of Failing Parameters on All PWS
25% COLIFORM BACTERIA
25% E. COLI
13% COLOUR
9% TURBIDITY
2.0% HYDROGEN ION (pH)
15% ALUMINIUM
1% IRON
4.0% MANGANESE
3.0% LEAD (25)
3.0% OTHER PARAMETERS
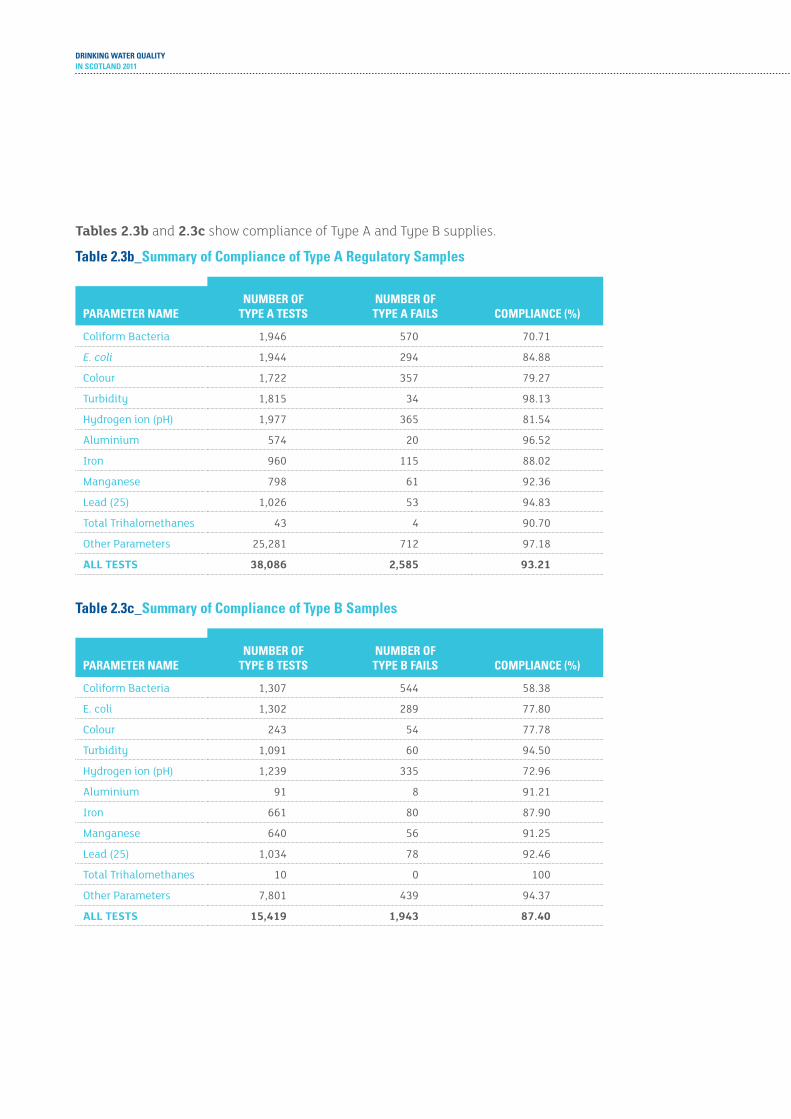
DRINKING WATER QUALITYIN SCOTLAND 2011
tables 2.3b and 2.3c show compliance of Type A and Type B supplies.
Table 2.3b_Summary of Compliance of Type A Regulatory Samples
PARAmETER NAmENUmBER OF
TYPE A TESTSNUmBER OF TYPE A FAILS COmPLIANCE (%)
Coliform Bacteria 1,946 570 70.71
E. coli 1,944 294 84.88
Colour 1,722 357 79.27
turbidity 1,815 34 98.13
Hydrogen ion (pH) 1,977 365 81.54
aluminium 574 20 96.52
iron 960 115 88.02
Manganese 798 61 92.36
Lead (25) 1,026 53 94.83
total trihalomethanes 43 4 90.70
Other Parameters 25,281 712 97.18
all teStS 38,086 2,585 93.21
Table 2.3c_Summary of Compliance of Type B Samples
PARAmETER NAmENUmBER OF
TYPE B TESTSNUmBER OF TYPE B FAILS COmPLIANCE (%)
Coliform Bacteria 1,307 544 58.38
e. coli 1,302 289 77.80
Colour 243 54 77.78
turbidity 1,091 60 94.50
Hydrogen ion (pH) 1,239 335 72.96
aluminium 91 8 91.21
iron 661 80 87.90
Manganese 640 56 91.25
Lead (25) 1,034 78 92.46
total trihalomethanes 10 0 100
Other Parameters 7,801 439 94.37
all teStS 15,419 1,943 87.40
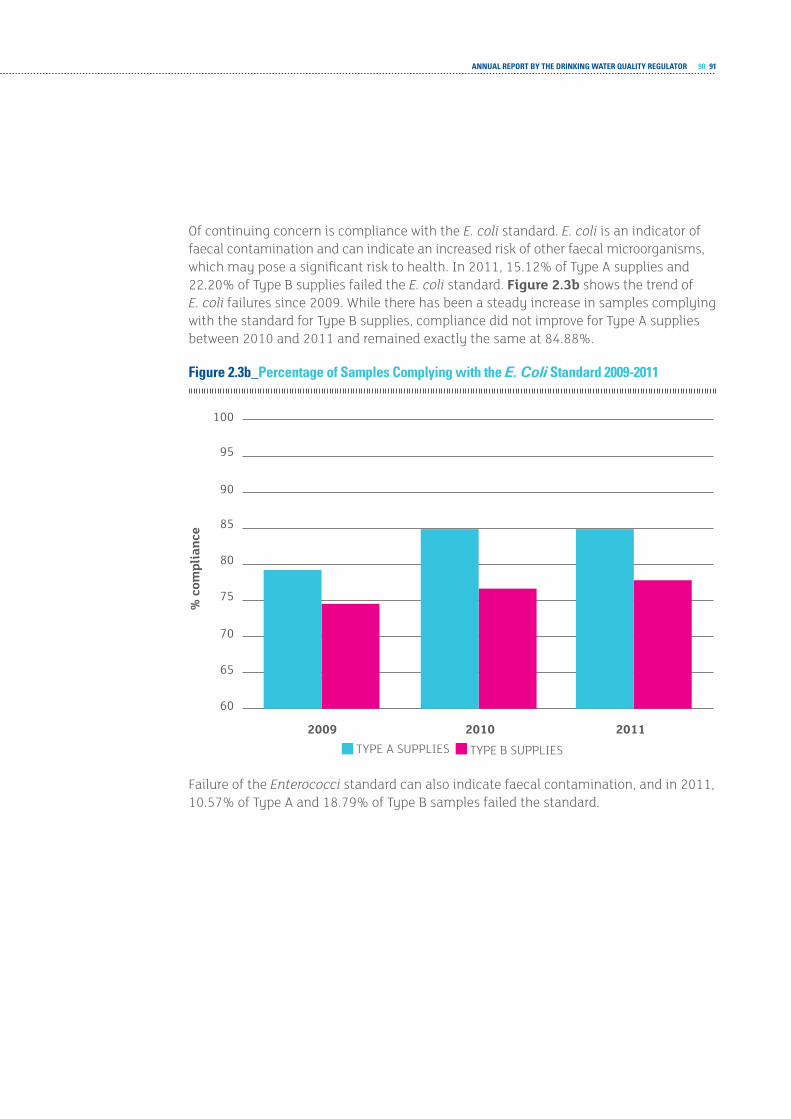
ANNUAL REPORT BY THE DRINKING WATER QUALITY REGULATOR 90_91
Of continuing concern is compliance with the E. coli standard. E. coli is an indicator of faecal contamination and can indicate an increased risk of other faecal microorganisms, which may pose a significant risk to health. In 2011, 15.12% of Type A supplies and 22.20% of Type B supplies failed the E. coli standard. figure 2.3b shows the trend of E. coli failures since 2009. While there has been a steady increase in samples complying with the standard for Type B supplies, compliance did not improve for Type A supplies between 2010 and 2011 and remained exactly the same at 84.88%.
Figure 2.3b_Percentage of Samples Complying with the E. Coli Standard 2009-2011
60
65
70
75
80
85
90
95
100
201120102009
% c
ompl
ianc
e
TYPE A SUPPLIES TYPE B SUPPLIES
Failure of the Enterococci standard can also indicate faecal contamination, and in 2011, 10.57% of Type A and 18.79% of Type B samples failed the standard.
DRINKING WATER QUALITYIN SCOTLAND 2011
appropriate operation and maintenance of water
treatment is essential.
It is critical for health protection that where risk assessment or analytical results show that there is a risk from diffuse pollution, catchments and sources of drinking water supplies should be protected from potential sources of faecal contamination such as farm animals, sewage or septic tank discharges and slurry spreading. Where there are concerns about the pollution of drinking water sources, this should be reported to the Scottish Environment Protection Agency (SEPA). Adequate treatment, including disinfection, should be installed. All PWS owners and users in Scotland are entitled to apply for a non-means tested grant to improve their PWS. It is critical, however, that treatment is correctly designed and installed, and is then adequately maintained in line with the manufacturer’s recommendations. Failure to do so can lead to ineffective treatment and drinking water which is potentially harmful to health.
In 2011 there were significant numbers of PWS which failed microbiological parameters despite apparently having disinfection, and the DWQR will investigate this theme further in 2012.
Colour continues to be an issue with PWS, with 20.73% of Type A and 22.22% of Type B samples failing the standard. Colour in drinking water supplies is often caused by naturally occurring organic matter in the water supply’s catchment. It can make water visually unappealing and can also interfere with the disinfection systems most commonly used in PWS treatment, ultraviolet (UV) light and chlorination. Elevated levels of colour in the presence of chlorine can lead to the generation of Trihalomethanes (THM), as discussed below. Colour absorbs UV radiation, thereby reducing the levels of UV available for the safe inactivation of potentially harmful microbiological organisms.
In 2011, there were 149 supplies with disinfection which failed the E. coli standard. Of these samples, 61, or 41%, also failed the colour standard. When broken down into Type A and Type B samples, 51% of Type A and 11% of Type B samples failing on E. coli also failed on colour. It is important that the water quality and the volume of water to be treated is very carefully considered over a reasonable period of time when owners and users of PWS are installing water treatment, and professional advice should be sought on this matter. Additionally, UV systems should be cleaned regularly, in accordance with manufacturer and installer’s advice. Colour of surface water will naturally change under different weather conditions, as will demand for flow, and the treatment should have sufficient design capacity to ensure a safe supply of drinking water at all times.
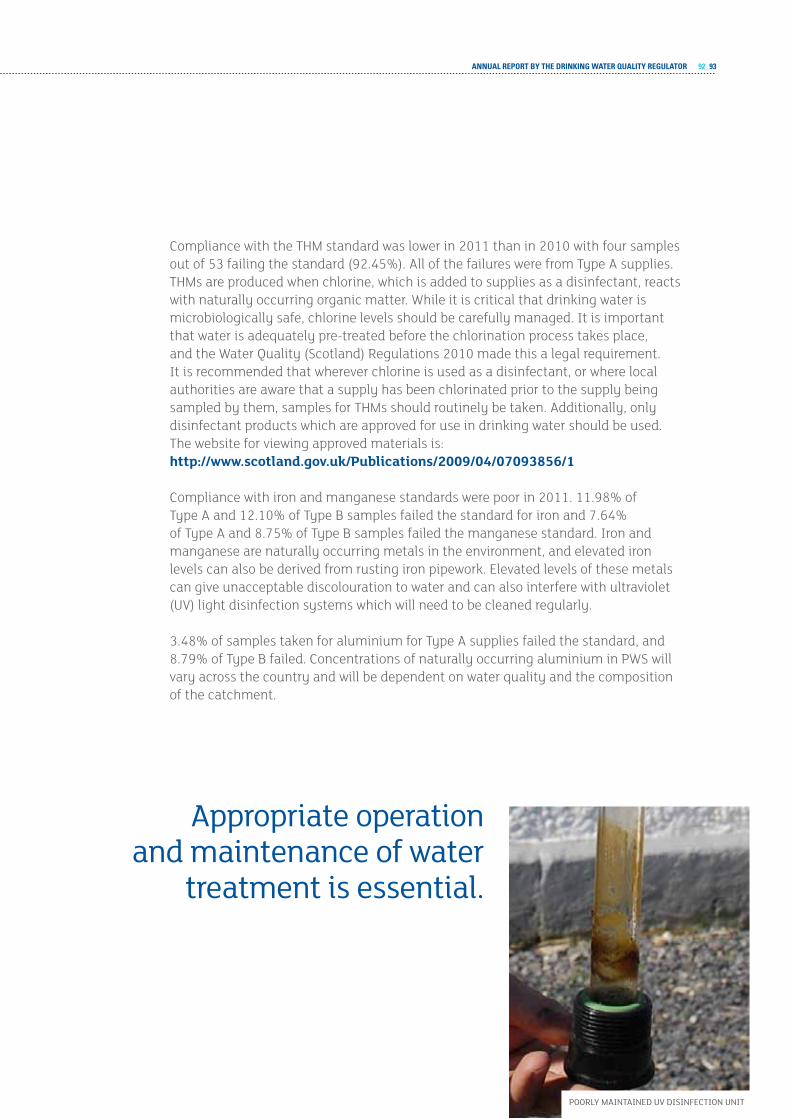
ANNUAL REPORT BY THE DRINKING WATER QUALITY REGULATOR 92_93
Compliance with the THM standard was lower in 2011 than in 2010 with four samples out of 53 failing the standard (92.45%). All of the failures were from Type A supplies. THMs are produced when chlorine, which is added to supplies as a disinfectant, reacts with naturally occurring organic matter. While it is critical that drinking water is microbiologically safe, chlorine levels should be carefully managed. It is important that water is adequately pre-treated before the chlorination process takes place, and the Water Quality (Scotland) Regulations 2010 made this a legal requirement. It is recommended that wherever chlorine is used as a disinfectant, or where local authorities are aware that a supply has been chlorinated prior to the supply being sampled by them, samples for THMs should routinely be taken. Additionally, only disinfectant products which are approved for use in drinking water should be used. The website for viewing approved materials is:http://www.scotland.gov.uk/publications/2009/04/07093856/1
Compliance with iron and manganese standards were poor in 2011. 11.98% of Type A and 12.10% of Type B samples failed the standard for iron and 7.64% of Type A and 8.75% of Type B samples failed the manganese standard. Iron and manganese are naturally occurring metals in the environment, and elevated iron levels can also be derived from rusting iron pipework. Elevated levels of these metals can give unacceptable discolouration to water and can also interfere with ultraviolet (UV) light disinfection systems which will need to be cleaned regularly.
3.48% of samples taken for aluminium for Type A supplies failed the standard, and 8.79% of Type B failed. Concentrations of naturally occurring aluminium in PWS will vary across the country and will be dependent on water quality and the composition of the catchment.
appropriate operation and maintenance of water
treatment is essential.
POOrLY MaintaineD UV DiSinFeCtiOn Unit
DRINKING WATER QUALITYIN SCOTLAND 2011
Compliance with the pH standard was poor, with 21.78% of samples failing the standards. 18.46% of Type A and 27.04% of Type B samples failed. While failures of pH standards may not necessarily cause health problems, they do increase the solubility of metals used in plumbing materials in drinking water. For example, there were 271 failures of the copper standard in 2011, and of these, 26.20% also failed pH standards.
Lead continues to be an issue with some PWS, with 6.35% of all samples taken failing the standard. 5.17% of Type A samples failed, and 7.54% of Type B. Lead is dissolved into water from lead pipes, and it is advised that lead pipes in contact with drinking water should be replaced wherever possible. The standard for lead across Europe will tighten from 25µ/l to 10µg/l at the end of 2013, and based on the figures for 2011, the number of failures would almost double from 6.35% to 11.98%.
2.4_ grantSLocal authorities continued to promote and administer the grants system for improvements to PWS on behalf of Scottish Ministers in 2011. Non means tested grants of up to £800 are available for all PWS, and owners and users of PWS should contact their local authority’s environmental health department for details of how to apply for a grant.
In the 2011-2012 financial year, £2.1 million of grants were awarded for PWS improvements. It is very important that when supplies are improved that they are adequately maintained.
Protection of drinking water catchments is critical.
ANNUAL REPORT BY THE DRINKING WATER QUALITY REGULATOR 94_95
2.5_ Water Safety planSInternationally it is recognised that PWS present a greater risk to health than those operated and managed by water utility companies, as they are more likely to be contaminated and are less likely to be managed and understood. The World Health Organisation (WHO) promotes Water Safety Plans (WSP), which are source to tap risk assessment and risk management plans, as the most effective method of managing drinking water supplies. Scotland continued to be an active member of the WHO’s Small Community Water Supplies Management Network and contributed to their manual on Water Safety Plans for small supplies which is due to be published in 2012.
The DWQR continued to promote the use of WSP with PWS in 2011. A number of benefits have been realised to date, namely a better understanding of water supply systems and the risks associated with them and the development of operational and maintenance plans and procedures. Angus and Orkney Councils have been particularly proactive in the promotion of WSP.
The DWQR was invited to participate in a project forming part of a United Nations/WHO Protocol on Water and Health, dealing specifically with small drinking water supplies and attended the first meeting of the group in Berlin in 2011. DWQR has been the lead author for the draft report on WSP and monitoring of supplies, and has contributed to sections on financial incentives and raising awareness of risk from small supplies.
The DWQR was invited to participate in a report by the European Commission on risk assessment of small supplies, hosted a meeting for the Commission in 2011 and contributed to the final report.
The DWQR continues to work with colleagues in Malawi on the mutual exchange of technical advice and promotion of Water Safety Plans for small community supplies. In 2011 the DWQR was represented at the Scotland Malawi Partnership’s annual conference and gave a presentation on behalf of the DWQR and Malawi’s Ministry of Agriculture, Irrigation and Water Development.

DRINKING WATER QUALITYIN SCOTLAND 2011
3_ DRINKING WATER QUALITY BY LOCAL AUTHORITY

ANNUAL REPORT BY THE DRINKING WATER QUALITY REGULATOR 96_97
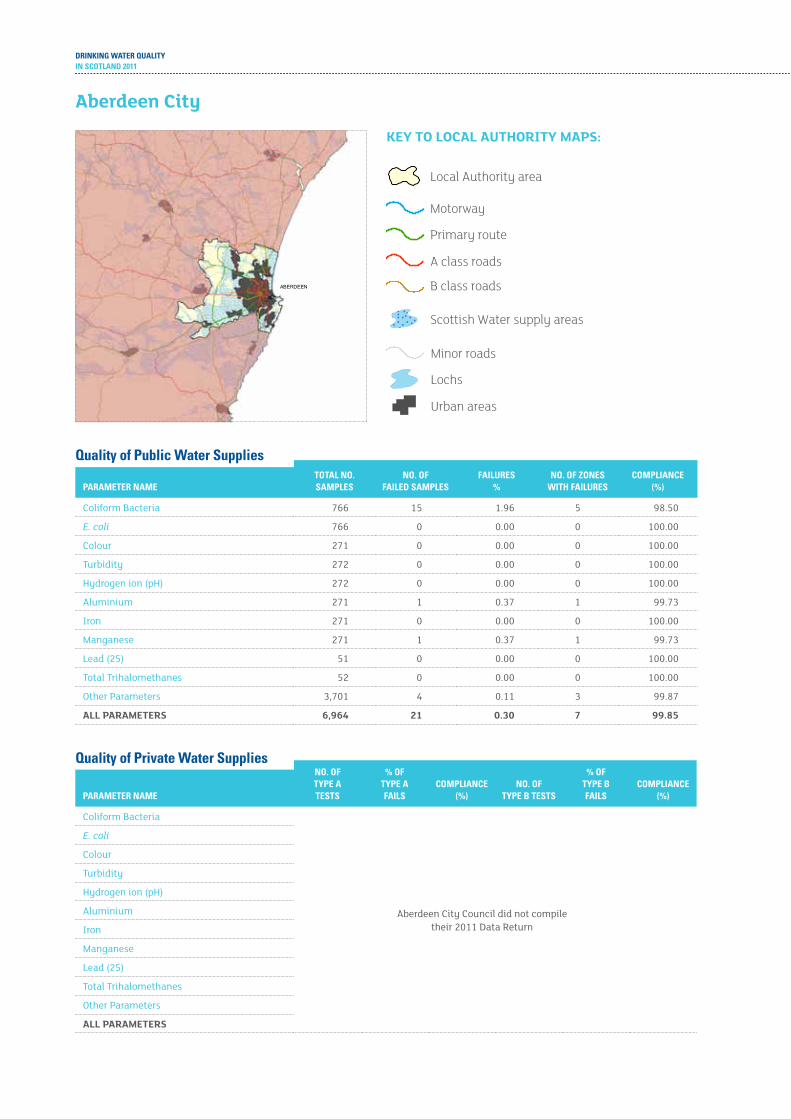
DRINKING WATER QUALITYIN SCOTLAND 2011
ABERDEEN
Quality of Public Water SuppliesTOTAL NO. SAmPLES
NO. OF FAILED SAmPLES
FAILURES %
NO. OF zONES WITH FAILURES
COmPLIANCE (%)PARAmETER NAmE
Coliform Bacteria 766 15 1.96 5 98.50
E. coli 766 0 0.00 0 100.00
Colour 271 0 0.00 0 100.00
turbidity 272 0 0.00 0 100.00
Hydrogen ion (pH) 272 0 0.00 0 100.00
aluminium 271 1 0.37 1 99.73
iron 271 0 0.00 0 100.00
Manganese 271 1 0.37 1 99.73
Lead (25) 51 0 0.00 0 100.00
total trihalomethanes 52 0 0.00 0 100.00
Other Parameters 3,701 4 0.11 3 99.87
all paraMeterS 6,964 21 0.30 7 99.85
Quality of Private Water SuppliesNO. OF TYPE A TESTS
% OF TYPE A FAILS
COmPLIANCE (%)
NO. OF TYPE B TESTS
% OF TYPE B FAILS
COmPLIANCE (%)PARAmETER NAmE
Coliform Bacteria
aberdeen City Council did not compiletheir 2011 Data return
E. coli
Colour
turbidity
Hydrogen ion (pH)
aluminium
iron
Manganese
Lead (25)
total trihalomethanes
Other Parameters
all paraMeterS
aberdeen city
Scottish Water supply areas
Urban areas
Lochs
Minor roads
Motorway
Primary route
A class roads
B class roads
Local Authority area
key to local authority MapS:

ANNUAL REPORT BY THE DRINKING WATER QUALITY REGULATOR 98_99
FORFAR
MONTROSE
ABERDEEN
PETERHEAD
ELGIN
FRASERBURGH
TURRIFF
Quality of Public Water SuppliesTOTAL NO. SAmPLES
NO. OF FAILED SAmPLES
FAILURES %
NO. OF zONES WITH FAILURES
COmPLIANCE (%)PARAmETER NAmE
Coliform Bacteria 1,411 17 1.20 7 99.03
E. coli 1,411 1 0.07 1 99.58
Colour 497 0 0.00 0 100.00
turbidity 498 0 0.00 0 100.00
Hydrogen ion (pH) 498 0 0.00 0 100.00
aluminium 499 1 0.20 1 99.90
iron 499 7 1.40 3 98.62
Manganese 499 1 0.20 1 99.90
Lead (25) 126 1 0.79 1 99.38
total trihalomethanes 127 0 0.00 0 100.00
Other Parameters 7,349 7 0.10 5 99.93
all paraMeterS 13,414 35 0.26 13 99.87
Quality of Private Water SuppliesNO. OF TYPE A TESTS
% OF TYPE A FAILS
COmPLIANCE (%)
NO. OF TYPE B TESTS
% OF TYPE B FAILS
COmPLIANCE (%)PARAmETER NAmE
Coliform Bacteria 203 27.59 72.41 486 39.51 60.49
E. coli 203 5.91 94.09 484 12.40 87.60
Colour 179 1.12 98.88 21 4.76 95.24
turbidity 200 2.00 98.00 413 3.87 96.13
Hydrogen ion (pH) 203 21.18 78.82 502 29.88 70.12
aluminium 0 - - 5 80.00 20.00
iron 200 3.00 97.00 417 6.47 93.53
Manganese 200 4.00 96.00 420 5.48 94.52
Lead (25) 201 4.98 95.02 422 4.98 95.02
total trihalomethanes 1 100 0.00 0 - -
Other Parameters 5,013 4.25 95.75 2,394 7.56 92.44
all paraMeterS 6,603 5.38 94.62 5,564 12.13 87.87
aberdeenshire
Scottish Water supply areas
Urban areas
Lochs
Minor roads
Motorway
Primary route
A class roads
B class roads
Local Authority area
key to local authority MapS:
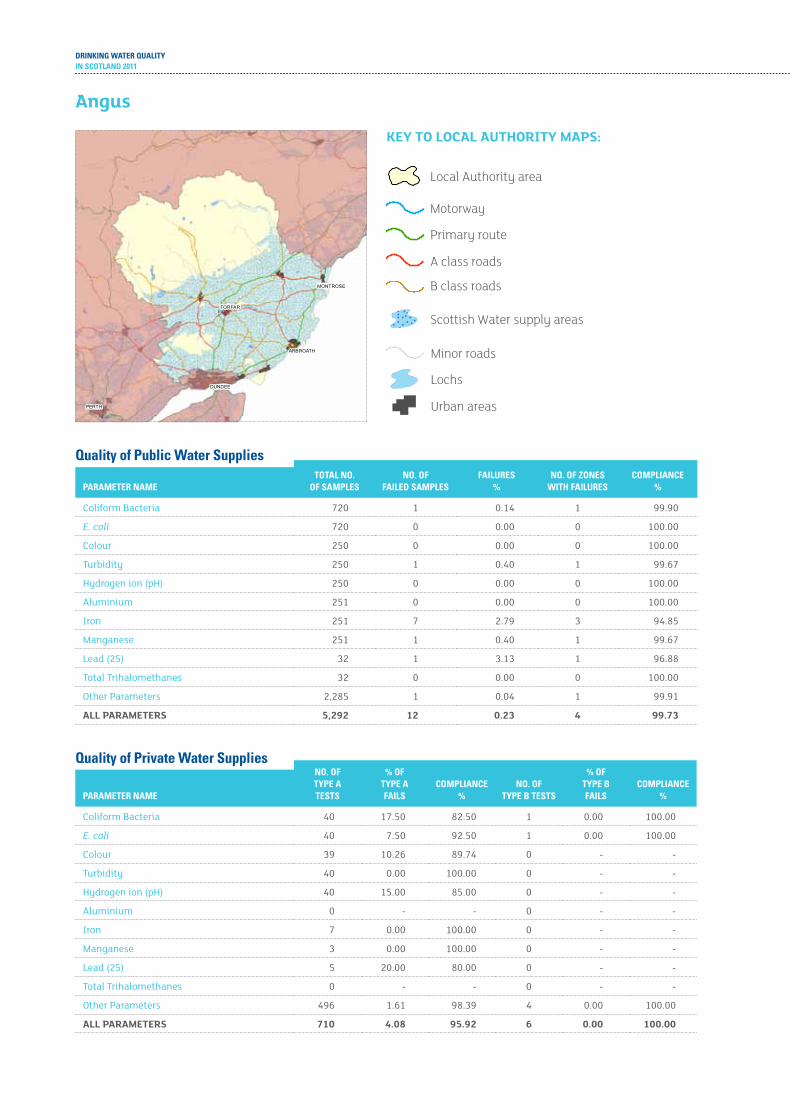
DRINKING WATER QUALITYIN SCOTLAND 2011
PERTH
DUNDEE
ARBROATH
FORFAR
MONTROSE
Quality of Public Water SuppliesTOTAL NO.
OF SAmPLESNO. OF
FAILED SAmPLESFAILURES
%NO. OF zONES
WITH FAILURESCOmPLIANCE
%PARAmETER NAmE
Coliform Bacteria 720 1 0.14 1 99.90
E. coli 720 0 0.00 0 100.00
Colour 250 0 0.00 0 100.00
turbidity 250 1 0.40 1 99.67
Hydrogen ion (pH) 250 0 0.00 0 100.00
aluminium 251 0 0.00 0 100.00
iron 251 7 2.79 3 94.85
Manganese 251 1 0.40 1 99.67
Lead (25) 32 1 3.13 1 96.88
total trihalomethanes 32 0 0.00 0 100.00
Other Parameters 2,285 1 0.04 1 99.91
all paraMeterS 5,292 12 0.23 4 99.73
Quality of Private Water SuppliesNO. OF TYPE A TESTS
% OF TYPE A FAILS
COmPLIANCE %
NO. OF TYPE B TESTS
% OF TYPE B FAILS
COmPLIANCE %PARAmETER NAmE
Coliform Bacteria 40 17.50 82.50 1 0.00 100.00
E. coli 40 7.50 92.50 1 0.00 100.00
Colour 39 10.26 89.74 0 - -
turbidity 40 0.00 100.00 0 - -
Hydrogen ion (pH) 40 15.00 85.00 0 - -
aluminium 0 - - 0 - -
iron 7 0.00 100.00 0 - -
Manganese 3 0.00 100.00 0 - -
Lead (25) 5 20.00 80.00 0 - -
total trihalomethanes 0 - - 0 - -
Other Parameters 496 1.61 98.39 4 0.00 100.00
all paraMeterS 710 4.08 95.92 6 0.00 100.00
angus
Scottish Water supply areas
Urban areas
Lochs
Minor roads
Motorway
Primary route
A class roads
B class roads
Local Authority area
key to local authority MapS:

ANNUAL REPORT BY THE DRINKING WATER QUALITY REGULATOR 100_101
CAMPBELTOWNAYR
IRVINE KILMARNOCK
PAISLEY
GREENOCK
OBAN
TOBERMORY
PORT ELLEN
Quality of Public Water SuppliesTOTAL NO.
OF SAmPLESNO. OF
FAILED SAmPLESFAILURES
(%)NO. OF zONES
WITH FAILURESCOmPLIANCE
%PARAmETER NAmE
Coliform Bacteria 590 5 0.85 5 99.29
E. coli 590 0 0.00 0 100.00
Colour 242 0 0.00 0 100.00
turbidity 243 0 0.00 0 100.00
Hydrogen ion (pH) 243 0 0.00 0 100.00
aluminium 241 0 0.00 0 100.00
iron 241 1 0.41 1 98.61
Manganese 241 2 0.83 1 99.77
Lead (25) 148 0 0.00 0 100.00
total trihalomethanes 150 7 4.67 2 95.14
Other Parameters 5,634 0 0.00 0 100.00
all paraMeterS 8,563 15 0.18 8 99.84
Quality of Private Water SuppliesNO. OF TYPE A TESTS
% OF TYPE A FAILS
COmPLIANCE %
NO. OF TYPE B TESTS
% OF TYPE B FAILS
COmPLIANCE %PARAmETER NAmE
Coliform Bacteria 263 38.02 61.98 106 43.40 56.60
E. coli 265 23.02 76.98 106 26.42 73.58
Colour 205 32.68 67.32 19 52.63 47.37
turbidity 218 4.59 95.41 102 5.88 94.12
Hydrogen ion (pH) 363 13.77 86.23 130 16.15 83.85
aluminium 309 4.53 95.47 37 2.70 97.30
iron 330 18.48 81.52 90 27.78 72.22
Manganese 312 6.41 93.59 90 16.67 83.33
Lead (25) 316 4.75 95.25 127 10.24 89.76
total trihalomethanes 10 10.00 90.00 2 0.00 100.00
Other Parameters 5,993 2.00 98.00 1,003 4.19 95.81
all paraMeterS 8,584 6.05 93.95 1,812 11.42 88.58
argyll and bute
Scottish Water supply areas
Urban areas
Lochs
Minor roads
Motorway
Primary route
A class roads
B class roads
Local Authority area
key to local authority MapS:
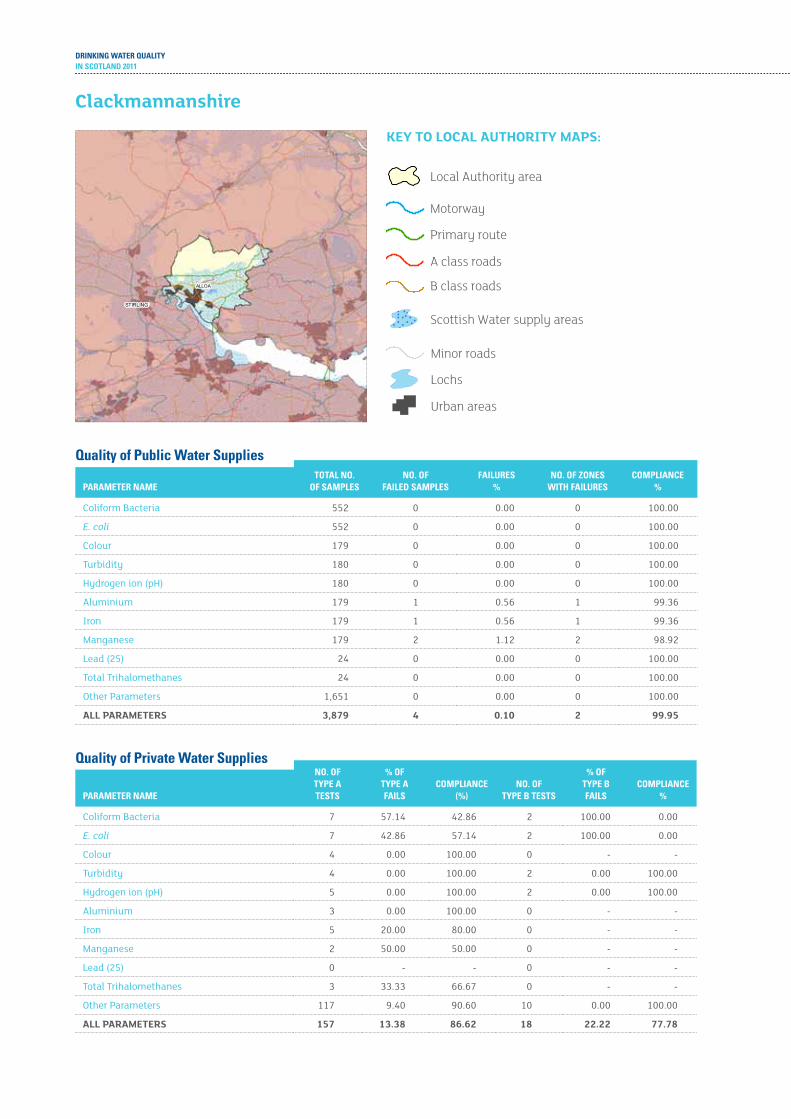
DRINKING WATER QUALITYIN SCOTLAND 2011
STIRLING
ALLOA
Quality of Public Water SuppliesTOTAL NO.
OF SAmPLESNO. OF
FAILED SAmPLESFAILURES
%NO. OF zONES
WITH FAILURESCOmPLIANCE
%PARAmETER NAmE
Coliform Bacteria 552 0 0.00 0 100.00
E. coli 552 0 0.00 0 100.00
Colour 179 0 0.00 0 100.00
turbidity 180 0 0.00 0 100.00
Hydrogen ion (pH) 180 0 0.00 0 100.00
aluminium 179 1 0.56 1 99.36
iron 179 1 0.56 1 99.36
Manganese 179 2 1.12 2 98.92
Lead (25) 24 0 0.00 0 100.00
total trihalomethanes 24 0 0.00 0 100.00
Other Parameters 1,651 0 0.00 0 100.00
all paraMeterS 3,879 4 0.10 2 99.95
Quality of Private Water SuppliesNO. OF TYPE A TESTS
% OF TYPE A FAILS
COmPLIANCE (%)
NO. OF TYPE B TESTS
% OF TYPE B FAILS
COmPLIANCE %PARAmETER NAmE
Coliform Bacteria 7 57.14 42.86 2 100.00 0.00
E. coli 7 42.86 57.14 2 100.00 0.00
Colour 4 0.00 100.00 0 - -
turbidity 4 0.00 100.00 2 0.00 100.00
Hydrogen ion (pH) 5 0.00 100.00 2 0.00 100.00
aluminium 3 0.00 100.00 0 - -
iron 5 20.00 80.00 0 - -
Manganese 2 50.00 50.00 0 - -
Lead (25) 0 - - 0 - -
total trihalomethanes 3 33.33 66.67 0 - -
Other Parameters 117 9.40 90.60 10 0.00 100.00
all paraMeterS 157 13.38 86.62 18 22.22 77.78
clackmannanshire
Scottish Water supply areas
Urban areas
Lochs
Minor roads
Motorway
Primary route
A class roads
B class roads
Local Authority area
key to local authority MapS:
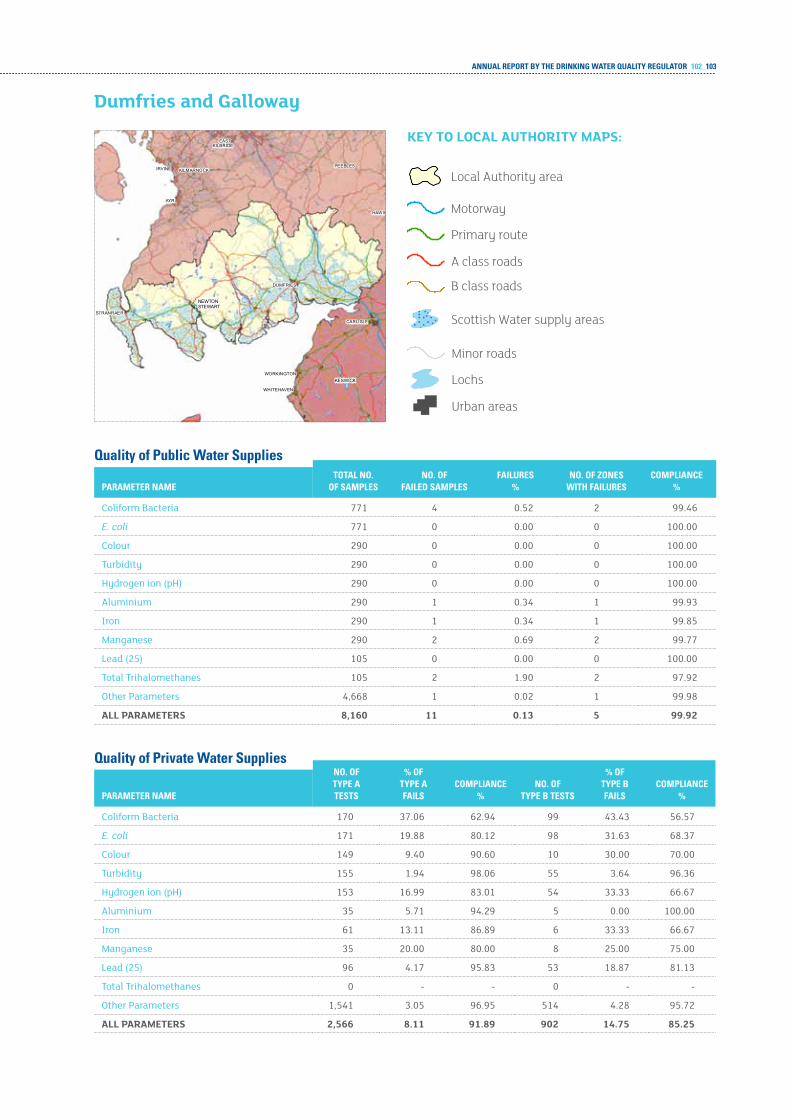
ANNUAL REPORT BY THE DRINKING WATER QUALITY REGULATOR 102_103
WHITEHAVEN
WORKINGTONKESWICK
STRANRAER
CARLISLE
DUMFRIES
HAWICK
AYR
IRVINE KILMARNOCKPEEBLES
KILBRIDEEAST
NEWTONSTEWART
Quality of Public Water SuppliesTOTAL NO.
OF SAmPLESNO. OF
FAILED SAmPLESFAILURES
%NO. OF zONES
WITH FAILURESCOmPLIANCE
%PARAmETER NAmE
Coliform Bacteria 771 4 0.52 2 99.46
E. coli 771 0 0.00 0 100.00
Colour 290 0 0.00 0 100.00
turbidity 290 0 0.00 0 100.00
Hydrogen ion (pH) 290 0 0.00 0 100.00
aluminium 290 1 0.34 1 99.93
iron 290 1 0.34 1 99.85
Manganese 290 2 0.69 2 99.77
Lead (25) 105 0 0.00 0 100.00
total trihalomethanes 105 2 1.90 2 97.92
Other Parameters 4,668 1 0.02 1 99.98
all paraMeterS 8,160 11 0.13 5 99.92
Quality of Private Water SuppliesNO. OF TYPE A TESTS
% OF TYPE A FAILS
COmPLIANCE %
NO. OF TYPE B TESTS
% OF TYPE B FAILS
COmPLIANCE %PARAmETER NAmE
Coliform Bacteria 170 37.06 62.94 99 43.43 56.57
E. coli 171 19.88 80.12 98 31.63 68.37
Colour 149 9.40 90.60 10 30.00 70.00
turbidity 155 1.94 98.06 55 3.64 96.36
Hydrogen ion (pH) 153 16.99 83.01 54 33.33 66.67
aluminium 35 5.71 94.29 5 0.00 100.00
iron 61 13.11 86.89 6 33.33 66.67
Manganese 35 20.00 80.00 8 25.00 75.00
Lead (25) 96 4.17 95.83 53 18.87 81.13
total trihalomethanes 0 - - 0 - -
Other Parameters 1,541 3.05 96.95 514 4.28 95.72
all paraMeterS 2,566 8.11 91.89 902 14.75 85.25
dumfries and galloway
Scottish Water supply areas
Urban areas
Lochs
Minor roads
Motorway
Primary route
A class roads
B class roads
Local Authority area
key to local authority MapS:
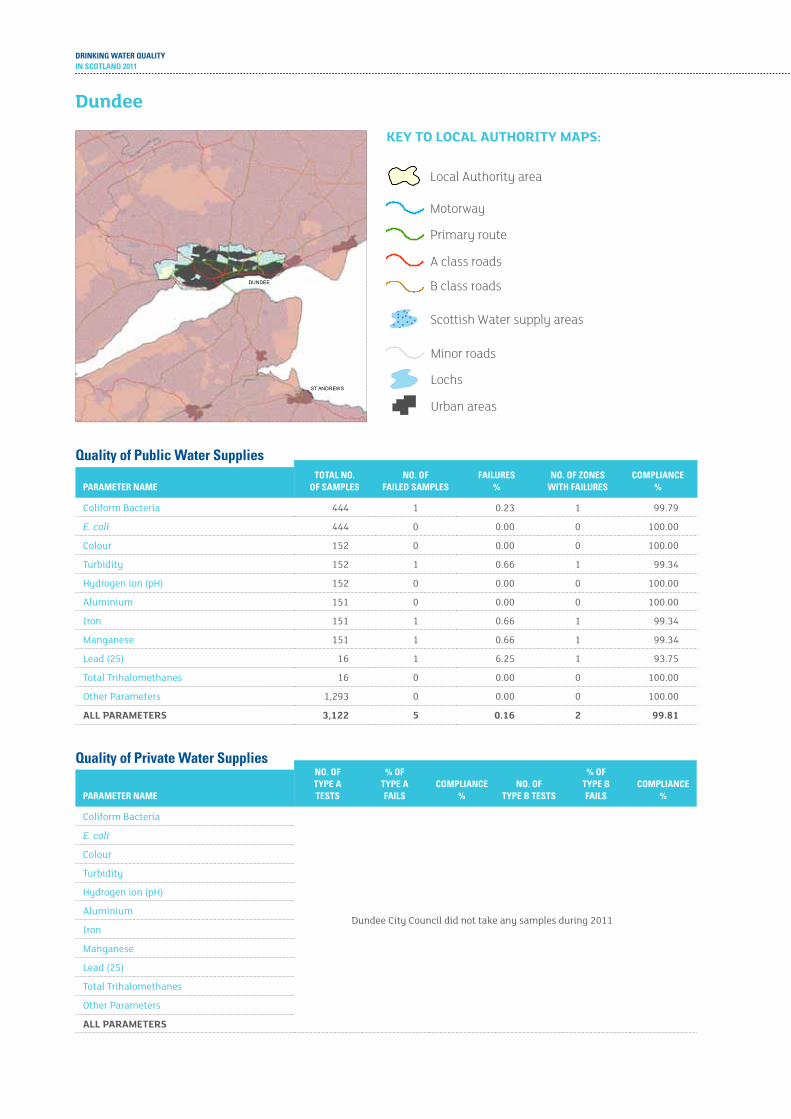
DRINKING WATER QUALITYIN SCOTLAND 2011
ST ANDREWS
DUNDEE
Quality of Public Water SuppliesTOTAL NO.
OF SAmPLESNO. OF
FAILED SAmPLESFAILURES
%NO. OF zONES
WITH FAILURESCOmPLIANCE
%PARAmETER NAmE
Coliform Bacteria 444 1 0.23 1 99.79
E. coli 444 0 0.00 0 100.00
Colour 152 0 0.00 0 100.00
turbidity 152 1 0.66 1 99.34
Hydrogen ion (pH) 152 0 0.00 0 100.00
aluminium 151 0 0.00 0 100.00
iron 151 1 0.66 1 99.34
Manganese 151 1 0.66 1 99.34
Lead (25) 16 1 6.25 1 93.75
total trihalomethanes 16 0 0.00 0 100.00
Other Parameters 1,293 0 0.00 0 100.00
all paraMeterS 3,122 5 0.16 2 99.81
Quality of Private Water SuppliesNO. OF TYPE A TESTS
% OF TYPE A FAILS
COmPLIANCE %
NO. OF TYPE B TESTS
% OF TYPE B FAILS
COmPLIANCE %PARAmETER NAmE
Coliform Bacteria
Dundee City Council did not take any samples during 2011
E. coli
Colour
turbidity
Hydrogen ion (pH)
aluminium
iron
Manganese
Lead (25)
total trihalomethanes
Other Parameters
all paraMeterS
dundee
Scottish Water supply areas
Urban areas
Lochs
Minor roads
Motorway
Primary route
A class roads
B class roads
Local Authority area
key to local authority MapS:
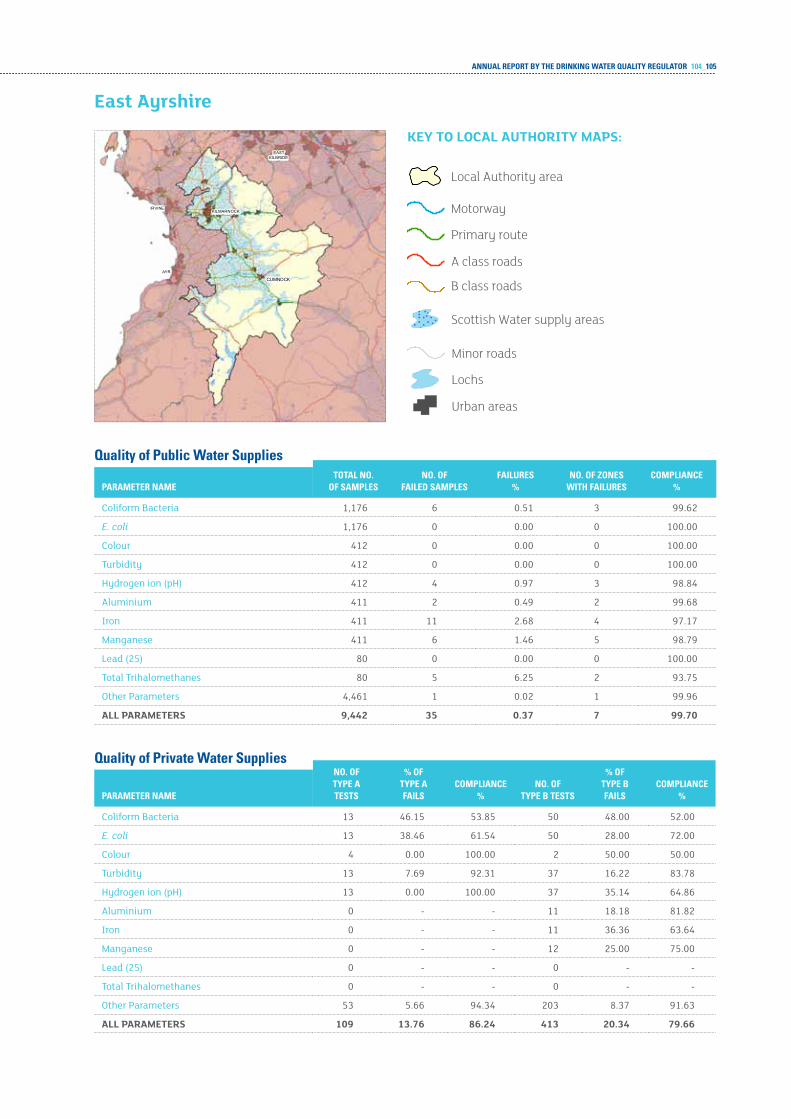
ANNUAL REPORT BY THE DRINKING WATER QUALITY REGULATOR 104_105
AYR
IRVINEKILMARNOCK
KILBRIDEEAST
CUMNOCK
Quality of Public Water SuppliesTOTAL NO.
OF SAmPLESNO. OF
FAILED SAmPLESFAILURES
%NO. OF zONES
WITH FAILURESCOmPLIANCE
%PARAmETER NAmE
Coliform Bacteria 1,176 6 0.51 3 99.62
E. coli 1,176 0 0.00 0 100.00
Colour 412 0 0.00 0 100.00
turbidity 412 0 0.00 0 100.00
Hydrogen ion (pH) 412 4 0.97 3 98.84
aluminium 411 2 0.49 2 99.68
iron 411 11 2.68 4 97.17
Manganese 411 6 1.46 5 98.79
Lead (25) 80 0 0.00 0 100.00
total trihalomethanes 80 5 6.25 2 93.75
Other Parameters 4,461 1 0.02 1 99.96
all paraMeterS 9,442 35 0.37 7 99.70
Quality of Private Water SuppliesNO. OF TYPE A TESTS
% OF TYPE A FAILS
COmPLIANCE %
NO. OF TYPE B TESTS
% OF TYPE B FAILS
COmPLIANCE %PARAmETER NAmE
Coliform Bacteria 13 46.15 53.85 50 48.00 52.00
E. coli 13 38.46 61.54 50 28.00 72.00
Colour 4 0.00 100.00 2 50.00 50.00
turbidity 13 7.69 92.31 37 16.22 83.78
Hydrogen ion (pH) 13 0.00 100.00 37 35.14 64.86
aluminium 0 - - 11 18.18 81.82
iron 0 - - 11 36.36 63.64
Manganese 0 - - 12 25.00 75.00
Lead (25) 0 - - 0 - -
total trihalomethanes 0 - - 0 - -
Other Parameters 53 5.66 94.34 203 8.37 91.63
all paraMeterS 109 13.76 86.24 413 20.34 79.66
east ayrshire
Scottish Water supply areas
Urban areas
Lochs
Minor roads
Motorway
Primary route
A class roads
B class roads
Local Authority area
key to local authority MapS:

DRINKING WATER QUALITYIN SCOTLAND 2011
PAISLEY
GLASGOW
MILNGAVIE KIRKINTILLOCH
Quality of Public Water SuppliesTOTAL NO.
OF SAmPLESNO. OF
FAILED SAmPLESFAILURES
%NO. OF zONES
WITH FAILURESCOmPLIANCE
%PARAmETER NAmE
Coliform Bacteria 1,428 6 0.42 5 99.53%
E. coli 1,428 0 0.00 0 100.00%
Colour 476 0 0.00 0 100.00%
turbidity 476 1 0.21 1 99.83%
Hydrogen ion (pH) 476 0 0.00 0 100.00%
aluminium 476 1 0.21 1 99.88%
iron 476 4 0.84 2 99.30%
Manganese 476 0 0.00 0 100.00%
Lead (25) 88 3 3.41 1 96.59%
total trihalomethanes 88 0 0.00 0 100.00%
Other Parameters 5,079 0 0.00 0 100.00%
all paraMeterS 10,967 15 0.14 6 99.89%
Quality of Private Water SuppliesNO. OF TYPE A TESTS
% OF TYPE A FAILS
COmPLIANCE %
NO. OF TYPE B TESTS
% OF TYPE B FAILS
COmPLIANCE %PARAmETER NAmE
Coliform Bacteria 0 - - 1 100.00 0.00
E. coli 0 - - 1 0.00 100.00
Colour 0 - - 0 - -
turbidity 0 - - 1 0.00 100.00
Hydrogen ion (pH) 0 - - 1 0.00 100.00
aluminium 0 - - 0 - -
iron 0 - - 1 0.00 100.00
Manganese 0 - - 0 - -
Lead (25) 0 - - 1 0.00 100.00
total trihalomethanes 0 - - 0 - -
Other Parameters 0 - - 4 25.00 75.00
all paraMeterS 0 - - 10 20.00 80.00
east dunbartonshire
Scottish Water supply areas
Urban areas
Lochs
Minor roads
Motorway
Primary route
A class roads
B class roads
Local Authority area
key to local authority MapS:
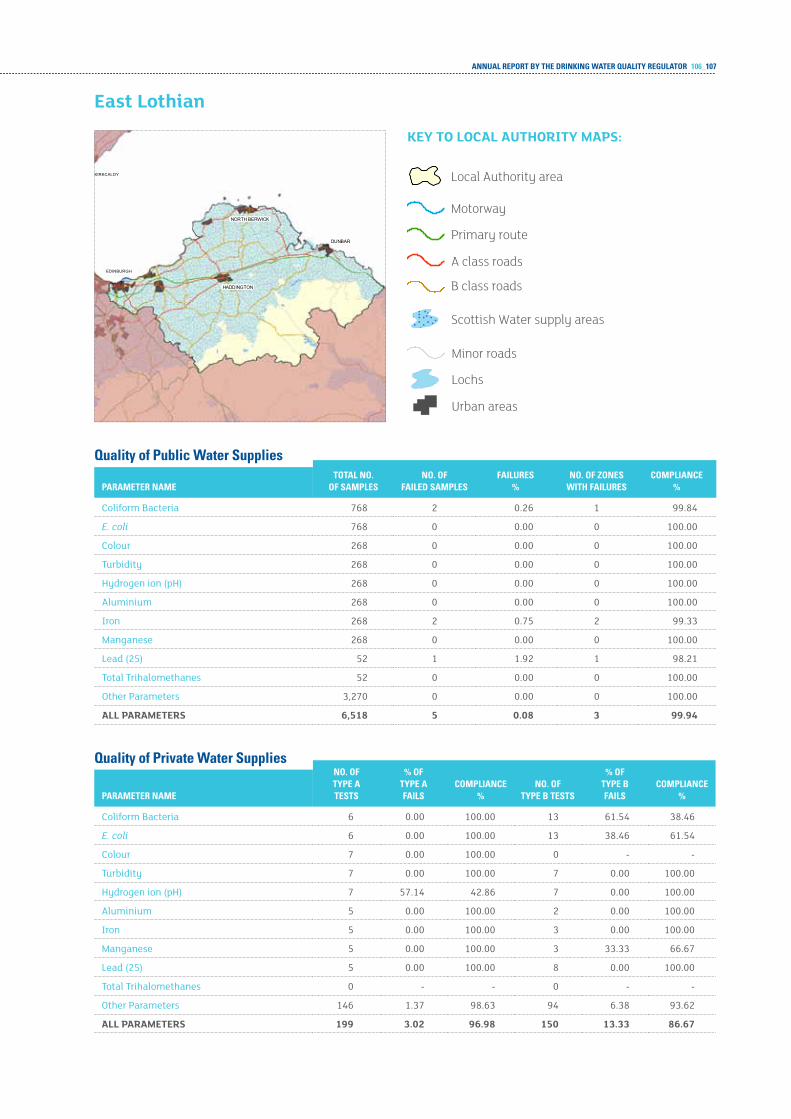
ANNUAL REPORT BY THE DRINKING WATER QUALITY REGULATOR 106_107
EDINBURGH
KIRKCALDY
NORTH BERWICK
DUNBAR
HADDINGTON
Quality of Public Water SuppliesTOTAL NO.
OF SAmPLESNO. OF
FAILED SAmPLESFAILURES
%NO. OF zONES
WITH FAILURESCOmPLIANCE
%PARAmETER NAmE
Coliform Bacteria 768 2 0.26 1 99.84
E. coli 768 0 0.00 0 100.00
Colour 268 0 0.00 0 100.00
turbidity 268 0 0.00 0 100.00
Hydrogen ion (pH) 268 0 0.00 0 100.00
aluminium 268 0 0.00 0 100.00
iron 268 2 0.75 2 99.33
Manganese 268 0 0.00 0 100.00
Lead (25) 52 1 1.92 1 98.21
total trihalomethanes 52 0 0.00 0 100.00
Other Parameters 3,270 0 0.00 0 100.00
all paraMeterS 6,518 5 0.08 3 99.94
Quality of Private Water SuppliesNO. OF TYPE A TESTS
% OF TYPE A FAILS
COmPLIANCE %
NO. OF TYPE B TESTS
% OF TYPE B FAILS
COmPLIANCE %PARAmETER NAmE
Coliform Bacteria 6 0.00 100.00 13 61.54 38.46
E. coli 6 0.00 100.00 13 38.46 61.54
Colour 7 0.00 100.00 0 - -
turbidity 7 0.00 100.00 7 0.00 100.00
Hydrogen ion (pH) 7 57.14 42.86 7 0.00 100.00
aluminium 5 0.00 100.00 2 0.00 100.00
iron 5 0.00 100.00 3 0.00 100.00
Manganese 5 0.00 100.00 3 33.33 66.67
Lead (25) 5 0.00 100.00 8 0.00 100.00
total trihalomethanes 0 - - 0 - -
Other Parameters 146 1.37 98.63 94 6.38 93.62
all paraMeterS 199 3.02 96.98 150 13.33 86.67
east lothian
Scottish Water supply areas
Urban areas
Lochs
Minor roads
Motorway
Primary route
A class roads
B class roads
Local Authority area
key to local authority MapS:
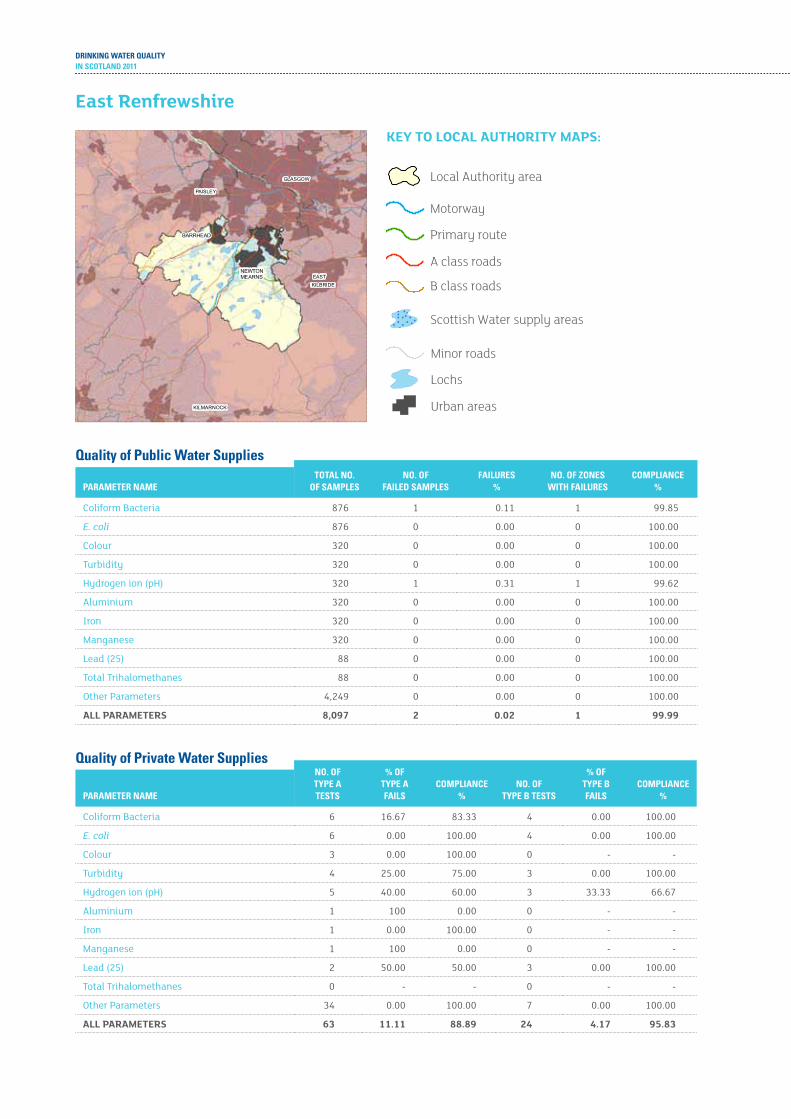
DRINKING WATER QUALITYIN SCOTLAND 2011
KILMARNOCK
KILBRIDEEAST
PAISLEY
GLASGOW
BARRHEAD
NEWTONMEARNS
Quality of Public Water SuppliesTOTAL NO.
OF SAmPLESNO. OF
FAILED SAmPLESFAILURES
%NO. OF zONES
WITH FAILURESCOmPLIANCE
%PARAmETER NAmE
Coliform Bacteria 876 1 0.11 1 99.85
E. coli 876 0 0.00 0 100.00
Colour 320 0 0.00 0 100.00
turbidity 320 0 0.00 0 100.00
Hydrogen ion (pH) 320 1 0.31 1 99.62
aluminium 320 0 0.00 0 100.00
iron 320 0 0.00 0 100.00
Manganese 320 0 0.00 0 100.00
Lead (25) 88 0 0.00 0 100.00
total trihalomethanes 88 0 0.00 0 100.00
Other Parameters 4,249 0 0.00 0 100.00
all paraMeterS 8,097 2 0.02 1 99.99
Quality of Private Water SuppliesNO. OF TYPE A TESTS
% OF TYPE A FAILS
COmPLIANCE %
NO. OF TYPE B TESTS
% OF TYPE B FAILS
COmPLIANCE %PARAmETER NAmE
Coliform Bacteria 6 16.67 83.33 4 0.00 100.00
E. coli 6 0.00 100.00 4 0.00 100.00
Colour 3 0.00 100.00 0 - -
turbidity 4 25.00 75.00 3 0.00 100.00
Hydrogen ion (pH) 5 40.00 60.00 3 33.33 66.67
aluminium 1 100 0.00 0 - -
iron 1 0.00 100.00 0 - -
Manganese 1 100 0.00 0 - -
Lead (25) 2 50.00 50.00 3 0.00 100.00
total trihalomethanes 0 - - 0 - -
Other Parameters 34 0.00 100.00 7 0.00 100.00
all paraMeterS 63 11.11 88.89 24 4.17 95.83
east renfrewshire
Scottish Water supply areas
Urban areas
Lochs
Minor roads
Motorway
Primary route
A class roads
B class roads
Local Authority area
key to local authority MapS:

ANNUAL REPORT BY THE DRINKING WATER QUALITY REGULATOR 108_109
EDINBURGH
QUEENSFERRY
Quality of Public Water SuppliesTOTAL NO.
OF SAmPLESNO. OF
FAILED SAmPLESFAILURES
%NO. OF zONES
WITH FAILURESCOmPLIANCE
%PARAmETER NAmE
Coliform Bacteria 1,836 2 0.11 1 99.91
E. coli 1,836 0 0.00 0 100.00
Colour 588 0 0.00 0 100.00
turbidity 589 1 0.17 1 99.65
Hydrogen ion (pH) 589 0 0.00 0 100.00
aluminium 586 0 0.00 0 100.00
iron 586 4 0.68 4 99.28
Manganese 586 0 0.00 0 100.00
Lead (25) 96 0 0.00 0 100.00
total trihalomethanes 96 0 0.00 0 100.00
Other Parameters 6,997 0 0.00 0 100.00
all paraMeterS 14,385 7 0.05 6 99.97
Quality of Private Water SuppliesNO. OF TYPE A TESTS
% OF TYPE A FAILS
COmPLIANCE %
NO. OF TYPE B TESTS
% OF TYPE B FAILS
COmPLIANCE %PARAmETER NAmE
Coliform Bacteria 1 0.00 100.00 2 50.00 50.00
E. coli 1 0.00 100.00 2 50.00 50.00
Colour 2 0.00 100.00 2 0.00 100.00
turbidity 2 0.00 100.00 2 0.00 100.00
Hydrogen ion (pH) 2 0.00 100.00 2 0.00 100.00
aluminium 0 - - 2 0.00 100.00
iron 0 - - 2 0.00 100.00
Manganese 0 - - 2 0.00 100.00
Lead (25) 0 - - 2 0.00 100.00
total trihalomethanes 0 - - 0 - -
Other Parameters 10 0.00 100.00 24 8.33 91.67
all paraMeterS 18 0.00 100.00 42 9.52 90.48
edinburgh
Scottish Water supply areas
Urban areas
Lochs
Minor roads
Motorway
Primary route
A class roads
B class roads
Local Authority area
key to local authority MapS:
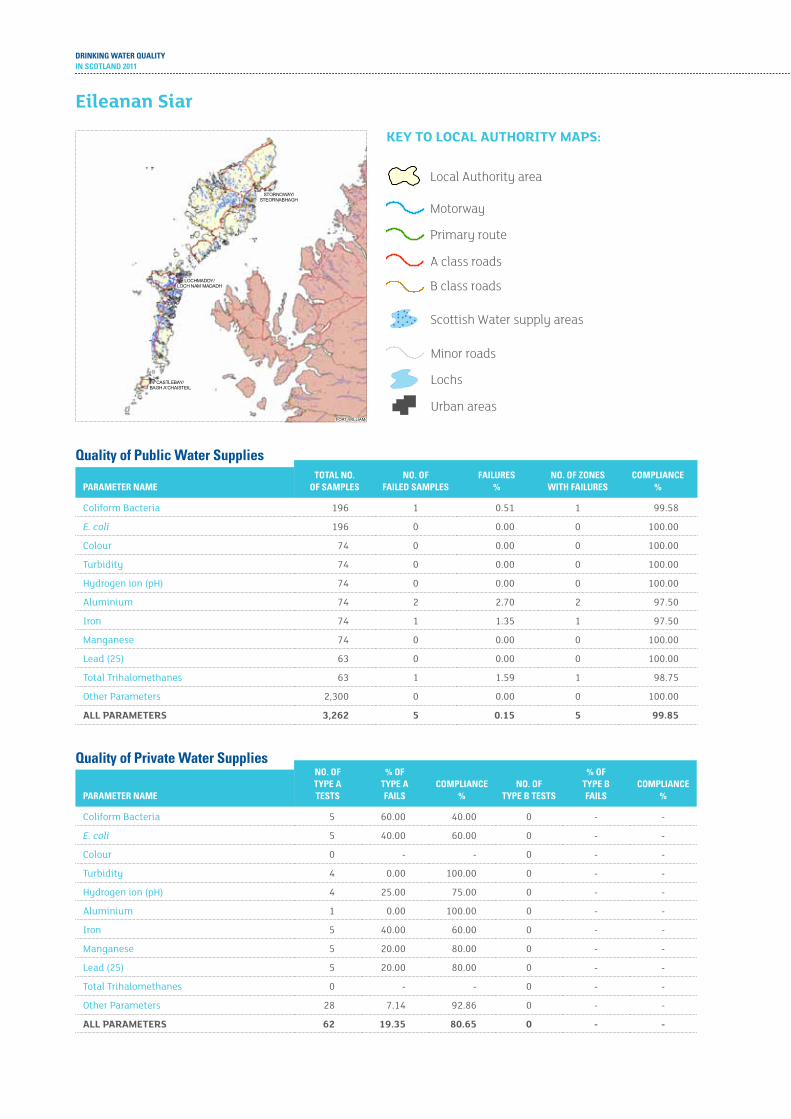
DRINKING WATER QUALITYIN SCOTLAND 2011
AN GEARASDANFORT WILLIAM/
LOCHMADDY/LOCH NAM MADADH
STORNOWAY/STEORNABHAGH
CASTLEBAY/BAGH A'CHAISTEIL
Quality of Public Water SuppliesTOTAL NO.
OF SAmPLESNO. OF
FAILED SAmPLESFAILURES
%NO. OF zONES
WITH FAILURESCOmPLIANCE
%PARAmETER NAmE
Coliform Bacteria 196 1 0.51 1 99.58
E. coli 196 0 0.00 0 100.00
Colour 74 0 0.00 0 100.00
turbidity 74 0 0.00 0 100.00
Hydrogen ion (pH) 74 0 0.00 0 100.00
aluminium 74 2 2.70 2 97.50
iron 74 1 1.35 1 97.50
Manganese 74 0 0.00 0 100.00
Lead (25) 63 0 0.00 0 100.00
total trihalomethanes 63 1 1.59 1 98.75
Other Parameters 2,300 0 0.00 0 100.00
all paraMeterS 3,262 5 0.15 5 99.85
Quality of Private Water SuppliesNO. OF TYPE A TESTS
% OF TYPE A FAILS
COmPLIANCE %
NO. OF TYPE B TESTS
% OF TYPE B FAILS
COmPLIANCE %PARAmETER NAmE
Coliform Bacteria 5 60.00 40.00 0 - -
E. coli 5 40.00 60.00 0 - -
Colour 0 - - 0 - -
turbidity 4 0.00 100.00 0 - -
Hydrogen ion (pH) 4 25.00 75.00 0 - -
aluminium 1 0.00 100.00 0 - -
iron 5 40.00 60.00 0 - -
Manganese 5 20.00 80.00 0 - -
Lead (25) 5 20.00 80.00 0 - -
total trihalomethanes 0 - - 0 - -
Other Parameters 28 7.14 92.86 0 - -
all paraMeterS 62 19.35 80.65 0 - -
eileanan Siar
Scottish Water supply areas
Urban areas
Lochs
Minor roads
Motorway
Primary route
A class roads
B class roads
Local Authority area
key to local authority MapS:

ANNUAL REPORT BY THE DRINKING WATER QUALITY REGULATOR 110_111
STIRLING
FALKIRK
GRANGEMOUTH
Quality of Public Water SuppliesTOTAL NO.
OF SAmPLESNO. OF
FAILED SAmPLESFAILURES
%NO. OF zONES
WITH FAILURESCOmPLIANCE
%PARAmETER NAmE
Coliform Bacteria 1,264 4 0.32 3 99.74
E. coli 1,264 0 0.00 0 100.00
Colour 410 0 0.00 0 100.00
turbidity 410 1 0.24 1 99.81
Hydrogen ion (pH) 410 0 0.00 0 100.00
aluminium 409 1 0.24 1 99.81
iron 409 8 1.96 5 98.46
Manganese 409 1 0.24 1 99.81
Lead (25) 73 0 0.00 0 100.00
total trihalomethanes 73 0 0.00 0 100.00
Other Parameters 4,314 0 0.00 0 100.00
all paraMeterS 9,445 15 0.16 5 99.95
Quality of Private Water SuppliesNO. OF TYPE A TESTS
% OF TYPE A FAILS
COmPLIANCE %
NO. OF TYPE B TESTS
% OF TYPE B FAILS
COmPLIANCE %PARAmETER NAmE
Coliform Bacteria 0 - - 0 - -
E. coli 0 - - 0 - -
Colour 0 - - 0 - -
turbidity 0 - - 0 - -
Hydrogen ion (pH) 1 0.00 100.00 0 - -
aluminium 1 0.00 100.00 0 - -
iron 1 0.00 100.00 0 - -
Manganese 1 100.00 0.00 0 - -
Lead (25) 1 0.00 100.00 0 - -
total trihalomethanes 1 0.00 100.00 0 - -
Other Parameters 41 2.44 97.56 0 - -
all paraMeterS 47 4.26 95.74 0 - -
falkirk
Scottish Water supply areas
Urban areas
Lochs
Minor roads
Motorway
Primary route
A class roads
B class roads
Local Authority area
key to local authority MapS:

DRINKING WATER QUALITYIN SCOTLAND 2011
EDINBURGH
KIRKCALDY
ST ANDREWS
PERTH
DUNDEE
ARBROA
DUNFERMLINE
Quality of Public Water SuppliesTOTAL NO.
OF SAmPLESNO. OF
FAILED SAmPLESFAILURES
%NO. OF zONES
WITH FAILURESCOmPLIANCE
(%)PARAmETER NAmE
Coliform Bacteria 1,072 2 0.19 2 99.85
E. coli 1,071 0 0.00 0 100.00
Colour 372 0 0.00 0 100.00
turbidity 374 0 0.00 0 100.00
Hydrogen ion (pH) 374 0 0.00 0 100.00
aluminium 373 3 0.80 3 97.12
iron 373 3 0.80 3 97.03
Manganese 373 3 0.80 3 97.18
Lead (25) 69 1 1.45 1 98.75
total trihalomethanes 69 0 0.00 0 100.00
Other Parameters 4,102 0 0.00 0 100.00
all paraMeterS 8,622 12 0.14 7 99.78
Quality of Private Water SuppliesNO. OF TYPE A TESTS
% OF TYPE A FAILS
COmPLIANCE %
NO. OF TYPE B TESTS
% OF TYPE B FAILS
COmPLIANCE %PARAmETER NAmE
Coliform Bacteria 30 6.67 93.33 24 37.50 62.50
E. coli 30 3.33 96.67 24 33.33 66.67
Colour 25 0.00 100.00 1 0.00 100.00
turbidity 30 0.00 100.00 24 8.33 91.67
Hydrogen ion (pH) 30 3.33 96.67 24 8.33 91.67
aluminium 24 0.00 100.00 2 0.00 100.00
iron 24 4.17 95.83 3 33.33 66.67
Manganese 8 12.50 87.50 2 0.00 100.00
Lead (25) 15 0.00 100.00 24 4.17 95.83
total trihalomethanes 3 0.00 100.00 2 0.00 100.00
Other Parameters 523 1.15 98.85 351 3.13 96.87
all paraMeterS 742 1.62 98.38 481 7.07 92.93
fife
Scottish Water supply areas
Urban areas
Lochs
Minor roads
Motorway
Primary route
A class roads
B class roads
Local Authority area
key to local authority MapS:
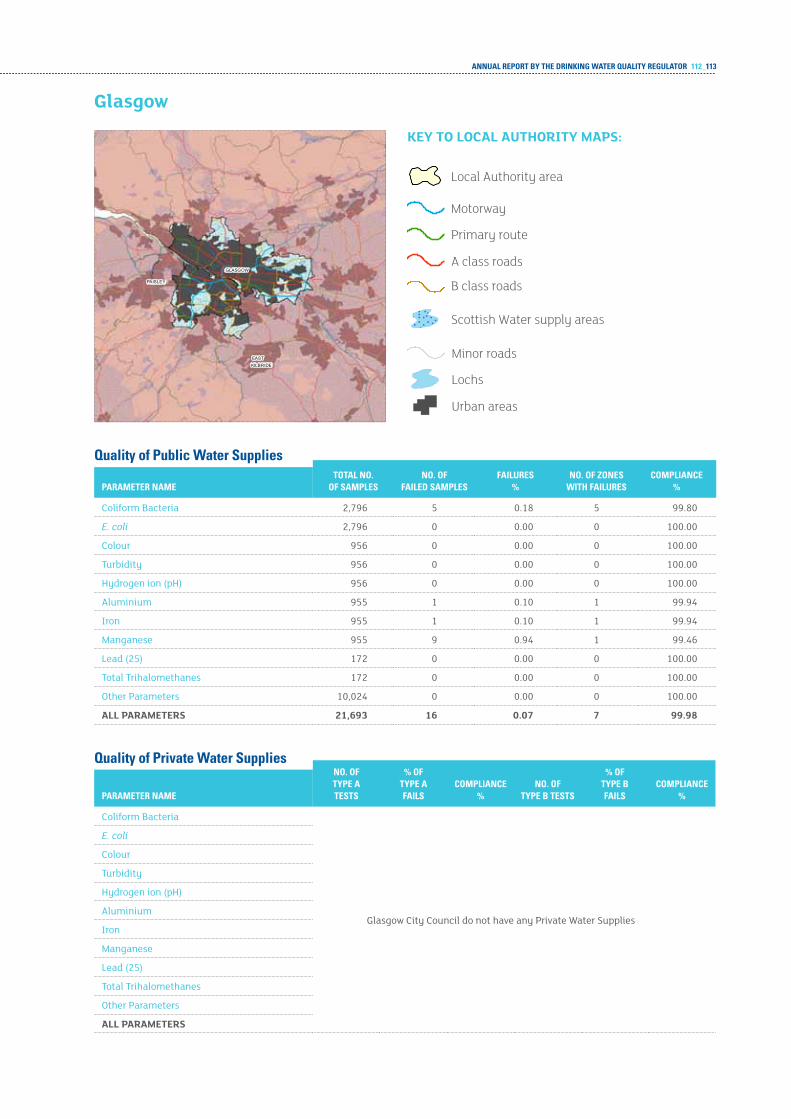
ANNUAL REPORT BY THE DRINKING WATER QUALITY REGULATOR 112_113
KILBRIDEEAST
PAISLEY
GLASGOW
Quality of Public Water SuppliesTOTAL NO.
OF SAmPLESNO. OF
FAILED SAmPLESFAILURES
%NO. OF zONES
WITH FAILURESCOmPLIANCE
%PARAmETER NAmE
Coliform Bacteria 2,796 5 0.18 5 99.80
E. coli 2,796 0 0.00 0 100.00
Colour 956 0 0.00 0 100.00
turbidity 956 0 0.00 0 100.00
Hydrogen ion (pH) 956 0 0.00 0 100.00
aluminium 955 1 0.10 1 99.94
iron 955 1 0.10 1 99.94
Manganese 955 9 0.94 1 99.46
Lead (25) 172 0 0.00 0 100.00
total trihalomethanes 172 0 0.00 0 100.00
Other Parameters 10,024 0 0.00 0 100.00
all paraMeterS 21,693 16 0.07 7 99.98
Quality of Private Water SuppliesNO. OF TYPE A TESTS
% OF TYPE A FAILS
COmPLIANCE %
NO. OF TYPE B TESTS
% OF TYPE B FAILS
COmPLIANCE %PARAmETER NAmE
Coliform Bacteria
glasgow City Council do not have any Private Water Supplies
E. coli
Colour
turbidity
Hydrogen ion (pH)
aluminium
iron
Manganese
Lead (25)
total trihalomethanes
Other Parameters
all paraMeterS
glasgow
Scottish Water supply areas
Urban areas
Lochs
Minor roads
Motorway
Primary route
A class roads
B class roads
Local Authority area
key to local authority MapS:
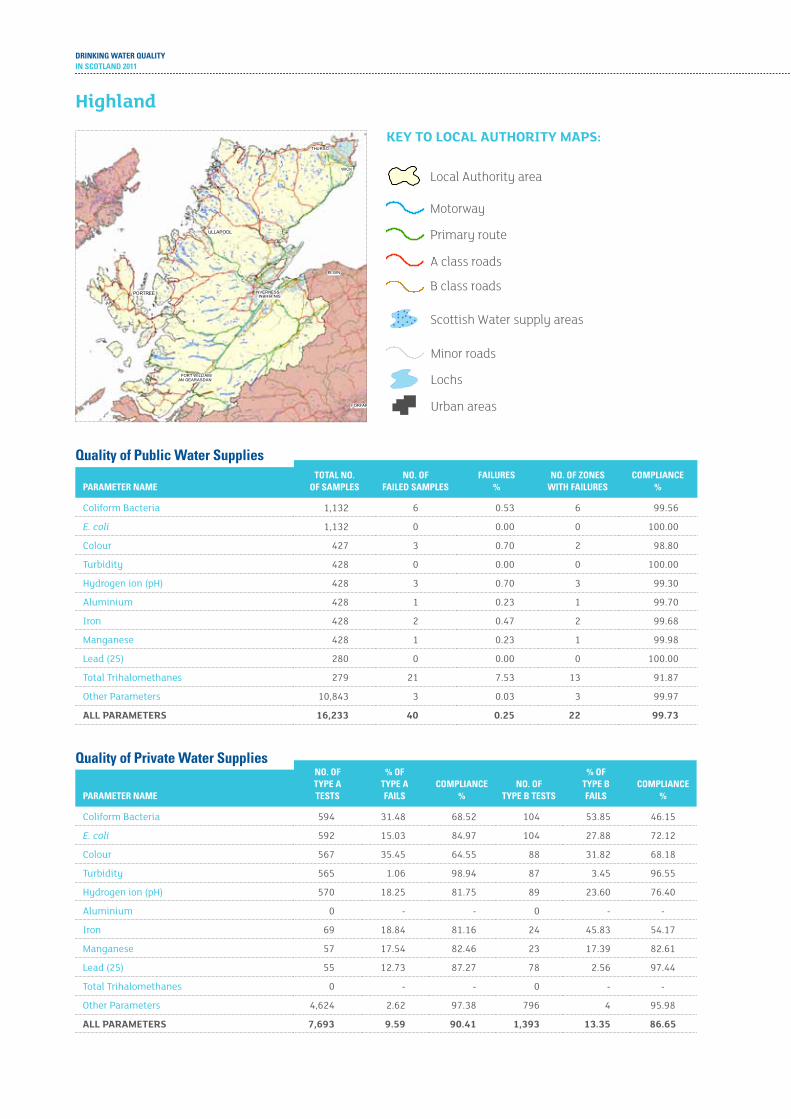
DRINKING WATER QUALITYIN SCOTLAND 2011
FORFAR
FORT WILLIAM/AN GEARASDAN
INBHIR NISINVERNESS/
ELGIN
WICK
THURSO
PORTREE
ULLAPOOL
Quality of Public Water SuppliesTOTAL NO.
OF SAmPLESNO. OF
FAILED SAmPLESFAILURES
%NO. OF zONES
WITH FAILURESCOmPLIANCE
%PARAmETER NAmE
Coliform Bacteria 1,132 6 0.53 6 99.56
E. coli 1,132 0 0.00 0 100.00
Colour 427 3 0.70 2 98.80
turbidity 428 0 0.00 0 100.00
Hydrogen ion (pH) 428 3 0.70 3 99.30
aluminium 428 1 0.23 1 99.70
iron 428 2 0.47 2 99.68
Manganese 428 1 0.23 1 99.98
Lead (25) 280 0 0.00 0 100.00
total trihalomethanes 279 21 7.53 13 91.87
Other Parameters 10,843 3 0.03 3 99.97
all paraMeterS 16,233 40 0.25 22 99.73
Quality of Private Water SuppliesNO. OF TYPE A TESTS
% OF TYPE A FAILS
COmPLIANCE %
NO. OF TYPE B TESTS
% OF TYPE B FAILS
COmPLIANCE %PARAmETER NAmE
Coliform Bacteria 594 31.48 68.52 104 53.85 46.15
E. coli 592 15.03 84.97 104 27.88 72.12
Colour 567 35.45 64.55 88 31.82 68.18
turbidity 565 1.06 98.94 87 3.45 96.55
Hydrogen ion (pH) 570 18.25 81.75 89 23.60 76.40
aluminium 0 - - 0 - -
iron 69 18.84 81.16 24 45.83 54.17
Manganese 57 17.54 82.46 23 17.39 82.61
Lead (25) 55 12.73 87.27 78 2.56 97.44
total trihalomethanes 0 - - 0 - -
Other Parameters 4,624 2.62 97.38 796 4 95.98
all paraMeterS 7,693 9.59 90.41 1,393 13.35 86.65
highland
Scottish Water supply areas
Urban areas
Lochs
Minor roads
Motorway
Primary route
A class roads
B class roads
Local Authority area
key to local authority MapS:
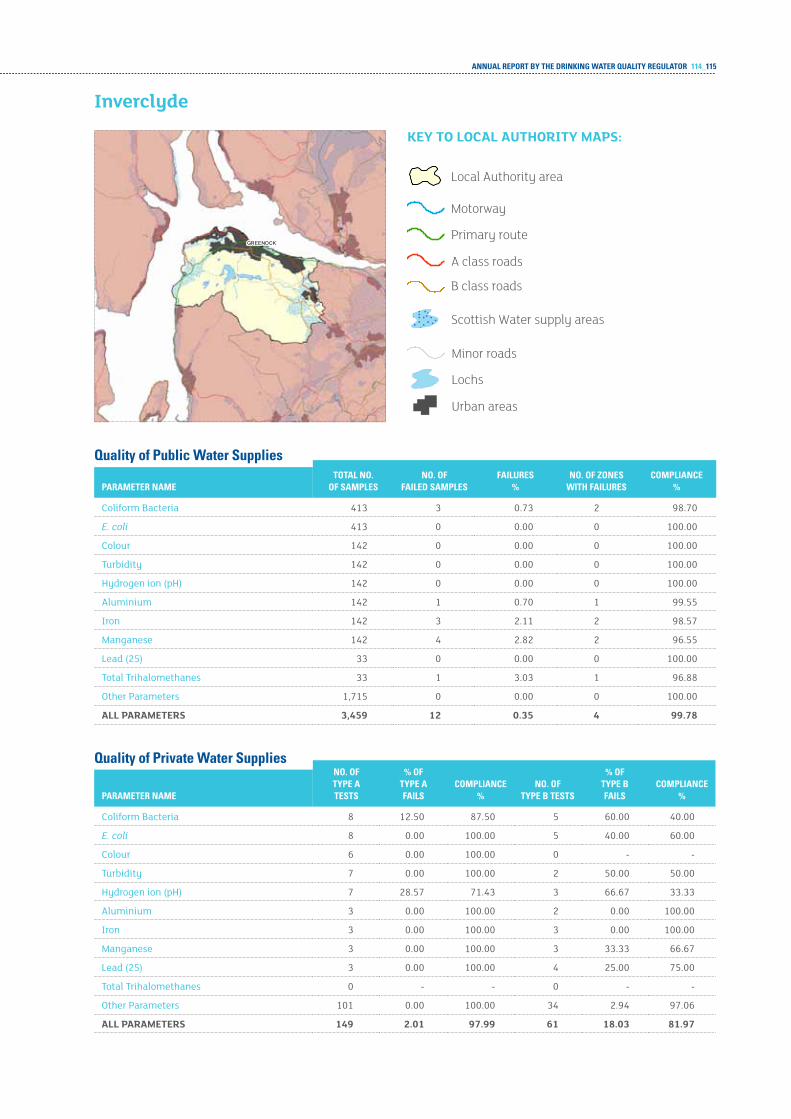
ANNUAL REPORT BY THE DRINKING WATER QUALITY REGULATOR 114_115
GREENOCK
Quality of Public Water SuppliesTOTAL NO.
OF SAmPLESNO. OF
FAILED SAmPLESFAILURES
%NO. OF zONES
WITH FAILURESCOmPLIANCE
%PARAmETER NAmE
Coliform Bacteria 413 3 0.73 2 98.70
E. coli 413 0 0.00 0 100.00
Colour 142 0 0.00 0 100.00
turbidity 142 0 0.00 0 100.00
Hydrogen ion (pH) 142 0 0.00 0 100.00
aluminium 142 1 0.70 1 99.55
iron 142 3 2.11 2 98.57
Manganese 142 4 2.82 2 96.55
Lead (25) 33 0 0.00 0 100.00
total trihalomethanes 33 1 3.03 1 96.88
Other Parameters 1,715 0 0.00 0 100.00
all paraMeterS 3,459 12 0.35 4 99.78
Quality of Private Water SuppliesNO. OF TYPE A TESTS
% OF TYPE A FAILS
COmPLIANCE %
NO. OF TYPE B TESTS
% OF TYPE B FAILS
COmPLIANCE %PARAmETER NAmE
Coliform Bacteria 8 12.50 87.50 5 60.00 40.00
E. coli 8 0.00 100.00 5 40.00 60.00
Colour 6 0.00 100.00 0 - -
turbidity 7 0.00 100.00 2 50.00 50.00
Hydrogen ion (pH) 7 28.57 71.43 3 66.67 33.33
aluminium 3 0.00 100.00 2 0.00 100.00
iron 3 0.00 100.00 3 0.00 100.00
Manganese 3 0.00 100.00 3 33.33 66.67
Lead (25) 3 0.00 100.00 4 25.00 75.00
total trihalomethanes 0 - - 0 - -
Other Parameters 101 0.00 100.00 34 2.94 97.06
all paraMeterS 149 2.01 97.99 61 18.03 81.97
inverclyde
Scottish Water supply areas
Urban areas
Lochs
Minor roads
Motorway
Primary route
A class roads
B class roads
Local Authority area
key to local authority MapS:
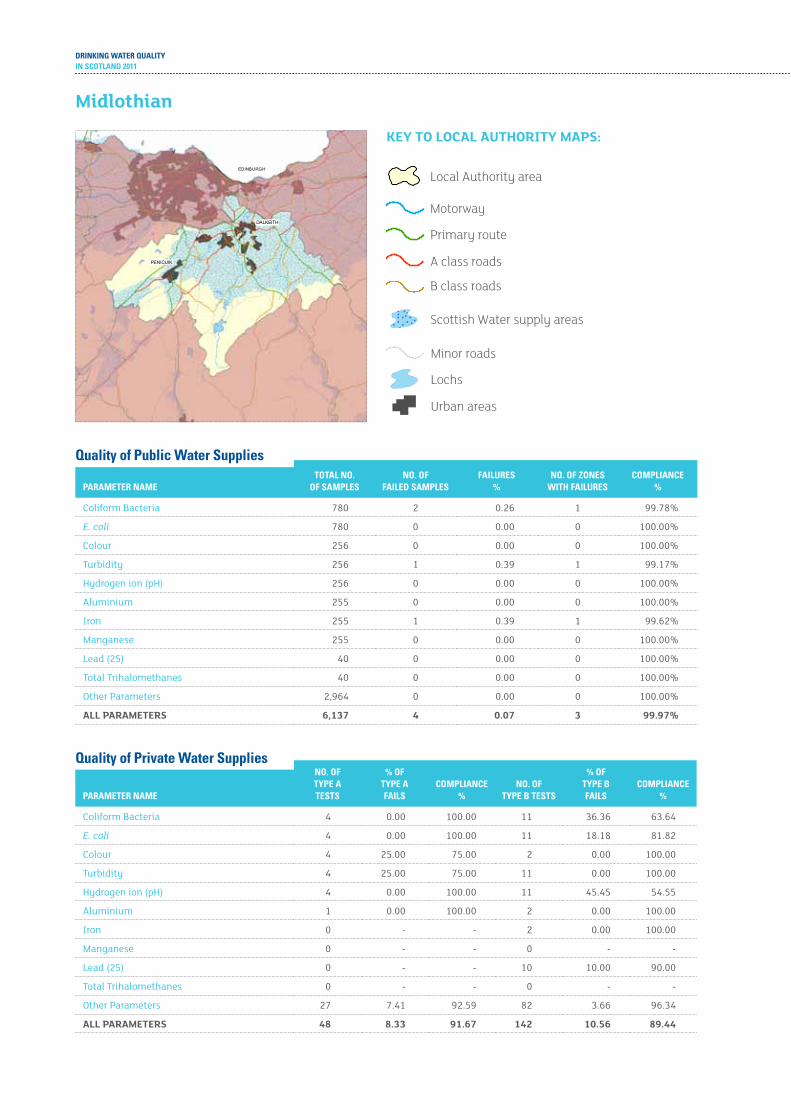
DRINKING WATER QUALITYIN SCOTLAND 2011
PEEBLES
EDINBURGH
PENICUIK
DALKEITH
Quality of Public Water SuppliesTOTAL NO.
OF SAmPLESNO. OF
FAILED SAmPLESFAILURES
%NO. OF zONES
WITH FAILURESCOmPLIANCE
%PARAmETER NAmE
Coliform Bacteria 780 2 0.26 1 99.78%
E. coli 780 0 0.00 0 100.00%
Colour 256 0 0.00 0 100.00%
turbidity 256 1 0.39 1 99.17%
Hydrogen ion (pH) 256 0 0.00 0 100.00%
aluminium 255 0 0.00 0 100.00%
iron 255 1 0.39 1 99.62%
Manganese 255 0 0.00 0 100.00%
Lead (25) 40 0 0.00 0 100.00%
total trihalomethanes 40 0 0.00 0 100.00%
Other Parameters 2,964 0 0.00 0 100.00%
all paraMeterS 6,137 4 0.07 3 99.97%
Quality of Private Water SuppliesNO. OF TYPE A TESTS
% OF TYPE A FAILS
COmPLIANCE %
NO. OF TYPE B TESTS
% OF TYPE B FAILS
COmPLIANCE %PARAmETER NAmE
Coliform Bacteria 4 0.00 100.00 11 36.36 63.64
E. coli 4 0.00 100.00 11 18.18 81.82
Colour 4 25.00 75.00 2 0.00 100.00
turbidity 4 25.00 75.00 11 0.00 100.00
Hydrogen ion (pH) 4 0.00 100.00 11 45.45 54.55
aluminium 1 0.00 100.00 2 0.00 100.00
iron 0 - - 2 0.00 100.00
Manganese 0 - - 0 - -
Lead (25) 0 - - 10 10.00 90.00
total trihalomethanes 0 - - 0 - -
Other Parameters 27 7.41 92.59 82 3.66 96.34
all paraMeterS 48 8.33 91.67 142 10.56 89.44
Midlothian
Scottish Water supply areas
Urban areas
Lochs
Minor roads
Motorway
Primary route
A class roads
B class roads
Local Authority area
key to local authority MapS:
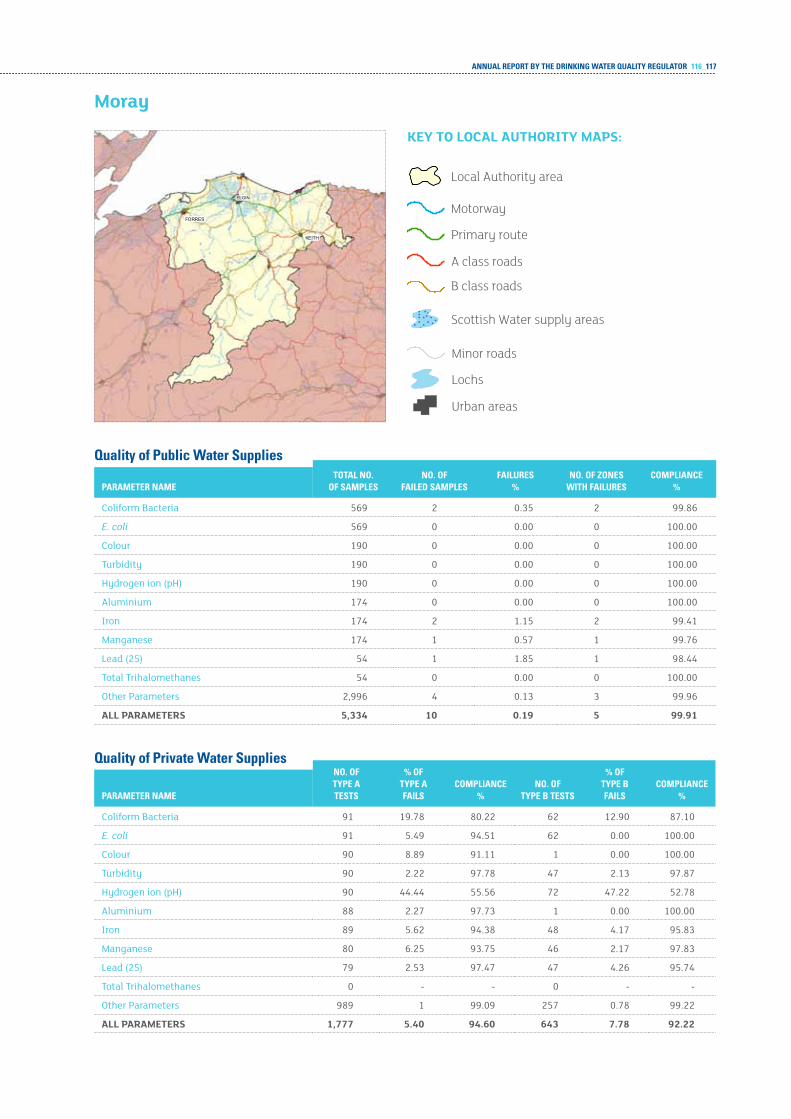
ANNUAL REPORT BY THE DRINKING WATER QUALITY REGULATOR 116_117
ELGIN
KEITH
FORRES
Quality of Public Water SuppliesTOTAL NO.
OF SAmPLESNO. OF
FAILED SAmPLESFAILURES
%NO. OF zONES
WITH FAILURESCOmPLIANCE
%PARAmETER NAmE
Coliform Bacteria 569 2 0.35 2 99.86
E. coli 569 0 0.00 0 100.00
Colour 190 0 0.00 0 100.00
turbidity 190 0 0.00 0 100.00
Hydrogen ion (pH) 190 0 0.00 0 100.00
aluminium 174 0 0.00 0 100.00
iron 174 2 1.15 2 99.41
Manganese 174 1 0.57 1 99.76
Lead (25) 54 1 1.85 1 98.44
total trihalomethanes 54 0 0.00 0 100.00
Other Parameters 2,996 4 0.13 3 99.96
all paraMeterS 5,334 10 0.19 5 99.91
Quality of Private Water SuppliesNO. OF TYPE A TESTS
% OF TYPE A FAILS
COmPLIANCE %
NO. OF TYPE B TESTS
% OF TYPE B FAILS
COmPLIANCE %PARAmETER NAmE
Coliform Bacteria 91 19.78 80.22 62 12.90 87.10
E. coli 91 5.49 94.51 62 0.00 100.00
Colour 90 8.89 91.11 1 0.00 100.00
turbidity 90 2.22 97.78 47 2.13 97.87
Hydrogen ion (pH) 90 44.44 55.56 72 47.22 52.78
aluminium 88 2.27 97.73 1 0.00 100.00
iron 89 5.62 94.38 48 4.17 95.83
Manganese 80 6.25 93.75 46 2.17 97.83
Lead (25) 79 2.53 97.47 47 4.26 95.74
total trihalomethanes 0 - - 0 - -
Other Parameters 989 1 99.09 257 0.78 99.22
all paraMeterS 1,777 5.40 94.60 643 7.78 92.22
Moray
Scottish Water supply areas
Urban areas
Lochs
Minor roads
Motorway
Primary route
A class roads
B class roads
Local Authority area
key to local authority MapS:

DRINKING WATER QUALITYIN SCOTLAND 2011
AYR
KILMARNOCKIRVINE
PAISLEY
GREENOCK
BRODICK
LARGS
Quality of Public Water SuppliesTOTAL NO.
OF SAmPLESNO. OF
FAILED SAmPLESFAILURES
%NO. OF zONES
WITH FAILURESCOmPLIANCE
%PARAmETER NAmE
Coliform Bacteria 684 4 0.58 2 99.77
E. coli 684 0 0.00 0 100.00
Colour 224 0 0.00 0 100.00
turbidity 224 0 0.00 0 100.00
Hydrogen ion (pH) 224 2 0.89 1 99.31
aluminium 222 0 0.00 0 100.00
iron 222 11 4.95 3 96.57
Manganese 222 2 0.90 2 99.49
Lead (25) 52 0 0.00 0 100.00
total trihalomethanes 52 3 5.77 1 95.31
Other Parameters 2,680 0 0.00 0 100.00
all paraMeterS 5,490 22 0.40 3 99.79
Quality of Private Water SuppliesNO. OF TYPE A TESTS
% OF TYPE A FAILS
COmPLIANCE %
NO. OF TYPE B TESTS
% OF TYPE B FAILS
COmPLIANCE %PARAmETER NAmE
Coliform Bacteria 25 20.00 80.00 9 55.56 44.44
E. coli 25 16.00 84.00 9 44.44 55.56
Colour 18 5.56 94.44 3 33.33 66.67
turbidity 25 4.00 96.00 9 0.00 100.00
Hydrogen ion (pH) 25 0.00 100.00 9 33.33 66.67
aluminium 5 0.00 100.00 5 0.00 100.00
iron 6 16.67 83.33 5 20.00 80.00
Manganese 4 0.00 100.00 5 0.00 100.00
Lead (25) 11 0.00 100.00 9 0.00 100.00
total trihalomethanes 2 0.00 100.00 1 0.00 100.00
Other Parameters 278 5.04 94.96 90 7.78 92.22
all paraMeterS 424 6.13 93.87 154 13.64 86.36
north ayrshire
Scottish Water supply areas
Urban areas
Lochs
Minor roads
Motorway
Primary route
A class roads
B class roads
Local Authority area
key to local authority MapS:
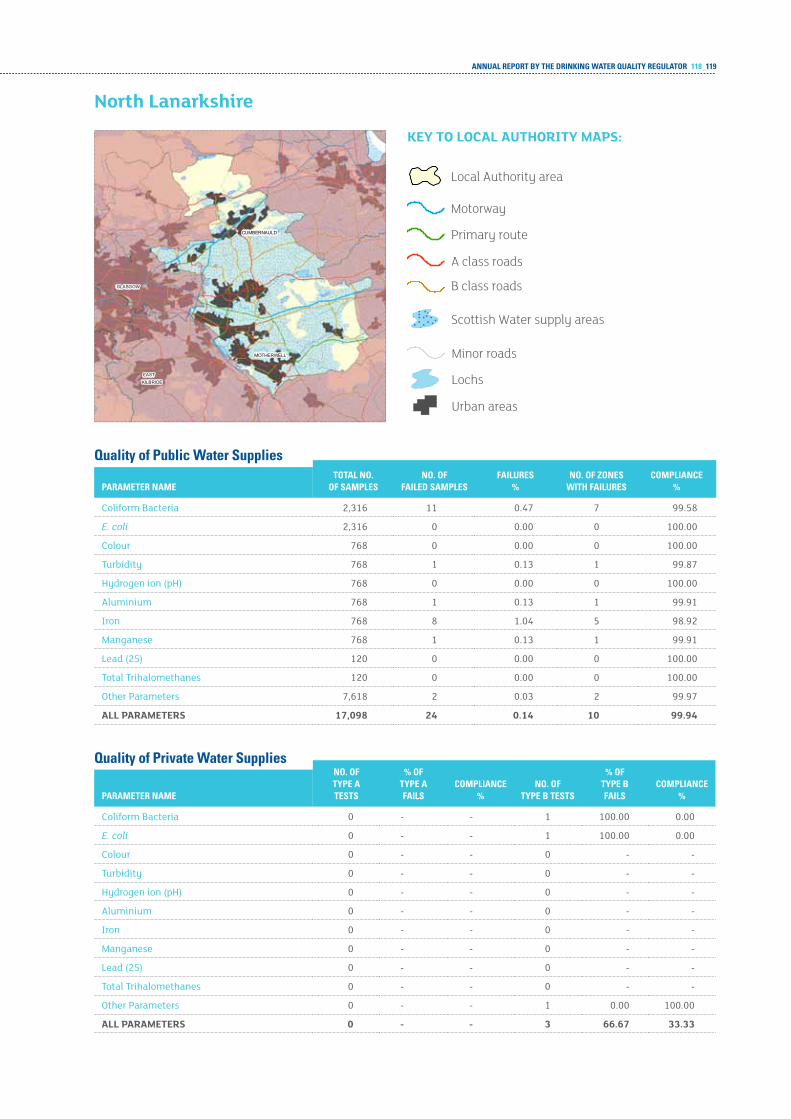
ANNUAL REPORT BY THE DRINKING WATER QUALITY REGULATOR 118_119
KILBRIDE
EAST
GLASGOW
CUMBERNAULD
MOTHERWELL
Quality of Public Water SuppliesTOTAL NO.
OF SAmPLESNO. OF
FAILED SAmPLESFAILURES
%NO. OF zONES
WITH FAILURESCOmPLIANCE
%PARAmETER NAmE
Coliform Bacteria 2,316 11 0.47 7 99.58
E. coli 2,316 0 0.00 0 100.00
Colour 768 0 0.00 0 100.00
turbidity 768 1 0.13 1 99.87
Hydrogen ion (pH) 768 0 0.00 0 100.00
aluminium 768 1 0.13 1 99.91
iron 768 8 1.04 5 98.92
Manganese 768 1 0.13 1 99.91
Lead (25) 120 0 0.00 0 100.00
total trihalomethanes 120 0 0.00 0 100.00
Other Parameters 7,618 2 0.03 2 99.97
all paraMeterS 17,098 24 0.14 10 99.94
Quality of Private Water SuppliesNO. OF TYPE A TESTS
% OF TYPE A FAILS
COmPLIANCE %
NO. OF TYPE B TESTS
% OF TYPE B FAILS
COmPLIANCE %PARAmETER NAmE
Coliform Bacteria 0 - - 1 100.00 0.00
E. coli 0 - - 1 100.00 0.00
Colour 0 - - 0 - -
turbidity 0 - - 0 - -
Hydrogen ion (pH) 0 - - 0 - -
aluminium 0 - - 0 - -
iron 0 - - 0 - -
Manganese 0 - - 0 - -
Lead (25) 0 - - 0 - -
total trihalomethanes 0 - - 0 - -
Other Parameters 0 - - 1 0.00 100.00
all paraMeterS 0 - - 3 66.67 33.33
north lanarkshire
Scottish Water supply areas
Urban areas
Lochs
Minor roads
Motorway
Primary route
A class roads
B class roads
Local Authority area
key to local authority MapS:

DRINKING WATER QUALITYIN SCOTLAND 2011
THURSO
STROMNESSKIRKWALL
Quality of Public Water SuppliesTOTAL NO.
OF SAmPLESNO. OF
FAILED SAmPLESFAILURES
%NO. OF zONES
WITH FAILURESCOmPLIANCE
%PARAmETER NAmE
Coliform Bacteria 135 0 0.00 0 100.00
E. coli 135 0 0.00 0 100.00
Colour 58 0 0.00 0 100.00
turbidity 59 0 0.00 0 100.00
Hydrogen ion (pH) 59 0 0.00 0 100.00
aluminium 60 0 0.00 0 100.00
iron 60 1 1.67 1 99.65
Manganese 60 0 0.00 0 100.00
Lead (25) 40 0 0.00 0 100.00
total trihalomethanes 39 3 7.69 3 88.54
Other Parameters 1,486 1 0.07 1 99.94
all paraMeterS 2,191 5 0.23 4 99.69
Quality of Private Water SuppliesNO. OF TYPE A TESTS
% OF TYPE A FAILS
COmPLIANCE %
NO. OF TYPE B TESTS
% OF TYPE B FAILS
COmPLIANCE %PARAmETER NAmE
Coliform Bacteria 26 61.54 38.46 36 75.00 25.00
E. coli 26 15.38 84.62 36 36.11 63.89
Colour 22 9.09 90.91 1 0.00 100.00
turbidity 23 4.35 95.65 30 10.00 90.00
Hydrogen ion (pH) 23 17.39 82.61 32 0.00 100.00
aluminium 22 4.55 95.45 1 0.00 100.00
iron 22 9.09 90.91 1 0.00 100.00
Manganese 0 - - 0 - -
Lead (25) 1 0.00 100.00 32 6.25 93.75
total trihalomethanes 0 - - 0 - -
Other Parameters 185 5.95 94.05 158 9.49 90.51
all paraMeterS 350 11.71 88.29 327 18.35 81.65
orkney
Scottish Water supply areas
Urban areas
Lochs
Minor roads
Motorway
Primary route
A class roads
B class roads
Local Authority area
key to local authority MapS:
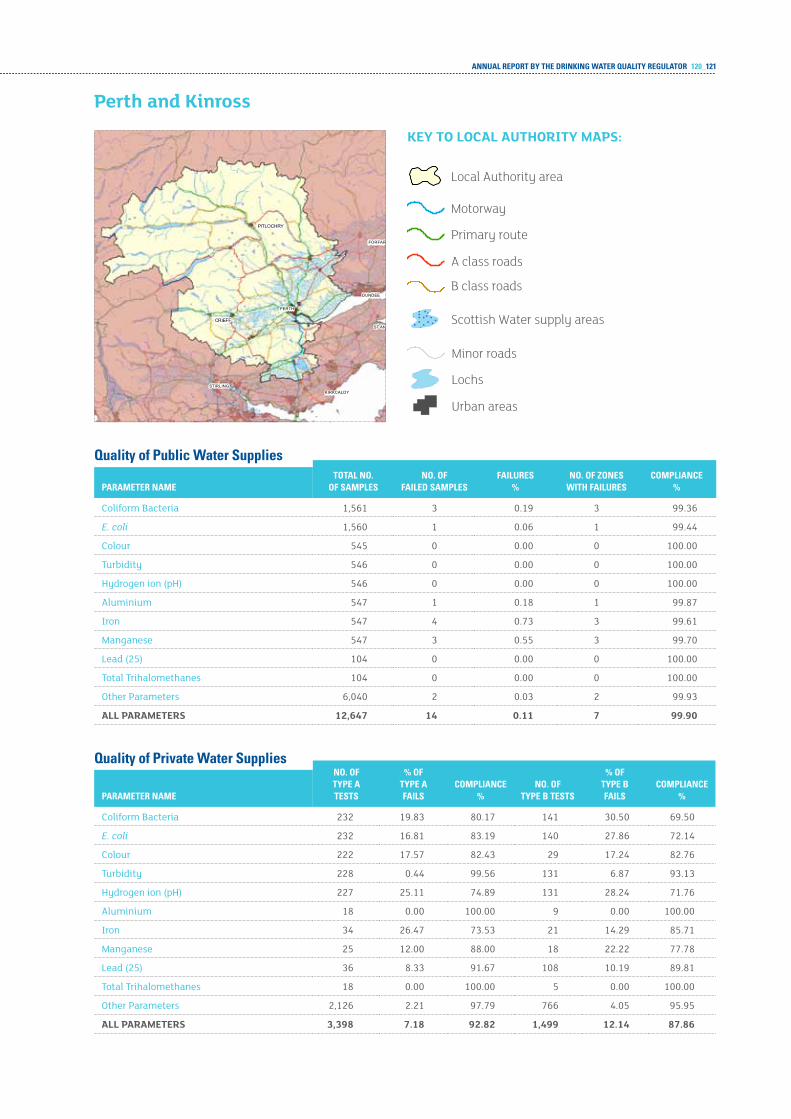
ANNUAL REPORT BY THE DRINKING WATER QUALITY REGULATOR 120_121
KIRKCALDYSTIRLING
ST AND
PERTH
DUNDEE
FORFAR
CRIEFF
PITLOCHRY
Quality of Public Water SuppliesTOTAL NO.
OF SAmPLESNO. OF
FAILED SAmPLESFAILURES
%NO. OF zONES
WITH FAILURESCOmPLIANCE
%PARAmETER NAmE
Coliform Bacteria 1,561 3 0.19 3 99.36
E. coli 1,560 1 0.06 1 99.44
Colour 545 0 0.00 0 100.00
turbidity 546 0 0.00 0 100.00
Hydrogen ion (pH) 546 0 0.00 0 100.00
aluminium 547 1 0.18 1 99.87
iron 547 4 0.73 3 99.61
Manganese 547 3 0.55 3 99.70
Lead (25) 104 0 0.00 0 100.00
total trihalomethanes 104 0 0.00 0 100.00
Other Parameters 6,040 2 0.03 2 99.93
all paraMeterS 12,647 14 0.11 7 99.90
Quality of Private Water SuppliesNO. OF TYPE A TESTS
% OF TYPE A FAILS
COmPLIANCE %
NO. OF TYPE B TESTS
% OF TYPE B FAILS
COmPLIANCE %PARAmETER NAmE
Coliform Bacteria 232 19.83 80.17 141 30.50 69.50
E. coli 232 16.81 83.19 140 27.86 72.14
Colour 222 17.57 82.43 29 17.24 82.76
turbidity 228 0.44 99.56 131 6.87 93.13
Hydrogen ion (pH) 227 25.11 74.89 131 28.24 71.76
aluminium 18 0.00 100.00 9 0.00 100.00
iron 34 26.47 73.53 21 14.29 85.71
Manganese 25 12.00 88.00 18 22.22 77.78
Lead (25) 36 8.33 91.67 108 10.19 89.81
total trihalomethanes 18 0.00 100.00 5 0.00 100.00
Other Parameters 2,126 2.21 97.79 766 4.05 95.95
all paraMeterS 3,398 7.18 92.82 1,499 12.14 87.86
perth and kinross
Scottish Water supply areas
Urban areas
Lochs
Minor roads
Motorway
Primary route
A class roads
B class roads
Local Authority area
key to local authority MapS:
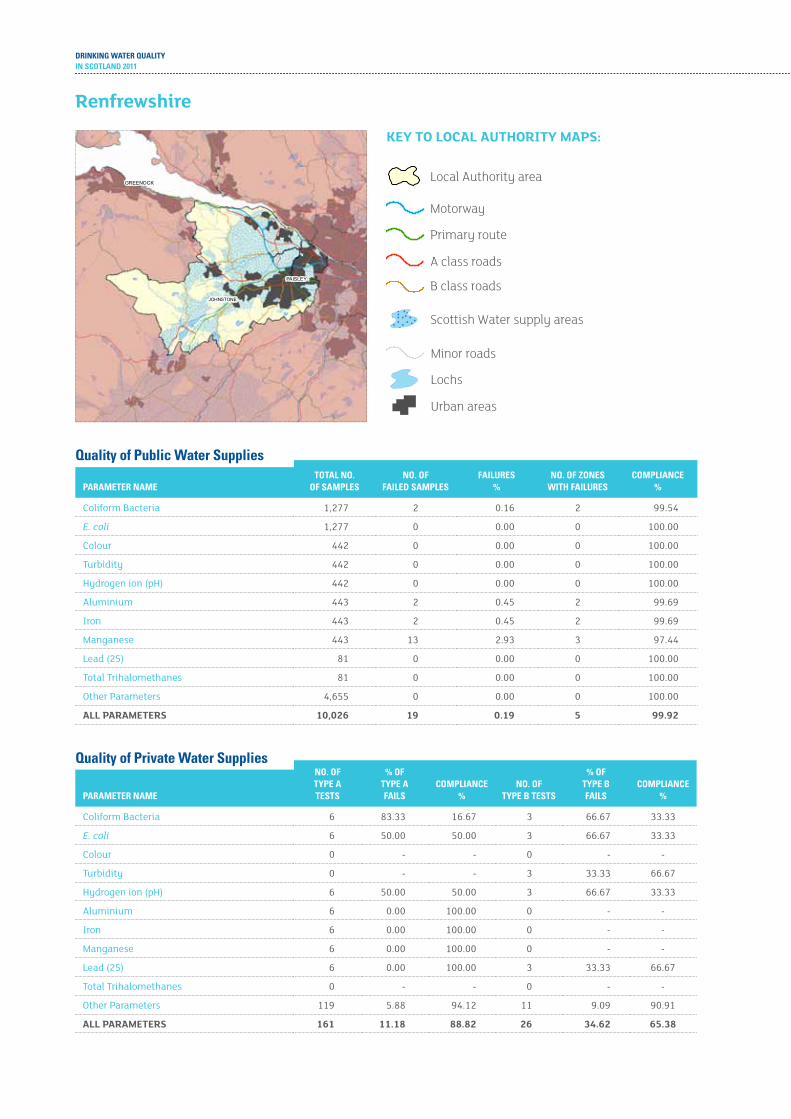
DRINKING WATER QUALITYIN SCOTLAND 2011
PAISLEY
GREENOCK
JOHNSTONE
Quality of Public Water SuppliesTOTAL NO.
OF SAmPLESNO. OF
FAILED SAmPLESFAILURES
%NO. OF zONES
WITH FAILURESCOmPLIANCE
%PARAmETER NAmE
Coliform Bacteria 1,277 2 0.16 2 99.54
E. coli 1,277 0 0.00 0 100.00
Colour 442 0 0.00 0 100.00
turbidity 442 0 0.00 0 100.00
Hydrogen ion (pH) 442 0 0.00 0 100.00
aluminium 443 2 0.45 2 99.69
iron 443 2 0.45 2 99.69
Manganese 443 13 2.93 3 97.44
Lead (25) 81 0 0.00 0 100.00
total trihalomethanes 81 0 0.00 0 100.00
Other Parameters 4,655 0 0.00 0 100.00
all paraMeterS 10,026 19 0.19 5 99.92
Quality of Private Water SuppliesNO. OF TYPE A TESTS
% OF TYPE A FAILS
COmPLIANCE %
NO. OF TYPE B TESTS
% OF TYPE B FAILS
COmPLIANCE %PARAmETER NAmE
Coliform Bacteria 6 83.33 16.67 3 66.67 33.33
E. coli 6 50.00 50.00 3 66.67 33.33
Colour 0 - - 0 - -
turbidity 0 - - 3 33.33 66.67
Hydrogen ion (pH) 6 50.00 50.00 3 66.67 33.33
aluminium 6 0.00 100.00 0 - -
iron 6 0.00 100.00 0 - -
Manganese 6 0.00 100.00 0 - -
Lead (25) 6 0.00 100.00 3 33.33 66.67
total trihalomethanes 0 - - 0 - -
Other Parameters 119 5.88 94.12 11 9.09 90.91
all paraMeterS 161 11.18 88.82 26 34.62 65.38
renfrewshire
Scottish Water supply areas
Urban areas
Lochs
Minor roads
Motorway
Primary route
A class roads
B class roads
Local Authority area
key to local authority MapS:
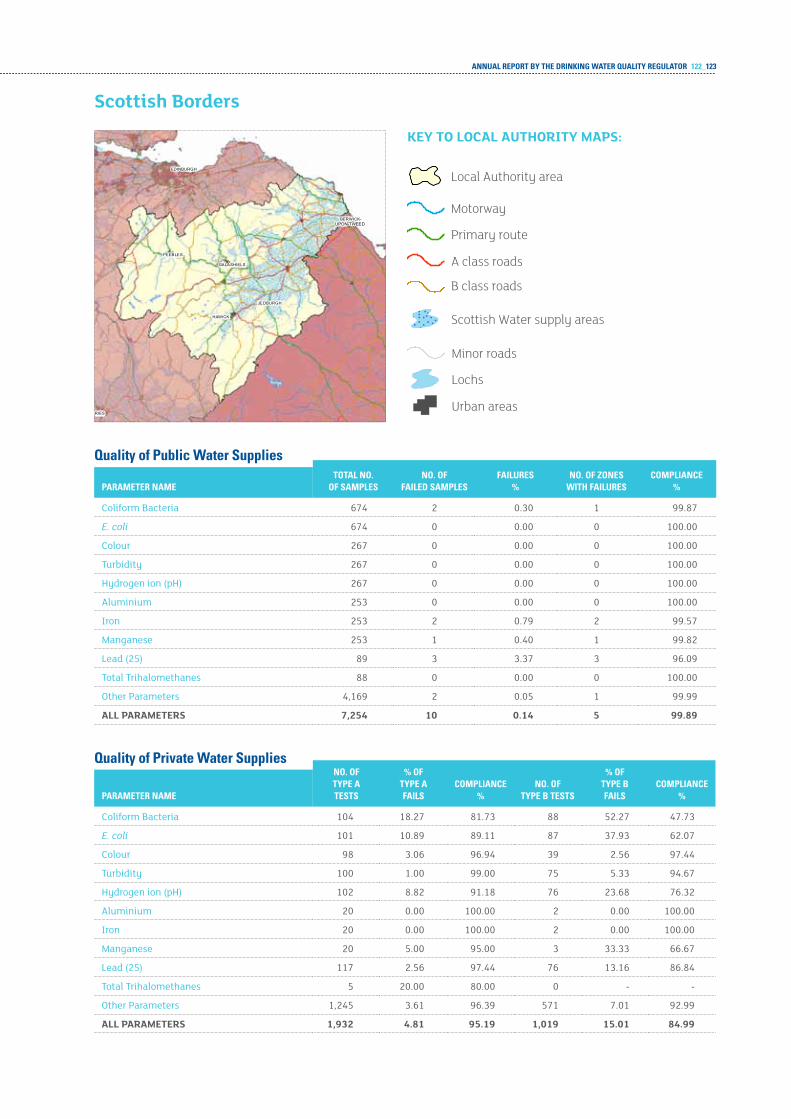
ANNUAL REPORT BY THE DRINKING WATER QUALITY REGULATOR 122_123
FRIES
HAWICK
JEDBURGH
GALASHIELS
PEEBLES
BERWICK-UPON-TWEED
EDINBURGH
Quality of Public Water SuppliesTOTAL NO.
OF SAmPLESNO. OF
FAILED SAmPLESFAILURES
%NO. OF zONES
WITH FAILURESCOmPLIANCE
%PARAmETER NAmE
Coliform Bacteria 674 2 0.30 1 99.87
E. coli 674 0 0.00 0 100.00
Colour 267 0 0.00 0 100.00
turbidity 267 0 0.00 0 100.00
Hydrogen ion (pH) 267 0 0.00 0 100.00
aluminium 253 0 0.00 0 100.00
iron 253 2 0.79 2 99.57
Manganese 253 1 0.40 1 99.82
Lead (25) 89 3 3.37 3 96.09
total trihalomethanes 88 0 0.00 0 100.00
Other Parameters 4,169 2 0.05 1 99.99
all paraMeterS 7,254 10 0.14 5 99.89
Quality of Private Water SuppliesNO. OF TYPE A TESTS
% OF TYPE A FAILS
COmPLIANCE %
NO. OF TYPE B TESTS
% OF TYPE B FAILS
COmPLIANCE %PARAmETER NAmE
Coliform Bacteria 104 18.27 81.73 88 52.27 47.73
E. coli 101 10.89 89.11 87 37.93 62.07
Colour 98 3.06 96.94 39 2.56 97.44
turbidity 100 1.00 99.00 75 5.33 94.67
Hydrogen ion (pH) 102 8.82 91.18 76 23.68 76.32
aluminium 20 0.00 100.00 2 0.00 100.00
iron 20 0.00 100.00 2 0.00 100.00
Manganese 20 5.00 95.00 3 33.33 66.67
Lead (25) 117 2.56 97.44 76 13.16 86.84
total trihalomethanes 5 20.00 80.00 0 - -
Other Parameters 1,245 3.61 96.39 571 7.01 92.99
all paraMeterS 1,932 4.81 95.19 1,019 15.01 84.99
Scottish borders
Scottish Water supply areas
Urban areas
Lochs
Minor roads
Motorway
Primary route
A class roads
B class roads
Local Authority area
key to local authority MapS:
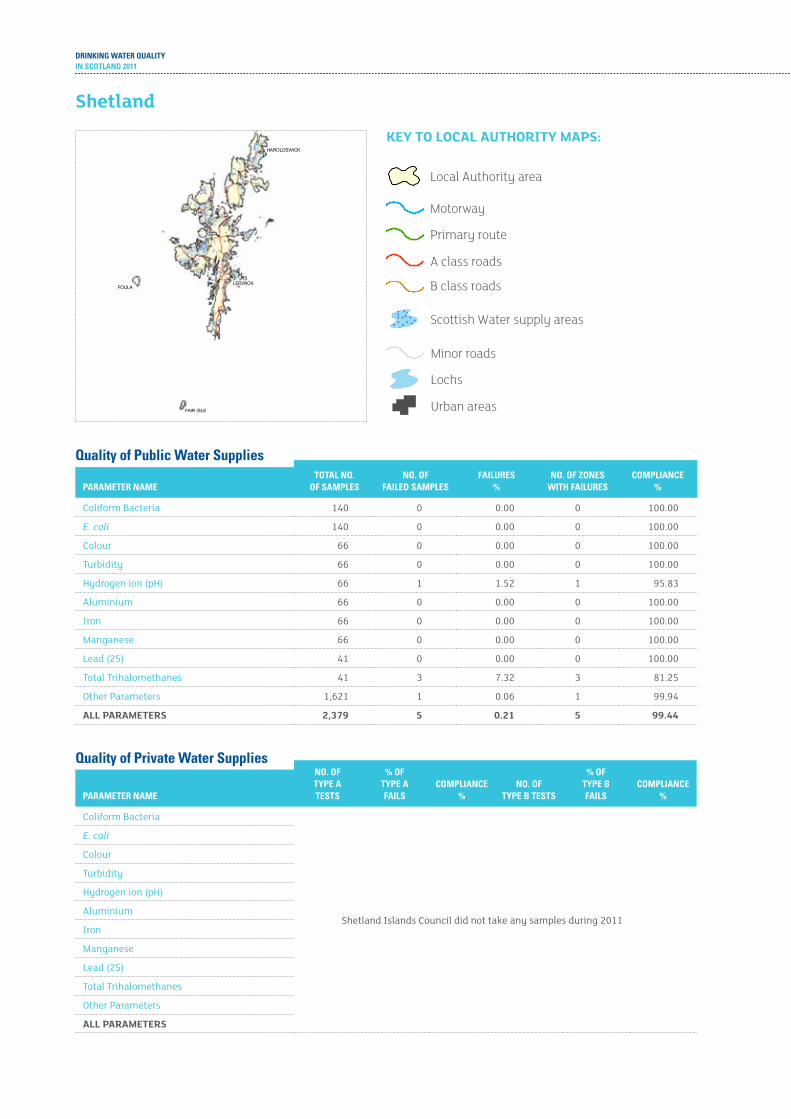
DRINKING WATER QUALITYIN SCOTLAND 2011
FOULALERWICK
HAROLDSWICK
FAIR ISLE
Quality of Public Water SuppliesTOTAL NO.
OF SAmPLESNO. OF
FAILED SAmPLESFAILURES
%NO. OF zONES
WITH FAILURESCOmPLIANCE
%PARAmETER NAmE
Coliform Bacteria 140 0 0.00 0 100.00
E. coli 140 0 0.00 0 100.00
Colour 66 0 0.00 0 100.00
turbidity 66 0 0.00 0 100.00
Hydrogen ion (pH) 66 1 1.52 1 95.83
aluminium 66 0 0.00 0 100.00
iron 66 0 0.00 0 100.00
Manganese 66 0 0.00 0 100.00
Lead (25) 41 0 0.00 0 100.00
total trihalomethanes 41 3 7.32 3 81.25
Other Parameters 1,621 1 0.06 1 99.94
all paraMeterS 2,379 5 0.21 5 99.44
Quality of Private Water SuppliesNO. OF TYPE A TESTS
% OF TYPE A FAILS
COmPLIANCE %
NO. OF TYPE B TESTS
% OF TYPE B FAILS
COmPLIANCE %PARAmETER NAmE
Coliform Bacteria
Shetland islands Council did not take any samples during 2011
E. coli
Colour
turbidity
Hydrogen ion (pH)
aluminium
iron
Manganese
Lead (25)
total trihalomethanes
Other Parameters
all paraMeterS
Shetland
Scottish Water supply areas
Urban areas
Lochs
Minor roads
Motorway
Primary route
A class roads
B class roads
Local Authority area
key to local authority MapS:
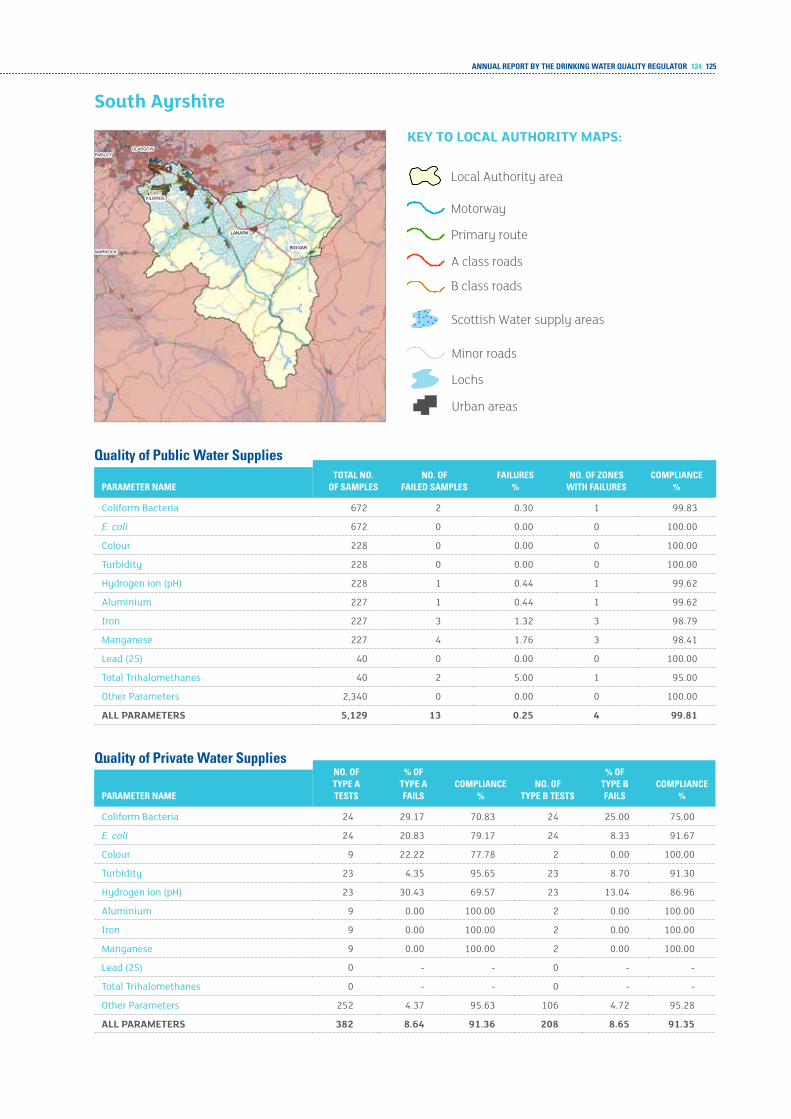
ANNUAL REPORT BY THE DRINKING WATER QUALITY REGULATOR 124_125
LMARNOCK
KILBRIDEEAST
PAISLEYGLASGOW
BIGGAR
LANARK
Quality of Public Water SuppliesTOTAL NO.
OF SAmPLESNO. OF
FAILED SAmPLESFAILURES
%NO. OF zONES
WITH FAILURESCOmPLIANCE
%PARAmETER NAmE
Coliform Bacteria 672 2 0.30 1 99.83
E. coli 672 0 0.00 0 100.00
Colour 228 0 0.00 0 100.00
turbidity 228 0 0.00 0 100.00
Hydrogen ion (pH) 228 1 0.44 1 99.62
aluminium 227 1 0.44 1 99.62
iron 227 3 1.32 3 98.79
Manganese 227 4 1.76 3 98.41
Lead (25) 40 0 0.00 0 100.00
total trihalomethanes 40 2 5.00 1 95.00
Other Parameters 2,340 0 0.00 0 100.00
all paraMeterS 5,129 13 0.25 4 99.81
Quality of Private Water SuppliesNO. OF TYPE A TESTS
% OF TYPE A FAILS
COmPLIANCE %
NO. OF TYPE B TESTS
% OF TYPE B FAILS
COmPLIANCE %PARAmETER NAmE
Coliform Bacteria 24 29.17 70.83 24 25.00 75.00
E. coli 24 20.83 79.17 24 8.33 91.67
Colour 9 22.22 77.78 2 0.00 100.00
turbidity 23 4.35 95.65 23 8.70 91.30
Hydrogen ion (pH) 23 30.43 69.57 23 13.04 86.96
aluminium 9 0.00 100.00 2 0.00 100.00
iron 9 0.00 100.00 2 0.00 100.00
Manganese 9 0.00 100.00 2 0.00 100.00
Lead (25) 0 - - 0 - -
total trihalomethanes 0 - - 0 - -
Other Parameters 252 4.37 95.63 106 4.72 95.28
all paraMeterS 382 8.64 91.36 208 8.65 91.35
South ayrshire
Scottish Water supply areas
Urban areas
Lochs
Minor roads
Motorway
Primary route
A class roads
B class roads
Local Authority area
key to local authority MapS:
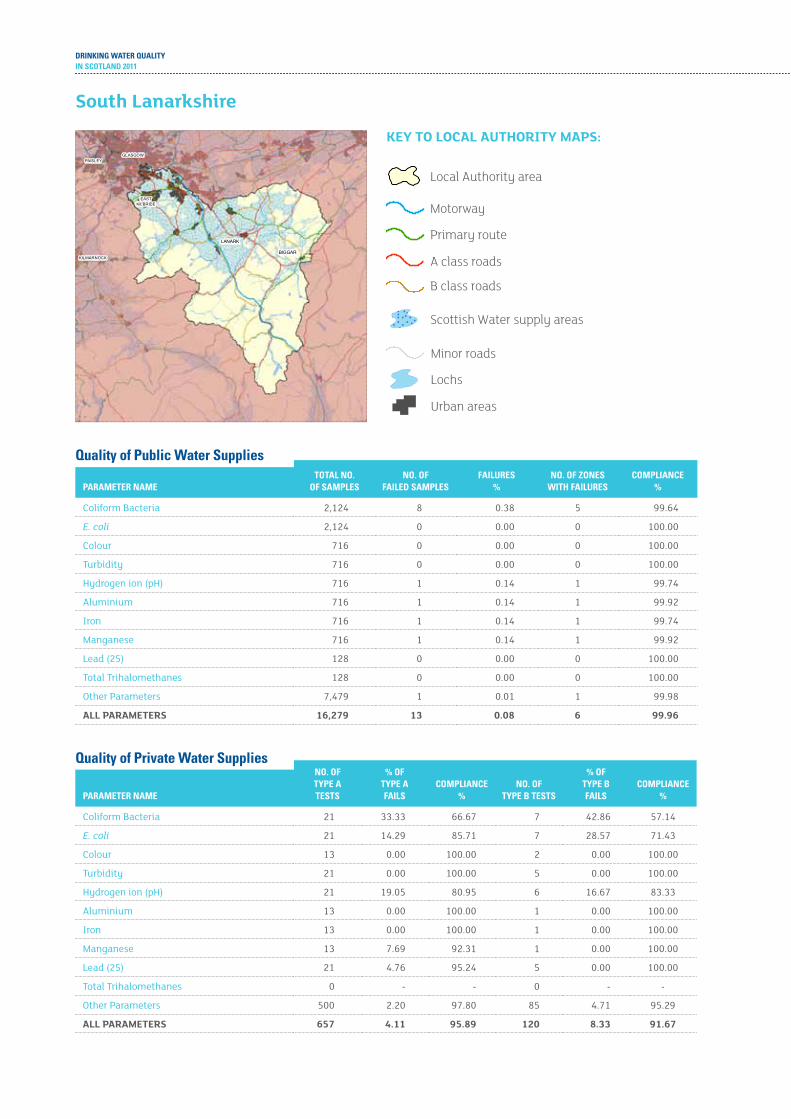
DRINKING WATER QUALITYIN SCOTLAND 2011
KILMARNOCK
EASTKILBRIDE
PAISLEYGLASGOW
BIGGAR
LANARK
Quality of Public Water SuppliesTOTAL NO.
OF SAmPLESNO. OF
FAILED SAmPLESFAILURES
%NO. OF zONES
WITH FAILURESCOmPLIANCE
%PARAmETER NAmE
Coliform Bacteria 2,124 8 0.38 5 99.64
E. coli 2,124 0 0.00 0 100.00
Colour 716 0 0.00 0 100.00
turbidity 716 0 0.00 0 100.00
Hydrogen ion (pH) 716 1 0.14 1 99.74
aluminium 716 1 0.14 1 99.92
iron 716 1 0.14 1 99.74
Manganese 716 1 0.14 1 99.92
Lead (25) 128 0 0.00 0 100.00
total trihalomethanes 128 0 0.00 0 100.00
Other Parameters 7,479 1 0.01 1 99.98
all paraMeterS 16,279 13 0.08 6 99.96
Quality of Private Water SuppliesNO. OF TYPE A TESTS
% OF TYPE A FAILS
COmPLIANCE %
NO. OF TYPE B TESTS
% OF TYPE B FAILS
COmPLIANCE %PARAmETER NAmE
Coliform Bacteria 21 33.33 66.67 7 42.86 57.14
E. coli 21 14.29 85.71 7 28.57 71.43
Colour 13 0.00 100.00 2 0.00 100.00
turbidity 21 0.00 100.00 5 0.00 100.00
Hydrogen ion (pH) 21 19.05 80.95 6 16.67 83.33
aluminium 13 0.00 100.00 1 0.00 100.00
iron 13 0.00 100.00 1 0.00 100.00
Manganese 13 7.69 92.31 1 0.00 100.00
Lead (25) 21 4.76 95.24 5 0.00 100.00
total trihalomethanes 0 - - 0 - -
Other Parameters 500 2.20 97.80 85 4.71 95.29
all paraMeterS 657 4.11 95.89 120 8.33 91.67
South lanarkshire
Scottish Water supply areas
Urban areas
Lochs
Minor roads
Motorway
Primary route
A class roads
B class roads
Local Authority area
key to local authority MapS:
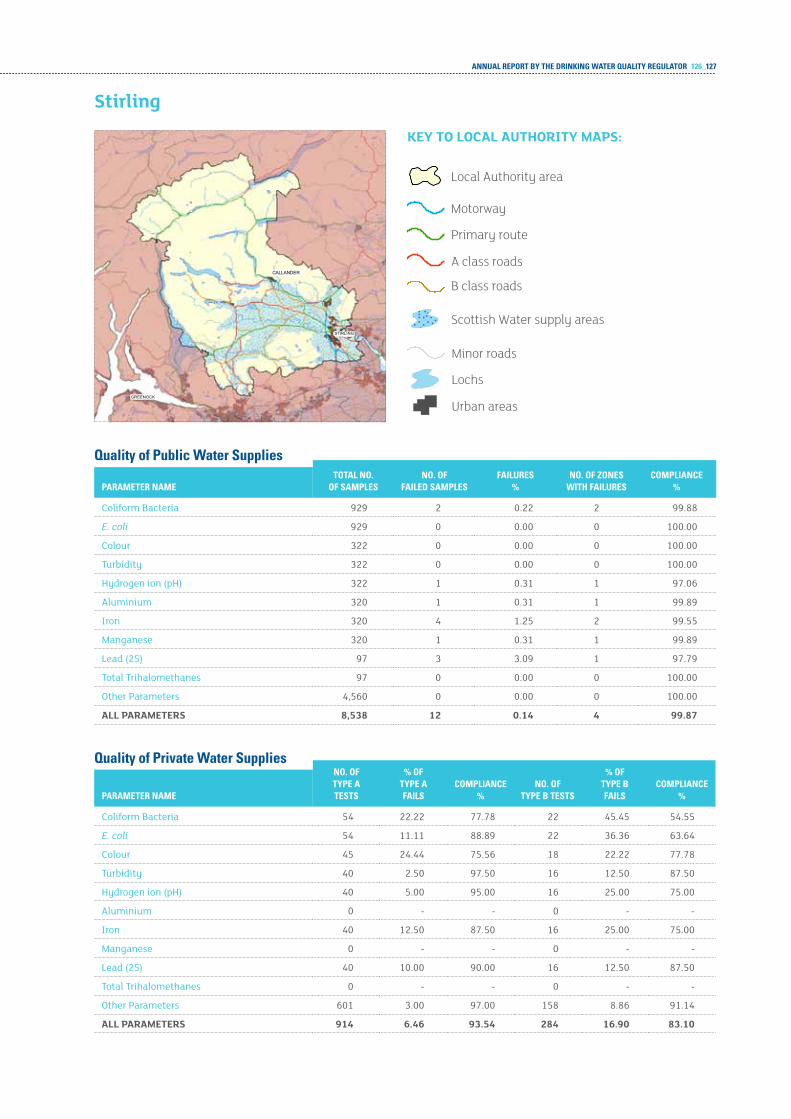
ANNUAL REPORT BY THE DRINKING WATER QUALITY REGULATOR 126_127
GREENOCK
STIRLING
CALLANDER
Quality of Public Water SuppliesTOTAL NO.
OF SAmPLESNO. OF
FAILED SAmPLESFAILURES
%NO. OF zONES
WITH FAILURESCOmPLIANCE
%PARAmETER NAmE
Coliform Bacteria 929 2 0.22 2 99.88
E. coli 929 0 0.00 0 100.00
Colour 322 0 0.00 0 100.00
turbidity 322 0 0.00 0 100.00
Hydrogen ion (pH) 322 1 0.31 1 97.06
aluminium 320 1 0.31 1 99.89
iron 320 4 1.25 2 99.55
Manganese 320 1 0.31 1 99.89
Lead (25) 97 3 3.09 1 97.79
total trihalomethanes 97 0 0.00 0 100.00
Other Parameters 4,560 0 0.00 0 100.00
all paraMeterS 8,538 12 0.14 4 99.87
Quality of Private Water SuppliesNO. OF TYPE A TESTS
% OF TYPE A FAILS
COmPLIANCE %
NO. OF TYPE B TESTS
% OF TYPE B FAILS
COmPLIANCE %PARAmETER NAmE
Coliform Bacteria 54 22.22 77.78 22 45.45 54.55
E. coli 54 11.11 88.89 22 36.36 63.64
Colour 45 24.44 75.56 18 22.22 77.78
turbidity 40 2.50 97.50 16 12.50 87.50
Hydrogen ion (pH) 40 5.00 95.00 16 25.00 75.00
aluminium 0 - - 0 - -
iron 40 12.50 87.50 16 25.00 75.00
Manganese 0 - - 0 - -
Lead (25) 40 10.00 90.00 16 12.50 87.50
total trihalomethanes 0 - - 0 - -
Other Parameters 601 3.00 97.00 158 8.86 91.14
all paraMeterS 914 6.46 93.54 284 16.90 83.10
Stirling
Scottish Water supply areas
Urban areas
Lochs
Minor roads
Motorway
Primary route
A class roads
B class roads
Local Authority area
key to local authority MapS:
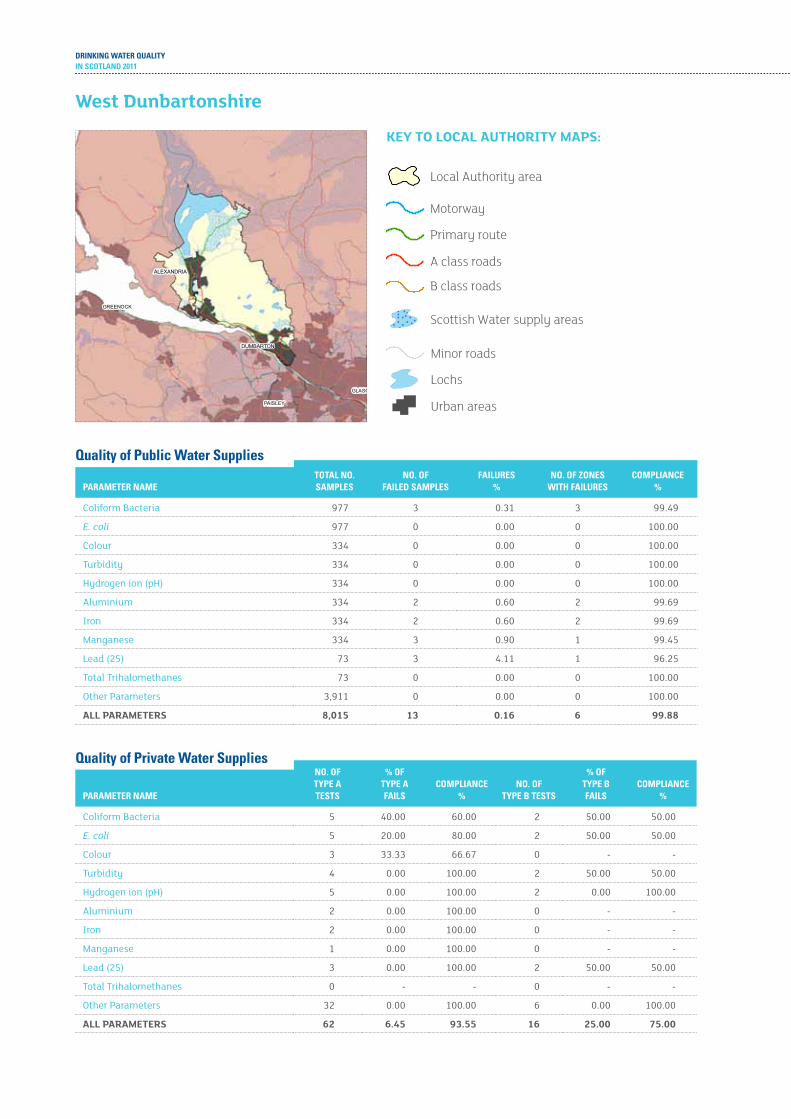
DRINKING WATER QUALITYIN SCOTLAND 2011
PAISLEY
GLASG
GREENOCK
ALEXANDRIA
DUMBARTON
Quality of Public Water SuppliesTOTAL NO. SAmPLES
NO. OF FAILED SAmPLES
FAILURES %
NO. OF zONES WITH FAILURES
COmPLIANCE %PARAmETER NAmE
Coliform Bacteria 977 3 0.31 3 99.49
E. coli 977 0 0.00 0 100.00
Colour 334 0 0.00 0 100.00
turbidity 334 0 0.00 0 100.00
Hydrogen ion (pH) 334 0 0.00 0 100.00
aluminium 334 2 0.60 2 99.69
iron 334 2 0.60 2 99.69
Manganese 334 3 0.90 1 99.45
Lead (25) 73 3 4.11 1 96.25
total trihalomethanes 73 0 0.00 0 100.00
Other Parameters 3,911 0 0.00 0 100.00
all paraMeterS 8,015 13 0.16 6 99.88
Quality of Private Water SuppliesNO. OF TYPE A TESTS
% OF TYPE A FAILS
COmPLIANCE %
NO. OF TYPE B TESTS
% OF TYPE B FAILS
COmPLIANCE %PARAmETER NAmE
Coliform Bacteria 5 40.00 60.00 2 50.00 50.00
E. coli 5 20.00 80.00 2 50.00 50.00
Colour 3 33.33 66.67 0 - -
turbidity 4 0.00 100.00 2 50.00 50.00
Hydrogen ion (pH) 5 0.00 100.00 2 0.00 100.00
aluminium 2 0.00 100.00 0 - -
iron 2 0.00 100.00 0 - -
Manganese 1 0.00 100.00 0 - -
Lead (25) 3 0.00 100.00 2 50.00 50.00
total trihalomethanes 0 - - 0 - -
Other Parameters 32 0.00 100.00 6 0.00 100.00
all paraMeterS 62 6.45 93.55 16 25.00 75.00
West dunbartonshire
Scottish Water supply areas
Urban areas
Lochs
Minor roads
Motorway
Primary route
A class roads
B class roads
Local Authority area
key to local authority MapS:
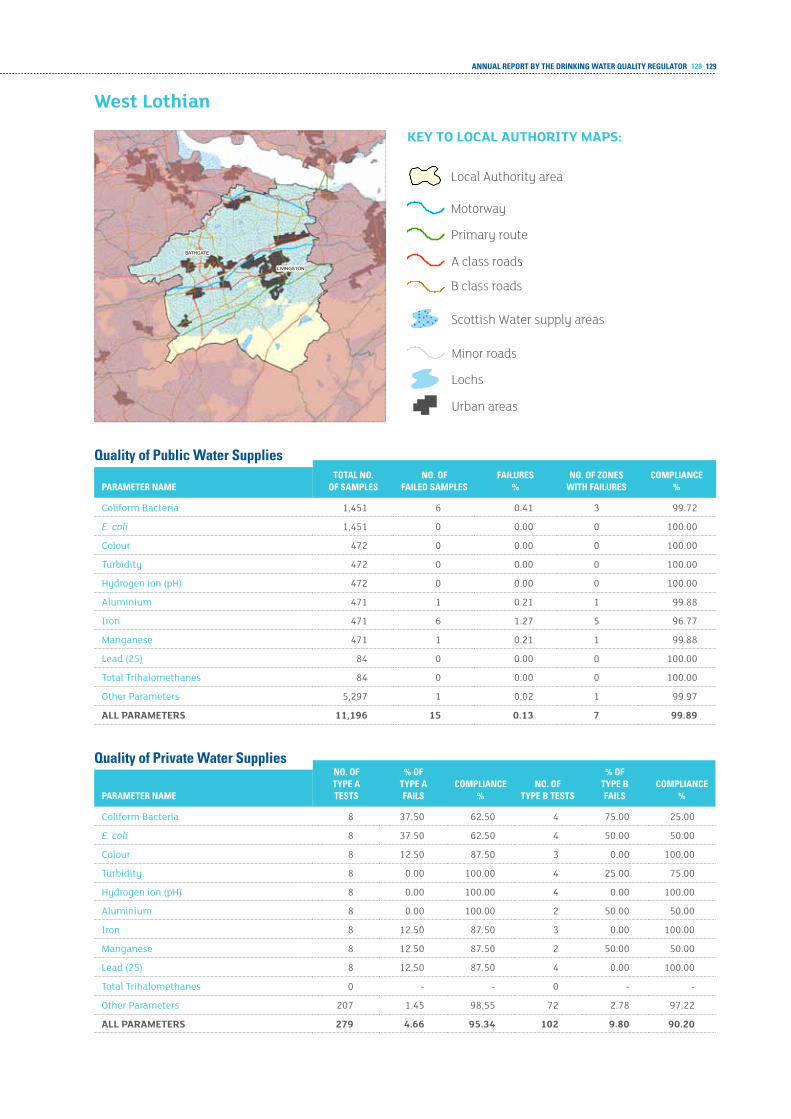
ANNUAL REPORT BY THE DRINKING WATER QUALITY REGULATOR 128_129
BATHGATE
LIVINGSTON
Quality of Public Water SuppliesTOTAL NO.
OF SAmPLESNO. OF
FAILED SAmPLESFAILURES
%NO. OF zONES
WITH FAILURESCOmPLIANCE
%PARAmETER NAmE
Coliform Bacteria 1,451 6 0.41 3 99.72
E. coli 1,451 0 0.00 0 100.00
Colour 472 0 0.00 0 100.00
turbidity 472 0 0.00 0 100.00
Hydrogen ion (pH) 472 0 0.00 0 100.00
aluminium 471 1 0.21 1 99.88
iron 471 6 1.27 5 96.77
Manganese 471 1 0.21 1 99.88
Lead (25) 84 0 0.00 0 100.00
total trihalomethanes 84 0 0.00 0 100.00
Other Parameters 5,297 1 0.02 1 99.97
all paraMeterS 11,196 15 0.13 7 99.89
Quality of Private Water SuppliesNO. OF TYPE A TESTS
% OF TYPE A FAILS
COmPLIANCE %
NO. OF TYPE B TESTS
% OF TYPE B FAILS
COmPLIANCE %PARAmETER NAmE
Coliform Bacteria 8 37.50 62.50 4 75.00 25.00
E. coli 8 37.50 62.50 4 50.00 50.00
Colour 8 12.50 87.50 3 0.00 100.00
turbidity 8 0.00 100.00 4 25.00 75.00
Hydrogen ion (pH) 8 0.00 100.00 4 0.00 100.00
aluminium 8 0.00 100.00 2 50.00 50.00
iron 8 12.50 87.50 3 0.00 100.00
Manganese 8 12.50 87.50 2 50.00 50.00
Lead (25) 8 12.50 87.50 4 0.00 100.00
total trihalomethanes 0 - - 0 - -
Other Parameters 207 1.45 98.55 72 2.78 97.22
all paraMeterS 279 4.66 95.34 102 9.80 90.20
West lothian
Scottish Water supply areas
Urban areas
Lochs
Minor roads
Motorway
Primary route
A class roads
B class roads
Local Authority area
key to local authority MapS:

DRINKING WATER QUALITYIN SCOTLAND 2011
ANNExES

ANNUAL REPORT BY THE DRINKING WATER QUALITY REGULATOR 130_131
DRINKING WATER QUALITYIN SCOTLAND 2011
anneX a – SuMMary of eVentS and incidentSScottish Water is required to tell DWQR about events that could affect water quality. DWQR looks at all events and classifies the most serious as incidents. All incidents are assessed by DWQR and, where appropriate, investigated further. The following tables detail the incidents declared in relation to distribution systems and treatment works events.
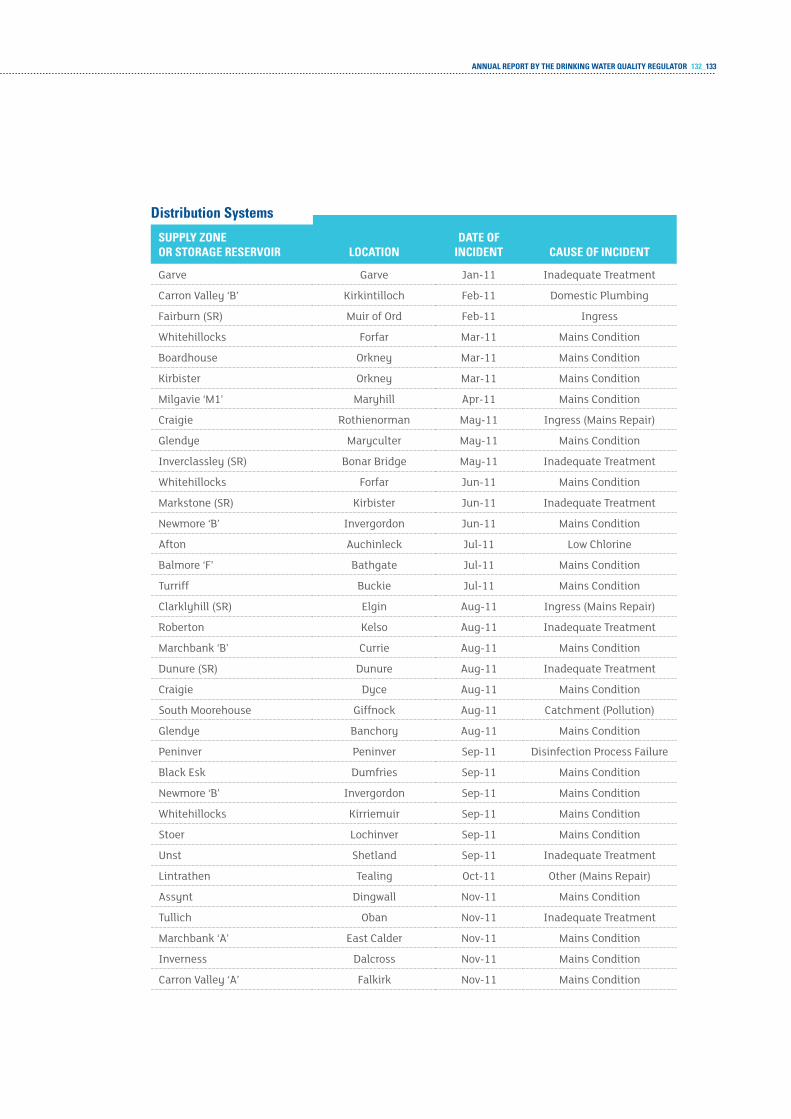
ANNUAL REPORT BY THE DRINKING WATER QUALITY REGULATOR 132_133
Distribution Systems
SUPPLY zONE OR STORAGE RESERvOIR LOCATION
DATE OF INCIDENT CAUSE OF INCIDENT
garve garve Jan-11 inadequate treatment
Carron Valley ‘B’ kirkintilloch Feb-11 Domestic Plumbing
Fairburn (Sr) Muir of Ord Feb-11 ingress
Whitehillocks Forfar Mar-11 Mains Condition
Boardhouse Orkney Mar-11 Mains Condition
kirbister Orkney Mar-11 Mains Condition
Milgavie ‘M1’ Maryhill apr-11 Mains Condition
Craigie rothienorman May-11 ingress (Mains repair)
glendye Maryculter May-11 Mains Condition
inverclassley (Sr) Bonar Bridge May-11 inadequate treatment
Whitehillocks Forfar Jun-11 Mains Condition
Markstone (Sr) kirbister Jun-11 inadequate treatment
newmore ‘B’ invergordon Jun-11 Mains Condition
afton auchinleck Jul-11 Low Chlorine
Balmore ‘F’ Bathgate Jul-11 Mains Condition
turriff Buckie Jul-11 Mains Condition
Clarklyhill (Sr) elgin aug-11 ingress (Mains repair)
roberton kelso aug-11 inadequate treatment
Marchbank ‘B’ Currie aug-11 Mains Condition
Dunure (Sr) Dunure aug-11 inadequate treatment
Craigie Dyce aug-11 Mains Condition
South Moorehouse giffnock aug-11 Catchment (Pollution)
glendye Banchory aug-11 Mains Condition
Peninver Peninver Sep-11 Disinfection Process Failure
Black esk Dumfries Sep-11 Mains Condition
newmore ‘B’ invergordon Sep-11 Mains Condition
Whitehillocks kirriemuir Sep-11 Mains Condition
Stoer Lochinver Sep-11 Mains Condition
Unst Shetland Sep-11 inadequate treatment
Lintrathen tealing Oct-11 Other (Mains repair)
assynt Dingwall nov-11 Mains Condition
tullich Oban nov-11 inadequate treatment
Marchbank ‘a’ east Calder nov-11 Mains Condition
inverness Dalcross nov-11 Mains Condition
Carron Valley ‘a’ Falkirk nov-11 Mains Condition

DRINKING WATER QUALITYIN SCOTLAND 2011
Water Treatment Works
SITEDATE OF
INCIDENT CAUSE OF INCIDENT
aMLairD WtW Jan-11 inadequate treatment
tarSkaVaig WtW Jan-11 inadequate treatment
CraignUre WtW Jan-11 inadequate treatment
aMLairD WtW Jan-11 SCaDa / PLC / telemetry
DerVaig WtW Jan-11 Disinfection Process Failure
tUrriFF WtW Feb-11 Disinfection Process Failure
LOCH eCk WtW Feb-11 Disinfection Process Failure
BOnCHeSter WtW Feb-11 SCaDa / PLC / telemetry
knOWeHeaD WtW Mar-11 Disinfection Process Failure
gLenFinnan WtW Mar-11 Disinfection Process Failure
neWMOre WtW Mar-11 Power Failure
BUrnCrOOkS WtW Mar-11 Failure of Coagulation
CarrOn VaLLeY WtW apr-11 Power Failure
kiLBerrY WtW May-11 Disinfection Process Failure
PaPa StOUr WtW May-11 inadequate treatment
aCHMOre WtW May-11 inadequate treatment
rOSeBerY WtW May-11 Failure of Coagulation
tOMnaVOULin WtW May-11 inadequate treatment
aMLairD WtW Jun-11 inadequate treatment
PiCketLaW WtW Jun-11 Final water pH Control
SHieLDaig WtW Jul-11 inadequate treatment
eLPHin WtW Jul-11 inadequate treatment
MUirDYkeS WtW Jul-11 inadequate treatment
PateSHiLL WtW Jul-11 Mains Condition
kinLOCHeWe WtW Jul-11 inadequate treatment
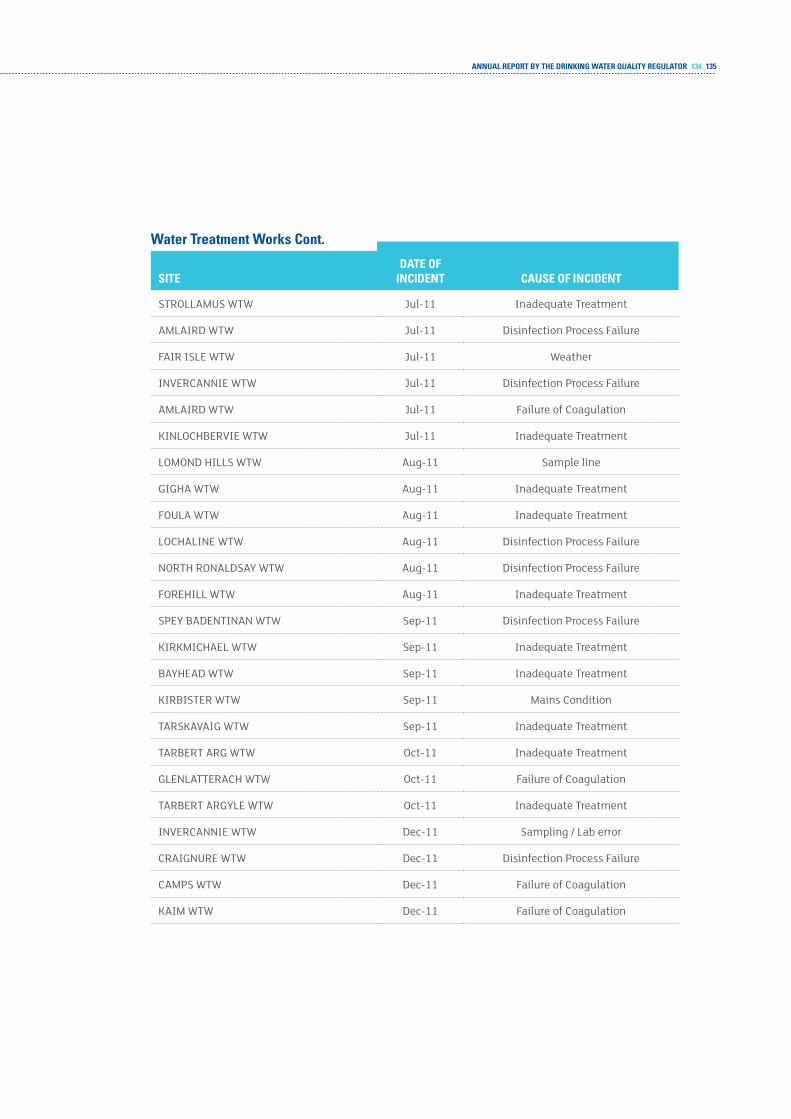
ANNUAL REPORT BY THE DRINKING WATER QUALITY REGULATOR 134_135
Water Treatment Works Cont.
SITEDATE OF
INCIDENT CAUSE OF INCIDENT
StrOLLaMUS WtW Jul-11 inadequate treatment
aMLairD WtW Jul-11 Disinfection Process Failure
Fair iSLe WtW Jul-11 Weather
inVerCannie WtW Jul-11 Disinfection Process Failure
aMLairD WtW Jul-11 Failure of Coagulation
kinLOCHBerVie WtW Jul-11 inadequate treatment
LOMOnD HiLLS WtW aug-11 Sample line
gigHa WtW aug-11 inadequate treatment
FOULa WtW aug-11 inadequate treatment
LOCHaLine WtW aug-11 Disinfection Process Failure
nOrtH rOnaLDSaY WtW aug-11 Disinfection Process Failure
FOreHiLL WtW aug-11 inadequate treatment
SPeY BaDentinan WtW Sep-11 Disinfection Process Failure
kirkMiCHaeL WtW Sep-11 inadequate treatment
BaYHeaD WtW Sep-11 inadequate treatment
kirBiSter WtW Sep-11 Mains Condition
tarSkaVaig WtW Sep-11 inadequate treatment
tarBert arg WtW Oct-11 inadequate treatment
gLenLatteraCH WtW Oct-11 Failure of Coagulation
tarBert argYLe WtW Oct-11 inadequate treatment
inVerCannie WtW Dec-11 Sampling / Lab error
CraignUre WtW Dec-11 Disinfection Process Failure
CaMPS WtW Dec-11 Failure of Coagulation
kaiM WtW Dec-11 Failure of Coagulation
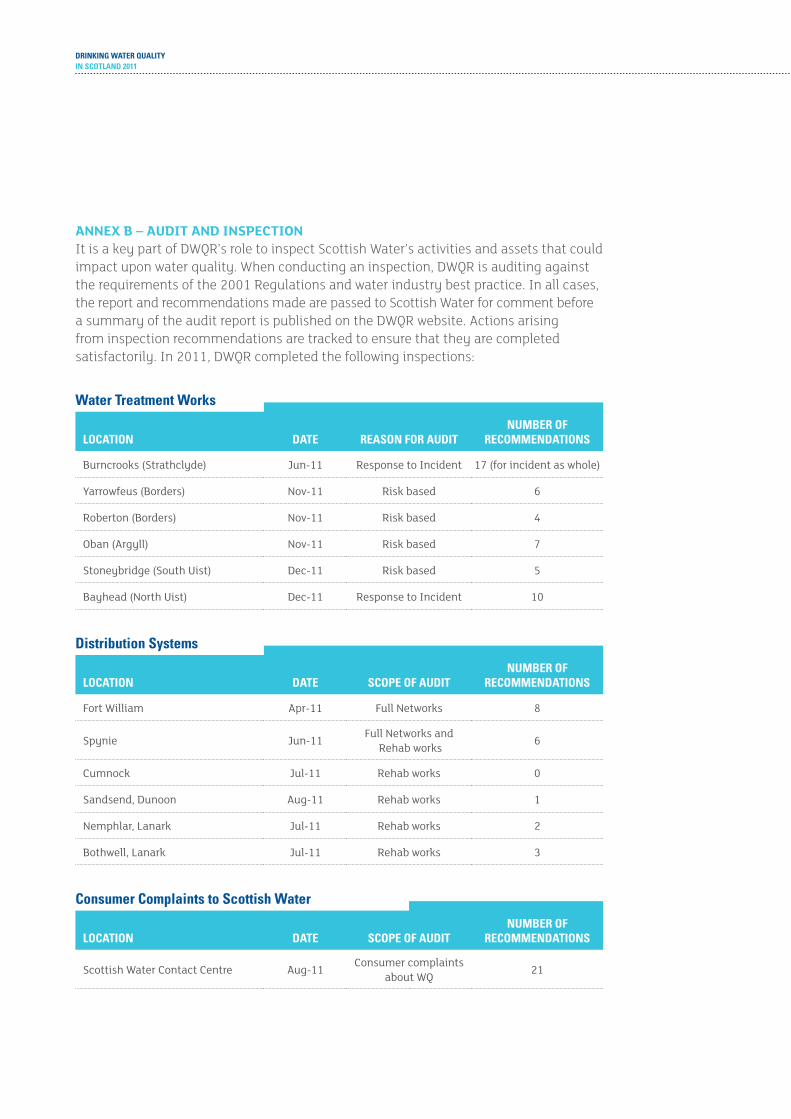
DRINKING WATER QUALITYIN SCOTLAND 2011
anneX b – audit and inSpectionIt is a key part of DWQR’s role to inspect Scottish Water’s activities and assets that could impact upon water quality. When conducting an inspection, DWQR is auditing against the requirements of the 2001 Regulations and water industry best practice. In all cases, the report and recommendations made are passed to Scottish Water for comment before a summary of the audit report is published on the DWQR website. Actions arising from inspection recommendations are tracked to ensure that they are completed satisfactorily. In 2011, DWQR completed the following inspections:
Water Treatment Works
LOCATION DATE REASON FOR AUDITNUmBER OF
RECOmmENDATIONS
Burncrooks (Strathclyde) Jun-11 response to incident 17 (for incident as whole)
Yarrowfeus (Borders) nov-11 risk based 6
roberton (Borders) nov-11 risk based 4
Oban (argyll) nov-11 risk based 7
Stoneybridge (South Uist) Dec-11 risk based 5
Bayhead (north Uist) Dec-11 response to incident 10
Distribution Systems
LOCATION DATE SCOPE OF AUDITNUmBER OF
RECOmmENDATIONS
Fort William apr-11 Full networks 8
Spynie Jun-11 Full networks and rehab works 6
Cumnock Jul-11 rehab works 0
Sandsend, Dunoon aug-11 rehab works 1
nemphlar, Lanark Jul-11 rehab works 2
Bothwell, Lanark Jul-11 rehab works 3
Consumer Complaints to Scottish Water
LOCATION DATE SCOPE OF AUDITNUmBER OF
RECOmmENDATIONS
Scottish Water Contact Centre aug-11 Consumer complaints about WQ 21
ANNUAL REPORT BY THE DRINKING WATER QUALITY REGULATOR 136_137
anneX c – undertakingS and enforceMent noticeSWhere water supplies do not comply with the required water quality standard, there are a number of mechanisms available to DWQR to ensure that the necessary steps are taken to achieve compliance.
undertakingsIn general, DWQR will seek to secure compliance with legislation through co-operation, discussion and offering advice. This process of co-operation and discussion may result in Scottish Water giving a legally binding Undertaking to Scottish Ministers under the provision of Section 76E of the Water (Scotland) Act 1980, setting out the steps that Scottish Water will take to secure compliance with the legislation. Such Undertakings provide a visible commitment from Scottish Water that the necessary improvement will be made.
In 2011, there were two active Undertakings. One was to deal with manganese in the water supply from Muirdykes water treatment works which supplies parts of Renfrewshire to the south west of Glasgow. This work is currently scheduled to be complete by March 2017. The other one is to deal with pesticides from Forehill water treatment works in the Peterhead area by March 2013.
DRINKING WATER QUALITYIN SCOTLAND 2011
enforcement noticesWhen DWQR has evidence that Scottish Water has contravened a drinking water quality duty and the contravention is likely to recur and Scottish Water does not appear willing to take timely steps to rectify the situation, DWQR may serve an Enforcement Notice on Scottish Water under Section 10 of the Water Industry (Scotland) Act 2002. Such an Enforcement Notice must set out specific actions to be taken by Scottish Water within specified timescales. Failure to complete such actions by the due date is a criminal offence under Section 12 (5) of the Act.
Before serving an Enforcement Notice we will explain the breach of drinking water quality legislation and our reasons for proposing an Enforcement Notice to Scottish Water. If, following discussion, DWQR decides to proceed with the enforcement action we will write formally to Scottish Water to notify them. This letter may offer a meeting to discuss the matter first and to hear any proposals for alternative remedies. In certain circumstances, where the contravention is serious and of an urgent nature, DWQR may decide to serve an immediate Enforcement Notice in accordance with Section 13 of the Water Industry (Scotland) Act 2002.
Once an Enforcement Notice has been served, Scottish Water may make an appeal to the Sheriff against the notice within 14 days of the date of service. The Enforcement Notice does not take effect until the appeal is withdrawn or finally determined by the Sheriff.
In 2011, there were two active Enforcement Notices. One of these was to deal with THMs and iron in the Penwhirn water supply which serves the area around Stranraer in south west Scotland. The work associated with this Enforcement Notice has now been completed. The other active Enforcement Notice is to deal with manganese in the water supply from the Lock Eck water treatment works which supplies Dunoon and the surrounding area and is due to be completed by the end of 2012.
ANNUAL REPORT BY THE DRINKING WATER QUALITY REGULATOR 138_139
anneX d – SuMMary of iMproVeMent prograMMeS
investment in catchmentsIn its Final Determination for the strategic review of charges for 2010-2015, the Water Industry Commission for Scotland allowed Scottish Water to invest £3 million per year to identify and operate sustainable land management (SLM) measures in five water catchments. The catchments which were identified in 2010 in agreement with DWQR and SEPA were Cargen and Terregles water treatment works which are just south and west, respectively, of Dumfries, Amlaird water treatment works which is to the north of Kilmarnock, Forehill water treatment works which supplies Peterhead and the surrounding area and Clatto water treatment works which supplies Dundee. A further three potential catchments have been identified by Scottish Water.
These catchments were chosen on the basis that there was potential to influence and change current land management practice to mitigate the impact of potentially polluting contaminants (colour, pesticides, nutrients such as phosphorous and nitrates) at source, thereby avoiding the costs of installing expensive treatment to remove these contaminant(s) at the water treatment works. During 2011 Scottish Water worked with SEPA and land managers such as farmers to better understand what is happening in each of the catchments in order to determine the effectiveness of SLM in reducing the level of treatment required in the production of drinking water.
Scottish Water is implementing a programme of detailed monitoring in these catchments to better understand the sources and pathways of diffuse pollution. This will also provide them with a starting point to measure the success of any measures introduced to improve the quality of the source water.
Scottish Water has also developed a Best Practice Incentive Scheme to help land managers finance measures aimed at reducing the level of diffuse pollution. In addition, Scottish Water is working closely with a number of different agencies, including SEPA, to deliver SLM measures with the aim of improving the environment and ensuring that drinking water sources are protected at the same time as keeping customers’ charges as low as possible.
DRINKING WATER QUALITYIN SCOTLAND 2011
investment at treatment WorksScottish Water has been directed by Scottish Ministers to undertake a number of different projects to improve and protect drinking water quality across Scotland during the period of 1 April 2010 to 31 March 2015. These projects include the establishment of a Water Safety Plan, as promoted by the World Health Organization, for all public water supplies in Scotland. These plans should consider the risks to drinking water quality from source through treatment and distribution to consumers’ taps. Scottish Water was directed to complete half of these plans during the previous investment period (2006-2010) with the remainder to be completed in the current period (2010-2015). During 2011 Scottish Water managed to complete this task early, allowing the water company now to concentrate on analysing all of the risks identified in these plans. This will enable them to identify any improvement programmes required to mitigate these risks in the next investment period beyond 2015. The DWQR is working closely with Scottish Water on these improvement programmes.
In addition, disinfection control was improved at four water treatment works during the course of 2011; Ardfern, Diabeg, Earlish and Kinlochleven. This should improve the consistency of chlorine dosing, making the taste and odour of the water being supplied from these works more acceptable to consumers.
There are a number of water treatment works which have more extensive works planned for investment during the period leading up to 2015, but these have yet to be completed.
ANNUAL REPORT BY THE DRINKING WATER QUALITY REGULATOR 140_141
investment in the distribution SystemDuring 2011, Scottish Water completed the construction of eight emergency tanker fill points at strategic positions within distribution systems throughout Scotland. If the piped supply fails and becomes contaminated for any reason, these facilities will assist Scottish Water in complying with their duty to supply at least 10 litres of alternative water per head during such an emergency.
Scottish Water also completed the installation of backflow prevention devices on the incoming water mains at 95 wastewater treatment works (WWTW) during 2011. These will protect the public water supply from any contamination that could have been caused by the backflow of dirty water from the WWTW as a result of a sudden loss of pressure in the mains water, for example due to a burst pipe.
Also during 2011, Scottish Water carried out studies on 45 distribution zones to determine the extent of water mains rehabilitation required to reduce the number of discoloration events and customer contacts. In addition, following studies previously undertaken, Scottish Water carried out water main rehabilitation works in 14 of its water supply zones to reduce the risk of water quality being degraded by the condition of the distribution system.
Scottish Water has undertaken studies during 2011 to determine the location and number of lead communication pipes in Scottish Water’s ownership. The communication pipe is the name given to that part of the pipe that delivers water from the water main in the road to the property boundary to connect with the supply pipe which is owned by the property owner and which runs into the property itself. These studies should help Scottish Water develop its longer-term strategy to ensure that it complies with the standard for lead which will reduce from its current level of 25 µg/l at present to 10 µg/l from the end of 2013.
In the short term, during 2011, Scottish Water investigated seven water supply zones for the presence of lead communication pipes. Where there was no lead present, no action was taken but where lead was found, these pipes would be replaced with plastic pipes.

DRINKING WATER QUALITYIN SCOTLAND 2011
anneX e – the regulatory fraMeWorkThe regulatory standards for drinking water quality in Scotland largely stem from European Directives. These standards are based on Guideline Values, developed by the World Health Organization, to protect public health.
Our key domestic water quality legislation includes: the Water (Scotland) act 1980 (as amended)¡¡ scottish Water must supply wholesome water for domestic purposes. It is a criminal
offence to supply water unfit for human consumption;
¡¡ scottish ministers must take enforcement action against scottish Water if it fails in its duty to supply wholesome water (as defined in the relevant regulations) unless the failure is trivial or scottish Water is complying with a legally binding undertaking to remedy the matter;
¡¡ local authorities must take appropriate steps to keep themselves informed about the wholesomeness of public water supplies in their area and notify scottish Water if not satisfied; and
¡¡ local authorities are required to secure improvements to private water supplies if they consider them necessary.
the Water Supply (Water Quality) (Scotland) regulations 2001¡¡ the 2001 regulations came into force on 25 december 2003;
¡¡ transpose the requirements of Council directive 98/83/EC on the quality of water intended for human consumption into scottish legislation;
¡¡ define wholesomeness by setting standards for 40 parameters and a further 11 indicator parameters;
¡¡ set and define the supply zone as the basic unit for quality monitoring;
¡¡ specify sampling requirements for samples taken at taps within zones, at service reservoirs and at WtW; and
¡¡ require scottish Water to publish an annual report and keep a public register of water quality in its area.

ANNUAL REPORT BY THE DRINKING WATER QUALITY REGULATOR 142_143
the Water industry (Scotland) act 2002 ¡¡ Created the post of drinking Water Quality regulator for scotland (dWQr);
¡¡ set out responsibility for enforcing the Water supply (Water Quality) (scotland) regulations 2001;
¡¡ defines dWQr’s independent status;
¡¡ defines dWQr power to obtain information, power of entry or inspection and power of enforcement; and
¡¡ dWQr also has emergency powers to require a water supplier to carry out works to ensure quality of water supplied is safe for public consumption.
Water framework directive 2000 (Wfd 2000/60/ec)¡¡ Aims to protect, enhance and restore surface and groundwaters and prevent,
or reverse, any deterioration in quality;
¡¡ ensures that water use is sustainable;
¡¡ repeals surface Water Abstraction directive; and
¡¡ establishes systems for managing water environments, including river Basin management plans.
¡¡ Implemented by the Water Environment and Water services (scotland) Act 2003 and the Water Environment (Controlled Activities) (scotland) regulations 2011.
the private Water Supplies (Scotland) regulations 2006 ¡¡ the 2006 regulations came into force on 3 July 2006;
¡¡ define wholesomeness in accordance with the EC drinking Water directive 98/83/EC;
¡¡ require local authorities to classify private supplies according to size and use;
¡¡ require local authorities to monitor, risk assess and report on private supplies in their area according to classification and risk; and
¡¡ provide advice to private supply owners and ensure improvements are carried out.
DRINKING WATER QUALITYIN SCOTLAND 2011
the private Water Supplies (grants) (Scotland) regulations 2006¡¡ the regulations provide for grants to be paid to eligible persons to enable them
to improve their private water supply; and
¡¡ is administered by local authorities and provides for non-means tested grants of up to £800 per property.
the Water Quality (Scotland) regulations 2010¡¡ the 2010 regulations came into force on 20 April 2010;
¡¡ further transpose the requirements of directive 98/83/EC most particularly in respect of water quality failures which are attributable to the domestic distribution system in establishments and premises where water is supplied to the public;
¡¡ require local authorities to investigate such water quality failures to determine its cause;
¡¡ instruct remedial action through the service of a notice on the person who owns, or is responsible for, the domestic distribution system; and
¡¡ ensure that affected consumers are notified of any risk to their health.
the 2010 regulations also make a number of technical amendments to the Water supply (Water Quality) (scotland) regulations 2001 and the private Water supplies (scotland) regulations 2006 to:
¡¡ create a duty to minimise contamination from disinfection by-products and to verify the effectiveness of the disinfection process.

ANNUAL REPORT BY THE DRINKING WATER QUALITY REGULATOR 144_145
the Cryptosporidium (Scottish Water) directions 2003¡¡ the Cryptosporidium (scottish Water) directions 2003 came into force
on 1 January 2004;
¡¡ provide for more widespread testing for Cryptosporidium to provide data about background levels in water supplies; and
¡¡ provision put in place for Cryptosporidium sampling at all water treatment works; every supply in scotland must be tested based on the assessed risk and the flow through the works (at least once a month).
the Scottish Water (objectives for 1 april 2010 to 31 March 2015) directions 2009In support of the Government’s objective for a healthier scotland, the scottish ministers issued directions to scottish Water to deliver a number of specified objectives in the period 1 April 2010 to 31 march 2015. In relation to drinking water quality these include:
¡¡ delivering appropriate treatment solutions to a number of sites to reduce the risk of Cryptosporidium from entering the supply system;
¡¡ commencing a programme of water mains rehabilitation that will reduce the risk of water quality being degraded by the condition of the distribution system when in steady state flow conditions;
¡¡ delivering the necessary improvements to ensure that water supply zones are protected against conditions that have a probability of a 1 in 40 year return period; and
¡¡ establishing water safety plans, as promoted by the World Health Organisation, for all public drinking water supplies.
DRINKING WATER QUALITYIN SCOTLAND 2011
anneX f – indeX of inforMation letterS iSSued during 2011
informationletter number title
public Supply1/2011 Augmentation of Drinking Water Supplies by Tanker –
managing risk2/2011 (inc Annex) Q&S3B Drinking Water Quality Improvement Programme –
monitoring of completed investment outputs
private Supply1/2011 Information on Local Authorities annual data return on drinking
water quality2/2011 Laboratory accreditation for analysis of drinking water quality –
reminder to Local Authorities
Copies of these letters are available on the DWQR website:www.dwqr.org.uk
ANNUAL REPORT BY THE DRINKING WATER QUALITY REGULATOR 146_147
anneX g – categorieS of drinking Water Quality contactS
appearance of the Water
discoloured WaterWater with a discernible taint or colour caused by suspended or dissolved matter. Two of the most common causes are a yellow taint caused by dissolved organic matter arising from peat in upland sources and more general orange, brown or black discoloration caused by suspended particles of iron (orange/brown) and manganese (black). Iron discolouration may occur through natural iron present in the raw water passing through inadequate treatment or from corrosion of cast-iron distribution mains. Manganese is present in some raw waters and may not be removed if treatment is inadequate.
Milky cloudy Water Water which has a milky appearance is caused by tiny bubbles of entrained air which dissolve in the water under pressure but come out of solution at the consumer’s tap. A number of causes are possible including burst mains, malfunctioning pumps and consumer stop taps that are only partially open. If air is the cause of the milky water, the cloudy appearance will clear in a glass of water from the bottom up.
particles in WaterVisible particulate matter in water which is otherwise not discoloured. This can be caused by corrosion of iron mains or deposits of sand, grit or other material present in the main being re-suspended following a change in the flow in the main.
organisms in WaterThis category includes complaints of insects or other animals in the water supply. Most complaints arise where an insect has crawled up a tap or is present in the sink. Very occasionally water systems can contain animals which may arise from the raw water, from treatment works or within the water mains themselves. This is extremely rare, however organisms such as midge larvae (Chironomid) or water shrimp (Aesellus) have occasionally been found in domestic supplies.
DRINKING WATER QUALITYIN SCOTLAND 2011
taste or Smell of the Water
chlorine taste/SmellExcess residual chlorine or the reaction of chlorine with phenolic compounds which may be present in household plumbing can result in taste and smells. Chlorine taste and smells should dissipate if the water is left to stand in the fridge for a few hours. It will also not be present after boiling. Phenolic tastes can be more persistent. Common descriptions used by customers include TCP, medicinal, swimming pool, bitter, and chemical. Common sources of phenol include washing machine hoses, tap washers and kettles. British Standard approved plumbing products which do not contain phenol should be used in all plumbing installations.
Metallic tasteMetallic tastes may arise from an excess of iron, aluminium or other metal dissolved in the water, although normally there will also be visible discoloration.
Solvent/fuel taste/SmellThis is not a common problem and if it arises it should be investigated immediately. Possible causes include spillages of petrol or hydrocarbons that have percolated through the soil and penetrated the plastic water main.
Musty/earthy taste/SmellMusty or earthy tastes can arise due to naturally occurring compounds present in raw waters that have not been removed by the treatment process. Geosmin is one such compound commonly associated with earthy/musty tastes. Complaints are more common in the summer months when biological activity is highest – algal blooms in raw water sources are common causes of widespread musty tastes.
tcp/chemical tasteSometimes consumers report that their drinking water has an unusual taste. Such tastes can be hard to describe, but a common description is TCP, medicinal or chemical. This can have a number of causes, but a common cause is where the small amount of chlorine added to the water to keep it safe reacts with phenol in plastics and rubbers in household plumbing and appliances to produce harmless compounds that have a very strong taste and smell that persists in cold and boiled drinks. Washing machine and dishwasher hoses, tap washers and kettles have all been shown to cause the problem under certain circumstances. The use of British Standard approved appliances and fittings will prevent the problem.

ANNUAL REPORT BY THE DRINKING WATER QUALITY REGULATOR 148_149
other categories
illness due to WaterIllnesses caused by public drinking water supplies are extremely rare in the UK as the quality of water is so high. Occasionally, consumers have concerns that their water supply is affecting their health in some way, but usually Scottish Water is able to demonstrate that the water is not the cause. DWQR expects Scottish Water to take all such concerns very seriously indeed, to investigate each contact very thoroughly and sample appropriately to demonstrate that the water supplied is wholesome. It is also expected that Scottish Water will provide reassurance to consumers and assist them by providing information on the quality of their water supply that they can discuss with their doctor if appropriate.
otherScottish Water receives a small number of contacts that do not easily fit into any other category. These may include other tastes and odours, or issues relating to lead plumbing and fungal growth on bathroom fittings.
DRINKING WATER QUALITYIN SCOTLAND 2011
anneX h – StatiStical MethodS uSed in the report
Water Quality compliance data for local authority areasIn order to present drinking water quality data by local authority area in Section 3, it has been necessary to report data for the group of supply zones within that area. Water supply zone boundaries do not fit local authority boundaries exactly, so the data for any supply zone which falls wholly or partly into the local authority area has been included.
This approach means that data from some supply zones is included twice or more in Section 3. For example, the same data for Alnwickhill B supply zone is included in the sections for East Lothian, Midlothian and City of Edinburgh.
Zonal complianceZonal compliance is simply the percentage of samples meeting the PCV for that parameter.
Mean Zonal complianceMean Zonal Compliance for an area is built up from zonal compliance figures for individual parameters in individual supply zones. DWQR used the Mean Zonal Compliance (MZC) index for the first time in the 2005 report. This is a helpful tool when considering water quality at national, regional and local level as it provides a simple means of summarising drinking water compliance and comparing year on year performance. All drinking water quality regulators in the UK are now reporting Mean Zonal Compliance figures using the same methodology, so it should therefore be possible to make comparisons using this index across the UK.
overall compliance The Overall Compliance for any group of supply zones is the arithmetic mean of the MZCs for every parameter. An Overall Compliance figure for Scotland may be calculated in this way. In 2011, DWQR has used the same parameters in this calculation as the other UK regulators, namely the 40 parameters in Schedule 1 of the 2001 Regulations that have a numerical standard. The full list of parameters may be found in table 1.4a of this report.
ANNUAL REPORT BY THE DRINKING WATER QUALITY REGULATOR 150_151
pesticidesAll parameters are weighted equally in the calculation but the sheer number of pesticide determinants has the potential to skew the Overall Compliance calculation by placing undue weight on pesticide analysis. For that reason, results for the individual pesticides not specifically mentioned in Schedule 1 of the Regulations have been pooled to produce a single ‘All Pesticides’ parameter. The large number of different pesticides analysed every year, is determined using a risk assessment process to define specific sampling requirements in each supply zone.
Zones with Small populationsSome of the water supply zones in Scotland are very small, serving populations in single figures. Regulatory sample frequencies are based on population, hence sampling for certain parameters in these zones is infrequent, with perhaps only two samples being taken for each parameter per year. If one of these samples fails, this will adversely affect mean zonal compliance to a much greater extent than a sample failure in a large supply zone. This is unavoidable, and in calculations of regional mean zonal compliance, this effect is compensated for by the large number of these small zones which are present in individual regions such as the north west.
distribution Maintenance indexThe Distribution Maintenance Index (DMI) is the same as the operational performance index (TIM) used in previous DWQR reports. It is used to reflect the performance of the distribution system for a zone or collection of zones, and is simply the arithmetic mean of the MZCs for turbidity, manganese and iron for the zone.
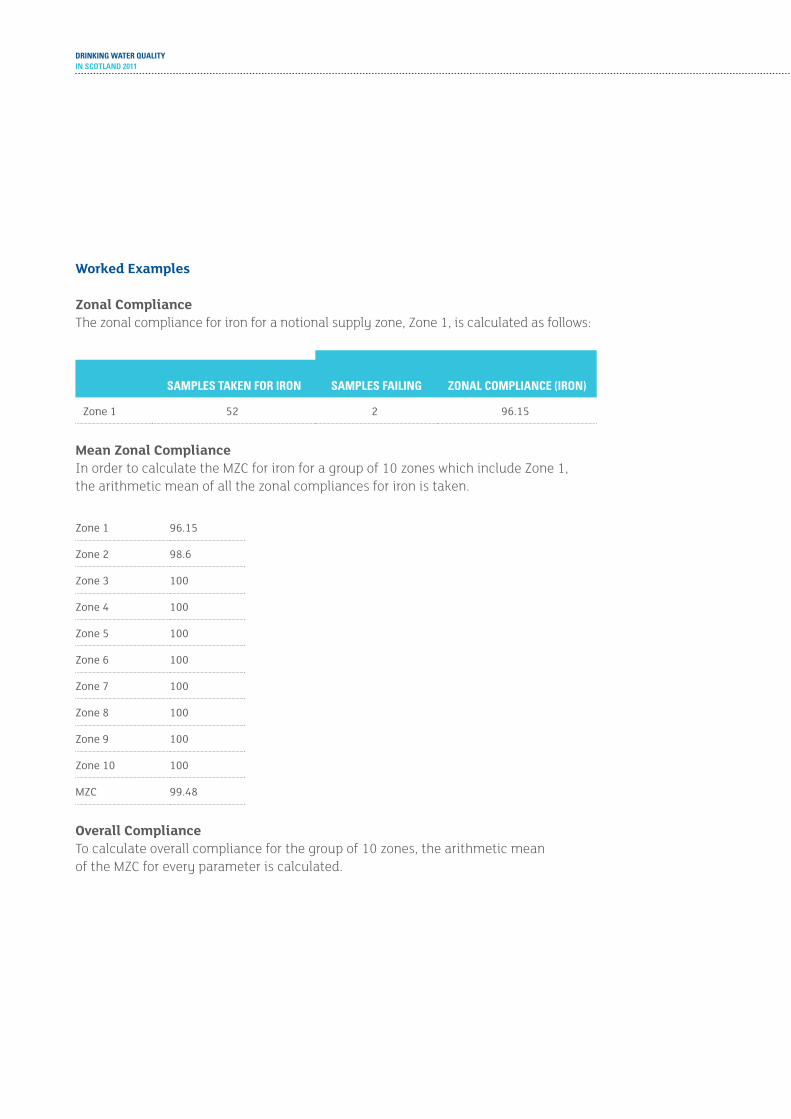
DRINKING WATER QUALITYIN SCOTLAND 2011
Worked examples
Zonal complianceThe zonal compliance for iron for a notional supply zone, Zone 1, is calculated as follows:
SAmPLES TAKEN FOR IRON SAmPLES FAILING zONAL COmPLIANCE (IRON)
Zone 1 52 2 96.15
Mean Zonal complianceIn order to calculate the MZC for iron for a group of 10 zones which include Zone 1, the arithmetic mean of all the zonal compliances for iron is taken.
Zone 1 96.15
Zone 2 98.6
Zone 3 100
Zone 4 100
Zone 5 100
Zone 6 100
Zone 7 100
Zone 8 100
Zone 9 100
Zone 10 100
MZC 99.48
overall complianceTo calculate overall compliance for the group of 10 zones, the arithmetic mean of the MZC for every parameter is calculated.

© Crown copyright 2012
The maps presented in this publication are based on Ordnance Survey material with the permission of Ordnance Survey on behalf of the Controller of Her Majesty’s Stationery Office © Crown copyright 2012. Unauthorised reproduction infringes Crown copyright and may lead to prosecution or civil proceedings. Scottish Government Licence number: 100024655, 2012.
Published on behalf of the Drinking Water Quality Regulator for Scotland, September 2012.
Produced for the Drinking Water Quality Regulator by APS Group Scotland DPPAS12684 (08/12) Further copies are available from DWQR at www.DWQR.org.uk or 0131 244 0190. The text pages of this document are printed on 100% recyclable paper.

SAFEGUARDING YOUR DRINKING WATER QUALITY
DRINKING WATER QUALITY IN SCOTLAND 2011ANNUAL REPORT BY THE DRINKING WATER QUALITY REGULATOR FOR SCOTLAND
The DWQR may be contacted either by writing to:
Drinking Water Quality Regulator for ScotlandPO Box 23598EDINBURGHEH6 6WW
or via our website: www.DWQR.org.uk
or telephoning 0131 244 0224
DRINKING WATER QUALITY IN SCOTLAND 2011
ANNUAL REPORT BY THE DRINKING WATER QUALITY REGULATOR FOR SCOTLAND