Embed Size (px)
Citation preview
Drinking Water Quality Annual Report 2016 - 17
2 Drinking Water Quality Annual Report ISSN 2202-879X
ContentsAbout this report ........................................................................................... 4
Acronyms ...................................................................................................... 5
Summary........................................................................................................ 6
Our health related performance 6 Non-health (aesthetic) related performance 6
Our commitment to you ............................................................................... 7
Introduction ................................................................................................... 8
Where does your water come from? .......................................................... 9 Perth Metropolitan Region 9 South West Region 11 Goldfields and Agricultural Region 12 Great Southern Region 13 North West Region 14 Mid-West Region 15
How is your water treated? ........................................................................ 16
Water treatment 16 Desalination 16 Ultra-filtration 17 Disinfection 17
Fluoridation 17
What drinking water guidelines must we meet?...................................... 19 Multiple barrier approach 19 Water Safety Plans 20 Source Protection 20 Monitoring 20 Incident response 21 Engagement with Department of Health 22
Case Study – Updated map to guide recreation in drinking water catchments .................................................................................................. 23
Case study – Addressing drinking water quality risks across diverse regional schemes ........................................................................................ 23
Case Study – Water Treatment Plant Logbooks ...................................... 26
Understanding water quality test results ................................................. 27
Escherichia coli (E. coli) 27 Fluoride 27 Nitrate 28 Trihalomethanes 29 Alkalinity (as calcium carbonate) 29 Aluminium (acid-soluble) 29

3 Drinking Water Quality Annual Report ISSN 2202-879X
Chloride 29 Hardness (as calcium carbonate) 29 Iron 30 Manganese 30 pH 30 Silica 30 Sodium 30 Total Dissolved Solids 31 True colour 31 Turbidity 31 Sampling parameters 31
Our performance ......................................................................................... 32
Health related performance 32 Non-health (aesthetic) related performance 32 Detailed performance review for 2016-17 32
Customer expectations .............................................................................. 33
Customer contacts 33 Customer research 34
Improving your water quality..................................................................... 35 Monitoring and reporting improvements 35 Water quality capital improvements 35 Monitoring and control systems 35 Chlorination 35 Water treatment 35 Tanks and pipelines 36
Appendix A – List of sampling parameters .............................................. 37
Pesticide 37 Organic compounds 38 Radiological 39 Inorganic Chemicals 39 Physical Characteristics 39 Microbiological 39 Metals 40
Appendix B – Summary of test results ..................................................... 41
Perth Metropolitan Region 41 Mid-West Region 41 Goldfields and Agricultural Regions 41 South West Region 41 Great Southern Region 41 North West Region 41
4 Drinking Water Quality Annual Report ISSN 2202-879X
About this report The Water Corporation’s 2016-17 Drinking Water Quality Annual Report is a review of our performance for the financial year ending 30 June 2017.
This report is designed to provide our customers and the Western Australian public with information on the quality of their drinking water.
Publication of this report allows us to meet the requirements of the Australian Drinking Water Guidelines, our Water Services Licence with the Economic Regulation Authority, our Memorandum of Understanding with the Department of Health and the National Performance Reporting requirements under the National Water Initiative.
Information contained in this report is the exclusive property of the Water Corporation and the respective copyright owners. It is subject to ongoing review and should be viewed in conjunction with the associated materials. No part of this production should be copied, modified, reproduced or published in any form other than that intended by the author. The respective data owners, other than the Water Corporation, are acknowledged below:
• Department of Water and Environmental Regulation - Public Drinking Water Source Areas - Hydrography Linear Hierarchy
• Landgate - Road Centrelines - Town sites
• Geoscience Australia - Australian Coastline
5 Drinking Water Quality Annual Report ISSN 2202-879X
Acronyms
Acronym Description
ADWG Australian Drinking Water Guidelines
AWRP Advanced Water Recycling Plant
BRA Barrier Risk Assessment
DoH Department of Health
DWER Department of Water and Environmental Regulation
EDR Electro Dialysis Reversal
GAWS Goldfields and Agricultural Water Supply
GSTWS Great Southern Towns Water Supply
IWSS Integrated Water Supply Scheme
LGSTWS Lower Great Southern Towns Water Supply
MIEX Magnetic Ion Exchange
MoU Memorandum of Understanding
NHMRC National Health and Medical Research Council
NTU Nephelometric Turbidity Units
PDWSA Public Drinking Water Source Area
RO Reverse Osmosis
Acronym Description
TCU True Colour Units
TDS Total Dissolved Solids
THM Trihalomethanes
UF Ultra-filtration
UV Ultra-violet
WQMS Water Quality Management System
WSP Water Safety Plan
WTP Water Treatment Plant
6 Drinking Water Quality Annual Report ISSN 2202-879X
Summary Ensuring supply of safe drinking water is our highest priority. In 2016-17, we achieved compliance with the health-related requirements and met all our health targets for drinking water quality set by the Department of Health (DoH).
Our health related performance • 100 percent compliance with microbiological guidelines
• 100 percent compliance with health related chemical guidelines
Non-health (aesthetic) related performance
While we strive to meet guidelines for aesthetic characteristics, this can be challenging to achieve across the diverse water sources in Western Australia.
This is especially the case in some of our small country water schemes where there may be few sources of drinking water available, and where installation of treatment can be very costly (refer page 16).
In 2016-17 our performance for all aesthetic analyses was 94 per cent (refer page 32). Although we meet all obligations under our Water Services Licence, we recognise there are always opportunities for improvement.
This is our 15th Drinking Water Quality Annual Report and we trust it provides our customers with the information they require about their drinking water quality.
We welcome any comments and feedback by phone on 13 13 75 or by email at [email protected].
7 Drinking Water Quality Annual Report ISSN 2202-879X
Our commitment to you We are committed to providing our customers with safe, high-quality drinking water that consistently meets the requirements of the Australian Drinking Water Guidelines (ADWG), our customers and other regulatory provisions.
To achieve this, in partnership with stakeholders and relevant agencies, we will:
• Take a ‘catchment to tap’ approach to managing and protecting water quality.
• Strongly advocate source protection and primacy of drinking water quality over other land uses.
• Use a risk-based approach to identify and manage potential threats to water quality.
• Comply with the health-related criteria of the ADWG and work to progressively improve compliance with aesthetic criteria.
• Use best practice contingency planning and incident response procedures.
• Routinely monitor the quality of drinking water and promote confidence in the water supply and its management.
• Participate in research and development activities to ensure timely management of emerging drinking water quality issues.
• Contribute to industry regulations and guidelines, and other standards relevant to public health and the water cycle.
• Continually improve our practices by assessing performance against corporate commitments and stakeholder expectations.
We will implement and maintain a management system consistent with the ADWG to protect our drinking water quality. All managers and employees involved in the supply of drinking water are responsible for understanding, implementing, maintaining and continuously improving the drinking water quality management system.
8 Drinking Water Quality Annual Report ISSN 2202-879X
Introduction We provide drinking water to Perth, Mandurah and more than 220 regional communities throughout Western Australia.
This year we delivered 361 billion litres of drinking water to more than 1.27 million properties through 34,799 kilometres of water mains. This has come from 128 dams and weirs, 94 licensed borefields, two major desalination plants (the Perth Seawater Desalination and Southern Seawater Desalination plants) and eight regional water treatment plants that use desalination technology.
Under our Water Services Licence, we comply with a Memorandum of Understanding (MoU) with the DoH. We act in accordance with the microbiological, health related chemical and radiological parameters as specified by the National Health and Medical Research Council (NHMRC) in the ADWG.
Our health performance (chemical, microbiological, and radiological) has again resulted in 100 percent of metropolitan and country localities meeting the high standards set by the DoH.
Our extensive and sophisticated drinking water quality monitoring program confirms the safety of the water we provide to our customers. Microbiological, chemical and radiological analyses are carried out by independent laboratories.
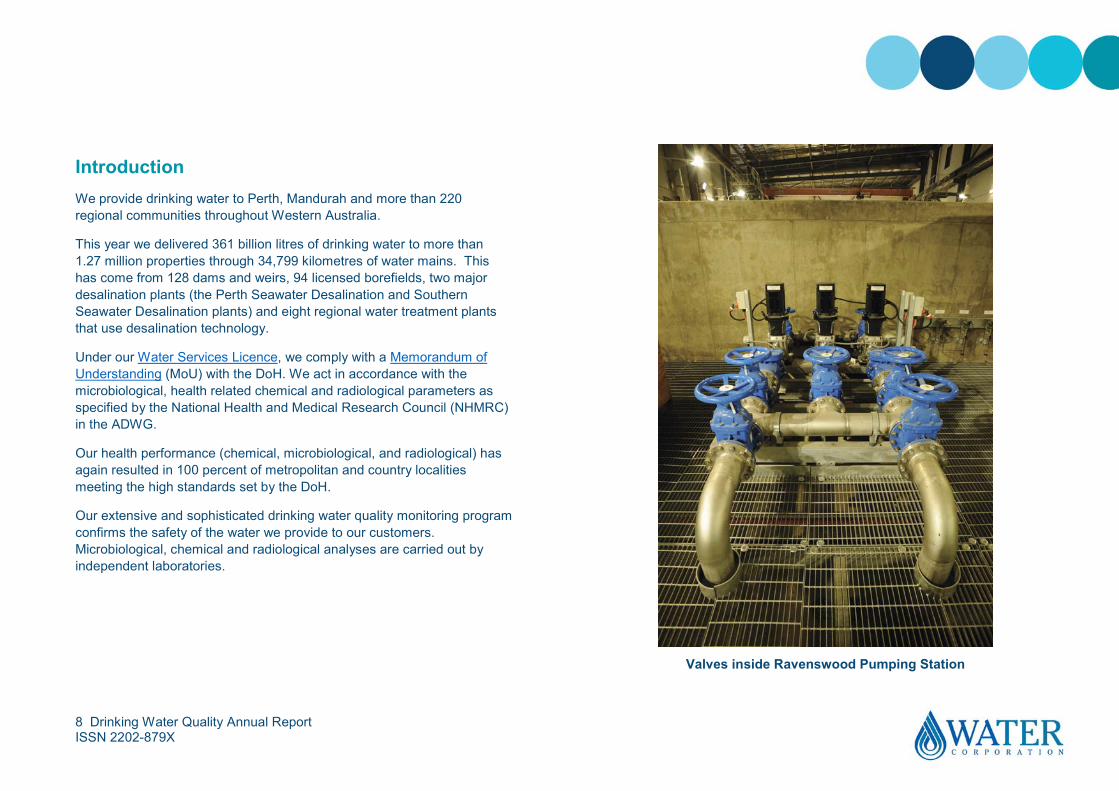
Valves inside Ravenswood Pumping Station
9 Drinking Water Quality Annual Report ISSN 2202-879X
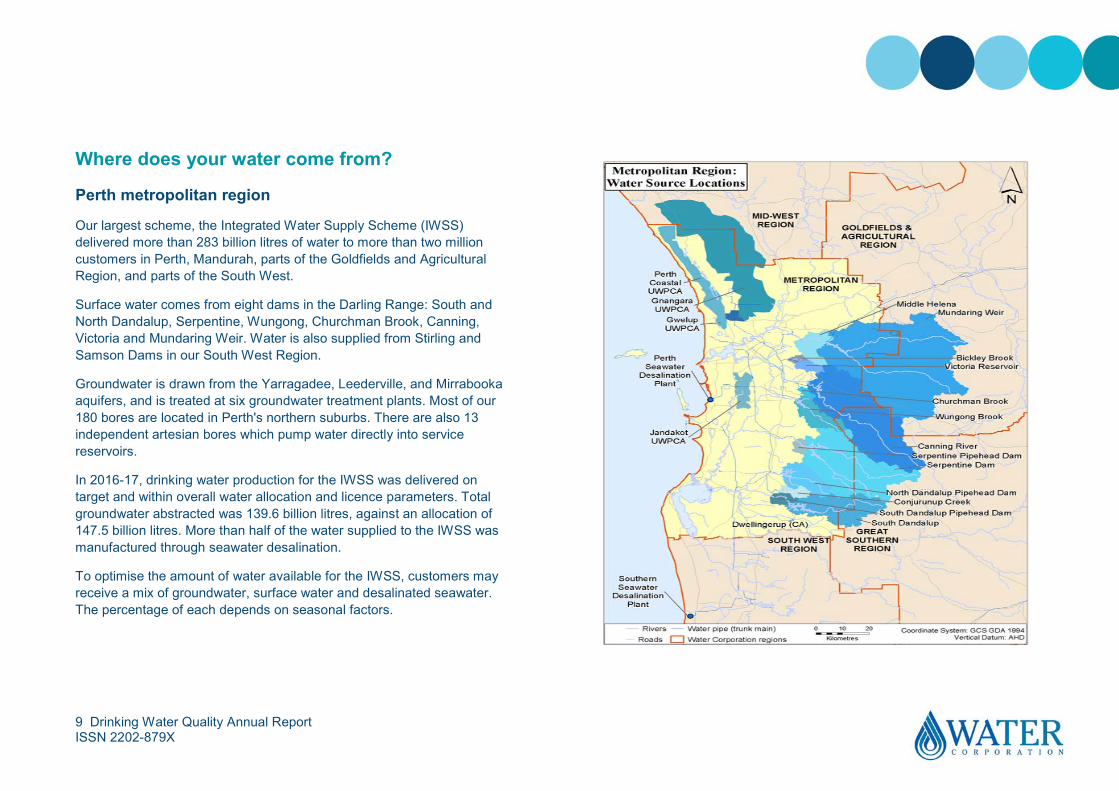
Where does your water come from?
Perth metropolitan region
Our largest scheme, the Integrated Water Supply Scheme (IWSS) delivered more than 283 billion litres of water to more than two million customers in Perth, Mandurah, parts of the Goldfields and Agricultural Region, and parts of the South West.
Surface water comes from eight dams in the Darling Range: South and North Dandalup, Serpentine, Wungong, Churchman Brook, Canning, Victoria and Mundaring Weir. Water is also supplied from Stirling and Samson Dams in our South West Region.
Groundwater is drawn from the Yarragadee, Leederville, and Mirrabooka aquifers, and is treated at six groundwater treatment plants. Most of our 180 bores are located in Perth's northern suburbs. There are also 13 independent artesian bores which pump water directly into service reservoirs.
In 2016-17, drinking water production for the IWSS was delivered on target and within overall water allocation and licence parameters. Total groundwater abstracted was 139.6 billion litres, against an allocation of 147.5 billion litres. More than half of the water supplied to the IWSS was manufactured through seawater desalination.
To optimise the amount of water available for the IWSS, customers may receive a mix of groundwater, surface water and desalinated seawater. The percentage of each depends on seasonal factors.
10 Drinking Water Quality Annual Report ISSN 2202-879X
Yanchep and Two Rocks are not connected to the IWSS, with water for these suburbs sourced from independent groundwater supplies. It is anticipated these suburbs will eventually connect to the IWSS to meet growing demand and provide a more secure water supply.
Climate independent sources
The Perth Seawater Desalination Plant in Kwinana delivered 47.3 billion litres of water into the IWSS in 2016-17. The desalinated water enters the IWSS through Thomsons Reservoir where it is blended with Jandakot groundwater and surface water. A portion can be stored in Canning Dam and Wungong Dam during periods of low demand in the winter. The Southern Seawater Desalination Plant near Binningup produced 102.4 billion litres of water for the IWSS in 2016-17. Together, these two climate independent water sources have the capacity to supply around half of Perth’s drinking water.
The next climate independent water source for the IWSS is the full-scale Groundwater Replenishment Scheme in Craigie, which has the capacity to recharge 14 billion litres of water each year.
Groundwater replenishment is the process by which secondary treated wastewater undergoes advanced treatment to produce recycled water. The recycled water is recharged to an aquifer for later use as a drinking water source.
Construction of the Advance Water Recycling Plant (AWRP) was completed in 2016-17, with the plant commissioned in mid-2017.
Construction of the Stage 2 expansion of the AWRP Stage 2 begins in late 2017 and will bring the scheme’s total recharge capacity to 28 billion litres of water each year.
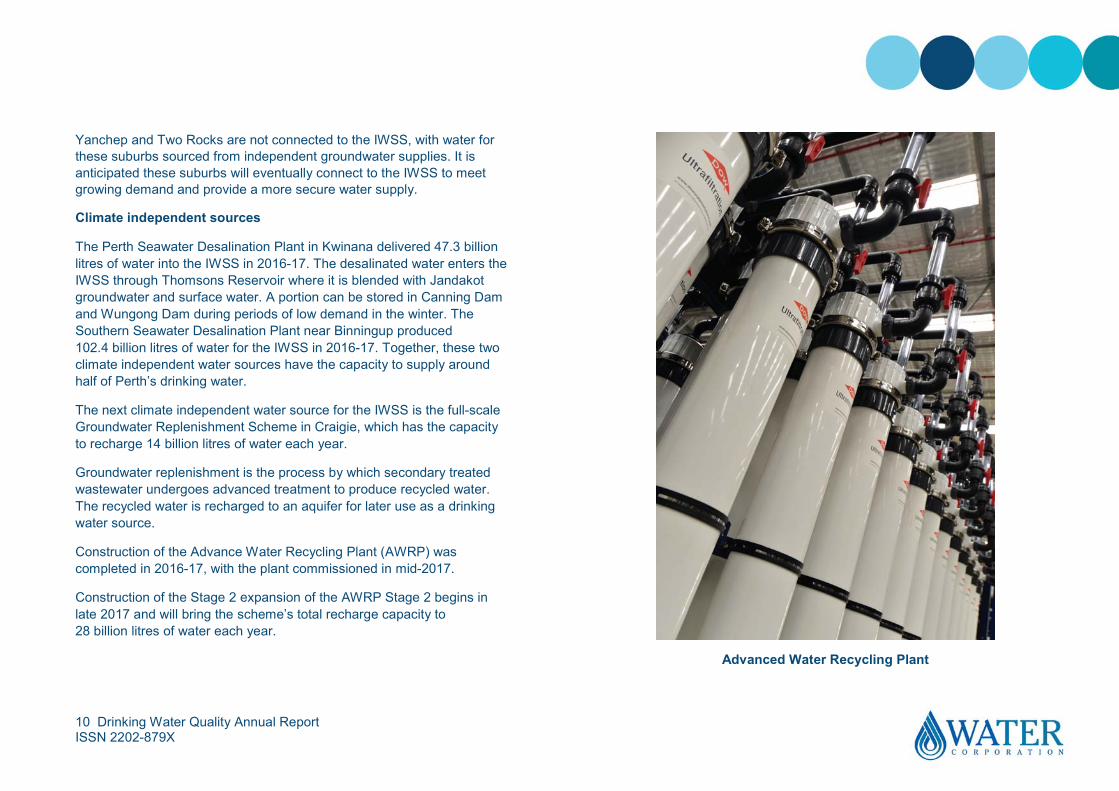
Advanced Water Recycling Plant
11 Drinking Water Quality Annual Report ISSN 2202-879X
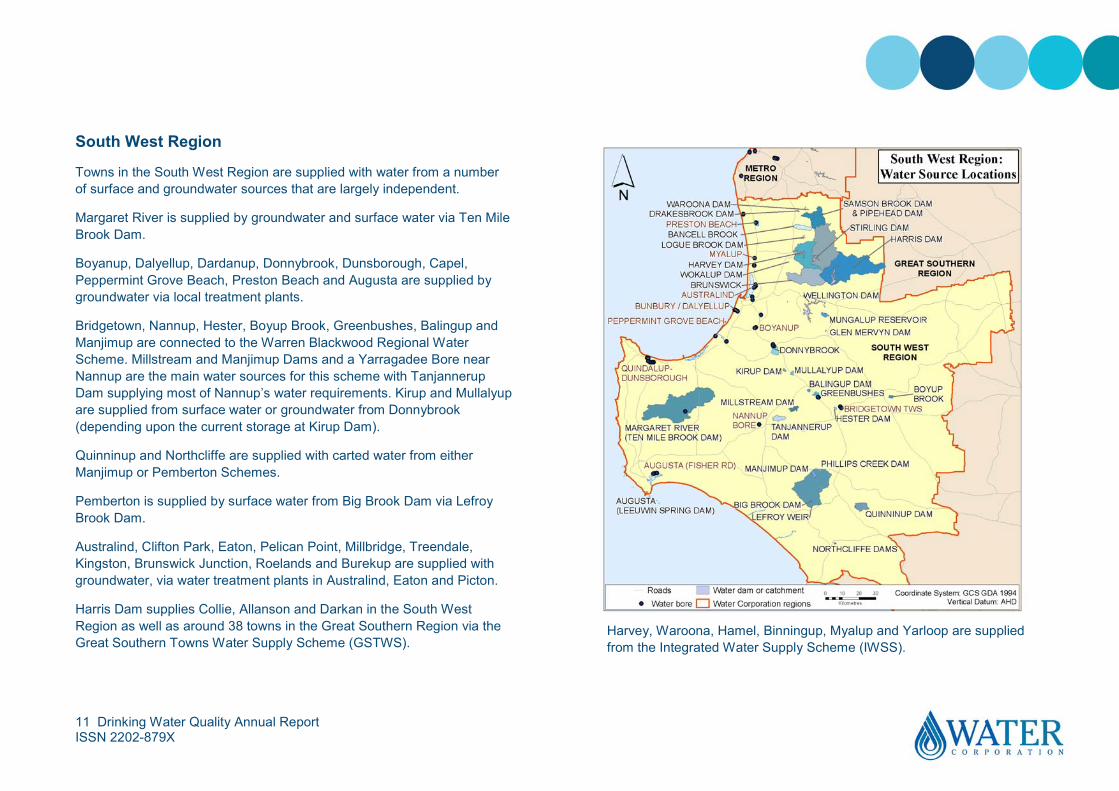
South West Region
Towns in the South West Region are supplied with water from a number of surface and groundwater sources that are largely independent.
Margaret River is supplied by groundwater and surface water via Ten Mile Brook Dam.
Boyanup, Dalyellup, Dardanup, Donnybrook, Dunsborough, Capel, Peppermint Grove Beach, Preston Beach and Augusta are supplied by groundwater via local treatment plants.
Bridgetown, Nannup, Hester, Boyup Brook, Greenbushes, Balingup and Manjimup are connected to the Warren Blackwood Regional Water Scheme. Millstream and Manjimup Dams and a Yarragadee Bore near Nannup are the main water sources for this scheme with Tanjannerup Dam supplying most of Nannup’s water requirements. Kirup and Mullalyup are supplied from surface water or groundwater from Donnybrook (depending upon the current storage at Kirup Dam).
Quinninup and Northcliffe are supplied with carted water from either Manjimup or Pemberton Schemes.
Pemberton is supplied by surface water from Big Brook Dam via Lefroy Brook Dam.
Australind, Clifton Park, Eaton, Pelican Point, Millbridge, Treendale, Kingston, Brunswick Junction, Roelands and Burekup are supplied with groundwater, via water treatment plants in Australind, Eaton and Picton.
Harris Dam supplies Collie, Allanson and Darkan in the South West Region as well as around 38 towns in the Great Southern Region via the Great Southern Towns Water Supply Scheme (GSTWS).
Harvey, Waroona, Hamel, Binningup, Myalup and Yarloop are supplied from the Integrated Water Supply Scheme (IWSS).
12 Drinking Water Quality Annual Report ISSN 2202-879X
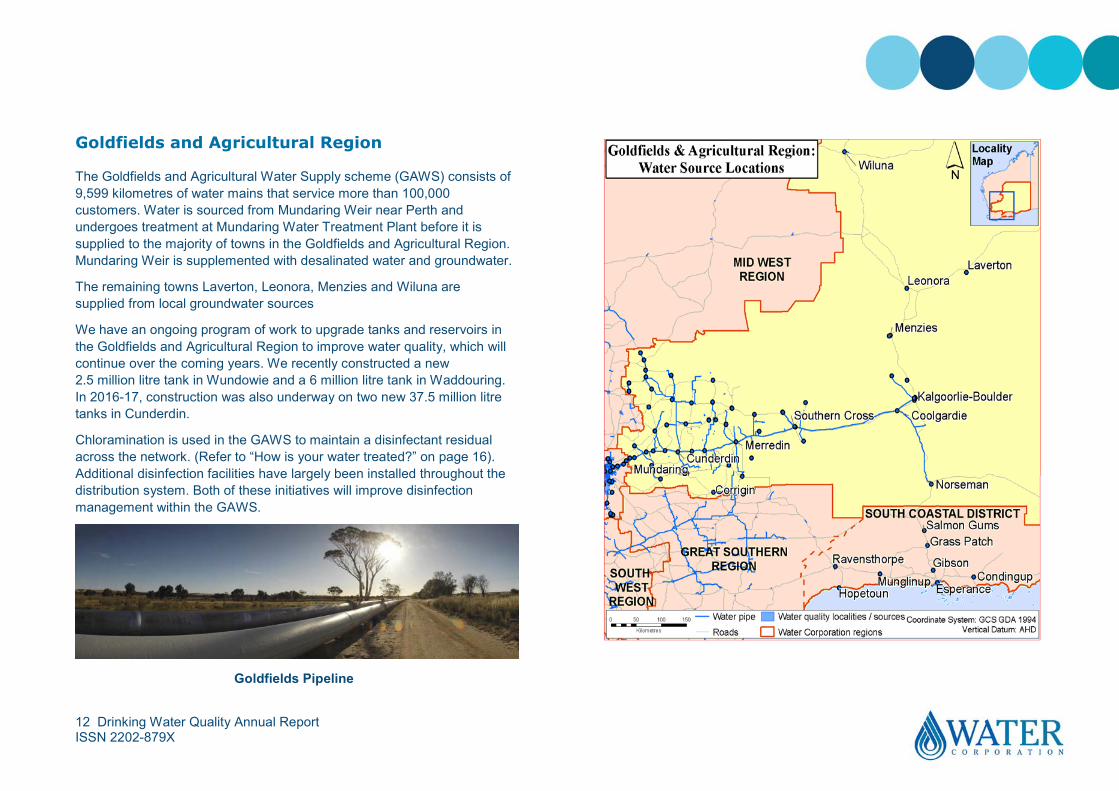
Goldfields and Agricultural Region
The Goldfields and Agricultural Water Supply scheme (GAWS) consists of 9,599 kilometres of water mains that service more than 100,000 customers. Water is sourced from Mundaring Weir near Perth and undergoes treatment at Mundaring Water Treatment Plant before it is supplied to the majority of towns in the Goldfields and Agricultural Region. Mundaring Weir is supplemented with desalinated water and groundwater.
The remaining towns Laverton, Leonora, Menzies and Wiluna are supplied from local groundwater sources
We have an ongoing program of work to upgrade tanks and reservoirs in the Goldfields and Agricultural Region to improve water quality, which will continue over the coming years. We recently constructed a new 2.5 million litre tank in Wundowie and a 6 million litre tank in Waddouring. In 2016-17, construction was also underway on two new 37.5 million litre tanks in Cunderdin.
Chloramination is used in the GAWS to maintain a disinfectant residual across the network. (Refer to “How is your water treated?” on page 16). Additional disinfection facilities have largely been installed throughout the distribution system. Both of these initiatives will improve disinfection management within the GAWS.
Goldfields Pipeline
13 Drinking Water Quality Annual Report ISSN 2202-879X
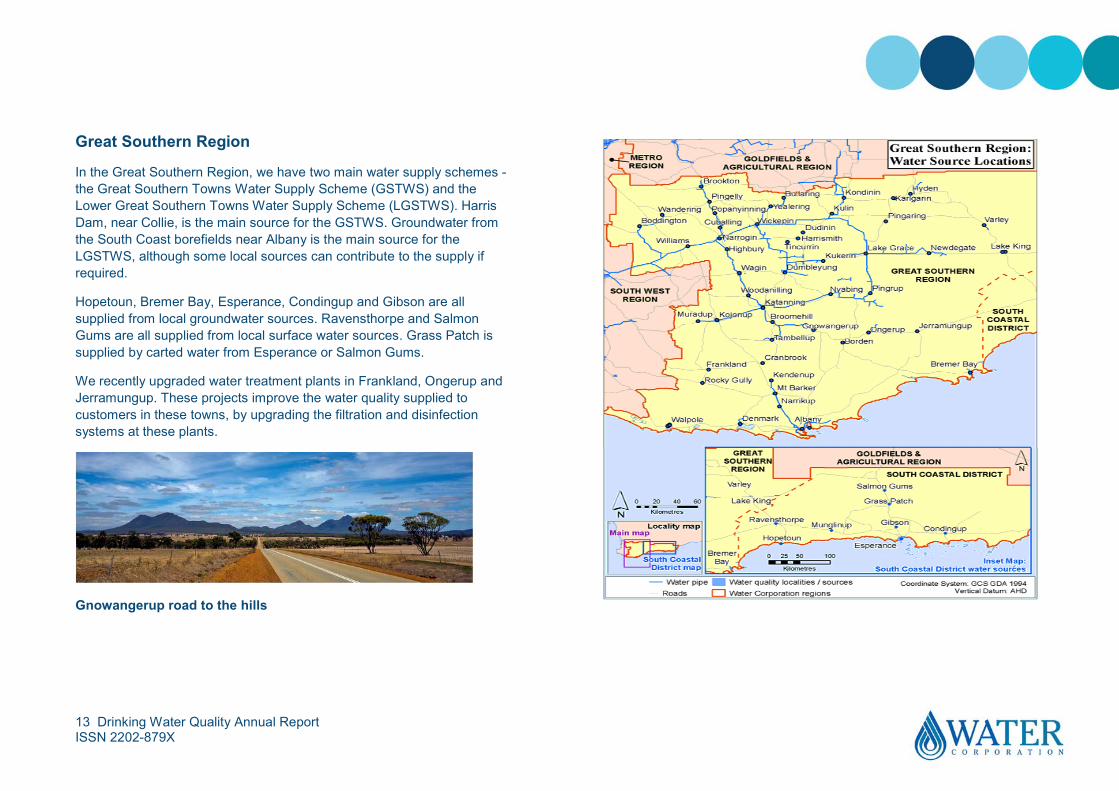
Great Southern Region
In the Great Southern Region, we have two main water supply schemes - the Great Southern Towns Water Supply Scheme (GSTWS) and the Lower Great Southern Towns Water Supply Scheme (LGSTWS). Harris Dam, near Collie, is the main source for the GSTWS. Groundwater from the South Coast borefields near Albany is the main source for the LGSTWS, although some local sources can contribute to the supply if required.
Hopetoun, Bremer Bay, Esperance, Condingup and Gibson are all supplied from local groundwater sources. Ravensthorpe and Salmon Gums are all supplied from local surface water sources. Grass Patch is supplied by carted water from Esperance or Salmon Gums.
We recently upgraded water treatment plants in Frankland, Ongerup and Jerramungup. These projects improve the water quality supplied to customers in these towns, by upgrading the filtration and disinfection systems at these plants.
Gnowangerup road to the hills
14 Drinking Water Quality Annual Report ISSN 2202-879X
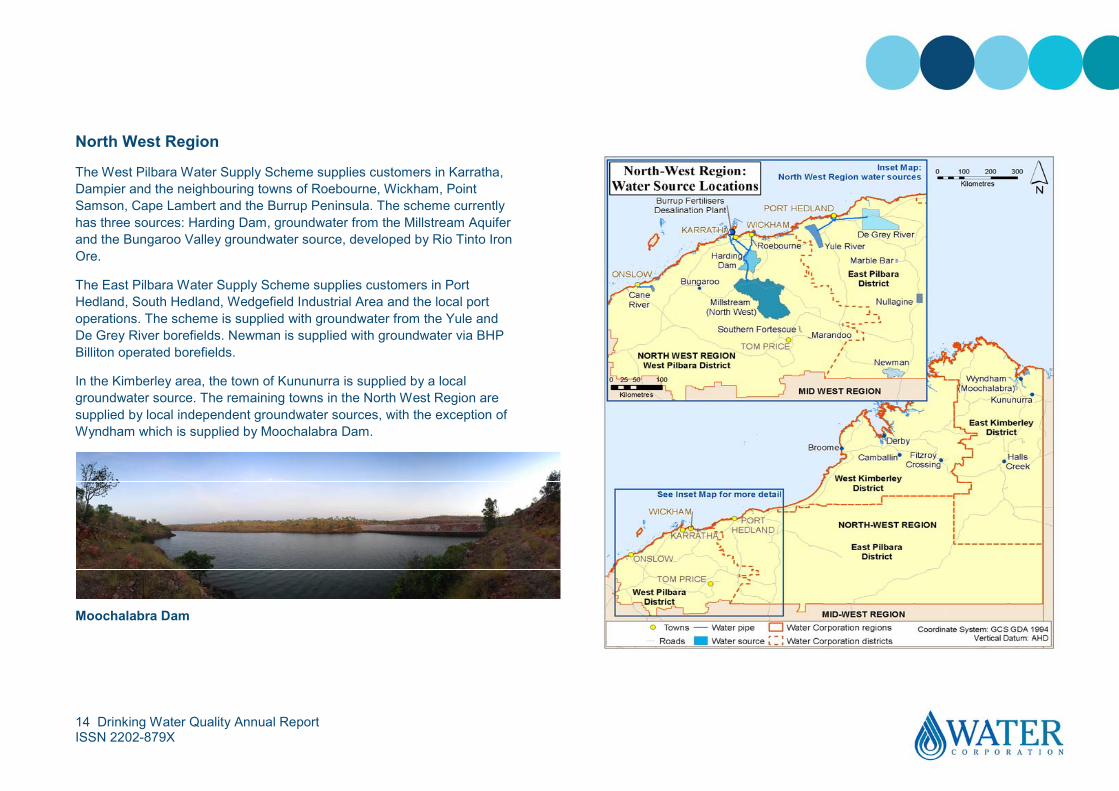
North West Region
The West Pilbara Water Supply Scheme supplies customers in Karratha, Dampier and the neighbouring towns of Roebourne, Wickham, Point Samson, Cape Lambert and the Burrup Peninsula. The scheme currently has three sources: Harding Dam, groundwater from the Millstream Aquifer and the Bungaroo Valley groundwater source, developed by Rio Tinto Iron Ore.
The East Pilbara Water Supply Scheme supplies customers in Port Hedland, South Hedland, Wedgefield Industrial Area and the local port operations. The scheme is supplied with groundwater from the Yule and De Grey River borefields. Newman is supplied with groundwater via BHP Billiton operated borefields.
In the Kimberley area, the town of Kununurra is supplied by a local groundwater source. The remaining towns in the North West Region are supplied by local independent groundwater sources, with the exception of Wyndham which is supplied by Moochalabra Dam.
Moochalabra Dam
15 Drinking Water Quality Annual Report ISSN 2202-879X
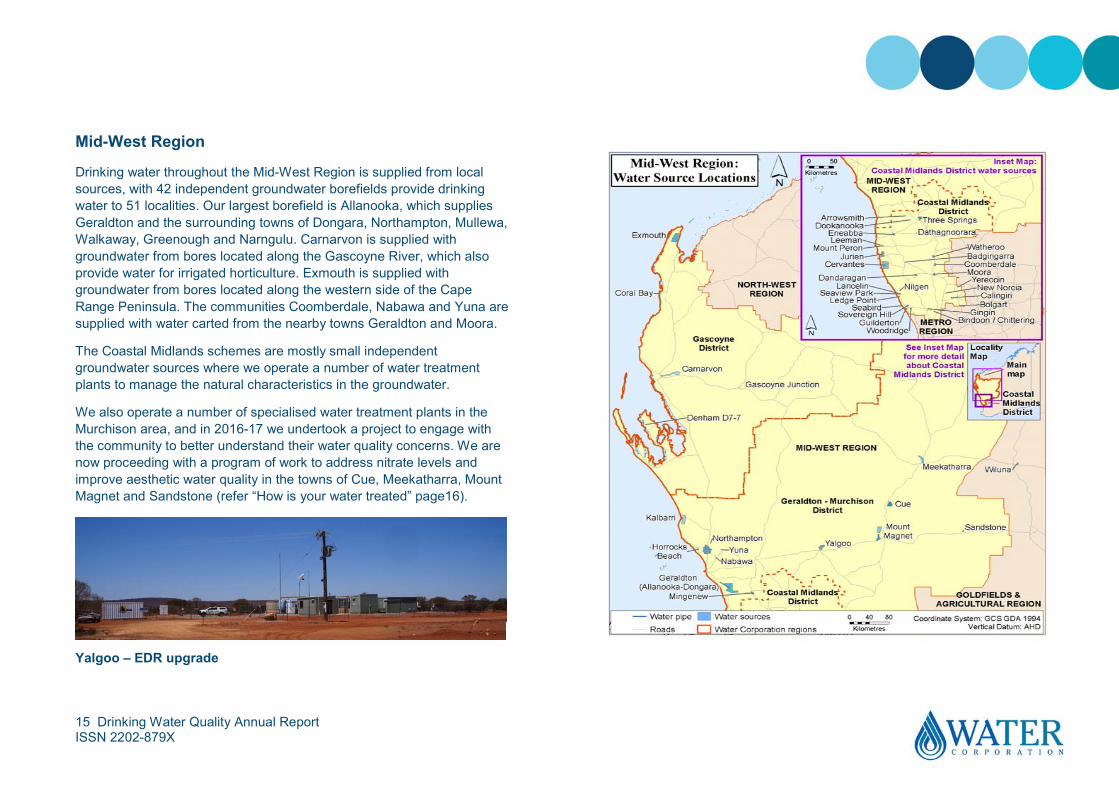
Mid-West Region
Drinking water throughout the Mid-West Region is supplied from local sources, with 42 independent groundwater borefields provide drinking water to 51 localities. Our largest borefield is Allanooka, which supplies Geraldton and the surrounding towns of Dongara, Northampton, Mullewa, Walkaway, Greenough and Narngulu. Carnarvon is supplied with groundwater from bores located along the Gascoyne River, which also provide water for irrigated horticulture. Exmouth is supplied with groundwater from bores located along the western side of the Cape Range Peninsula. The communities Coomberdale, Nabawa and Yuna are supplied with water carted from the nearby towns Geraldton and Moora.
The Coastal Midlands schemes are mostly small independent groundwater sources where we operate a number of water treatment plants to manage the natural characteristics in the groundwater.
We also operate a number of specialised water treatment plants in the Murchison area, and in 2016-17 we undertook a project to engage with the community to better understand their water quality concerns. We are now proceeding with a program of work to address nitrate levels and improve aesthetic water quality in the towns of Cue, Meekatharra, Mount Magnet and Sandstone (refer “How is your water treated” page16).
Yalgoo – EDR upgrade
16 Drinking Water Quality Annual Report ISSN 2202-879X
How is your water treated?
Water treatment
The specific water quality of each source dictates the type of treatment required. Where water comes from large water bodies or some groundwater supplied by fully protected catchment areas, very little treatment is required – often just disinfection. In other cases, more intensive treatment processes may be required to ensure the drinking water delivered to every house is safe and aesthetically pleasing.
Groundwater, which is pumped from underground aquifers, can be treated to remove dissolved gases, iron, manganese, colour and turbidity. In Perth, groundwater treatment plants at Jandakot, Wanneroo, Lexia, Mirrabooka and Gwelup oxidise the water (via aeration and/or chlorination) to increase the amount of dissolved oxygen and remove both carbon dioxide and hydrogen sulphide. A coagulant (alum) is also added which increases the settling of fine particles caused by iron and natural organic matter. Clarified water then passes through sand filters to remove any remaining particles. Similar processes occur in many country water schemes. At Neerabup Groundwater Treatment Plant, we use a crystallisation technology to reduce hardness (soften the water) and salinity (total dissolved solids).
Naturally occurring organic substances present an issue for many water sources because they add colour to the water, which can increase taste and odour and provide precursors for disinfection by-products. Since 2001, we have used a water treatment technology known as MIEX (magnetised ion exchange) to prevent an intermittent “swampy” odour occurring in treated groundwater supplied to Perth’s northern suburbs. Unlike conventional processes, MIEX resin more effectively removes dissolved organic carbon from drinking water, the source of the odour and taste concerns.
The MIEX Treatment Plant has provided a considerable reduction in swampy odour contacts from customers supplied from the Wanneroo Groundwater Treatment Plant.
Desalination
Desalination, using reverse osmosis (RO), a membrane based treatment, has been used in Denham for many years to treat brackish groundwater. RO was the desalination process chosen for both the Perth Seawater Desalination Plant, which has been operational since November 2006, and the Southern Seawater Desalination Plant, that began supply in September 2011.
Similar technology exists at Leonora, Gascoyne Junction, Coral Bay, Hopetoun and Cocos Islands to improve the aesthetic water quality. Other methods of desalination available include Electrodialysis Reversal (EDR) which is in use at Wiluna and Yalgoo to remove nitrates.
EDR works like a form of desalination, however, it uses the EDR process in place of the traditional desalination process – reverse osmosis. The EDR process removes salts in water by inducing ion movement using electrical currents. The groundwater that supplies Yalgoo is affected by salinity, hardness, nitrates and silica. As a result of this, the water had an undesirable taste for some people, was difficult to form soap lather with and left white crystalline deposits when evaporated. To help address these issues and cater for future growth in the town, we installed a new EDR plant at Yalgoo’s water treatment plant. This will allow 180,000 litres of water to be treated each day in Yalgoo.
17 Drinking Water Quality Annual Report ISSN 2202-879X
Ultra-filtration
Ultra-filtration (UF) treatment is a form of membrane filtration where source water is forced through a very small semi-permeable membrane. It is designed to remove suspended solids, bacteria, viruses and other pathogens to produce water with very high purity.
UF is being used at Wyndham, Harding Dam, Pemberton, Denmark, Hyden, Walpole, Gascoyne Junction, Salmon Gums, Frankland and Kirup.
Disinfection
All drinking water supply schemes are disinfected with chlorine or chloramine to protect against pathogenic bacteria and viruses. The chlorine dose is maintained within a narrow range to ensure adequate disinfection is achieved with a minimal effect on the taste of our water.
Chloramination involves the use of chlorine and ammonia to produce a longer lasting disinfectant. Chloramination is used in the Goldfields and Agricultural Water Supply Scheme to maintain a disinfectant residual along the length of the extensive pipe network.
Ultraviolet (UV) light is used as an additional disinfectant in combination with chlorination at some towns where there are additional risks due to activities in the catchment. UV is used at a number of water treatment plants across the State, including Kirup Dam, Hester, Greenbushes, Salmon Gums and Cranbrook.
Fluoridation
Community water fluoridation is an important, cost-effective public health measure which plays a critical role in reducing dental decay and improving oral health.
Fluoridation of community water supplies is backed by authoritative health research agencies and government bodies in Australia and worldwide, including the World Health Organization; the Australian Dental Association; the Australian Medical Association; the National Health and Medical Research Council, and numerous others.
In Western Australia, fluoridation of community water supplies is regulated by the Fluoridation of Public Water Supplies Act 1966 (the Act) which is administered by the Department of Health. The Fluoridation of Public Water Supplies Advisory Committee oversees fluoridation and makes recommendations to the Minister for Health who may issue or rescind directives as appropriate.
Water fluoridation was introduced in Western Australia in 1968. Currently, around 91 per cent of the WA population is provided with fluoridated drinking water, principally in the Perth metropolitan area and most regional centres, as well as a number of smaller communities supplied from the same source or treatment plant as the regional centres.
Some regional centres in WA have naturally occurring levels of fluoride in the water supply.
The water fluoridation process involves adding fluoride in a controlled manner to the recommended optimum concentration. Fluoridated water supplies are monitored continuously via an online fluoride analyser at a dosing point, and sampled at least weekly to confirm acceptable fluoridation performance. Purity and quality control standards for chemicals added to drinking water are also strictly controlled by the Department of Health. Fluoridation performance is reported quarterly to the Advisory Committee for Purity of Water. Table 1 shows the localities requiring fluoridation under the Act.

18 Drinking Water Quality Annual Report ISSN 2202-879X
Table 1 Localities requiring fluoridation under Fluoridation of Public Water Supplies Act 1966
Region / Scheme Locality Perth Integrated Water Supply Scheme Armadale/Kelmscott
Bold Park Buckland Hill Foothills Greenmount Greenmount/Darlington Hamilton Hill Harvey Hills Direct Lake Thompson Lexia Mandurah Melville Mirrabooka Mt. Eliza Mt. Hawthorn Mt. Yokine Mundaring Neerabup Pinjarra South Perth/Kewdale Tamworth Hill Wanneroo Waroona West Yokine Whitfords
Region / Scheme Locality Great Southern Region Albany
Esperance Katanning (GSTWS) Mt Barker Narrogin (GSTWS)
Goldfields & Agricultural Water Supply Scheme
Kalgoorlie Merredin Northam York
North West Region Broome Derby Hedland Karratha
South West Region Collie (GSTWS) Manjimup
Mid-West Region Dongara/Port Denison Exmouth Geraldton Moora
Notes:
1. Dunsborough is de-fluoridated (as fluoride is naturally occurring). Although the scheme is not covered by the Fluoridation Act, the recommended range and optimum concentration have been specified to provide a duty of care target (0.7-1.0mg/L and 0.9mg/L respectively).
2. The Water Corporation is working towards implementing the fluoridation directives, issued by the Department of Health, at Kununurra, Newman and Yanchep.
19 Drinking Water Quality Annual Report ISSN 2202-879X
What drinking water guidelines must we meet? The NHMRC define the requirements for safe drinking water in Australia through the ADWG. These Guidelines include a framework for best practice management of drinking water supplies designed to integrate all facets of the drinking water quality management and assurance system.
We have a Memorandum of Understanding with the DoH which requires our compliance with the microbiological, chemical health and radiological parameters as specified in the ADWG. This forms part of our Water Services Licence as issued by the Economic Regulation Authority. We, along with the DoH, recognise the practices and processes used to establish and maintain high levels of drinking water quality need to be open and transparent to the community.
For aesthetic parameters, the Memorandum of Understanding states that we should comply as far as practical with the ADWG for non-health related characteristics. It is accepted full compliance with non-health related characteristics may take a number of years bearing in mind the significant investment required to achieve this. For more information on our program of water quality improvements please refer to “Improving Your Water Quality” on page 35.
Multiple barrier approach
Preventing contamination and minimising risk is an essential part of providing our customers with safe drinking water. The ADWG emphasise the importance of using multiple barriers to ensure the safety of drinking water. Barriers include:
• Protected catchments and groundwater recharge areas;
• Large reservoirs with long water detention (storage) times;
• Water treatment (refer to “How is your water treated?” on page 16);
• Ensuring tanks and bores are sealed to prevent contamination;
• Disinfection of water; and
• Maintaining chlorine residuals through our distribution system.
We strive to continually improve the robustness and performance of our barriers.
20 Drinking Water Quality Annual Report ISSN 2202-879X
Water Safety Plans
Having a Water Safety Plan (WSP) for each of our schemes is a large part of implementing the ADWG Framework for Management of Drinking Water Quality. WSPs use a systematic risk management approach from catchment to tap assessing the risks to each water supply scheme, ensuring appropriate preventative measures are in place and identifying the operational controls necessary to consistently ensure the safety of drinking water. We review WSPs at least every five years to re-evaluate the schemes’ risks and update any site or treatment details. This year has seen reviews of 37 schemes across the State. In addition, 88 WSPs were updated to show recent capital upgrades and other modifications of those schemes.
Source Protection
We manage approximately 140 drinking water sources at over 250 localities across the State. Catchment management and protection is the first barrier in providing safe, good quality drinking water to the community. Our Drinking Water Source Protection Policy guides catchment operations and highlights our commitment to the primacy of drinking water quality over other catchment land uses.
We employ several strategies to effectively undertake drinking water source protection. Surveillance and by-law enforcement are key elements, carried out under delegated authority from the Department of Water and Environmental Regulation (DWER), to control potentially polluting activities in gazetted Public Drinking Water Source Areas (PDWSAs). In 2016-17, approximately 20,500 surveillance hours were undertaken state-wide with 274 by-law offence prosecutions initiated and over 410 warning letters sent out.
By-law enforcement was historically restricted to application of the Metropolitan Water Supply, Sewerage and Drainage By-laws 1981 within metropolitan PDWSAs and limited catchments under the Country Areas Water Supply By-laws 1957. In January 2013, a change in the delegation enabled by-law application within all gazetted PDWSAs across the State. In April 2014, we were also given the power to prosecute for offences under the Water Services Act 2012 and Water Services Regulations 2013.
Elements of this legislation may be used to improve our catchment management performance by applying the provisions relating to the protection of our assets such as drinking water reservoirs and bores. The DWER delegates responsibility to us to undertake activities including surveillance, signage, raw water sampling and DWER Land Management in PDWSAs.
Monitoring
In accordance with the ADWG, we run an extensive drinking water quality monitoring program to confirm the safety of the water we provide to our customers. In 2016-17 we took more than 66,000 water samples from water sources, treatment plants and pipe networks which supply our customers, and had in excess of 250,000 individual analyses performed by our contracted analytical laboratories.
All our water quality monitoring and reporting is coordinated through our Water Quality Management System (WQMS). This software provides many aspects of water quality management and acts as the central database for all information on drinking water quality including sampling program design, sampling analysis, monitoring and reporting.
Additionally WQMS automatically issues alerts for results outside guideline and operational limits and prompts remedial action as defined by our Water Safety Plans (WSPs).
21 Drinking Water Quality Annual Report ISSN 2202-879X
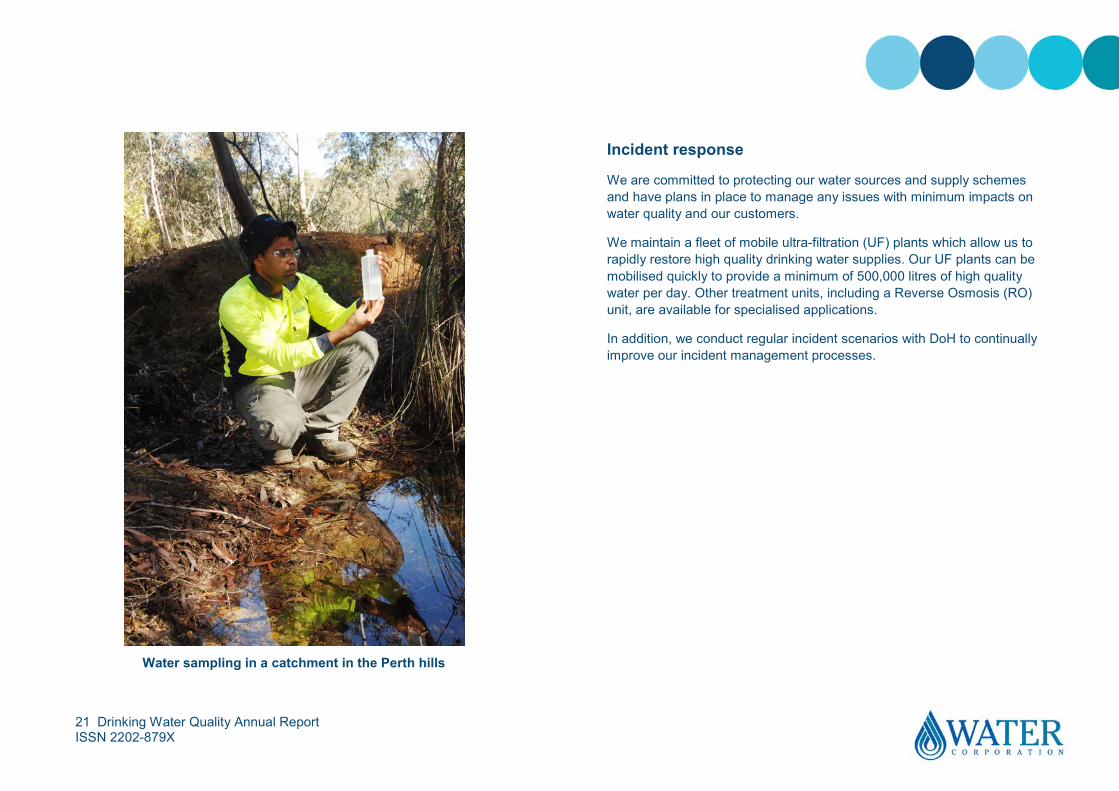
Water sampling in a catchment in the Perth hills
Incident response
We are committed to protecting our water sources and supply schemes and have plans in place to manage any issues with minimum impacts on water quality and our customers.
We maintain a fleet of mobile ultra-filtration (UF) plants which allow us to rapidly restore high quality drinking water supplies. Our UF plants can be mobilised quickly to provide a minimum of 500,000 litres of high quality water per day. Other treatment units, including a Reverse Osmosis (RO) unit, are available for specialised applications.
In addition, we conduct regular incident scenarios with DoH to continually improve our incident management processes.

22 Drinking Water Quality Annual Report ISSN 2202-879X
Engagement with Department of Health
DoH regulates drinking water quality in Western Australia. We have a Memorandum of Understanding with DoH for managing drinking water quality, which connects all facets of nationally and internationally recognised drinking water guidelines, standards, and quality management systems to ensure the safe and continuous supply of water to our customers. It requires us to notify DoH within 24 hours when any sample exceeds a set health value or any event occurs which could pose a risk to public health.
We also provide updates to DoH throughout the year, with DoH regularly reviewing our monitoring results and corrective actions.
The Memorandum of Understanding provides for DoH to conduct reviews of the performance of our systems and databases used to manage drinking water quality. In consultation with the Economic Regulation Authority, DoH commission audits in line with our Water Services Licence.
For more information on the last audit, please visit the drinking water quality section of our webpage www.watercorporation.com.au.
Advanced Water Recycling Plant
23 Drinking Water Quality Annual Report ISSN 2202-879X
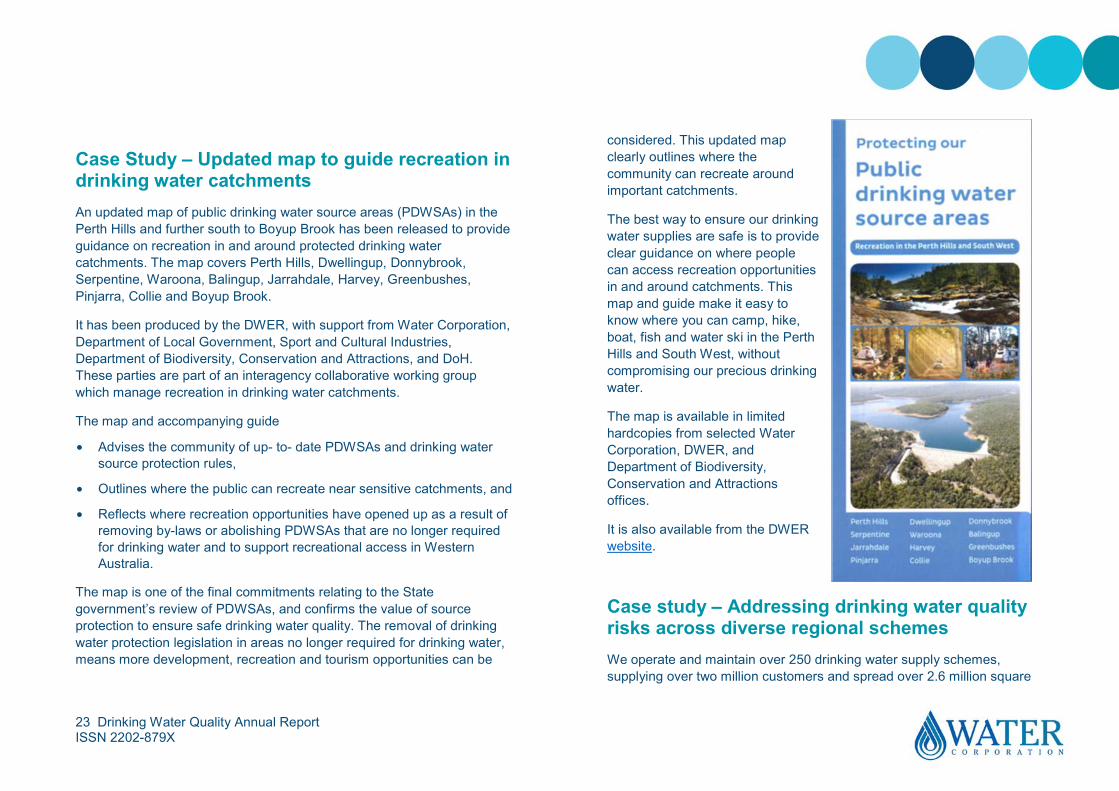
Case Study – Updated map to guide recreation in drinking water catchments An updated map of public drinking water source areas (PDWSAs) in the Perth Hills and further south to Boyup Brook has been released to provide guidance on recreation in and around protected drinking water catchments. The map covers Perth Hills, Dwellingup, Donnybrook, Serpentine, Waroona, Balingup, Jarrahdale, Harvey, Greenbushes, Pinjarra, Collie and Boyup Brook.
It has been produced by the DWER, with support from Water Corporation, Department of Local Government, Sport and Cultural Industries, Department of Biodiversity, Conservation and Attractions, and DoH. These parties are part of an interagency collaborative working group which manage recreation in drinking water catchments.
The map and accompanying guide
• Advises the community of up- to- date PDWSAs and drinking water source protection rules,
• Outlines where the public can recreate near sensitive catchments, and
• Reflects where recreation opportunities have opened up as a result of removing by-laws or abolishing PDWSAs that are no longer required for drinking water and to support recreational access in Western Australia.
The map is one of the final commitments relating to the State government’s review of PDWSAs, and confirms the value of source protection to ensure safe drinking water quality. The removal of drinking water protection legislation in areas no longer required for drinking water, means more development, recreation and tourism opportunities can be
considered. This updated map clearly outlines where the community can recreate around important catchments.
The best way to ensure our drinking water supplies are safe is to provide clear guidance on where people can access recreation opportunities in and around catchments. This map and guide make it easy to know where you can camp, hike, boat, fish and water ski in the Perth Hills and South West, without compromising our precious drinking water.
The map is available in limited hardcopies from selected Water Corporation, DWER, and Department of Biodiversity, Conservation and Attractions offices.
It is also available from the DWER website.
Case study – Addressing drinking water quality risks across diverse regional schemes We operate and maintain over 250 drinking water supply schemes, supplying over two million customers and spread over 2.6 million square
24 Drinking Water Quality Annual Report ISSN 2202-879X
kilometres. Water is currently sourced from surface water, groundwater and desalinated seawater. Groundwater replenishment will soon start contributing to groundwater supplies, by recharging recycled water treated to drinking water quality to aquifers below Perth.
The five regions outside Perth include standalone schemes, many of which supply less than 50 services, through to large integrated schemes such as the Goldfields and Agricultural Water Supply. Challenges to drinking water quality (DWQ) management are diverse and include the impacts of elevated water temperatures, drying climate, cyclonic conditions, microbial contamination, undesirable naturally occurring parameters within the source water (e.g. total dissolved solids) and accessing remote areas. Each scheme must be assessed and treated individually, although we have developed comprehensive methods for assessing and treating common major risks.
The Australian Drinking Water Guidelines (ADWG) is the Australian “standard” for managing drinking water quality. The Framework for Management of drinking water quality (the Framework) is an integral part of the 2004 and 2011 ADWG. It advocates a structured and systematic approach to the management of drinking water quality from catchment to customer. This ensures the safety and reliability of the water we supply, by assessing and managing risks.
A key to our risk management is a robust risk assessment methodology providing consistent risk outcomes, to ensure appropriate mitigation strategies can be implemented. The provision of barriers against identified risks from water quality hazards, as required by our standards based on the ADWG, other international guidelines and our own experience, enables these risks to be acceptably alleviated. Barriers include source protection, extended raw water detention, water treatment, disinfection and a sealed reticulation system. We have developed a Barrier Risk Assessment (BRA) process that provides guidance on how water quality risks should be assessed, prioritised and mitigated. Significantly, the BRA
ranks drinking water quality risks against other specific water quality risks, rather than seeking to compare between the multiple risk drivers of a water utility (e.g. adequate source volume, adequate and aging conveyance systems, adequacy of wastewater treatment and disposal etc.).
The development of our standards, reflecting the required level of risk treatment, for planning, design, operation and maintenance of drinking water supply systems was an important first step in the development of the BRA. This ensured there would be no new assets or systems with inadequate risk barriers and allowed for capital funding to bring existing assets up to standard.
Water Safety Plans and the Barrier Risk Assessment
The Water Safety Planning process is a comprehensive scheme risk assessment, from catchment to customer, undertaken in each scheme every 5 years, which addresses many of the requirements of the Framework. In between this major risk assessment an assessment on the degree of challenge and adequacy of barriers (BRA) is conducted on each scheme annually. Outputs from both of these processes inform our capital, operations or maintenance programs.

25 Drinking Water Quality Annual Report ISSN 2202-879X
Four major water quality hazards are assessed in the completion of the BRA of each water supply system. These are the risk of supplying water to customers that may:
• Contain pathogens
• Contain Naegleria
• Contain chemicals, or
• Be aesthetically displeasing
There are 11 hazardous events assessed within these four categories, for example trihalomethanes (THMs) and pesticides both reside in the ‘contain chemicals’ risk.
To ensure consistency across schemes and enable prioritisation of mitigation strategies, the consequence of each hazardous event is fixed based on our risk assessment criteria ratings. As expected, when considering the consequence of drinking water quality risks, the criteria accounts for impacts to public health, but also financial, reputational and compliance consequences.
Example of a simple WSP schematic
The likelihood is measured based on the degree to which the challenge from a hazardous event is mitigated by a barrier. The closer the barrier is to our standard, the closer the likelihood is to being effectively mitigated (i.e. a ‘rare’ likelihood). For example, to meet our standards, an “unprotected” drinking water catchment requires a treatment barrier (filtration) plus disinfection barriers (UV disinfection and chlorination). Where the likelihood of a hazardous event is greater than ‘rare’, actions are captured to bring the system up to our standard.
Conclusion
The Water Safety Planning and BRA processes have been refined over the years and have enhanced understanding of drinking water quality risk throughout the business. The information gained through these processes is used to optimise the allocation of funding to mitigate the highest drinking water quality risks. As we become increasingly risk focussed, the visibility and flexibility provided by the BRA will become increasingly critical in achievement of the ‘continual improvement’ element of the Framework.

26 Drinking Water Quality Annual Report ISSN 2202-879X
Case Study – Water Treatment Plant logbooks We have been a leader in the development and adoption of the multiple barrier approach to managing drinking water quality risks. The majority of data on the performance of these barriers is collected and stored electronically. This includes continuous SCADA based data from on-line instrumentation monitoring treatment plant operations and grab sample based data that operators and laboratories generate. The data is stored in a number of different systems and this was identified as requiring a more robust solution.
We have almost 200 water treatment plants across our country regions, of which over 50 are considered more ‘complex’ as they have more than just simple chlorine disinfection as part of the water treatment process. The use of logbooks for recording field readings at these more complex plants has resulted in a number of process improvements and the prevention of many water quality incidents.
Logbooks are created as group of MS Excel data sheets that are uniquely built for each treatment plant. They outline the monitoring requirements for each treatment process and enable reporting of the performance of these processes as part of our multiple barrier approach to managing drinking water quality risk. In particular, reporting performance of water treatment against critical regulatory and risk management performance criteria. Field operators, operations managers, water quality coordinators and water treatment specialists use the logbooks to review historical data and maintain knowledge of plant performance. The logbooks are also used to monitor and identify issues with treatment plant performance that may require operational and/or capital investment to assure the delivery of safe drinking water.
The limitations of maintaining the logbooks in MS Excel resulted in the creation of a project in 2016/17 to develop a more robust IT solution. The solution identified involves using a mobile application (app) that will allow operators enter field data directing into our systems and receive real-time notification for ‘out-of-spec’ readings requiring a response action. The mobile application allows:
• Field data capture with online and offline capability;
• Real-time notifications for out-of-spec readings;
• Ability to register events/actions with defined escalation process;
• Ability to audit settings and administer user security permissions;
• Connectivity to established business systems;
• Retention of historical records with customised reporting; and
• Adoption of a corporately supported data management system for water treatment plant logbooks.
The mobile application has been trialled at a number of regional water treatment plants, some of which have, until now, been unable to transfer field data directly from the operator at the treatment plant into our systems without the use of offline paper-based processes. The success of this application development was shared at this year’s WA IT Leaders’ Summit in Perth where we discussed some of the solutions that were developed to manage performance data from remote treatment plants.
27 Drinking Water Quality Annual Report ISSN 2202-879X
Understanding water quality test results The following summaries are intended to assist you with interpreting the results presented in this report. Additional information can be obtained by referring to the Fact Sheets contained in the ADWG published by the National Health and Medical Research Council and our website www.watercorporation.com.au.
For the purposes of this report, all data are assessed in relation to the ADWG.
Escherichia coli (E. coli)
Most human pathogenic microorganisms are found in the gut and faeces of humans and other warm blooded animals along with other non-pathogenic microorganisms. The bacteria E. coli is found in abundance in the intestine of warm blooded animals and, although most species are not pathogenic to humans, they indicate possible contamination by human or animal waste. As it is impractical to test for the presence of all pathogenic microorganisms in water, the ADWG recommends testing for the microbial indicator bacterium E. coli to indicate the presence of contamination. If there is E. coli there may also be pathogenic organisms. We employ the multiple barrier approach (refer to page 19) to prevent microbial contamination, however if there is an E. coli detection it is immediately addressed to ensure the water supplied to customers is safe.
Thermophilic Naegleria
Thermophilic Naegleria refers to a group of amoebae that thrive in water between 20°C and 42°C, which includes Naegleria fowleri. This organism is safe to drink but can cause the disease primary amoebic meningoencephalitis if it enters the body through the nose. It is found in the environment, is not associated with human waste and, under certain conditions, may proliferate in pipework and tanks. Adequate levels of chlorine or chloramine can control Naegleria. Any detection of thermophilic Naegleria is responded to immediately to ensure the potential risk to public health is managed.
Fluoride
Fluorine is one of the most abundant elements in the Earth’s crust, and is typically found as the fluoride ion or as organic or inorganic fluorides. It is found naturally in groundwater supplies, and is present in most food and beverage products and toothpaste. Additional fluoride is added to a number of water supplies in Western Australia as directed by the Minister for Health (refer to “Fluoridation” on page 17). The fluoride concentration after dosing is set by the Fluoridation of Public Water Supplies Advisory Committee, and does not exceed 1 mg/L. Notwithstanding this, the ADWG health guideline for fluoride is 1.5 mg/L, applicable to both fluoridated and non-fluoridated localities.
28 Drinking Water Quality Annual Report ISSN 2202-879X
Nitrate
In Western Australia, elevated nitrate concentrations are usually due to the natural process of plant decay underground that has occurred over geological time. The ADWG specify a health guideline for nitrate of 50 mg/L for bottle-fed infants less than three months old and a guideline of 100 mg/L for adults and children over three months old. Nitrate poisoning is very rare and to date no case, due to nitrate in drinking water, has been recorded in Western Australia.
The following localities have a nitrate levels between 50 mg/L and 100 mg/l and have an exemption from compliance with the nitrate guidelines by the Department of Health:
• Mid-West Region - Cue, Meekatharra, Mt Magnet, Nabawa, New Norcia, Sandstone, and Yalgoo.
• Goldfields and Agricultural Region - Laverton, Leonora, Menzies, and Wiluna.
In these towns, the Community Health Nurse provides advice to mothers regarding the use of alternative water for the preparation of bottle feeds. We provide bottled water free of charge via the Community Health Nurse as required.
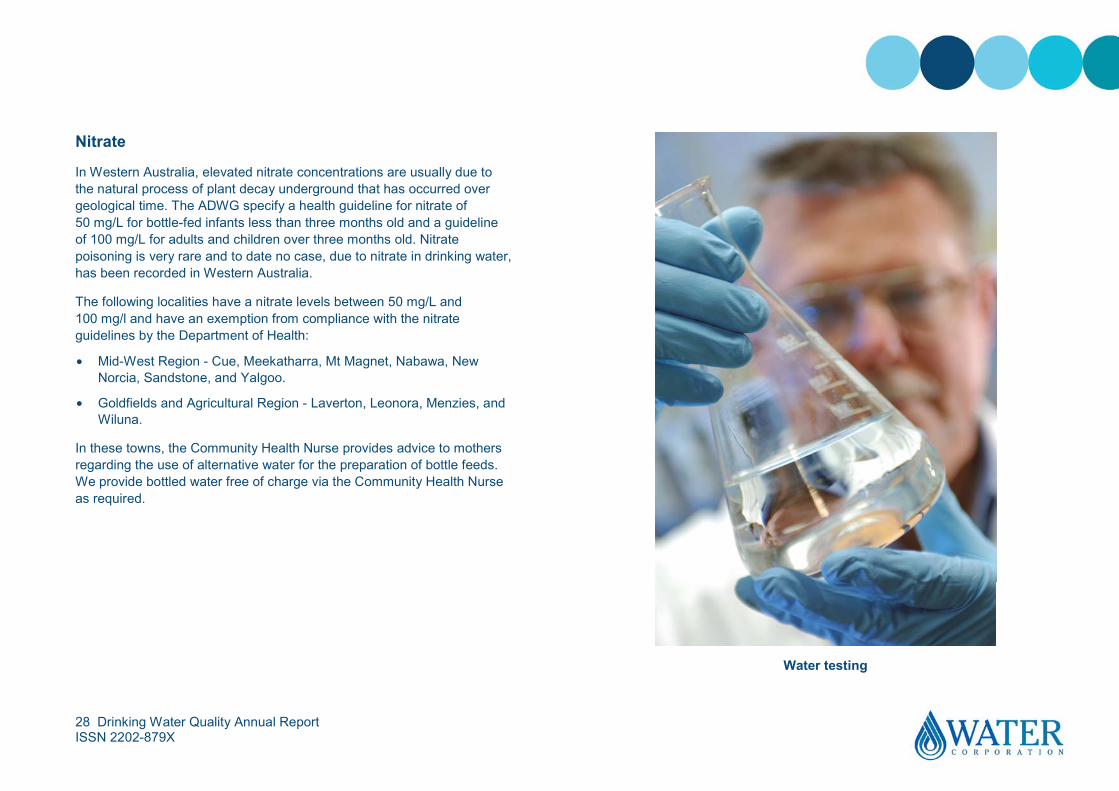
Water testing
29 Drinking Water Quality Annual Report ISSN 2202-879X
Trihalomethanes
Trihalomethanes (THMs) are present in drinking water as a by-product of disinfection using chlorination (and chloramination to a lesser extent). We are required to comply with the ADWG health guideline of 0.25mg/L expressed as an average long term exposure. For the purposes of this report, THM compliance is assessed comparing the guideline with the mean annual THM concentration.
Alkalinity (as calcium carbonate)
Alkalinity is a measure of the parameters in water that have acid-neutralising ability, typically expressed in mg/L of equivalent calcium carbonate. Alkalinity can be affected by naturally occurring minerals or water treatment chemicals. There are no aesthetic or health considerations for alkalinity, and therefore the ADWG do not provide a guideline value.
Aluminium (acid-soluble)
Acid-soluble aluminium in water primarily originates from the addition of coagulants such as aluminium sulphate or poly-aluminium chloride in the water treatment process. These coagulants are added to aid the removal of colour and turbidity. Aluminium can accumulate in pipe sediments, and be re-suspended during periods of rapid changes to flow patterns. The ADWG specify an aesthetic guideline of 0.2 mg/L. No health guideline is set.
Chloride
Chloride is present in natural waters from the dissolution of salt deposits. In surface water, the concentration of chloride is typically less than 100 mg/L while groundwater can have higher concentrations, particularly
if there is salt water intrusion. In Australian drinking water supplies chloride levels range up to 650 mg/L depending on local source characteristics.
Chloride is essential for humans and animals. It contributes to the osmotic activity of body fluids. Based on aesthetic considerations, the chloride concentration in drinking water should not exceed 250 mg/L (ADWG).
Hardness (as calcium carbonate)
Hard water requires more soap to obtain lather. It can also cause scale to form on hot water pipes and fittings. Hardness is caused by the presence of dissolved calcium and magnesium. Water with hardness:
• Less than 60 mg/L is soft and possibly corrosive (depends on pH, alkalinity and dissolved oxygen concentration);
• Between 60 and 200 mg/L is deemed good quality for all domestic uses;
• Between 200 and 500 mg/L will increase scale formation; and
• Greater than 500 mg/L will cause a high level scaling.
Hardness can be an important issue when purchasing appliances such as dishwashers. Hardness can be expressed in a number of units of measure. To convert the hardness values presented in this report (expressed in mg/L) to dH (German degree) units, divide by 17.8. To convert hardness to millimol (mmol) units, divide by 100 and to convert to milliequivalent (mEq) divide by 50. The ADWG specify an aesthetic hardness guideline of 200 mg/L.

30 Drinking Water Quality Annual Report ISSN 2202-879X
Iron
Iron occurs naturally in water as a result of contact with soil or rock in the catchment. It can accumulate in pipe sediments, and be re-suspended during periods of rapid changes to flow patterns. Elevated concentrations cause discoloured water and can stain laundry. The ADWG specify an aesthetic guideline of 0.3 mg/L.
Manganese
Manganese in water can come from contact with soil or rock in the catchment. It can accumulate in pipe sediments, and be re-suspended during periods of rapid changes to flow patterns.
Elevated manganese can make water look black and stain laundry. The ADWG specify an aesthetic guideline of 0.1 mg/L, though we aim to manage below this guideline due to customer impacts. For further information regarding guideline levels for other metals relevant to drinking water, refer to Appendix A, page 40.
pH
pH is a measure of water acidity (pH 7 is neutral). The ADWG specify a lower and upper aesthetic value of 6.5 and 8.5 respectively. The guidelines allow for a pH of up to 9.2 for new concrete tanks and cement-lined pipes, which can significantly increase the pH for a short period of time. Elevated pH is often caused by calcium carbonate leaching from the protective cement lining of the pipes after long transit times, or may be required as part of chloramine disinfection (refer to page 17). These conditions may be found at a number of localities in our large water supply schemes. Where low pH is experienced, this is typically a consequence of the source characteristic rather than the influence of treatment. Buffering is a treatment process that stabilises the pH of the water.
Silica
In Australia, dissolved silica can range between 0.6 mg/L in some surface waters to 110 mg/L in ground waters. Dissolved silica can precipitate on some surfaces forming a white residue. In cases where customer complaints occur due to scale build-up, water hardness and silica concentrations are often identified as the primary cause. There is no adverse health considerations associated with silica in drinking water, but to minimise scale build up on surfaces silica should not exceed 80 mg/L (ADWG).
Sodium
Sodium is widespread in water due to the high solubility of sodium salts and the abundance of mineral deposits. In major Australian reticulated supplies, sodium concentrations range from 3 mg/L to 300 mg/L. While sodium is essential to human life, there is no agreed minimum daily intake level. Based on aesthetic consideration the concentration of sodium in drinking water should not exceed 180 mg/L (ADWG).
31 Drinking Water Quality Annual Report ISSN 2202-879X
Total Dissolved Solids
Total Dissolved Solids (TDS) consist of inorganic (natural) salts and small amounts of organic matter dissolved in water. TDSs comprise sodium, potassium, calcium, magnesium, chloride, sulphate, bicarbonate, carbonate, silica, organic matter, fluoride, iron, manganese, nitrate and phosphate.
Water with low TDS can taste flat, while water with high TDS tastes salty and causes scaling in pipes, fittings and household appliances. The ADWG provide guidance in the palatability of drinking water according to TDS concentration:
TDS (mg/L) Palatability
0 – 600 Good quality
600 – 900 Fair quality
900 – 1200 Poor quality
> 1200 Unpalatable
The ADWG guideline of 600 mg/L is based on taste.
True colour
Colour in water originates mainly from natural drainage through soil and vegetation in a catchment. Corroding metal pipes can also discolour the water, with iron producing a brownish colour and copper a faint blue colour. The ADWG specify an aesthetic guideline of 15 True Colour Units (TCU). As a guide, 15 TCU is just noticeable in a glass.
Turbidity
Turbidity is the cloudy appearance of water caused by the presence of suspended matter. The ADWG specify an aesthetic guideline of 5 Nephelometric Turbidity Units (NTU) which is just noticeable in a glass of water.
Sampling parameters
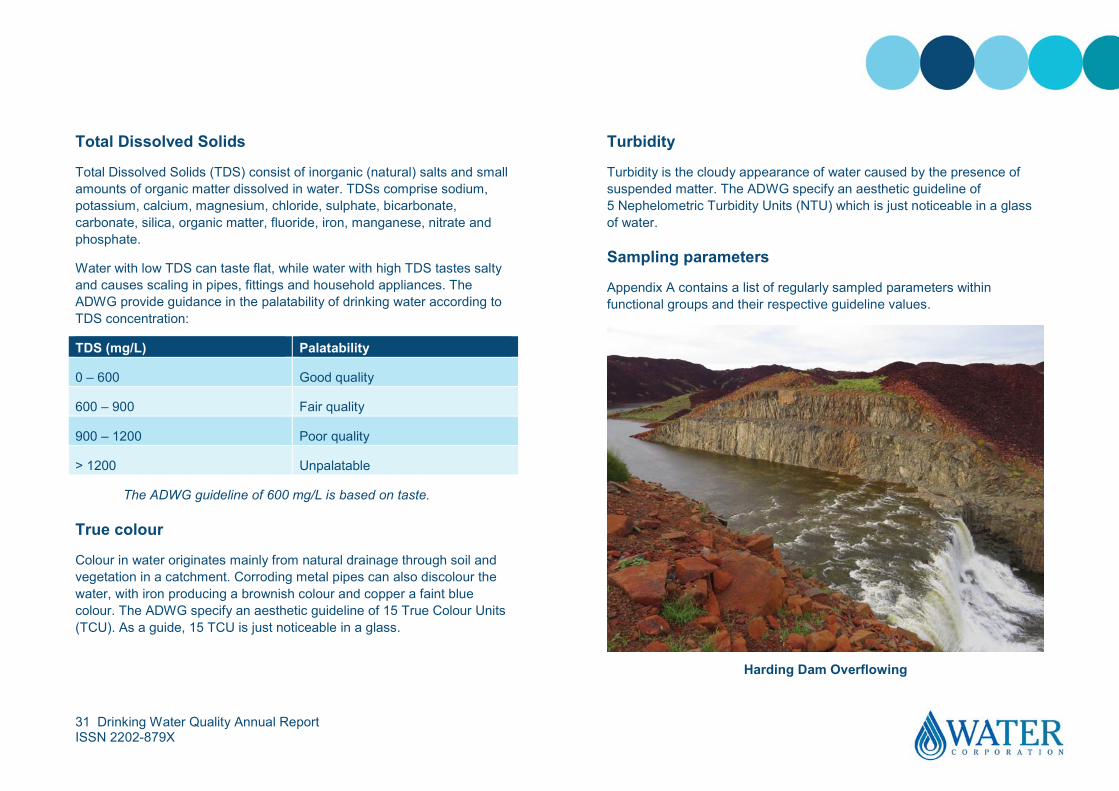
Appendix A contains a list of regularly sampled parameters within functional groups and their respective guideline values.
Harding Dam Overflowing

32 Drinking Water Quality Annual Report ISSN 2202-879X
Our performance
Health related performance
We again achieved excellent microbiological performance in 2016-17 with 100 per cent of schemes complying with Escherichia coli and thermotolerant Naegleria requirements. We also achieved 100 per cent for chemical health performance (see graph 1).
For this report, the target is achieved if the yearly average concentration for each chemical is less than the guideline value (refer to ‘Understanding water quality test results on page 27).
Microbiological performance requirements of our MoU with DoH were all met for the past six years (graph 2).
Graph 1: Microbiological and Chemical Health Performance
Graph 2: Six year microbiological performance
Non-health (aesthetic) related performance
While we strive to meet the ADWG for aesthetic characteristics, this is very difficult to achieve in a state as vast as Western Australia with such diverse water sources. We are committed to improving all aspects of drinking water quality, however, improvements in aesthetic water quality can be very costly and are often hard to achieve.
Detailed performance review for 2016-17
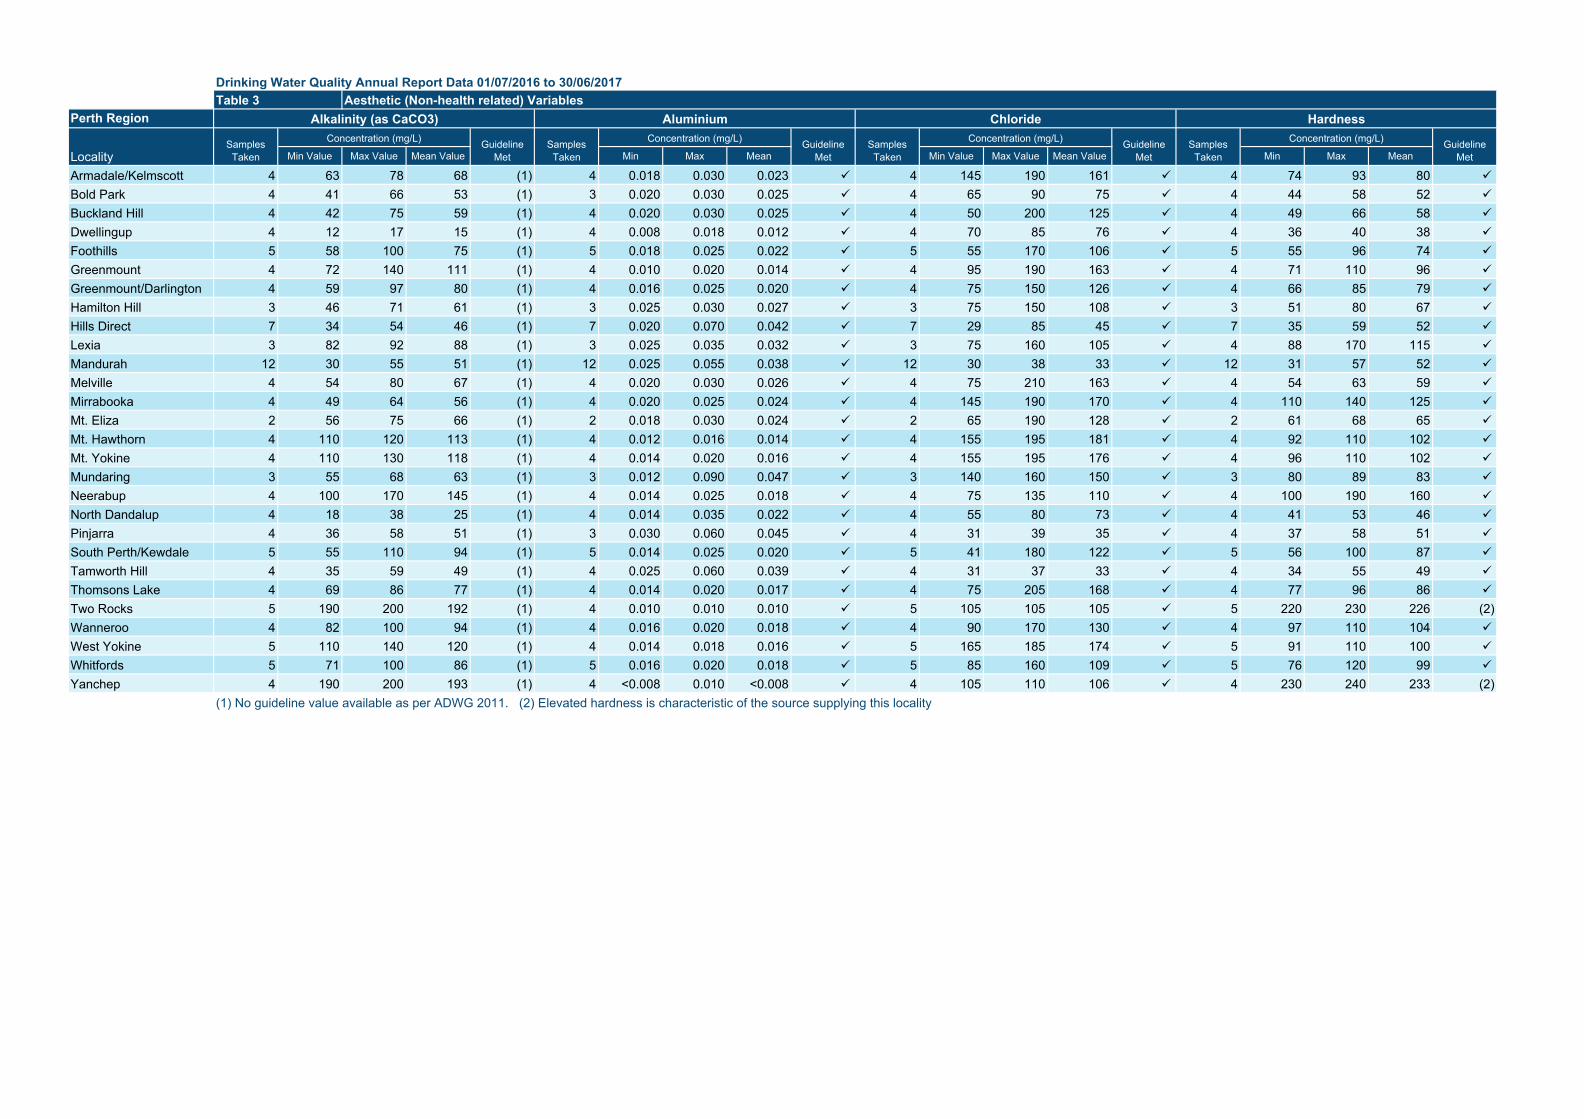
Appendix B provides a detailed summary of test results for each scheme throughout the State. In 2016-17 there were 157 out of 251 schemes where the mean concentration for the year for all aesthetic parameters was less than the aesthetic guidelines. Our performance for all aesthetic analyses (alkalinity, aluminium, true colour, hardness, iron, manganese, pH, TDS, turbidity, sodium, chloride and silica) across our 251 schemes was 94 per cent, with 8,406 out of 8,918 analyses complying with the aesthetic guidelines.
The results in Appendix B show a small number of excursions above the guidelines in aesthetic quality. These excursions are caused by the unique quality of local sources, lack of alternative sources, impact of the drying climate on groundwater production and abstraction from groundwater in proximity to the coast.
For many schemes, these excursions have no, or minimal, influence on the taste of the drinking water.
33 Drinking Water Quality Annual Report ISSN 2202-879X
Customer expectations
Customer contacts
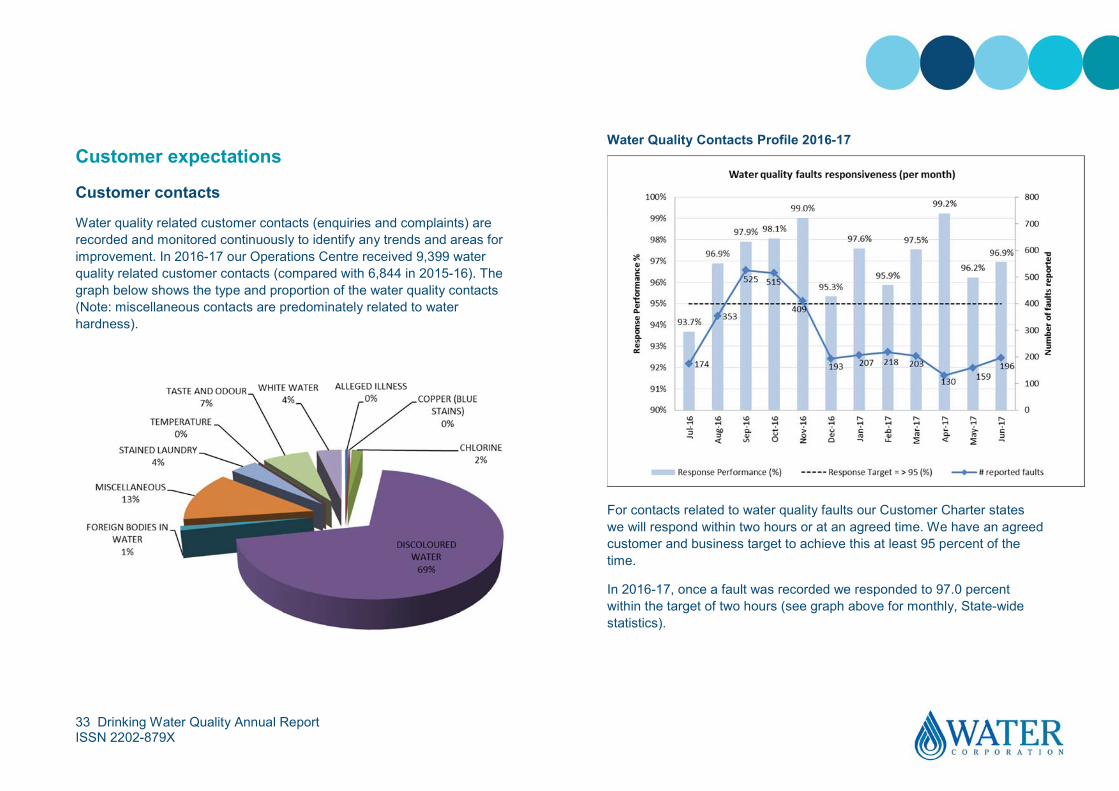
Water quality related customer contacts (enquiries and complaints) are recorded and monitored continuously to identify any trends and areas for improvement. In 2016-17 our Operations Centre received 9,399 water quality related customer contacts (compared with 6,844 in 2015-16). The graph below shows the type and proportion of the water quality contacts (Note: miscellaneous contacts are predominately related to water hardness).
Water Quality Contacts Profile 2016-17
For contacts related to water quality faults our Customer Charter states we will respond within two hours or at an agreed time. We have an agreed customer and business target to achieve this at least 95 percent of the time.
In 2016-17, once a fault was recorded we responded to 97.0 percent within the target of two hours (see graph above for monthly, State-wide statistics).

34 Drinking Water Quality Annual Report ISSN 2202-879X
Customer research
We measure community perceptions of the quality of their drinking water through our quarterly Customer Performance Index (CPI) survey. In this survey, customers are asked to indicate the degree to which they either agree or disagree with two statements in relation to water quality (where 1 is ‘poor’ and 10 is ‘excellent’). The rating for these questions, for each quarter of the year, is shown below.
In March 2017, we began a formal, extensive State-wide community engagement and customer research program known as ‘Tap In’. Through this program, we will plan customer feedback into our strategic and business planning processes to continue to ensure we are truly a customer led organisation.
Responses to Survey Questions over the past 5 years:
Survey Questions September 2016 December 2016 March 2017 June 2017 End of year average
How would you rate the Water Corporation on providing an acceptable standard of water quality?
7.28 7.35 7.24 7.31 7.29
How would you rate the Water Corporation on providing a consistent level of water quality?
7.38 7.49 7.37 7.40 7.40
6.8
6.9
7
7.1
7.2
7.3
7.4
7.5
Jan-13 Jan-14 Jan-15 Jan-16 Jan-17
an acceptablestandard ofwater quality
a consistentlevel of waterquality
35 Drinking Water Quality Annual Report ISSN 2202-879X
Improving your water quality
Monitoring and reporting improvements
We continue to strengthen the performance of our operational monitoring which informs our Barrier Risk Assessment (see page 24). The Barrier Risk Assessment is a process we routinely apply to review the risk associated with our drinking water supply schemes. This process assists us with identifying and understanding the need for and prioritisation of our investment to address those risks.
Water quality capital improvements
We continue to progress our program of water quality capital improvements. These projects ensure robust multiple barriers are in place from “catchment to tap” for all our schemes. Some examples of work undertaken this year are described throughout this report.
Monitoring and control systems
Installation of instrumentation that allows continuous monitoring of key water quality parameters at each water supply ensures unsatisfactory performance is detected quickly and remedial actions initiated.
This year six Chemscan analysers were installed within the Goldfields and Agricultural Water Supply (GAWS). The analysers are capable of measuring and providing high quality and reliable data necessary to inform and manage this complex chloraminated system.
Additional fencing and signage was installed at several of our drinking water catchments within the North West and Great Southern Regions. This infrastructure is an effective method in reducing the occurrence of undesirable activity within our precious catchment areas.
Chlorination
We continue with our chlorination program, upgrading the visibility of chlorinators to the latest standards. Improvements will ensure enhanced alarming, automation and reporting capability.
In addition, new chlorinators have been installed / upgraded this financial year at Marvel Loch, Kellerberrin North, Mocardy and East Miling. The new chlorinators will improve the residual maintenance capability for GAWS by better maintaining and extending the disinfection residual throughout the system. Provision of an adequate disinfection residual results in reducing the occurrence of nitrification which can have a significant water quality impact.
Water treatment
New treatment plants, and upgrades to existing plants continue to be installed across the State to provide an additional barrier to microbiological contamination.
This year new water treatment plants have been installed within the Great Southern Towns of Salmon Gums, Jerramungup, Frankland and Ongerup. These new treatment plants increase the robustness of the current treatment in place to further reduce water quality risks for these towns.
Treatment upgrade projects have progressed primarily within the Mid-West Region with an objective to improve the aesthetic quality of water within several towns including Cue, Horrocks, Meekatharra Moora, Mt Magnet, Sandstone and Yalgoo. A project to upgrade the existing iron removal treatment within the South West Region town of Australind is also nearing completion.
36 Drinking Water Quality Annual Report ISSN 2202-879X
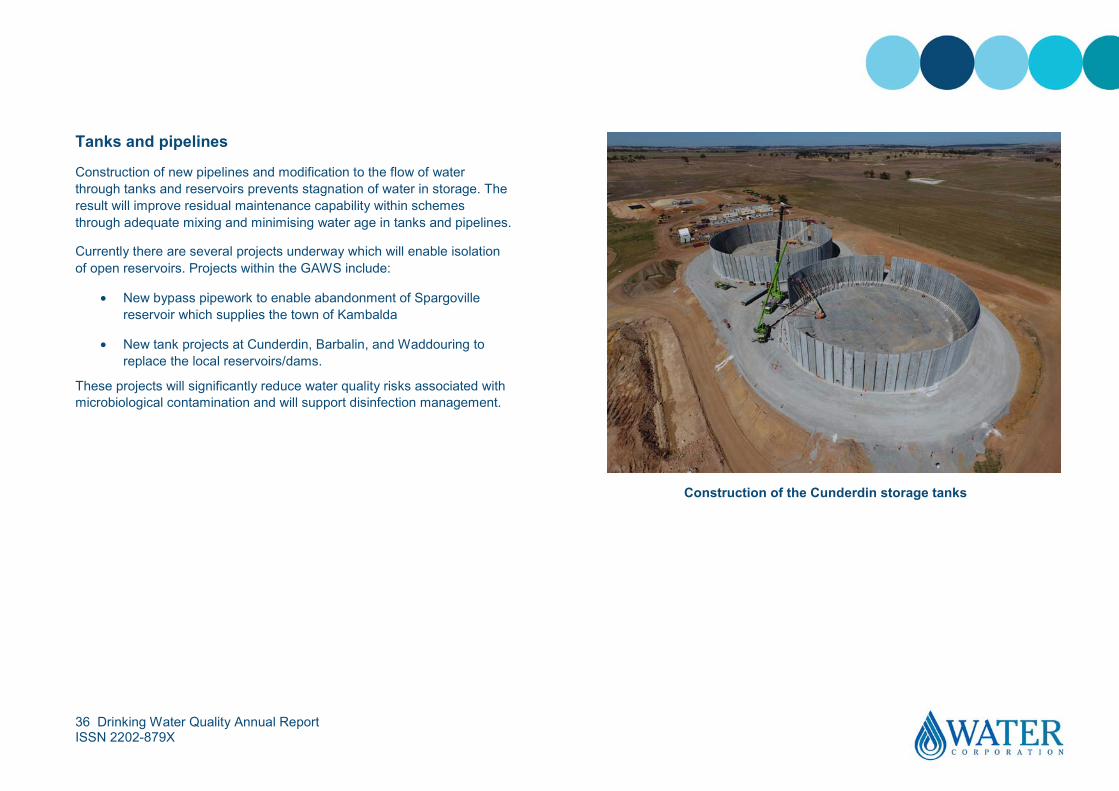
Tanks and pipelines
Construction of new pipelines and modification to the flow of water through tanks and reservoirs prevents stagnation of water in storage. The result will improve residual maintenance capability within schemes through adequate mixing and minimising water age in tanks and pipelines.
Currently there are several projects underway which will enable isolation of open reservoirs. Projects within the GAWS include:
• New bypass pipework to enable abandonment of Spargoville reservoir which supplies the town of Kambalda
• New tank projects at Cunderdin, Barbalin, and Waddouring to replace the local reservoirs/dams.
These projects will significantly reduce water quality risks associated with microbiological contamination and will support disinfection management.
Construction of the Cunderdin storage tanks
37 Drinking Water Quality Annual Report ISSN 2202-879X
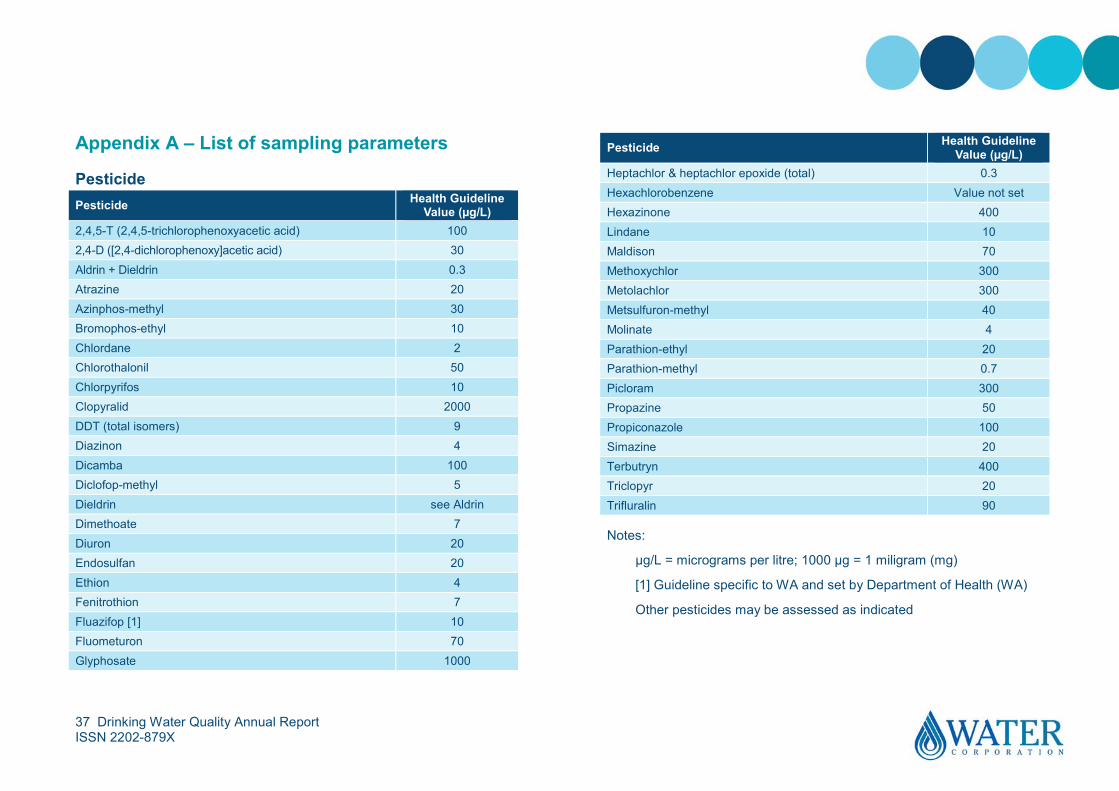
Appendix A – List of sampling parameters
Pesticide Pesticide Health Guideline
Value (µg/L) 2,4,5-T (2,4,5-trichlorophenoxyacetic acid) 100 2,4-D ([2,4-dichlorophenoxy]acetic acid) 30 Aldrin + Dieldrin 0.3 Atrazine 20 Azinphos-methyl 30 Bromophos-ethyl 10 Chlordane 2 Chlorothalonil 50 Chlorpyrifos 10 Clopyralid 2000 DDT (total isomers) 9 Diazinon 4 Dicamba 100 Diclofop-methyl 5 Dieldrin see Aldrin Dimethoate 7 Diuron 20 Endosulfan 20 Ethion 4 Fenitrothion 7 Fluazifop [1] 10 Fluometuron 70 Glyphosate 1000
Pesticide Health Guideline Value (µg/L)
Heptachlor & heptachlor epoxide (total) 0.3 Hexachlorobenzene Value not set Hexazinone 400 Lindane 10 Maldison 70 Methoxychlor 300 Metolachlor 300 Metsulfuron-methyl 40 Molinate 4 Parathion-ethyl 20 Parathion-methyl 0.7 Picloram 300 Propazine 50 Propiconazole 100 Simazine 20 Terbutryn 400 Triclopyr 20 Trifluralin 90
Notes:
µg/L = micrograms per litre; 1000 µg = 1 miligram (mg)
[1] Guideline specific to WA and set by Department of Health (WA)
Other pesticides may be assessed as indicated
38 Drinking Water Quality Annual Report ISSN 2202-879X
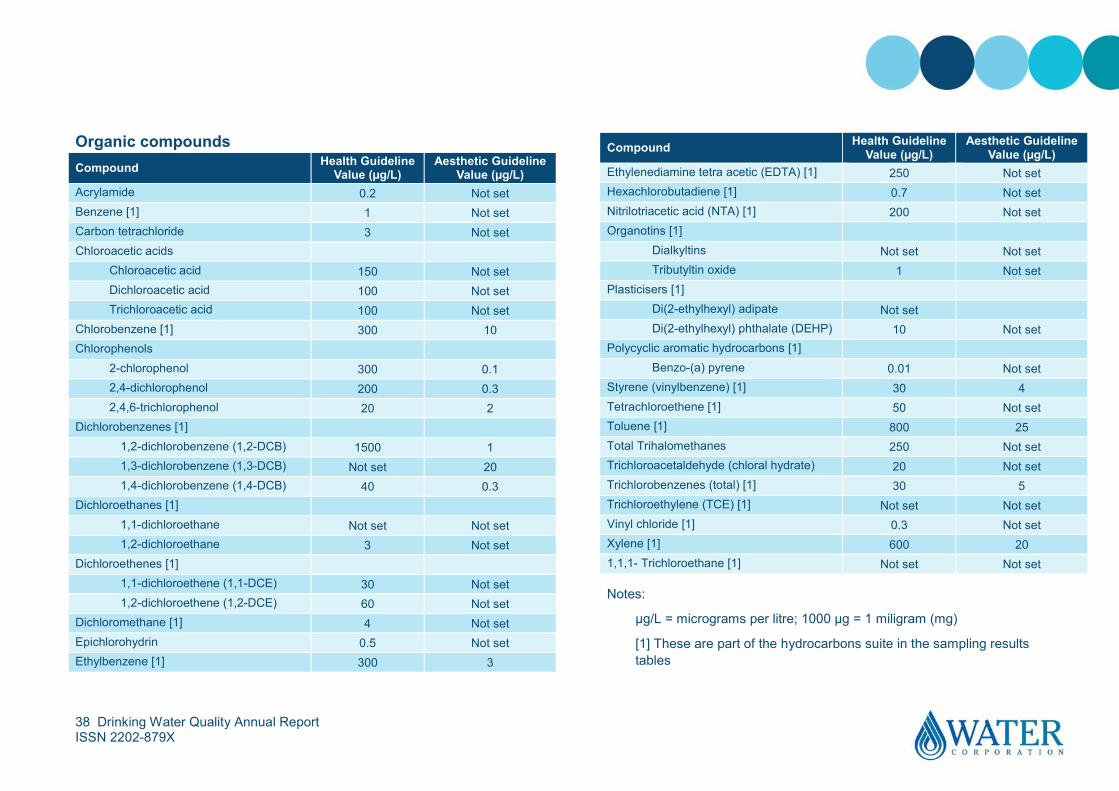
Organic compounds Compound Health Guideline
Value (µg/L) Aesthetic Guideline
Value (µg/L) Acrylamide 0.2 Not set Benzene [1] 1 Not set Carbon tetrachloride 3 Not set Chloroacetic acids
Chloroacetic acid 150 Not set Dichloroacetic acid 100 Not set Trichloroacetic acid 100 Not set
Chlorobenzene [1] 300 10 Chlorophenols
2-chlorophenol 300 0.1 2,4-dichlorophenol 200 0.3 2,4,6-trichlorophenol 20 2
Dichlorobenzenes [1] 1,2-dichlorobenzene (1,2-DCB) 1500 1 1,3-dichlorobenzene (1,3-DCB) Not set 20 1,4-dichlorobenzene (1,4-DCB) 40 0.3
Dichloroethanes [1] 1,1-dichloroethane Not set Not set 1,2-dichloroethane 3 Not set
Dichloroethenes [1] 1,1-dichloroethene (1,1-DCE) 30 Not set 1,2-dichloroethene (1,2-DCE) 60 Not set
Dichloromethane [1] 4 Not set Epichlorohydrin 0.5 Not set Ethylbenzene [1] 300 3
Compound Health Guideline Value (µg/L)
Aesthetic Guideline Value (µg/L)
Ethylenediamine tetra acetic (EDTA) [1] 250 Not set Hexachlorobutadiene [1] 0.7 Not set Nitrilotriacetic acid (NTA) [1] 200 Not set Organotins [1]
Dialkyltins Not set Not set Tributyltin oxide 1 Not set
Plasticisers [1] Di(2-ethylhexyl) adipate Not set Di(2-ethylhexyl) phthalate (DEHP) 10 Not set
Polycyclic aromatic hydrocarbons [1] Benzo-(a) pyrene 0.01 Not set
Styrene (vinylbenzene) [1] 30 4 Tetrachloroethene [1] 50 Not set Toluene [1] 800 25 Total Trihalomethanes 250 Not set Trichloroacetaldehyde (chloral hydrate) 20 Not set Trichlorobenzenes (total) [1] 30 5 Trichloroethylene (TCE) [1] Not set Not set Vinyl chloride [1] 0.3 Not set Xylene [1] 600 20 1,1,1- Trichloroethane [1] Not set Not set
Notes:
µg/L = micrograms per litre; 1000 µg = 1 miligram (mg)
[1] These are part of the hydrocarbons suite in the sampling results tables
39 Drinking Water Quality Annual Report ISSN 2202-879X
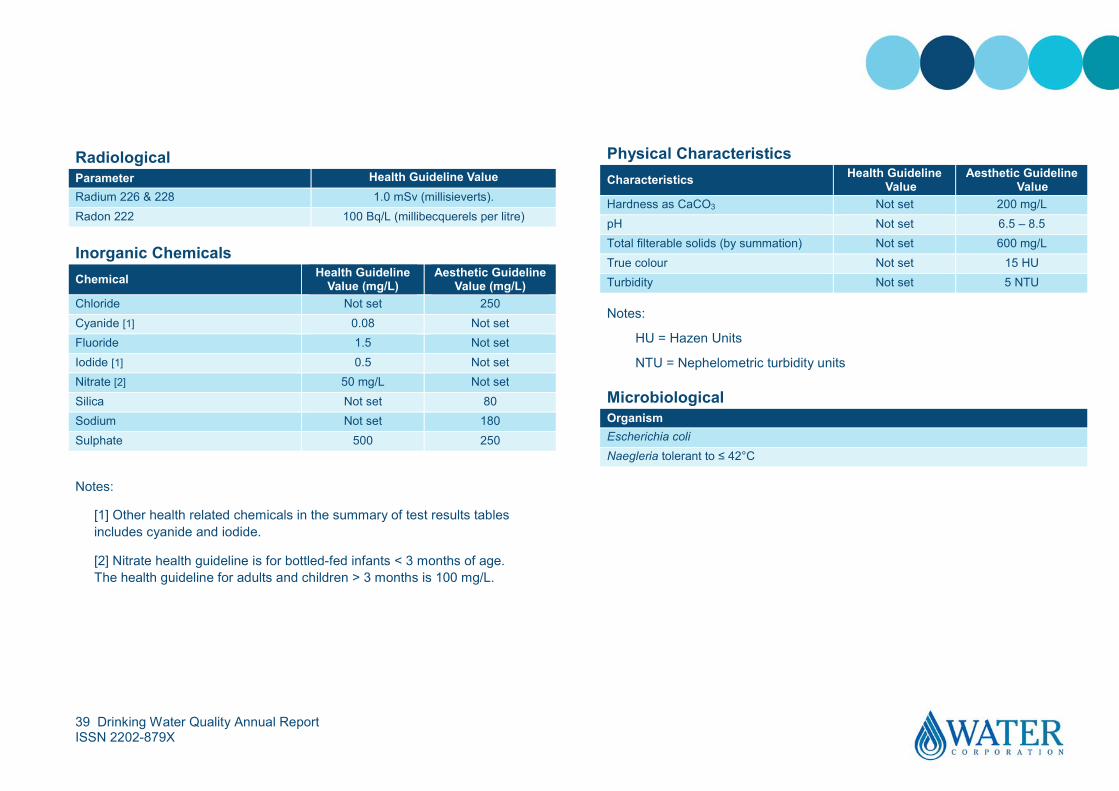
Radiological Parameter Health Guideline Value Radium 226 & 228 1.0 mSv (millisieverts). Radon 222 100 Bq/L (millibecquerels per litre)
Inorganic Chemicals Chemical Health Guideline
Value (mg/L) Aesthetic Guideline
Value (mg/L) Chloride Not set 250 Cyanide [1] 0.08 Not set Fluoride 1.5 Not set Iodide [1] 0.5 Not set Nitrate [2] 50 mg/L Not set Silica Not set 80 Sodium Not set 180 Sulphate 500 250
Notes:
[1] Other health related chemicals in the summary of test results tables includes cyanide and iodide.
[2] Nitrate health guideline is for bottled-fed infants < 3 months of age. The health guideline for adults and children > 3 months is 100 mg/L.
Physical Characteristics Characteristics Health Guideline
Value Aesthetic Guideline
Value Hardness as CaCO3 Not set 200 mg/L pH Not set 6.5 – 8.5 Total filterable solids (by summation) Not set 600 mg/L True colour Not set 15 HU Turbidity Not set 5 NTU
Notes:
HU = Hazen Units
NTU = Nephelometric turbidity units
Microbiological Organism Escherichia coli Naegleria tolerant to ≤ 42°C
40 Drinking Water Quality Annual Report ISSN 2202-879X
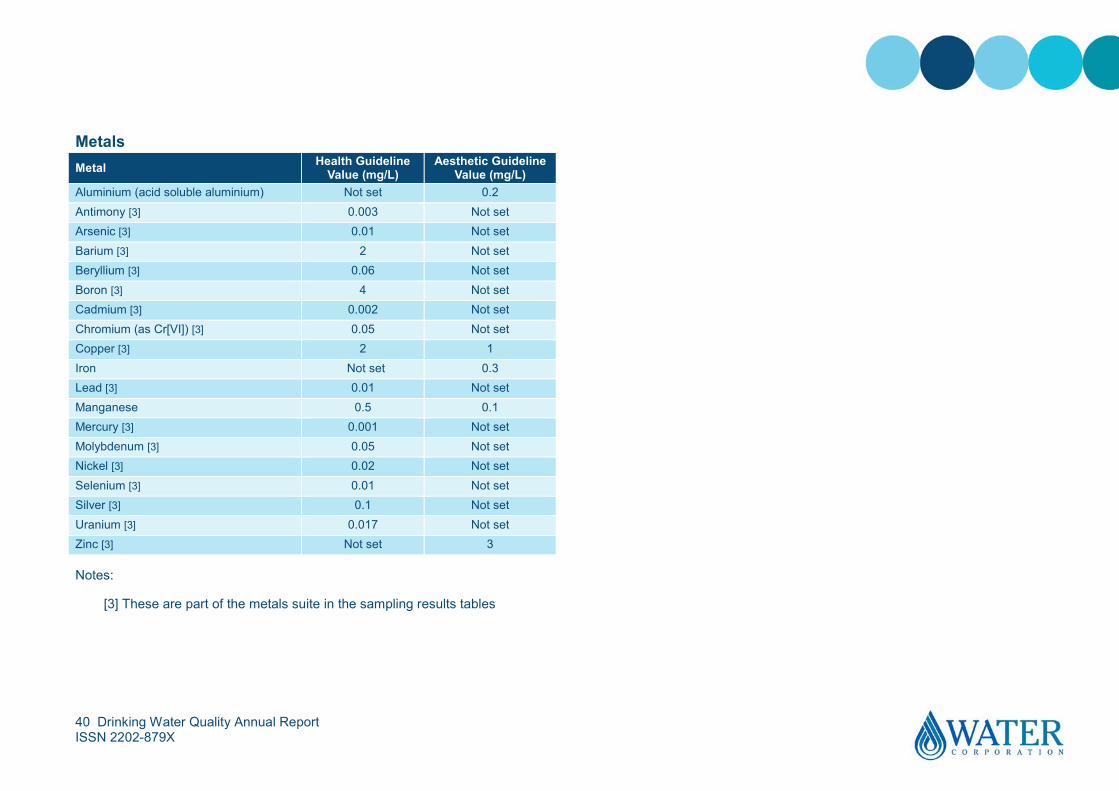
Metals Metal Health Guideline
Value (mg/L) Aesthetic Guideline
Value (mg/L) Aluminium (acid soluble aluminium) Not set 0.2 Antimony [3] 0.003 Not set Arsenic [3] 0.01 Not set Barium [3] 2 Not set Beryllium [3] 0.06 Not set Boron [3] 4 Not set Cadmium [3] 0.002 Not set Chromium (as Cr[VI]) [3] 0.05 Not set Copper [3] 2 1 Iron Not set 0.3 Lead [3] 0.01 Not set Manganese 0.5 0.1 Mercury [3] 0.001 Not set Molybdenum [3] 0.05 Not set Nickel [3] 0.02 Not set Selenium [3] 0.01 Not set Silver [3] 0.1 Not set Uranium [3] 0.017 Not set Zinc [3] Not set 3
Notes:
[3] These are part of the metals suite in the sampling results tables
41 Drinking Water Quality Annual Report ISSN 2202-879X
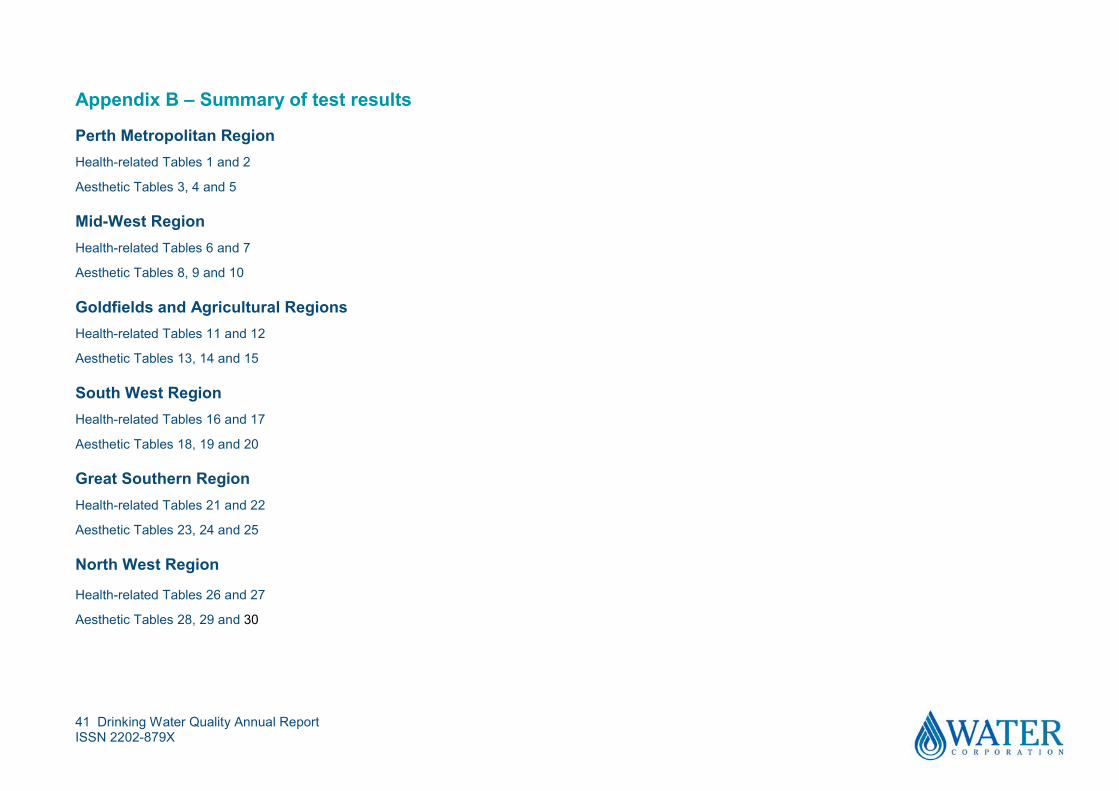
Appendix B – Summary of test results
Perth Metropolitan Region Health-related Tables 1 and 2
Aesthetic Tables 3, 4 and 5
Mid-West Region Health-related Tables 6 and 7
Aesthetic Tables 8, 9 and 10
Goldfields and Agricultural Regions Health-related Tables 11 and 12
Aesthetic Tables 13, 14 and 15
South West Region Health-related Tables 16 and 17
Aesthetic Tables 18, 19 and 20
Great Southern Region Health-related Tables 21 and 22
Aesthetic Tables 23, 24 and 25
North West Region
Health-related Tables 26 and 27
Aesthetic Tables 28, 29 and 30
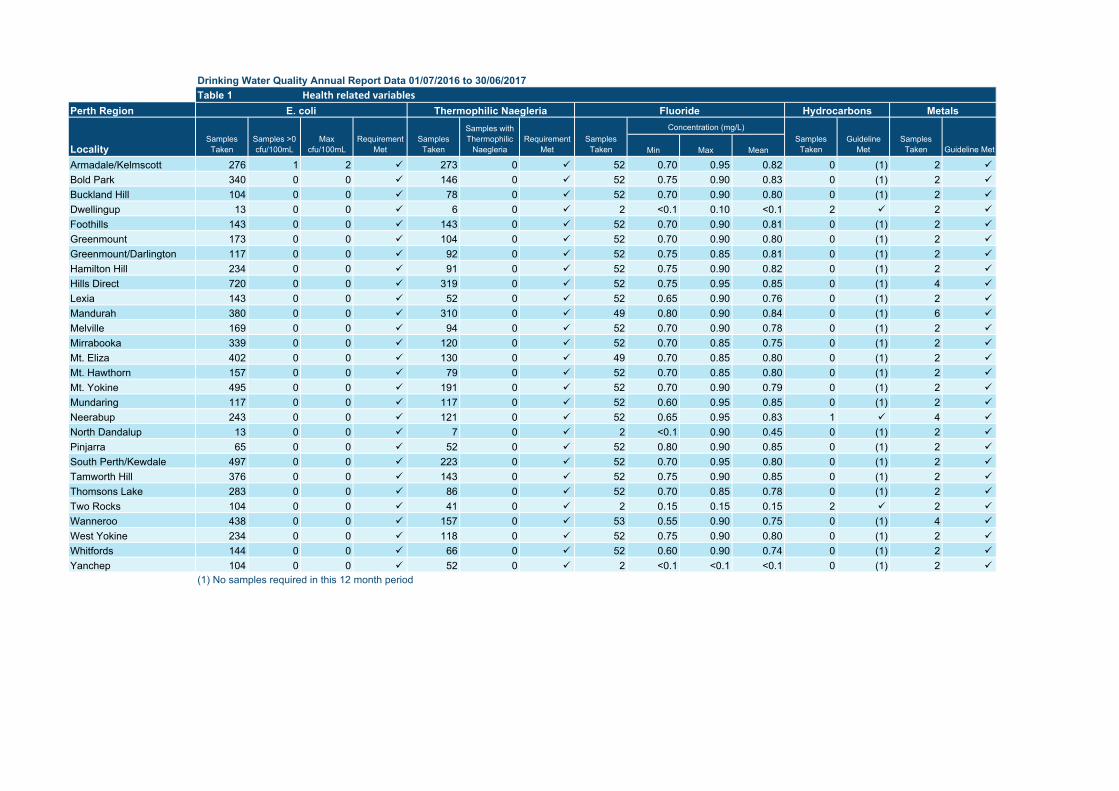
Drinking Water Quality Annual Report Data 01/07/2016 to 30/06/2017
Perth Region
Min Max Mean
Armadale/Kelmscott 276 1 2 273 0 52 0.70 0.95 0.82 0 (1) 2
Bold Park 340 0 0 146 0 52 0.75 0.90 0.83 0 (1) 2
Buckland Hill 104 0 0 78 0 52 0.70 0.90 0.80 0 (1) 2
Dwellingup 13 0 0 6 0 2 <0.1 0.10 <0.1 2 2
Foothills 143 0 0 143 0 52 0.70 0.90 0.81 0 (1) 2
Greenmount 173 0 0 104 0 52 0.70 0.90 0.80 0 (1) 2
Greenmount/Darlington 117 0 0 92 0 52 0.75 0.85 0.81 0 (1) 2
Hamilton Hill 234 0 0 91 0 52 0.75 0.90 0.82 0 (1) 2
Hills Direct 720 0 0 319 0 52 0.75 0.95 0.85 0 (1) 4
Lexia 143 0 0 52 0 52 0.65 0.90 0.76 0 (1) 2
Mandurah 380 0 0 310 0 49 0.80 0.90 0.84 0 (1) 6
Melville 169 0 0 94 0 52 0.70 0.90 0.78 0 (1) 2
Mirrabooka 339 0 0 120 0 52 0.70 0.85 0.75 0 (1) 2
Mt. Eliza 402 0 0 130 0 49 0.70 0.85 0.80 0 (1) 2
Mt. Hawthorn 157 0 0 79 0 52 0.70 0.85 0.80 0 (1) 2
Mt. Yokine 495 0 0 191 0 52 0.70 0.90 0.79 0 (1) 2
Mundaring 117 0 0 117 0 52 0.60 0.95 0.85 0 (1) 2
Neerabup 243 0 0 121 0 52 0.65 0.95 0.83 1 4
North Dandalup 13 0 0 7 0 2 <0.1 0.90 0.45 0 (1) 2
Pinjarra 65 0 0 52 0 52 0.80 0.90 0.85 0 (1) 2
South Perth/Kewdale 497 0 0 223 0 52 0.70 0.95 0.80 0 (1) 2
Tamworth Hill 376 0 0 143 0 52 0.75 0.90 0.85 0 (1) 2
Thomsons Lake 283 0 0 86 0 52 0.70 0.85 0.78 0 (1) 2
Two Rocks 104 0 0 41 0 2 0.15 0.15 0.15 2 2
Wanneroo 438 0 0 157 0 53 0.55 0.90 0.75 0 (1) 4
West Yokine 234 0 0 118 0 52 0.75 0.90 0.80 0 (1) 2
Whitfords 144 0 0 66 0 52 0.60 0.90 0.74 0 (1) 2
Yanchep 104 0 0 52 0 2 <0.1 <0.1 <0.1 0 (1) 2 (1) No samples required in this 12 month period
Samples Taken Guideline Met
Samples with Thermophilic
NaegleriaRequirement
MetSamples
Taken
Concentration (mg/L)Samples
TakenGuideline
MetLocalitySamples
TakenSamples >0 cfu/100mL
Max cfu/100mL
Requirement Met
Samples Taken
Table 1 Health related variablesE. coli Thermophilic Naegleria Fluoride Hydrocarbons Metals
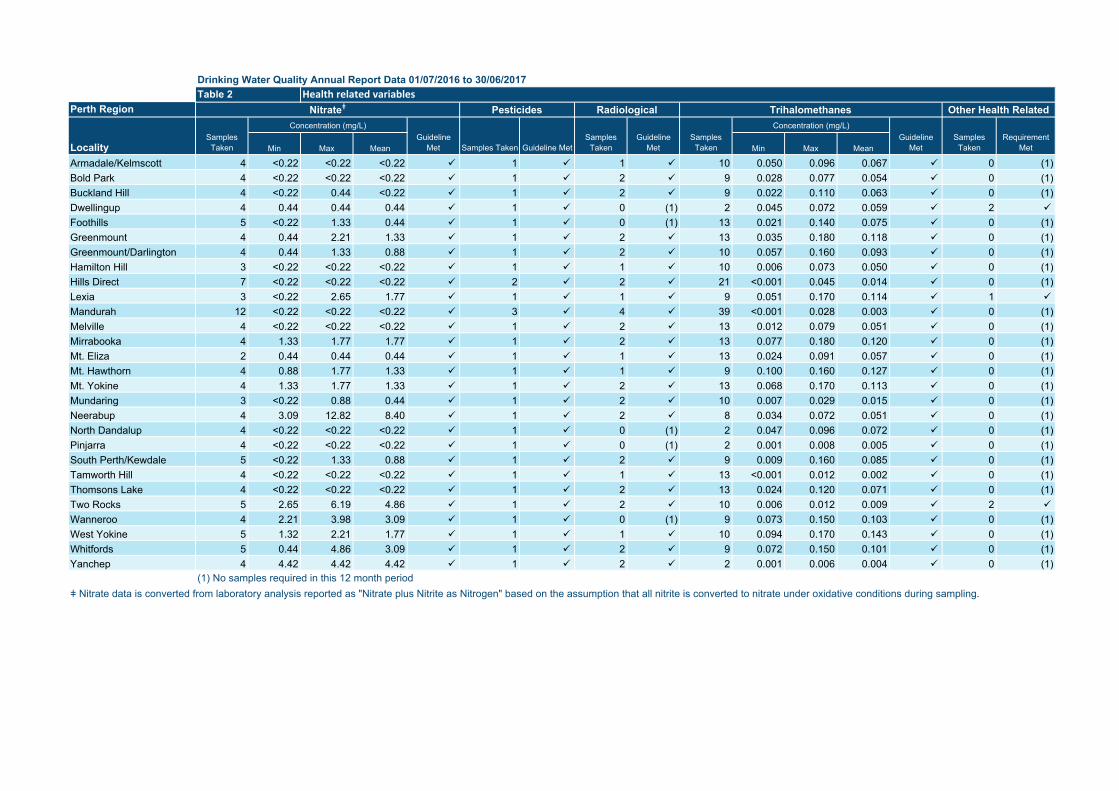
Drinking Water Quality Annual Report Data 01/07/2016 to 30/06/2017
Perth Region
Min Max Mean Min Max Mean
Armadale/Kelmscott 4 <0.22 <0.22 <0.22 1 1 10 0.050 0.096 0.067 0 (1)Bold Park 4 <0.22 <0.22 <0.22 1 2 9 0.028 0.077 0.054 0 (1)Buckland Hill 4 <0.22 0.44 <0.22 1 2 9 0.022 0.110 0.063 0 (1)Dwellingup 4 0.44 0.44 0.44 1 0 (1) 2 0.045 0.072 0.059 2
Foothills 5 <0.22 1.33 0.44 1 0 (1) 13 0.021 0.140 0.075 0 (1)Greenmount 4 0.44 2.21 1.33 1 2 13 0.035 0.180 0.118 0 (1)Greenmount/Darlington 4 0.44 1.33 0.88 1 2 10 0.057 0.160 0.093 0 (1)Hamilton Hill 3 <0.22 <0.22 <0.22 1 1 10 0.006 0.073 0.050 0 (1)Hills Direct 7 <0.22 <0.22 <0.22 2 2 21 <0.001 0.045 0.014 0 (1)Lexia 3 <0.22 2.65 1.77 1 1 9 0.051 0.170 0.114 1
Mandurah 12 <0.22 <0.22 <0.22 3 4 39 <0.001 0.028 0.003 0 (1)Melville 4 <0.22 <0.22 <0.22 1 2 13 0.012 0.079 0.051 0 (1)Mirrabooka 4 1.33 1.77 1.77 1 2 13 0.077 0.180 0.120 0 (1)Mt. Eliza 2 0.44 0.44 0.44 1 1 13 0.024 0.091 0.057 0 (1)Mt. Hawthorn 4 0.88 1.77 1.33 1 1 9 0.100 0.160 0.127 0 (1)Mt. Yokine 4 1.33 1.77 1.33 1 2 13 0.068 0.170 0.113 0 (1)Mundaring 3 <0.22 0.88 0.44 1 2 10 0.007 0.029 0.015 0 (1)Neerabup 4 3.09 12.82 8.40 1 2 8 0.034 0.072 0.051 0 (1)North Dandalup 4 <0.22 <0.22 <0.22 1 0 (1) 2 0.047 0.096 0.072 0 (1)Pinjarra 4 <0.22 <0.22 <0.22 1 0 (1) 2 0.001 0.008 0.005 0 (1)South Perth/Kewdale 5 <0.22 1.33 0.88 1 2 9 0.009 0.160 0.085 0 (1)Tamworth Hill 4 <0.22 <0.22 <0.22 1 1 13 <0.001 0.012 0.002 0 (1)Thomsons Lake 4 <0.22 <0.22 <0.22 1 2 13 0.024 0.120 0.071 0 (1)Two Rocks 5 2.65 6.19 4.86 1 2 10 0.006 0.012 0.009 2
Wanneroo 4 2.21 3.98 3.09 1 0 (1) 9 0.073 0.150 0.103 0 (1)West Yokine 5 1.32 2.21 1.77 1 1 10 0.094 0.170 0.143 0 (1)Whitfords 5 0.44 4.86 3.09 1 2 9 0.072 0.150 0.101 0 (1)Yanchep 4 4.42 4.42 4.42 1 2 2 0.001 0.006 0.004 0 (1)
(1) No samples required in this 12 month periodǂ Nitrate data is converted from laboratory analysis reported as "Nitrate plus Nitrite as Nitrogen" based on the assumption that all nitrite is converted to nitrate under oxidative conditions during sampling.
Requirement Met
Samples Taken
Guideline Met
Samples Taken
Concentration (mg/L)Guideline
MetSamples
TakenLocalitySamples
Taken
Concentration (mg/L)Guideline
Met Samples Taken Guideline Met
Table 2 Health related variablesNitrateǂ Pesticides Radiological Trihalomethanes Other Health Related
Drinking Water Quality Annual Report Data 01/07/2016 to 30/06/2017
Perth Region
Min Value Max Value Mean Value Min Max Mean Min Value Max Value Mean Value Min Max Mean
Armadale/Kelmscott 4 63 78 68 (1) 4 0.018 0.030 0.023 4 145 190 161 4 74 93 80
Bold Park 4 41 66 53 (1) 3 0.020 0.030 0.025 4 65 90 75 4 44 58 52
Buckland Hill 4 42 75 59 (1) 4 0.020 0.030 0.025 4 50 200 125 4 49 66 58
Dwellingup 4 12 17 15 (1) 4 0.008 0.018 0.012 4 70 85 76 4 36 40 38
Foothills 5 58 100 75 (1) 5 0.018 0.025 0.022 5 55 170 106 5 55 96 74
Greenmount 4 72 140 111 (1) 4 0.010 0.020 0.014 4 95 190 163 4 71 110 96
Greenmount/Darlington 4 59 97 80 (1) 4 0.016 0.025 0.020 4 75 150 126 4 66 85 79
Hamilton Hill 3 46 71 61 (1) 3 0.025 0.030 0.027 3 75 150 108 3 51 80 67
Hills Direct 7 34 54 46 (1) 7 0.020 0.070 0.042 7 29 85 45 7 35 59 52
Lexia 3 82 92 88 (1) 3 0.025 0.035 0.032 3 75 160 105 4 88 170 115
Mandurah 12 30 55 51 (1) 12 0.025 0.055 0.038 12 30 38 33 12 31 57 52
Melville 4 54 80 67 (1) 4 0.020 0.030 0.026 4 75 210 163 4 54 63 59
Mirrabooka 4 49 64 56 (1) 4 0.020 0.025 0.024 4 145 190 170 4 110 140 125
Mt. Eliza 2 56 75 66 (1) 2 0.018 0.030 0.024 2 65 190 128 2 61 68 65
Mt. Hawthorn 4 110 120 113 (1) 4 0.012 0.016 0.014 4 155 195 181 4 92 110 102
Mt. Yokine 4 110 130 118 (1) 4 0.014 0.020 0.016 4 155 195 176 4 96 110 102
Mundaring 3 55 68 63 (1) 3 0.012 0.090 0.047 3 140 160 150 3 80 89 83
Neerabup 4 100 170 145 (1) 4 0.014 0.025 0.018 4 75 135 110 4 100 190 160
North Dandalup 4 18 38 25 (1) 4 0.014 0.035 0.022 4 55 80 73 4 41 53 46
Pinjarra 4 36 58 51 (1) 3 0.030 0.060 0.045 4 31 39 35 4 37 58 51
South Perth/Kewdale 5 55 110 94 (1) 5 0.014 0.025 0.020 5 41 180 122 5 56 100 87
Tamworth Hill 4 35 59 49 (1) 4 0.025 0.060 0.039 4 31 37 33 4 34 55 49
Thomsons Lake 4 69 86 77 (1) 4 0.014 0.020 0.017 4 75 205 168 4 77 96 86
Two Rocks 5 190 200 192 (1) 4 0.010 0.010 0.010 5 105 105 105 5 220 230 226 (2)Wanneroo 4 82 100 94 (1) 4 0.016 0.020 0.018 4 90 170 130 4 97 110 104
West Yokine 5 110 140 120 (1) 4 0.014 0.018 0.016 5 165 185 174 5 91 110 100
Whitfords 5 71 100 86 (1) 5 0.016 0.020 0.018 5 85 160 109 5 76 120 99
Yanchep 4 190 200 193 (1) 4 <0.008 0.010 <0.008 4 105 110 106 4 230 240 233 (2)(1) No guideline value available as per ADWG 2011. (2) Elevated hardness is characteristic of the source supplying this locality
Table 3 Aesthetic (Non-health related) VariablesAlkalinity (as CaCO3) Aluminium Chloride Hardness
LocalitySamples
Taken
Concentration (mg/L) Guideline Met
Samples Taken
Guideline Met
Guideline Met
Samples Taken
Concentration (mg/L) Guideline Met
Samples Taken
Concentration (mg/L)Concentration (mg/L)
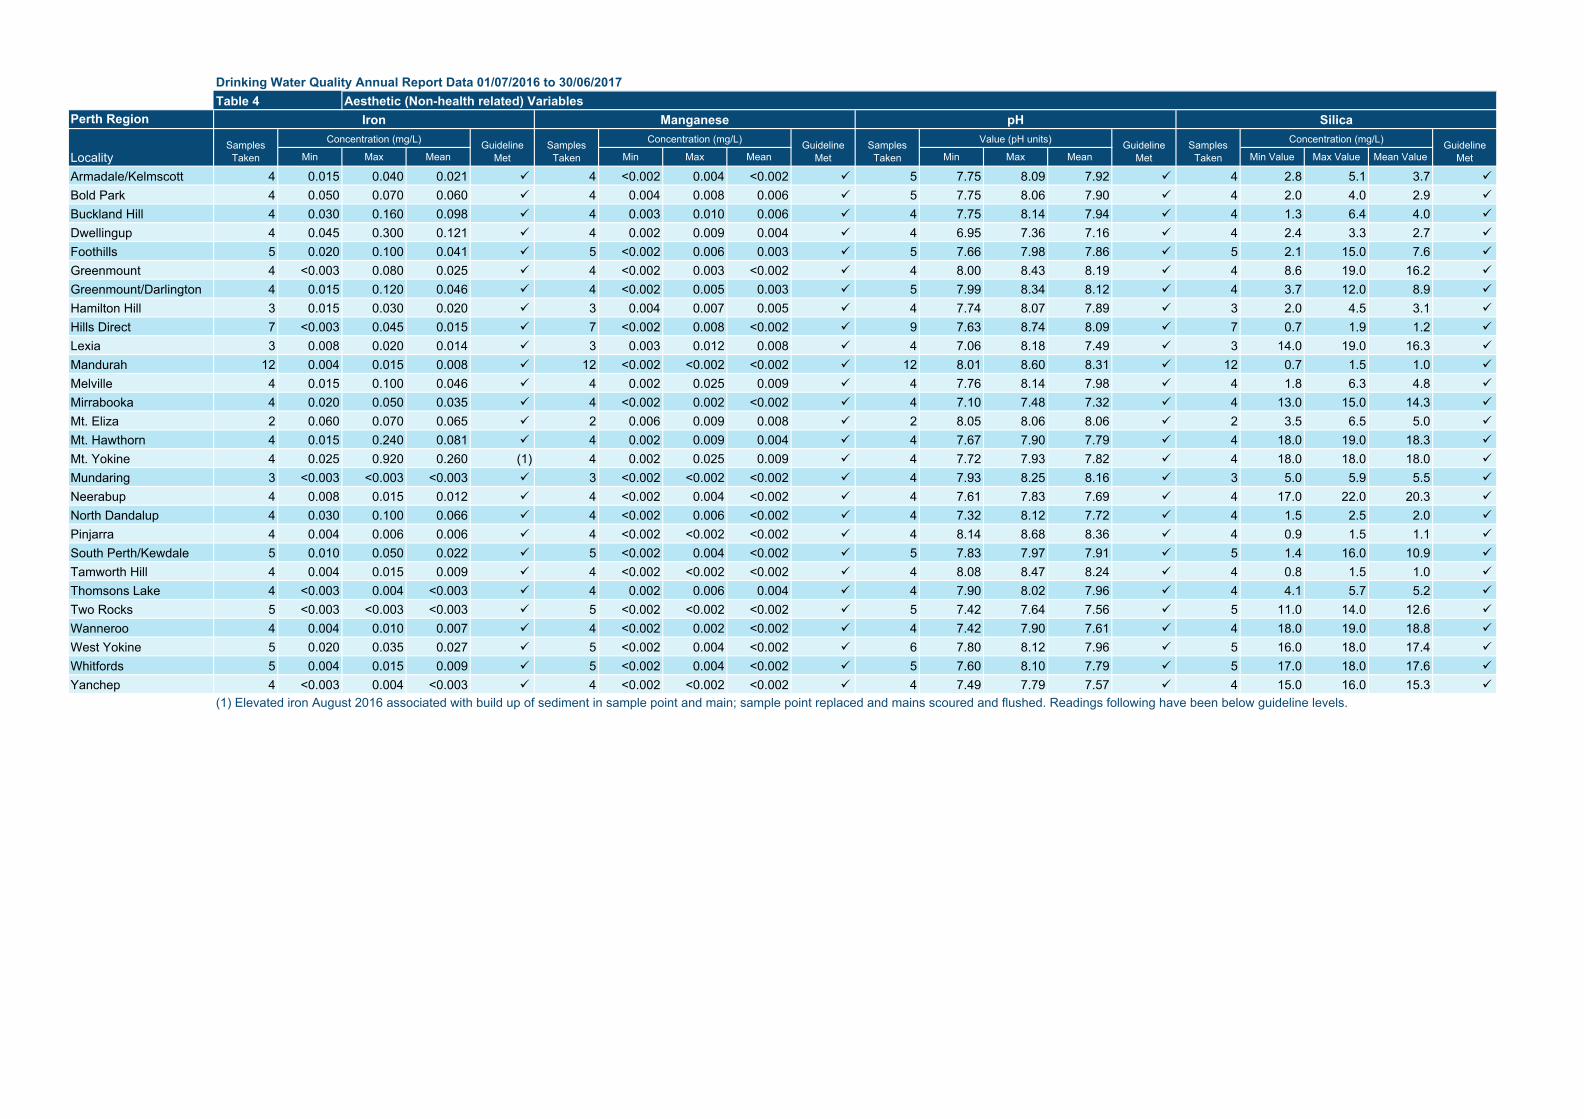
Drinking Water Quality Annual Report Data 01/07/2016 to 30/06/2017
Perth Region
Min Max Mean Min Max Mean Min Max Mean Min Value Max Value Mean Value
Armadale/Kelmscott 4 0.015 0.040 0.021 4 <0.002 0.004 <0.002 5 7.75 8.09 7.92 4 2.8 5.1 3.7
Bold Park 4 0.050 0.070 0.060 4 0.004 0.008 0.006 5 7.75 8.06 7.90 4 2.0 4.0 2.9
Buckland Hill 4 0.030 0.160 0.098 4 0.003 0.010 0.006 4 7.75 8.14 7.94 4 1.3 6.4 4.0
Dwellingup 4 0.045 0.300 0.121 4 0.002 0.009 0.004 4 6.95 7.36 7.16 4 2.4 3.3 2.7
Foothills 5 0.020 0.100 0.041 5 <0.002 0.006 0.003 5 7.66 7.98 7.86 5 2.1 15.0 7.6
Greenmount 4 <0.003 0.080 0.025 4 <0.002 0.003 <0.002 4 8.00 8.43 8.19 4 8.6 19.0 16.2
Greenmount/Darlington 4 0.015 0.120 0.046 4 <0.002 0.005 0.003 5 7.99 8.34 8.12 4 3.7 12.0 8.9
Hamilton Hill 3 0.015 0.030 0.020 3 0.004 0.007 0.005 4 7.74 8.07 7.89 3 2.0 4.5 3.1
Hills Direct 7 <0.003 0.045 0.015 7 <0.002 0.008 <0.002 9 7.63 8.74 8.09 7 0.7 1.9 1.2
Lexia 3 0.008 0.020 0.014 3 0.003 0.012 0.008 4 7.06 8.18 7.49 3 14.0 19.0 16.3
Mandurah 12 0.004 0.015 0.008 12 <0.002 <0.002 <0.002 12 8.01 8.60 8.31 12 0.7 1.5 1.0
Melville 4 0.015 0.100 0.046 4 0.002 0.025 0.009 4 7.76 8.14 7.98 4 1.8 6.3 4.8
Mirrabooka 4 0.020 0.050 0.035 4 <0.002 0.002 <0.002 4 7.10 7.48 7.32 4 13.0 15.0 14.3
Mt. Eliza 2 0.060 0.070 0.065 2 0.006 0.009 0.008 2 8.05 8.06 8.06 2 3.5 6.5 5.0
Mt. Hawthorn 4 0.015 0.240 0.081 4 0.002 0.009 0.004 4 7.67 7.90 7.79 4 18.0 19.0 18.3
Mt. Yokine 4 0.025 0.920 0.260 (1) 4 0.002 0.025 0.009 4 7.72 7.93 7.82 4 18.0 18.0 18.0
Mundaring 3 <0.003 <0.003 <0.003 3 <0.002 <0.002 <0.002 4 7.93 8.25 8.16 3 5.0 5.9 5.5
Neerabup 4 0.008 0.015 0.012 4 <0.002 0.004 <0.002 4 7.61 7.83 7.69 4 17.0 22.0 20.3
North Dandalup 4 0.030 0.100 0.066 4 <0.002 0.006 <0.002 4 7.32 8.12 7.72 4 1.5 2.5 2.0
Pinjarra 4 0.004 0.006 0.006 4 <0.002 <0.002 <0.002 4 8.14 8.68 8.36 4 0.9 1.5 1.1
South Perth/Kewdale 5 0.010 0.050 0.022 5 <0.002 0.004 <0.002 5 7.83 7.97 7.91 5 1.4 16.0 10.9
Tamworth Hill 4 0.004 0.015 0.009 4 <0.002 <0.002 <0.002 4 8.08 8.47 8.24 4 0.8 1.5 1.0
Thomsons Lake 4 <0.003 0.004 <0.003 4 0.002 0.006 0.004 4 7.90 8.02 7.96 4 4.1 5.7 5.2
Two Rocks 5 <0.003 <0.003 <0.003 5 <0.002 <0.002 <0.002 5 7.42 7.64 7.56 5 11.0 14.0 12.6
Wanneroo 4 0.004 0.010 0.007 4 <0.002 0.002 <0.002 4 7.42 7.90 7.61 4 18.0 19.0 18.8
West Yokine 5 0.020 0.035 0.027 5 <0.002 0.004 <0.002 6 7.80 8.12 7.96 5 16.0 18.0 17.4
Whitfords 5 0.004 0.015 0.009 5 <0.002 0.004 <0.002 5 7.60 8.10 7.79 5 17.0 18.0 17.6
Yanchep 4 <0.003 0.004 <0.003 4 <0.002 <0.002 <0.002 4 7.49 7.79 7.57 4 15.0 16.0 15.3
(1) Elevated iron August 2016 associated with build up of sediment in sample point and main; sample point replaced and mains scoured and flushed. Readings following have been below guideline levels.
Table 4 Aesthetic (Non-health related) VariablesIron Manganese pH Silica
LocalitySamples
Taken
Concentration (mg/L) Guideline Met
Samples Taken
Guideline Met
Guideline Met
Samples Taken
Value (pH units) Guideline Met
Samples Taken
Concentration (mg/L)Concentration (mg/L)
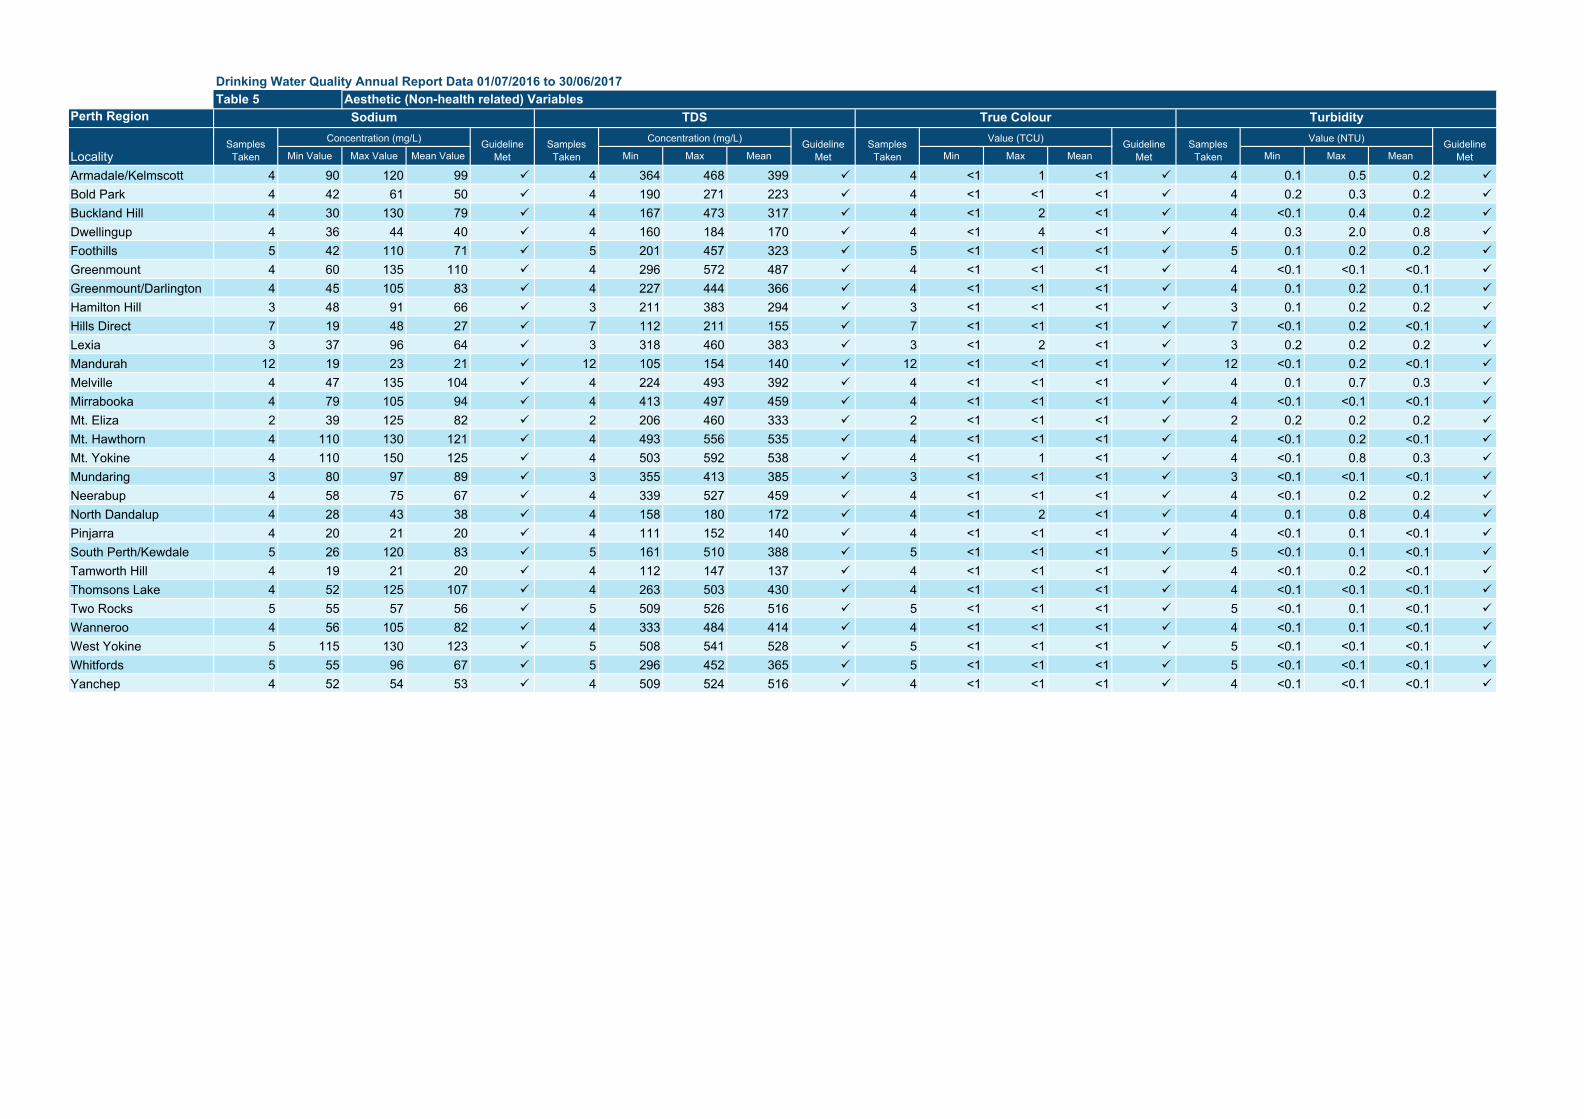
Drinking Water Quality Annual Report Data 01/07/2016 to 30/06/2017
Perth Region
Min Value Max Value Mean Value Min Max Mean Min Max Mean Min Max Mean
Armadale/Kelmscott 4 90 120 99 4 364 468 399 4 <1 1 <1 4 0.1 0.5 0.2
Bold Park 4 42 61 50 4 190 271 223 4 <1 <1 <1 4 0.2 0.3 0.2
Buckland Hill 4 30 130 79 4 167 473 317 4 <1 2 <1 4 <0.1 0.4 0.2
Dwellingup 4 36 44 40 4 160 184 170 4 <1 4 <1 4 0.3 2.0 0.8
Foothills 5 42 110 71 5 201 457 323 5 <1 <1 <1 5 0.1 0.2 0.2
Greenmount 4 60 135 110 4 296 572 487 4 <1 <1 <1 4 <0.1 <0.1 <0.1
Greenmount/Darlington 4 45 105 83 4 227 444 366 4 <1 <1 <1 4 0.1 0.2 0.1
Hamilton Hill 3 48 91 66 3 211 383 294 3 <1 <1 <1 3 0.1 0.2 0.2
Hills Direct 7 19 48 27 7 112 211 155 7 <1 <1 <1 7 <0.1 0.2 <0.1
Lexia 3 37 96 64 3 318 460 383 3 <1 2 <1 3 0.2 0.2 0.2
Mandurah 12 19 23 21 12 105 154 140 12 <1 <1 <1 12 <0.1 0.2 <0.1
Melville 4 47 135 104 4 224 493 392 4 <1 <1 <1 4 0.1 0.7 0.3
Mirrabooka 4 79 105 94 4 413 497 459 4 <1 <1 <1 4 <0.1 <0.1 <0.1
Mt. Eliza 2 39 125 82 2 206 460 333 2 <1 <1 <1 2 0.2 0.2 0.2
Mt. Hawthorn 4 110 130 121 4 493 556 535 4 <1 <1 <1 4 <0.1 0.2 <0.1
Mt. Yokine 4 110 150 125 4 503 592 538 4 <1 1 <1 4 <0.1 0.8 0.3
Mundaring 3 80 97 89 3 355 413 385 3 <1 <1 <1 3 <0.1 <0.1 <0.1
Neerabup 4 58 75 67 4 339 527 459 4 <1 <1 <1 4 <0.1 0.2 0.2
North Dandalup 4 28 43 38 4 158 180 172 4 <1 2 <1 4 0.1 0.8 0.4
Pinjarra 4 20 21 20 4 111 152 140 4 <1 <1 <1 4 <0.1 0.1 <0.1
South Perth/Kewdale 5 26 120 83 5 161 510 388 5 <1 <1 <1 5 <0.1 0.1 <0.1
Tamworth Hill 4 19 21 20 4 112 147 137 4 <1 <1 <1 4 <0.1 0.2 <0.1
Thomsons Lake 4 52 125 107 4 263 503 430 4 <1 <1 <1 4 <0.1 <0.1 <0.1
Two Rocks 5 55 57 56 5 509 526 516 5 <1 <1 <1 5 <0.1 0.1 <0.1
Wanneroo 4 56 105 82 4 333 484 414 4 <1 <1 <1 4 <0.1 0.1 <0.1
West Yokine 5 115 130 123 5 508 541 528 5 <1 <1 <1 5 <0.1 <0.1 <0.1
Whitfords 5 55 96 67 5 296 452 365 5 <1 <1 <1 5 <0.1 <0.1 <0.1
Yanchep 4 52 54 53 4 509 524 516 4 <1 <1 <1 4 <0.1 <0.1 <0.1
Concentration (mg/L)
Table 5 Aesthetic (Non-health related) VariablesSodium TDS True Colour Turbidity
Guideline MetLocality
Samples Taken
Concentration (mg/L) Guideline Met
Samples Taken
Value (NTU)Guideline Met
Samples Taken
Value (TCU) Guideline Met
Samples Taken

Drinking Water Quality Annual Report Data 01/07/2016 to 30/06/2017
Mid West
Min Max Mean
Badgingarra 13 0 0 9 0 2 <0.1 <0.1 <0.1 0 (1) 2
Bindoon /Chittering 52 0 0 28 0 2 0.35 0.35 0.35 1 2
Bolgart 13 0 0 9 0 2 0.20 0.20 0.20 0 (1) 2
Calingiri 13 0 0 9 0 2 <0.1 <0.1 <0.1 0 (1) 2
Carnamah 12 0 0 12 0 2 <0.1 <0.1 <0.1 0 (1) 2
Carnarvon 63 0 0 38 0 2 0.55 0.60 0.58 0 (1) 2
Cervantes 52 0 0 9 0 2 0.15 0.15 0.15 0 (1) 2
Coomberdale 12 0 0 8 0 2 0.10 0.15 0.13 0 (1) 2
Coorow 12 0 0 12 0 2 <0.1 <0.1 <0.1 0 (1) 2
Coral Bay 12 0 0 11 0 3 <0.1 <0.1 <0.1 1 2
Cue 13 0 0 13 0 2 0.30 0.30 0.30 0 (1) 2
Dandaragan 13 0 0 9 0 2 0.25 0.25 0.25 0 (1) 2
Denham 49 0 0 24 0 2 <0.1 <0.1 <0.1 0 (1) 2
Dongara/Denison 51 0 0 26 0 49 0.20 0.85 0.51 (2) 0 (1) 2
Eneabba 13 0 0 13 0 2 0.15 0.15 0.15 0 (1) 6
Exmouth 61 0 0 39 0 53 0.40 0.75 0.68 (2) 0 (1) 2
Gascoyne Junction 25 0 0 25 0 2 <0.1 <0.1 <0.1 0 (1) 2
Geraldton 168 0 0 168 0 56 0.75 0.90 0.80 1 4
Gingin 52 0 0 18 0 2 <0.1 <0.1 <0.1 0 (1) 2
Greenhead 52 0 0 12 0 2 <0.1 <0.1 <0.1 0 (1) 5
Guilderton 51 0 0 17 0 2 0.20 0.20 0.20 1 2
Horrocks 13 0 0 13 0 2 0.35 0.40 0.38 0 (1) 2
Jurien Bay 52 0 0 9 0 1 0.30 0.30 0.30 0 (1) 2
Kalbarri 52 0 0 26 0 2 <0.1 <0.1 <0.1 0 (1) 2
Lancelin 52 0 0 18 0 2 0.20 0.20 0.20 0 (1) 2
Latham 52 0 0 13 0 2 <0.1 <0.1 <0.1 0 (1) 2
Ledge Point 52 0 0 9 0 2 0.15 0.15 0.15 0 (1) 2
Leeman 52 0 0 12 0 2 <0.1 <0.1 <0.1 0 (1) 5
Meekatharra 50 0 0 13 0 2 0.60 0.60 0.60 0 (1) 14
Mingenew 13 0 0 13 0 2 0.15 0.15 0.15 0 (1) 2
Moora 51 0 0 16 0 50 <0.1 0.85 0.34 (2) 0 (1) 2
Morawa 52 0 0 13 0 2 <0.1 <0.1 <0.1 0 (1) 2
Mt Magnet 50 0 0 13 0 2 0.30 0.30 0.30 0 (1) 2
Mullewa 13 0 0 13 0 2 0.70 0.75 0.73 0 (1) 2
Nabawa 26 0 0 13 0 2 0.75 0.80 0.78 0 (1) 2
New Norcia 13 0 0 9 0 2 0.20 0.20 0.20 0 (1) 2
Nilgern (Ocean Farms) 13 0 0 9 0 2 <0.1 <0.1 <0.1 2 2
Northampton 50 0 0 12 0 2 0.75 0.75 0.75 0 (1) 2
Perenjori 13 0 0 13 0 2 <0.1 <0.1 <0.1 0 (1) 2
Piawaning 26 0 0 9 0 2 <0.1 <0.1 <0.1 0 (1) 2
Port Kalbarri 13 0 0 13 0 2 0.15 0.15 0.15 0 (1) 2
Sandstone 12 0 0 12 0 2 0.40 0.45 0.43 0 (1) 6
Seabird 26 0 0 9 0 3 0.25 0.30 0.27 0 (1) 2
Seaview Park 13 0 0 9 0 2 <0.1 <0.1 <0.1 1 2
Sovereign Hills 26 0 0 17 0 2 <0.1 <0.1 <0.1 0 (1) 5
Three Springs 13 0 0 13 0 2 <0.1 <0.1 <0.1 0 (1) 2
Watheroo 13 0 0 9 0 2 <0.1 <0.1 <0.1 2 2
Woodridge 13 0 0 9 0 2 0.25 0.30 0.28 0 (1) 2
Yalgoo 13 0 0 13 0 2 0.15 0.20 0.18 0 (1) 2
Yerecoin 13 0 0 9 0 2 <0.1 <0.1 <0.1 0 (1) 2
Yuna 13 0 0 13 0 2 0.80 0.80 0.80 0 (1) 2
Table 6 Health related variablesE. coli Thermophilic Naegleria Fluoride Hydrocarbons Metals
LocalitySamples
TakenSamples >0 cfu/100mL
Max cfu/100mL
Requirement Met
Samples Taken
Guideline Met
(1) No samples required in this 12 month period. (2) Schemes for Dongara/Denison, Exmouth & Moora not meeting the dosing range of 0.7-1.0mg/L
Samples with Thermophilic
NaegleriaRequirement
MetSamples
Taken
Concentration (mg/L)Samples
TakenGuideline
MetSamples
Taken
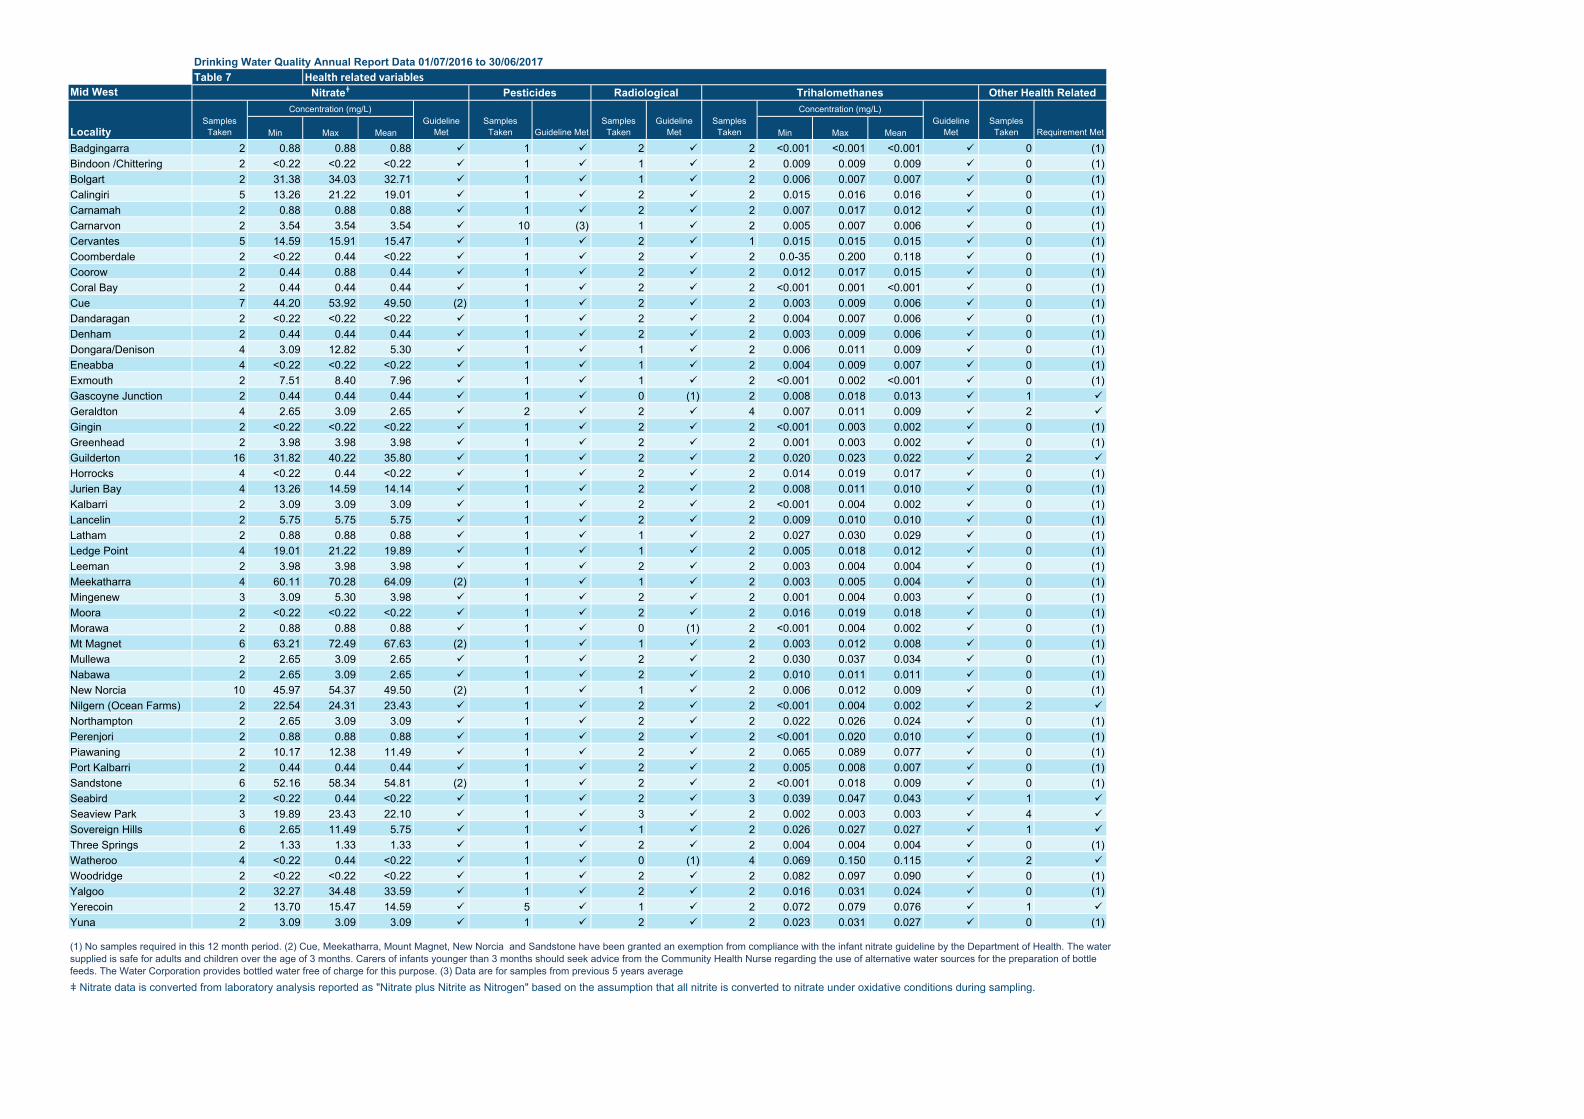
Drinking Water Quality Annual Report Data 01/07/2016 to 30/06/2017
Mid West
Min Max Mean Min Max Mean
Badgingarra 2 0.88 0.88 0.88 1 2 2 <0.001 <0.001 <0.001 0 (1)Bindoon /Chittering 2 <0.22 <0.22 <0.22 1 1 2 0.009 0.009 0.009 0 (1)Bolgart 2 31.38 34.03 32.71 1 1 2 0.006 0.007 0.007 0 (1)Calingiri 5 13.26 21.22 19.01 1 2 2 0.015 0.016 0.016 0 (1)Carnamah 2 0.88 0.88 0.88 1 2 2 0.007 0.017 0.012 0 (1)Carnarvon 2 3.54 3.54 3.54 10 (3) 1 2 0.005 0.007 0.006 0 (1)Cervantes 5 14.59 15.91 15.47 1 2 1 0.015 0.015 0.015 0 (1)Coomberdale 2 <0.22 0.44 <0.22 1 2 2 0.0-35 0.200 0.118 0 (1)Coorow 2 0.44 0.88 0.44 1 2 2 0.012 0.017 0.015 0 (1)Coral Bay 2 0.44 0.44 0.44 1 2 2 <0.001 0.001 <0.001 0 (1)Cue 7 44.20 53.92 49.50 (2) 1 2 2 0.003 0.009 0.006 0 (1)Dandaragan 2 <0.22 <0.22 <0.22 1 2 2 0.004 0.007 0.006 0 (1)Denham 2 0.44 0.44 0.44 1 2 2 0.003 0.009 0.006 0 (1)Dongara/Denison 4 3.09 12.82 5.30 1 1 2 0.006 0.011 0.009 0 (1)Eneabba 4 <0.22 <0.22 <0.22 1 1 2 0.004 0.009 0.007 0 (1)Exmouth 2 7.51 8.40 7.96 1 1 2 <0.001 0.002 <0.001 0 (1)Gascoyne Junction 2 0.44 0.44 0.44 1 0 (1) 2 0.008 0.018 0.013 1
Geraldton 4 2.65 3.09 2.65 2 2 4 0.007 0.011 0.009 2
Gingin 2 <0.22 <0.22 <0.22 1 2 2 <0.001 0.003 0.002 0 (1)Greenhead 2 3.98 3.98 3.98 1 2 2 0.001 0.003 0.002 0 (1)Guilderton 16 31.82 40.22 35.80 1 2 2 0.020 0.023 0.022 2
Horrocks 4 <0.22 0.44 <0.22 1 2 2 0.014 0.019 0.017 0 (1)Jurien Bay 4 13.26 14.59 14.14 1 2 2 0.008 0.011 0.010 0 (1)Kalbarri 2 3.09 3.09 3.09 1 2 2 <0.001 0.004 0.002 0 (1)Lancelin 2 5.75 5.75 5.75 1 2 2 0.009 0.010 0.010 0 (1)Latham 2 0.88 0.88 0.88 1 1 2 0.027 0.030 0.029 0 (1)Ledge Point 4 19.01 21.22 19.89 1 1 2 0.005 0.018 0.012 0 (1)Leeman 2 3.98 3.98 3.98 1 2 2 0.003 0.004 0.004 0 (1)Meekatharra 4 60.11 70.28 64.09 (2) 1 1 2 0.003 0.005 0.004 0 (1)Mingenew 3 3.09 5.30 3.98 1 2 2 0.001 0.004 0.003 0 (1)Moora 2 <0.22 <0.22 <0.22 1 2 2 0.016 0.019 0.018 0 (1)Morawa 2 0.88 0.88 0.88 1 0 (1) 2 <0.001 0.004 0.002 0 (1)Mt Magnet 6 63.21 72.49 67.63 (2) 1 1 2 0.003 0.012 0.008 0 (1)Mullewa 2 2.65 3.09 2.65 1 2 2 0.030 0.037 0.034 0 (1)Nabawa 2 2.65 3.09 2.65 1 2 2 0.010 0.011 0.011 0 (1)New Norcia 10 45.97 54.37 49.50 (2) 1 1 2 0.006 0.012 0.009 0 (1)Nilgern (Ocean Farms) 2 22.54 24.31 23.43 1 2 2 <0.001 0.004 0.002 2
Northampton 2 2.65 3.09 3.09 1 2 2 0.022 0.026 0.024 0 (1)Perenjori 2 0.88 0.88 0.88 1 2 2 <0.001 0.020 0.010 0 (1)Piawaning 2 10.17 12.38 11.49 1 2 2 0.065 0.089 0.077 0 (1)Port Kalbarri 2 0.44 0.44 0.44 1 2 2 0.005 0.008 0.007 0 (1)Sandstone 6 52.16 58.34 54.81 (2) 1 2 2 <0.001 0.018 0.009 0 (1)Seabird 2 <0.22 0.44 <0.22 1 2 3 0.039 0.047 0.043 1
Seaview Park 3 19.89 23.43 22.10 1 3 2 0.002 0.003 0.003 4
Sovereign Hills 6 2.65 11.49 5.75 1 1 2 0.026 0.027 0.027 1
Three Springs 2 1.33 1.33 1.33 1 2 2 0.004 0.004 0.004 0 (1)Watheroo 4 <0.22 0.44 <0.22 1 0 (1) 4 0.069 0.150 0.115 2
Woodridge 2 <0.22 <0.22 <0.22 1 2 2 0.082 0.097 0.090 0 (1)Yalgoo 2 32.27 34.48 33.59 1 2 2 0.016 0.031 0.024 0 (1)Yerecoin 2 13.70 15.47 14.59 5 1 2 0.072 0.079 0.076 1
Yuna 2 3.09 3.09 3.09 1 2 2 0.023 0.031 0.027 0 (1)
ǂ Nitrate data is converted from laboratory analysis reported as "Nitrate plus Nitrite as Nitrogen" based on the assumption that all nitrite is converted to nitrate under oxidative conditions during sampling.
Nitrateǂ Pesticides Radiological Trihalomethanes Other Health RelatedTable 7 Health related variables
Requirement Met
(1) No samples required in this 12 month period. (2) Cue, Meekatharra, Mount Magnet, New Norcia and Sandstone have been granted an exemption from compliance with the infant nitrate guideline by the Department of Health. The water supplied is safe for adults and children over the age of 3 months. Carers of infants younger than 3 months should seek advice from the Community Health Nurse regarding the use of alternative water sources for the preparation of bottle feeds. The Water Corporation provides bottled water free of charge for this purpose. (3) Data are for samples from previous 5 years average
Samples Taken
Guideline Met
Samples Taken
Concentration (mg/L)Guideline
MetSamples
TakenLocalitySamples
Taken
Concentration (mg/L)Guideline
MetSamples
Taken Guideline Met
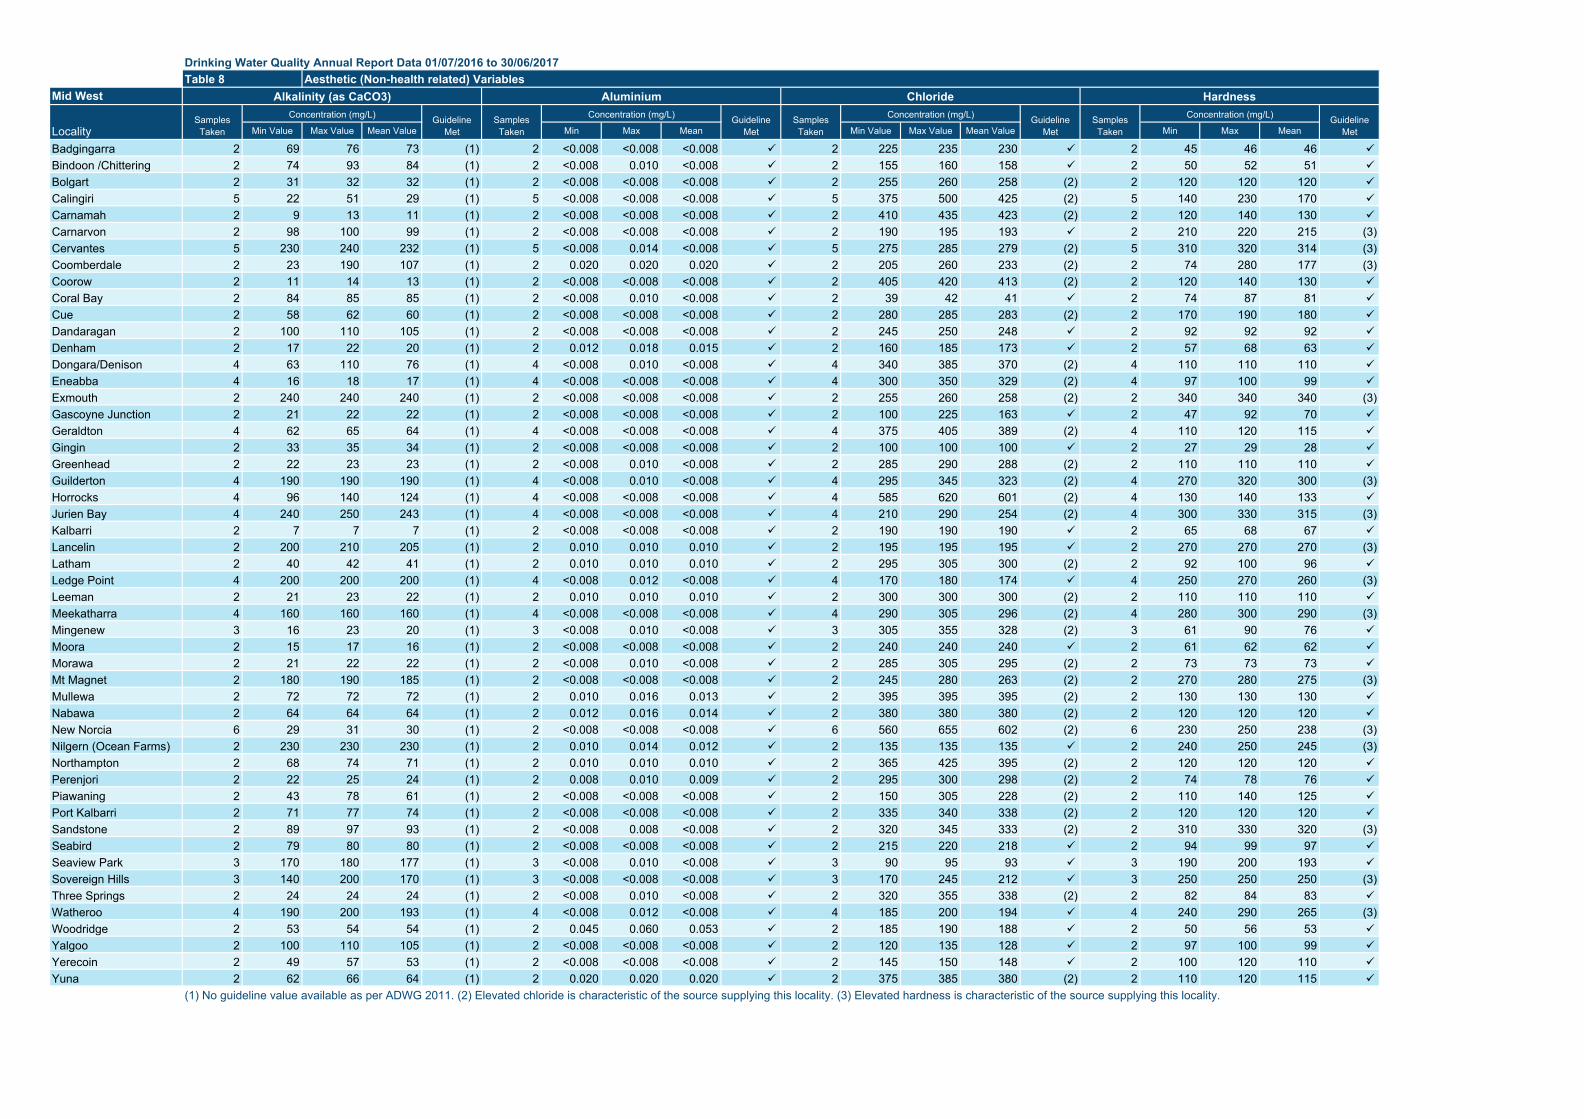
Drinking Water Quality Annual Report Data 01/07/2016 to 30/06/2017
Mid West
Min Value Max Value Mean Value Min Max Mean Min Value Max Value Mean Value Min Max Mean
Badgingarra 2 69 76 73 (1) 2 <0.008 <0.008 <0.008 2 225 235 230 2 45 46 46
Bindoon /Chittering 2 74 93 84 (1) 2 <0.008 0.010 <0.008 2 155 160 158 2 50 52 51
Bolgart 2 31 32 32 (1) 2 <0.008 <0.008 <0.008 2 255 260 258 (2) 2 120 120 120
Calingiri 5 22 51 29 (1) 5 <0.008 <0.008 <0.008 5 375 500 425 (2) 5 140 230 170
Carnamah 2 9 13 11 (1) 2 <0.008 <0.008 <0.008 2 410 435 423 (2) 2 120 140 130
Carnarvon 2 98 100 99 (1) 2 <0.008 <0.008 <0.008 2 190 195 193 2 210 220 215 (3)Cervantes 5 230 240 232 (1) 5 <0.008 0.014 <0.008 5 275 285 279 (2) 5 310 320 314 (3)Coomberdale 2 23 190 107 (1) 2 0.020 0.020 0.020 2 205 260 233 (2) 2 74 280 177 (3)Coorow 2 11 14 13 (1) 2 <0.008 <0.008 <0.008 2 405 420 413 (2) 2 120 140 130
Coral Bay 2 84 85 85 (1) 2 <0.008 0.010 <0.008 2 39 42 41 2 74 87 81
Cue 2 58 62 60 (1) 2 <0.008 <0.008 <0.008 2 280 285 283 (2) 2 170 190 180
Dandaragan 2 100 110 105 (1) 2 <0.008 <0.008 <0.008 2 245 250 248 2 92 92 92
Denham 2 17 22 20 (1) 2 0.012 0.018 0.015 2 160 185 173 2 57 68 63
Dongara/Denison 4 63 110 76 (1) 4 <0.008 0.010 <0.008 4 340 385 370 (2) 4 110 110 110
Eneabba 4 16 18 17 (1) 4 <0.008 <0.008 <0.008 4 300 350 329 (2) 4 97 100 99
Exmouth 2 240 240 240 (1) 2 <0.008 <0.008 <0.008 2 255 260 258 (2) 2 340 340 340 (3)Gascoyne Junction 2 21 22 22 (1) 2 <0.008 <0.008 <0.008 2 100 225 163 2 47 92 70
Geraldton 4 62 65 64 (1) 4 <0.008 <0.008 <0.008 4 375 405 389 (2) 4 110 120 115
Gingin 2 33 35 34 (1) 2 <0.008 <0.008 <0.008 2 100 100 100 2 27 29 28
Greenhead 2 22 23 23 (1) 2 <0.008 0.010 <0.008 2 285 290 288 (2) 2 110 110 110
Guilderton 4 190 190 190 (1) 4 <0.008 0.010 <0.008 4 295 345 323 (2) 4 270 320 300 (3)Horrocks 4 96 140 124 (1) 4 <0.008 <0.008 <0.008 4 585 620 601 (2) 4 130 140 133
Jurien Bay 4 240 250 243 (1) 4 <0.008 <0.008 <0.008 4 210 290 254 (2) 4 300 330 315 (3)Kalbarri 2 7 7 7 (1) 2 <0.008 <0.008 <0.008 2 190 190 190 2 65 68 67
Lancelin 2 200 210 205 (1) 2 0.010 0.010 0.010 2 195 195 195 2 270 270 270 (3)Latham 2 40 42 41 (1) 2 0.010 0.010 0.010 2 295 305 300 (2) 2 92 100 96
Ledge Point 4 200 200 200 (1) 4 <0.008 0.012 <0.008 4 170 180 174 4 250 270 260 (3)Leeman 2 21 23 22 (1) 2 0.010 0.010 0.010 2 300 300 300 (2) 2 110 110 110
Meekatharra 4 160 160 160 (1) 4 <0.008 <0.008 <0.008 4 290 305 296 (2) 4 280 300 290 (3)Mingenew 3 16 23 20 (1) 3 <0.008 0.010 <0.008 3 305 355 328 (2) 3 61 90 76
Moora 2 15 17 16 (1) 2 <0.008 <0.008 <0.008 2 240 240 240 2 61 62 62
Morawa 2 21 22 22 (1) 2 <0.008 0.010 <0.008 2 285 305 295 (2) 2 73 73 73
Mt Magnet 2 180 190 185 (1) 2 <0.008 <0.008 <0.008 2 245 280 263 (2) 2 270 280 275 (3)Mullewa 2 72 72 72 (1) 2 0.010 0.016 0.013 2 395 395 395 (2) 2 130 130 130
Nabawa 2 64 64 64 (1) 2 0.012 0.016 0.014 2 380 380 380 (2) 2 120 120 120
New Norcia 6 29 31 30 (1) 2 <0.008 <0.008 <0.008 6 560 655 602 (2) 6 230 250 238 (3)Nilgern (Ocean Farms) 2 230 230 230 (1) 2 0.010 0.014 0.012 2 135 135 135 2 240 250 245 (3)Northampton 2 68 74 71 (1) 2 0.010 0.010 0.010 2 365 425 395 (2) 2 120 120 120
Perenjori 2 22 25 24 (1) 2 0.008 0.010 0.009 2 295 300 298 (2) 2 74 78 76
Piawaning 2 43 78 61 (1) 2 <0.008 <0.008 <0.008 2 150 305 228 (2) 2 110 140 125
Port Kalbarri 2 71 77 74 (1) 2 <0.008 <0.008 <0.008 2 335 340 338 (2) 2 120 120 120
Sandstone 2 89 97 93 (1) 2 <0.008 0.008 <0.008 2 320 345 333 (2) 2 310 330 320 (3)Seabird 2 79 80 80 (1) 2 <0.008 <0.008 <0.008 2 215 220 218 2 94 99 97
Seaview Park 3 170 180 177 (1) 3 <0.008 0.010 <0.008 3 90 95 93 3 190 200 193
Sovereign Hills 3 140 200 170 (1) 3 <0.008 <0.008 <0.008 3 170 245 212 3 250 250 250 (3)Three Springs 2 24 24 24 (1) 2 <0.008 0.010 <0.008 2 320 355 338 (2) 2 82 84 83
Watheroo 4 190 200 193 (1) 4 <0.008 0.012 <0.008 4 185 200 194 4 240 290 265 (3)Woodridge 2 53 54 54 (1) 2 0.045 0.060 0.053 2 185 190 188 2 50 56 53
Yalgoo 2 100 110 105 (1) 2 <0.008 <0.008 <0.008 2 120 135 128 2 97 100 99
Yerecoin 2 49 57 53 (1) 2 <0.008 <0.008 <0.008 2 145 150 148 2 100 120 110
Yuna 2 62 66 64 (1) 2 0.020 0.020 0.020 2 375 385 380 (2) 2 110 120 115
(1) No guideline value available as per ADWG 2011. (2) Elevated chloride is characteristic of the source supplying this locality. (3) Elevated hardness is characteristic of the source supplying this locality.
Guideline Met
Guideline Met
Samples Taken
Concentration (mg/L) Guideline Met
Samples Taken
Concentration (mg/L)Concentration (mg/L)
LocalitySamples Taken
Concentration (mg/L) Guideline Met
Samples Taken
Table 8 Aesthetic (Non-health related) VariablesAlkalinity (as CaCO3) Aluminium Chloride Hardness
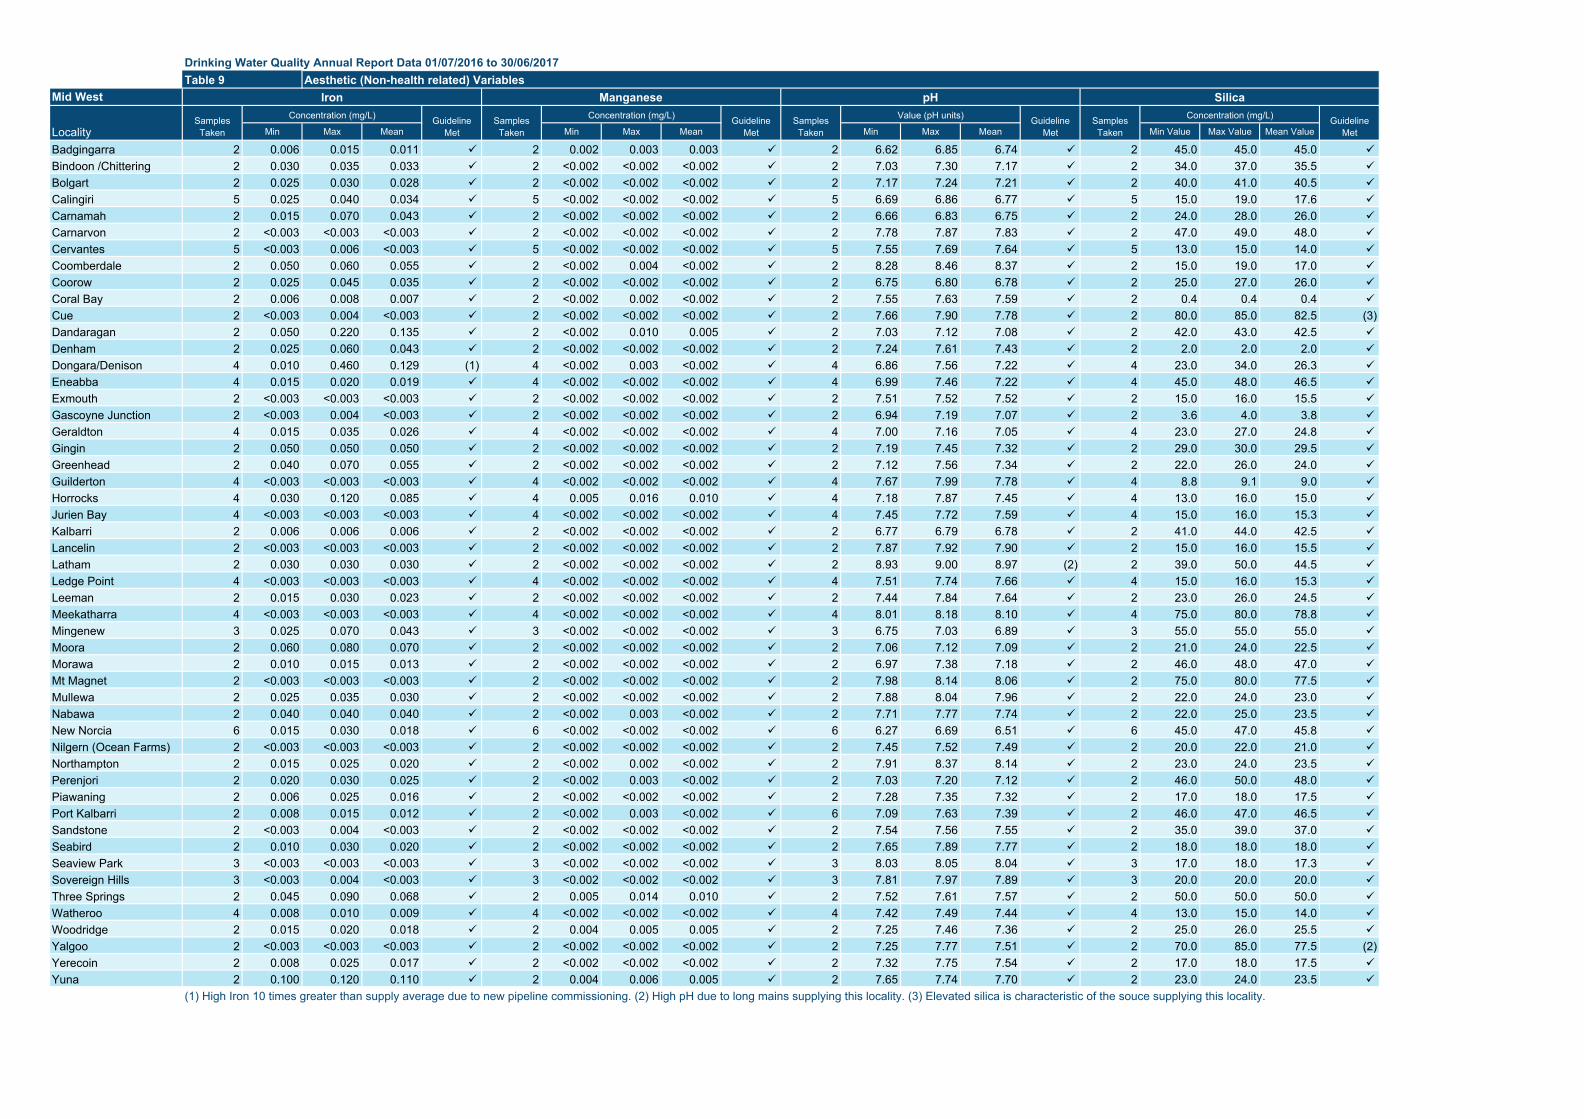
Drinking Water Quality Annual Report Data 01/07/2016 to 30/06/2017
Mid West
Min Max Mean Min Max Mean Min Max Mean Min Value Max Value Mean Value
Badgingarra 2 0.006 0.015 0.011 2 0.002 0.003 0.003 2 6.62 6.85 6.74 2 45.0 45.0 45.0
Bindoon /Chittering 2 0.030 0.035 0.033 2 <0.002 <0.002 <0.002 2 7.03 7.30 7.17 2 34.0 37.0 35.5
Bolgart 2 0.025 0.030 0.028 2 <0.002 <0.002 <0.002 2 7.17 7.24 7.21 2 40.0 41.0 40.5
Calingiri 5 0.025 0.040 0.034 5 <0.002 <0.002 <0.002 5 6.69 6.86 6.77 5 15.0 19.0 17.6
Carnamah 2 0.015 0.070 0.043 2 <0.002 <0.002 <0.002 2 6.66 6.83 6.75 2 24.0 28.0 26.0
Carnarvon 2 <0.003 <0.003 <0.003 2 <0.002 <0.002 <0.002 2 7.78 7.87 7.83 2 47.0 49.0 48.0
Cervantes 5 <0.003 0.006 <0.003 5 <0.002 <0.002 <0.002 5 7.55 7.69 7.64 5 13.0 15.0 14.0
Coomberdale 2 0.050 0.060 0.055 2 <0.002 0.004 <0.002 2 8.28 8.46 8.37 2 15.0 19.0 17.0
Coorow 2 0.025 0.045 0.035 2 <0.002 <0.002 <0.002 2 6.75 6.80 6.78 2 25.0 27.0 26.0
Coral Bay 2 0.006 0.008 0.007 2 <0.002 0.002 <0.002 2 7.55 7.63 7.59 2 0.4 0.4 0.4
Cue 2 <0.003 0.004 <0.003 2 <0.002 <0.002 <0.002 2 7.66 7.90 7.78 2 80.0 85.0 82.5 (3)Dandaragan 2 0.050 0.220 0.135 2 <0.002 0.010 0.005 2 7.03 7.12 7.08 2 42.0 43.0 42.5
Denham 2 0.025 0.060 0.043 2 <0.002 <0.002 <0.002 2 7.24 7.61 7.43 2 2.0 2.0 2.0
Dongara/Denison 4 0.010 0.460 0.129 (1) 4 <0.002 0.003 <0.002 4 6.86 7.56 7.22 4 23.0 34.0 26.3
Eneabba 4 0.015 0.020 0.019 4 <0.002 <0.002 <0.002 4 6.99 7.46 7.22 4 45.0 48.0 46.5
Exmouth 2 <0.003 <0.003 <0.003 2 <0.002 <0.002 <0.002 2 7.51 7.52 7.52 2 15.0 16.0 15.5
Gascoyne Junction 2 <0.003 0.004 <0.003 2 <0.002 <0.002 <0.002 2 6.94 7.19 7.07 2 3.6 4.0 3.8
Geraldton 4 0.015 0.035 0.026 4 <0.002 <0.002 <0.002 4 7.00 7.16 7.05 4 23.0 27.0 24.8
Gingin 2 0.050 0.050 0.050 2 <0.002 <0.002 <0.002 2 7.19 7.45 7.32 2 29.0 30.0 29.5
Greenhead 2 0.040 0.070 0.055 2 <0.002 <0.002 <0.002 2 7.12 7.56 7.34 2 22.0 26.0 24.0
Guilderton 4 <0.003 <0.003 <0.003 4 <0.002 <0.002 <0.002 4 7.67 7.99 7.78 4 8.8 9.1 9.0
Horrocks 4 0.030 0.120 0.085 4 0.005 0.016 0.010 4 7.18 7.87 7.45 4 13.0 16.0 15.0
Jurien Bay 4 <0.003 <0.003 <0.003 4 <0.002 <0.002 <0.002 4 7.45 7.72 7.59 4 15.0 16.0 15.3
Kalbarri 2 0.006 0.006 0.006 2 <0.002 <0.002 <0.002 2 6.77 6.79 6.78 2 41.0 44.0 42.5
Lancelin 2 <0.003 <0.003 <0.003 2 <0.002 <0.002 <0.002 2 7.87 7.92 7.90 2 15.0 16.0 15.5
Latham 2 0.030 0.030 0.030 2 <0.002 <0.002 <0.002 2 8.93 9.00 8.97 (2) 2 39.0 50.0 44.5
Ledge Point 4 <0.003 <0.003 <0.003 4 <0.002 <0.002 <0.002 4 7.51 7.74 7.66 4 15.0 16.0 15.3
Leeman 2 0.015 0.030 0.023 2 <0.002 <0.002 <0.002 2 7.44 7.84 7.64 2 23.0 26.0 24.5
Meekatharra 4 <0.003 <0.003 <0.003 4 <0.002 <0.002 <0.002 4 8.01 8.18 8.10 4 75.0 80.0 78.8
Mingenew 3 0.025 0.070 0.043 3 <0.002 <0.002 <0.002 3 6.75 7.03 6.89 3 55.0 55.0 55.0
Moora 2 0.060 0.080 0.070 2 <0.002 <0.002 <0.002 2 7.06 7.12 7.09 2 21.0 24.0 22.5
Morawa 2 0.010 0.015 0.013 2 <0.002 <0.002 <0.002 2 6.97 7.38 7.18 2 46.0 48.0 47.0
Mt Magnet 2 <0.003 <0.003 <0.003 2 <0.002 <0.002 <0.002 2 7.98 8.14 8.06 2 75.0 80.0 77.5
Mullewa 2 0.025 0.035 0.030 2 <0.002 <0.002 <0.002 2 7.88 8.04 7.96 2 22.0 24.0 23.0
Nabawa 2 0.040 0.040 0.040 2 <0.002 0.003 <0.002 2 7.71 7.77 7.74 2 22.0 25.0 23.5
New Norcia 6 0.015 0.030 0.018 6 <0.002 <0.002 <0.002 6 6.27 6.69 6.51 6 45.0 47.0 45.8
Nilgern (Ocean Farms) 2 <0.003 <0.003 <0.003 2 <0.002 <0.002 <0.002 2 7.45 7.52 7.49 2 20.0 22.0 21.0
Northampton 2 0.015 0.025 0.020 2 <0.002 0.002 <0.002 2 7.91 8.37 8.14 2 23.0 24.0 23.5
Perenjori 2 0.020 0.030 0.025 2 <0.002 0.003 <0.002 2 7.03 7.20 7.12 2 46.0 50.0 48.0
Piawaning 2 0.006 0.025 0.016 2 <0.002 <0.002 <0.002 2 7.28 7.35 7.32 2 17.0 18.0 17.5
Port Kalbarri 2 0.008 0.015 0.012 2 <0.002 0.003 <0.002 6 7.09 7.63 7.39 2 46.0 47.0 46.5
Sandstone 2 <0.003 0.004 <0.003 2 <0.002 <0.002 <0.002 2 7.54 7.56 7.55 2 35.0 39.0 37.0
Seabird 2 0.010 0.030 0.020 2 <0.002 <0.002 <0.002 2 7.65 7.89 7.77 2 18.0 18.0 18.0
Seaview Park 3 <0.003 <0.003 <0.003 3 <0.002 <0.002 <0.002 3 8.03 8.05 8.04 3 17.0 18.0 17.3
Sovereign Hills 3 <0.003 0.004 <0.003 3 <0.002 <0.002 <0.002 3 7.81 7.97 7.89 3 20.0 20.0 20.0
Three Springs 2 0.045 0.090 0.068 2 0.005 0.014 0.010 2 7.52 7.61 7.57 2 50.0 50.0 50.0
Watheroo 4 0.008 0.010 0.009 4 <0.002 <0.002 <0.002 4 7.42 7.49 7.44 4 13.0 15.0 14.0
Woodridge 2 0.015 0.020 0.018 2 0.004 0.005 0.005 2 7.25 7.46 7.36 2 25.0 26.0 25.5
Yalgoo 2 <0.003 <0.003 <0.003 2 <0.002 <0.002 <0.002 2 7.25 7.77 7.51 2 70.0 85.0 77.5 (2)Yerecoin 2 0.008 0.025 0.017 2 <0.002 <0.002 <0.002 2 7.32 7.75 7.54 2 17.0 18.0 17.5
Yuna 2 0.100 0.120 0.110 2 0.004 0.006 0.005 2 7.65 7.74 7.70 2 23.0 24.0 23.5
(1) High Iron 10 times greater than supply average due to new pipeline commissioning. (2) High pH due to long mains supplying this locality. (3) Elevated silica is characteristic of the souce supplying this locality.
Guideline Met
Guideline Met
Samples Taken
Value (pH units) Guideline Met
Samples Taken
Concentration (mg/L)Concentration (mg/L)
LocalitySamples Taken
Concentration (mg/L) Guideline Met
Samples Taken
Table 9 Aesthetic (Non-health related) VariablesIron Manganese pH Silica
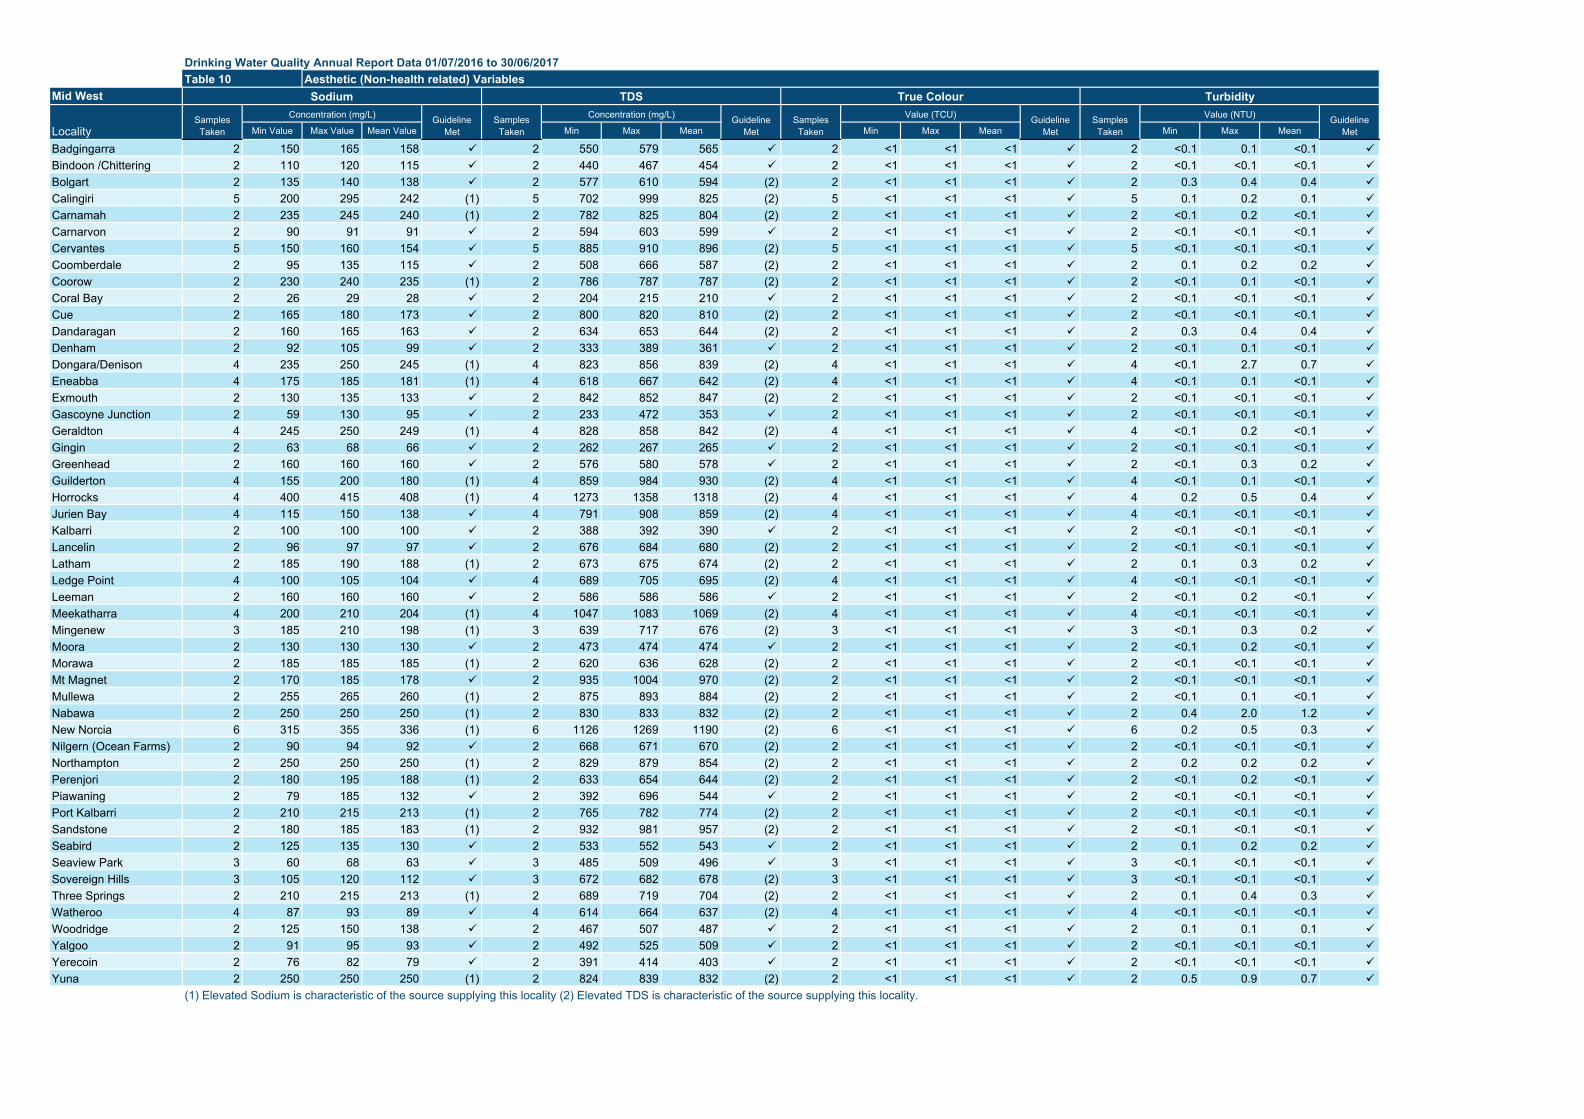
Drinking Water Quality Annual Report Data 01/07/2016 to 30/06/2017
Mid West
Min Value Max Value Mean Value Min Max Mean Min Max Mean Min Max Mean
Badgingarra 2 150 165 158 2 550 579 565 2 <1 <1 <1 2 <0.1 0.1 <0.1
Bindoon /Chittering 2 110 120 115 2 440 467 454 2 <1 <1 <1 2 <0.1 <0.1 <0.1
Bolgart 2 135 140 138 2 577 610 594 (2) 2 <1 <1 <1 2 0.3 0.4 0.4
Calingiri 5 200 295 242 (1) 5 702 999 825 (2) 5 <1 <1 <1 5 0.1 0.2 0.1
Carnamah 2 235 245 240 (1) 2 782 825 804 (2) 2 <1 <1 <1 2 <0.1 0.2 <0.1
Carnarvon 2 90 91 91 2 594 603 599 2 <1 <1 <1 2 <0.1 <0.1 <0.1
Cervantes 5 150 160 154 5 885 910 896 (2) 5 <1 <1 <1 5 <0.1 <0.1 <0.1
Coomberdale 2 95 135 115 2 508 666 587 (2) 2 <1 <1 <1 2 0.1 0.2 0.2
Coorow 2 230 240 235 (1) 2 786 787 787 (2) 2 <1 <1 <1 2 <0.1 0.1 <0.1
Coral Bay 2 26 29 28 2 204 215 210 2 <1 <1 <1 2 <0.1 <0.1 <0.1
Cue 2 165 180 173 2 800 820 810 (2) 2 <1 <1 <1 2 <0.1 <0.1 <0.1
Dandaragan 2 160 165 163 2 634 653 644 (2) 2 <1 <1 <1 2 0.3 0.4 0.4
Denham 2 92 105 99 2 333 389 361 2 <1 <1 <1 2 <0.1 0.1 <0.1
Dongara/Denison 4 235 250 245 (1) 4 823 856 839 (2) 4 <1 <1 <1 4 <0.1 2.7 0.7
Eneabba 4 175 185 181 (1) 4 618 667 642 (2) 4 <1 <1 <1 4 <0.1 0.1 <0.1
Exmouth 2 130 135 133 2 842 852 847 (2) 2 <1 <1 <1 2 <0.1 <0.1 <0.1
Gascoyne Junction 2 59 130 95 2 233 472 353 2 <1 <1 <1 2 <0.1 <0.1 <0.1
Geraldton 4 245 250 249 (1) 4 828 858 842 (2) 4 <1 <1 <1 4 <0.1 0.2 <0.1
Gingin 2 63 68 66 2 262 267 265 2 <1 <1 <1 2 <0.1 <0.1 <0.1
Greenhead 2 160 160 160 2 576 580 578 2 <1 <1 <1 2 <0.1 0.3 0.2
Guilderton 4 155 200 180 (1) 4 859 984 930 (2) 4 <1 <1 <1 4 <0.1 0.1 <0.1
Horrocks 4 400 415 408 (1) 4 1273 1358 1318 (2) 4 <1 <1 <1 4 0.2 0.5 0.4
Jurien Bay 4 115 150 138 4 791 908 859 (2) 4 <1 <1 <1 4 <0.1 <0.1 <0.1
Kalbarri 2 100 100 100 2 388 392 390 2 <1 <1 <1 2 <0.1 <0.1 <0.1
Lancelin 2 96 97 97 2 676 684 680 (2) 2 <1 <1 <1 2 <0.1 <0.1 <0.1
Latham 2 185 190 188 (1) 2 673 675 674 (2) 2 <1 <1 <1 2 0.1 0.3 0.2
Ledge Point 4 100 105 104 4 689 705 695 (2) 4 <1 <1 <1 4 <0.1 <0.1 <0.1
Leeman 2 160 160 160 2 586 586 586 2 <1 <1 <1 2 <0.1 0.2 <0.1
Meekatharra 4 200 210 204 (1) 4 1047 1083 1069 (2) 4 <1 <1 <1 4 <0.1 <0.1 <0.1
Mingenew 3 185 210 198 (1) 3 639 717 676 (2) 3 <1 <1 <1 3 <0.1 0.3 0.2
Moora 2 130 130 130 2 473 474 474 2 <1 <1 <1 2 <0.1 0.2 <0.1
Morawa 2 185 185 185 (1) 2 620 636 628 (2) 2 <1 <1 <1 2 <0.1 <0.1 <0.1
Mt Magnet 2 170 185 178 2 935 1004 970 (2) 2 <1 <1 <1 2 <0.1 <0.1 <0.1
Mullewa 2 255 265 260 (1) 2 875 893 884 (2) 2 <1 <1 <1 2 <0.1 0.1 <0.1
Nabawa 2 250 250 250 (1) 2 830 833 832 (2) 2 <1 <1 <1 2 0.4 2.0 1.2
New Norcia 6 315 355 336 (1) 6 1126 1269 1190 (2) 6 <1 <1 <1 6 0.2 0.5 0.3
Nilgern (Ocean Farms) 2 90 94 92 2 668 671 670 (2) 2 <1 <1 <1 2 <0.1 <0.1 <0.1
Northampton 2 250 250 250 (1) 2 829 879 854 (2) 2 <1 <1 <1 2 0.2 0.2 0.2
Perenjori 2 180 195 188 (1) 2 633 654 644 (2) 2 <1 <1 <1 2 <0.1 0.2 <0.1
Piawaning 2 79 185 132 2 392 696 544 2 <1 <1 <1 2 <0.1 <0.1 <0.1
Port Kalbarri 2 210 215 213 (1) 2 765 782 774 (2) 2 <1 <1 <1 2 <0.1 <0.1 <0.1
Sandstone 2 180 185 183 (1) 2 932 981 957 (2) 2 <1 <1 <1 2 <0.1 <0.1 <0.1
Seabird 2 125 135 130 2 533 552 543 2 <1 <1 <1 2 0.1 0.2 0.2
Seaview Park 3 60 68 63 3 485 509 496 3 <1 <1 <1 3 <0.1 <0.1 <0.1
Sovereign Hills 3 105 120 112 3 672 682 678 (2) 3 <1 <1 <1 3 <0.1 <0.1 <0.1
Three Springs 2 210 215 213 (1) 2 689 719 704 (2) 2 <1 <1 <1 2 0.1 0.4 0.3
Watheroo 4 87 93 89 4 614 664 637 (2) 4 <1 <1 <1 4 <0.1 <0.1 <0.1
Woodridge 2 125 150 138 2 467 507 487 2 <1 <1 <1 2 0.1 0.1 0.1
Yalgoo 2 91 95 93 2 492 525 509 2 <1 <1 <1 2 <0.1 <0.1 <0.1
Yerecoin 2 76 82 79 2 391 414 403 2 <1 <1 <1 2 <0.1 <0.1 <0.1
Yuna 2 250 250 250 (1) 2 824 839 832 (2) 2 <1 <1 <1 2 0.5 0.9 0.7
(1) Elevated Sodium is characteristic of the source supplying this locality (2) Elevated TDS is characteristic of the source supplying this locality.
Value (NTU)Guideline Met
Samples Taken
Value (TCU) Guideline Met
Samples TakenLocality
Samples Taken
Concentration (mg/L) Guideline Met
Samples Taken
Concentration (mg/L)
Table 10 Aesthetic (Non-health related) VariablesSodium TDS True Colour Turbidity
Guideline Met
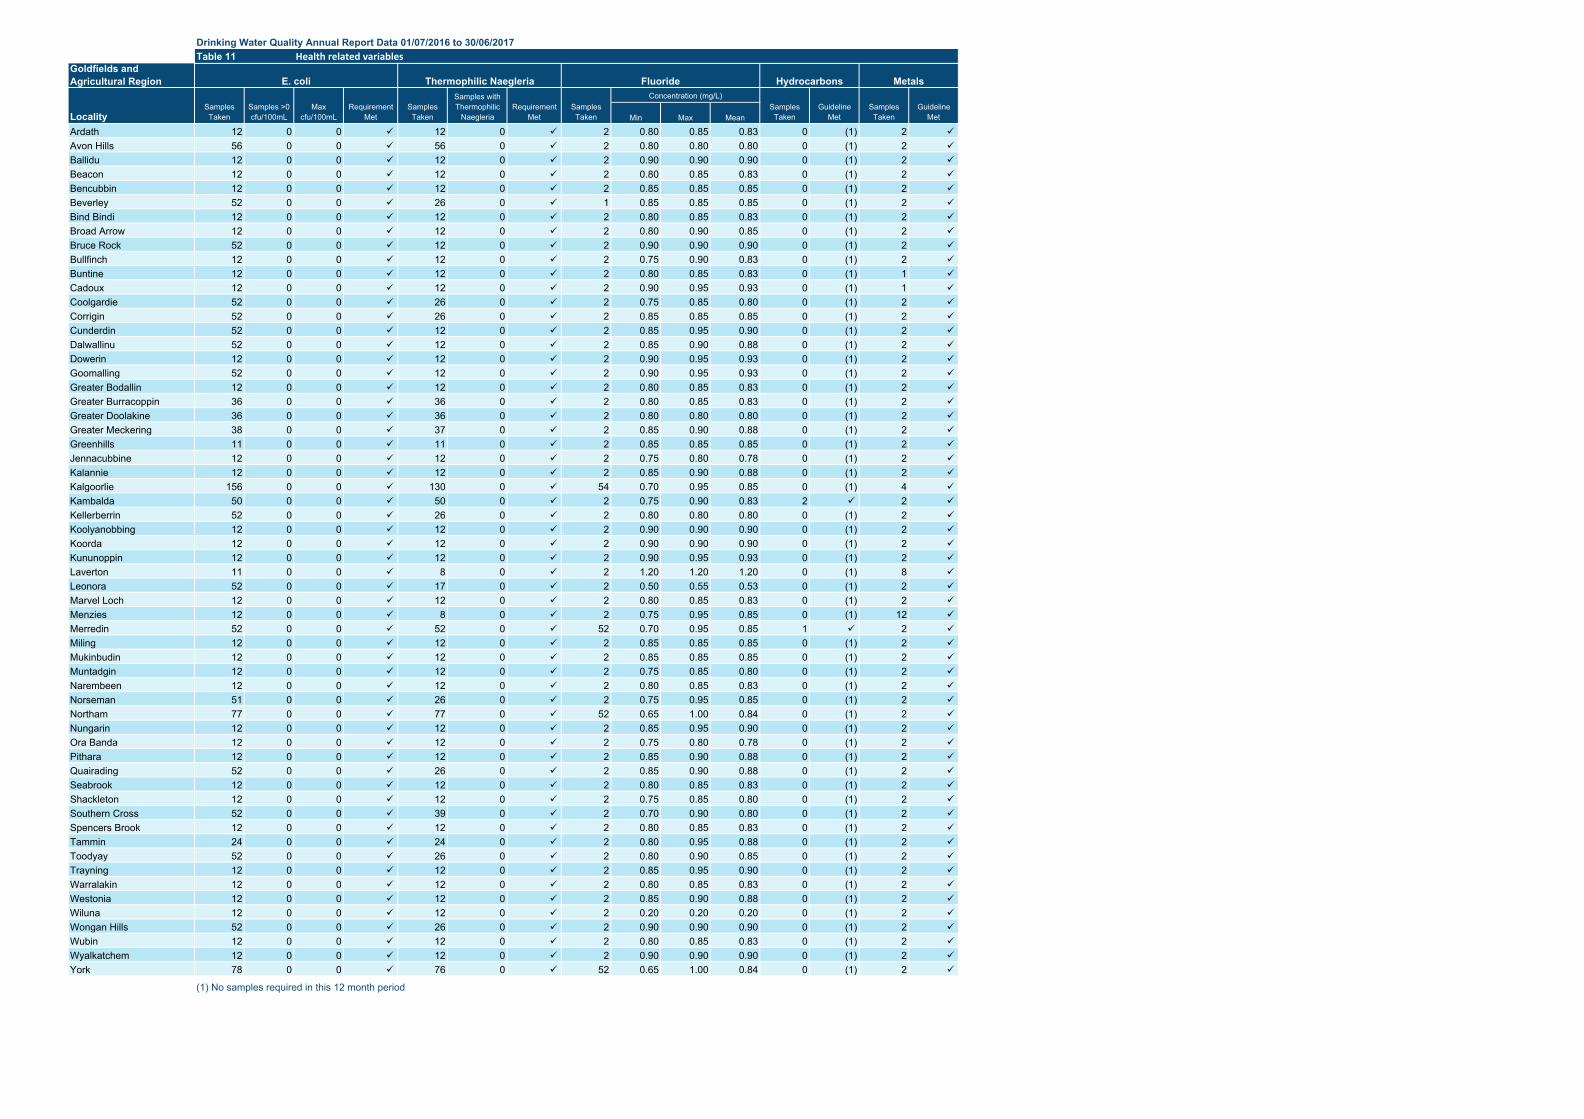
Drinking Water Quality Annual Report Data 01/07/2016 to 30/06/2017
Goldfields and Agricultural Region
Min Max Mean
Ardath 12 0 0 12 0 2 0.80 0.85 0.83 0 (1) 2
Avon Hills 56 0 0 56 0 2 0.80 0.80 0.80 0 (1) 2
Ballidu 12 0 0 12 0 2 0.90 0.90 0.90 0 (1) 2
Beacon 12 0 0 12 0 2 0.80 0.85 0.83 0 (1) 2
Bencubbin 12 0 0 12 0 2 0.85 0.85 0.85 0 (1) 2
Beverley 52 0 0 26 0 1 0.85 0.85 0.85 0 (1) 2
Bind Bindi 12 0 0 12 0 2 0.80 0.85 0.83 0 (1) 2
Broad Arrow 12 0 0 12 0 2 0.80 0.90 0.85 0 (1) 2
Bruce Rock 52 0 0 12 0 2 0.90 0.90 0.90 0 (1) 2
Bullfinch 12 0 0 12 0 2 0.75 0.90 0.83 0 (1) 2
Buntine 12 0 0 12 0 2 0.80 0.85 0.83 0 (1) 1
Cadoux 12 0 0 12 0 2 0.90 0.95 0.93 0 (1) 1
Coolgardie 52 0 0 26 0 2 0.75 0.85 0.80 0 (1) 2
Corrigin 52 0 0 26 0 2 0.85 0.85 0.85 0 (1) 2
Cunderdin 52 0 0 12 0 2 0.85 0.95 0.90 0 (1) 2
Dalwallinu 52 0 0 12 0 2 0.85 0.90 0.88 0 (1) 2
Dowerin 12 0 0 12 0 2 0.90 0.95 0.93 0 (1) 2
Goomalling 52 0 0 12 0 2 0.90 0.95 0.93 0 (1) 2
Greater Bodallin 12 0 0 12 0 2 0.80 0.85 0.83 0 (1) 2
Greater Burracoppin 36 0 0 36 0 2 0.80 0.85 0.83 0 (1) 2
Greater Doolakine 36 0 0 36 0 2 0.80 0.80 0.80 0 (1) 2
Greater Meckering 38 0 0 37 0 2 0.85 0.90 0.88 0 (1) 2
Greenhills 11 0 0 11 0 2 0.85 0.85 0.85 0 (1) 2
Jennacubbine 12 0 0 12 0 2 0.75 0.80 0.78 0 (1) 2
Kalannie 12 0 0 12 0 2 0.85 0.90 0.88 0 (1) 2
Kalgoorlie 156 0 0 130 0 54 0.70 0.95 0.85 0 (1) 4
Kambalda 50 0 0 50 0 2 0.75 0.90 0.83 2 2
Kellerberrin 52 0 0 26 0 2 0.80 0.80 0.80 0 (1) 2
Koolyanobbing 12 0 0 12 0 2 0.90 0.90 0.90 0 (1) 2
Koorda 12 0 0 12 0 2 0.90 0.90 0.90 0 (1) 2
Kununoppin 12 0 0 12 0 2 0.90 0.95 0.93 0 (1) 2
Laverton 11 0 0 8 0 2 1.20 1.20 1.20 0 (1) 8
Leonora 52 0 0 17 0 2 0.50 0.55 0.53 0 (1) 2
Marvel Loch 12 0 0 12 0 2 0.80 0.85 0.83 0 (1) 2
Menzies 12 0 0 8 0 2 0.75 0.95 0.85 0 (1) 12
Merredin 52 0 0 52 0 52 0.70 0.95 0.85 1 2
Miling 12 0 0 12 0 2 0.85 0.85 0.85 0 (1) 2
Mukinbudin 12 0 0 12 0 2 0.85 0.85 0.85 0 (1) 2
Muntadgin 12 0 0 12 0 2 0.75 0.85 0.80 0 (1) 2
Narembeen 12 0 0 12 0 2 0.80 0.85 0.83 0 (1) 2
Norseman 51 0 0 26 0 2 0.75 0.95 0.85 0 (1) 2
Northam 77 0 0 77 0 52 0.65 1.00 0.84 0 (1) 2
Nungarin 12 0 0 12 0 2 0.85 0.95 0.90 0 (1) 2
Ora Banda 12 0 0 12 0 2 0.75 0.80 0.78 0 (1) 2
Pithara 12 0 0 12 0 2 0.85 0.90 0.88 0 (1) 2
Quairading 52 0 0 26 0 2 0.85 0.90 0.88 0 (1) 2
Seabrook 12 0 0 12 0 2 0.80 0.85 0.83 0 (1) 2
Shackleton 12 0 0 12 0 2 0.75 0.85 0.80 0 (1) 2
Southern Cross 52 0 0 39 0 2 0.70 0.90 0.80 0 (1) 2
Spencers Brook 12 0 0 12 0 2 0.80 0.85 0.83 0 (1) 2
Tammin 24 0 0 24 0 2 0.80 0.95 0.88 0 (1) 2
Toodyay 52 0 0 26 0 2 0.80 0.90 0.85 0 (1) 2
Trayning 12 0 0 12 0 2 0.85 0.95 0.90 0 (1) 2
Warralakin 12 0 0 12 0 2 0.80 0.85 0.83 0 (1) 2
Westonia 12 0 0 12 0 2 0.85 0.90 0.88 0 (1) 2
Wiluna 12 0 0 12 0 2 0.20 0.20 0.20 0 (1) 2
Wongan Hills 52 0 0 26 0 2 0.90 0.90 0.90 0 (1) 2
Wubin 12 0 0 12 0 2 0.80 0.85 0.83 0 (1) 2
Wyalkatchem 12 0 0 12 0 2 0.90 0.90 0.90 0 (1) 2
York 78 0 0 76 0 52 0.65 1.00 0.84 0 (1) 2
(1) No samples required in this 12 month period
Table 11 Health related variables
E. coli Thermophilic Naegleria Fluoride Hydrocarbons Metals
LocalitySamples Taken
Samples >0 cfu/100mL
Max cfu/100mL
Requirement Met
Samples Taken
Guideline Met
Samples with Thermophilic
NaegleriaRequirement
MetSamples Taken
Concentration (mg/L)Samples Taken
Guideline Met
Samples Taken

Drinking Water Quality Annual Report Data 01/07/2016 to 30/06/2017
Goldfields and Agricultural Region
Min Max Mean Min Max Mean
Ardath 2 0.44 3.98 2.21 1 0 (1) 2 0.007 0.009 0.008 0 (1)Avon Hills 2 0.44 0.44 0.44 1 0 (1) 2 0.008 0.015 0.012 0 (1)Ballidu 2 1.33 2.65 2.21 1 0 (1) 2 0.014 0.019 0.017 0 (1)Beacon 2 0.88 11.49 6.19 1 0 (1) 2 0.004 0.038 0.021 0 (1)Bencubbin 2 1.77 3.98 3.09 1 0 (1) 2 0.006 0.038 0.022 0 (1)Beverley 2 0.44 2.21 1.33 1 0 (1) 2 0.010 0.025 0.018 0 (1)Bind Bindi 2 1.33 5.30 3.09 1 0 (1) 2 0.010 0.015 0.013 0 (1)Broad Arrow 2 1.77 4.42 3.09 1 0 (1) 2 0.059 0.060 0.060 0 (1)Bruce Rock 2 1.33 7.51 4.42 1 0 (1) 2 0.030 0.042 0.036 0 (1)Bullfinch 2 5.30 6.19 5.75 1 0 (1) 2 0.035 0.052 0.043 0 (1)Buntine 2 3.09 6.63 4.86 1 0 (1) 2 0.007 0.039 0.023 0 (1)Cadoux 2 0.88 2.21 1.77 1 0 (1) 2 0.004 0.012 0.008 0 (1)Coolgardie 2 0.88 2.21 1.77 1 0 (1) 2 0.019 0.042 0.031 0 (1)Corrigin 2 0.88 4.86 2.65 1 0 (1) 2 0.002 0.014 0.008 0 (1)Cunderdin 2 0.44 0.88 0.44 1 0 (1) 2 <0.001 0.015 0.008 0 (1)Dalwallinu 2 0.88 1.33 1.33 1 0 (1) 2 0.011 0.016 0.014 0 (1)Dowerin 2 1.33 3.98 2.65 1 0 (1) 2 0.004 0.010 0.007 0 (1)Goomalling 2 0.44 2.21 1.33 1 0 (1) 2 0.004 0.013 0.009 0 (1)Greater Bodallin 2 0.44 2.21 1.33 1 0 (1) 2 <0.001 0.007 0.004 0 (1)Greater Burracoppin 2 0.44 3.09 1.77 1 0 (1) 2 0.001 0.007 0.004 0 (1)Greater Doolakine 2 0.44 0.88 0.44 1 0 (1) 2 0.011 0.020 0.016 0 (1)Greater Meckering 2 0.88 1.33 0.88 1 0 (1) 2 0.001 0.016 0.009 0 (1)Greenhills 2 1.77 3.98 3.09 1 0 (1) 2 0.016 0.021 0.019 0 (1)Jennacubbine 2 1.33 3.98 2.65 1 0 (1) 2 0.016 0.023 0.020 0 (1)Kalannie 2 0.88 3.98 2.21 1 0 (1) 2 0.024 0.034 0.029 0 (1)Kalgoorlie 4 1.33 2.65 1.77 2 0 (1) 4 0.023 0.081 0.050 0 (1)Kambalda 2 1.33 2.65 1.77 1 0 (1) 2 0.047 0.067 0.057 0 (1)Kellerberrin 2 0.44 0.44 0.44 1 0 (1) 2 0.007 0.014 0.011 0 (1)Koolyanobbing 2 1.33 5.75 3.54 1 0 (1) 2 0.002 0.017 0.010 0 (1)Koorda 2 2.21 3.09 2.65 1 0 (1) 2 0.003 0.010 0.007 0 (1)Kununoppin 2 1.33 3.54 2.65 1 0 (1) 2 0.008 0.009 0.009 0 (1)Laverton 10 31.38 37.13 34.03 (2) 1 2 2 0.049 0.056 0.053 0 (1)Leonora 10 18.56 32.71 26.52 (2) 1 0 (1) 2 <0.001 <0.001 <0.001 0 (1)Marvel Loch 2 0.88 4.86 3.09 1 0 (1) 2 0.011 0.019 0.015 0 (1)Menzies 4 2.65 3.54 3.09 1 0 (1) 2 0.050 0.062 0.056 0 (1)Merredin 2 0.44 3.98 2.21 1 0 (1) 2 0.009 0.014 0.012 0 (1)Miling 2 0.88 4.42 2.65 1 0 (1) 2 0.003 0.011 0.007 0 (1)Mukinbudin 2 1.33 11.49 6.63 1 0 (1) 2 0.001 0.007 0.004 0 (1)Muntadgin 2 0.44 4.42 2.65 1 0 (1) 2 0.004 0.014 0.009 0 (1)Narembeen 2 0.88 2.21 1.33 1 0 (1) 2 0.010 0.013 0.012 0 (1)Norseman 2 1.33 3.98 2.65 1 0 (1) 2 0.050 0.079 0.065 0 (1)Northam 2 0.88 2.65 1.77 1 0 (1) 2 0.005 0.017 0.011 0 (1)Nungarin 2 0.88 1.33 0.88 1 0 (1) 2 0.005 0.007 0.006 0 (1)Ora Banda 2 1.33 2.65 2.21 1 0 (1) 2 0.028 0.033 0.031 0 (1)Pithara 2 0.88 2.21 1.77 1 0 (1) 2 0.011 0.014 0.013 0 (1)Quairading 2 1.77 2.65 2.21 1 0 (1) 2 0.008 0.029 0.019 0 (1)Seabrook 2 0.88 3.54 2.21 1 0 (1) 2 0.012 0.017 0.015 0 (1)Shackleton 2 0.44 0.88 0.88 1 0 (1) 2 0.007 0.024 0.016 0 (1)Southern Cross 2 0.88 3.98 2.65 1 0 (1) 2 0.005 0.009 0.007 0 (1)Spencers Brook 2 0.44 0.88 0.44 1 0 (1) 2 0.010 0.012 0.011 0 (1)Tammin 2 0.88 3.54 2.21 1 0 (1) 2 0.012 0.023 0.018 0 (1)Toodyay 2 1.33 3.54 2.21 1 0 (1) 2 0.004 0.011 0.008 0 (1)Trayning 2 0.88 3.98 2.21 1 0 (1) 2 0.020 0.024 0.022 0 (1)Warralakin 2 0.88 8.40 4.86 1 0 (1) 2 0.004 0.017 0.011 0 (1)Westonia 2 0.88 7.07 3.98 1 0 (1) 2 0.006 0.016 0.011 0 (1)Wiluna 2 29.61 36.69 33.15 (2) 1 0 (1) 2 0.002 0.005 0.004 0 (1)Wongan Hills 2 0.44 0.88 0.88 1 0 (1) 2 0.004 0.061 0.033 0 (1)Wubin 2 1.77 6.19 3.98 1 0 (1) 2 0.008 0.023 0.016 0 (1)Wyalkatchem 2 0.88 0.88 0.88 1 0 (1) 2 0.004 0.010 0.007 0 (1)York 2 0.88 1.77 1.33 1 0 (1) 2 0.005 0.020 0.013 0 (1)
ǂ Nitrate data is converted from laboratory analysis reported as "Nitrate plus Nitrite as Nitrogen" based on the assumption that all nitrite is converted to nitrate under oxidative conditions during sampling.
Table 12 Health related variables
Nitrateǂ Pesticides Radiological Trihalomethanes Other Health Related
Requirement Met
(1) No samples required in this 12 month period. (2) Laverton, Leonora, Menzies and Wiluna have been granted an exemption from compliance with the infant nitrate guideline by the Department of Health. The water supplied is safe for adults and children over the age of 3 months. Carers of infants younger than 3 months should seek advice from the Community HealthNurse regarding the use of alternative water sources for the preparation of bottle feeds. The Water Corporation provides bottled water free of charge for this purpose.
Samples Taken
Guideline Met
Samples Taken
Concentration (mg/L) Guideline Met
Samples TakenLocality
Samples Taken
Concentration (mg/L) Guideline Met Samples Taken Guideline Met
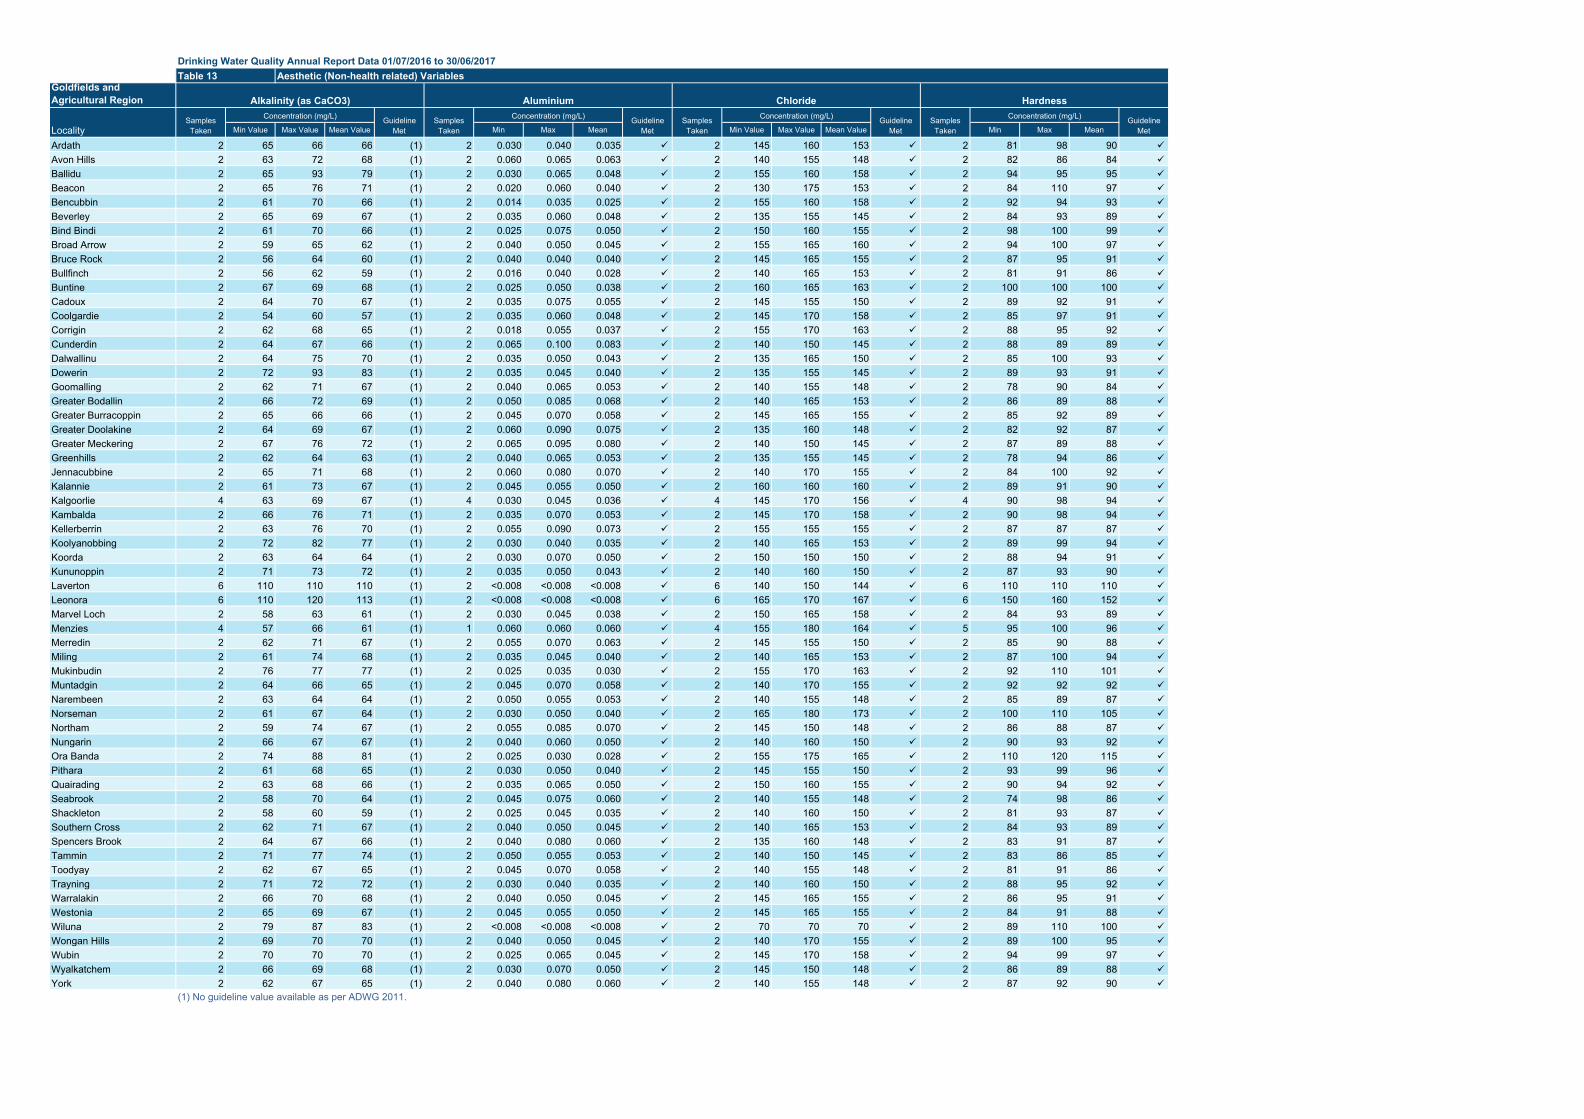
Drinking Water Quality Annual Report Data 01/07/2016 to 30/06/2017
Goldfields and Agricultural Region
Min Value Max Value Mean Value Min Max Mean Min Value Max Value Mean Value Min Max Mean
Ardath 2 65 66 66 (1) 2 0.030 0.040 0.035 2 145 160 153 2 81 98 90
Avon Hills 2 63 72 68 (1) 2 0.060 0.065 0.063 2 140 155 148 2 82 86 84
Ballidu 2 65 93 79 (1) 2 0.030 0.065 0.048 2 155 160 158 2 94 95 95
Beacon 2 65 76 71 (1) 2 0.020 0.060 0.040 2 130 175 153 2 84 110 97
Bencubbin 2 61 70 66 (1) 2 0.014 0.035 0.025 2 155 160 158 2 92 94 93
Beverley 2 65 69 67 (1) 2 0.035 0.060 0.048 2 135 155 145 2 84 93 89
Bind Bindi 2 61 70 66 (1) 2 0.025 0.075 0.050 2 150 160 155 2 98 100 99
Broad Arrow 2 59 65 62 (1) 2 0.040 0.050 0.045 2 155 165 160 2 94 100 97
Bruce Rock 2 56 64 60 (1) 2 0.040 0.040 0.040 2 145 165 155 2 87 95 91
Bullfinch 2 56 62 59 (1) 2 0.016 0.040 0.028 2 140 165 153 2 81 91 86
Buntine 2 67 69 68 (1) 2 0.025 0.050 0.038 2 160 165 163 2 100 100 100
Cadoux 2 64 70 67 (1) 2 0.035 0.075 0.055 2 145 155 150 2 89 92 91
Coolgardie 2 54 60 57 (1) 2 0.035 0.060 0.048 2 145 170 158 2 85 97 91
Corrigin 2 62 68 65 (1) 2 0.018 0.055 0.037 2 155 170 163 2 88 95 92
Cunderdin 2 64 67 66 (1) 2 0.065 0.100 0.083 2 140 150 145 2 88 89 89
Dalwallinu 2 64 75 70 (1) 2 0.035 0.050 0.043 2 135 165 150 2 85 100 93
Dowerin 2 72 93 83 (1) 2 0.035 0.045 0.040 2 135 155 145 2 89 93 91
Goomalling 2 62 71 67 (1) 2 0.040 0.065 0.053 2 140 155 148 2 78 90 84
Greater Bodallin 2 66 72 69 (1) 2 0.050 0.085 0.068 2 140 165 153 2 86 89 88
Greater Burracoppin 2 65 66 66 (1) 2 0.045 0.070 0.058 2 145 165 155 2 85 92 89
Greater Doolakine 2 64 69 67 (1) 2 0.060 0.090 0.075 2 135 160 148 2 82 92 87
Greater Meckering 2 67 76 72 (1) 2 0.065 0.095 0.080 2 140 150 145 2 87 89 88
Greenhills 2 62 64 63 (1) 2 0.040 0.065 0.053 2 135 155 145 2 78 94 86
Jennacubbine 2 65 71 68 (1) 2 0.060 0.080 0.070 2 140 170 155 2 84 100 92
Kalannie 2 61 73 67 (1) 2 0.045 0.055 0.050 2 160 160 160 2 89 91 90
Kalgoorlie 4 63 69 67 (1) 4 0.030 0.045 0.036 4 145 170 156 4 90 98 94
Kambalda 2 66 76 71 (1) 2 0.035 0.070 0.053 2 145 170 158 2 90 98 94
Kellerberrin 2 63 76 70 (1) 2 0.055 0.090 0.073 2 155 155 155 2 87 87 87
Koolyanobbing 2 72 82 77 (1) 2 0.030 0.040 0.035 2 140 165 153 2 89 99 94
Koorda 2 63 64 64 (1) 2 0.030 0.070 0.050 2 150 150 150 2 88 94 91
Kununoppin 2 71 73 72 (1) 2 0.035 0.050 0.043 2 140 160 150 2 87 93 90
Laverton 6 110 110 110 (1) 2 <0.008 <0.008 <0.008 6 140 150 144 6 110 110 110
Leonora 6 110 120 113 (1) 2 <0.008 <0.008 <0.008 6 165 170 167 6 150 160 152
Marvel Loch 2 58 63 61 (1) 2 0.030 0.045 0.038 2 150 165 158 2 84 93 89
Menzies 4 57 66 61 (1) 1 0.060 0.060 0.060 4 155 180 164 5 95 100 96
Merredin 2 62 71 67 (1) 2 0.055 0.070 0.063 2 145 155 150 2 85 90 88
Miling 2 61 74 68 (1) 2 0.035 0.045 0.040 2 140 165 153 2 87 100 94
Mukinbudin 2 76 77 77 (1) 2 0.025 0.035 0.030 2 155 170 163 2 92 110 101
Muntadgin 2 64 66 65 (1) 2 0.045 0.070 0.058 2 140 170 155 2 92 92 92
Narembeen 2 63 64 64 (1) 2 0.050 0.055 0.053 2 140 155 148 2 85 89 87
Norseman 2 61 67 64 (1) 2 0.030 0.050 0.040 2 165 180 173 2 100 110 105
Northam 2 59 74 67 (1) 2 0.055 0.085 0.070 2 145 150 148 2 86 88 87
Nungarin 2 66 67 67 (1) 2 0.040 0.060 0.050 2 140 160 150 2 90 93 92
Ora Banda 2 74 88 81 (1) 2 0.025 0.030 0.028 2 155 175 165 2 110 120 115
Pithara 2 61 68 65 (1) 2 0.030 0.050 0.040 2 145 155 150 2 93 99 96
Quairading 2 63 68 66 (1) 2 0.035 0.065 0.050 2 150 160 155 2 90 94 92
Seabrook 2 58 70 64 (1) 2 0.045 0.075 0.060 2 140 155 148 2 74 98 86
Shackleton 2 58 60 59 (1) 2 0.025 0.045 0.035 2 140 160 150 2 81 93 87
Southern Cross 2 62 71 67 (1) 2 0.040 0.050 0.045 2 140 165 153 2 84 93 89
Spencers Brook 2 64 67 66 (1) 2 0.040 0.080 0.060 2 135 160 148 2 83 91 87
Tammin 2 71 77 74 (1) 2 0.050 0.055 0.053 2 140 150 145 2 83 86 85
Toodyay 2 62 67 65 (1) 2 0.045 0.070 0.058 2 140 155 148 2 81 91 86
Trayning 2 71 72 72 (1) 2 0.030 0.040 0.035 2 140 160 150 2 88 95 92
Warralakin 2 66 70 68 (1) 2 0.040 0.050 0.045 2 145 165 155 2 86 95 91
Westonia 2 65 69 67 (1) 2 0.045 0.055 0.050 2 145 165 155 2 84 91 88
Wiluna 2 79 87 83 (1) 2 <0.008 <0.008 <0.008 2 70 70 70 2 89 110 100
Wongan Hills 2 69 70 70 (1) 2 0.040 0.050 0.045 2 140 170 155 2 89 100 95
Wubin 2 70 70 70 (1) 2 0.025 0.065 0.045 2 145 170 158 2 94 99 97
Wyalkatchem 2 66 69 68 (1) 2 0.030 0.070 0.050 2 145 150 148 2 86 89 88
York 2 62 67 65 (1) 2 0.040 0.080 0.060 2 140 155 148 2 87 92 90 (1) No guideline value available as per ADWG 2011.
Guideline Met
Guideline Met
Samples Taken
Concentration (mg/L) Guideline Met
Samples Taken
Concentration (mg/L)Concentration (mg/L)
LocalitySamples Taken
Concentration (mg/L) Guideline Met
Samples Taken
Table 13 Aesthetic (Non-health related) Variables
Alkalinity (as CaCO3) Aluminium Chloride Hardness

Drinking Water Quality Annual Report Data 01/07/2016 to 30/06/2017
Goldfields and Agricultural Region
Min Max Mean Min Max Mean Min Max Mean Min Value Max Value Mean Value
Ardath 2 0.015 0.030 0.023 2 <0.002 <0.002 <0.002 2 8.33 8.76 8.55 (1) 2 4.2 4.8 4.5
Avon Hills 2 <0.003 0.004 <0.003 2 <0.002 <0.002 <0.002 2 8.22 8.31 8.27 2 6.0 6.1 6.1
Ballidu 2 0.006 0.015 0.011 2 <0.002 <0.002 <0.002 2 7.20 8.52 7.86 2 4.4 5.5 5.0
Beacon 2 0.035 0.090 0.063 2 <0.002 0.004 <0.002 2 8.17 9.02 8.60 (1) 2 3.9 6.1 5.0
Bencubbin 2 0.010 0.030 0.020 2 <0.002 0.002 <0.002 2 7.70 8.29 8.00 2 5.3 5.7 5.5
Beverley 2 0.006 0.010 0.008 2 <0.002 <0.002 <0.002 2 8.45 8.77 8.61 (1) 2 4.4 5.6 5.0
Bind Bindi 2 0.004 0.020 0.012 2 <0.002 <0.002 <0.002 2 7.79 8.85 8.32 2 4.4 5.5 5.0
Broad Arrow 2 0.060 0.120 0.090 2 <0.002 <0.002 <0.002 2 7.82 8.03 7.93 2 4.8 5.5 5.2
Bruce Rock 2 0.010 0.025 0.018 2 <0.002 <0.002 <0.002 2 7.48 7.81 7.65 2 5.8 6.6 6.2
Bullfinch 2 <0.003 0.004 <0.003 2 <0.002 <0.002 <0.002 2 8.60 8.71 8.66 (1) 2 4.5 5.1 4.8
Buntine 2 0.008 0.015 0.012 2 <0.002 <0.002 <0.002 2 8.21 8.35 8.28 2 4.4 5.3 4.9
Cadoux 2 0.010 0.015 0.013 2 <0.002 <0.002 <0.002 2 8.08 8.32 8.20 2 4.3 5.6 5.0
Coolgardie 2 0.010 0.015 0.013 2 <0.002 <0.002 <0.002 2 7.43 7.48 7.46 2 4.8 5.5 5.2
Corrigin 2 0.008 0.010 0.009 2 <0.002 <0.002 <0.002 2 8.12 8.53 8.33 2 4.1 5.4 4.8
Cunderdin 2 <0.003 0.006 <0.003 2 <0.002 <0.002 <0.002 2 7.90 8.03 7.97 2 4.8 5.4 5.1
Dalwallinu 2 0.015 0.030 0.023 2 <0.002 <0.002 <0.002 2 8.71 8.72 8.72 (1) 2 4.8 5.6 5.2
Dowerin 2 0.006 0.015 0.011 2 <0.002 <0.002 <0.002 2 8.18 8.53 8.36 (1) 2 5.7 6.0 5.9
Goomalling 2 0.008 0.010 0.009 2 <0.002 <0.002 <0.002 2 8.10 8.39 8.25 2 4.8 6.3 5.6
Greater Bodallin 2 0.006 0.006 0.006 2 <0.002 <0.002 <0.002 2 8.08 8.17 8.13 2 4.6 5.7 5.2
Greater Burracoppin 2 <0.003 0.006 <0.003 2 <0.002 <0.002 <0.002 2 8.17 8.47 8.32 2 4.6 5.5 5.1
Greater Doolakine 2 0.004 0.004 0.004 2 <0.002 <0.002 <0.002 2 8.34 8.58 8.46 2 4.8 6.1 5.5
Greater Meckering 2 <0.003 <0.003 <0.003 2 <0.002 <0.002 <0.002 2 7.99 8.24 8.12 2 4.5 5.4 5.0
Greenhills 2 0.010 0.020 0.015 2 <0.002 <0.002 <0.002 2 7.82 8.18 8.00 2 5.1 5.6 5.4
Jennacubbine 2 0.010 0.020 0.015 2 <0.002 <0.002 <0.002 2 8.46 8.68 8.57 (1) 2 4.6 5.8 5.2
Kalannie 2 0.015 0.030 0.023 2 <0.002 <0.002 <0.002 2 7.99 8.33 8.16 2 5.2 5.4 5.3
Kalgoorlie 4 0.006 0.015 0.009 4 <0.002 <0.002 <0.002 4 7.55 7.77 7.65 4 4.8 5.5 5.2
Kambalda 2 0.015 0.260 0.138 2 <0.002 0.025 0.013 2 8.10 8.18 8.14 2 4.4 5.6 5.0
Kellerberrin 2 0.004 0.004 0.004 2 <0.002 <0.002 <0.002 2 7.96 8.43 8.20 2 5.4 5.8 5.6
Koolyanobbing 2 0.008 0.010 0.009 2 <0.002 <0.002 <0.002 2 8.26 8.50 8.38 2 5.8 6.8 6.3
Koorda 2 0.006 0.010 0.008 2 <0.002 <0.002 <0.002 2 7.45 8.04 7.75 2 4.4 5.4 4.9
Kununoppin 2 0.006 0.010 0.008 2 <0.002 <0.002 <0.002 2 8.68 8.72 8.70 (1) 2 6.0 7.2 6.6
Laverton 6 0.010 0.035 0.022 6 <0.002 <0.002 <0.002 6 7.81 7.97 7.91 6 35.0 44.0 40.3
Leonora 6 <0.003 <0.003 <0.003 6 <0.002 <0.002 <0.002 6 7.51 7.79 7.61 6 14.0 25.0 20.3
Marvel Loch 2 0.006 0.010 0.008 2 <0.002 <0.002 <0.002 2 7.50 8.02 7.76 2 4.4 5.6 5.0
Menzies 4 0.015 0.025 0.018 4 <0.002 <0.002 <0.002 4 7.95 8.16 8.04 4 5.9 6.2 6.1
Merredin 2 0.006 0.015 0.011 2 <0.002 <0.002 <0.002 2 7.94 8.37 8.16 2 4.5 5.3 4.9
Miling 2 0.010 0.035 0.023 2 <0.002 <0.002 <0.002 2 8.38 8.74 8.56 (1) 2 5.3 5.6 5.5
Mukinbudin 2 0.010 0.280 0.145 2 <0.002 0.010 0.005 2 7.90 8.27 8.09 2 3.5 6.0 4.8
Muntadgin 2 0.015 0.020 0.018 2 <0.002 <0.002 <0.002 2 7.69 8.42 8.06 2 4.8 5.5 5.2
Narembeen 2 0.010 0.090 0.050 2 <0.002 <0.002 <0.002 2 8.08 8.27 8.18 2 4.1 5.2 4.7
Norseman 2 0.008 0.035 0.022 2 <0.002 0.003 <0.002 2 7.76 7.77 7.77 2 4.5 5.5 5.0
Northam 2 0.004 0.006 0.005 2 <0.002 <0.002 <0.002 2 7.79 8.39 8.09 2 5.0 5.8 5.4
Nungarin 2 <0.003 0.004 <0.003 2 <0.002 <0.002 <0.002 2 8.43 8.85 8.64 (1) 2 4.8 6.1 5.5
Ora Banda 2 0.004 0.008 0.006 2 <0.002 <0.002 <0.002 2 8.38 8.42 8.40 2 5.1 5.4 5.3
Pithara 2 0.010 0.025 0.018 2 <0.002 <0.002 <0.002 2 7.78 8.18 7.98 2 4.5 5.4 5.0
Quairading 2 0.008 0.010 0.009 2 <0.002 <0.002 <0.002 2 7.89 8.37 8.13 2 4.8 5.4 5.1
Seabrook 2 <0.003 0.006 <0.003 2 <0.002 <0.002 <0.002 2 8.39 8.75 8.57 (1) 2 4.6 6.0 5.3
Shackleton 2 0.004 0.008 0.006 2 <0.002 <0.002 <0.002 2 8.46 8.64 8.55 (1) 2 4.2 4.7 4.5
Southern Cross 2 0.004 0.008 0.006 2 <0.002 <0.002 <0.002 2 7.89 8.30 8.10 2 5.2 5.8 5.5
Spencers Brook 2 <0.003 0.008 0.004 2 <0.002 <0.002 <0.002 2 8.29 8.31 8.30 2 5.1 5.8 5.5
Tammin 2 0.008 0.015 0.012 2 <0.002 <0.002 <0.002 2 7.98 8.00 7.99 2 5.9 6.0 6.0
Toodyay 2 <0.003 0.004 <0.003 2 <0.002 <0.002 <0.002 2 8.06 8.07 8.07 2 5.0 5.3 5.2
Trayning 2 0.008 0.010 0.009 2 <0.002 <0.002 <0.002 2 8.51 8.78 8.65 (1) 2 5.7 6.7 6.2
Warralakin 2 <0.003 0.004 <0.003 2 <0.002 <0.002 <0.002 2 7.96 8.56 8.26 2 6.1 6.3 6.2
Westonia 2 <0.003 0.006 <0.003 2 <0.002 <0.002 <0.002 2 7.89 8.33 8.11 2 6.0 6.3 6.2
Wiluna 2 <0.003 <0.003 <0.003 2 <0.002 <0.002 <0.002 2 7.96 7.99 7.98 2 80.0 85.0 82.5 (2)Wongan Hills 2 0.006 0.020 0.013 2 <0.002 <0.002 <0.002 2 8.30 8.72 8.51 (1) 2 4.5 5.4 5.0
Wubin 2 0.020 0.025 0.023 2 <0.002 <0.002 <0.002 2 8.22 8.68 8.45 2 4.1 5.6 4.9
Wyalkatchem 2 <0.003 0.006 <0.003 2 <0.002 <0.002 <0.002 2 8.32 8.43 8.38 2 4.1 5.6 4.9
York 2 0.008 0.008 0.008 2 <0.002 <0.002 <0.002 2 8.26 8.37 8.32 2 4.6 5.9 5.3
Guideline Met
Samples Taken
Concentration (mg/L)Concentration (mg/L)
1) Elevated pH is a result of the pH adjustment as part of Chloramination (disinfection) process. Experience shows that pH at this level is not objectionable to our customers. (2) Elevated Silica is a naturacharacteristic of the source supplying this locality.
LocalitySamples Taken
Concentration (mg/L) Guideline Met
Samples Taken
Guideline Met
Guideline Met
Samples Taken
Value (pH units)
Table 14 Aesthetic (Non-health related) Variables
Iron Manganese pH Silica
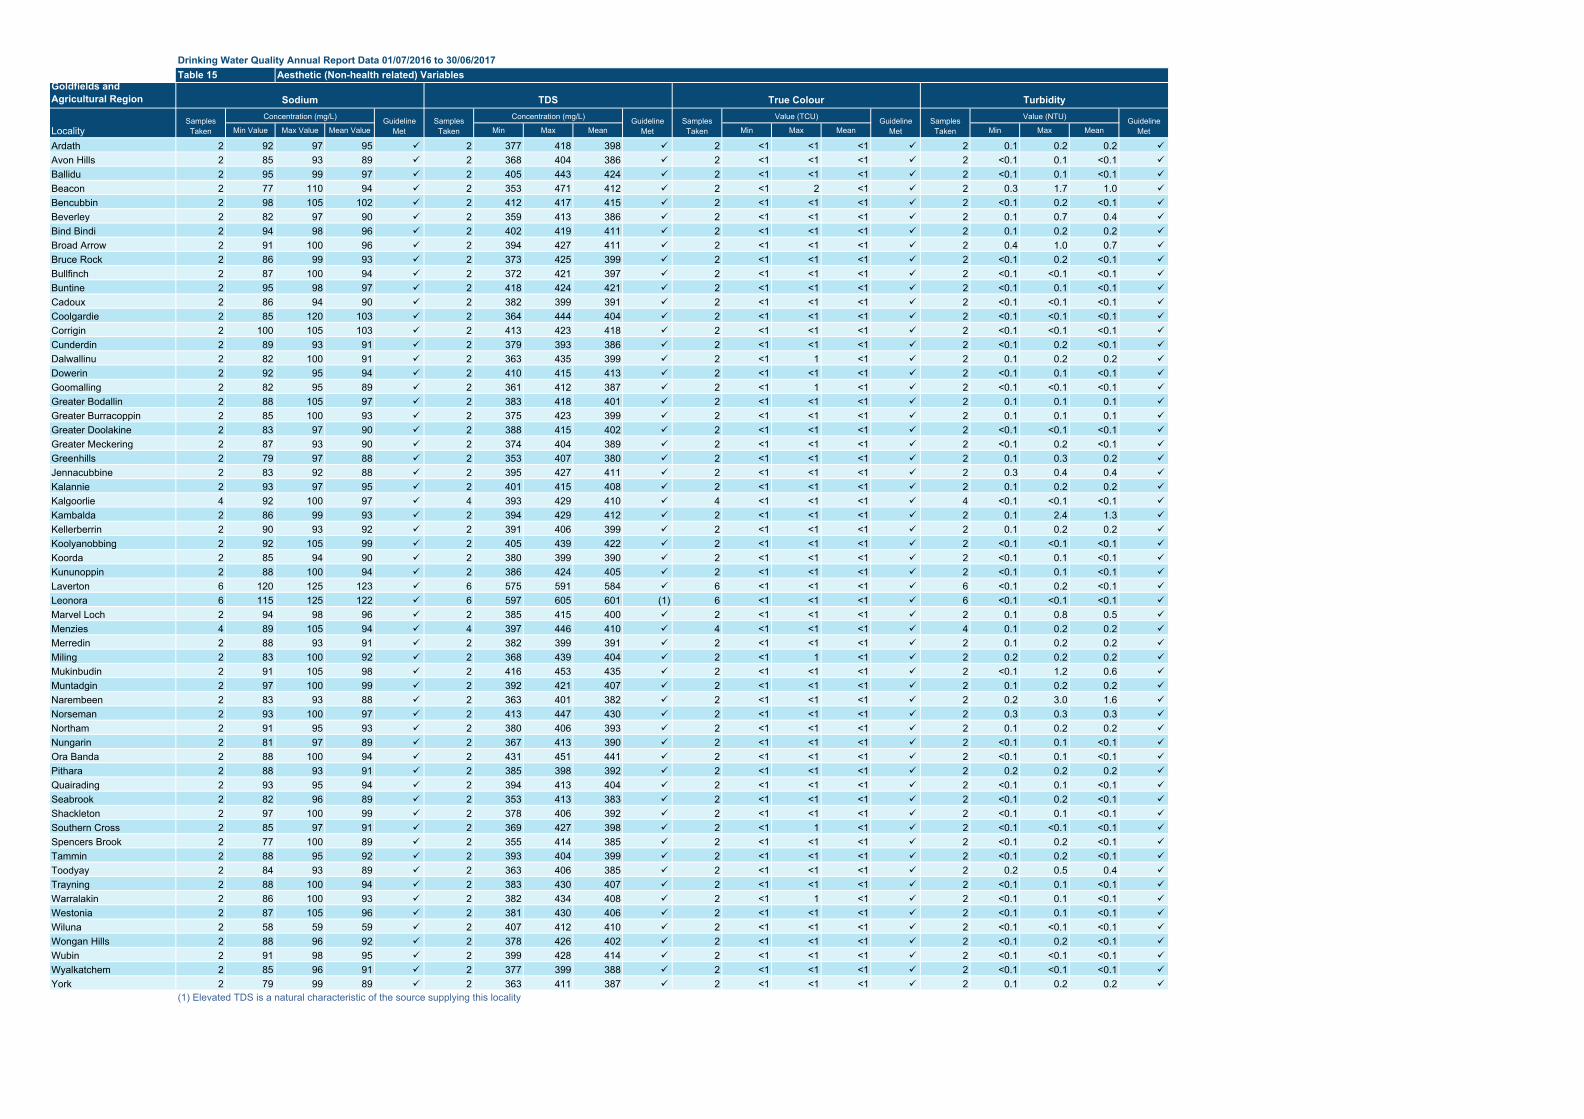
Drinking Water Quality Annual Report Data 01/07/2016 to 30/06/2017
Goldfields and Agricultural Region
Min Value Max Value Mean Value Min Max Mean Min Max Mean Min Max Mean
Ardath 2 92 97 95 2 377 418 398 2 <1 <1 <1 2 0.1 0.2 0.2
Avon Hills 2 85 93 89 2 368 404 386 2 <1 <1 <1 2 <0.1 0.1 <0.1
Ballidu 2 95 99 97 2 405 443 424 2 <1 <1 <1 2 <0.1 0.1 <0.1
Beacon 2 77 110 94 2 353 471 412 2 <1 2 <1 2 0.3 1.7 1.0
Bencubbin 2 98 105 102 2 412 417 415 2 <1 <1 <1 2 <0.1 0.2 <0.1
Beverley 2 82 97 90 2 359 413 386 2 <1 <1 <1 2 0.1 0.7 0.4
Bind Bindi 2 94 98 96 2 402 419 411 2 <1 <1 <1 2 0.1 0.2 0.2
Broad Arrow 2 91 100 96 2 394 427 411 2 <1 <1 <1 2 0.4 1.0 0.7
Bruce Rock 2 86 99 93 2 373 425 399 2 <1 <1 <1 2 <0.1 0.2 <0.1
Bullfinch 2 87 100 94 2 372 421 397 2 <1 <1 <1 2 <0.1 <0.1 <0.1
Buntine 2 95 98 97 2 418 424 421 2 <1 <1 <1 2 <0.1 0.1 <0.1
Cadoux 2 86 94 90 2 382 399 391 2 <1 <1 <1 2 <0.1 <0.1 <0.1
Coolgardie 2 85 120 103 2 364 444 404 2 <1 <1 <1 2 <0.1 <0.1 <0.1
Corrigin 2 100 105 103 2 413 423 418 2 <1 <1 <1 2 <0.1 <0.1 <0.1
Cunderdin 2 89 93 91 2 379 393 386 2 <1 <1 <1 2 <0.1 0.2 <0.1
Dalwallinu 2 82 100 91 2 363 435 399 2 <1 1 <1 2 0.1 0.2 0.2
Dowerin 2 92 95 94 2 410 415 413 2 <1 <1 <1 2 <0.1 0.1 <0.1
Goomalling 2 82 95 89 2 361 412 387 2 <1 1 <1 2 <0.1 <0.1 <0.1
Greater Bodallin 2 88 105 97 2 383 418 401 2 <1 <1 <1 2 0.1 0.1 0.1
Greater Burracoppin 2 85 100 93 2 375 423 399 2 <1 <1 <1 2 0.1 0.1 0.1
Greater Doolakine 2 83 97 90 2 388 415 402 2 <1 <1 <1 2 <0.1 <0.1 <0.1
Greater Meckering 2 87 93 90 2 374 404 389 2 <1 <1 <1 2 <0.1 0.2 <0.1
Greenhills 2 79 97 88 2 353 407 380 2 <1 <1 <1 2 0.1 0.3 0.2
Jennacubbine 2 83 92 88 2 395 427 411 2 <1 <1 <1 2 0.3 0.4 0.4
Kalannie 2 93 97 95 2 401 415 408 2 <1 <1 <1 2 0.1 0.2 0.2
Kalgoorlie 4 92 100 97 4 393 429 410 4 <1 <1 <1 4 <0.1 <0.1 <0.1
Kambalda 2 86 99 93 2 394 429 412 2 <1 <1 <1 2 0.1 2.4 1.3
Kellerberrin 2 90 93 92 2 391 406 399 2 <1 <1 <1 2 0.1 0.2 0.2
Koolyanobbing 2 92 105 99 2 405 439 422 2 <1 <1 <1 2 <0.1 <0.1 <0.1
Koorda 2 85 94 90 2 380 399 390 2 <1 <1 <1 2 <0.1 0.1 <0.1
Kununoppin 2 88 100 94 2 386 424 405 2 <1 <1 <1 2 <0.1 0.1 <0.1
Laverton 6 120 125 123 6 575 591 584 6 <1 <1 <1 6 <0.1 0.2 <0.1
Leonora 6 115 125 122 6 597 605 601 (1) 6 <1 <1 <1 6 <0.1 <0.1 <0.1
Marvel Loch 2 94 98 96 2 385 415 400 2 <1 <1 <1 2 0.1 0.8 0.5
Menzies 4 89 105 94 4 397 446 410 4 <1 <1 <1 4 0.1 0.2 0.2
Merredin 2 88 93 91 2 382 399 391 2 <1 <1 <1 2 0.1 0.2 0.2
Miling 2 83 100 92 2 368 439 404 2 <1 1 <1 2 0.2 0.2 0.2
Mukinbudin 2 91 105 98 2 416 453 435 2 <1 <1 <1 2 <0.1 1.2 0.6
Muntadgin 2 97 100 99 2 392 421 407 2 <1 <1 <1 2 0.1 0.2 0.2
Narembeen 2 83 93 88 2 363 401 382 2 <1 <1 <1 2 0.2 3.0 1.6
Norseman 2 93 100 97 2 413 447 430 2 <1 <1 <1 2 0.3 0.3 0.3
Northam 2 91 95 93 2 380 406 393 2 <1 <1 <1 2 0.1 0.2 0.2
Nungarin 2 81 97 89 2 367 413 390 2 <1 <1 <1 2 <0.1 0.1 <0.1
Ora Banda 2 88 100 94 2 431 451 441 2 <1 <1 <1 2 <0.1 0.1 <0.1
Pithara 2 88 93 91 2 385 398 392 2 <1 <1 <1 2 0.2 0.2 0.2
Quairading 2 93 95 94 2 394 413 404 2 <1 <1 <1 2 <0.1 0.1 <0.1
Seabrook 2 82 96 89 2 353 413 383 2 <1 <1 <1 2 <0.1 0.2 <0.1
Shackleton 2 97 100 99 2 378 406 392 2 <1 <1 <1 2 <0.1 0.1 <0.1
Southern Cross 2 85 97 91 2 369 427 398 2 <1 1 <1 2 <0.1 <0.1 <0.1
Spencers Brook 2 77 100 89 2 355 414 385 2 <1 <1 <1 2 <0.1 0.2 <0.1
Tammin 2 88 95 92 2 393 404 399 2 <1 <1 <1 2 <0.1 0.2 <0.1
Toodyay 2 84 93 89 2 363 406 385 2 <1 <1 <1 2 0.2 0.5 0.4
Trayning 2 88 100 94 2 383 430 407 2 <1 <1 <1 2 <0.1 0.1 <0.1
Warralakin 2 86 100 93 2 382 434 408 2 <1 1 <1 2 <0.1 0.1 <0.1
Westonia 2 87 105 96 2 381 430 406 2 <1 <1 <1 2 <0.1 0.1 <0.1
Wiluna 2 58 59 59 2 407 412 410 2 <1 <1 <1 2 <0.1 <0.1 <0.1
Wongan Hills 2 88 96 92 2 378 426 402 2 <1 <1 <1 2 <0.1 0.2 <0.1
Wubin 2 91 98 95 2 399 428 414 2 <1 <1 <1 2 <0.1 <0.1 <0.1
Wyalkatchem 2 85 96 91 2 377 399 388 2 <1 <1 <1 2 <0.1 <0.1 <0.1
York 2 79 99 89 2 363 411 387 2 <1 <1 <1 2 0.1 0.2 0.2 (1) Elevated TDS is a natural characteristic of the source supplying this locality
Concentration (mg/L) Value (NTU)Guideline Met
Samples Taken
Value (TCU) Guideline Met
Samples TakenLocality
Samples Taken
Concentration (mg/L) Guideline Met
Samples Taken
Guideline Met
Table 15 Aesthetic (Non-health related) Variables
Sodium TDS True Colour Turbidity
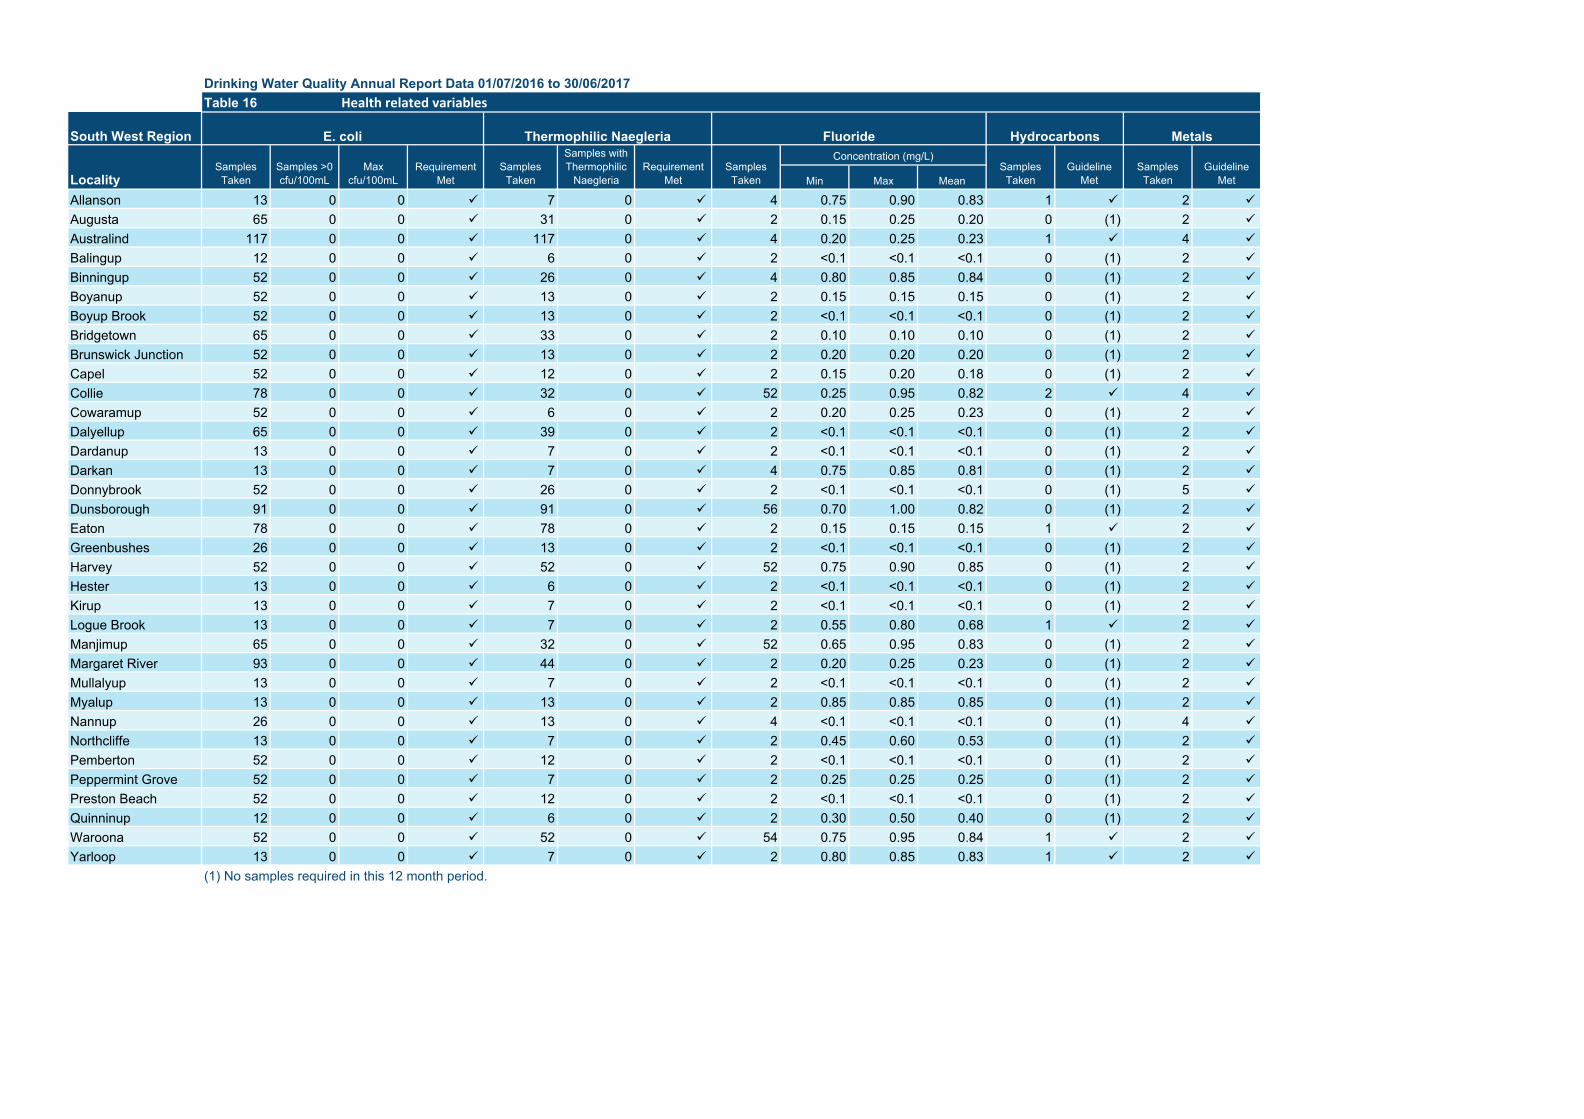
Drinking Water Quality Annual Report Data 01/07/2016 to 30/06/2017
South West Region
Min Max Mean
Allanson 13 0 0 7 0 4 0.75 0.90 0.83 1 2
Augusta 65 0 0 31 0 2 0.15 0.25 0.20 0 (1) 2
Australind 117 0 0 117 0 4 0.20 0.25 0.23 1 4
Balingup 12 0 0 6 0 2 <0.1 <0.1 <0.1 0 (1) 2
Binningup 52 0 0 26 0 4 0.80 0.85 0.84 0 (1) 2
Boyanup 52 0 0 13 0 2 0.15 0.15 0.15 0 (1) 2
Boyup Brook 52 0 0 13 0 2 <0.1 <0.1 <0.1 0 (1) 2
Bridgetown 65 0 0 33 0 2 0.10 0.10 0.10 0 (1) 2
Brunswick Junction 52 0 0 13 0 2 0.20 0.20 0.20 0 (1) 2
Capel 52 0 0 12 0 2 0.15 0.20 0.18 0 (1) 2
Collie 78 0 0 32 0 52 0.25 0.95 0.82 2 4
Cowaramup 52 0 0 6 0 2 0.20 0.25 0.23 0 (1) 2
Dalyellup 65 0 0 39 0 2 <0.1 <0.1 <0.1 0 (1) 2
Dardanup 13 0 0 7 0 2 <0.1 <0.1 <0.1 0 (1) 2
Darkan 13 0 0 7 0 4 0.75 0.85 0.81 0 (1) 2
Donnybrook 52 0 0 26 0 2 <0.1 <0.1 <0.1 0 (1) 5
Dunsborough 91 0 0 91 0 56 0.70 1.00 0.82 0 (1) 2
Eaton 78 0 0 78 0 2 0.15 0.15 0.15 1 2
Greenbushes 26 0 0 13 0 2 <0.1 <0.1 <0.1 0 (1) 2
Harvey 52 0 0 52 0 52 0.75 0.90 0.85 0 (1) 2
Hester 13 0 0 6 0 2 <0.1 <0.1 <0.1 0 (1) 2
Kirup 13 0 0 7 0 2 <0.1 <0.1 <0.1 0 (1) 2
Logue Brook 13 0 0 7 0 2 0.55 0.80 0.68 1 2
Manjimup 65 0 0 32 0 52 0.65 0.95 0.83 0 (1) 2
Margaret River 93 0 0 44 0 2 0.20 0.25 0.23 0 (1) 2
Mullalyup 13 0 0 7 0 2 <0.1 <0.1 <0.1 0 (1) 2
Myalup 13 0 0 13 0 2 0.85 0.85 0.85 0 (1) 2
Nannup 26 0 0 13 0 4 <0.1 <0.1 <0.1 0 (1) 4
Northcliffe 13 0 0 7 0 2 0.45 0.60 0.53 0 (1) 2
Pemberton 52 0 0 12 0 2 <0.1 <0.1 <0.1 0 (1) 2
Peppermint Grove 52 0 0 7 0 2 0.25 0.25 0.25 0 (1) 2
Preston Beach 52 0 0 12 0 2 <0.1 <0.1 <0.1 0 (1) 2
Quinninup 12 0 0 6 0 2 0.30 0.50 0.40 0 (1) 2
Waroona 52 0 0 52 0 54 0.75 0.95 0.84 1 2
Yarloop 13 0 0 7 0 2 0.80 0.85 0.83 1 2
(1) No samples required in this 12 month period.
Samples Taken
Table 16 Health related variables
E. coli Thermophilic Naegleria Fluoride Hydrocarbons Metals
LocalitySamples
TakenSamples >0 cfu/100mL
Max cfu/100mL
Requirement Met
Samples Taken
Guideline Met
Samples with Thermophilic
NaegleriaRequirement
MetSamples
Taken
Concentration (mg/L)Samples
TakenGuideline
Met

Drinking Water Quality Annual Report Data 01/07/2016 to 30/06/2017
South West Region
Min Max Mean Min Max Mean
Allanson 2 <0.22 0.44 <0.22 1 0 (1) 2 0.110 0.140 0.125 1
Augusta 4 <0.22 <0.22 <0.22 1 2 2 0.017 0.018 0.018 0 (1)Australind 8 <0.22 <0.22 <0.22 2 4 4 0.004 0.064 0.033 0 (1)Balingup 2 <0.22 0.44 <0.22 1 0 (1) 2 0.093 0.190 0.142 0 (1)Binningup 2 <0.22 <0.22 <0.22 1 2 2 <0.001 <0.001 <0.001 0 (1)Boyanup 2 <0.22 <0.22 <0.22 1 0 (1) 2 <0.001 0.002 <0.001 0 (1)Boyup Brook 4 <0.22 0.44 0.44 1 2 4 0.081 0.160 0.119 0 (1)Bridgetown 2 0.44 0.44 0.44 1 0 (1) 2 0.023 0.064 0.044 0 (1)Brunswick Junction 3 <0.22 <0.22 <0.22 1 2 2 0.009 0.014 0.012 0 (1)Capel 4 <0.22 <0.22 <0.22 1 2 2 <0.001 <0.001 <0.001 0 (1)Collie 4 <0.22 0.44 <0.22 2 0 (1) 4 0.100 0.130 0.113 2
Cowaramup 4 <0.22 <0.22 <0.22 1 0 (1) 4 0.100 0.180 0.128 0 (1)Dalyellup 3 <0.22 <0.22 <0.22 1 2 2 0.023 0.057 0.040 0 (1)Dardanup 2 <0.22 0.44 <0.22 1 0 (1) 2 <0.001 0.002 <0.001 0 (1)Darkan 2 0.44 0.44 0.44 1 2 4 0.140 0.190 0.173 1
Donnybrook 4 15.03 18.12 16.8 1 1 2 0.003 0.004 0.004 0 (1)Dunsborough 4 <0.22 0.44 <0.22 1 1 2 0.024 0.034 0.029 0 (1)Eaton 2 <0.22 <0.22 <0.22 1 0 (1) 2 <0.001 <0.001 <0.001 1
Greenbushes 4 <0.22 0.44 <0.22 1 2 2 0.075 0.130 0.103 0 (1)Harvey 2 <0.22 <0.22 <0.22 1 0 (1) 2 <0.001 <0.001 <0.001 0 (1)Hester 2 <0.22 0.44 <0.22 1 2 2 0.062 0.071 0.067 0 (1)Kirup 4 <0.22 20.77 5.30 1 0 (1) 2 0.051 0.110 0.081 0 (1)Logue Brook 2 <0.22 4.42 2.21 1 2 2 <0.001 0.005 0.003 0 (1)Manjimup 3 <0.22 <0.22 <0.22 4 0 (1) 2 0.046 0.120 0.083 0 (1)Margaret River 4 <0.22 <0.22 <0.22 1 1 2 0.120 0.130 0.125 0 (1)Mullalyup 2 <0.22 0.44 <0.22 1 2 2 0.047 0.089 0.068 0 (1)Myalup 2 <0.22 <0.22 <0.22 1 1 2 0.004 0.006 0.005 0 (1)Nannup 8 <0.22 0.44 <0.22 2 0 (1) 4 0.043 0.074 0.059 0 (1)Northcliffe 4 0.44 1.77 0.88 1 0 (1) 2 0.048 0.072 0.060 0 (1)Pemberton 2 1.33 1.77 1.77 4 2 2 0.066 0.120 0.093 0 (1)Peppermint Grove 4 <0.22 <0.22 <0.22 1 2 2 <0.001 <0.001 <0.001 0 (1)Preston Beach 4 3.98 5.30 4.86 1 2 4 0.100 0.130 0.113 0 (1)Quinninup 4 0.44 1.33 0.88 1 2 4 0.067 0.120 0.098 0 (1)Waroona 2 <0.22 <0.22 <0.22 1 0 (1) 4 <0.001 0.055 0.021 0 (1)Yarloop 2 <0.22 <0.22 <0.22 1 0 (1) 2 <0.001 0.008 0.004 1
(1) No samples required in this 12 month period.ǂ Nitrate data is converted from laboratory analysis reported as "Nitrate plus Nitrite as Nitrogen" based on the assumption that all nitrite is converted to nitrate under oxidative conditions during sampling.
Guideline Met
Table 17 Health related variables
Nitrateǂ Pesticides Radiological Trihalomethanes Other Health Related
LocalitySamples
Taken
Concentration (mg/L)
Guideline MetSamples
TakenRequirement
MetSamples
TakenGuideline
MetSamples
Taken
Concentration (mg/L) Guideline Met
Samples Taken
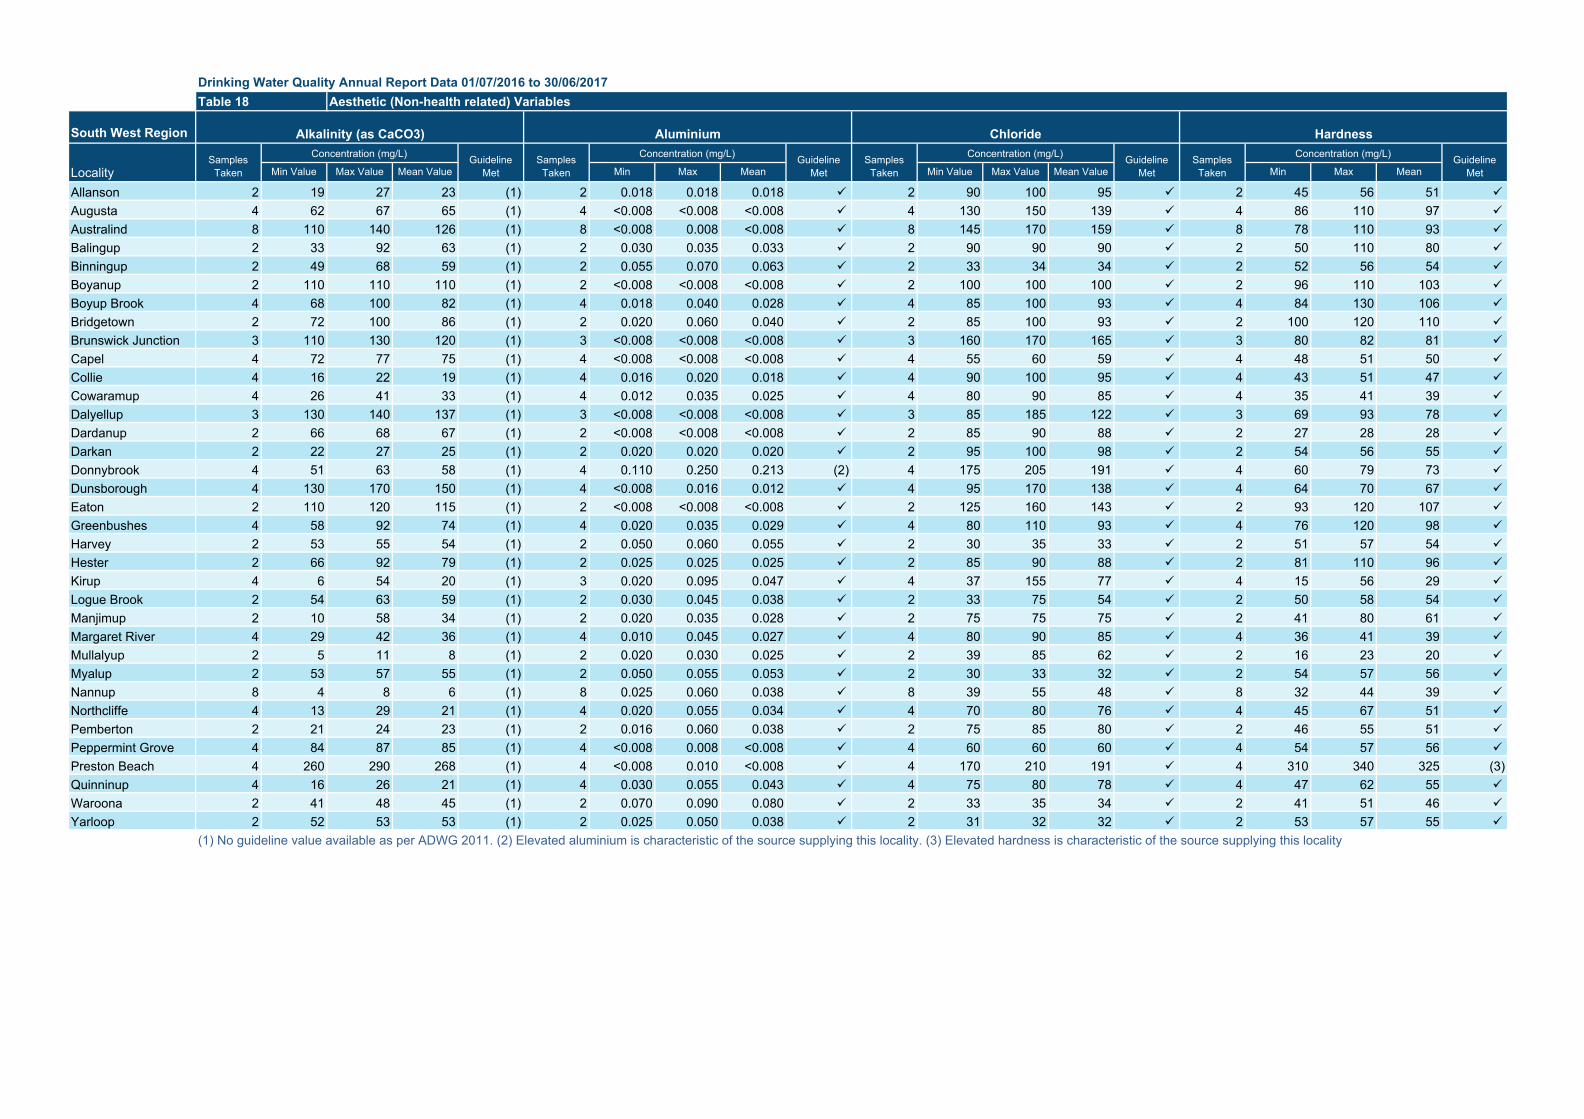
Drinking Water Quality Annual Report Data 01/07/2016 to 30/06/2017
South West Region
Min Value Max Value Mean Value Min Max Mean Min Value Max Value Mean Value Min Max Mean
Allanson 2 19 27 23 (1) 2 0.018 0.018 0.018 2 90 100 95 2 45 56 51
Augusta 4 62 67 65 (1) 4 <0.008 <0.008 <0.008 4 130 150 139 4 86 110 97
Australind 8 110 140 126 (1) 8 <0.008 0.008 <0.008 8 145 170 159 8 78 110 93
Balingup 2 33 92 63 (1) 2 0.030 0.035 0.033 2 90 90 90 2 50 110 80
Binningup 2 49 68 59 (1) 2 0.055 0.070 0.063 2 33 34 34 2 52 56 54
Boyanup 2 110 110 110 (1) 2 <0.008 <0.008 <0.008 2 100 100 100 2 96 110 103
Boyup Brook 4 68 100 82 (1) 4 0.018 0.040 0.028 4 85 100 93 4 84 130 106
Bridgetown 2 72 100 86 (1) 2 0.020 0.060 0.040 2 85 100 93 2 100 120 110
Brunswick Junction 3 110 130 120 (1) 3 <0.008 <0.008 <0.008 3 160 170 165 3 80 82 81
Capel 4 72 77 75 (1) 4 <0.008 <0.008 <0.008 4 55 60 59 4 48 51 50
Collie 4 16 22 19 (1) 4 0.016 0.020 0.018 4 90 100 95 4 43 51 47
Cowaramup 4 26 41 33 (1) 4 0.012 0.035 0.025 4 80 90 85 4 35 41 39
Dalyellup 3 130 140 137 (1) 3 <0.008 <0.008 <0.008 3 85 185 122 3 69 93 78
Dardanup 2 66 68 67 (1) 2 <0.008 <0.008 <0.008 2 85 90 88 2 27 28 28
Darkan 2 22 27 25 (1) 2 0.020 0.020 0.020 2 95 100 98 2 54 56 55
Donnybrook 4 51 63 58 (1) 4 0.110 0.250 0.213 (2) 4 175 205 191 4 60 79 73
Dunsborough 4 130 170 150 (1) 4 <0.008 0.016 0.012 4 95 170 138 4 64 70 67
Eaton 2 110 120 115 (1) 2 <0.008 <0.008 <0.008 2 125 160 143 2 93 120 107
Greenbushes 4 58 92 74 (1) 4 0.020 0.035 0.029 4 80 110 93 4 76 120 98
Harvey 2 53 55 54 (1) 2 0.050 0.060 0.055 2 30 35 33 2 51 57 54
Hester 2 66 92 79 (1) 2 0.025 0.025 0.025 2 85 90 88 2 81 110 96
Kirup 4 6 54 20 (1) 3 0.020 0.095 0.047 4 37 155 77 4 15 56 29
Logue Brook 2 54 63 59 (1) 2 0.030 0.045 0.038 2 33 75 54 2 50 58 54
Manjimup 2 10 58 34 (1) 2 0.020 0.035 0.028 2 75 75 75 2 41 80 61
Margaret River 4 29 42 36 (1) 4 0.010 0.045 0.027 4 80 90 85 4 36 41 39
Mullalyup 2 5 11 8 (1) 2 0.020 0.030 0.025 2 39 85 62 2 16 23 20
Myalup 2 53 57 55 (1) 2 0.050 0.055 0.053 2 30 33 32 2 54 57 56
Nannup 8 4 8 6 (1) 8 0.025 0.060 0.038 8 39 55 48 8 32 44 39
Northcliffe 4 13 29 21 (1) 4 0.020 0.055 0.034 4 70 80 76 4 45 67 51
Pemberton 2 21 24 23 (1) 2 0.016 0.060 0.038 2 75 85 80 2 46 55 51
Peppermint Grove 4 84 87 85 (1) 4 <0.008 0.008 <0.008 4 60 60 60 4 54 57 56
Preston Beach 4 260 290 268 (1) 4 <0.008 0.010 <0.008 4 170 210 191 4 310 340 325 (3)Quinninup 4 16 26 21 (1) 4 0.030 0.055 0.043 4 75 80 78 4 47 62 55
Waroona 2 41 48 45 (1) 2 0.070 0.090 0.080 2 33 35 34 2 41 51 46
Yarloop 2 52 53 53 (1) 2 0.025 0.050 0.038 2 31 32 32 2 53 57 55
(1) No guideline value available as per ADWG 2011. (2) Elevated aluminium is characteristic of the source supplying this locality. (3) Elevated hardness is characteristic of the source supplying this locality
LocalitySamples
Taken
Concentration (mg/L) Guideline Met
Samples Taken
Table 18 Aesthetic (Non-health related) Variables
Alkalinity (as CaCO3) Aluminium Chloride Hardness
Guideline Met
Guideline Met
Samples Taken
Concentration (mg/L) Guideline Met
Samples Taken
Concentration (mg/L)Concentration (mg/L)
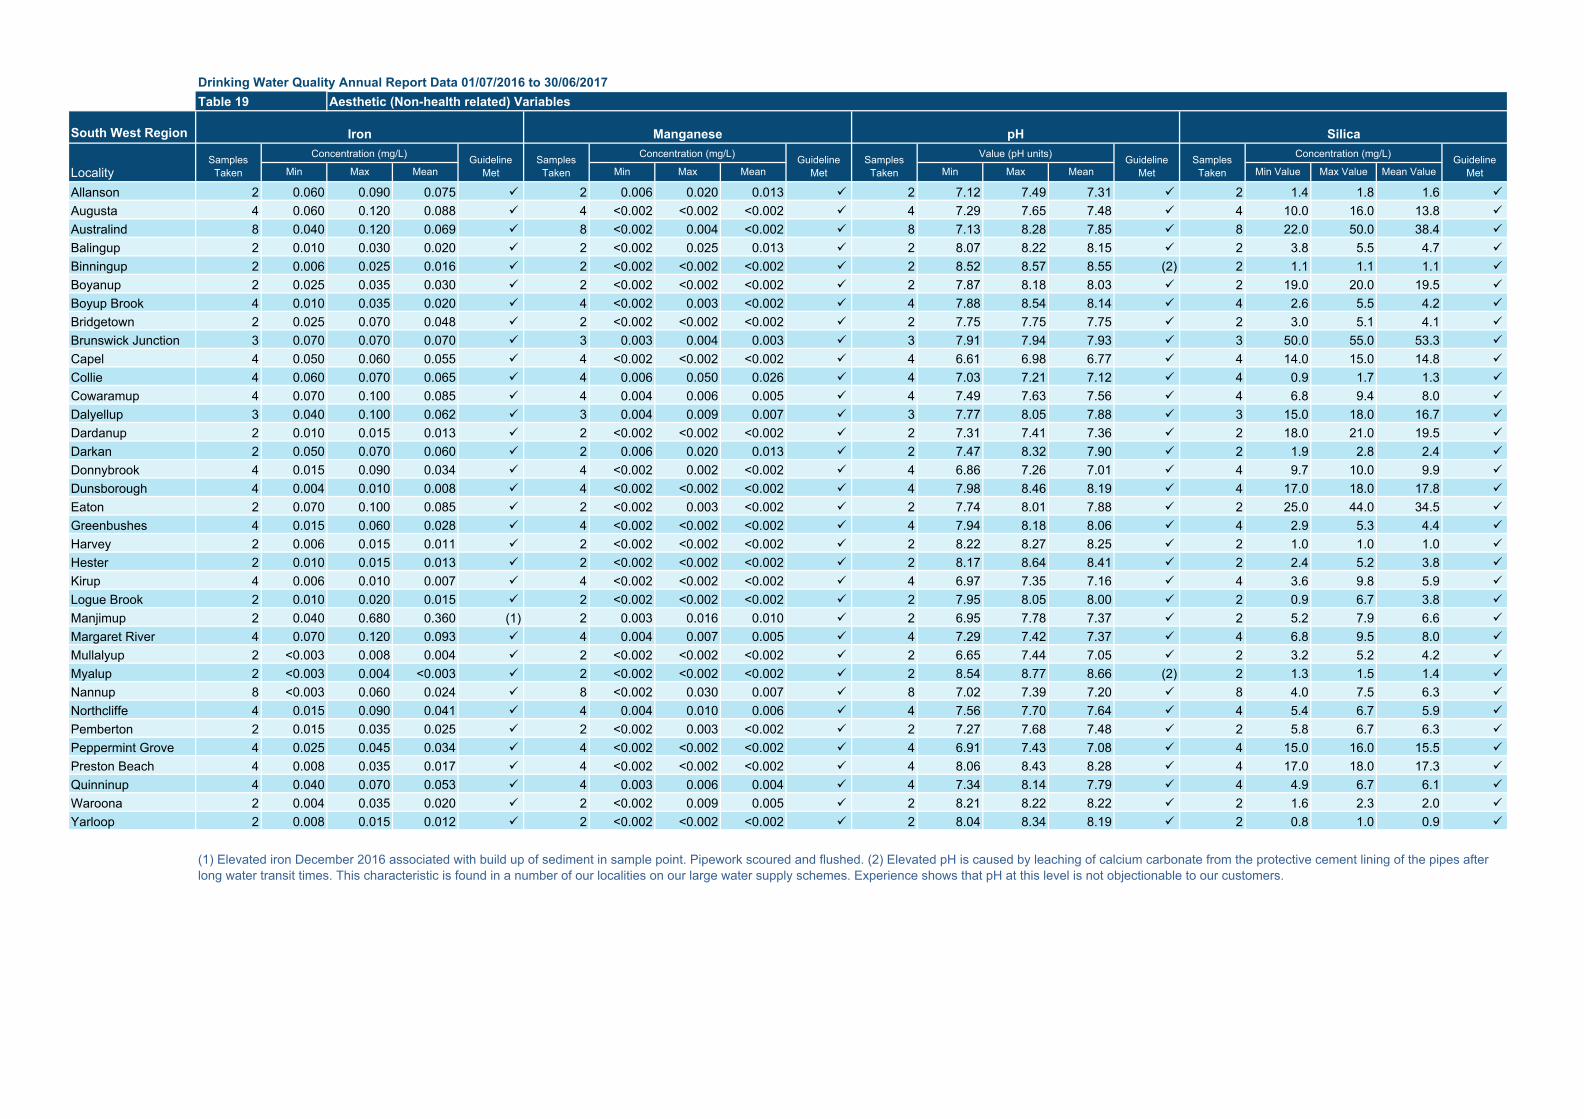
Drinking Water Quality Annual Report Data 01/07/2016 to 30/06/2017
South West Region
Min Max Mean Min Max Mean Min Max Mean Min Value Max Value Mean Value
Allanson 2 0.060 0.090 0.075 2 0.006 0.020 0.013 2 7.12 7.49 7.31 2 1.4 1.8 1.6
Augusta 4 0.060 0.120 0.088 4 <0.002 <0.002 <0.002 4 7.29 7.65 7.48 4 10.0 16.0 13.8
Australind 8 0.040 0.120 0.069 8 <0.002 0.004 <0.002 8 7.13 8.28 7.85 8 22.0 50.0 38.4
Balingup 2 0.010 0.030 0.020 2 <0.002 0.025 0.013 2 8.07 8.22 8.15 2 3.8 5.5 4.7
Binningup 2 0.006 0.025 0.016 2 <0.002 <0.002 <0.002 2 8.52 8.57 8.55 (2) 2 1.1 1.1 1.1
Boyanup 2 0.025 0.035 0.030 2 <0.002 <0.002 <0.002 2 7.87 8.18 8.03 2 19.0 20.0 19.5
Boyup Brook 4 0.010 0.035 0.020 4 <0.002 0.003 <0.002 4 7.88 8.54 8.14 4 2.6 5.5 4.2
Bridgetown 2 0.025 0.070 0.048 2 <0.002 <0.002 <0.002 2 7.75 7.75 7.75 2 3.0 5.1 4.1
Brunswick Junction 3 0.070 0.070 0.070 3 0.003 0.004 0.003 3 7.91 7.94 7.93 3 50.0 55.0 53.3
Capel 4 0.050 0.060 0.055 4 <0.002 <0.002 <0.002 4 6.61 6.98 6.77 4 14.0 15.0 14.8
Collie 4 0.060 0.070 0.065 4 0.006 0.050 0.026 4 7.03 7.21 7.12 4 0.9 1.7 1.3
Cowaramup 4 0.070 0.100 0.085 4 0.004 0.006 0.005 4 7.49 7.63 7.56 4 6.8 9.4 8.0
Dalyellup 3 0.040 0.100 0.062 3 0.004 0.009 0.007 3 7.77 8.05 7.88 3 15.0 18.0 16.7
Dardanup 2 0.010 0.015 0.013 2 <0.002 <0.002 <0.002 2 7.31 7.41 7.36 2 18.0 21.0 19.5
Darkan 2 0.050 0.070 0.060 2 0.006 0.020 0.013 2 7.47 8.32 7.90 2 1.9 2.8 2.4
Donnybrook 4 0.015 0.090 0.034 4 <0.002 0.002 <0.002 4 6.86 7.26 7.01 4 9.7 10.0 9.9
Dunsborough 4 0.004 0.010 0.008 4 <0.002 <0.002 <0.002 4 7.98 8.46 8.19 4 17.0 18.0 17.8
Eaton 2 0.070 0.100 0.085 2 <0.002 0.003 <0.002 2 7.74 8.01 7.88 2 25.0 44.0 34.5
Greenbushes 4 0.015 0.060 0.028 4 <0.002 <0.002 <0.002 4 7.94 8.18 8.06 4 2.9 5.3 4.4
Harvey 2 0.006 0.015 0.011 2 <0.002 <0.002 <0.002 2 8.22 8.27 8.25 2 1.0 1.0 1.0
Hester 2 0.010 0.015 0.013 2 <0.002 <0.002 <0.002 2 8.17 8.64 8.41 2 2.4 5.2 3.8
Kirup 4 0.006 0.010 0.007 4 <0.002 <0.002 <0.002 4 6.97 7.35 7.16 4 3.6 9.8 5.9
Logue Brook 2 0.010 0.020 0.015 2 <0.002 <0.002 <0.002 2 7.95 8.05 8.00 2 0.9 6.7 3.8
Manjimup 2 0.040 0.680 0.360 (1) 2 0.003 0.016 0.010 2 6.95 7.78 7.37 2 5.2 7.9 6.6
Margaret River 4 0.070 0.120 0.093 4 0.004 0.007 0.005 4 7.29 7.42 7.37 4 6.8 9.5 8.0
Mullalyup 2 <0.003 0.008 0.004 2 <0.002 <0.002 <0.002 2 6.65 7.44 7.05 2 3.2 5.2 4.2
Myalup 2 <0.003 0.004 <0.003 2 <0.002 <0.002 <0.002 2 8.54 8.77 8.66 (2) 2 1.3 1.5 1.4
Nannup 8 <0.003 0.060 0.024 8 <0.002 0.030 0.007 8 7.02 7.39 7.20 8 4.0 7.5 6.3
Northcliffe 4 0.015 0.090 0.041 4 0.004 0.010 0.006 4 7.56 7.70 7.64 4 5.4 6.7 5.9
Pemberton 2 0.015 0.035 0.025 2 <0.002 0.003 <0.002 2 7.27 7.68 7.48 2 5.8 6.7 6.3
Peppermint Grove 4 0.025 0.045 0.034 4 <0.002 <0.002 <0.002 4 6.91 7.43 7.08 4 15.0 16.0 15.5
Preston Beach 4 0.008 0.035 0.017 4 <0.002 <0.002 <0.002 4 8.06 8.43 8.28 4 17.0 18.0 17.3
Quinninup 4 0.040 0.070 0.053 4 0.003 0.006 0.004 4 7.34 8.14 7.79 4 4.9 6.7 6.1
Waroona 2 0.004 0.035 0.020 2 <0.002 0.009 0.005 2 8.21 8.22 8.22 2 1.6 2.3 2.0
Yarloop 2 0.008 0.015 0.012 2 <0.002 <0.002 <0.002 2 8.04 8.34 8.19 2 0.8 1.0 0.9
Guideline Met
Guideline Met
Samples Taken
Value (pH units) Guideline Met
Samples Taken
Concentration (mg/L)Concentration (mg/L)
(1) Elevated iron December 2016 associated with build up of sediment in sample point. Pipework scoured and flushed. (2) Elevated pH is caused by leaching of calcium carbonate from the protective cement lining of the pipes after long water transit times. This characteristic is found in a number of our localities on our large water supply schemes. Experience shows that pH at this level is not objectionable to our customers.
LocalitySamples
Taken
Concentration (mg/L) Guideline Met
Samples Taken
Table 19 Aesthetic (Non-health related) Variables
Iron Manganese pH Silica
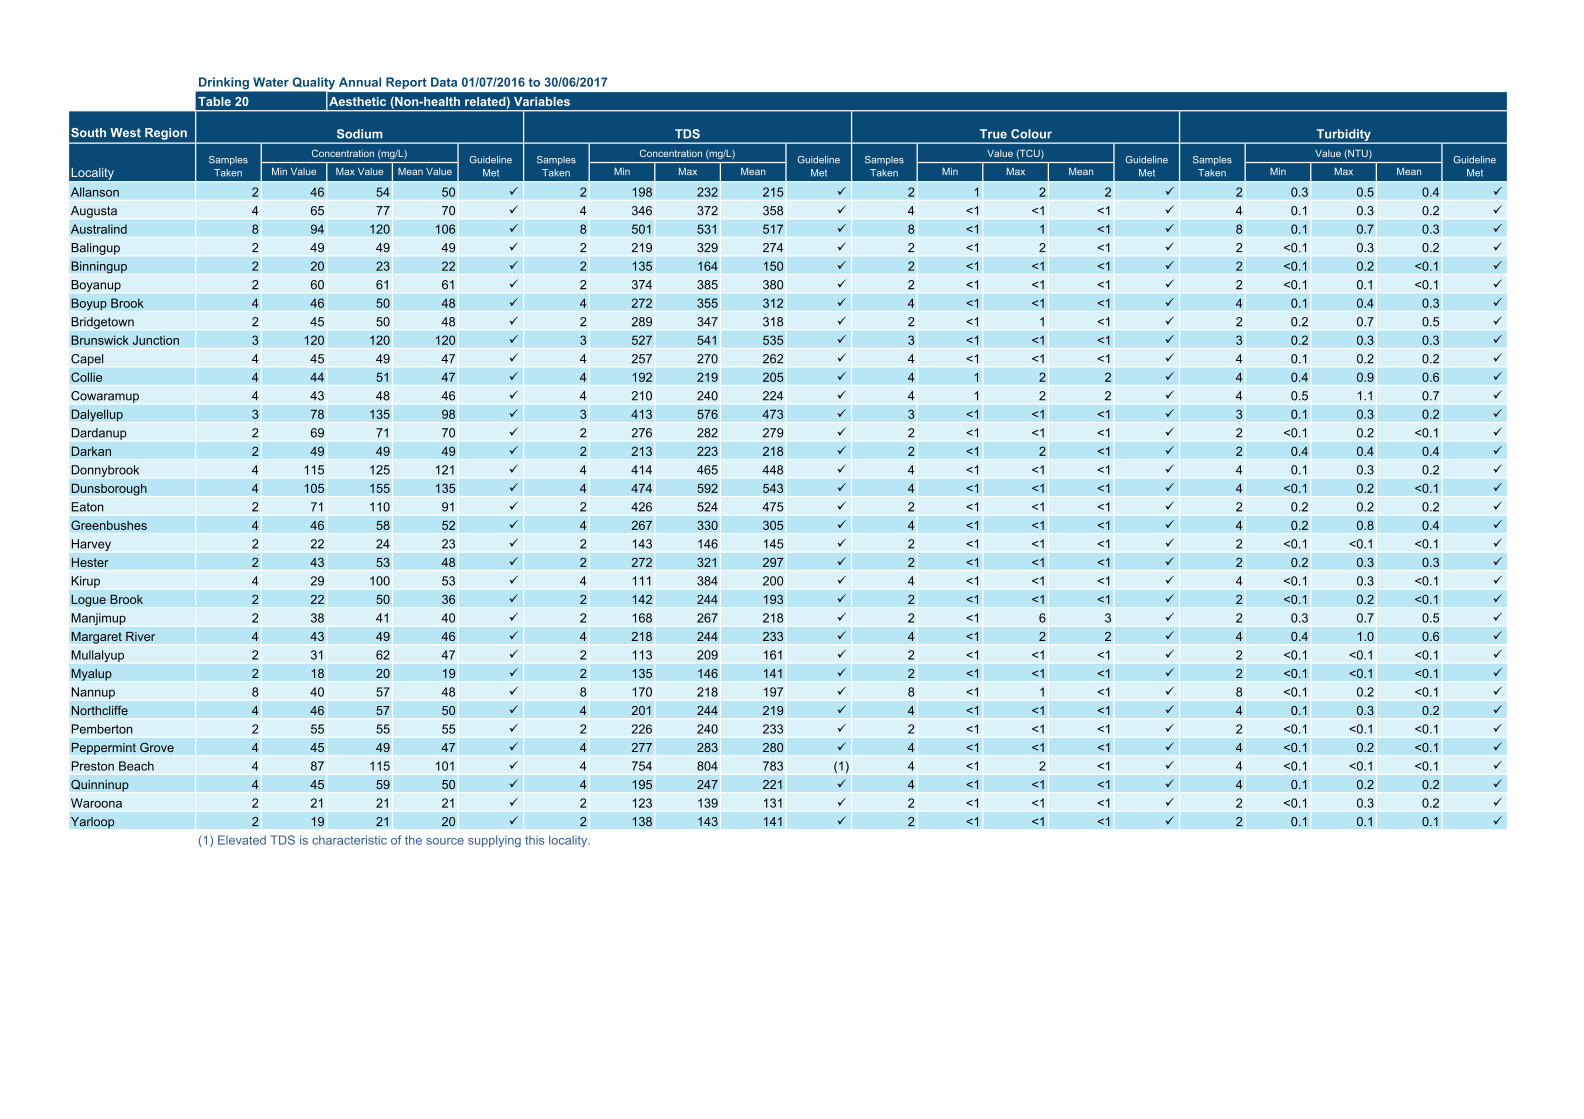
Drinking Water Quality Annual Report Data 01/07/2016 to 30/06/2017
South West Region
Min Value Max Value Mean Value Min Max Mean Min Max Mean Min Max Mean
Allanson 2 46 54 50 2 198 232 215 2 1 2 2 2 0.3 0.5 0.4
Augusta 4 65 77 70 4 346 372 358 4 <1 <1 <1 4 0.1 0.3 0.2
Australind 8 94 120 106 8 501 531 517 8 <1 1 <1 8 0.1 0.7 0.3
Balingup 2 49 49 49 2 219 329 274 2 <1 2 <1 2 <0.1 0.3 0.2
Binningup 2 20 23 22 2 135 164 150 2 <1 <1 <1 2 <0.1 0.2 <0.1
Boyanup 2 60 61 61 2 374 385 380 2 <1 <1 <1 2 <0.1 0.1 <0.1
Boyup Brook 4 46 50 48 4 272 355 312 4 <1 <1 <1 4 0.1 0.4 0.3
Bridgetown 2 45 50 48 2 289 347 318 2 <1 1 <1 2 0.2 0.7 0.5
Brunswick Junction 3 120 120 120 3 527 541 535 3 <1 <1 <1 3 0.2 0.3 0.3
Capel 4 45 49 47 4 257 270 262 4 <1 <1 <1 4 0.1 0.2 0.2
Collie 4 44 51 47 4 192 219 205 4 1 2 2 4 0.4 0.9 0.6
Cowaramup 4 43 48 46 4 210 240 224 4 1 2 2 4 0.5 1.1 0.7
Dalyellup 3 78 135 98 3 413 576 473 3 <1 <1 <1 3 0.1 0.3 0.2
Dardanup 2 69 71 70 2 276 282 279 2 <1 <1 <1 2 <0.1 0.2 <0.1
Darkan 2 49 49 49 2 213 223 218 2 <1 2 <1 2 0.4 0.4 0.4
Donnybrook 4 115 125 121 4 414 465 448 4 <1 <1 <1 4 0.1 0.3 0.2
Dunsborough 4 105 155 135 4 474 592 543 4 <1 <1 <1 4 <0.1 0.2 <0.1
Eaton 2 71 110 91 2 426 524 475 2 <1 <1 <1 2 0.2 0.2 0.2
Greenbushes 4 46 58 52 4 267 330 305 4 <1 <1 <1 4 0.2 0.8 0.4
Harvey 2 22 24 23 2 143 146 145 2 <1 <1 <1 2 <0.1 <0.1 <0.1
Hester 2 43 53 48 2 272 321 297 2 <1 <1 <1 2 0.2 0.3 0.3
Kirup 4 29 100 53 4 111 384 200 4 <1 <1 <1 4 <0.1 0.3 <0.1
Logue Brook 2 22 50 36 2 142 244 193 2 <1 <1 <1 2 <0.1 0.2 <0.1
Manjimup 2 38 41 40 2 168 267 218 2 <1 6 3 2 0.3 0.7 0.5
Margaret River 4 43 49 46 4 218 244 233 4 <1 2 2 4 0.4 1.0 0.6
Mullalyup 2 31 62 47 2 113 209 161 2 <1 <1 <1 2 <0.1 <0.1 <0.1
Myalup 2 18 20 19 2 135 146 141 2 <1 <1 <1 2 <0.1 <0.1 <0.1
Nannup 8 40 57 48 8 170 218 197 8 <1 1 <1 8 <0.1 0.2 <0.1
Northcliffe 4 46 57 50 4 201 244 219 4 <1 <1 <1 4 0.1 0.3 0.2
Pemberton 2 55 55 55 2 226 240 233 2 <1 <1 <1 2 <0.1 <0.1 <0.1
Peppermint Grove 4 45 49 47 4 277 283 280 4 <1 <1 <1 4 <0.1 0.2 <0.1
Preston Beach 4 87 115 101 4 754 804 783 (1) 4 <1 2 <1 4 <0.1 <0.1 <0.1
Quinninup 4 45 59 50 4 195 247 221 4 <1 <1 <1 4 0.1 0.2 0.2
Waroona 2 21 21 21 2 123 139 131 2 <1 <1 <1 2 <0.1 0.3 0.2
Yarloop 2 19 21 20 2 138 143 141 2 <1 <1 <1 2 0.1 0.1 0.1
(1) Elevated TDS is characteristic of the source supplying this locality.
Concentration (mg/L) Guideline Met
Value (NTU)Guideline Met
Samples Taken
Value (TCU) Guideline Met
Samples TakenLocality
Samples Taken
Concentration (mg/L) Guideline Met
Samples Taken
Table 20 Aesthetic (Non-health related) Variables
Sodium TDS True Colour Turbidity
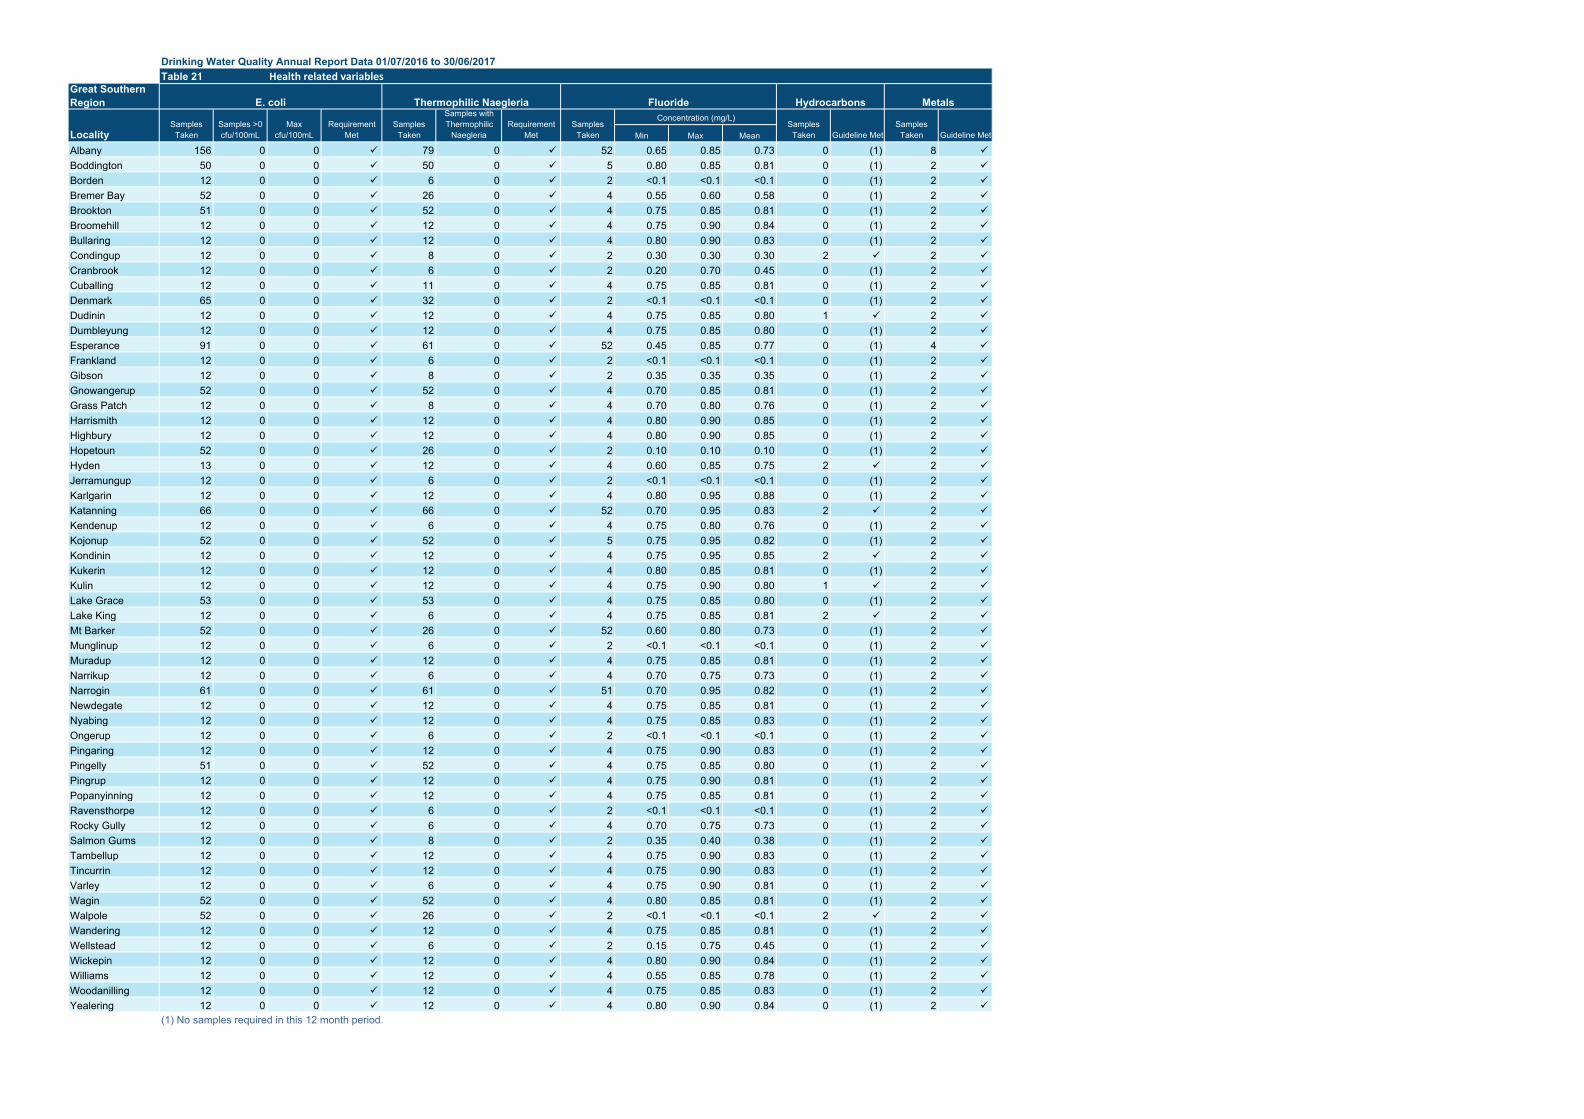
Drinking Water Quality Annual Report Data 01/07/2016 to 30/06/2017
Great Southern Region
Min Max Mean
Albany 156 0 0 79 0 52 0.65 0.85 0.73 0 (1) 8
Boddington 50 0 0 50 0 5 0.80 0.85 0.81 0 (1) 2
Borden 12 0 0 6 0 2 <0.1 <0.1 <0.1 0 (1) 2
Bremer Bay 52 0 0 26 0 4 0.55 0.60 0.58 0 (1) 2
Brookton 51 0 0 52 0 4 0.75 0.85 0.81 0 (1) 2
Broomehill 12 0 0 12 0 4 0.75 0.90 0.84 0 (1) 2
Bullaring 12 0 0 12 0 4 0.80 0.90 0.83 0 (1) 2
Condingup 12 0 0 8 0 2 0.30 0.30 0.30 2 2
Cranbrook 12 0 0 6 0 2 0.20 0.70 0.45 0 (1) 2
Cuballing 12 0 0 11 0 4 0.75 0.85 0.81 0 (1) 2
Denmark 65 0 0 32 0 2 <0.1 <0.1 <0.1 0 (1) 2
Dudinin 12 0 0 12 0 4 0.75 0.85 0.80 1 2
Dumbleyung 12 0 0 12 0 4 0.75 0.85 0.80 0 (1) 2
Esperance 91 0 0 61 0 52 0.45 0.85 0.77 0 (1) 4
Frankland 12 0 0 6 0 2 <0.1 <0.1 <0.1 0 (1) 2
Gibson 12 0 0 8 0 2 0.35 0.35 0.35 0 (1) 2
Gnowangerup 52 0 0 52 0 4 0.70 0.85 0.81 0 (1) 2
Grass Patch 12 0 0 8 0 4 0.70 0.80 0.76 0 (1) 2
Harrismith 12 0 0 12 0 4 0.80 0.90 0.85 0 (1) 2
Highbury 12 0 0 12 0 4 0.80 0.90 0.85 0 (1) 2
Hopetoun 52 0 0 26 0 2 0.10 0.10 0.10 0 (1) 2
Hyden 13 0 0 12 0 4 0.60 0.85 0.75 2 2
Jerramungup 12 0 0 6 0 2 <0.1 <0.1 <0.1 0 (1) 2
Karlgarin 12 0 0 12 0 4 0.80 0.95 0.88 0 (1) 2
Katanning 66 0 0 66 0 52 0.70 0.95 0.83 2 2
Kendenup 12 0 0 6 0 4 0.75 0.80 0.76 0 (1) 2
Kojonup 52 0 0 52 0 5 0.75 0.95 0.82 0 (1) 2
Kondinin 12 0 0 12 0 4 0.75 0.95 0.85 2 2
Kukerin 12 0 0 12 0 4 0.80 0.85 0.81 0 (1) 2
Kulin 12 0 0 12 0 4 0.75 0.90 0.80 1 2
Lake Grace 53 0 0 53 0 4 0.75 0.85 0.80 0 (1) 2
Lake King 12 0 0 6 0 4 0.75 0.85 0.81 2 2
Mt Barker 52 0 0 26 0 52 0.60 0.80 0.73 0 (1) 2
Munglinup 12 0 0 6 0 2 <0.1 <0.1 <0.1 0 (1) 2
Muradup 12 0 0 12 0 4 0.75 0.85 0.81 0 (1) 2
Narrikup 12 0 0 6 0 4 0.70 0.75 0.73 0 (1) 2
Narrogin 61 0 0 61 0 51 0.70 0.95 0.82 0 (1) 2
Newdegate 12 0 0 12 0 4 0.75 0.85 0.81 0 (1) 2
Nyabing 12 0 0 12 0 4 0.75 0.85 0.83 0 (1) 2
Ongerup 12 0 0 6 0 2 <0.1 <0.1 <0.1 0 (1) 2
Pingaring 12 0 0 12 0 4 0.75 0.90 0.83 0 (1) 2
Pingelly 51 0 0 52 0 4 0.75 0.85 0.80 0 (1) 2
Pingrup 12 0 0 12 0 4 0.75 0.90 0.81 0 (1) 2
Popanyinning 12 0 0 12 0 4 0.75 0.85 0.81 0 (1) 2
Ravensthorpe 12 0 0 6 0 2 <0.1 <0.1 <0.1 0 (1) 2
Rocky Gully 12 0 0 6 0 4 0.70 0.75 0.73 0 (1) 2
Salmon Gums 12 0 0 8 0 2 0.35 0.40 0.38 0 (1) 2
Tambellup 12 0 0 12 0 4 0.75 0.90 0.83 0 (1) 2
Tincurrin 12 0 0 12 0 4 0.75 0.90 0.83 0 (1) 2
Varley 12 0 0 6 0 4 0.75 0.90 0.81 0 (1) 2
Wagin 52 0 0 52 0 4 0.80 0.85 0.81 0 (1) 2
Walpole 52 0 0 26 0 2 <0.1 <0.1 <0.1 2 2
Wandering 12 0 0 12 0 4 0.75 0.85 0.81 0 (1) 2
Wellstead 12 0 0 6 0 2 0.15 0.75 0.45 0 (1) 2
Wickepin 12 0 0 12 0 4 0.80 0.90 0.84 0 (1) 2
Williams 12 0 0 12 0 4 0.55 0.85 0.78 0 (1) 2
Woodanilling 12 0 0 12 0 4 0.75 0.85 0.83 0 (1) 2
Yealering 12 0 0 12 0 4 0.80 0.90 0.84 0 (1) 2 (1) No samples required in this 12 month period.
Samples Taken
Table 21 Health related variables
E. coli Thermophilic Naegleria Fluoride Hydrocarbons Metals
LocalitySamples
TakenSamples >0 cfu/100mL
Max cfu/100mL
Requirement Met
Samples Taken Guideline Met
Samples with Thermophilic
NaegleriaRequirement
MetSamples
Taken
Concentration (mg/L)Samples
Taken Guideline Met
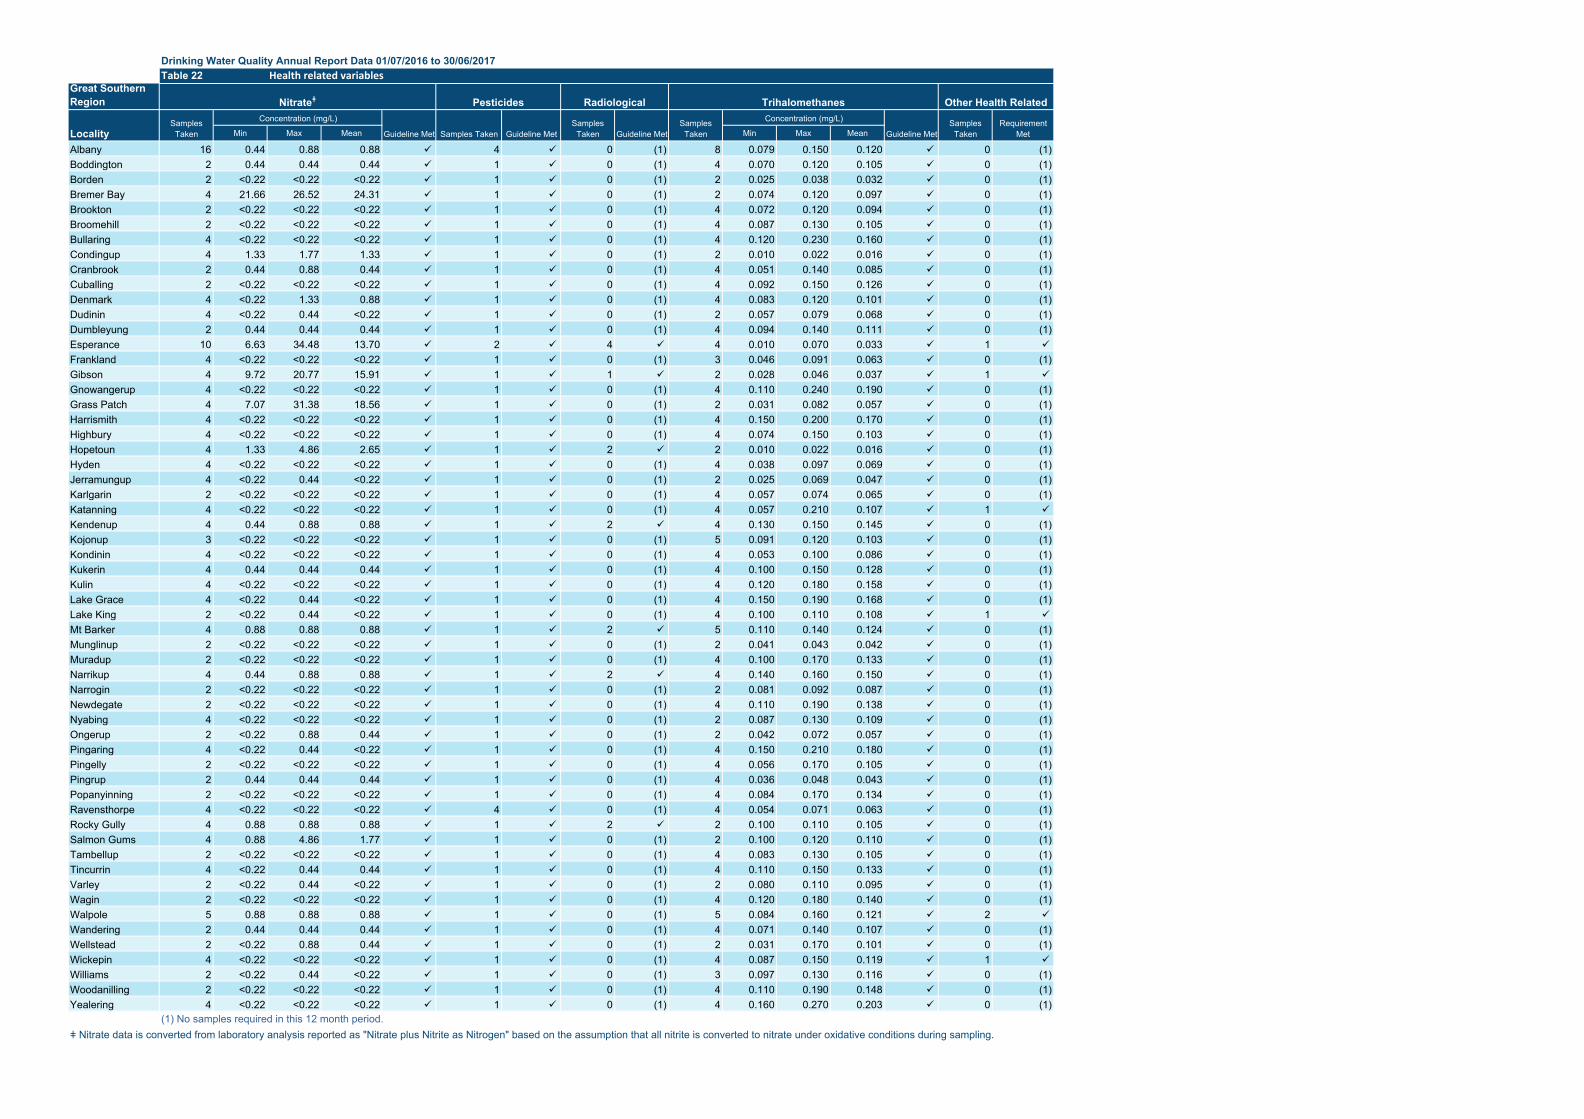
Drinking Water Quality Annual Report Data 01/07/2016 to 30/06/2017
Great Southern Region
Min Max Mean Min Max Mean
Albany 16 0.44 0.88 0.88 4 0 (1) 8 0.079 0.150 0.120 0 (1)Boddington 2 0.44 0.44 0.44 1 0 (1) 4 0.070 0.120 0.105 0 (1)Borden 2 <0.22 <0.22 <0.22 1 0 (1) 2 0.025 0.038 0.032 0 (1)Bremer Bay 4 21.66 26.52 24.31 1 0 (1) 2 0.074 0.120 0.097 0 (1)Brookton 2 <0.22 <0.22 <0.22 1 0 (1) 4 0.072 0.120 0.094 0 (1)Broomehill 2 <0.22 <0.22 <0.22 1 0 (1) 4 0.087 0.130 0.105 0 (1)Bullaring 4 <0.22 <0.22 <0.22 1 0 (1) 4 0.120 0.230 0.160 0 (1)Condingup 4 1.33 1.77 1.33 1 0 (1) 2 0.010 0.022 0.016 0 (1)Cranbrook 2 0.44 0.88 0.44 1 0 (1) 4 0.051 0.140 0.085 0 (1)Cuballing 2 <0.22 <0.22 <0.22 1 0 (1) 4 0.092 0.150 0.126 0 (1)Denmark 4 <0.22 1.33 0.88 1 0 (1) 4 0.083 0.120 0.101 0 (1)Dudinin 4 <0.22 0.44 <0.22 1 0 (1) 2 0.057 0.079 0.068 0 (1)Dumbleyung 2 0.44 0.44 0.44 1 0 (1) 4 0.094 0.140 0.111 0 (1)Esperance 10 6.63 34.48 13.70 2 4 4 0.010 0.070 0.033 1
Frankland 4 <0.22 <0.22 <0.22 1 0 (1) 3 0.046 0.091 0.063 0 (1)Gibson 4 9.72 20.77 15.91 1 1 2 0.028 0.046 0.037 1
Gnowangerup 4 <0.22 <0.22 <0.22 1 0 (1) 4 0.110 0.240 0.190 0 (1)Grass Patch 4 7.07 31.38 18.56 1 0 (1) 2 0.031 0.082 0.057 0 (1)Harrismith 4 <0.22 <0.22 <0.22 1 0 (1) 4 0.150 0.200 0.170 0 (1)Highbury 4 <0.22 <0.22 <0.22 1 0 (1) 4 0.074 0.150 0.103 0 (1)Hopetoun 4 1.33 4.86 2.65 1 2 2 0.010 0.022 0.016 0 (1)Hyden 4 <0.22 <0.22 <0.22 1 0 (1) 4 0.038 0.097 0.069 0 (1)Jerramungup 4 <0.22 0.44 <0.22 1 0 (1) 2 0.025 0.069 0.047 0 (1)Karlgarin 2 <0.22 <0.22 <0.22 1 0 (1) 4 0.057 0.074 0.065 0 (1)Katanning 4 <0.22 <0.22 <0.22 1 0 (1) 4 0.057 0.210 0.107 1
Kendenup 4 0.44 0.88 0.88 1 2 4 0.130 0.150 0.145 0 (1)Kojonup 3 <0.22 <0.22 <0.22 1 0 (1) 5 0.091 0.120 0.103 0 (1)Kondinin 4 <0.22 <0.22 <0.22 1 0 (1) 4 0.053 0.100 0.086 0 (1)Kukerin 4 0.44 0.44 0.44 1 0 (1) 4 0.100 0.150 0.128 0 (1)Kulin 4 <0.22 <0.22 <0.22 1 0 (1) 4 0.120 0.180 0.158 0 (1)Lake Grace 4 <0.22 0.44 <0.22 1 0 (1) 4 0.150 0.190 0.168 0 (1)Lake King 2 <0.22 0.44 <0.22 1 0 (1) 4 0.100 0.110 0.108 1
Mt Barker 4 0.88 0.88 0.88 1 2 5 0.110 0.140 0.124 0 (1)Munglinup 2 <0.22 <0.22 <0.22 1 0 (1) 2 0.041 0.043 0.042 0 (1)Muradup 2 <0.22 <0.22 <0.22 1 0 (1) 4 0.100 0.170 0.133 0 (1)Narrikup 4 0.44 0.88 0.88 1 2 4 0.140 0.160 0.150 0 (1)Narrogin 2 <0.22 <0.22 <0.22 1 0 (1) 2 0.081 0.092 0.087 0 (1)Newdegate 2 <0.22 <0.22 <0.22 1 0 (1) 4 0.110 0.190 0.138 0 (1)Nyabing 4 <0.22 <0.22 <0.22 1 0 (1) 2 0.087 0.130 0.109 0 (1)Ongerup 2 <0.22 0.88 0.44 1 0 (1) 2 0.042 0.072 0.057 0 (1)Pingaring 4 <0.22 0.44 <0.22 1 0 (1) 4 0.150 0.210 0.180 0 (1)Pingelly 2 <0.22 <0.22 <0.22 1 0 (1) 4 0.056 0.170 0.105 0 (1)Pingrup 2 0.44 0.44 0.44 1 0 (1) 4 0.036 0.048 0.043 0 (1)Popanyinning 2 <0.22 <0.22 <0.22 1 0 (1) 4 0.084 0.170 0.134 0 (1)Ravensthorpe 4 <0.22 <0.22 <0.22 4 0 (1) 4 0.054 0.071 0.063 0 (1)Rocky Gully 4 0.88 0.88 0.88 1 2 2 0.100 0.110 0.105 0 (1)Salmon Gums 4 0.88 4.86 1.77 1 0 (1) 2 0.100 0.120 0.110 0 (1)Tambellup 2 <0.22 <0.22 <0.22 1 0 (1) 4 0.083 0.130 0.105 0 (1)Tincurrin 4 <0.22 0.44 0.44 1 0 (1) 4 0.110 0.150 0.133 0 (1)Varley 2 <0.22 0.44 <0.22 1 0 (1) 2 0.080 0.110 0.095 0 (1)Wagin 2 <0.22 <0.22 <0.22 1 0 (1) 4 0.120 0.180 0.140 0 (1)Walpole 5 0.88 0.88 0.88 1 0 (1) 5 0.084 0.160 0.121 2
Wandering 2 0.44 0.44 0.44 1 0 (1) 4 0.071 0.140 0.107 0 (1)Wellstead 2 <0.22 0.88 0.44 1 0 (1) 2 0.031 0.170 0.101 0 (1)Wickepin 4 <0.22 <0.22 <0.22 1 0 (1) 4 0.087 0.150 0.119 1
Williams 2 <0.22 0.44 <0.22 1 0 (1) 3 0.097 0.130 0.116 0 (1)Woodanilling 2 <0.22 <0.22 <0.22 1 0 (1) 4 0.110 0.190 0.148 0 (1)Yealering 4 <0.22 <0.22 <0.22 1 0 (1) 4 0.160 0.270 0.203 0 (1)
(1) No samples required in this 12 month period.ǂ Nitrate data is converted from laboratory analysis reported as "Nitrate plus Nitrite as Nitrogen" based on the assumption that all nitrite is converted to nitrate under oxidative conditions during sampling.
Guideline Met
Table 22 Health related variables
Nitrateǂ Pesticides Radiological Trihalomethanes Other Health Related
LocalitySamples
Taken
Concentration (mg/L)
Guideline Met Samples TakenRequirement
MetSamples
Taken Guideline MetSamples
Taken
Concentration (mg/L)
Guideline MetSamples
Taken
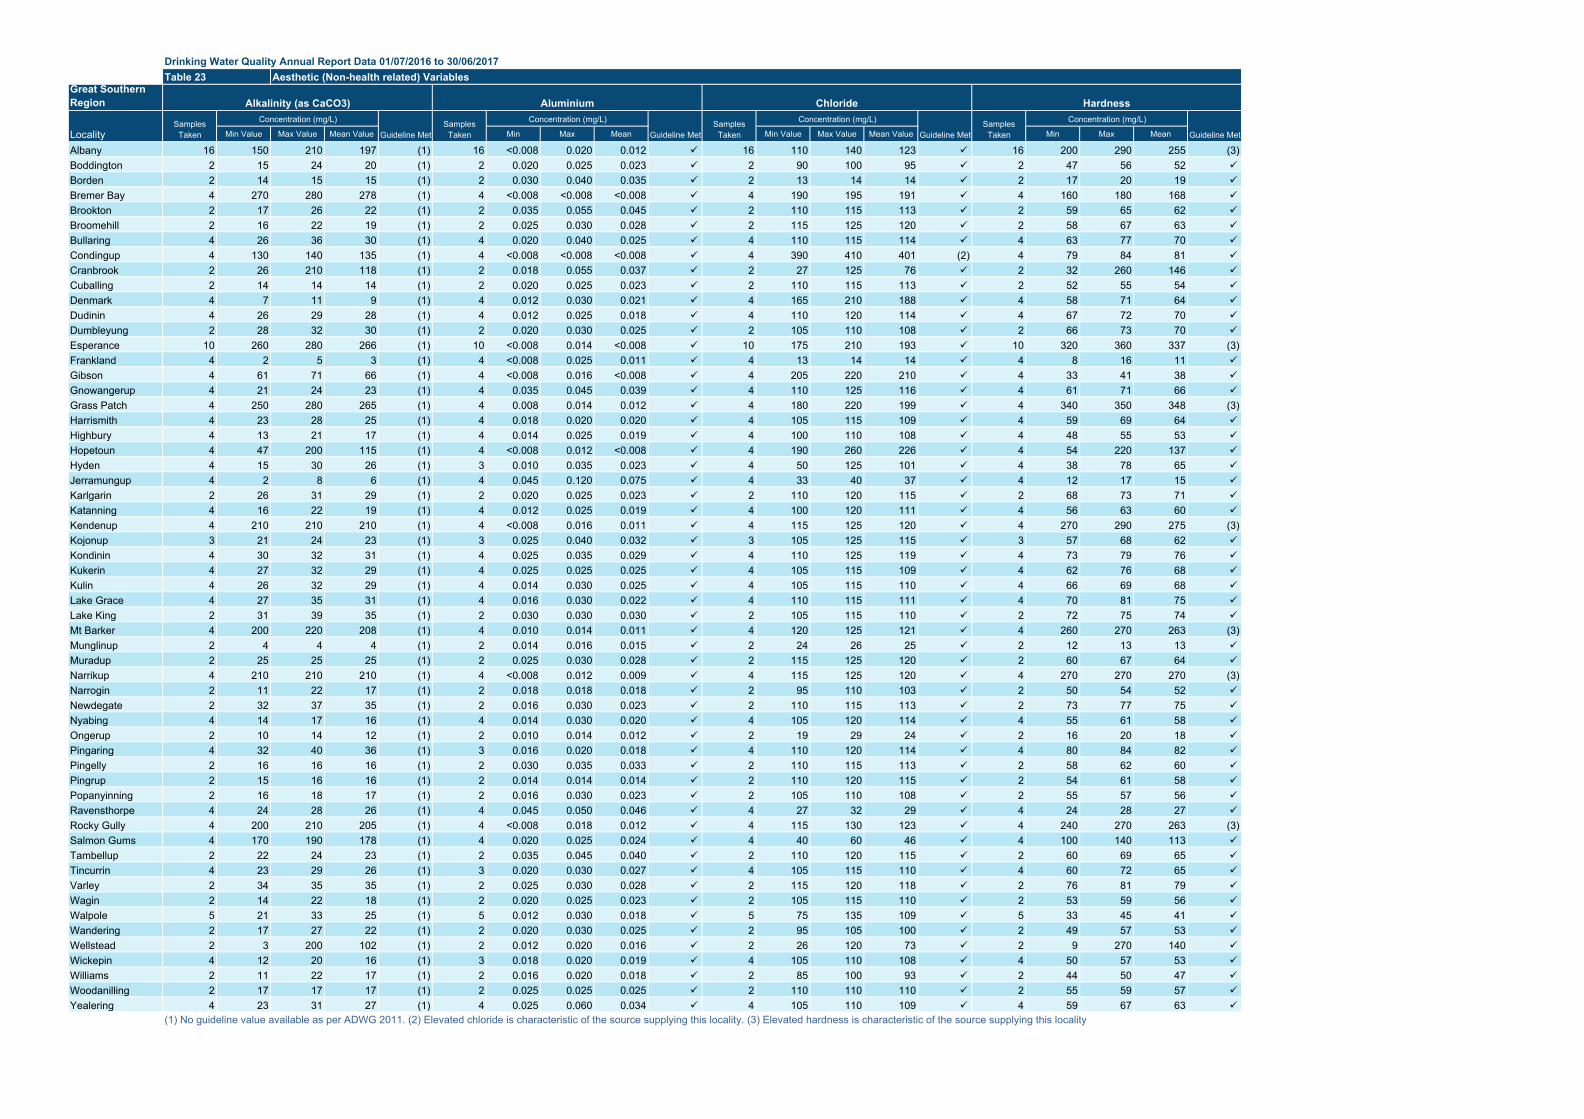
Drinking Water Quality Annual Report Data 01/07/2016 to 30/06/2017
Great Southern Region
Min Value Max Value Mean Value Min Max Mean Min Value Max Value Mean Value Min Max Mean
Albany 16 150 210 197 (1) 16 <0.008 0.020 0.012 16 110 140 123 16 200 290 255 (3)Boddington 2 15 24 20 (1) 2 0.020 0.025 0.023 2 90 100 95 2 47 56 52
Borden 2 14 15 15 (1) 2 0.030 0.040 0.035 2 13 14 14 2 17 20 19
Bremer Bay 4 270 280 278 (1) 4 <0.008 <0.008 <0.008 4 190 195 191 4 160 180 168
Brookton 2 17 26 22 (1) 2 0.035 0.055 0.045 2 110 115 113 2 59 65 62
Broomehill 2 16 22 19 (1) 2 0.025 0.030 0.028 2 115 125 120 2 58 67 63
Bullaring 4 26 36 30 (1) 4 0.020 0.040 0.025 4 110 115 114 4 63 77 70
Condingup 4 130 140 135 (1) 4 <0.008 <0.008 <0.008 4 390 410 401 (2) 4 79 84 81
Cranbrook 2 26 210 118 (1) 2 0.018 0.055 0.037 2 27 125 76 2 32 260 146
Cuballing 2 14 14 14 (1) 2 0.020 0.025 0.023 2 110 115 113 2 52 55 54
Denmark 4 7 11 9 (1) 4 0.012 0.030 0.021 4 165 210 188 4 58 71 64
Dudinin 4 26 29 28 (1) 4 0.012 0.025 0.018 4 110 120 114 4 67 72 70
Dumbleyung 2 28 32 30 (1) 2 0.020 0.030 0.025 2 105 110 108 2 66 73 70
Esperance 10 260 280 266 (1) 10 <0.008 0.014 <0.008 10 175 210 193 10 320 360 337 (3)Frankland 4 2 5 3 (1) 4 <0.008 0.025 0.011 4 13 14 14 4 8 16 11
Gibson 4 61 71 66 (1) 4 <0.008 0.016 <0.008 4 205 220 210 4 33 41 38
Gnowangerup 4 21 24 23 (1) 4 0.035 0.045 0.039 4 110 125 116 4 61 71 66
Grass Patch 4 250 280 265 (1) 4 0.008 0.014 0.012 4 180 220 199 4 340 350 348 (3)Harrismith 4 23 28 25 (1) 4 0.018 0.020 0.020 4 105 115 109 4 59 69 64
Highbury 4 13 21 17 (1) 4 0.014 0.025 0.019 4 100 110 108 4 48 55 53
Hopetoun 4 47 200 115 (1) 4 <0.008 0.012 <0.008 4 190 260 226 4 54 220 137
Hyden 4 15 30 26 (1) 3 0.010 0.035 0.023 4 50 125 101 4 38 78 65
Jerramungup 4 2 8 6 (1) 4 0.045 0.120 0.075 4 33 40 37 4 12 17 15
Karlgarin 2 26 31 29 (1) 2 0.020 0.025 0.023 2 110 120 115 2 68 73 71
Katanning 4 16 22 19 (1) 4 0.012 0.025 0.019 4 100 120 111 4 56 63 60
Kendenup 4 210 210 210 (1) 4 <0.008 0.016 0.011 4 115 125 120 4 270 290 275 (3)Kojonup 3 21 24 23 (1) 3 0.025 0.040 0.032 3 105 125 115 3 57 68 62
Kondinin 4 30 32 31 (1) 4 0.025 0.035 0.029 4 110 125 119 4 73 79 76
Kukerin 4 27 32 29 (1) 4 0.025 0.025 0.025 4 105 115 109 4 62 76 68
Kulin 4 26 32 29 (1) 4 0.014 0.030 0.025 4 105 115 110 4 66 69 68
Lake Grace 4 27 35 31 (1) 4 0.016 0.030 0.022 4 110 115 111 4 70 81 75
Lake King 2 31 39 35 (1) 2 0.030 0.030 0.030 2 105 115 110 2 72 75 74
Mt Barker 4 200 220 208 (1) 4 0.010 0.014 0.011 4 120 125 121 4 260 270 263 (3)Munglinup 2 4 4 4 (1) 2 0.014 0.016 0.015 2 24 26 25 2 12 13 13
Muradup 2 25 25 25 (1) 2 0.025 0.030 0.028 2 115 125 120 2 60 67 64
Narrikup 4 210 210 210 (1) 4 <0.008 0.012 0.009 4 115 125 120 4 270 270 270 (3)Narrogin 2 11 22 17 (1) 2 0.018 0.018 0.018 2 95 110 103 2 50 54 52
Newdegate 2 32 37 35 (1) 2 0.016 0.030 0.023 2 110 115 113 2 73 77 75
Nyabing 4 14 17 16 (1) 4 0.014 0.030 0.020 4 105 120 114 4 55 61 58
Ongerup 2 10 14 12 (1) 2 0.010 0.014 0.012 2 19 29 24 2 16 20 18
Pingaring 4 32 40 36 (1) 3 0.016 0.020 0.018 4 110 120 114 4 80 84 82
Pingelly 2 16 16 16 (1) 2 0.030 0.035 0.033 2 110 115 113 2 58 62 60
Pingrup 2 15 16 16 (1) 2 0.014 0.014 0.014 2 110 120 115 2 54 61 58
Popanyinning 2 16 18 17 (1) 2 0.016 0.030 0.023 2 105 110 108 2 55 57 56
Ravensthorpe 4 24 28 26 (1) 4 0.045 0.050 0.046 4 27 32 29 4 24 28 27
Rocky Gully 4 200 210 205 (1) 4 <0.008 0.018 0.012 4 115 130 123 4 240 270 263 (3)Salmon Gums 4 170 190 178 (1) 4 0.020 0.025 0.024 4 40 60 46 4 100 140 113
Tambellup 2 22 24 23 (1) 2 0.035 0.045 0.040 2 110 120 115 2 60 69 65
Tincurrin 4 23 29 26 (1) 3 0.020 0.030 0.027 4 105 115 110 4 60 72 65
Varley 2 34 35 35 (1) 2 0.025 0.030 0.028 2 115 120 118 2 76 81 79
Wagin 2 14 22 18 (1) 2 0.020 0.025 0.023 2 105 115 110 2 53 59 56
Walpole 5 21 33 25 (1) 5 0.012 0.030 0.018 5 75 135 109 5 33 45 41
Wandering 2 17 27 22 (1) 2 0.020 0.030 0.025 2 95 105 100 2 49 57 53
Wellstead 2 3 200 102 (1) 2 0.012 0.020 0.016 2 26 120 73 2 9 270 140
Wickepin 4 12 20 16 (1) 3 0.018 0.020 0.019 4 105 110 108 4 50 57 53
Williams 2 11 22 17 (1) 2 0.016 0.020 0.018 2 85 100 93 2 44 50 47
Woodanilling 2 17 17 17 (1) 2 0.025 0.025 0.025 2 110 110 110 2 55 59 57
Yealering 4 23 31 27 (1) 4 0.025 0.060 0.034 4 105 110 109 4 59 67 63 (1) No guideline value available as per ADWG 2011. (2) Elevated chloride is characteristic of the source supplying this locality. (3) Elevated hardness is characteristic of the source supplying this locality
Concentration (mg/L)
Table 23 Aesthetic (Non-health related) Variables
Alkalinity (as CaCO3) Aluminium Chloride Hardness
Guideline MetGuideline Met
Concentration (mg/L)
LocalitySamples
Taken
Concentration (mg/L)
Guideline MetSamples
TakenSamples
Taken
Concentration (mg/L)
Guideline MetSamples
Taken
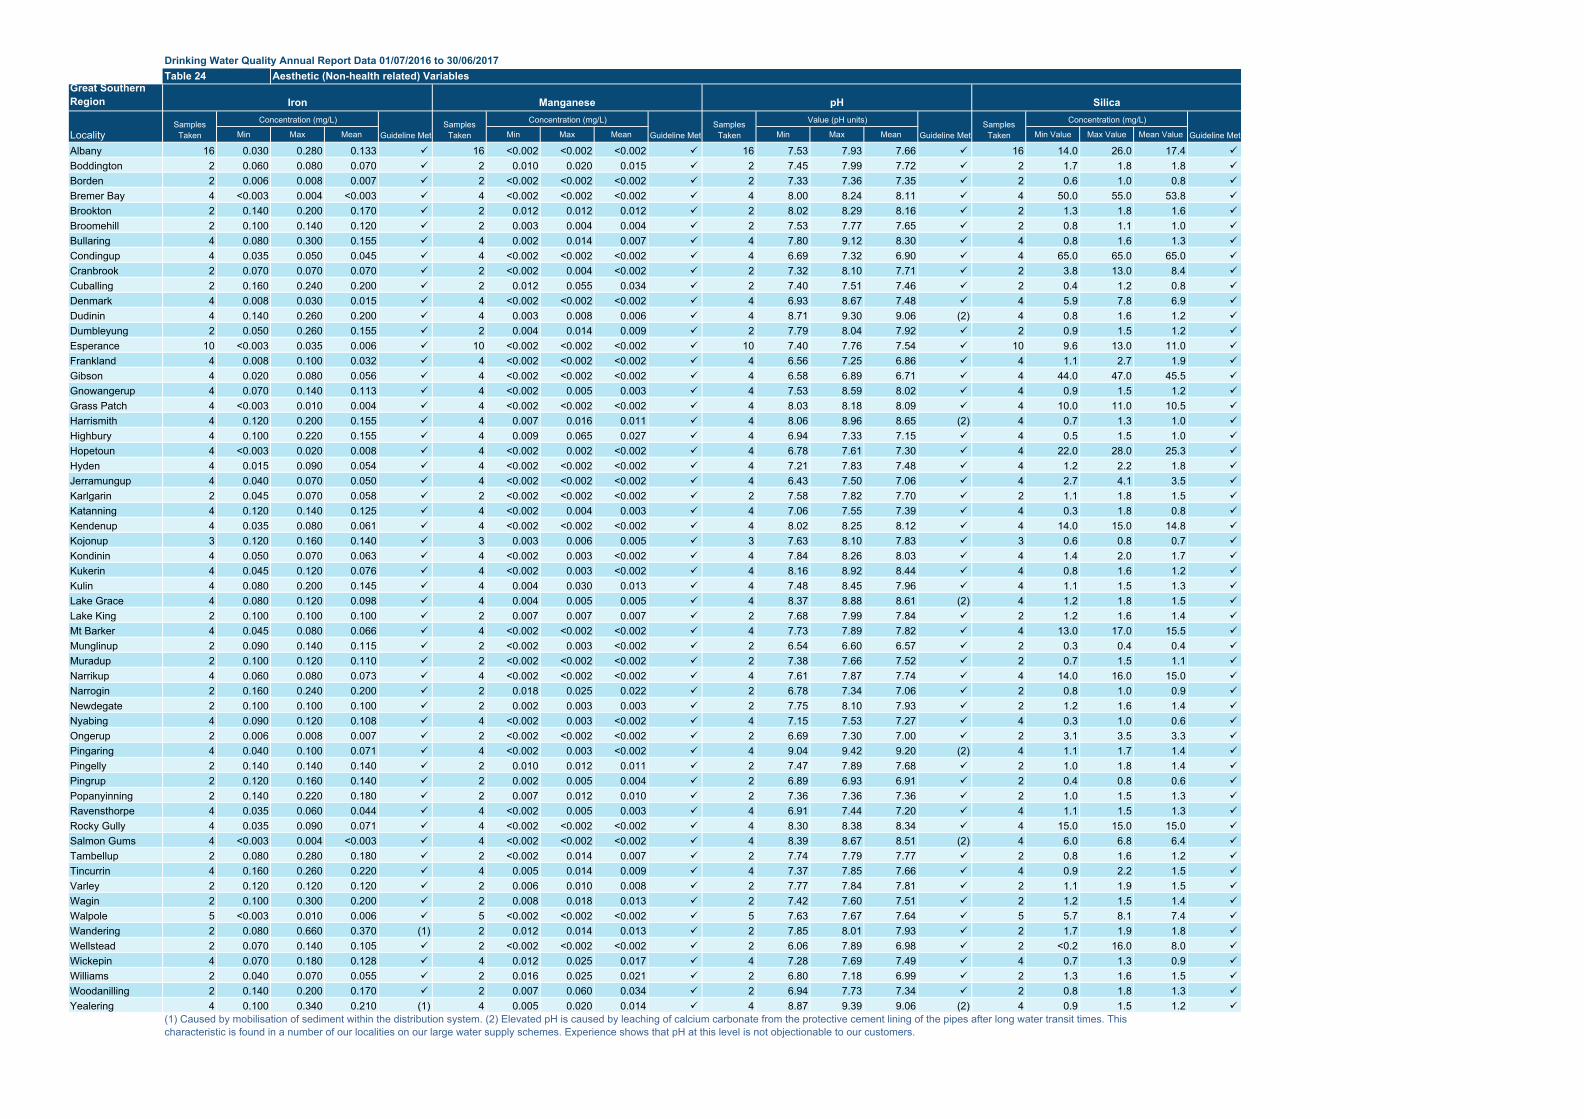
Drinking Water Quality Annual Report Data 01/07/2016 to 30/06/2017
Great Southern Region
Min Max Mean Min Max Mean Min Max Mean Min Value Max Value Mean Value
Albany 16 0.030 0.280 0.133 16 <0.002 <0.002 <0.002 16 7.53 7.93 7.66 16 14.0 26.0 17.4
Boddington 2 0.060 0.080 0.070 2 0.010 0.020 0.015 2 7.45 7.99 7.72 2 1.7 1.8 1.8
Borden 2 0.006 0.008 0.007 2 <0.002 <0.002 <0.002 2 7.33 7.36 7.35 2 0.6 1.0 0.8
Bremer Bay 4 <0.003 0.004 <0.003 4 <0.002 <0.002 <0.002 4 8.00 8.24 8.11 4 50.0 55.0 53.8
Brookton 2 0.140 0.200 0.170 2 0.012 0.012 0.012 2 8.02 8.29 8.16 2 1.3 1.8 1.6
Broomehill 2 0.100 0.140 0.120 2 0.003 0.004 0.004 2 7.53 7.77 7.65 2 0.8 1.1 1.0
Bullaring 4 0.080 0.300 0.155 4 0.002 0.014 0.007 4 7.80 9.12 8.30 4 0.8 1.6 1.3
Condingup 4 0.035 0.050 0.045 4 <0.002 <0.002 <0.002 4 6.69 7.32 6.90 4 65.0 65.0 65.0
Cranbrook 2 0.070 0.070 0.070 2 <0.002 0.004 <0.002 2 7.32 8.10 7.71 2 3.8 13.0 8.4
Cuballing 2 0.160 0.240 0.200 2 0.012 0.055 0.034 2 7.40 7.51 7.46 2 0.4 1.2 0.8
Denmark 4 0.008 0.030 0.015 4 <0.002 <0.002 <0.002 4 6.93 8.67 7.48 4 5.9 7.8 6.9
Dudinin 4 0.140 0.260 0.200 4 0.003 0.008 0.006 4 8.71 9.30 9.06 (2) 4 0.8 1.6 1.2
Dumbleyung 2 0.050 0.260 0.155 2 0.004 0.014 0.009 2 7.79 8.04 7.92 2 0.9 1.5 1.2
Esperance 10 <0.003 0.035 0.006 10 <0.002 <0.002 <0.002 10 7.40 7.76 7.54 10 9.6 13.0 11.0
Frankland 4 0.008 0.100 0.032 4 <0.002 <0.002 <0.002 4 6.56 7.25 6.86 4 1.1 2.7 1.9
Gibson 4 0.020 0.080 0.056 4 <0.002 <0.002 <0.002 4 6.58 6.89 6.71 4 44.0 47.0 45.5
Gnowangerup 4 0.070 0.140 0.113 4 <0.002 0.005 0.003 4 7.53 8.59 8.02 4 0.9 1.5 1.2
Grass Patch 4 <0.003 0.010 0.004 4 <0.002 <0.002 <0.002 4 8.03 8.18 8.09 4 10.0 11.0 10.5
Harrismith 4 0.120 0.200 0.155 4 0.007 0.016 0.011 4 8.06 8.96 8.65 (2) 4 0.7 1.3 1.0
Highbury 4 0.100 0.220 0.155 4 0.009 0.065 0.027 4 6.94 7.33 7.15 4 0.5 1.5 1.0
Hopetoun 4 <0.003 0.020 0.008 4 <0.002 0.002 <0.002 4 6.78 7.61 7.30 4 22.0 28.0 25.3
Hyden 4 0.015 0.090 0.054 4 <0.002 <0.002 <0.002 4 7.21 7.83 7.48 4 1.2 2.2 1.8
Jerramungup 4 0.040 0.070 0.050 4 <0.002 <0.002 <0.002 4 6.43 7.50 7.06 4 2.7 4.1 3.5
Karlgarin 2 0.045 0.070 0.058 2 <0.002 <0.002 <0.002 2 7.58 7.82 7.70 2 1.1 1.8 1.5
Katanning 4 0.120 0.140 0.125 4 <0.002 0.004 0.003 4 7.06 7.55 7.39 4 0.3 1.8 0.8
Kendenup 4 0.035 0.080 0.061 4 <0.002 <0.002 <0.002 4 8.02 8.25 8.12 4 14.0 15.0 14.8
Kojonup 3 0.120 0.160 0.140 3 0.003 0.006 0.005 3 7.63 8.10 7.83 3 0.6 0.8 0.7
Kondinin 4 0.050 0.070 0.063 4 <0.002 0.003 <0.002 4 7.84 8.26 8.03 4 1.4 2.0 1.7
Kukerin 4 0.045 0.120 0.076 4 <0.002 0.003 <0.002 4 8.16 8.92 8.44 4 0.8 1.6 1.2
Kulin 4 0.080 0.200 0.145 4 0.004 0.030 0.013 4 7.48 8.45 7.96 4 1.1 1.5 1.3
Lake Grace 4 0.080 0.120 0.098 4 0.004 0.005 0.005 4 8.37 8.88 8.61 (2) 4 1.2 1.8 1.5
Lake King 2 0.100 0.100 0.100 2 0.007 0.007 0.007 2 7.68 7.99 7.84 2 1.2 1.6 1.4
Mt Barker 4 0.045 0.080 0.066 4 <0.002 <0.002 <0.002 4 7.73 7.89 7.82 4 13.0 17.0 15.5
Munglinup 2 0.090 0.140 0.115 2 <0.002 0.003 <0.002 2 6.54 6.60 6.57 2 0.3 0.4 0.4
Muradup 2 0.100 0.120 0.110 2 <0.002 <0.002 <0.002 2 7.38 7.66 7.52 2 0.7 1.5 1.1
Narrikup 4 0.060 0.080 0.073 4 <0.002 <0.002 <0.002 4 7.61 7.87 7.74 4 14.0 16.0 15.0
Narrogin 2 0.160 0.240 0.200 2 0.018 0.025 0.022 2 6.78 7.34 7.06 2 0.8 1.0 0.9
Newdegate 2 0.100 0.100 0.100 2 0.002 0.003 0.003 2 7.75 8.10 7.93 2 1.2 1.6 1.4
Nyabing 4 0.090 0.120 0.108 4 <0.002 0.003 <0.002 4 7.15 7.53 7.27 4 0.3 1.0 0.6
Ongerup 2 0.006 0.008 0.007 2 <0.002 <0.002 <0.002 2 6.69 7.30 7.00 2 3.1 3.5 3.3
Pingaring 4 0.040 0.100 0.071 4 <0.002 0.003 <0.002 4 9.04 9.42 9.20 (2) 4 1.1 1.7 1.4
Pingelly 2 0.140 0.140 0.140 2 0.010 0.012 0.011 2 7.47 7.89 7.68 2 1.0 1.8 1.4
Pingrup 2 0.120 0.160 0.140 2 0.002 0.005 0.004 2 6.89 6.93 6.91 2 0.4 0.8 0.6
Popanyinning 2 0.140 0.220 0.180 2 0.007 0.012 0.010 2 7.36 7.36 7.36 2 1.0 1.5 1.3
Ravensthorpe 4 0.035 0.060 0.044 4 <0.002 0.005 0.003 4 6.91 7.44 7.20 4 1.1 1.5 1.3
Rocky Gully 4 0.035 0.090 0.071 4 <0.002 <0.002 <0.002 4 8.30 8.38 8.34 4 15.0 15.0 15.0
Salmon Gums 4 <0.003 0.004 <0.003 4 <0.002 <0.002 <0.002 4 8.39 8.67 8.51 (2) 4 6.0 6.8 6.4
Tambellup 2 0.080 0.280 0.180 2 <0.002 0.014 0.007 2 7.74 7.79 7.77 2 0.8 1.6 1.2
Tincurrin 4 0.160 0.260 0.220 4 0.005 0.014 0.009 4 7.37 7.85 7.66 4 0.9 2.2 1.5
Varley 2 0.120 0.120 0.120 2 0.006 0.010 0.008 2 7.77 7.84 7.81 2 1.1 1.9 1.5
Wagin 2 0.100 0.300 0.200 2 0.008 0.018 0.013 2 7.42 7.60 7.51 2 1.2 1.5 1.4
Walpole 5 <0.003 0.010 0.006 5 <0.002 <0.002 <0.002 5 7.63 7.67 7.64 5 5.7 8.1 7.4
Wandering 2 0.080 0.660 0.370 (1) 2 0.012 0.014 0.013 2 7.85 8.01 7.93 2 1.7 1.9 1.8
Wellstead 2 0.070 0.140 0.105 2 <0.002 <0.002 <0.002 2 6.06 7.89 6.98 2 <0.2 16.0 8.0
Wickepin 4 0.070 0.180 0.128 4 0.012 0.025 0.017 4 7.28 7.69 7.49 4 0.7 1.3 0.9
Williams 2 0.040 0.070 0.055 2 0.016 0.025 0.021 2 6.80 7.18 6.99 2 1.3 1.6 1.5
Woodanilling 2 0.140 0.200 0.170 2 0.007 0.060 0.034 2 6.94 7.73 7.34 2 0.8 1.8 1.3
Yealering 4 0.100 0.340 0.210 (1) 4 0.005 0.020 0.014 4 8.87 9.39 9.06 (2) 4 0.9 1.5 1.2
Table 24 Aesthetic (Non-health related) Variables
Iron Manganese pH Silica
LocalitySamples
Taken
Concentration (mg/L)
Guideline MetSamples
Taken Guideline MetGuideline MetSamples
Taken
Value (pH units)
Guideline MetSamples
Taken
Concentration (mg/L)Concentration (mg/L)
(1) Caused by mobilisation of sediment within the distribution system. (2) Elevated pH is caused by leaching of calcium carbonate from the protective cement lining of the pipes after long water transit times. This characteristic is found in a number of our localities on our large water supply schemes. Experience shows that pH at this level is not objectionable to our customers.
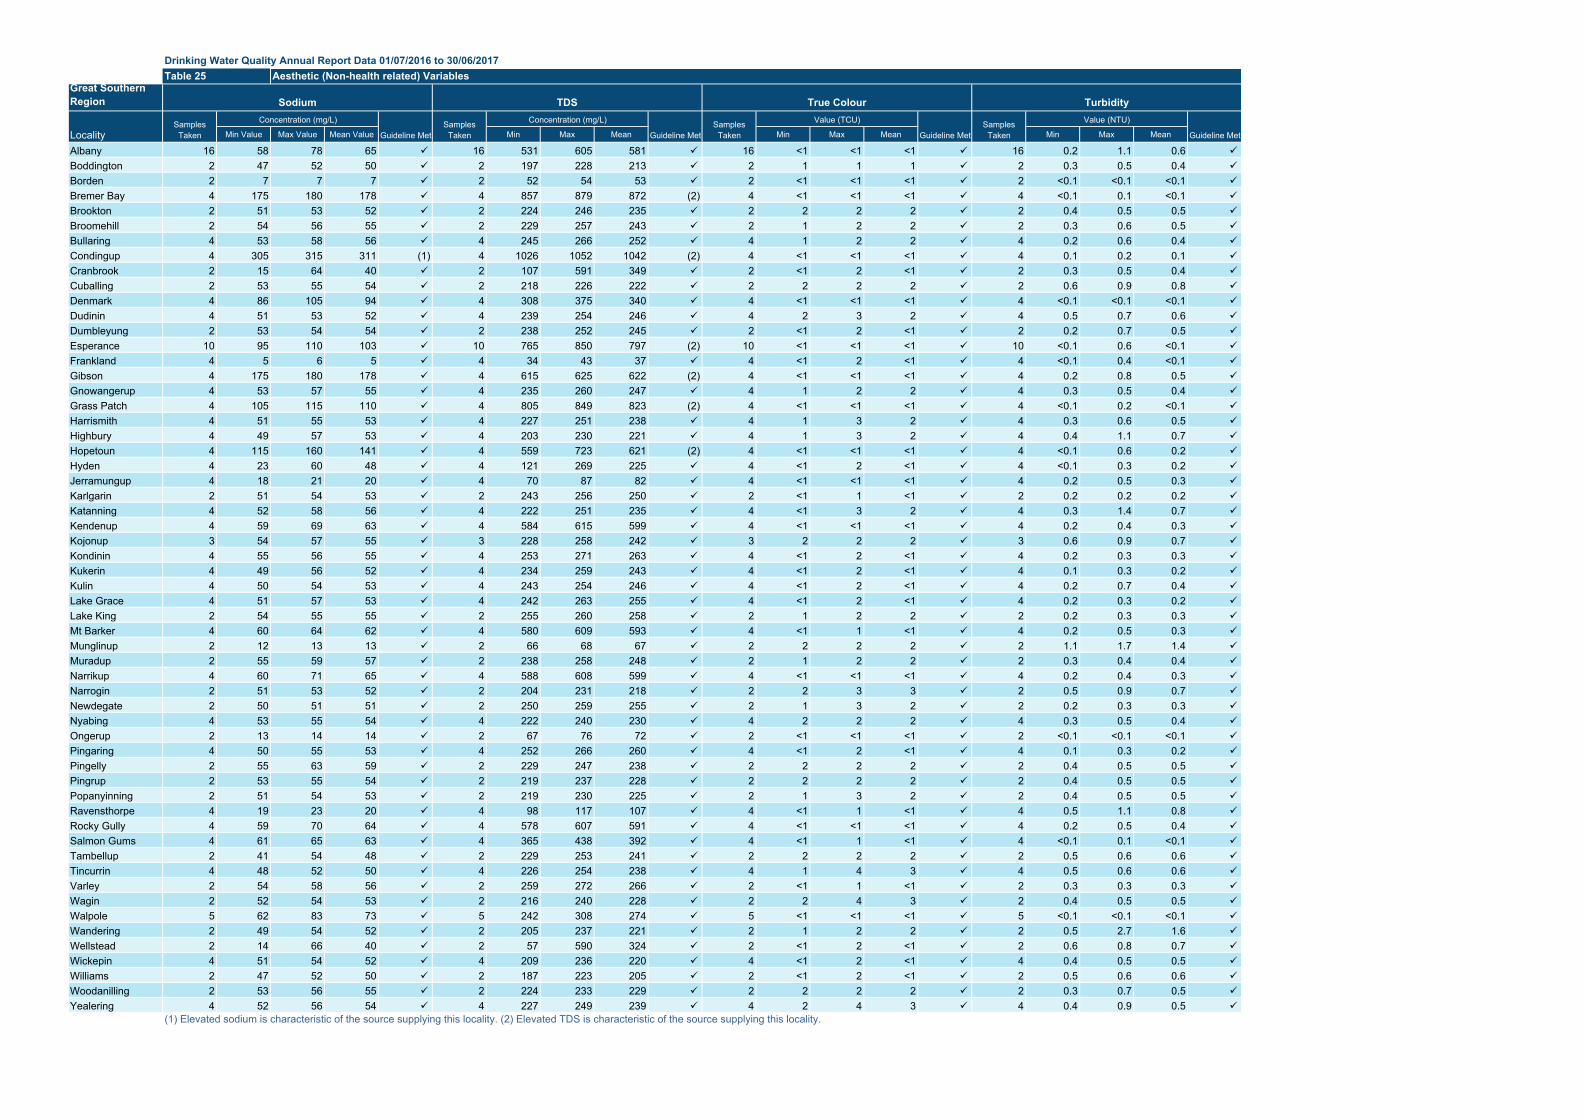
Drinking Water Quality Annual Report Data 01/07/2016 to 30/06/2017
Great Southern Region
Min Value Max Value Mean Value Min Max Mean Min Max Mean Min Max Mean
Albany 16 58 78 65 16 531 605 581 16 <1 <1 <1 16 0.2 1.1 0.6
Boddington 2 47 52 50 2 197 228 213 2 1 1 1 2 0.3 0.5 0.4
Borden 2 7 7 7 2 52 54 53 2 <1 <1 <1 2 <0.1 <0.1 <0.1
Bremer Bay 4 175 180 178 4 857 879 872 (2) 4 <1 <1 <1 4 <0.1 0.1 <0.1
Brookton 2 51 53 52 2 224 246 235 2 2 2 2 2 0.4 0.5 0.5
Broomehill 2 54 56 55 2 229 257 243 2 1 2 2 2 0.3 0.6 0.5
Bullaring 4 53 58 56 4 245 266 252 4 1 2 2 4 0.2 0.6 0.4
Condingup 4 305 315 311 (1) 4 1026 1052 1042 (2) 4 <1 <1 <1 4 0.1 0.2 0.1
Cranbrook 2 15 64 40 2 107 591 349 2 <1 2 <1 2 0.3 0.5 0.4
Cuballing 2 53 55 54 2 218 226 222 2 2 2 2 2 0.6 0.9 0.8
Denmark 4 86 105 94 4 308 375 340 4 <1 <1 <1 4 <0.1 <0.1 <0.1
Dudinin 4 51 53 52 4 239 254 246 4 2 3 2 4 0.5 0.7 0.6
Dumbleyung 2 53 54 54 2 238 252 245 2 <1 2 <1 2 0.2 0.7 0.5
Esperance 10 95 110 103 10 765 850 797 (2) 10 <1 <1 <1 10 <0.1 0.6 <0.1
Frankland 4 5 6 5 4 34 43 37 4 <1 2 <1 4 <0.1 0.4 <0.1
Gibson 4 175 180 178 4 615 625 622 (2) 4 <1 <1 <1 4 0.2 0.8 0.5
Gnowangerup 4 53 57 55 4 235 260 247 4 1 2 2 4 0.3 0.5 0.4
Grass Patch 4 105 115 110 4 805 849 823 (2) 4 <1 <1 <1 4 <0.1 0.2 <0.1
Harrismith 4 51 55 53 4 227 251 238 4 1 3 2 4 0.3 0.6 0.5
Highbury 4 49 57 53 4 203 230 221 4 1 3 2 4 0.4 1.1 0.7
Hopetoun 4 115 160 141 4 559 723 621 (2) 4 <1 <1 <1 4 <0.1 0.6 0.2
Hyden 4 23 60 48 4 121 269 225 4 <1 2 <1 4 <0.1 0.3 0.2
Jerramungup 4 18 21 20 4 70 87 82 4 <1 <1 <1 4 0.2 0.5 0.3
Karlgarin 2 51 54 53 2 243 256 250 2 <1 1 <1 2 0.2 0.2 0.2
Katanning 4 52 58 56 4 222 251 235 4 <1 3 2 4 0.3 1.4 0.7
Kendenup 4 59 69 63 4 584 615 599 4 <1 <1 <1 4 0.2 0.4 0.3
Kojonup 3 54 57 55 3 228 258 242 3 2 2 2 3 0.6 0.9 0.7
Kondinin 4 55 56 55 4 253 271 263 4 <1 2 <1 4 0.2 0.3 0.3
Kukerin 4 49 56 52 4 234 259 243 4 <1 2 <1 4 0.1 0.3 0.2
Kulin 4 50 54 53 4 243 254 246 4 <1 2 <1 4 0.2 0.7 0.4
Lake Grace 4 51 57 53 4 242 263 255 4 <1 2 <1 4 0.2 0.3 0.2
Lake King 2 54 55 55 2 255 260 258 2 1 2 2 2 0.2 0.3 0.3
Mt Barker 4 60 64 62 4 580 609 593 4 <1 1 <1 4 0.2 0.5 0.3
Munglinup 2 12 13 13 2 66 68 67 2 2 2 2 2 1.1 1.7 1.4
Muradup 2 55 59 57 2 238 258 248 2 1 2 2 2 0.3 0.4 0.4
Narrikup 4 60 71 65 4 588 608 599 4 <1 <1 <1 4 0.2 0.4 0.3
Narrogin 2 51 53 52 2 204 231 218 2 2 3 3 2 0.5 0.9 0.7
Newdegate 2 50 51 51 2 250 259 255 2 1 3 2 2 0.2 0.3 0.3
Nyabing 4 53 55 54 4 222 240 230 4 2 2 2 4 0.3 0.5 0.4
Ongerup 2 13 14 14 2 67 76 72 2 <1 <1 <1 2 <0.1 <0.1 <0.1
Pingaring 4 50 55 53 4 252 266 260 4 <1 2 <1 4 0.1 0.3 0.2
Pingelly 2 55 63 59 2 229 247 238 2 2 2 2 2 0.4 0.5 0.5
Pingrup 2 53 55 54 2 219 237 228 2 2 2 2 2 0.4 0.5 0.5
Popanyinning 2 51 54 53 2 219 230 225 2 1 3 2 2 0.4 0.5 0.5
Ravensthorpe 4 19 23 20 4 98 117 107 4 <1 1 <1 4 0.5 1.1 0.8
Rocky Gully 4 59 70 64 4 578 607 591 4 <1 <1 <1 4 0.2 0.5 0.4
Salmon Gums 4 61 65 63 4 365 438 392 4 <1 1 <1 4 <0.1 0.1 <0.1
Tambellup 2 41 54 48 2 229 253 241 2 2 2 2 2 0.5 0.6 0.6
Tincurrin 4 48 52 50 4 226 254 238 4 1 4 3 4 0.5 0.6 0.6
Varley 2 54 58 56 2 259 272 266 2 <1 1 <1 2 0.3 0.3 0.3
Wagin 2 52 54 53 2 216 240 228 2 2 4 3 2 0.4 0.5 0.5
Walpole 5 62 83 73 5 242 308 274 5 <1 <1 <1 5 <0.1 <0.1 <0.1
Wandering 2 49 54 52 2 205 237 221 2 1 2 2 2 0.5 2.7 1.6
Wellstead 2 14 66 40 2 57 590 324 2 <1 2 <1 2 0.6 0.8 0.7
Wickepin 4 51 54 52 4 209 236 220 4 <1 2 <1 4 0.4 0.5 0.5
Williams 2 47 52 50 2 187 223 205 2 <1 2 <1 2 0.5 0.6 0.6
Woodanilling 2 53 56 55 2 224 233 229 2 2 2 2 2 0.3 0.7 0.5
Yealering 4 52 56 54 4 227 249 239 4 2 4 3 4 0.4 0.9 0.5 (1) Elevated sodium is characteristic of the source supplying this locality. (2) Elevated TDS is characteristic of the source supplying this locality.
Guideline Met
Table 25 Aesthetic (Non-health related) Variables
Sodium TDS True Colour Turbidity
LocalitySamples
Taken
Concentration (mg/L)
Guideline MetSamples
Taken
Concentration (mg/L) Value (NTU)
Guideline MetSamples
Taken
Value (TCU)
Guideline MetSamples
Taken
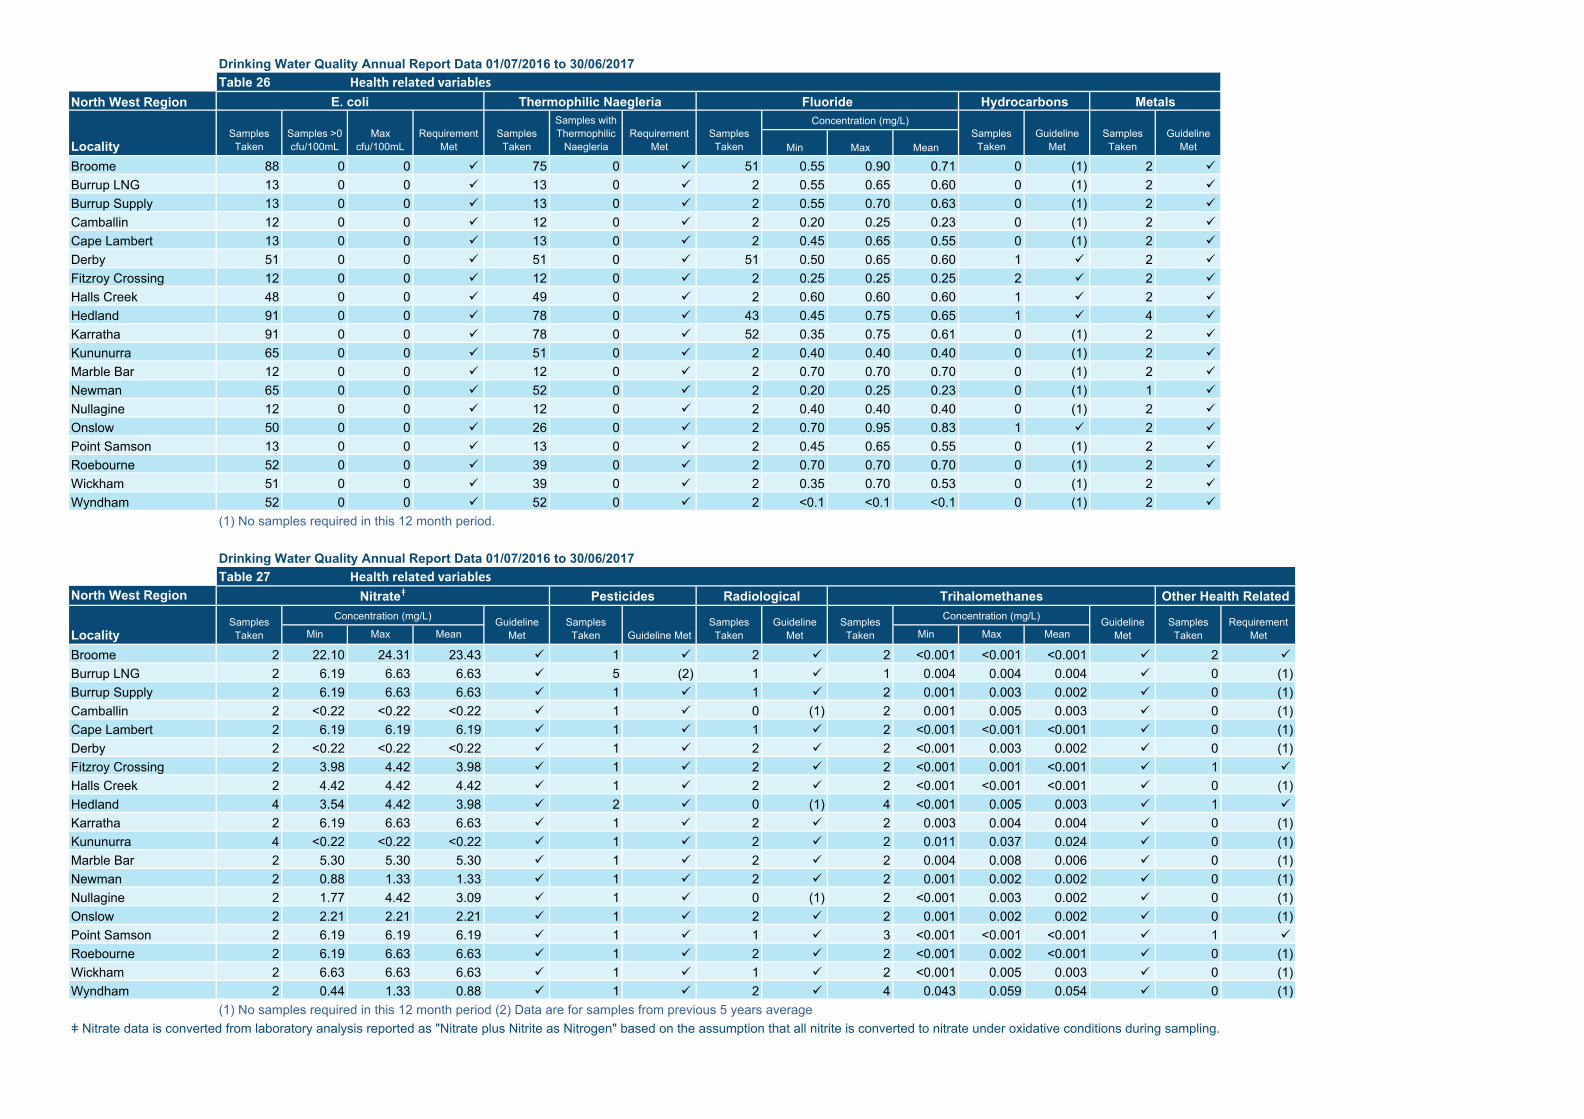
Drinking Water Quality Annual Report Data 01/07/2016 to 30/06/2017
North West Region
Min Max Mean
Broome 88 0 0 75 0 51 0.55 0.90 0.71 0 (1) 2
Burrup LNG 13 0 0 13 0 2 0.55 0.65 0.60 0 (1) 2
Burrup Supply 13 0 0 13 0 2 0.55 0.70 0.63 0 (1) 2
Camballin 12 0 0 12 0 2 0.20 0.25 0.23 0 (1) 2
Cape Lambert 13 0 0 13 0 2 0.45 0.65 0.55 0 (1) 2
Derby 51 0 0 51 0 51 0.50 0.65 0.60 1 2
Fitzroy Crossing 12 0 0 12 0 2 0.25 0.25 0.25 2 2
Halls Creek 48 0 0 49 0 2 0.60 0.60 0.60 1 2
Hedland 91 0 0 78 0 43 0.45 0.75 0.65 1 4
Karratha 91 0 0 78 0 52 0.35 0.75 0.61 0 (1) 2
Kununurra 65 0 0 51 0 2 0.40 0.40 0.40 0 (1) 2
Marble Bar 12 0 0 12 0 2 0.70 0.70 0.70 0 (1) 2
Newman 65 0 0 52 0 2 0.20 0.25 0.23 0 (1) 1
Nullagine 12 0 0 12 0 2 0.40 0.40 0.40 0 (1) 2
Onslow 50 0 0 26 0 2 0.70 0.95 0.83 1 2
Point Samson 13 0 0 13 0 2 0.45 0.65 0.55 0 (1) 2
Roebourne 52 0 0 39 0 2 0.70 0.70 0.70 0 (1) 2
Wickham 51 0 0 39 0 2 0.35 0.70 0.53 0 (1) 2
Wyndham 52 0 0 52 0 2 <0.1 <0.1 <0.1 0 (1) 2
(1) No samples required in this 12 month period.
Drinking Water Quality Annual Report Data 01/07/2016 to 30/06/2017
North West Region
Min Max Mean Min Max Mean
Broome 2 22.10 24.31 23.43 1 2 2 <0.001 <0.001 <0.001 2
Burrup LNG 2 6.19 6.63 6.63 5 (2) 1 1 0.004 0.004 0.004 0 (1)Burrup Supply 2 6.19 6.63 6.63 1 1 2 0.001 0.003 0.002 0 (1)Camballin 2 <0.22 <0.22 <0.22 1 0 (1) 2 0.001 0.005 0.003 0 (1)Cape Lambert 2 6.19 6.19 6.19 1 1 2 <0.001 <0.001 <0.001 0 (1)Derby 2 <0.22 <0.22 <0.22 1 2 2 <0.001 0.003 0.002 0 (1)Fitzroy Crossing 2 3.98 4.42 3.98 1 2 2 <0.001 0.001 <0.001 1
Halls Creek 2 4.42 4.42 4.42 1 2 2 <0.001 <0.001 <0.001 0 (1)Hedland 4 3.54 4.42 3.98 2 0 (1) 4 <0.001 0.005 0.003 1
Karratha 2 6.19 6.63 6.63 1 2 2 0.003 0.004 0.004 0 (1)Kununurra 4 <0.22 <0.22 <0.22 1 2 2 0.011 0.037 0.024 0 (1)Marble Bar 2 5.30 5.30 5.30 1 2 2 0.004 0.008 0.006 0 (1)Newman 2 0.88 1.33 1.33 1 2 2 0.001 0.002 0.002 0 (1)Nullagine 2 1.77 4.42 3.09 1 0 (1) 2 <0.001 0.003 0.002 0 (1)Onslow 2 2.21 2.21 2.21 1 2 2 0.001 0.002 0.002 0 (1)Point Samson 2 6.19 6.19 6.19 1 1 3 <0.001 <0.001 <0.001 1
Roebourne 2 6.19 6.63 6.63 1 2 2 <0.001 0.002 <0.001 0 (1)Wickham 2 6.63 6.63 6.63 1 1 2 <0.001 0.005 0.003 0 (1)Wyndham 2 0.44 1.33 0.88 1 2 4 0.043 0.059 0.054 0 (1)
(1) No samples required in this 12 month period (2) Data are for samples from previous 5 years averageǂ Nitrate data is converted from laboratory analysis reported as "Nitrate plus Nitrite as Nitrogen" based on the assumption that all nitrite is converted to nitrate under oxidative conditions during sampling.
Samples Taken
Table 26 Health related variablesE. coli Thermophilic Naegleria Fluoride Hydrocarbons Metals
LocalitySamples Taken
Samples >0 cfu/100mL
Max cfu/100mL
Requirement Met
Guideline Met
Samples Taken
Guideline Met
Table 27 Health related variablesNitrateǂ Pesticides Radiological Trihalomethanes Other Health Related
Samples with Thermophilic
NaegleriaRequirement
MetSamples Taken
Concentration (mg/L)Samples Taken
Guideline Met
LocalitySamples Taken
Concentration (mg/L) Guideline Met
Samples Taken
Requirement Met
Samples Taken
Guideline Met
Samples Taken
Concentration (mg/L) Guideline Met
Samples Taken
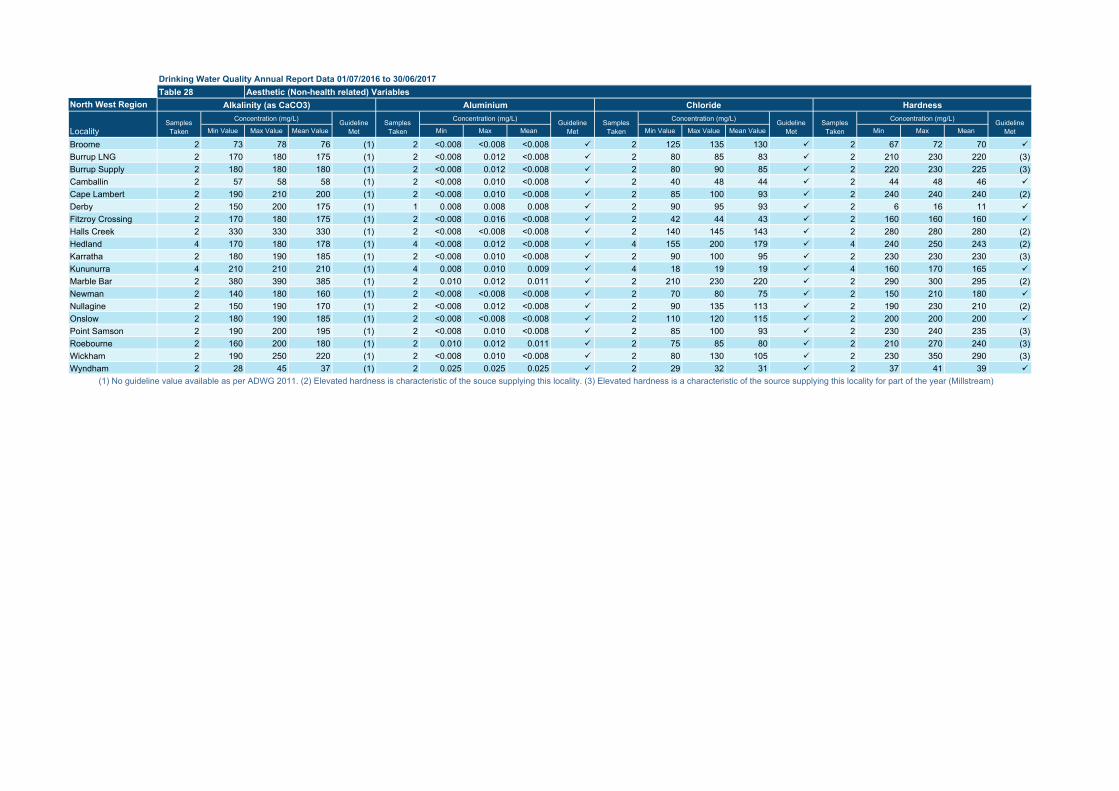
Drinking Water Quality Annual Report Data 01/07/2016 to 30/06/2017
North West Region
Min Value Max Value Mean Value Min Max Mean Min Value Max Value Mean Value Min Max Mean
Broome 2 73 78 76 (1) 2 <0.008 <0.008 <0.008 2 125 135 130 2 67 72 70
Burrup LNG 2 170 180 175 (1) 2 <0.008 0.012 <0.008 2 80 85 83 2 210 230 220 (3)Burrup Supply 2 180 180 180 (1) 2 <0.008 0.012 <0.008 2 80 90 85 2 220 230 225 (3)Camballin 2 57 58 58 (1) 2 <0.008 0.010 <0.008 2 40 48 44 2 44 48 46
Cape Lambert 2 190 210 200 (1) 2 <0.008 0.010 <0.008 2 85 100 93 2 240 240 240 (2)Derby 2 150 200 175 (1) 1 0.008 0.008 0.008 2 90 95 93 2 6 16 11
Fitzroy Crossing 2 170 180 175 (1) 2 <0.008 0.016 <0.008 2 42 44 43 2 160 160 160
Halls Creek 2 330 330 330 (1) 2 <0.008 <0.008 <0.008 2 140 145 143 2 280 280 280 (2)Hedland 4 170 180 178 (1) 4 <0.008 0.012 <0.008 4 155 200 179 4 240 250 243 (2)Karratha 2 180 190 185 (1) 2 <0.008 0.010 <0.008 2 90 100 95 2 230 230 230 (3)Kununurra 4 210 210 210 (1) 4 0.008 0.010 0.009 4 18 19 19 4 160 170 165
Marble Bar 2 380 390 385 (1) 2 0.010 0.012 0.011 2 210 230 220 2 290 300 295 (2)Newman 2 140 180 160 (1) 2 <0.008 <0.008 <0.008 2 70 80 75 2 150 210 180
Nullagine 2 150 190 170 (1) 2 <0.008 0.012 <0.008 2 90 135 113 2 190 230 210 (2)Onslow 2 180 190 185 (1) 2 <0.008 <0.008 <0.008 2 110 120 115 2 200 200 200
Point Samson 2 190 200 195 (1) 2 <0.008 0.010 <0.008 2 85 100 93 2 230 240 235 (3)Roebourne 2 160 200 180 (1) 2 0.010 0.012 0.011 2 75 85 80 2 210 270 240 (3)Wickham 2 190 250 220 (1) 2 <0.008 0.010 <0.008 2 80 130 105 2 230 350 290 (3)Wyndham 2 28 45 37 (1) 2 0.025 0.025 0.025 2 29 32 31 2 37 41 39
(1) No guideline value available as per ADWG 2011. (2) Elevated hardness is characteristic of the souce supplying this locality. (3) Elevated hardness is a characteristic of the source supplying this locality for part of the year (Millstream)
Guideline Met
Guideline Met
Samples Taken
Concentration (mg/L) Guideline Met
Samples Taken
Concentration (mg/L)Concentration (mg/L)
LocalitySamples
Taken
Concentration (mg/L) Guideline Met
Samples Taken
Table 28 Aesthetic (Non-health related) VariablesAlkalinity (as CaCO3) Aluminium Chloride Hardness
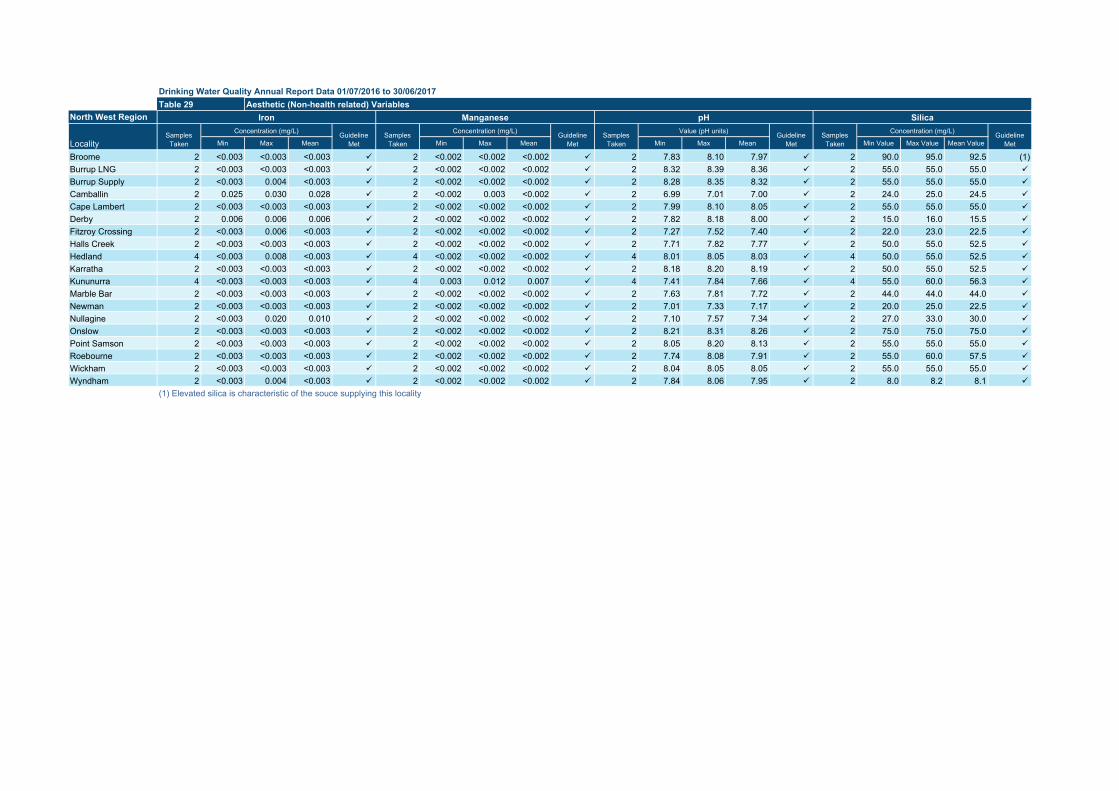
Drinking Water Quality Annual Report Data 01/07/2016 to 30/06/2017
North West Region
Min Max Mean Min Max Mean Min Max Mean Min Value Max Value Mean Value
Broome 2 <0.003 <0.003 <0.003 2 <0.002 <0.002 <0.002 2 7.83 8.10 7.97 2 90.0 95.0 92.5 (1)Burrup LNG 2 <0.003 <0.003 <0.003 2 <0.002 <0.002 <0.002 2 8.32 8.39 8.36 2 55.0 55.0 55.0
Burrup Supply 2 <0.003 0.004 <0.003 2 <0.002 <0.002 <0.002 2 8.28 8.35 8.32 2 55.0 55.0 55.0
Camballin 2 0.025 0.030 0.028 2 <0.002 0.003 <0.002 2 6.99 7.01 7.00 2 24.0 25.0 24.5
Cape Lambert 2 <0.003 <0.003 <0.003 2 <0.002 <0.002 <0.002 2 7.99 8.10 8.05 2 55.0 55.0 55.0
Derby 2 0.006 0.006 0.006 2 <0.002 <0.002 <0.002 2 7.82 8.18 8.00 2 15.0 16.0 15.5
Fitzroy Crossing 2 <0.003 0.006 <0.003 2 <0.002 <0.002 <0.002 2 7.27 7.52 7.40 2 22.0 23.0 22.5
Halls Creek 2 <0.003 <0.003 <0.003 2 <0.002 <0.002 <0.002 2 7.71 7.82 7.77 2 50.0 55.0 52.5
Hedland 4 <0.003 0.008 <0.003 4 <0.002 <0.002 <0.002 4 8.01 8.05 8.03 4 50.0 55.0 52.5
Karratha 2 <0.003 <0.003 <0.003 2 <0.002 <0.002 <0.002 2 8.18 8.20 8.19 2 50.0 55.0 52.5
Kununurra 4 <0.003 <0.003 <0.003 4 0.003 0.012 0.007 4 7.41 7.84 7.66 4 55.0 60.0 56.3
Marble Bar 2 <0.003 <0.003 <0.003 2 <0.002 <0.002 <0.002 2 7.63 7.81 7.72 2 44.0 44.0 44.0
Newman 2 <0.003 <0.003 <0.003 2 <0.002 <0.002 <0.002 2 7.01 7.33 7.17 2 20.0 25.0 22.5
Nullagine 2 <0.003 0.020 0.010 2 <0.002 <0.002 <0.002 2 7.10 7.57 7.34 2 27.0 33.0 30.0
Onslow 2 <0.003 <0.003 <0.003 2 <0.002 <0.002 <0.002 2 8.21 8.31 8.26 2 75.0 75.0 75.0
Point Samson 2 <0.003 <0.003 <0.003 2 <0.002 <0.002 <0.002 2 8.05 8.20 8.13 2 55.0 55.0 55.0
Roebourne 2 <0.003 <0.003 <0.003 2 <0.002 <0.002 <0.002 2 7.74 8.08 7.91 2 55.0 60.0 57.5
Wickham 2 <0.003 <0.003 <0.003 2 <0.002 <0.002 <0.002 2 8.04 8.05 8.05 2 55.0 55.0 55.0
Wyndham 2 <0.003 0.004 <0.003 2 <0.002 <0.002 <0.002 2 7.84 8.06 7.95 2 8.0 8.2 8.1
(1) Elevated silica is characteristic of the souce supplying this locality
Guideline Met
Guideline Met
Samples Taken
Value (pH units) Guideline Met
Samples Taken
Concentration (mg/L)Concentration (mg/L)
LocalitySamples
Taken
Concentration (mg/L) Guideline Met
Samples Taken
Table 29 Aesthetic (Non-health related) VariablesIron Manganese pH Silica
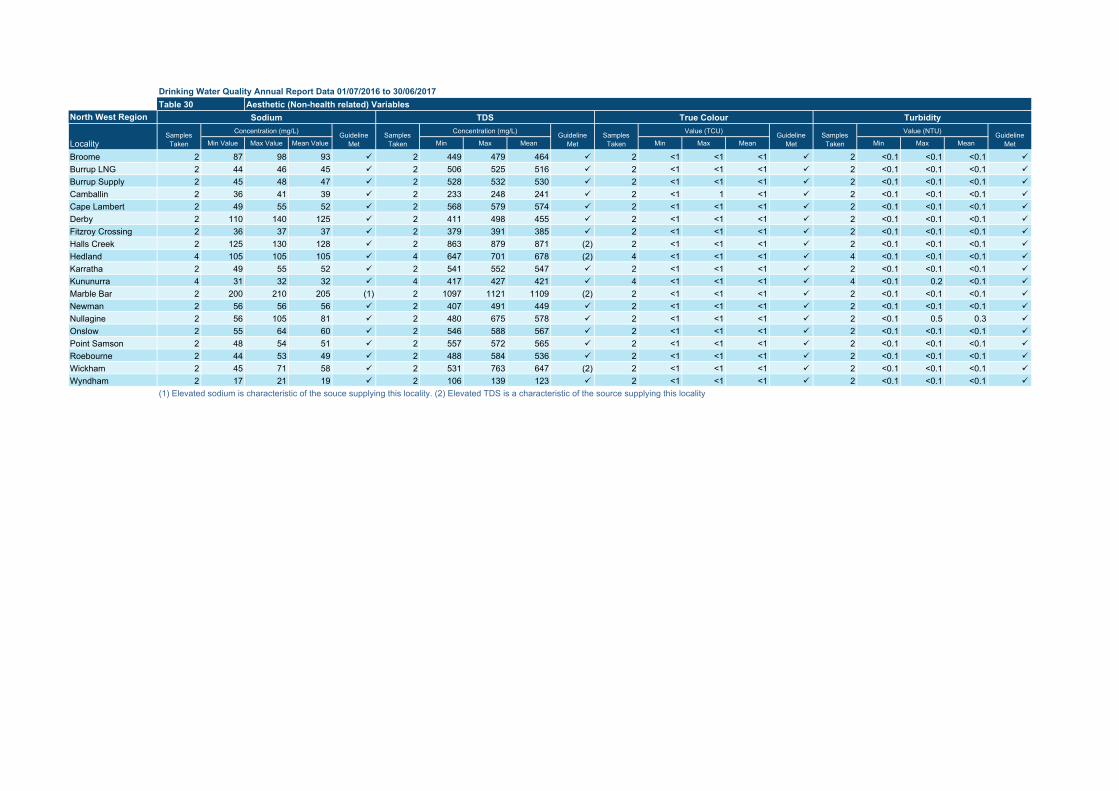
Drinking Water Quality Annual Report Data 01/07/2016 to 30/06/2017
North West Region
Min Value Max Value Mean Value Min Max Mean Min Max Mean Min Max Mean
Broome 2 87 98 93 2 449 479 464 2 <1 <1 <1 2 <0.1 <0.1 <0.1
Burrup LNG 2 44 46 45 2 506 525 516 2 <1 <1 <1 2 <0.1 <0.1 <0.1
Burrup Supply 2 45 48 47 2 528 532 530 2 <1 <1 <1 2 <0.1 <0.1 <0.1
Camballin 2 36 41 39 2 233 248 241 2 <1 1 <1 2 <0.1 <0.1 <0.1
Cape Lambert 2 49 55 52 2 568 579 574 2 <1 <1 <1 2 <0.1 <0.1 <0.1
Derby 2 110 140 125 2 411 498 455 2 <1 <1 <1 2 <0.1 <0.1 <0.1
Fitzroy Crossing 2 36 37 37 2 379 391 385 2 <1 <1 <1 2 <0.1 <0.1 <0.1
Halls Creek 2 125 130 128 2 863 879 871 (2) 2 <1 <1 <1 2 <0.1 <0.1 <0.1
Hedland 4 105 105 105 4 647 701 678 (2) 4 <1 <1 <1 4 <0.1 <0.1 <0.1
Karratha 2 49 55 52 2 541 552 547 2 <1 <1 <1 2 <0.1 <0.1 <0.1
Kununurra 4 31 32 32 4 417 427 421 4 <1 <1 <1 4 <0.1 0.2 <0.1
Marble Bar 2 200 210 205 (1) 2 1097 1121 1109 (2) 2 <1 <1 <1 2 <0.1 <0.1 <0.1
Newman 2 56 56 56 2 407 491 449 2 <1 <1 <1 2 <0.1 <0.1 <0.1
Nullagine 2 56 105 81 2 480 675 578 2 <1 <1 <1 2 <0.1 0.5 0.3
Onslow 2 55 64 60 2 546 588 567 2 <1 <1 <1 2 <0.1 <0.1 <0.1
Point Samson 2 48 54 51 2 557 572 565 2 <1 <1 <1 2 <0.1 <0.1 <0.1
Roebourne 2 44 53 49 2 488 584 536 2 <1 <1 <1 2 <0.1 <0.1 <0.1
Wickham 2 45 71 58 2 531 763 647 (2) 2 <1 <1 <1 2 <0.1 <0.1 <0.1
Wyndham 2 17 21 19 2 106 139 123 2 <1 <1 <1 2 <0.1 <0.1 <0.1
(1) Elevated sodium is characteristic of the souce supplying this locality. (2) Elevated TDS is a characteristic of the source supplying this locality
Value (NTU)Guideline Met
Samples Taken
Value (TCU) Guideline Met
Samples TakenLocality
Samples Taken
Concentration (mg/L) Guideline Met
Samples Taken
Concentration (mg/L)
Table 30 Aesthetic (Non-health related) VariablesSodium TDS True Colour Turbidity
Guideline Met