Embed Size (px)
Citation preview

T 071003 Study no. 2611 eB Copy
{ October 2007 }
A report prepared by
CONTENTS
1. Legal Framework and Current Situation
1.1 General
1.2 Tariffs
1.3 Metering
2. The Lisbon Municipality Case: EPAL
2.1 Water Supply and Consumption
2.2 Tariffs
2.3 Metering, reading and billing
Page | 1
1. Legal Framework and Current Situation
1.1 General
Traditionally, in Portugal water distribution services have been a responsibility of the municipalities, except in the city of Lisbon, where, since 1867, there is a company holding the concession of these services1.
The Portuguese “Administrative Code” (1940)2 sets out that town councils have the task of ensuring the “public supply of water” and should “build and maintain public distribution networks of water for domestic consumption”. The same code established that, for the purpose of providing water distribution services, town councils had the competences of (a) to municipalise the services, (b) to lease the service facilities to third parties, (c) to award concession of the services to third parties.
In the 70’s and 80’s, following the new constitution of 1976, more autonomy was granted to town councils3. Their competences on water distribution remained the same, and some aspects were clarified (namely through the Decree‐Law no. 77/84, clearly assigning municipalities responsibilities for investing in municipal water distribution systems, and through the Decree‐Law no. 100/84, allowing town councils to establish tariffs for providing public services of water supply).
In the 90’s the functioning and statutory regulation of “inter‐municipal systems” or “multi‐municipal systems” were institutionalised. At the same time, the regime for awarding concessions for water supply systems though competitive public tender was established. The supply systems were structured into 2 major areas: (a) bulk supply or “high pressure”, and (b) retail supply or “low pressure”.
The strategy underlying these changes had 3 major orientations4:
• To assign town councils the responsibility for building and operating the systems for distributing drinking water and treating waste water, and to the central state, in co‐
1 The initial company, Companhia das Águas de Lisboa, has been replaced by the current EPAL – Empresa Portuguesa das Águas Livres, SA 2 Decree-Law no. 31 095, 31st December 1940 3 For centuries the political power in Portugal has been based on 2 main pillars: the central ruling system in Lisbon and the town councils (currently governing over 300 municipalities), without any intermediate or regional power. After the revolution of 1975 the system remained basically the same, with the exception of the regions of the Atlantic islands (Azores and Madeira), which gained a relatively autonomous statute in the mid 70’s, with elected regional parliaments and governments. In Portugal, the municipalities have average demographic and surface dimensions well above the European averages (32,500 inhabitants vs. 1,580 in France, 4,935 in Germany, 4,930 in Spain and 7,130 in Italy and 301 sq km vs. 15 in France, 37 in Italy, 62 in Spain and 136 in Germany). These dimensions are larger only in the United Kingdom (118,440 inhabitants and 504 sq km). The relatively large size of Portuguese municipalities has been mentioned as one of the explanations for the “delay” in the regionalisation of the country [Source: Juan Mozzicafreddo (2003),municipal data for 1995] 4 IRAR (2006)

Page | 2
operation with the municipalities, the responsibility for building the bulk water, or “high pressure”, supply systems;
• To institutionalise the indirect management of the water supply and distribution systems, through the concession to specialised private companies;
• To institutionalise the joint management (central state and the municipalities) of inter‐municipal systems (bulk supply), following a model inspired in the functioning of private companies.
During this period Águas de Portugal SA (AdP) was formed as a private company wholly owned by the central state and acting as a holding company of several operating firms active in the water supply, waste water treatment and urban waste businesses.
In 1998 a new public entity was created, IRAR5, as the regulating authority of the water and waste sectors.
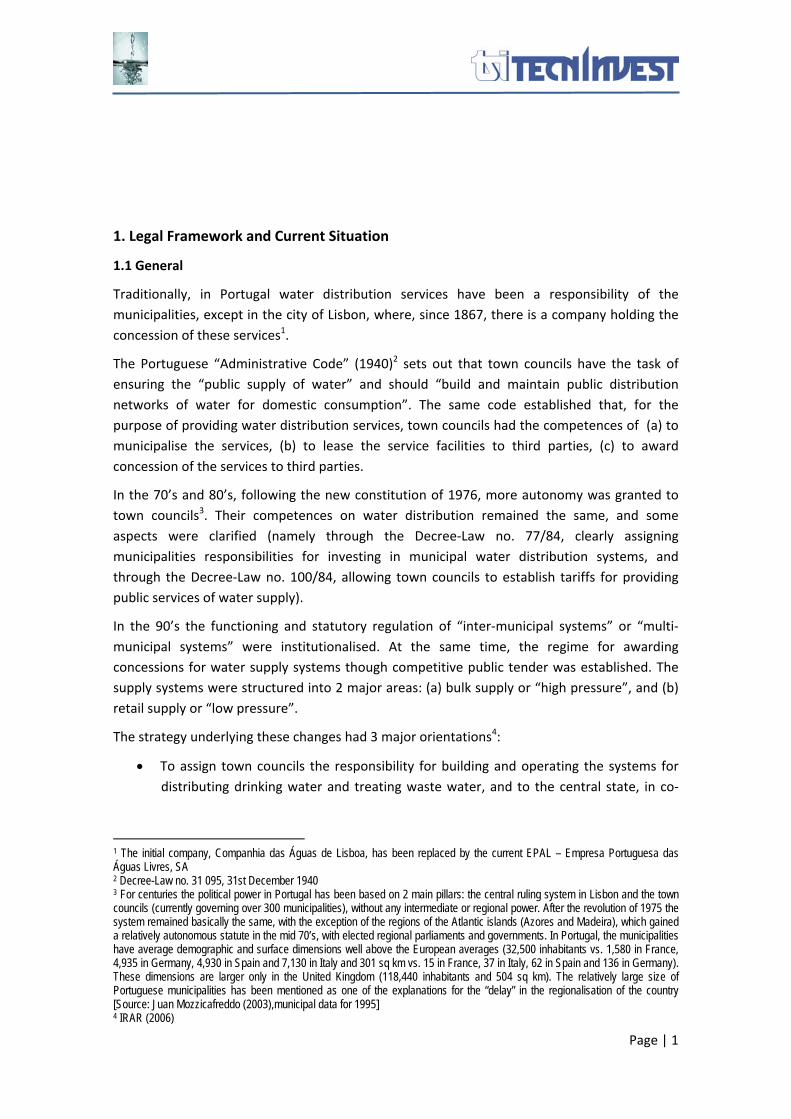
Exhibit 16 shows how the bulk water supply system is organised in Portugal. About 72 percent of the population is served by inter‐municipal concessions, followed by town councils and municipal departments (17%)7.
Most of the operators are Inter‐municipal concessionaires which are controlled by the state holding AdP8. Typically, the town councils of the areas served by these concessions have minority interests in the concessionaire.
As to the retail distribution of water (Exhibit 26), municipalities provide water supply services to domestic and non‐domestic consumers using different settings:
• Directly by the town council services
• Municipal semi‐autonomous departments (separate management, own accounting)9
5 IRAR – Instituto Regulador de Águas e Resíduos. Created by Decree-Law no. 230/97. IRAR statutes were published by Decree-law no. 362/98 and changed by Decree-Law no. 151/2002. 6 Source: Lopes, Lídia et al (2006) 7 In 2005 and for mainland Portugal (exclusive of Madeira and Azores archipelagos). 8 In 2005, AdP was in control of more than 70% of the companies active in the water and sanitation businesses through its subsidiaries Aquapor, Lusaqua and EGF. Source: IRAR (2006) 9 These departmens are known as SMAS – Serviços Municipalizados de Águas e Saneamento (Municipalised Services of Water and Sanitation).
Exhibit 1 – Bulk distributors of drinking water
Page | 3
• Municipal or inter‐municipal companies (separate entity, wholly owned by the municipality or several municipalities)
• Municipal or inter‐municipal concessionaires (concessions are awarded upon competitive public tender procedures, either by one municipality or by an association of several municipalities)
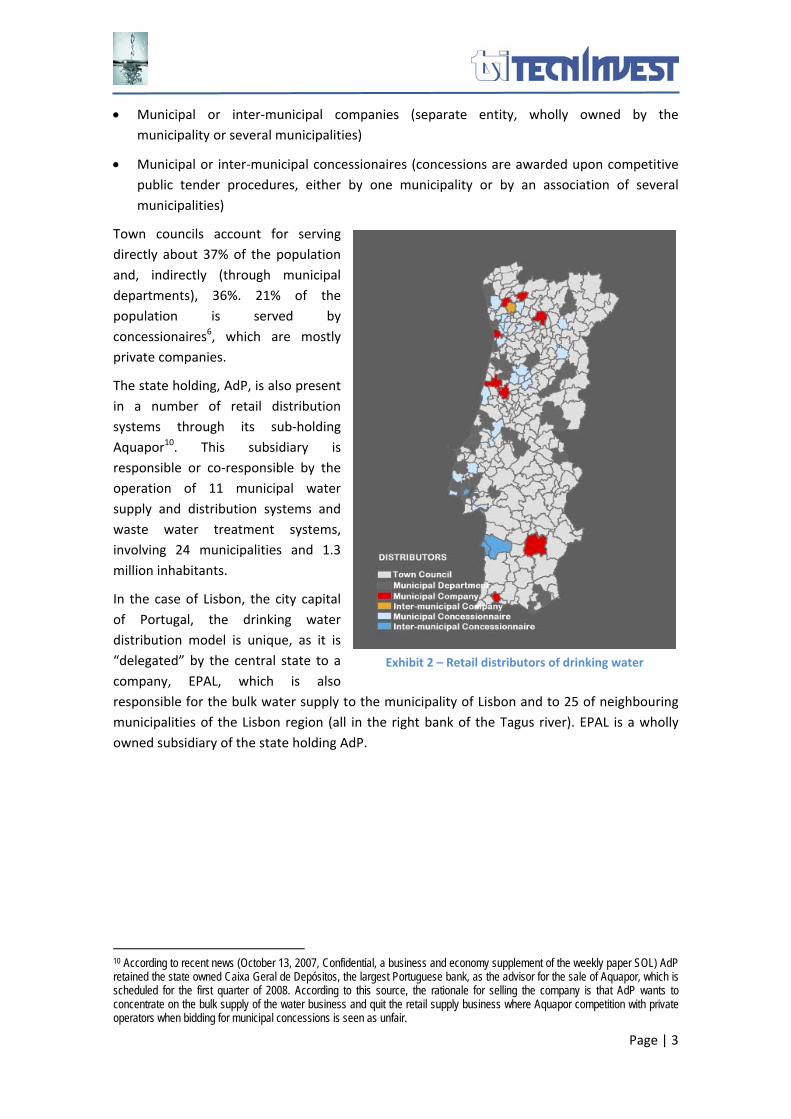
Town councils account for serving directly about 37% of the population and, indirectly (through municipal departments), 36%. 21% of the population is served by concessionaires6, which are mostly private companies.
The state holding, AdP, is also present in a number of retail distribution systems through its sub‐holding Aquapor10. This subsidiary is responsible or co‐responsible by the operation of 11 municipal water supply and distribution systems and waste water treatment systems, involving 24 municipalities and 1.3 million inhabitants.
In the case of Lisbon, the city capital of Portugal, the drinking water distribution model is unique, as it is “delegated” by the central state to a company, EPAL, which is also responsible for the bulk water supply to the municipality of Lisbon and to 25 of neighbouring municipalities of the Lisbon region (all in the right bank of the Tagus river). EPAL is a wholly owned subsidiary of the state holding AdP.
10 According to recent news (October 13, 2007, Confidential, a business and economy supplement of the weekly paper SOL) AdP retained the state owned Caixa Geral de Depósitos, the largest Portuguese bank, as the advisor for the sale of Aquapor, which is scheduled for the first quarter of 2008. According to this source, the rationale for selling the company is that AdP wants to concentrate on the bulk supply of the water business and quit the retail supply business where Aquapor competition with private operators when bidding for municipal concessions is seen as unfair.
Exhibit 2 – Retail distributors of drinking water

Page | 4
1.2 Tariffs
The 1940 “Administrative Code” assigned town councils the right to establish taxes and to its municipal services departments the competence to establish tariffs. In the 80’s the right to establish taxes was assigned to the municipal assemblies and the right to set out tariffs remained with the town councils. This system remained basically the same since then.
In the nineties, the basis for awarding concessions for water supply and waste water treatment within inter‐municipal systems was set out, as well as the criteria for establishing the tariffs for these services11. According to these criteria, the tariffs should be designed in such way that ensures:
• The recovery, via depreciation, of the initial investment in fixed assets incurred by the concessionaire;
• The cost of maintaining, repairing and renovating the assets assigned to the concession;
• The recovery, via depreciation, of all expansion or modernization investment costs incurred by the concessionaire;
• The coverage of all costs needed to guarantee an efficient management of the system;
• The adequate remuneration of share capital of the concessionaire.
The legislation that set out the rules and criteria for the concessions also established the main principle governing the tariffication of water supplying services as follows: “The principle of the economic value of the water, which acknowledges the current or future scarcity of this resource and the need to ensure that its utilisation is economically efficient, thus recovering all costs entailed by the water services, including the environmental ones, having as a basis the principles of ‘polluter‐pays’ and ‘user‐pays’”12.
The IRAR statutes, approved during the same period, assigned to this regulating institute the task of giving its opinion on the water tariff systems proposed by the concessionaires, and to follow up how the tariffs would be evolving along the time, as well as to prepare the appropriate regulations to ensure that the application of tariffs follows fair criteria.
In general, drinking water retail tariffs are set out by town councils or agreed upon with concessionaires in accordance with the legislation mentioned above. According to research studies recently conducted13, the average prices for residential clients with annual consumption of 120 and 200 m3 have increased between 4 and 6%, per year, between 2002 and 2004, depending on the consumption level. They are summarized in the following table.
Table 1 – Weighted average of consumer prices Annual Consumption (m3)
2002
2004 Change (%)
120 0.534 €/m3 0.609 €/m3 14200 0.759 €/m3 0.828 €/m3 9
11 Decree-law no. 319/94 and Decree-law no. 162/96 12 Lopes, Lídia et al (2006) 13 Lopes, Lídia et al (2004) and Lopes, Lídia et al (2006)
Page | 5
This table also shows that progressive tariffs14 are widely used in Portugal, though having variations in the fixed and proportional amounts and in the number of consumption level brackets.
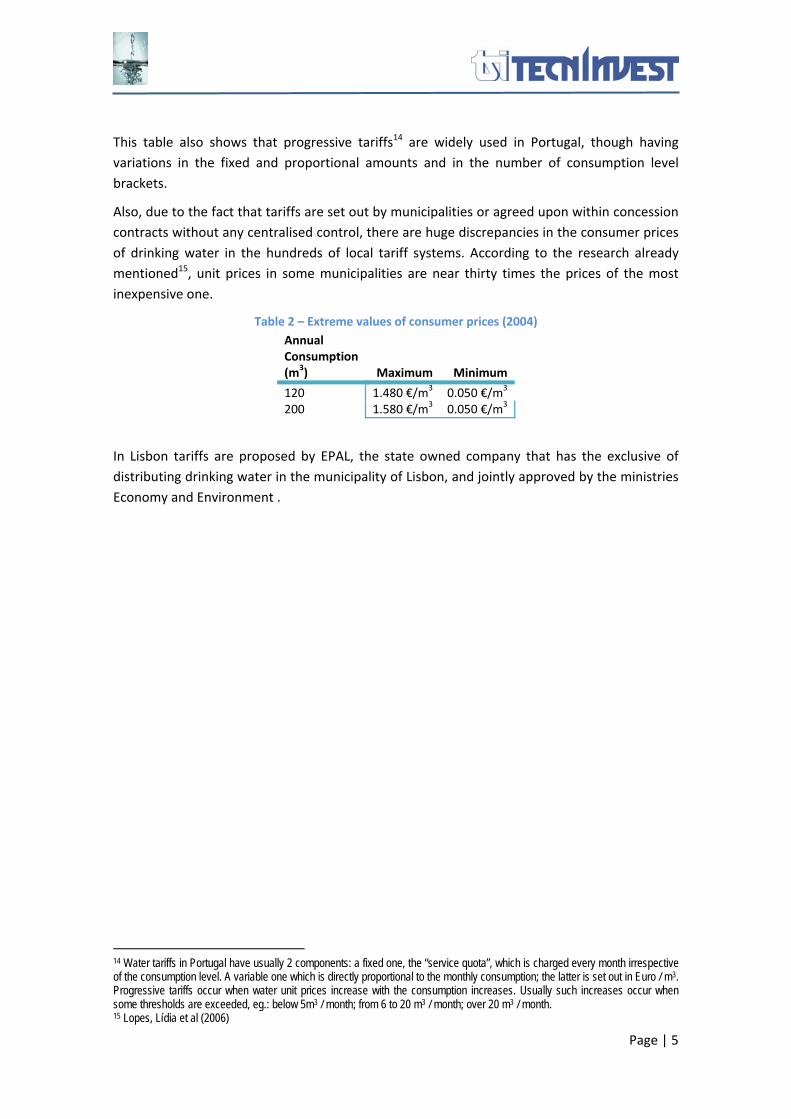
Also, due to the fact that tariffs are set out by municipalities or agreed upon within concession contracts without any centralised control, there are huge discrepancies in the consumer prices of drinking water in the hundreds of local tariff systems. According to the research already mentioned15, unit prices in some municipalities are near thirty times the prices of the most inexpensive one.
Table 2 – Extreme values of consumer prices (2004) Annual Consumption(m3) Maximum Minimum
120 1.480 €/m3 0.050 €/m3
200 1.580 €/m3 0.050 €/m3
In Lisbon tariffs are proposed by EPAL, the state owned company that has the exclusive of distributing drinking water in the municipality of Lisbon, and jointly approved by the ministries Economy and Environment .
14 Water tariffs in Portugal have usually 2 components: a fixed one, the “service quota”, which is charged every month irrespective of the consumption level. A variable one which is directly proportional to the monthly consumption; the latter is set out in Euro / m3. Progressive tariffs occur when water unit prices increase with the consumption increases. Usually such increases occur when some thresholds are exceeded, eg.: below 5m3 / month; from 6 to 20 m3 / month; over 20 m3 / month. 15 Lopes, Lídia et al (2006)
Page | 6
1.3 Metering
There are about 4 million meters installed in Portugal. In the Greater Lisbon area there are about 1.4 million, about 350 thousand of which are installed in the municipality of Lisbon. In urban areas, near 90% of meters are installed in residential consumers; this proportion is lower in the municipality of Lisbon (85%, Source: EPAL), where office buildings, institutions (hospital, universities, schools, public services, etc.), hotels, restaurants, etc., have a higher representation. In the hinterland areas, the residential proportion may even attain 92%.
The number of meters per residential consumer is one (1 dwelling, 1 meter). There are no cases of separate meters for the kitchen and the bathroom. But there are cases of high‐standing residential villas where a second meter is installed for the swimming pool.
Building meters (1 meter per apartment building) seldom occur: in some multi‐family buildings or ‘building parks’ (several buildings in a closed condominium) there is a “totalling” meter, installed together with the individual meters of the dwellings. In these cases, consumers are billed according to their own meters, and the building management by the difference of readings (these amounts are treated as condominium common expenses, such as for garages, gardens and swimming pools).
Since the regulations approved in 199516 meters are installed outside the apartments or the (single family) houses or villas. This provision was at that time included in the “municipal regulations” issued by the town councils. In fact, since 30 years ago or so, the municipalities had already begun to install the meters outside the apartments and houses. As all the construction projects must be licensed by the town councils, it was easy for them to swiftly force the location of the meters outside the apartments and buildings, making it easier for their operators to perform the periodic readings, even when dwellers were absent.
In large buildings (either apartment or office buildings) of urban areas, and particularly in Lisbon, since 15 year or so, the practice is to install individual meters in a single battery located at an easily accessible place of the building (typically the ground floor).
16 Regulatory-Decree no. 23/95, setting out the technical general principles of conception, construction and exploitation of public and building systems of water distribution and water drainage.
Page | 7
2. The Lisbon Municipality Case: EPAL
2.1 Water Supply and Consumption
EPAL is the successor of CAL ‐ Companhia das Águas de Lisboa, founded over 100 years ago17 and holder of the water supply concession to the city of Lisbon from the 2nd of April 1868 to the 30th of October 1974 when an extension of the concession contract ended. At that time EPAL ‐ Empresa Pública das Águas de Lisboa was incorporated as a public company (owned by the state and governed by public law), retaining this name until 1981 when it was changed to EPAL ‐ Empresa Pública das Águas Livres.
In 199118 the statute of EPAL ‐ Empresa Pública das Águas Livres was changed into a limited liability company (wholly owned by the state, but governed by private company law). From 1993 it became a part of the AdP.
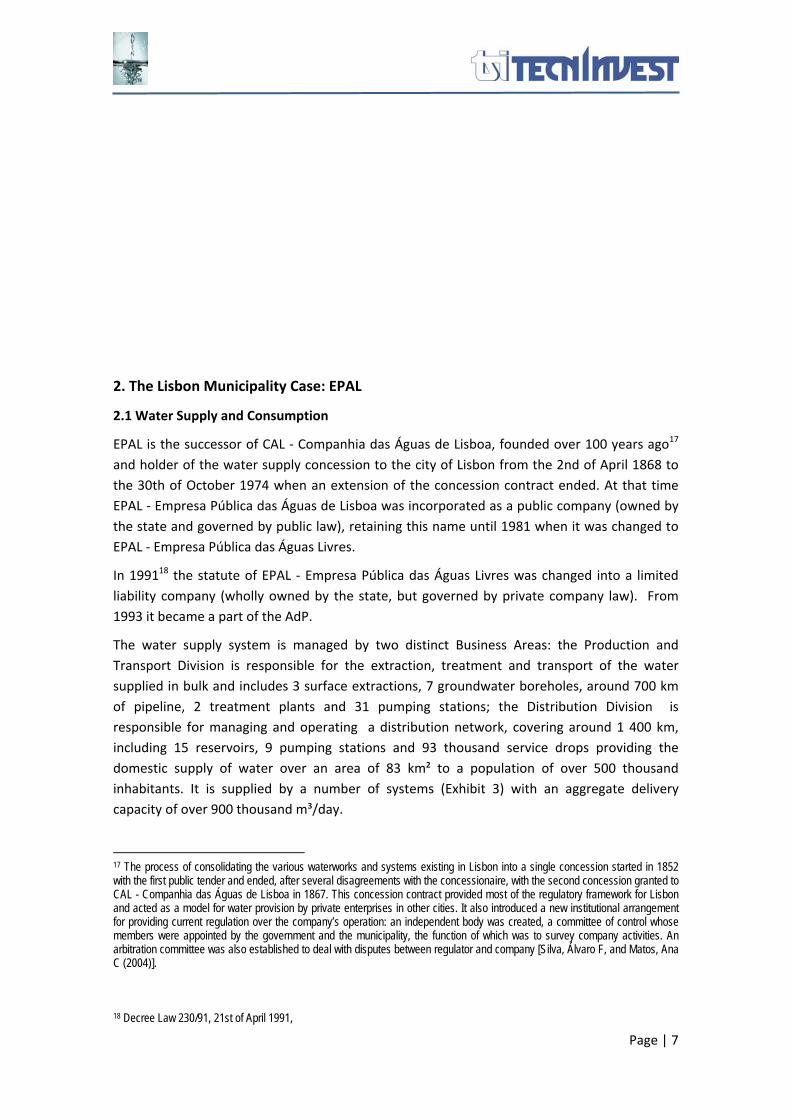
The water supply system is managed by two distinct Business Areas: the Production and Transport Division is responsible for the extraction, treatment and transport of the water supplied in bulk and includes 3 surface extractions, 7 groundwater boreholes, around 700 km of pipeline, 2 treatment plants and 31 pumping stations; the Distribution Division is responsible for managing and operating a distribution network, covering around 1 400 km, including 15 reservoirs, 9 pumping stations and 93 thousand service drops providing the domestic supply of water over an area of 83 km² to a population of over 500 thousand inhabitants. It is supplied by a number of systems (Exhibit 3) with an aggregate delivery capacity of over 900 thousand m³/day.
17 The process of consolidating the various waterworks and systems existing in Lisbon into a single concession started in 1852 with the first public tender and ended, after several disagreements with the concessionaire, with the second concession granted to CAL - Companhia das Águas de Lisboa in 1867. This concession contract provided most of the regulatory framework for Lisbon and acted as a model for water provision by private enterprises in other cities. It also introduced a new institutional arrangement for providing current regulation over the company’s operation: an independent body was created, a committee of control whose members were appointed by the government and the municipality, the function of which was to survey company activities. An arbitration committee was also established to deal with disputes between regulator and company [Silva, Álvaro F, and Matos, Ana C (2004)]. 18 Decree Law 230/91, 21st of April 1991,
Page | 8
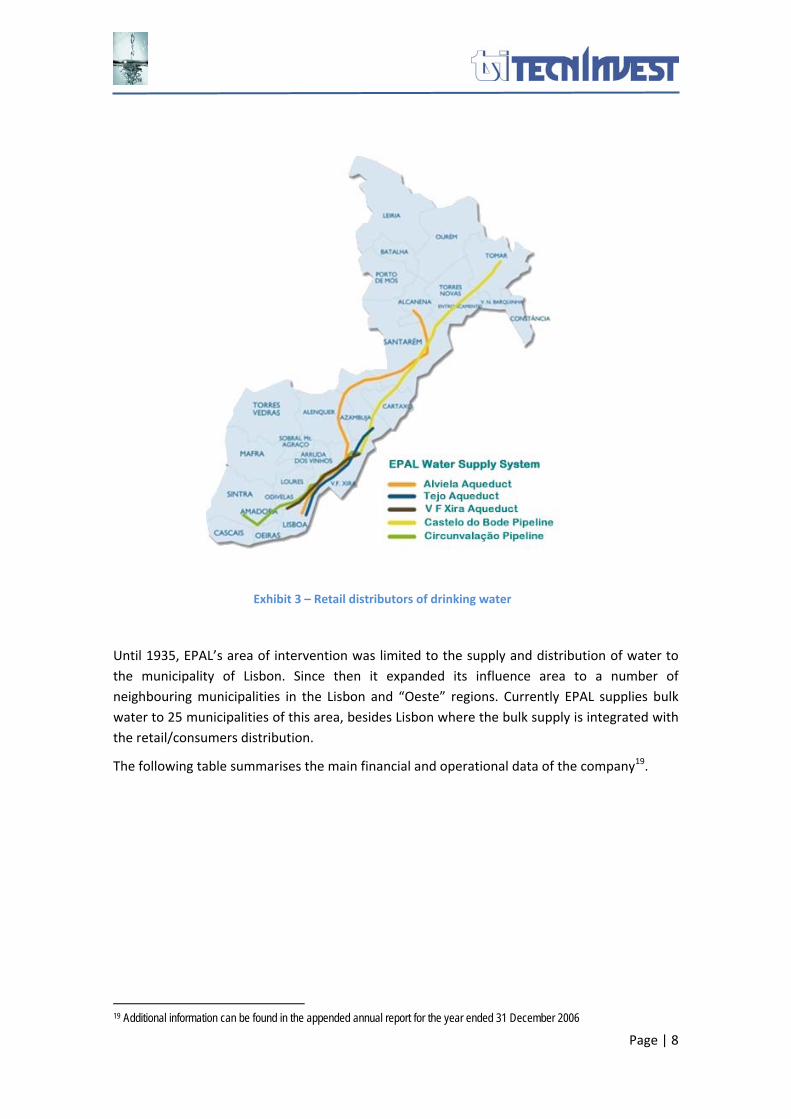
Until 1935, EPAL’s area of intervention was limited to the supply and distribution of water to the municipality of Lisbon. Since then it expanded its influence area to a number of neighbouring municipalities in the Lisbon and “Oeste” regions. Currently EPAL supplies bulk water to 25 municipalities of this area, besides Lisbon where the bulk supply is integrated with the retail/consumers distribution.
The following table summarises the main financial and operational data of the company19.
19 Additional information can be found in the appended annual report for the year ended 31 December 2006
Exhibit 3 – Retail distributors of drinking water
Page | 9
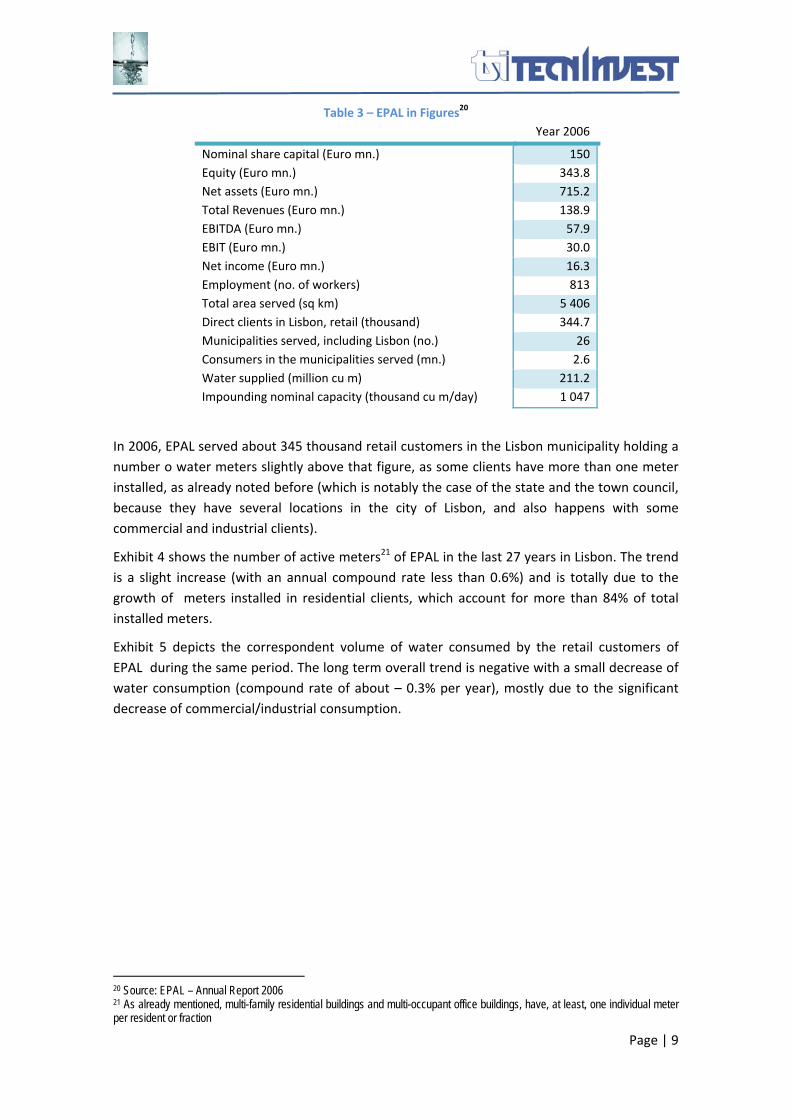
Table 3 – EPAL in Figures20 Year 2006
Nominal share capital (Euro mn.) 150 Equity (Euro mn.) 343.8 Net assets (Euro mn.) 715.2 Total Revenues (Euro mn.) 138.9 EBITDA (Euro mn.) 57.9 EBIT (Euro mn.) 30.0 Net income (Euro mn.) 16.3 Employment (no. of workers) 813 Total area served (sq km) 5 406 Direct clients in Lisbon, retail (thousand) 344.7 Municipalities served, including Lisbon (no.) 26 Consumers in the municipalities served (mn.) 2.6 Water supplied (million cu m) 211.2 Impounding nominal capacity (thousand cu m/day) 1 047
In 2006, EPAL served about 345 thousand retail customers in the Lisbon municipality holding a number o water meters slightly above that figure, as some clients have more than one meter installed, as already noted before (which is notably the case of the state and the town council, because they have several locations in the city of Lisbon, and also happens with some commercial and industrial clients).
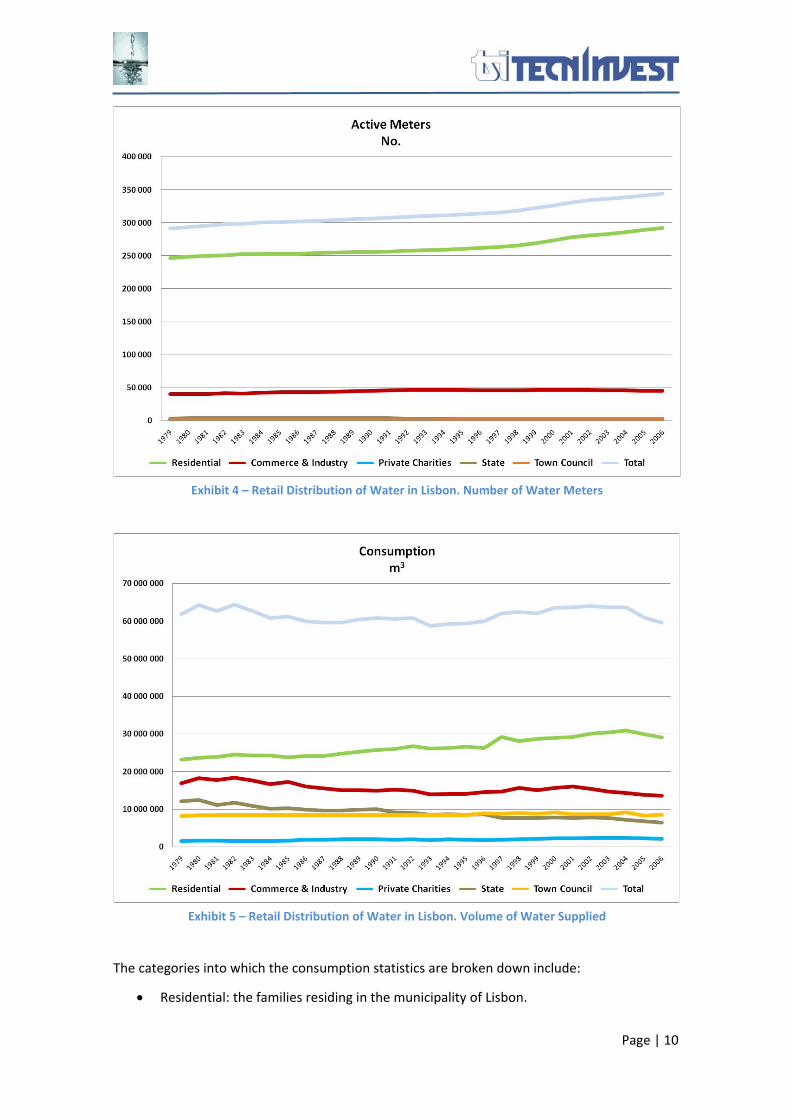
Exhibit 4 shows the number of active meters21 of EPAL in the last 27 years in Lisbon. The trend is a slight increase (with an annual compound rate less than 0.6%) and is totally due to the growth of meters installed in residential clients, which account for more than 84% of total installed meters.
Exhibit 5 depicts the correspondent volume of water consumed by the retail customers of EPAL during the same period. The long term overall trend is negative with a small decrease of water consumption (compound rate of about – 0.3% per year), mostly due to the significant decrease of commercial/industrial consumption.
20 Source: EPAL – Annual Report 2006 21 As already mentioned, multi-family residential buildings and multi-occupant office buildings, have, at least, one individual meter per resident or fraction
Page | 10
The categories into which the consumption statistics are broken down include:
• Residential: the families residing in the municipality of Lisbon.
Exhibit 4 – Retail Distribution of Water in Lisbon. Number of Water Meters
Exhibit 5 – Retail Distribution of Water in Lisbon. Volume of Water Supplied
Page | 11
• Commerce and Industry: industrial, trade and service companies, including sole proprietor firms, individual traders and free‐lancers.
• Private charities: private institutions providing social services. Though their water consumption is relatively small they are shown separately in the statistics, because they benefit from special tariffs22;
• State: ministries, departments and government agencies as well as state owned hospitals, schools, prisons and other institutions;
• Town Council: includes the various services and agencies of the Lisbon city municipality, notably office buildings, pools, etc., and the water used for irrigating public gardens.
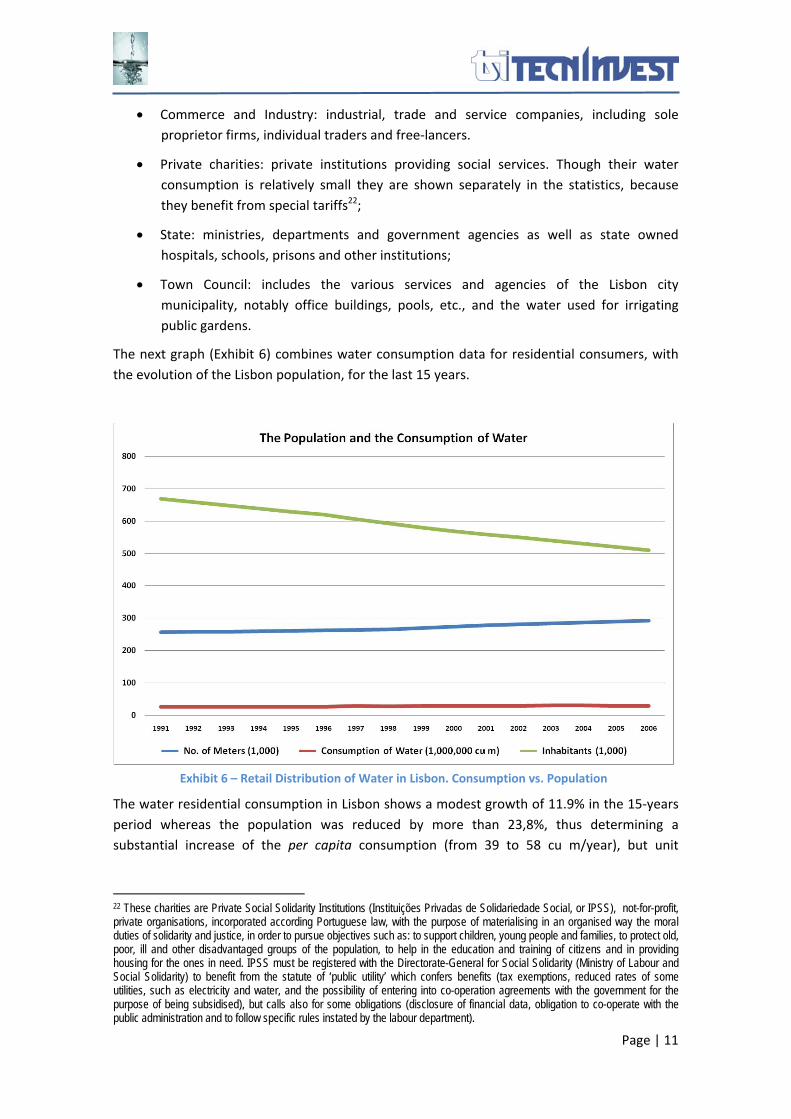
The next graph (Exhibit 6) combines water consumption data for residential consumers, with the evolution of the Lisbon population, for the last 15 years.
The water residential consumption in Lisbon shows a modest growth of 11.9% in the 15‐years period whereas the population was reduced by more than 23,8%, thus determining a substantial increase of the per capita consumption (from 39 to 58 cu m/year), but unit
22 These charities are Private Social Solidarity Institutions (Instituições Privadas de Solidariedade Social, or IPSS), not-for-profit, private organisations, incorporated according Portuguese law, with the purpose of materialising in an organised way the moral duties of solidarity and justice, in order to pursue objectives such as: to support children, young people and families, to protect old, poor, ill and other disadvantaged groups of the population, to help in the education and training of citizens and in providing housing for the ones in need. IPSS must be registered with the Directorate-General for Social Solidarity (Ministry of Labour and Social Solidarity) to benefit from the statute of ‘public utility’ which confers benefits (tax exemptions, reduced rates of some utilities, such as electricity and water, and the possibility of entering into co-operation agreements with the government for the purpose of being subsidised), but calls also for some obligations (disclosure of financial data, obligation to co-operate with the public administration and to follow specific rules instated by the labour department).
Exhibit 6 – Retail Distribution of Water in Lisbon. Consumption vs. Population

Page | 12
consumption per meter remained practically constant (reduction from 101.5 to 99.6 cu m/meter).
Some facts on the basis this behaviour are:
• Between the census years of 1981 and 2001 (20 years) the population of the Lisbon municipality was reduced from 807.9 to 564.7 thousand inhabitants (‐ 30%), though the population of the Lisbon Metropolitan Area increased from 2.5 to 2.7 million inhabitants (7%)23;
• In the same period, the number of Lisbon inhabitants over 65 years increased from 115.5 to 133.3 thousand (15%), making the elderly population of the city increase from 14% to 24% of total population, which is a figure substantially higher than the national average23;
• The average family size was reduced from 2.8 to 2.4 people in the same period23;
• Only in the second decade of the 20‐years period, the number of dwellings in the Lisbon municipality increases by 5% or about 14,00024.
Due to the steep increase of the price of flats in Lisbon, in the 80’s and 90’s, the population of the modest and low income brackets tended to move to the surrounding municipalities. This was (and still is) particularly the case of young people, when moving away from their parent’s home, that could find less expensive flats in the latter municipalities. At the same time, the more affluent youngster tended to buy flats at the new real estate developments within the Lisbon city. Thus, older quarters tend to be now occupied by the low income elderly, frequently in a single person family setting, and the new neighbourhoods, by young and more affluent families.
These changes determined an alteration of the water consumption pattern in Lisbon: more residential meters were installed because more dwellings were erected, decreasing population but no decreasing water consumption by dwellings because lower income (and less prone to larger water use) people are abandoning the city, and higher income (and more intensive users of water) are staying in the city.
23 Gaspar, Manuel, Teixeira, João and Marques, Zulmira (2005) 24 Salgueiro, Teresa B (2002)

Page | 13
2.2 Tariffs
EPAL, as most of the retail distributors of water Portugal, uses a progressive tariffication system (see section 1.2 Tariffs) since long (more than 25 years). Thus since many years the changes to Lisbon system have been mostly small annual adjustments, notably to account for inflation and some cost increases, as well as some minor adjustments on the number of consumption levels. The company does not carry out any regular research or survey to fine tune its tariffication approach.
Due to its unique status25, EPAL prepares annually a substantiated proposal for changing the tariffs of the next year and submits it to the Ministry of Economy, though the Directorate General of Economic Activities. This department circulates the proposal by various entities, including:
• IRAR, the water and waste regulatory authority;
• DECO, a private consumer association,
• IC, the Consumer Institute, a government agency
Then, the Directorate General collects the non‐binding opinions of the consulted bodies, with the exception of IRAR, and submits the proposal to the Minister of Economy. This, together with the Ministry of Urban Planning, Environment and Regional development (who already had received the opinion of IRAR) produce the final joint approval of the tariffs.
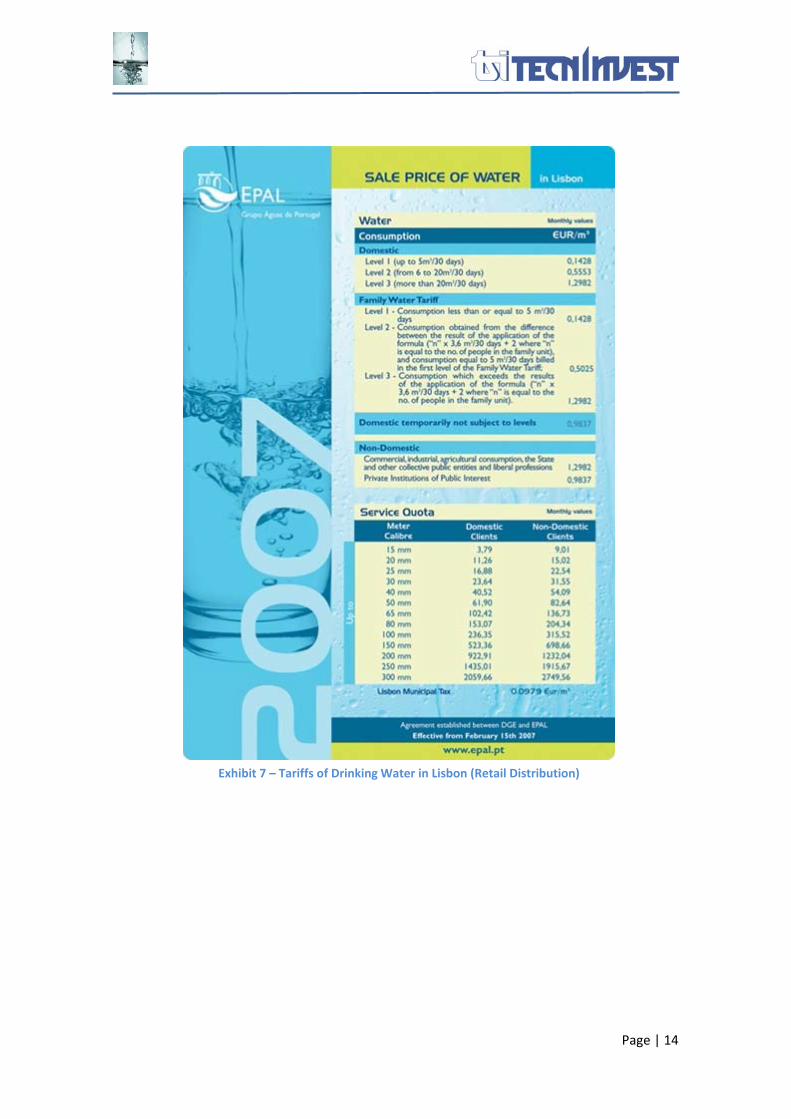
Exhibit 7 shows the currently in force tariffs for the Lisbon city.
25 As mentioned before, EPAL is an operator wholly owned by the state and and having the delegated right to establish retail tariffs in the Lisbon municipality. The governing board of the company is appointed by the government though the ministries of environment
Page | 14
Exhibit 7 – Tariffs of Drinking Water in Lisbon (Retail Distribution)
Page | 15
2.3 Metering, reading and billing
The meters installed at the client premises are read by EPAL once every 6 months unless the customer have a monthly average consumption that exceeds 150 cubic metres, in which case it is read monthly. To ensure that the meters are read, the customers must always provide access to the meters.
Customers can also read the meters themselves, and send the reading to EPAL by phone or uploading it at the company website.
EPAL issues a monthly bill to its clients showing the following major items See also Exhibit 7):
• Billed Water: an unite price applied to the actual or estimated consumption, the unit price depending on the consumption level (currently 3) and the type of consumption (domestic, non‐domestic, etc.);
• Service Quota: a fixed monthly charge amount of which depends on the calibre of the meter installed (currently 13 sizes) and the type of consumption (domestic, non‐domestic), which pays for the cost of providing access to the direct water supply;
• CML supplement: an amount proportional to the volume of water consumed (currently Euro 0.0979/cu m), to be transferred to the town council to cover municipal consumption of water for community uses, such as street washing, public fountains, garden irrigation;
• Sewerage Charge: this charge includes a fixed (Euro 0.018/month) and a variable (0.19/cu m), to be transferred to the town council to cover the costs of running and maintaining the municipal sewage and wastewater systems;
• Value Added Tax: it is charged only on water consumption for levels 2 and 3 (over 5 cu m/month) at a 5% rate.
Page | 16
2.4 Water Quality
EPAL has 3 laboratories which are responsible for monitoring the quality of water at different stages of the extraction, transport and distribution operations:
• The Central Laboratory was accredited in 1999 by the IPAC – the Portuguese Accrediting Institute, by NP EN ISO/IEC 17 025 standard, to perform 171 parameters/species. The laboratory runs the Water Quality Monitoring Program for the whole supply system. Water samples are taken regularly at around 1,026 sampling points and 162 water quality parameters analysed. Around 180 000 analyses are produced every year. A specimen of an analysis report is appended.
• The Asseiceira Laboratory is accredited since 1996 to NP EN ISO/IEC 17.025 standard, with certificate no. 96/L.200, for 38 analytical parameters, 27 of which are physical and chemical and 10 microbiological. This laboratory performs the control of the water collected from the Castelo do Bode dam and treated in the Asseiceira Water Treatment Plant.
• The Meter Laboratory was accredited under NP EN ISO 45001, subsequently making the transition to NP EN ISO/IEC 17 025. This is also a Meteorological Verification Body since 1994, and has the qualification of Qualified Repairer since 1990 and of Qualified fitter of cold drinking water meters since 2001.
Lisbon, 17 October 2007
Page | 17
Bibliography
Gaspar, Manuel, Teixeira, João and Marques, Zulmira (2005), Lisboa: o desafio da mobilidade [Lisbon: the mobility chalenge], Câmara Municipal de Lisboa (Lisbon Town Council), Lisbon, July 2005
INE (2007 …), Demographic Statistics, National Institute of Statistics, Lisbon, Several Years
IRAR (2006), Relatório Anual do Sector de Águas e Resíduos em Portugal [Annual Report of the Water and Waste Sector in Portugal], IRAR – Instituto Regulador de Águas e Resíduos, Volume 1, Lisbon, December 2006
Lopes, Lídia et al (2004), Abastecimento de Água em Portugal – Mercado e Preços [Water Supply in Portugal – Market and Prices], APDA, Economy Commission, Lisbon, July 2004
Lopes, Lídia et al (2006), Água e Saneamento em Portugal – Mercado e Preços [Water and Sanitation in Portugal – Market and Prices], APDA, Economy Commission, Lisbon, July 2006
Mozzicafreddo, Juan (2003), La Décentralisation Administrative et les Innovations em Matiére de Politiques Régionalles au Portugal, Sociologia, Problemas e Práticas, no. 41, 2003, pp. 151‐179
Salgueiro, Teresa B (2002), Desenvolvimento Urbano de Lisboa [Urban Development of Lisbon], INE, Revista de Estudos Regionais, Lisbon, 2nd semester 2002
Santos, Rui F (2006), As Políticas Tarifárias no Sector da Água [Tariffication Policies in Water Sector], APRH Technical Conference on the Economy of the Water, Lisbon, October 2006
Silva, Álvaro F, and Matos, Ana C (2004),The Networked City: Managing Power and Water Utilities in Portugal, 1850s‐1920s, Business and Economic History On‐line, H‐Net, Michigan State University, Volume 2, 2004
Page | 18
Appendices
EPAL – Annual Report 2006
EPAL – Tap water quality report, July 2007
2006Annual report

EPAL - Empresa Portuguesa das Águas Livres, S.A.Annual report 2006

5
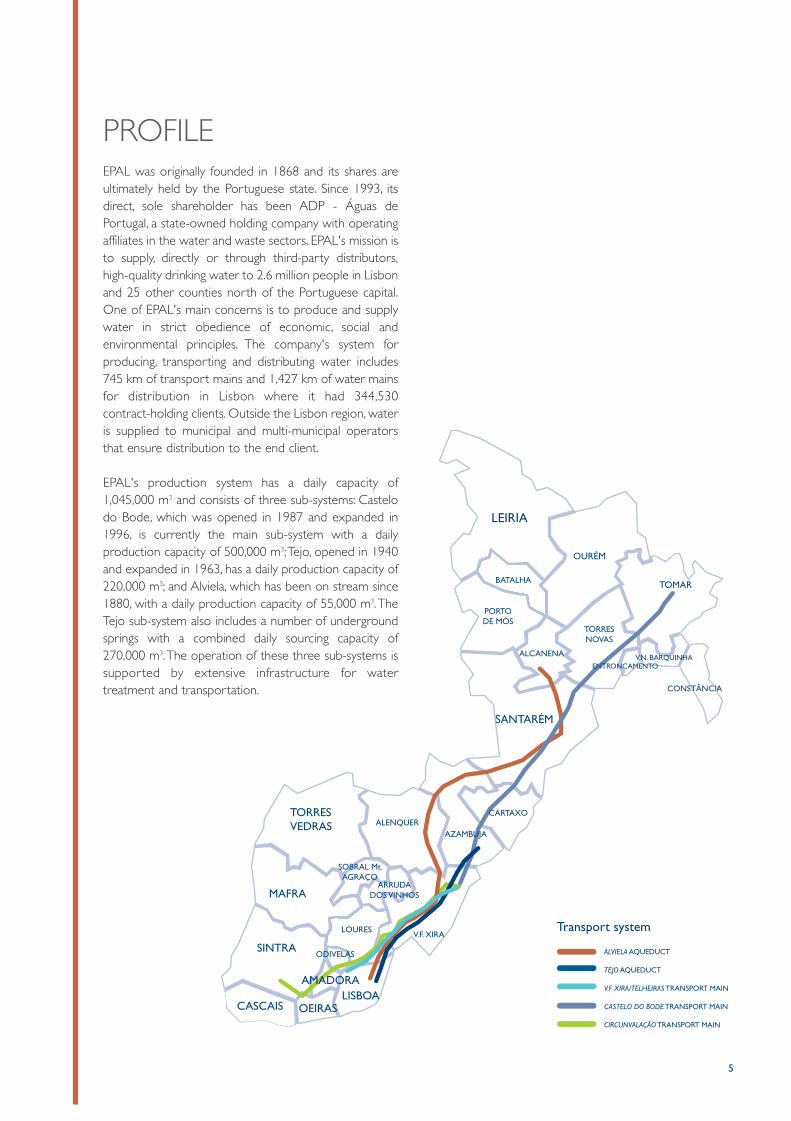
PROFILEEPAL was originally founded in 1868 and its shares areultimately held by the Portuguese state. Since 1993, itsdirect, sole shareholder has been ADP - Águas dePortugal, a state-owned holding company with operatingaffiliates in the water and waste sectors. EPAL's mission isto supply, directly or through third-party distributors,high-quality drinking water to 2.6 million people in Lisbonand 25 other counties north of the Portuguese capital.One of EPAL's main concerns is to produce and supplywater in strict obedience of economic, social and environmental principles. The company's system for producing, transporting and distributing water includes745 km of transport mains and 1,427 km of water mainsfor distribution in Lisbon where it had 344,530 contract-holding clients. Outside the Lisbon region, wateris supplied to municipal and multi-municipal operatorsthat ensure distribution to the end client.
EPAL's production system has a daily capacity of1,045,000 m3 and consists of three sub-systems: Castelodo Bode, which was opened in 1987 and expanded in1996, is currently the main sub-system with a daily production capacity of 500,000 m3;Tejo, opened in 1940and expanded in 1963, has a daily production capacity of220,000 m3; and Alviela, which has been on stream since1880, with a daily production capacity of 55,000 m3.TheTejo sub-system also includes a number of undergroundsprings with a combined daily sourcing capacity of270,000 m3.The operation of these three sub-systems issupported by extensive infrastructure for water treatment and transportation.
Transport system
ALVIELA AQUEDUCT
TEJO AQUEDUCT
V.F XIRA/TELHEIRAS TRANSPORT MAIN
CASTELO DO BODE TRANSPORT MAIN
CIRCUNVALAÇÃO TRANSPORT MAIN
LISBOAOEIRASCASCAIS
SINTRA
AMADORA
MAFRA
TORRESVEDRAS
SOBRAL Mt.AGRAÇO
ARRUDADOSVINHOS
LOURES
ODIVELAS
V.F. XIRA
ALENQUERAZAMBUJA
CARTAXO
SANTARÉM
PORTODE MÓS
ALCANENA
BATALHA
LEIRIA
OURÉM
TOMAR
ENTRONCAMENTOV.N. BARQUINHA
TORRESNOVAS
CONSTÂNCIA

CONTENTSContents 7Key indicators 9
MANAGEMENT REPORTChairman's message 9Mission and objectives 13Corporate governance 17From production to distribution 21Water quality 25Non-invoiced water 31Capital expenditure 35Customer care 37Labour policy 41Sustainability 45Other activities 49Financial performance 51Risk management 57Proposed appropriation of net income 59Outlook 61Acknowledgements 63
ACCOUNTSFinancial statements and Notes 65Notes to the financial statements 73Accounting documents required by the official Accounting Plan 99Audit report 105
7
Garrulus glandarius

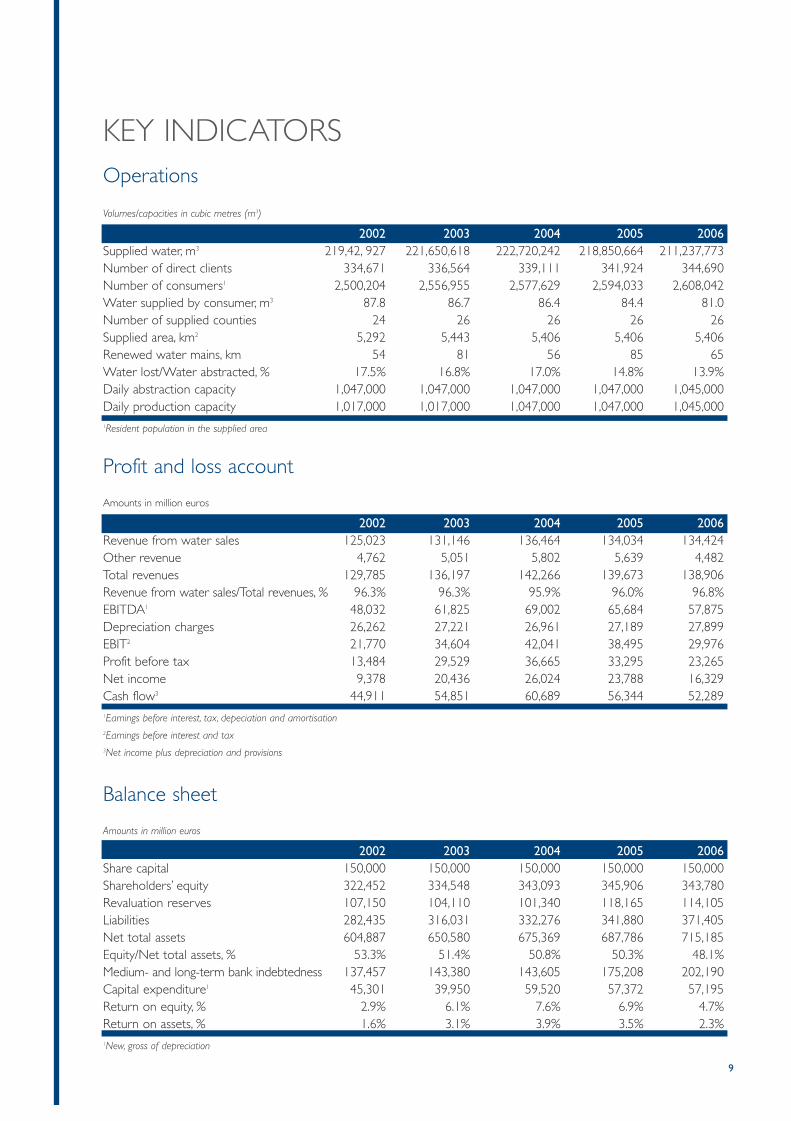
KEY INDICATORSOperations
Volumes/capacities in cubic metres (m3)
2002 2003 2004 2005 2006Supplied water, m3 219,42, 927 221,650,618 222,720,242 218,850,664 211,237,773Number of direct clients 334,671 336,564 339,111 341,924 344,690Number of consumers1 2,500,204 2,556,955 2,577,629 2,594,033 2,608,042Water supplied by consumer, m3 87.8 86.7 86.4 84.4 81.0Number of supplied counties 24 26 26 26 26Supplied area, km2 5,292 5,443 5,406 5,406 5,406Renewed water mains, km 54 81 56 85 65Water lost/Water abstracted, % 17.5% 16.8% 17.0% 14.8% 13.9%Daily abstraction capacity 1,047,000 1,047,000 1,047,000 1,047,000 1,045,000Daily production capacity 1,017,000 1,017,000 1,047,000 1,047,000 1,045,0001Resident population in the supplied area
Profit and loss account
Amounts in million euros
2002 2003 2004 2005 2006Revenue from water sales 125,023 131,146 136,464 134,034 134,424Other revenue 4,762 5,051 5,802 5,639 4,482Total revenues 129,785 136,197 142,266 139,673 138,906Revenue from water sales/Total revenues, % 96.3% 96.3% 95.9% 96.0% 96.8%EBITDA1 48,032 61,825 69,002 65,684 57,875Depreciation charges 26,262 27,221 26,961 27,189 27,899EBIT2 21,770 34,604 42,041 38,495 29,976Profit before tax 13,484 29,529 36,665 33,295 23,265Net income 9,378 20,436 26,024 23,788 16,329Cash flow3 44,911 54,851 60,689 56,344 52,2891Earnings before interest, tax, depeciation and amortisation2Earnings before interest and tax3Net income plus depreciation and provisions
Balance sheet
Amounts in million euros
2002 2003 2004 2005 2006Share capital 150,000 150,000 150,000 150,000 150,000Shareholders’ equity 322,452 334,548 343,093 345,906 343,780Revaluation reserves 107,150 104,110 101,340 118,165 114,105Liabilities 282,435 316,031 332,276 341,880 371,405Net total assets 604,887 650,580 675,369 687,786 715,185Equity/Net total assets, % 53.3% 51.4% 50.8% 50.3% 48.1%Medium- and long-term bank indebtedness 137,457 143,380 143,605 175,208 202,190Capital expenditure1 45,301 39,950 59,520 57,372 57,195Return on equity, % 2.9% 6.1% 7.6% 6.9% 4.7%Return on assets, % 1.6% 3.1% 3.9% 3.5% 2.3%1New, gross of depreciation
9
Luscinia megarhynchos

MANAGEMENT REPORT

Buteo buteo
EPAL Annual report 2006
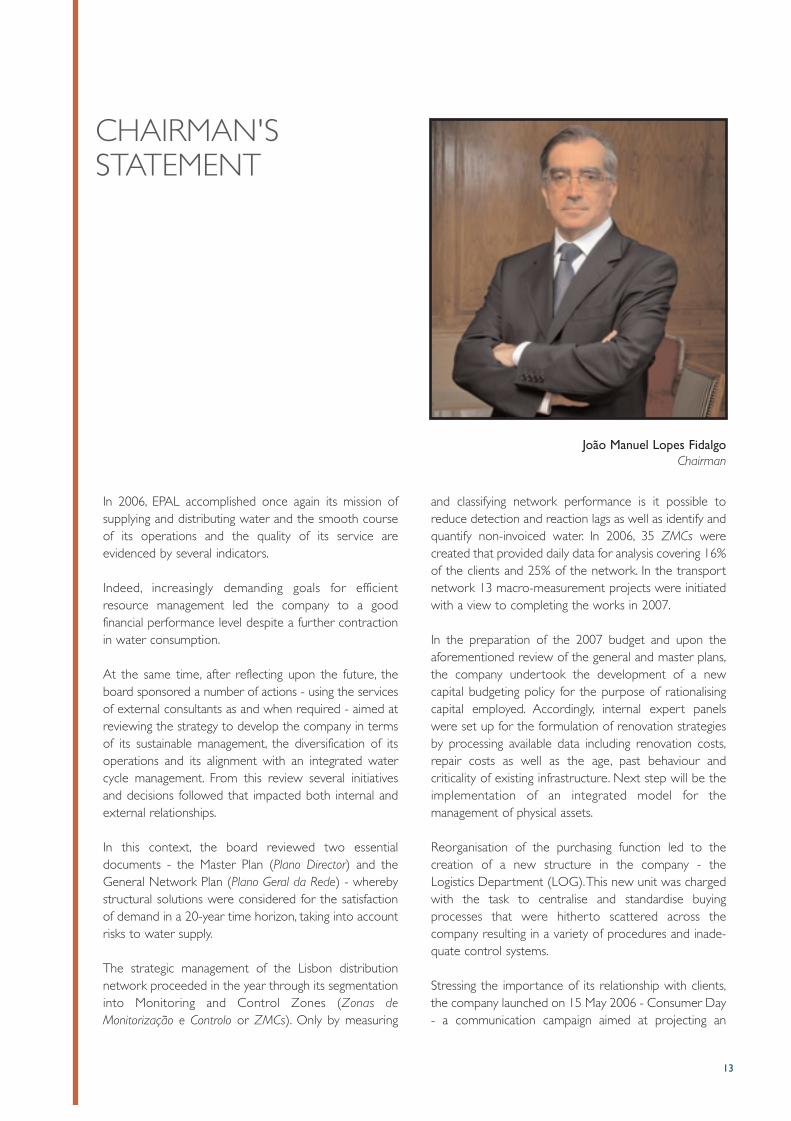
In 2006, EPAL accomplished once again its mission ofsupplying and distributing water and the smooth courseof its operations and the quality of its service are evidenced by several indicators.
Indeed, increasingly demanding goals for efficientresource management led the company to a good financial performance level despite a further contractionin water consumption.
At the same time, after reflecting upon the future, theboard sponsored a number of actions - using the servicesof external consultants as and when required - aimed atreviewing the strategy to develop the company in termsof its sustainable management, the diversification of itsoperations and its alignment with an integrated watercycle management. From this review several initiativesand decisions followed that impacted both internal andexternal relationships.
In this context, the board reviewed two essential documents - the Master Plan (Plano Director) and theGeneral Network Plan (Plano Geral da Rede) - wherebystructural solutions were considered for the satisfactionof demand in a 20-year time horizon, taking into accountrisks to water supply.
The strategic management of the Lisbon distribution network proceeded in the year through its segmentationinto Monitoring and Control Zones (Zonas deMonitorização e Controlo or ZMCs). Only by measuring
and classifying network performance is it possible toreduce detection and reaction lags as well as identify andquantify non-invoiced water. In 2006, 35 ZMCs were created that provided daily data for analysis covering 16%of the clients and 25% of the network. In the transportnetwork 13 macro-measurement projects were initiatedwith a view to completing the works in 2007.
In the preparation of the 2007 budget and upon theaforementioned review of the general and master plans,the company undertook the development of a new capital budgeting policy for the purpose of rationalisingcapital employed. Accordingly, internal expert panelswere set up for the formulation of renovation strategiesby processing available data including renovation costs,repair costs as well as the age, past behaviour and criticality of existing infrastructure. Next step will be theimplementation of an integrated model for the management of physical assets.
Reorganisation of the purchasing function led to the creation of a new structure in the company - theLogistics Department (LOG).This new unit was chargedwith the task to centralise and standardise buyingprocesses that were hitherto scattered across the company resulting in a variety of procedures and inade-quate control systems.
Stressing the importance of its relationship with clients,the company launched on 15 May 2006 - Consumer Day- a communication campaign aimed at projecting an
João Manuel Lopes FidalgoChairman
CHAIRMAN'S STATEMENT
13

image of EPAL along three lines: service quality anddependability, process innovation, social and environmentalresponsibility.Management of the company's human resources wasstrengthened in 2006, whereby knowledge managementbecame an all-present ingredient in traineeships for astart in working life and in proposals for discontinuingemployment relationships. Particular emphasis was alsogiven to training and professional development pro-grammes.
On 17 November 2006 the board decided to terminatethe labour agreement (Acordo de Empresa) in force andpresented a proposal to the unions consisting primarilyof a change in the retirement plan towards a definedcontribution scheme and the deletion of provisionsmade redundant by developments in labour law.
Besides complying with the government's guidelines, asjointly expressed by the Finance and Environment ministries, these negotiations are a unique opportunityfor reflection on the outlook for EPAL's development as
a sustainable business enterprise and a major player inthe Portuguese water sector.
Concerns about EPAL's financial sustainability as measured by the return on invested capital adjusted forthe company's business risk are reflected in the relevantregulatory framework. For this reason, a working groupon regulation was set up and a study was launched withthe support of specialist consultants for the purpose ofanalysing regulatory models adapted to EPAL's specificfeatures. It is our belief that this is a strategic issue requiring the attention of the board, the shareholder, theregulators and the government.The transparency of thisprocess is essential for its credibility and adequate incentives must be created for improving service withoutadded risk to invested capital.
As a closing remark, I should like to emphasise that EPALpublished in 2006 its first sustainability report, a furthertoken of the company's awareness of its responsibilitiesin terms of environmental ethics and social responsibilitytowards the communities in which it operates.
EPAL Annual report 200614
João Manuel Lopes FidalgoChairman

MISSION AND OBJECTIVES
Mission
The mission of EPAL - Empresa Portuguesa das ÁguasLivres, S.A. is to supply water for human consumption inits service area and to ensure product quality andrespect for essential social and environmental aspectswhile using its capabilities in the national interest.
Objectives
Customer satisfaction through superior service levels
Environmental sustainability
Adequate return on invested capital
15
EPAL Annual report 2006
Streptopelia turtur
CORPORATE GOVERNANCEShareholder
EPAL is ultimately held by the Portuguese state and itssole direct shareholder is Águas de Portugal, SGPS, SA,the holding company of a group of water and wastetreatment operators that includes EPAL.
Águas de Portugal was created in 1993 and is whollyowned by the Portuguese state. Group companies provide services to more than seven million inhabitantsin Portugal in such fields as water supply, wastewatertreatment and processing and recycling of solid waste.
Governing bodies
EPAL's general meeting committee is chaired by AMEGA- Associação de Municípios para Estudos e Gestão daÁgua, represented by Carlos Alberto Dias Teixeira, withCristina Rebelo Pereira as vice-chairperson andAlexandra Varandas as secretary.
The general meeting convened once in 2006 to pass a resolution on the management report and accounts of 2005and the proposed appropriation of net income for the year.
Supervision of the company is the responsibility of soleauditor António Dias Nabais, chartered accountant, andJoaquim Manuel da Silva Neves, his deputy.
The company's executive body is the board of directors,which has been elected for the 2005-2007 period and iscomposed of João Manuel Lopes Fidalgo, chairman, andJorge Luís Ferrão de Mascarenhas Loureiro, José AlfredoManita Vaz, António Bento Franco and Rui Manuel deCarvalho Godinho, directors.
In 2006, the board of directors met 47 times to decideon management objectives and policies, activity andinvestment plans and to manage the ordinary businessaffairs of the company.
According to article 8, paragraph 3. d) of the company'sarticles of association, it is the general meeting's responsibility to pass a resolution on the remuneration ofgoverning body members for which purpose it mayappoint a remuneration committee.
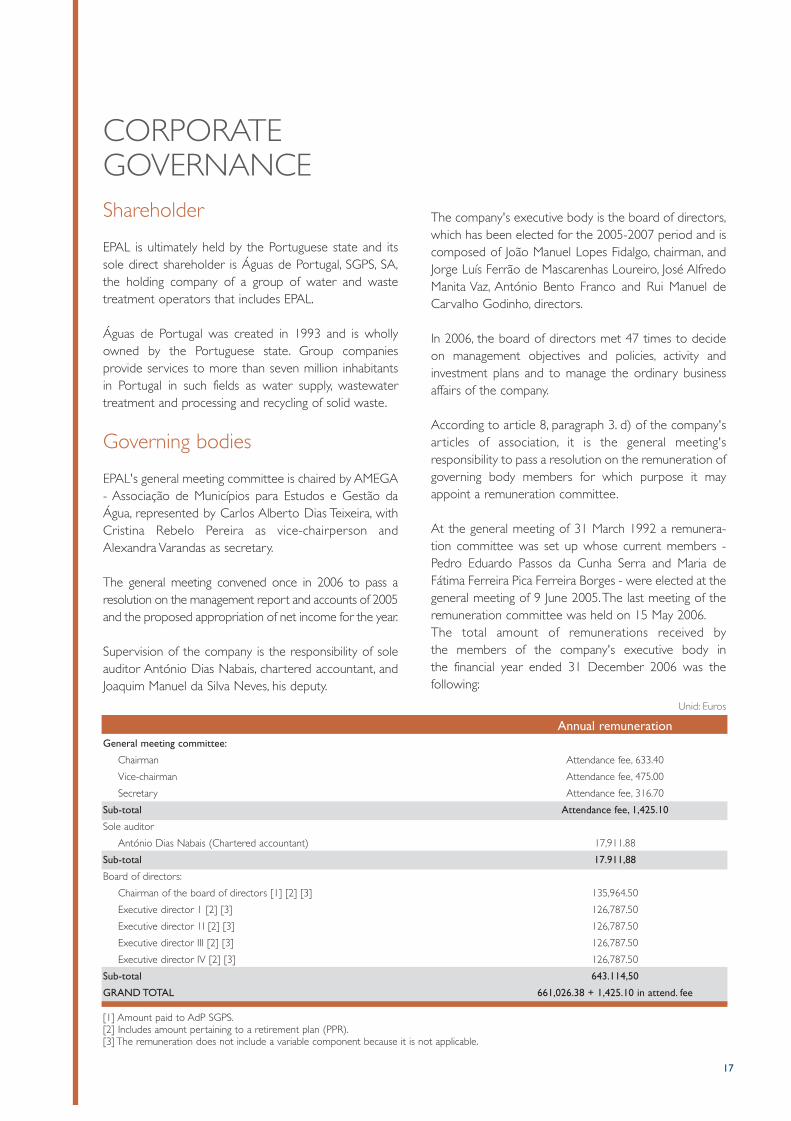
At the general meeting of 31 March 1992 a remunera-tion committee was set up whose current members -Pedro Eduardo Passos da Cunha Serra and Maria deFátima Ferreira Pica Ferreira Borges - were elected at thegeneral meeting of 9 June 2005.The last meeting of theremuneration committee was held on 15 May 2006.The total amount of remunerations received by the members of the company's executive body in the financial year ended 31 December 2006 was the following:
17
Annual remunerationGeneral meeting committee:
Chairman Attendance fee, 633.40
Vice-chairman Attendance fee, 475.00
Secretary Attendance fee, 316.70
Sub-total Attendance fee, 1,425.10
Sole auditor
António Dias Nabais (Chartered accountant) 17,911.88
Sub-total 17.911,88
Board of directors:
Chairman of the board of directors [1] [2] [3] 135,964.50
Executive director 1 [2] [3] 126,787.50
Executive director 1I [2] [3] 126,787.50
Executive director III [2] [3] 126,787.50
Executive director IV [2] [3] 126,787.50
Sub-total 643.114,50
GRAND TOTAL 661,026.38 + 1,425.10 in attend. fee
[1] Amount paid to AdP SGPS.[2] Includes amount pertaining to a retirement plan (PPR).[3] The remuneration does not include a variable component because it is not applicable.
Unid: Euros
In order to appraise environmental issues, the company hasan Environmental Impact Board chaired by Maria Helena
Veríssimo Colaço Alegre and of which Maria Paula BatistaAntunes and Manuel Duarte Pinheiro also are members.
EPAL Annual report 200618
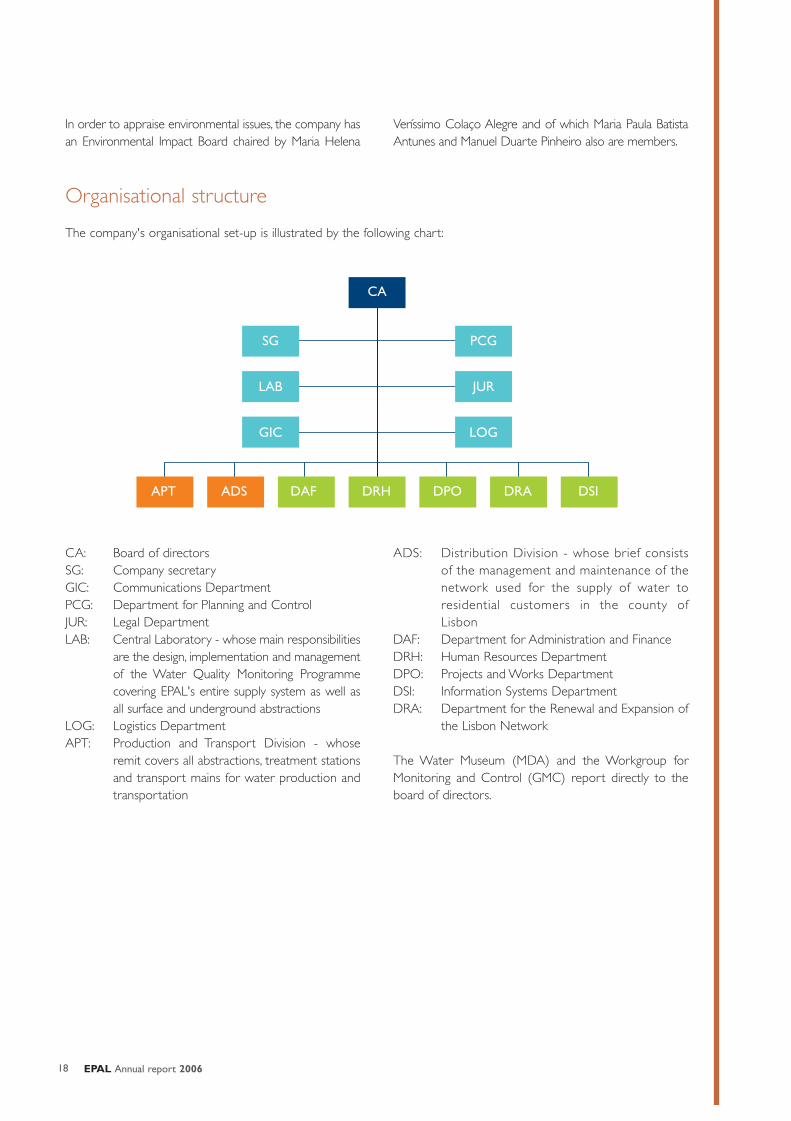
Organisational structure
The company's organisational set-up is illustrated by the following chart:
CA
SG
LAB
GIC
PCG
JUR
LOG
APT ADS DAF DRH DPO DRA DSI
CA: Board of directorsSG: Company secretaryGIC: Communications Department PCG: Department for Planning and ControlJUR: Legal DepartmentLAB: Central Laboratory - whose main responsibilities
are the design, implementation and managementof the Water Quality Monitoring Programmecovering EPAL's entire supply system as well asall surface and underground abstractions
LOG: Logistics DepartmentAPT: Production and Transport Division - whose
remit covers all abstractions, treatment stationsand transport mains for water production andtransportation
ADS: Distribution Division - whose brief consistsof the management and maintenance of thenetwork used for the supply of water toresidential customers in the county ofLisbon
DAF: Department for Administration and FinanceDRH: Human Resources DepartmentDPO: Projects and Works DepartmentDSI: Information Systems DepartmentDRA: Department for the Renewal and Expansion of
the Lisbon Network
The Water Museum (MDA) and the Workgroup forMonitoring and Control (GMC) report directly to theboard of directors.
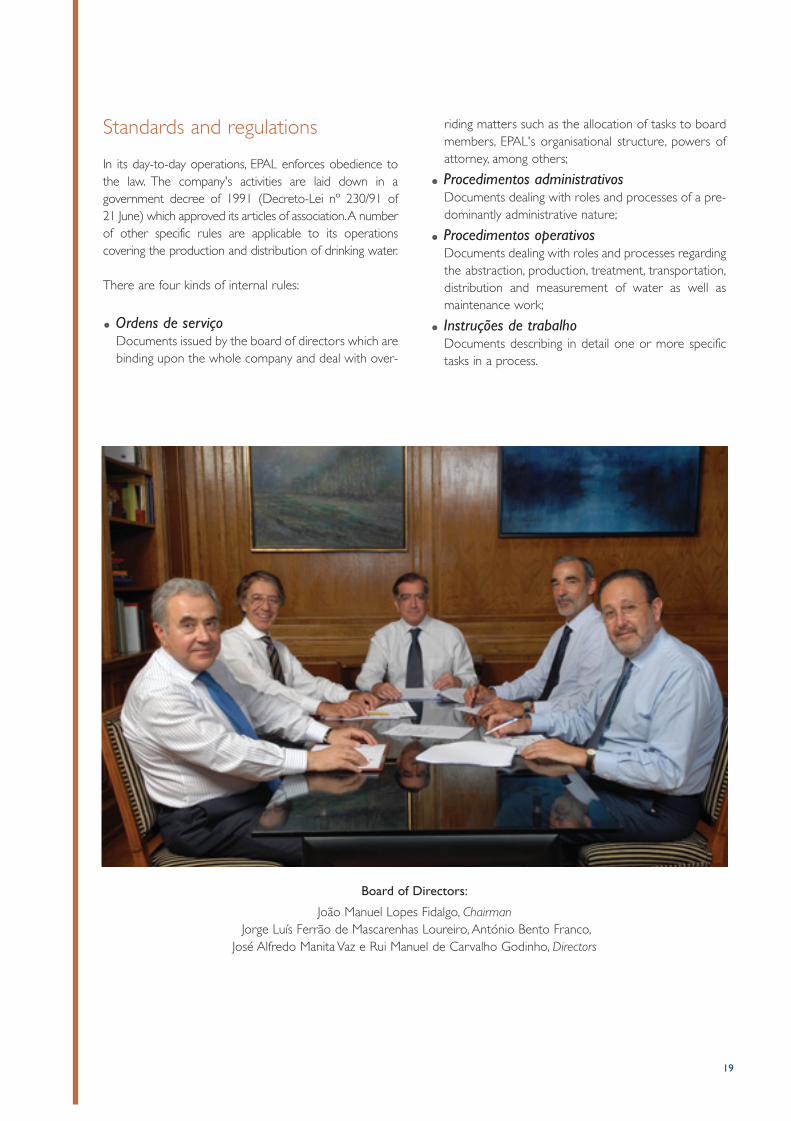
Standards and regulations
In its day-to-day operations, EPAL enforces obedience tothe law. The company's activities are laid down in a government decree of 1991 (Decreto-Lei nº 230/91 of 21 June) which approved its articles of association.A numberof other specific rules are applicable to its operations covering the production and distribution of drinking water.
There are four kinds of internal rules:
Ordens de serviçoDocuments issued by the board of directors which arebinding upon the whole company and deal with over-
riding matters such as the allocation of tasks to boardmembers, EPAL's organisational structure, powers ofattorney, among others;
Procedimentos administrativosDocuments dealing with roles and processes of a pre-dominantly administrative nature;
Procedimentos operativosDocuments dealing with roles and processes regardingthe abstraction, production, treatment, transportation,distribution and measurement of water as well asmaintenance work;
Instruções de trabalhoDocuments describing in detail one or more specifictasks in a process.
19
Board of Directors:
João Manuel Lopes Fidalgo, ChairmanJorge Luís Ferrão de Mascarenhas Loureiro, António Bento Franco,
José Alfredo Manita Vaz e Rui Manuel de Carvalho Godinho, Directors
Turdus merula
EPAL Annual report 2006

FROM PRODUCTIONTO DISTRIBUTIONThe supply of drinking water by EPAL is preceded by anelaborate process of abstraction, treatment and transport.
In order to supply 2.6 million consumers - directly in theLisbon area and indirectly in 25 counties north and westof the capital through municipal and multi-municipal distributors - EPAL has 745 km of transport mains and1,427 km of water mains for urban distribution.
Production
EPAL operates a system with a daily productioncapacity of close to 1,045,000 m3. This infrastructureconsists of three sub-systems:
Castelo do Bode, with a daily production capacity of
500,000 m3 of water abstracted from the surface;
Tejo, with a daily production capacity of 220,000 m3 of
surface water and close to 270,000 m3 of groundwa-
ter ;
Alviela, with an average daily production of 55,000 m3
of spring water.
Operation of these three sub-systems is supported by avast infrastructure for the transportation of abstractedand treated water.
The total volume of water abstracted in 2006 was244,350,667 m3.The volume of water produced after treatmentwas 244,063,092 m3, with the difference representingprocess water resulting from treatment operations.
21
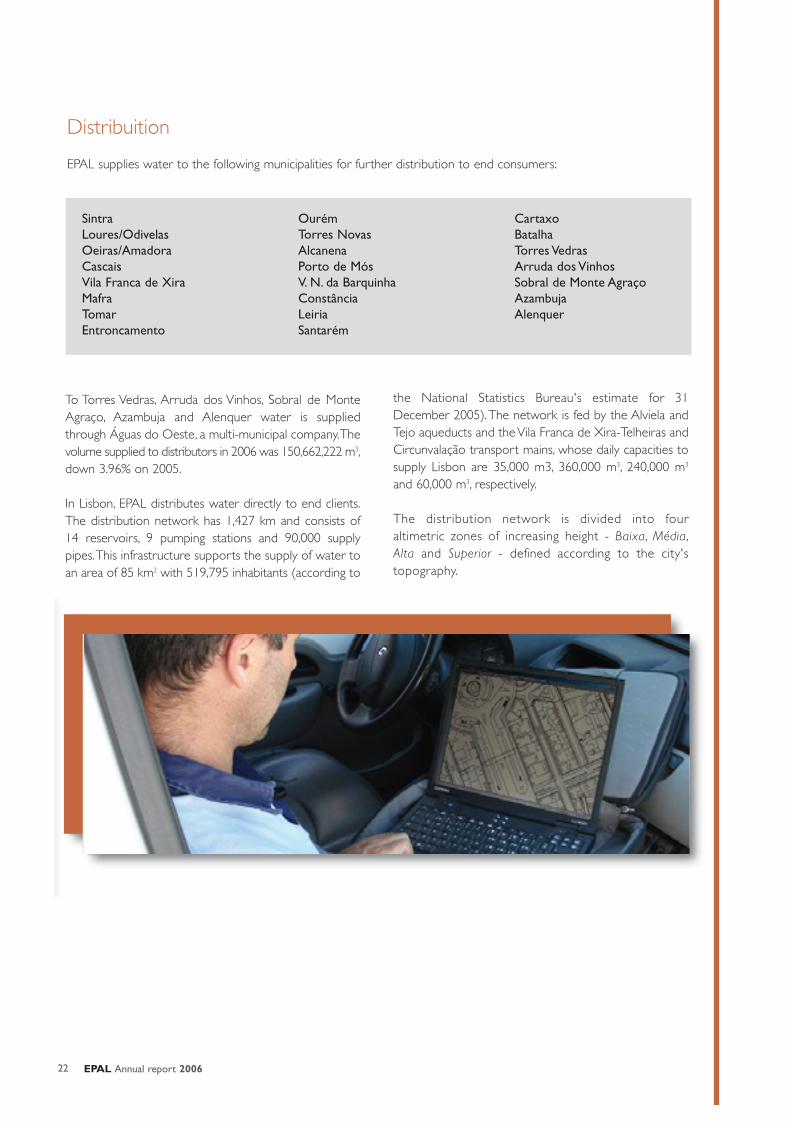
To Torres Vedras, Arruda dos Vinhos, Sobral de MonteAgraço, Azambuja and Alenquer water is suppliedthrough Águas do Oeste, a multi-municipal company.Thevolume supplied to distributors in 2006 was 150,662,222 m3,down 3.96% on 2005.
In Lisbon, EPAL distributes water directly to end clients.The distribution network has 1,427 km and consists of14 reservoirs, 9 pumping stations and 90,000 supplypipes.This infrastructure supports the supply of water toan area of 85 km2 with 519,795 inhabitants (according to
the National Statistics Bureau's estimate for 31December 2005).The network is fed by the Alviela andTejo aqueducts and the Vila Franca de Xira-Telheiras andCircunvalação transport mains, whose daily capacities tosupply Lisbon are 35,000 m3, 360,000 m3, 240,000 m3
and 60,000 m3, respectively.
The distribution network is divided into four altimetric zones of increasing height - Baixa, Média,Alta and Superior - defined according to the city'stopography.
EPAL Annual report 200622
Distribuition
EPAL supplies water to the following municipalities for further distribution to end consumers:
SintraLoures/OdivelasOeiras/AmadoraCascaisVila Franca de XiraMafraTomarEntroncamento
OurémTorres NovasAlcanenaPorto de MósV. N. da BarquinhaConstânciaLeiriaSantarém
CartaxoBatalhaTorres VedrasArruda dos VinhosSobral de Monte AgraçoAzambujaAlenquer
23
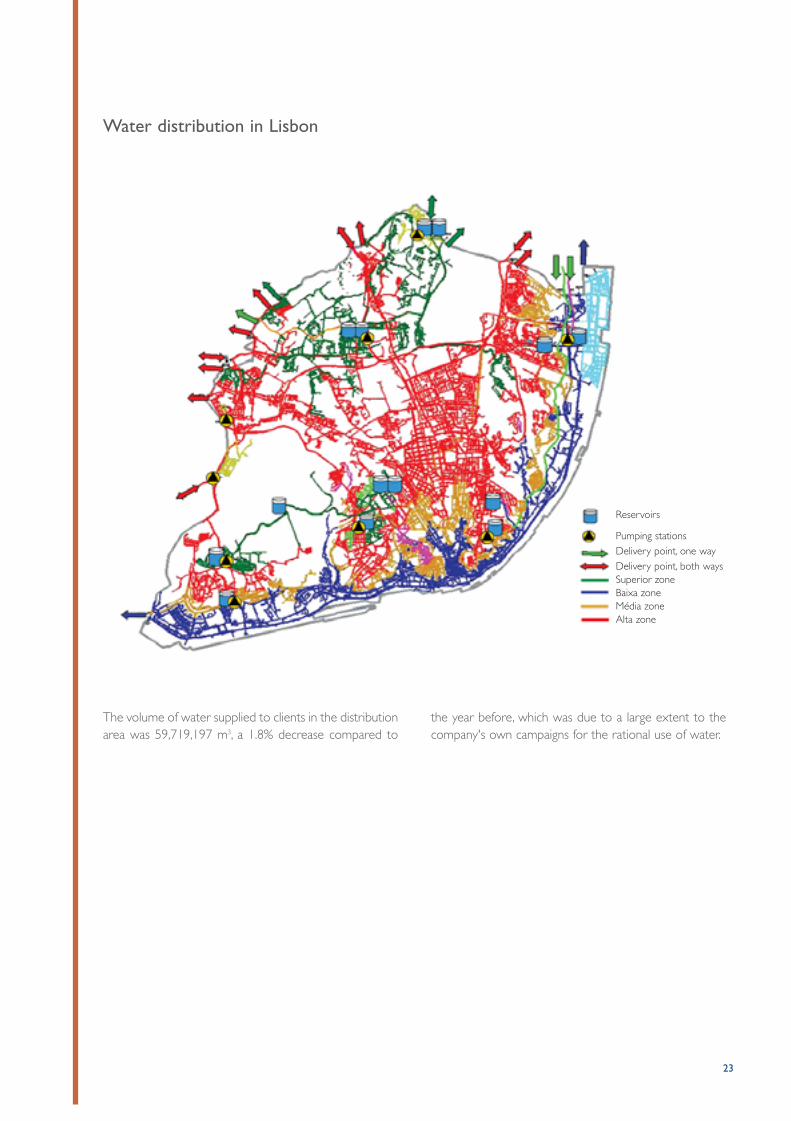
Water distribution in Lisbon
The volume of water supplied to clients in the distributionarea was 59,719,197 m3, a 1.8% decrease compared to
the year before, which was due to a large extent to thecompany's own campaigns for the rational use of water.
Reservoirs
Pumping stationsDelivery point, one wayDelivery point, both waysSuperior zoneBaixa zoneMédia zoneAlta zone

EPAL Annual report 2006
Erithacus rubecula

WATER QUALITY
EPAL's system for managing water quality ensures processand parameter control along the abstraction, treatment,transportation and distribution stages. Quality control isensured by the company's central laboratory (LAB) andthe laboratories of Asseiceira and Vale da Pedra.
Monitoring
The central laboratory is responsible for the design,implementation and management of the Water QualityMonitoring Programme (PMQA). In 2006 the LAB completed the schedule provided for in the PMQA forsampling and analysis of the water abstracted on the surfaceand in the ground, transported, supplied to distributorsand distributed in the city of Lisbon. The programme'spurpose was to obtain data for the support and guidanceof management actions towards ensuring water quality.
The PMQA that has been approved by EPAL's board ofdirectors consists of two types of control: legal controland operational or 'surveillance' control.While legal controlrefers to supervision by the water and waste regulator
(Instituto Regulador de Águas e Resíduos, IRAR) regarding enforcement of the legal requirements EPALmust obey in its capacity as supplier of water for humanconsumption - the purpose of operational or 'surveillance'control is to check the quality of drinking water in thewhole supply system as well as to timely detect possiblefailures, either occasional or systematic, for effective preventive action to be taken. Under the PMQA particular attention is given to monitoring microbiologicalstandards and residual chlorine through daily sampling.
Under the programme 7,239 samples were taken at 264fixed points representing the whole EPAL system -abstractions, water treatment stations, transport mains,points of delivery to distributors and the Lisbon distributionnetwork - and at 1,352 sampling points in consumer tapsin Lisbon. A total of 174,709 tests were performed for avariety of substances and species determining waterquality, whose distribution is shown in Table 1.
EPAL had also operational control plans for water quality at the Castelo do Bode and Tejo sub-systems,which were entirely executed.
25
Number of tests (species)Legal controlLisbon network(Consumer taps) 21,875Deliveries to distributors 45,366Direct clients outside Lisbon 1,110Operational/surveillance controlUnderground abstractions 8,783Surface abstractions 5,815Water treatment station (process water) 312Transportation system 44,798Lisbon network (fixed points) 46,650Total 174,709
Tests performed in 2006 in EPAL's supply system
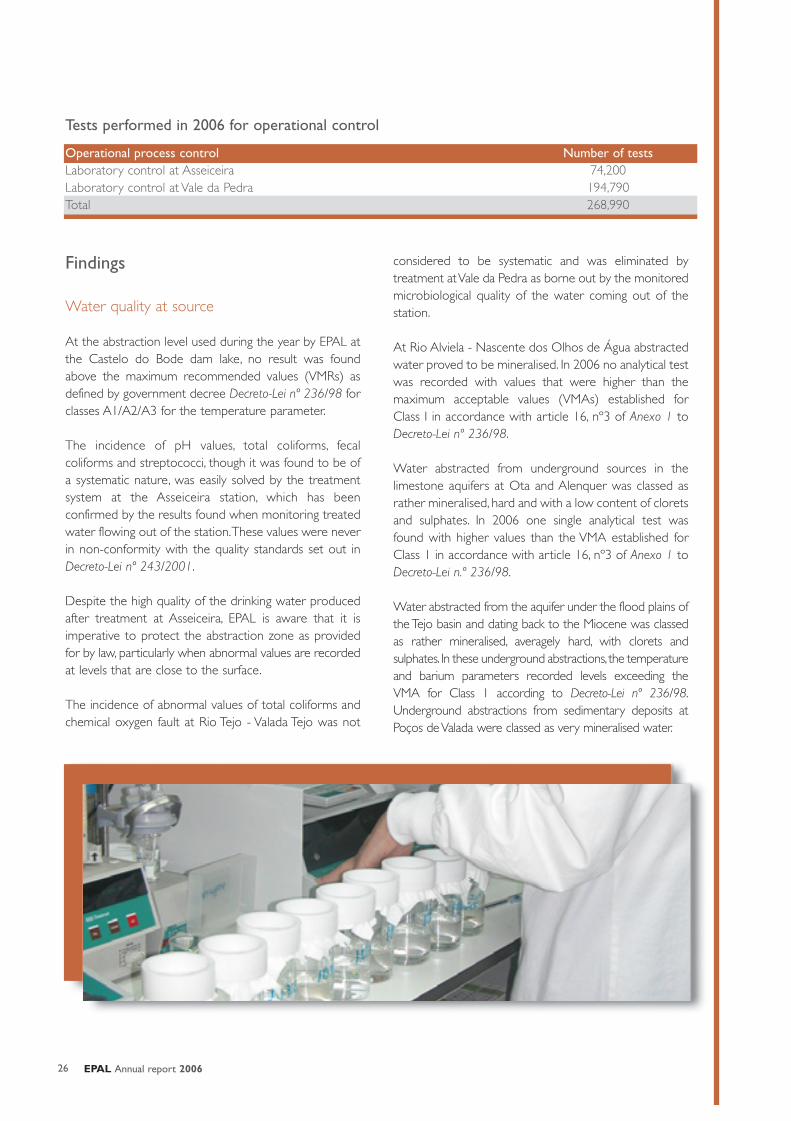
Findings
Water quality at source
At the abstraction level used during the year by EPAL atthe Castelo do Bode dam lake, no result was foundabove the maximum recommended values (VMRs) asdefined by government decree Decreto-Lei nº 236/98 forclasses A1/A2/A3 for the temperature parameter.
The incidence of pH values, total coliforms, fecal coliforms and streptococci, though it was found to be ofa systematic nature, was easily solved by the treatmentsystem at the Asseiceira station, which has been confirmed by the results found when monitoring treatedwater flowing out of the station.These values were neverin non-conformity with the quality standards set out inDecreto-Lei nº 243/2001.
Despite the high quality of the drinking water producedafter treatment at Asseiceira, EPAL is aware that it isimperative to protect the abstraction zone as providedfor by law, particularly when abnormal values are recordedat levels that are close to the surface.
The incidence of abnormal values of total coliforms andchemical oxygen fault at Rio Tejo - Valada Tejo was not
considered to be systematic and was eliminated by treatment at Vale da Pedra as borne out by the monitoredmicrobiological quality of the water coming out of thestation.
At Rio Alviela - Nascente dos Olhos de Água abstractedwater proved to be mineralised. In 2006 no analytical testwas recorded with values that were higher than the maximum acceptable values (VMAs) established forClass I in accordance with article 16, nº3 of Anexo 1 toDecreto-Lei nº 236/98.
Water abstracted from underground sources in the limestone aquifers at Ota and Alenquer was classed asrather mineralised, hard and with a low content of cloretsand sulphates. In 2006 one single analytical test wasfound with higher values than the VMA established forClass 1 in accordance with article 16, nº3 of Anexo 1 toDecreto-Lei n.º 236/98.
Water abstracted from the aquifer under the flood plains ofthe Tejo basin and dating back to the Miocene was classedas rather mineralised, averagely hard, with clorets and sulphates. In these underground abstractions, the temperatureand barium parameters recorded levels exceeding the VMA for Class 1 according to Decreto-Lei nº 236/98.Underground abstractions from sedimentary deposits atPoços de Valada were classed as very mineralised water.
EPAL Annual report 200626
Tests performed in 2006 for operational control
Operational process control Number of testsLaboratory control at Asseiceira 74,200Laboratory control at Vale da Pedra 194,790Total 268,990

27
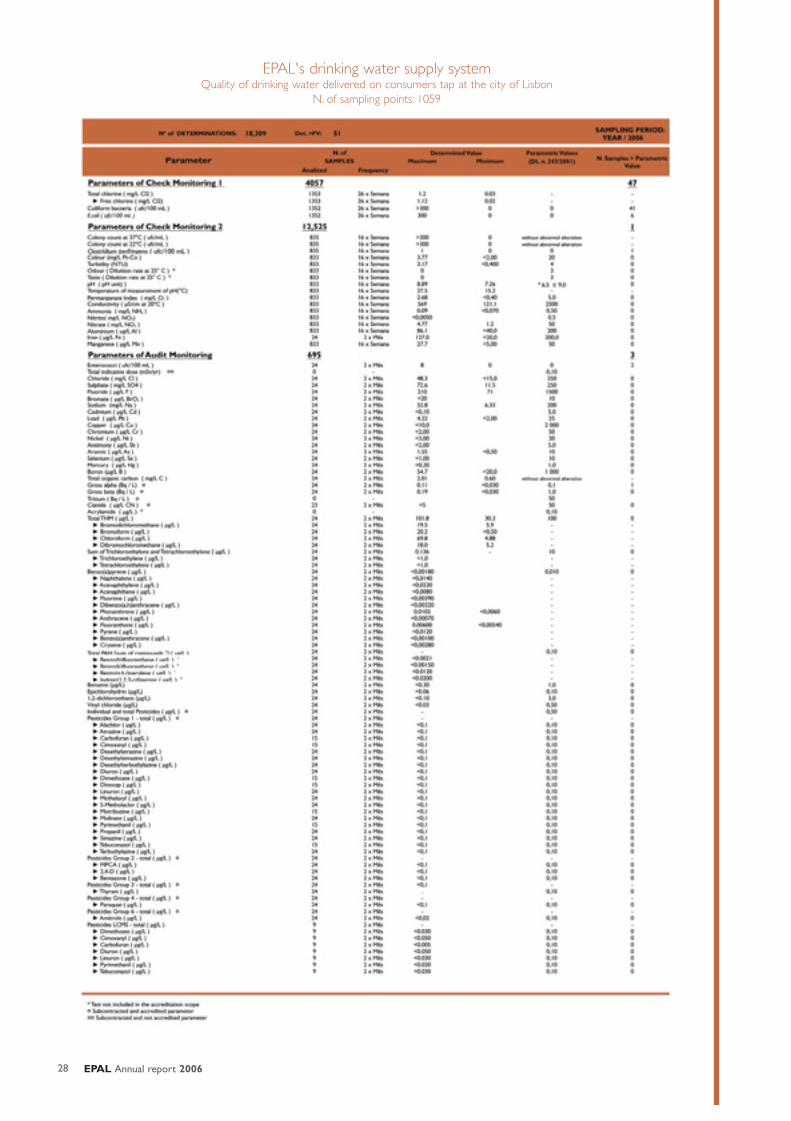
Quality of drinking water
The number of tests performed for controlling waterquality against the legal requirements of Decreto-Lei n.º 243/2001 reached 21,875, with residential and publictaps fed by the Lisbon distribution network (at hospitals,schools, health centres) sampled on a daily basis.
Data analysis of the tap samples led to the conclusionthat, except for a few isolated, non-recurring cases, thewater complied with the quality standards required byPortuguese law. Only in 0.23% of the cases did tests produce non-conforming values.
In comparison with 2005, there was a broad improvement in the quality of the drinking water
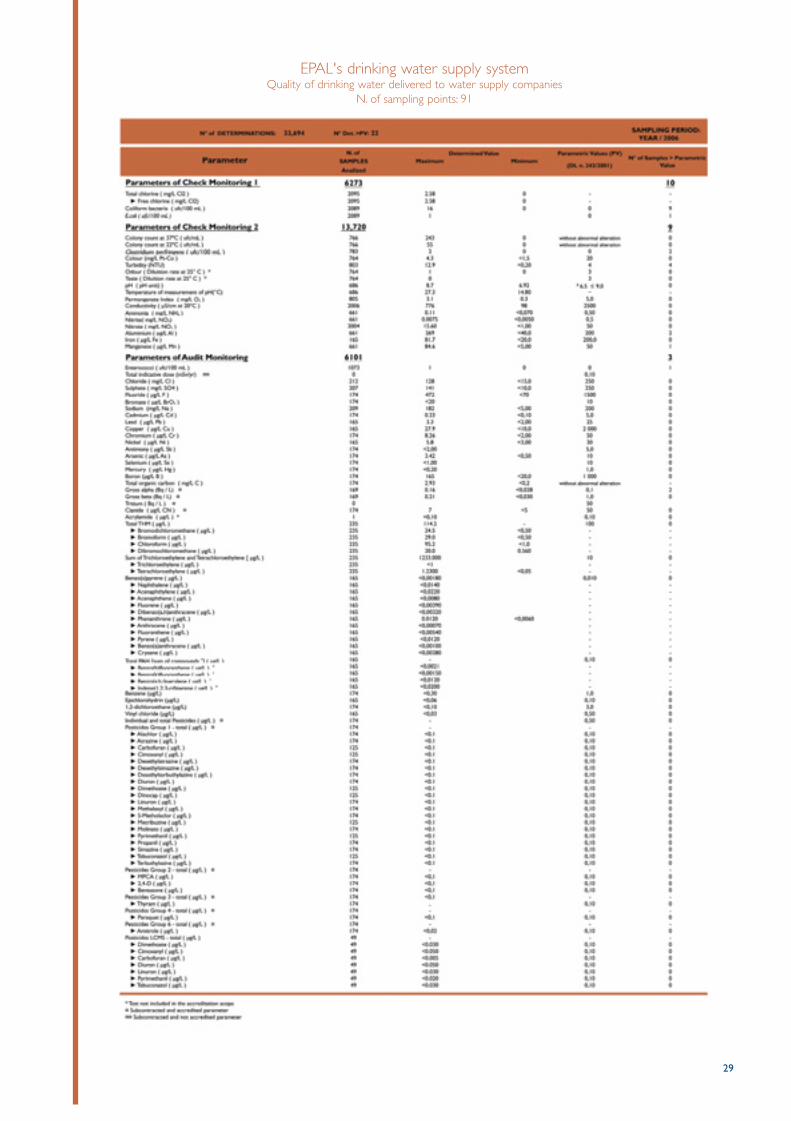
supplied by EPAL.This was confirmed by a lower numberof non-compliances, in both absolute and percentageterms, in the samples of water distributed in Lisbon(legal and operational controls) and delivered to distributors.
EPAL disclosed monthly on its website statistical dataabout the compliance tests performed in water taken atconsumer taps in Lisbon, at fixed sampling points in theLisbon distribution network and at points for delivery todistributors.
In 2006 the report Quality of drinking water suppliedby EPAL in 2005 was published where data were disclosed about compliance with the applicable qualitystandards.
EPAL Annual report 200628
EPAL's drinking water supply systemQuality of drinking water delivered on consumers tap at the city of Lisbon
N. of sampling points: 1059
29
EPAL's drinking water supply systemQuality of drinking water delivered to water supply companies
N. of sampling points: 91
EPAL Annual report 2006
Serinus serinus
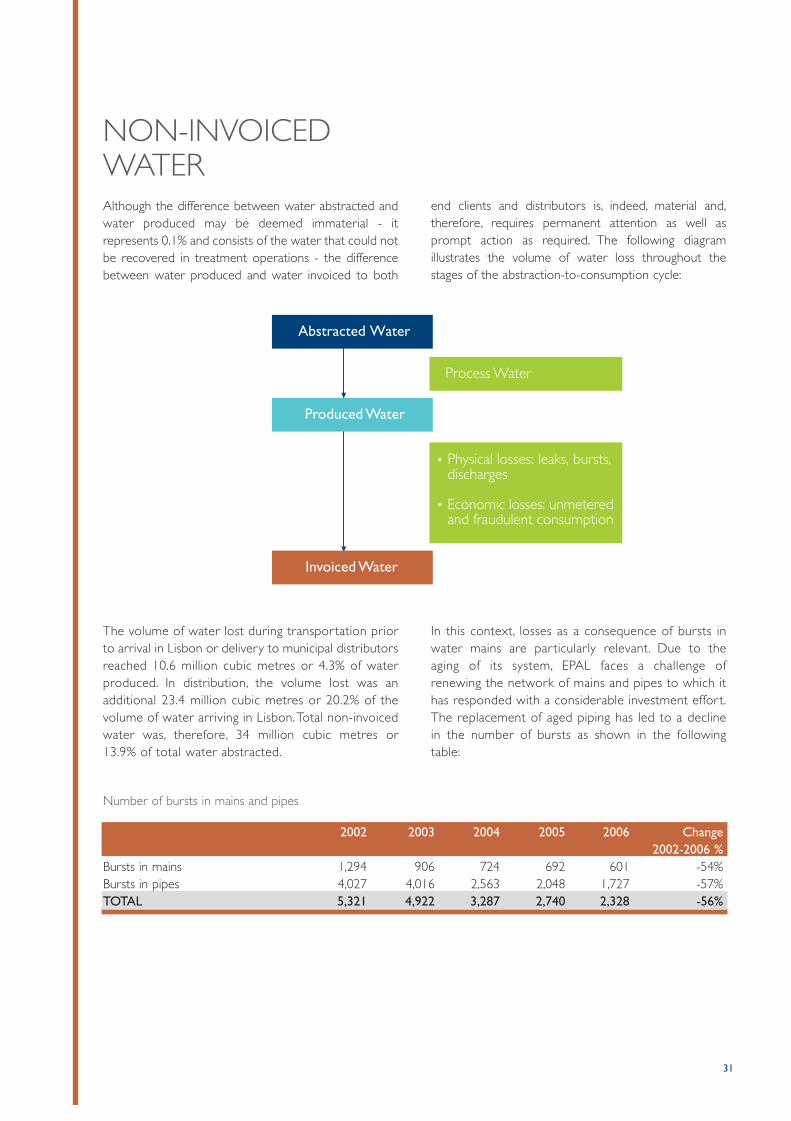
NON-INVOICEDWATERAlthough the difference between water abstracted andwater produced may be deemed immaterial - it represents 0.1% and consists of the water that could notbe recovered in treatment operations - the differencebetween water produced and water invoiced to both
end clients and distributors is, indeed, material and,therefore, requires permanent attention as well asprompt action as required. The following diagram illustrates the volume of water loss throughout thestages of the abstraction-to-consumption cycle:
31
Abstracted Water
Process Water
Produced Water
Invoiced Water
Physical losses: leaks, bursts,discharges
Economic losses: unmeteredand fraudulent consumption
The volume of water lost during transportation priorto arrival in Lisbon or delivery to municipal distributorsreached 10.6 million cubic metres or 4.3% of waterproduced. In distribution, the volume lost was anadditional 23.4 million cubic metres or 20.2% of thevolume of water arriving in Lisbon.Total non-invoicedwater was, therefore, 34 million cubic metres or13.9% of total water abstracted.
In this context, losses as a consequence of bursts inwater mains are par ticularly relevant. Due to theaging of its system, EPAL faces a challenge of renewing the network of mains and pipes to which ithas responded with a considerable investment effor t.The replacement of aged piping has led to a declinein the number of bursts as shown in the followingtable:
Number of bursts in mains and pipes
2002 2003 2004 2005 2006 Change2002-2006 %
Bursts in mains 1,294 906 724 692 601 -54%Bursts in pipes 4,027 4,016 2,563 2,048 1,727 -57%TOTAL 5,321 4,922 3,287 2,740 2,328 -56%
Another indicator with relevance to loss reduction is thepercentage of bursts repaired in less than 24 hours,which reached 91.5% for piping with a diameter of lessthan 400 mm.
The Plan for Monitoring and Control of Water Lossesprepared by the Monitoring and Control Group (GMC)in cooperation with EPAL's operating units was launchedin January 2006 and its purpose was to monitor andexamine transportation and distribution networks - withthe help of such new tools as G/Interaqua, Epanet and
telemetrics - as well as take appropriate action for reducing non-invoiced water.
In distribution, the primary objective was to implementMonitoring and Control Zones (ZMCs) and Monitoringand Transport Zones (ZMTs) across the whole network.Segmentation in ZMCs will allow EPAL to map the distribution system, to shorten detection and reactionlags in case of network failures, to improve client serviceand system reliability, to manage proactively as well asidentify non-invoiced water resulting from both real and
EPAL Annual report 200632
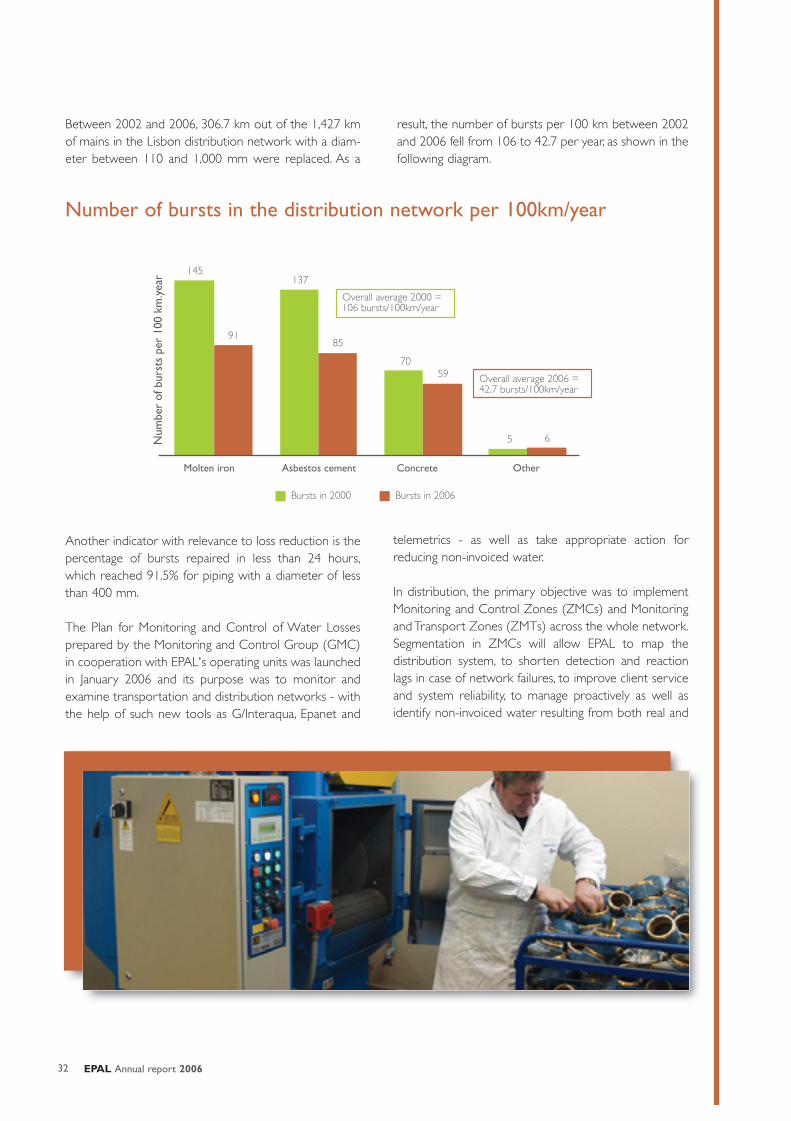
145
91
137
85
7059
5 6
Concrete OtherAsbestos cementMolten iron
Overall average 2000 =106 bursts/100km/year
Overall average 2006 =42.7 bursts/100km/year
Num
ber
of b
urst
s pe
r 10
0 km
.yea
r
Bursts in 2000 Bursts in 2006
Number of bursts in the distribution network per 100km/year
Between 2002 and 2006, 306.7 km out of the 1,427 kmof mains in the Lisbon distribution network with a diam-eter between 110 and 1,000 mm were replaced. As a
result, the number of bursts per 100 km between 2002and 2006 fell from 106 to 42.7 per year, as shown in thefollowing diagram.

apparent losses. Up to December 2006, 35 ZMCs hadbeen implemented covering 56,000 clients or 16% of thetotal and 276 km or 23% of the network.
During the year, an innovative computer applicationnamed IMC - Integration, Monitoring and Control wasdeveloped for the purpose of processing the data collected from the ZMCs by the telemetrics and telemanagement systems.
In December, the board of directors approved the firstinspection of the large transport mains with the help ofSAHARA, a system developed in the UK by the WaterResearch Centre. SAHARA is an advanced system forthe detection and location of bursts by acoustic methodswhich also allows viewing and inspection of the mains'inner part by remote TV.The first inspection trials werescheduled for March 2007 in the Vila Franca deXira/Telheiras transport mains, in the mains for untreated water at Valada Tejo and at selected locationsin the larger mains in the Lisbon network's Média andBaixa zones.
33
EPAL Annual report 2006
Athene noctua

CAPITAL EXPENDITUREInvestment spending totalled 57.2 million euros in 2006, which was in line with the 57.4 million euros spent the yearbefore.Total expenditure is broken down below by strategic area:
35
Certainty of supply 46.175.668Enlargement of the Castelo do Bode sub-system 6,785,629
Enlargement of the treatment station at Asseiceira 15,613,453Duplication of the stretch between Quinta da Marquesa andthe plant at Vila Franca de Xira 10,898,916
Upgrade of supply to Mafra 4,963,511Renewal of 63 km in the distribution network 13,501,866
Quality guarantee 766,809Renewal of laboratory equipment 358,907Installation of automatic and online analysers 143,791Overhaul of the treatment line at Vale da Pedra 15,708New building for the central laboratory - Projects 172,993
Infrastructure safety 8,954,395Alviela aqueduct 8,233,914
Renewal of the Alcanhões/Alcoentre stretch 6,151,912Renewal of siphons 35 e 36 (underway) 997,222
Maintenance and improvement of reservoirs 70,726Other investments for infrastructure safety 649,755
Information technology and systems 948,917Upgrade of telemanagement systems' ability to recover from an emergency situation 98,794Upgrade of the data transfer capacity 200,795
Technological innovation 585,641Appraisal of the distribution network's efficiency 161,424Improvement of automatic telemanagement 151,800Pilot model for powering automation equipments by solar energy 26,680
The company's two instruments for long-term planning -the Master Plan for the Supply System and the General Planfor the Lisbon Distribution Network - were revised andupdated in 2006.With a 20-year time horizon, the plansconsider the most likely development scenarios for thecompany's service area and set out the possible structural
models to satisfy supply needs. The scenarios have alsotaken into account the risks to EPAL's operations.The planscontain a capital budgeting policy oriented towards customer satisfaction, increased efficiency in production,transportation and distribution systems, and guaranteedquantity and quality of the water supplied.
euros
EPAL Annual report 2006
Larus fuscus
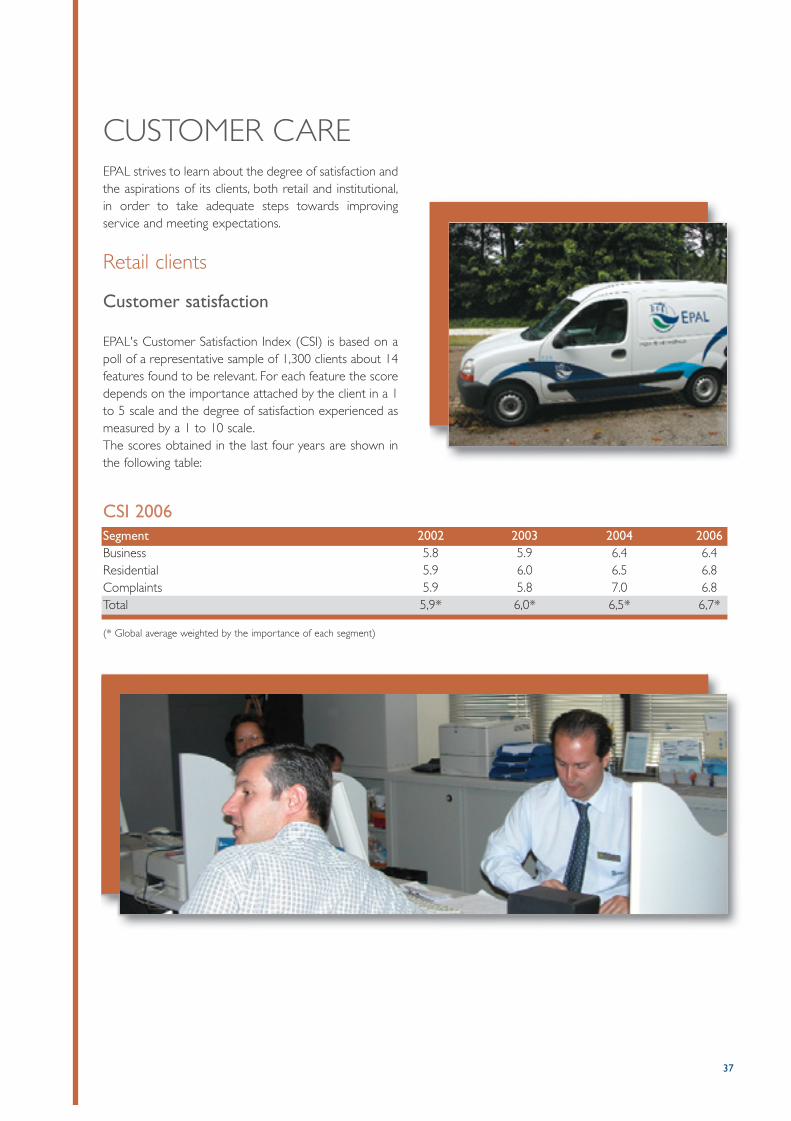
CUSTOMER CAREEPAL strives to learn about the degree of satisfaction andthe aspirations of its clients, both retail and institutional,in order to take adequate steps towards improving service and meeting expectations.
Retail clients
Customer satisfaction
EPAL's Customer Satisfaction Index (CSI) is based on apoll of a representative sample of 1,300 clients about 14features found to be relevant. For each feature the scoredepends on the importance attached by the client in a 1to 5 scale and the degree of satisfaction experienced asmeasured by a 1 to 10 scale.The scores obtained in the last four years are shown inthe following table:
37
Segment 2002 2003 2004 2006Business 5.8 5.9 6.4 6.4Residential 5.9 6.0 6.5 6.8Complaints 5.9 5.8 7.0 6.8Total 5,9* 6,0* 6,5* 6,7*
(* Global average weighted by the importance of each segment)
A inexistência de valores para o índice de satisfação dosclientes em 2005 justifica-se pelo facto de, nesse ano, se
CSI 2006
The absence of scores for 2005 is explained by thereappraisal in that year of the features considered to bemost relevant.The study found that the drought in 2005brought a higher degree of awareness of water as a valuable commodity, which led to more importancebeing attached to the management and maintenance ofthe supply network as well as the efficient use of waterin parallel with concerns about its quality. In 2006, the pollfound that the features obtaining the highest marks wereconsistency, pressure of supply and friendliness in contacts while price scored lowest. Features relating towater quality also scored high.
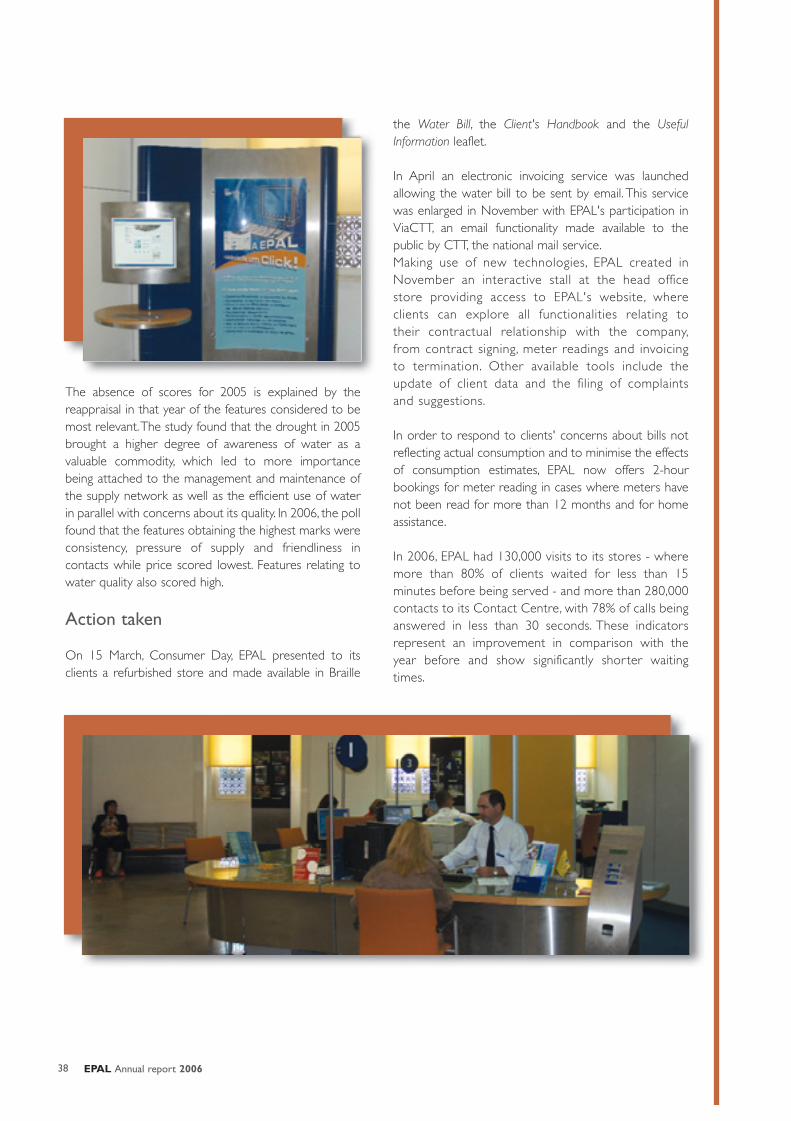
Action taken
On 15 March, Consumer Day, EPAL presented to itsclients a refurbished store and made available in Braille
the Water Bill, the Client's Handbook and the UsefulInformation leaflet.
In April an electronic invoicing service was launchedallowing the water bill to be sent by email. This servicewas enlarged in November with EPAL's participation inViaCTT, an email functionality made available to the public by CTT, the national mail service.Making use of new technologies, EPAL created inNovember an interactive stall at the head officestore providing access to EPAL's website, whereclients can explore all functionalities relating totheir contractual relationship with the company,from contract signing, meter readings and invoicingto termination. Other available tools include theupdate of client data and the filing of complaintsand suggestions.
In order to respond to clients' concerns about bills notreflecting actual consumption and to minimise the effectsof consumption estimates, EPAL now offers 2-hourbookings for meter reading in cases where meters havenot been read for more than 12 months and for homeassistance.
In 2006, EPAL had 130,000 visits to its stores - wheremore than 80% of clients waited for less than 15 minutes before being served - and more than 280,000contacts to its Contact Centre, with 78% of calls beinganswered in less than 30 seconds. These indicatorsrepresent an improvement in comparison with theyear before and show significantly shorter waitingtimes.
EPAL Annual report 200638
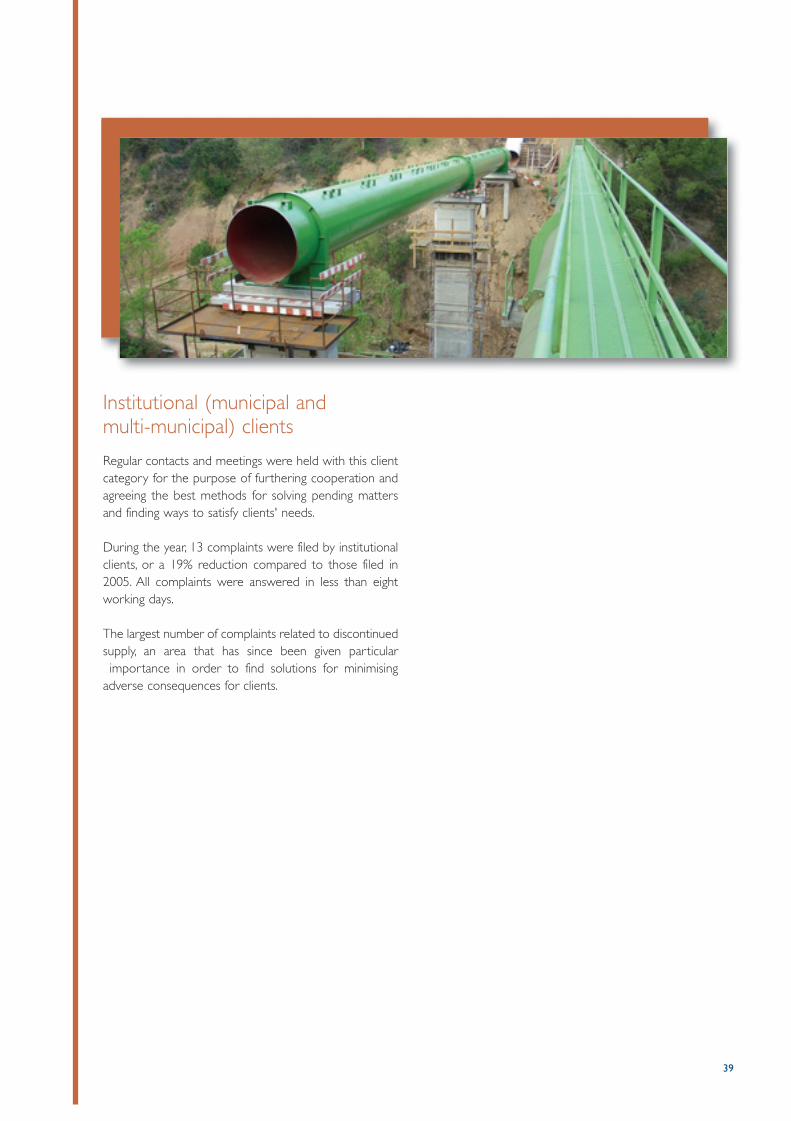
Institutional (municipal and multi-municipal) clients
Regular contacts and meetings were held with this clientcategory for the purpose of furthering cooperation andagreeing the best methods for solving pending mattersand finding ways to satisfy clients' needs.
During the year, 13 complaints were filed by institutionalclients, or a 19% reduction compared to those filed in2005. All complaints were answered in less than eightworking days.
The largest number of complaints related to discontinuedsupply, an area that has since been given particularimportance in order to find solutions for minimising
adverse consequences for clients.
39
EPAL Annual report 2006
Passer domesticus
LABOUR POLICY
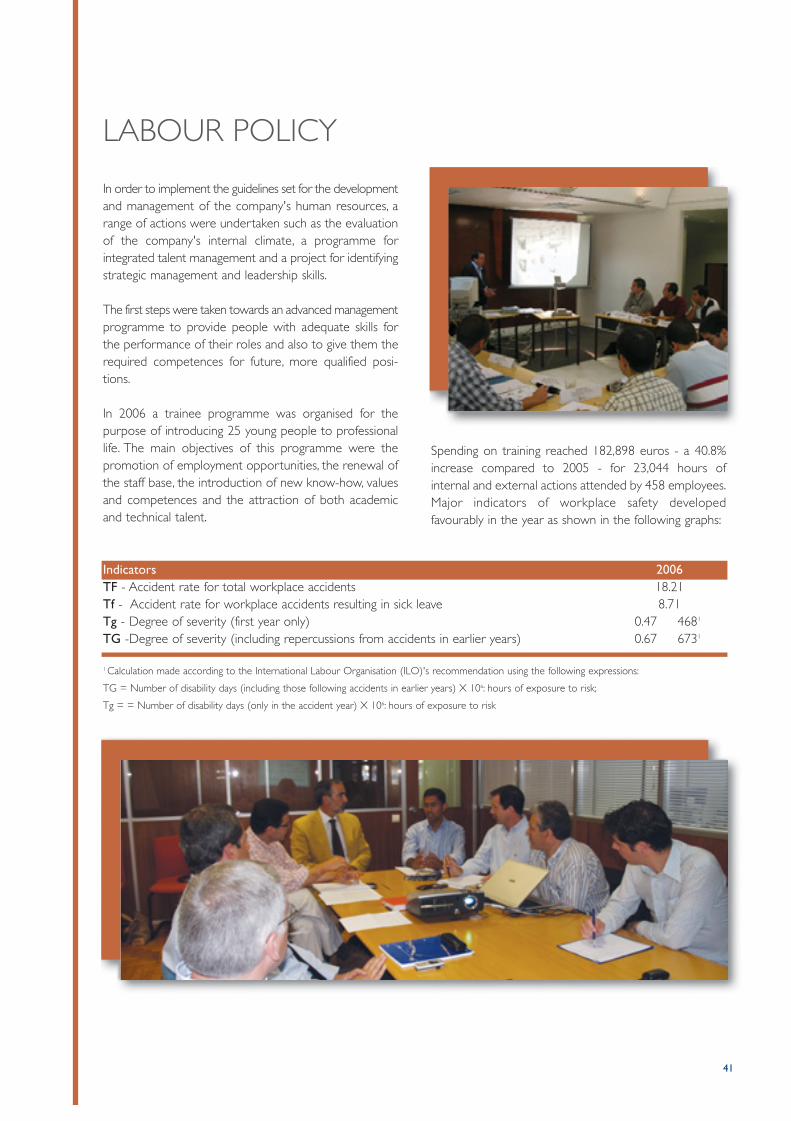
In order to implement the guidelines set for the developmentand management of the company's human resources, arange of actions were undertaken such as the evaluationof the company's internal climate, a programme for integrated talent management and a project for identifyingstrategic management and leadership skills.
The first steps were taken towards an advanced managementprogramme to provide people with adequate skills forthe performance of their roles and also to give them therequired competences for future, more qualified posi-tions.
In 2006 a trainee programme was organised for the purpose of introducing 25 young people to professionallife. The main objectives of this programme were the promotion of employment opportunities, the renewal ofthe staff base, the introduction of new know-how, valuesand competences and the attraction of both academicand technical talent.
Spending on training reached 182,898 euros - a 40.8%increase compared to 2005 - for 23,044 hours of internal and external actions attended by 458 employees.Major indicators of workplace safety developedfavourably in the year as shown in the following graphs:
41
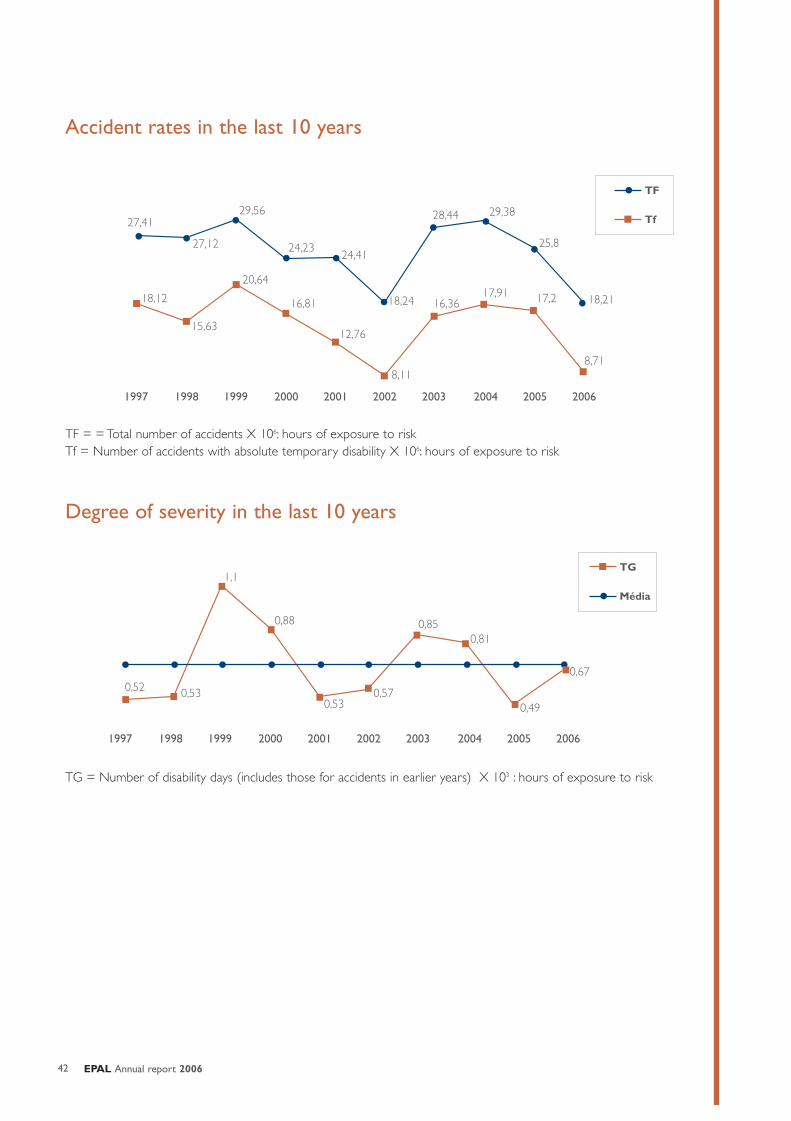
Indicators 2006TF - Accident rate for total workplace accidents 18.21Tf - Accident rate for workplace accidents resulting in sick leave 8.71Tg - Degree of severity (first year only) 0.47 4681
TG -Degree of severity (including repercussions from accidents in earlier years) 0.67 6731
1 Calculation made according to the International Labour Organisation (ILO)'s recommendation using the following expressions:
TG = Number of disability days (including those following accidents in earlier years) X 106: hours of exposure to risk;
Tg = = Number of disability days (only in the accident year) X 106: hours of exposure to risk
EPAL Annual report 200642
TG
Média
1997 1998 1999 2000 2001 2002 2003 2004 2005 2006
0,52 0,53
1,1
0,88
0,530,57
0,850,81
0,49
0,67
Degree of severity in the last 10 years
TG = Number of disability days (includes those for accidents in earlier years) X 103 : hours of exposure to risk
TF
Tf
1997 1998 1999 2000 2001 2002 2003 2004 2005 2006
27,41
27,12
29,56
24,2324,41
18,24
28,44 29,38
25,8
18,2118,12
15,63
20,64
16,81
12,76
8,11
16,3617,91 17,2
8,71
Accident rates in the last 10 years
TF = = Total number of accidents X 106: hours of exposure to riskTf = Number of accidents with absolute temporary disability X 106: hours of exposure to risk
43
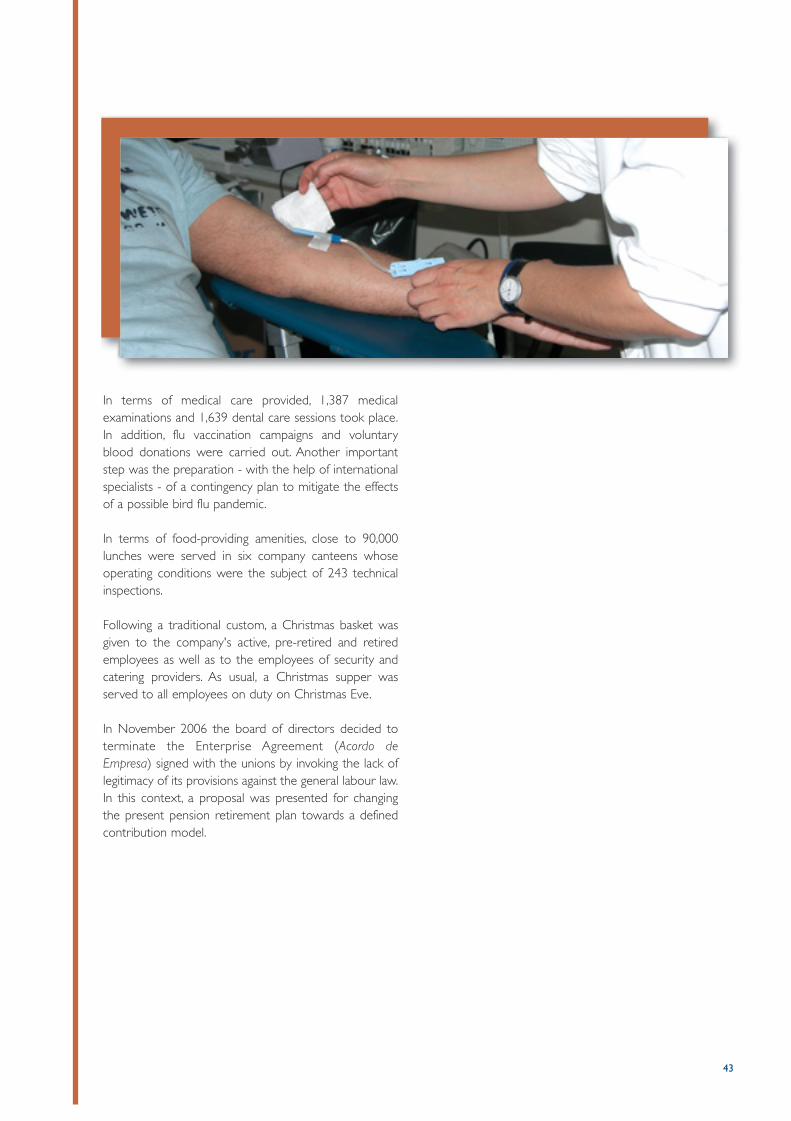
In terms of medical care provided, 1,387 medical examinations and 1,639 dental care sessions took place.In addition, flu vaccination campaigns and voluntaryblood donations were carried out. Another importantstep was the preparation - with the help of internationalspecialists - of a contingency plan to mitigate the effectsof a possible bird flu pandemic.
In terms of food-providing amenities, close to 90,000lunches were served in six company canteens whoseoperating conditions were the subject of 243 technicalinspections.
Following a traditional custom, a Christmas basket wasgiven to the company's active, pre-retired and retiredemployees as well as to the employees of security andcatering providers. As usual, a Christmas supper wasserved to all employees on duty on Christmas Eve.
In November 2006 the board of directors decided toterminate the Enterprise Agreement (Acordo deEmpresa) signed with the unions by invoking the lack oflegitimacy of its provisions against the general labour law.In this context, a proposal was presented for changingthe present pension retirement plan towards a definedcontribution model.
Falco tinnunculus
EPAL Annual report 2006

SUSTAINABILITYIn 2006, EPAL published its first sustainability reportaccording to international guidelines in which the compa-ny's economic, social and environmental performancewas described in detail.
The data disclosed in that document showed the predominantly favourable effects the company's opera-tions have on society and its stakeholders' well-being.With the help of a large number of indicators, the com-pany's action in several areas was amply documented.
The report's initial statement sums up the company'sguiding principles for sustainable development:
To achieve efficiency in water production, generating anadequate return on invested capitalTo minimise operations' footprint on the environmentTo follow fair labour policies that will foster efficiencyTo invest in new production technologyTo promote the efficient use of water
Although EPAL's second sustainability report is due forpublication in the first half of 2007, a few achievements in2006 can be listed here,
on the economic front:Share of net income distributed to the shareholderProtection of employees' purchasing powerSustained capital expenditure levels
on the social front:Funded level of retirement plan obligationsEqual opportunity in recruitment and promotion ofemployeesAccess to computer equipment by the visually
impaired
on the environmental front:Water loss in steady decline to 13.6% of total abstract-ed waterEnergy consumption in line with objectives in the five-year planLower production of waste and higher percentage ofrecycled products.
In 2006, EPAL's second environmental progress reportwas delivered, showing significant improvements comparedto the first report in 2002. In this second edition aspectswere covered that had either not been considered or
45
had been insufficiently covered in the first report;indicators were defined for a more rigorous annual evaluation of improvements in environmental performancewith a view to generating, in the system's annual reviews,more relevant data for the design of annual environmental management programmes.
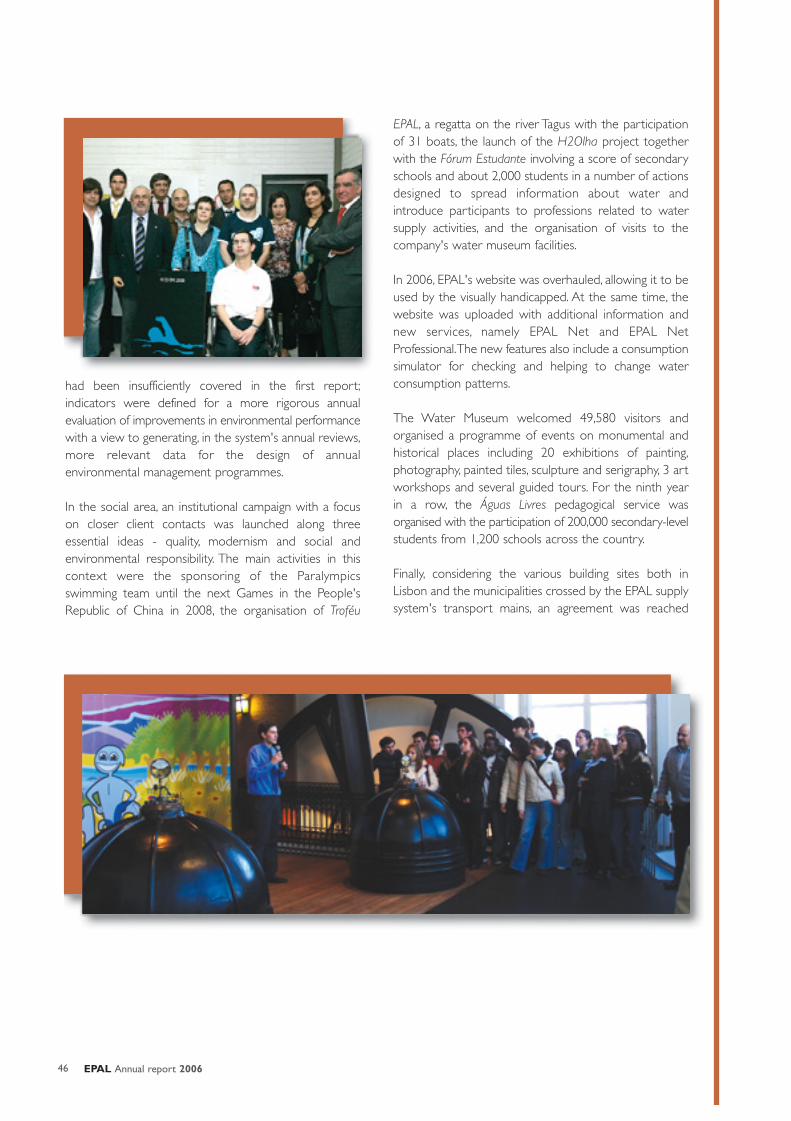
In the social area, an institutional campaign with a focuson closer client contacts was launched along three essential ideas - quality, modernism and social and environmental responsibility. The main activities in thiscontext were the sponsoring of the Paralympics swimming team until the next Games in the People'sRepublic of China in 2008, the organisation of Troféu
EPAL, a regatta on the river Tagus with the participationof 31 boats, the launch of the H2Olha project togetherwith the Fórum Estudante involving a score of secondaryschools and about 2,000 students in a number of actionsdesigned to spread information about water and introduce participants to professions related to watersupply activities, and the organisation of visits to the company's water museum facilities.
In 2006, EPAL's website was overhauled, allowing it to beused by the visually handicapped. At the same time, thewebsite was uploaded with additional information andnew services, namely EPAL Net and EPAL NetProfessional.The new features also include a consumptionsimulator for checking and helping to change water consumption patterns.
The Water Museum welcomed 49,580 visitors andorganised a programme of events on monumental andhistorical places including 20 exhibitions of painting,photography, painted tiles, sculpture and serigraphy, 3 artworkshops and several guided tours. For the ninth yearin a row, the Águas Livres pedagogical service was organised with the participation of 200,000 secondary-levelstudents from 1,200 schools across the country.
Finally, considering the various building sites both inLisbon and the municipalities crossed by the EPAL supplysystem's transport mains, an agreement was reached
EPAL Annual report 200646
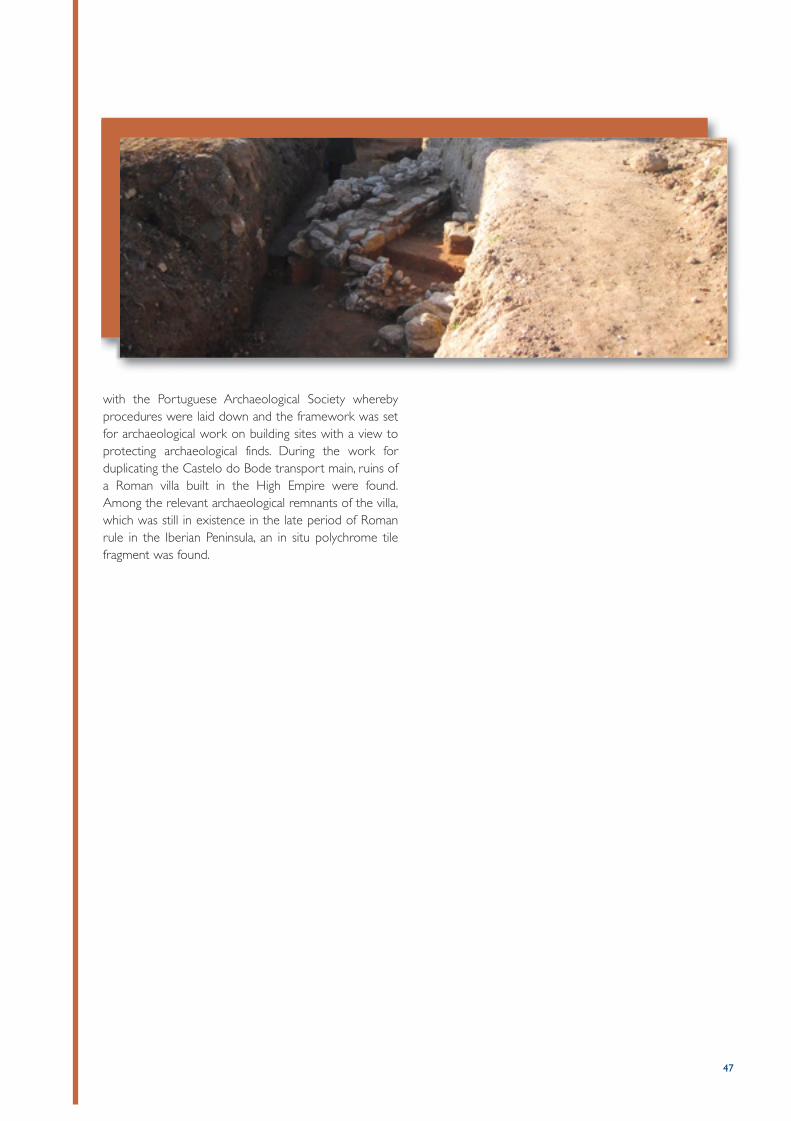
with the Portuguese Archaeological Society wherebyprocedures were laid down and the framework was setfor archaeological work on building sites with a view toprotecting archaeological finds. During the work forduplicating the Castelo do Bode transport main, ruins ofa Roman villa built in the High Empire were found.Among the relevant archaeological remnants of the villa,which was still in existence in the late period of Romanrule in the Iberian Peninsula, an in situ polychrome tilefragment was found.
47
EPAL Annual report 2006
Dendrocopos major
OTHER ACTIVITIESEPAL's quality systems and activities, achieved by itsinvestment efforts, have prompted the company to offera number of services to the market in order to enhancereturns from its installed and available capacity.
In providing testing services to external entities, EPAL'sCentral Laboratory received 1,517 samples and conducted13,032 trials of water quality, while the Meter Laboratorychecked, fine-tuned and repaired meters for externalparties.
In technology and information systems, EPAL focused itsefforts on the following four areas: telecommunications,industrial automation and centralised supervision, innovativeschemes for the distribution of drinking water and strategic and technological realignment of the customerrelationship platform. Named AQUAmatrix®, this platform was fitted with a number of new functionalitiesdesigned to meet the company's internal needs and therequirements for integrated and effective commercialmanagement. In this way, the basis was provided for thecommercial use of AQUAmatrix® as an application service provider. In Torres Vedras, northwest of the capital, EPAL's bid won the public tender organised bythe local municipality. Other bids were submitted to the
Águas de Santo André water company, in Alentejo, andthe municipal company Praia Ambiente on Terceiraisland, on the Azores.
In consortium with COBA - Consultores de Engenhariaand NEE - Nationale Eau Environnement, EPAL is developing a fact-finding and renewal study of the distributionsystems for drinking water in the cities of Bejaia,Tizi-Ouzou and Chlef, a project it was awarded by theAlgerian Ministry for Water Resources. Under this consortium, EPAL is responsible for the studies expectedto lead to improved technical and commercial managementof the cities' water distribution systems, currently run byAlgérienne des Eaux.In 2006, EPAL developed auditing activities in commercialmatters, in particular the organisation of means andresources, customer relationships and supporting information systems. The company gathered sufficientdata in the process for drafting a commercial reorganisationproposal.
Finally, following the government's Technological Planguidelines for simplifying public administration, EPALstarted to implement a pilot project for switching toelectronic invoicing.
49
EPAL Annual report 2006
Certhia brachydactyla
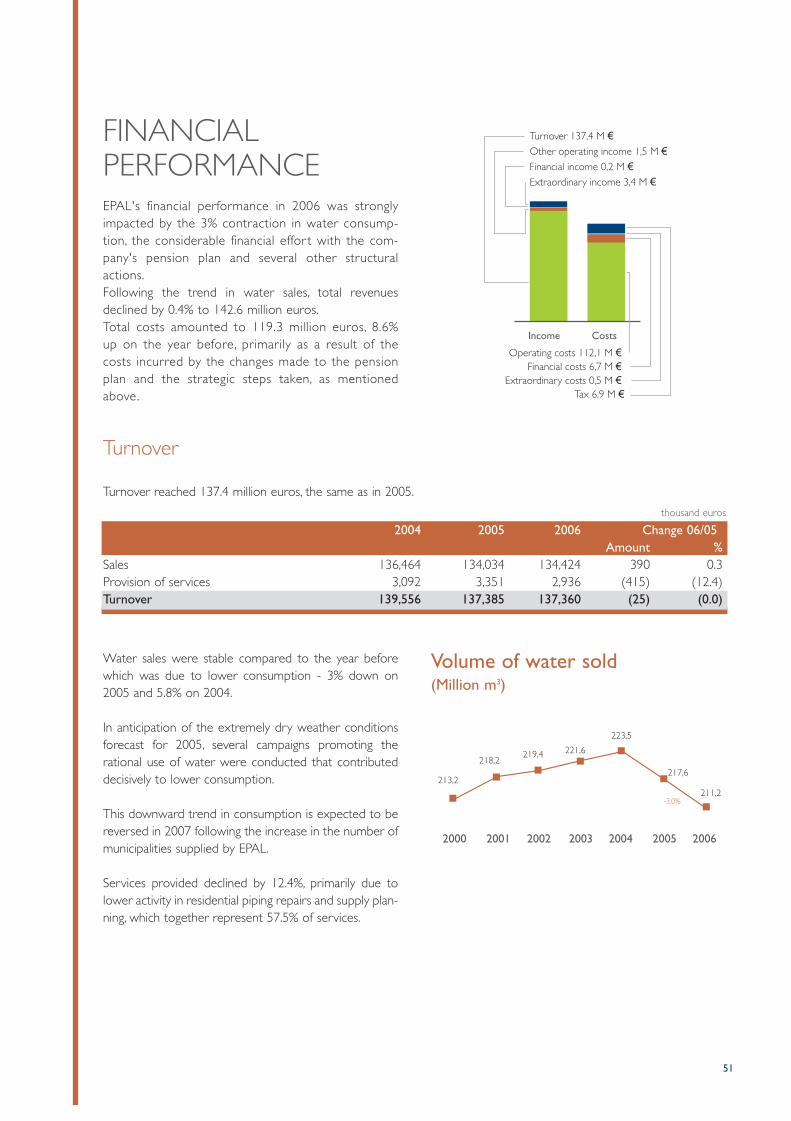
FINANCIAL PERFORMANCEEPAL's financial performance in 2006 was stronglyimpacted by the 3% contraction in water consump-tion, the considerable financial effor t with the com-pany's pension plan and several other structuralactions.Following the trend in water sales, total revenuesdeclined by 0.4% to 142.6 million euros.Total costs amounted to 119.3 million euros, 8.6%up on the year before, primarily as a result of thecosts incurred by the changes made to the pensionplan and the strategic steps taken, as mentionedabove.
51
Water sales were stable compared to the year beforewhich was due to lower consumption - 3% down on2005 and 5.8% on 2004.
In anticipation of the extremely dry weather conditionsforecast for 2005, several campaigns promoting therational use of water were conducted that contributeddecisively to lower consumption.
This downward trend in consumption is expected to bereversed in 2007 following the increase in the number ofmunicipalities supplied by EPAL.
Services provided declined by 12.4%, primarily due tolower activity in residential piping repairs and supply plan-ning, which together represent 57.5% of services.
Extraordinary income 3,4 M �
Income Costs
Financial income 0,2 M �Other operating income 1,5 M �Turnover 137,4 M �
Tax 6,9 M �Extraordinary costs 0,5 M �
Financial costs 6,7 M �Operating costs 112,1 M �
Turnover
Turnover reached 137.4 million euros, the same as in 2005.
2004 2005 2006 Change 06/05Amount %
Sales 136,464 134,034 134,424 390 0.3Provision of services 3,092 3,351 2,936 (415) (12.4)Turnover 139,556 137,385 137,360 (25) (0.0)
Volume of water sold(Million m3)
2000 2001 2002 2003 2004 2005 2006
217,6
223,5
213,2
218,2219,4 221,6
211,2-3,0%
thousand euros
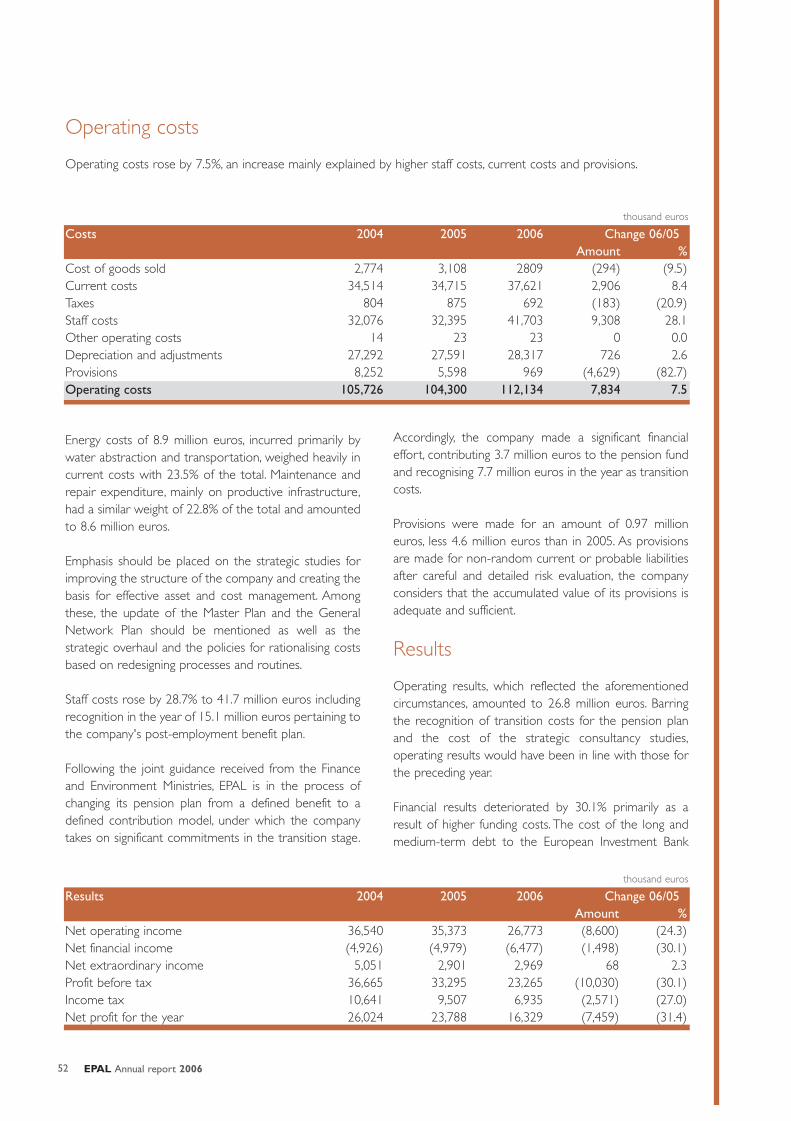
Energy costs of 8.9 million euros, incurred primarily bywater abstraction and transportation, weighed heavily incurrent costs with 23.5% of the total. Maintenance andrepair expenditure, mainly on productive infrastructure,had a similar weight of 22.8% of the total and amountedto 8.6 million euros.
Emphasis should be placed on the strategic studies forimproving the structure of the company and creating thebasis for effective asset and cost management. Amongthese, the update of the Master Plan and the GeneralNetwork Plan should be mentioned as well as the strategic overhaul and the policies for rationalising costsbased on redesigning processes and routines.
Staff costs rose by 28.7% to 41.7 million euros includingrecognition in the year of 15.1 million euros pertaining tothe company's post-employment benefit plan.
Following the joint guidance received from the Financeand Environment Ministries, EPAL is in the process ofchanging its pension plan from a defined benefit to adefined contribution model, under which the companytakes on significant commitments in the transition stage.
Accordingly, the company made a significant financialeffort, contributing 3.7 million euros to the pension fundand recognising 7.7 million euros in the year as transitioncosts.
Provisions were made for an amount of 0.97 millioneuros, less 4.6 million euros than in 2005. As provisionsare made for non-random current or probable liabilitiesafter careful and detailed risk evaluation, the companyconsiders that the accumulated value of its provisions isadequate and sufficient.
Results
Operating results, which reflected the aforementionedcircumstances, amounted to 26.8 million euros. Barringthe recognition of transition costs for the pension planand the cost of the strategic consultancy studies,operating results would have been in line with those forthe preceding year.
Financial results deteriorated by 30.1% primarily as aresult of higher funding costs. The cost of the long andmedium-term debt to the European Investment Bank
EPAL Annual report 200652
Operating costs
Operating costs rose by 7.5%, an increase mainly explained by higher staff costs, current costs and provisions.
Costs 2004 2005 2006 Change 06/05Amount %
Cost of goods sold 2,774 3,108 2809 (294) (9.5)Current costs 34,514 34,715 37,621 2,906 8.4Taxes 804 875 692 (183) (20.9)Staff costs 32,076 32,395 41,703 9,308 28.1Other operating costs 14 23 23 0 0.0Depreciation and adjustments 27,292 27,591 28,317 726 2.6Provisions 8,252 5,598 969 (4,629) (82.7)Operating costs 105,726 104,300 112,134 7,834 7.5
thousand euros
Results 2004 2005 2006 Change 06/05Amount %
Net operating income 36,540 35,373 26,773 (8,600) (24.3)Net financial income (4,926) (4,979) (6,477) (1,498) (30.1)Net extraordinary income 5,051 2,901 2,969 68 2.3Profit before tax 36,665 33,295 23,265 (10,030) (30.1)Income tax 10,641 9,507 6,935 (2,571) (27.0)Net profit for the year 26,024 23,788 16,329 (7,459) (31.4)
thousand euros

(EIB) rose by 34.4% to 6.3 million euros after theincrease in debt outstanding - with loan utilisationsamounting to 33 million euros in the year - and the significant rise in interest rates.EPAL's policy for managing interest rate risk consisted of(i) entering into funding agreements that will minimisethe cost of debt by comparing the cost of fixed-rateinstruments with the combined cost of floating-rate andhedging instruments and (ii) evenly balancing fixed ratewith floating rate instruments.
Extraordinary results were broadly stable and included2.7 million euros of income recognised in the year andrelating to EU investment subsidies received in earlieryears.
Income tax amounted to 6.9 million euros, which represented an average tax rate of 29.8%, the same as inprevious years.
As a consequence of the aforementioned circumstances,in particular reduced demand, lesser absorption of fixedcosts due to the lower level of activity and higher costswith EPAL's pension plan, the net result was 16.3 millioneuros, less 31.4 % than in the year before.
Financial position
In 2006, EPAL continued to implement its investment strategy for maintaining water quality standards while promoting the efficient use of the resource. Investmentspending in the year amounted to 57.2 million euros andcovered two important items: the upgrade of abstractioncapacity at Castelo do Bode, the company's main sourceof water, and the planned replacement of the Lisbon network, a key factor in water loss reduction. In order to fund, among other things, capital expenditure of 57.4 million euros, the company borrowed
33 million euros to supplement operating cash flow of51.3 million.
53
Balance sheet 2004 2005 2006 Change 06/05(restated) (restated) Amount %
ASSETSNon-current assets 607,695 639,961 669,155 29,194 4.6Current assets 67,674 47,825 46,030 (1,795) (3.8)TOTAL 675,369 687,786 715,185 27,399 4.0
SHAREHOLDERS' EQUITY ANSD LIABILITIESEquity 343,093 345,906 343,780 (2,126) (0.6)Non-current liabilities 239,333 272,192 303,168 30,976 11.4Current liabilities 92,943 69,688 68,237 (1,451) (2.1)TOTAL 675,369 687,786 715,185 27,399 4.0
thousand euros
Abridged cash flow statement 2006Operating cash flows 51,3Investing cash flows (57,4)Outflows from financing activities
Dividend payments and bank debt service (29,5)
Inflows from financing activitiesDrawings in the year 33,0
Change in cash and cash equivalents (2,6)
Following these expenditure and funding transactions,non-current assets rose by 4.6% and non-current liabilities,including long and medium-term debt and pension and pre-retirement obligations, increased by 11.4%.
Remark: The amounts relating to 2004 and 2005 are notdirectly comparable with those shown in the annual reportsfor the respective years, a fact emphasised by the mention“restated”.
In the last five-year period, net debt increased by 64.7million euros or close to 25% of capital expenditure inthe period which amounted to 259 million euros. Thisfact highlights the large contribution of operating cashflow to funding capital expenditure at EPAL.
The rise in long-term (non-current) assets by 29.2 millioneuros combined with an increase in non-current liabilities by31 million euros provides evidence of a maturity-matchingfunding policy and a favourable development comparedto previous years in spite of a decrease in equity, whichwas, at 31 December 2006, considerably affected by thedistribution of 2005 results in 2006.

Equity holdings
EPAL has equity holdings in the following four companies.
EPAL Annual report 200654
137.5
2002
143.4
2003
143.6
2004
175.2
2005
202.2
2006
Equity declined 0.6% to 343.8 million euros, compared tothe year before,which highlights the level of retained earningsin 2005 - 5 million euros or 19% of net results for 2005.Current assets declined by 3.8% or 1.8 million euros reflecting lower liquidity towards the end of the year resulting from the settlement of sizable obligations in theamount of 7 million euros including contributions toEPAL's pension fund, payments of income tax and thesettlement of equipment suppliers' accounts.EPAL kept its financial strength and ability to meet short,medium and long-term commitments according to the rating by Companhia Portuguesa de Rating.
Medium and long-term debt Milllion euros
30.934.0
36.741.4
2002 2003 2004 2005 2006
46.0
EPAL's pension fundMillion euros
Rating category RatingShort-term rating A-1 +Medium- and long-term rating A+
Prolagos, SA (Brasil) 7.5% R$ 9.5 million
Clube de Golfe
das Amoreiras 100.0% € 350,000
Shore, Lda. 7.5% € 31,500
Ambelis, SA 1.0% € 9,976
Pension fund
EPAL's pension fund reached 46 million euros at the end of2006, an 11.1% increase on the year before and a 48.8% risein the last five years.This increase was partly due to the goodperformance of the fund but, in particular, to the contributo-ry effort made by the company - 13.2 million euros in thelast five years of which 3.7 million in 2006 alone.The contri-butions impacted the funding of obligations according to thePortuguese Insurance Institute's Minimal Fund, which wasslightly above 100% in 2005 and reached 107% in 2006.
Prolagos, SA
EPAL's main equity holding is in the Brazilian company Prolagos of which it owns 7.5% for anamount of R$ 9.5 million. The balance of Prolagos'share capital is held by Águas de Por tugal, SGPS,either directly or indirectly through EBAL - Águasdo Brasil, SA.
EPAL is the technical operator for the concession heldby Prolagos for the supply of water and treatment ofwaste in the urban areas of the Cabo Frio, Búzios, SãoPedro da Aldeia and Iguaba Grande municipalities and the supply of water to the Arraial do Cabo municipality.
In April 2006, Prolagos raised its share capital by R$6.8 million and EPAL subscribed to its allotted share ofR$510,000. At year end, the equity holding in Prolagoswas valued on EPAL's balance sheet at 5.0 million eurosand was totally provided for.
Clube de Golfe das Amoreiras, SA
EPAL is the sole owner of Clube de Golfe dasAmoreiras, SA, a company with share capital of 350,000euros which was created for the development, construc-tion and operation of a golf training ground on the landabove the Amoreiras reservoir following a request by the Lisbon municipality for the area to be put to valuable use.
Recently, Supergolf - Amoreiras, the contracted developer, sought new arbitration after EPAL and Clubede Golfe challenged a previous arbitral decision wherebySupergolf was awarded the right to terminate the development contract.
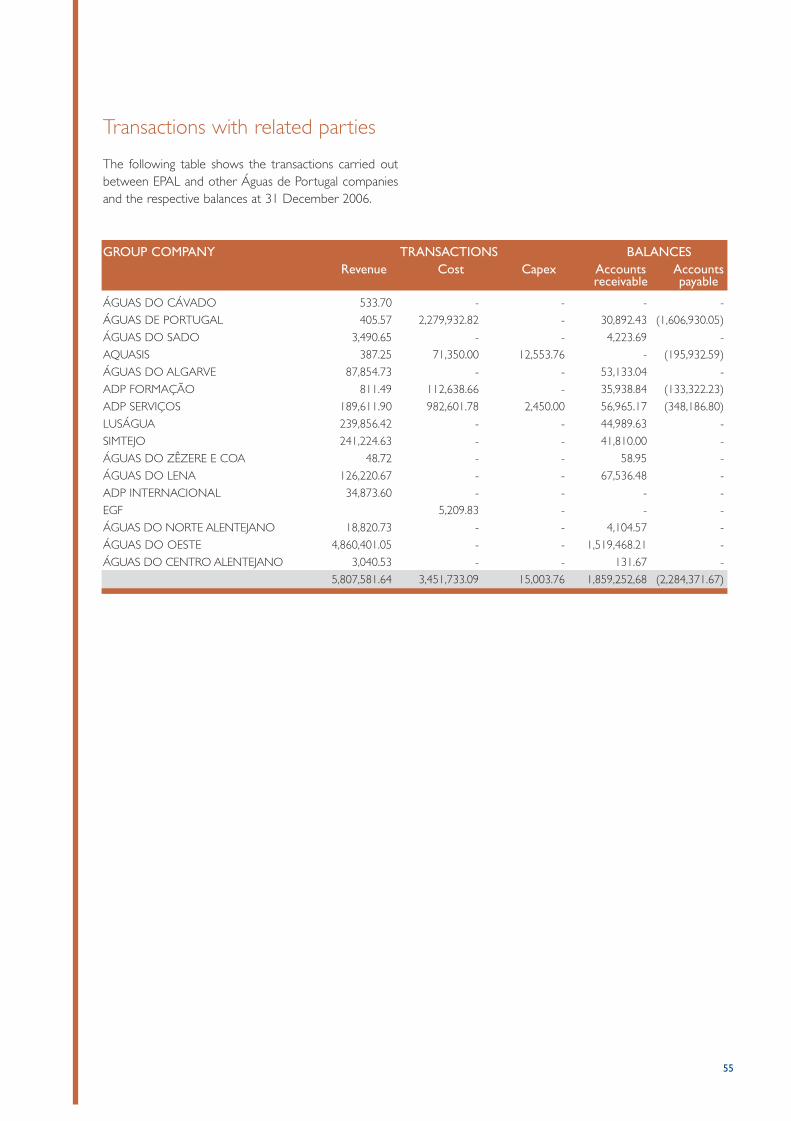
Transactions with related parties
The following table shows the transactions carried outbetween EPAL and other Águas de Portugal companiesand the respective balances at 31 December 2006.
55
GROUP COMPANY TRANSACTIONS BALANCESRevenue Cost Capex Accounts Accounts
receivable payable
ÁGUAS DO CÁVADO 533.70 - - - -
ÁGUAS DE PORTUGAL 405.57 2,279,932.82 - 30,892.43 (1,606,930.05)
ÁGUAS DO SADO 3,490.65 - - 4,223.69 -
AQUASIS 387.25 71,350.00 12,553.76 - (195,932.59)
ÁGUAS DO ALGARVE 87,854.73 - - 53,133.04 -
ADP FORMAÇÃO 811.49 112,638.66 - 35,938.84 (133,322.23)
ADP SERVIÇOS 189,611.90 982,601.78 2,450.00 56,965.17 (348,186.80)
LUSÁGUA 239,856.42 - - 44,989.63 -
SIMTEJO 241,224.63 - - 41,810.00 -
ÁGUAS DO ZÊZERE E COA 48.72 - - 58.95 -
ÁGUAS DO LENA 126,220.67 - - 67,536.48 -
ADP INTERNACIONAL 34,873.60 - - - -
EGF 5,209.83 - - -
ÁGUAS DO NORTE ALENTEJANO 18,820.73 - - 4,104.57 -
ÁGUAS DO OESTE 4,860,401.05 - - 1,519,468.21 -
ÁGUAS DO CENTRO ALENTEJANO 3,040.53 - - 131.67 -
5,807,581.64 3,451,733.09 15,003.76 1,859,252,68 (2,284,371.67)
EPAL Annual report 2006
Turdus philomelos
RISK MANAGEMENTFinancial risks
EPAL's operations are exposed to financial risks whichare primarily related to liquidity and interest rates.
In terms of liquidity risk management, the company's policy is to keep reasonable cash balances while ensuringthat occasional cash outflows from operating or investingactivities are covered by short-, medium- and long-termborrowing arrangements.
For short-term borrowings, EPAL's policy is to secureaccess to credit lines for flexible use and for the requiredamount. To this end, the company agreed with two reputable banking institutions the availability of two credit lines for a total value of 12.5 million euros as wellas a commercial paper programme for the sameamount.
In order to fund capital expenditure, EPAL signed on 16January 2002 an agreement with the EuropeanInvestment Bank (EIB) whereby the bank extended thecompany a long-term loan facility for 185 million euroscalled EIB EPAL III. The purpose of this facility is to fund50% of an ongoing investment programme for a totalamount of 370 million euros. At year end, 100 millioneuros had been utilised under the facility.
Interest rate risk arises for EPAL from its floating-rate,long-term borrowings. The company's financial policyrests on (i) entering into the most competitive interestrate regime comparing fixed rates with the sum of floating rates and hedging instruments and (ii) a balancedfixed/floating-rate mix. At year end, indebtedness to EIBwas 43.1% at fixed rate and 56.9% at floating rate.
Personal, property and third-partyrisks
The broad majority of the risks incurred by EPAL in its busi-ness activities have been transferred to insurers by means ofpersonal, property and third-party insurance policies cover-ing namely workplace hazards, personal and travelling acci-dents, road assistance, disease, business multi-risks includingforegone income,automotive accidents and third-party liabil-ity for operations, pollution and products. EPAL's insurancecontracts are valid for one year at a time, mature on each30th June and may be renewed.
Environmental risks
Environmental risks to EPAL derive primarily from down-graded water at abstraction points for reasons out ofEPAL's control which may affect the satisfaction of con-sumer needs. Systematic monitoring and control ofabstracted water provides knowledge about occasionalevents and downgrading trends which may lead to pre-venting action being taken if the relevant authorities arealerted in a timely fashion.Environmental hazards following from the company'sactivities are primarily related to bursts of water mains,particularly large-diameter transport mains. Expenditureon the improvement and replacement of transport anddistribution mains contributes to controlling risk as domaintenance and control activities and the implementa-tion of monitoring and control zones and transportmonitoring zones.Supported by its complete and rigorous environmentalmapping, EPAL knows the significance of any adverseenvironmental impacts that may arise from emergencysituations in the company's business operations.
57
EPAL Annual report 2006
Carduelis carduelis
PROPOSED APPROPRIATION OF NET RESULTS
Pursuant to article 21 of the articles of association of EPAL - Empresa Portuguesa das Águas Livres, S.A,the Board of Directors proposes that the net result
of € 16,328,528.05 obtained in financial year 2006should be appropriated as follows:
59
€ 1,632,852.81 to legal reserves;
€ 10,769,583.00 to shareholder dividends;
€ 941,221.00 to the employees' profit-sharing plan;
€ 2,984,871.24 to retained earnings.
EPAL Annual report 2006
Hirundo rustica
OUTLOOKIn 2007 some very important investments will be completed, namely the expansion of production capacityat the Asseiceira treatment station from 500,000 to625,000 m3 per day with the introduction of flotationand intermediate ozonisation techniques in the treatment process.The following works should also be mentioned: theincreased supply capabilities for the Mafra municipality,the doubling of the third Castelo do Bode transportmain which is 4.5 km long in the Santarém zone for thepurpose of rebalancing the transport main's capacityupstream from Alcanhões, as well as some other newprojects such as the pumping station at A-dos-Bispos.
On the Lisbon distribution network, planned investmentsaim to raise reliability while rationalising capitalemployed, namely by renewing small- and large-diameterpiping and upgrading the pumping station at Olivais.
Starting in the second half of 2007, EPAL will supply nineadditional municipalities through the Águas do Oestemulti-municipal company, thus reaching a total of 35municipalities supplied.
One of the goals for 2007 is to raise to 75 the numberof Monitoring and Control Zones (ZMCs) so as to cover63% of the network and 54% of the clients.Simultaneously, a new software tool that has been developed in-house will be consolidated for controllingevents on the ZMCs.
A plan for the extraordinary inspection of large transportmains has been launched and will be a reference for set-ting investment priorities. This action is part of the implementation of the Integrated Asset ManagementModel that will in the current year be one of the company'spriorities.The model will give management the tools andthe ability to make the right decisions on assets throughouttheir life cycle.
Development and implementation of a QualityManagement System for the whole company will proceed.
In 2007, the required final licence from the relevantauthorities is expected to be obtained that will allow aninternational tender to be launched for the constructionof EPAL's new central laboratory, planned to be the firststep in a project leading to centralised functions atOlivais.
The Environment Ministry's launch on 28 December2006 of PEAASAR II, a strategic plan for water supplyand wastewater treatment, has presented new challengesto the company.
In line with the plan's thoughts, EPAL's sole shareholderÁguas de Portugal set as a strategic goal for the companyto manage, in an integrated way, the urban water cycle inits area of influence.Taking up this challenge will determinethe company's continued development in raising clientservice and enhancing shareholder value.
61
Parus caeruleus
EPAL Annual report 2006
All those who contributed, directly or indirectly, to thecompany's progress and activities are hereby acknowl-edged with appreciation and respect.
EPAL employees, for their efforts in achieving profes-sional self-fulfilment at the company's service;
The members of the company's governing bodies,namely the Sole Auditor and the CharteredAccountants, the members of the EnvironmentalImpact Board and the members of the GeneralMeeting Committee;
Suppliers, contractors and service providers, for theircommitted response to a variety of challenges;
Águas de Portugal, a diligent and available shareholder;
ACKNOWLEDGEMENTS
Bankers and insurers, for their trust;
The Environment and Finance ministries as well asother public bodies such as Instituto Regulador daÁgua e Resíduos, Direcção-Geral da Empresa, theWater Institute, the Coordination and RegionalDevelopment Board for Lisbon and the Tagus Valleyand so many others;
EPAL's clients, from municipal and multi-municipal toresidential clients, from business clients to public bod-ies, for their wishes and expectations, for their trustand relationship with the company.
Lisbon, 15 March 2007
63
João Manuel Lopes FidalgoChairman
Jorge Luís Ferrão de Mascarenhas Loureiro José Alfredo Manita VazDirector Director
António Bento Franco Rui Manuel de Carvalho GodinhoDirector Director

Columba livia
FINANCIAL STATEMENTSAND NOTES

EPAL Annual report 2006
Picus viridis
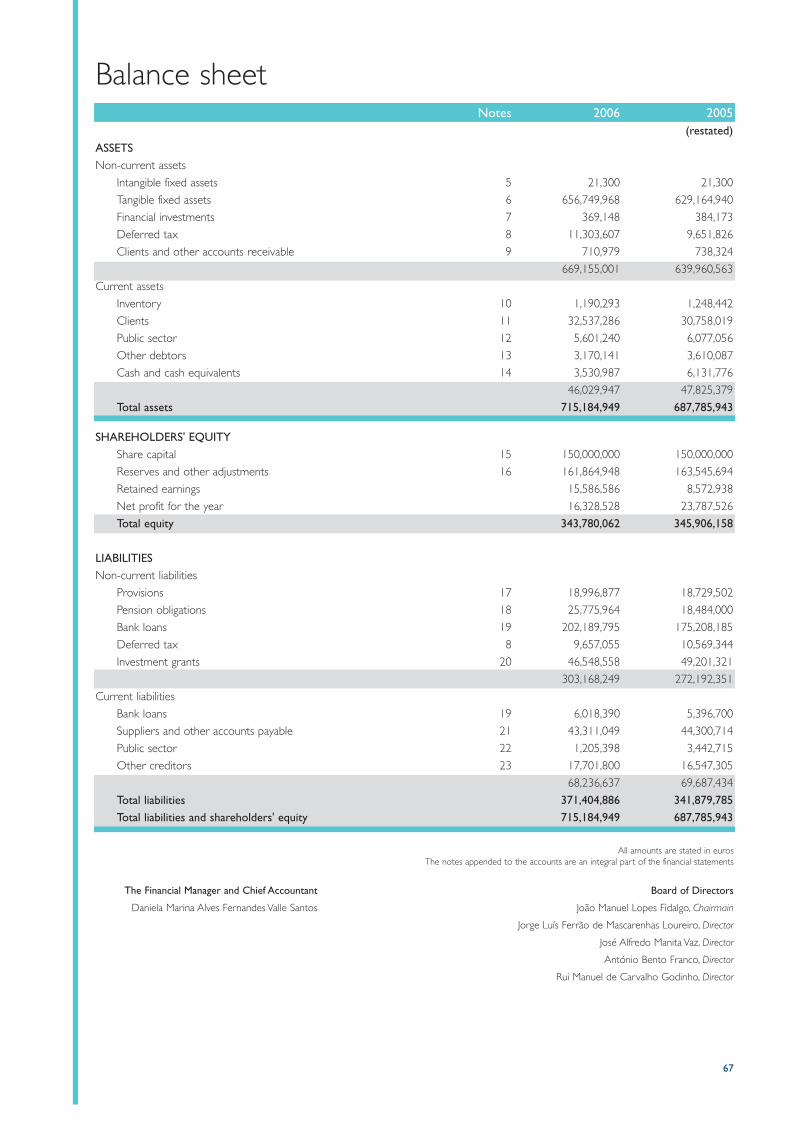
67
Notes 2006 2005(restated)
ASSETSNon-current assets
Intangible fixed assets 5 21,300 21,300
Tangible fixed assets 6 656,749,968 629,164,940
Financial investments 7 369,148 384,173
Deferred tax 8 11,303,607 9,651,826
Clients and other accounts receivable 9 710,979 738,324
669,155,001 639,960,563
Current assets
Inventory 10 1,190,293 1,248,442
Clients 11 32,537,286 30,758,019
Public sector 12 5,601,240 6,077,056
Other debtors 13 3,170,141 3,610,087
Cash and cash equivalents 14 3,530,987 6,131,776
46,029,947 47,825,379
Total assets 715,184,949 687,785,943
Balance sheet
SHAREHOLDERS' EQUITYShare capital 15 150,000,000 150,000,000
Reserves and other adjustments 16 161,864,948 163,545,694
Retained earnings 15,586,586 8,572,938
Net profit for the year 16,328,528 23,787,526
Total equity 343,780,062 345,906,158
LIABILITIESNon-current liabilities
Provisions 17 18,996,877 18,729,502
Pension obligations 18 25,775,964 18,484,000
Bank loans 19 202,189,795 175,208,185
Deferred tax 8 9,657,055 10,569,344
Investment grants 20 46,548,558 49,201,321
303,168,249 272,192,351
Current liabilities
Bank loans 19 6,018,390 5,396,700
Suppliers and other accounts payable 21 43,311,049 44,300,714
Public sector 22 1,205,398 3,442,715
Other creditors 23 17,701,800 16,547,305
68,236,637 69,687,434
Total liabilities 371,404,886 341,879,785 Total liabilities and shareholders' equity 715,184,949 687,785,943
All amounts are stated in eurosThe notes appended to the accounts are an integral part of the financial statements
The Financial Manager and Chief Accountant
Daniela Marina Alves Fernandes Valle Santos
Board of Directors
João Manuel Lopes Fidalgo, Chairmain
Jorge Luís Ferrão de Mascarenhas Loureiro, Director
José Alfredo Manita Vaz, Director
António Bento Franco, Director
Rui Manuel de Carvalho Godinho, Director
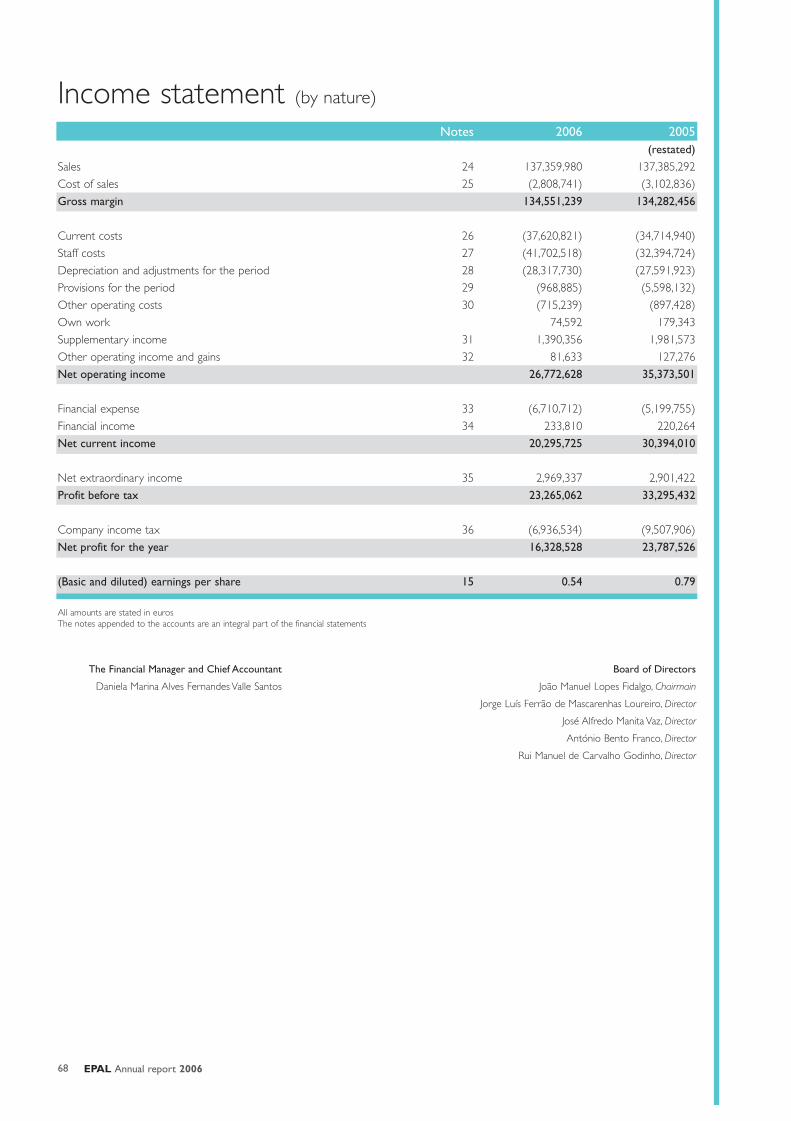
EPAL Annual report 200668
Income statement (by nature)
Notes 2006 2005(restated)
Sales 24 137,359,980 137,385,292
Cost of sales 25 (2,808,741) (3,102,836)
Gross margin 134,551,239 134,282,456
Current costs 26 (37,620,821) (34,714,940)
Staff costs 27 (41,702,518) (32,394,724)
Depreciation and adjustments for the period 28 (28,317,730) (27,591,923)
Provisions for the period 29 (968,885) (5,598,132)
Other operating costs 30 (715,239) (897,428)
Own work 74,592 179,343
Supplementary income 31 1,390,356 1,981,573
Other operating income and gains 32 81,633 127,276
Net operating income 26,772,628 35,373,501
Financial expense 33 (6,710,712) (5,199,755)
Financial income 34 233,810 220,264
Net current income 20,295,725 30,394,010
Net extraordinary income 35 2,969,337 2,901,422
Profit before tax 23,265,062 33,295,432
Company income tax 36 (6,936,534) (9,507,906)
Net profit for the year 16,328,528 23,787,526
(Basic and diluted) earnings per share 15 0.54 0.79
All amounts are stated in eurosThe notes appended to the accounts are an integral part of the financial statements
The Financial Manager and Chief Accountant
Daniela Marina Alves Fernandes Valle Santos
Board of Directors
João Manuel Lopes Fidalgo, Chairmain
Jorge Luís Ferrão de Mascarenhas Loureiro, Director
José Alfredo Manita Vaz, Director
António Bento Franco, Director
Rui Manuel de Carvalho Godinho, Director
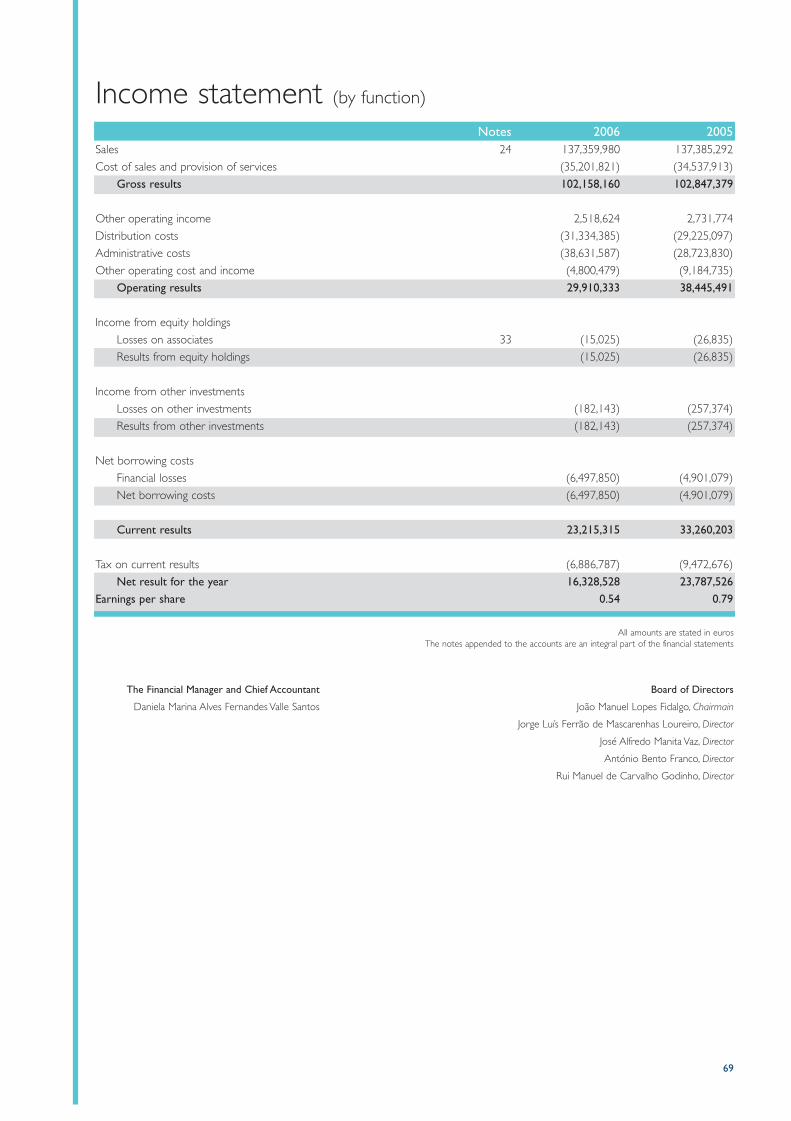
69
Notes 2006 2005Sales 24 137,359,980 137,385,292
Cost of sales and provision of services (35,201,821) (34,537,913)
Gross results 102,158,160 102,847,379
Other operating income 2,518,624 2,731,774
Distribution costs (31,334,385) (29,225,097)
Administrative costs (38,631,587) (28,723,830)
Other operating cost and income (4,800,479) (9,184,735)
Operating results 29,910,333 38,445,491
Income from equity holdings
Losses on associates 33 (15,025) (26,835)
Results from equity holdings (15,025) (26,835)
Income from other investments
Losses on other investments (182,143) (257,374)
Results from other investments (182,143) (257,374)
Net borrowing costs
Financial losses (6,497,850) (4,901,079)
Net borrowing costs (6,497,850) (4,901,079)
Current results 23,215,315 33,260,203
Tax on current results (6,886,787) (9,472,676)
Net result for the year 16,328,528 23,787,526 Earnings per share 0.54 0.79
Income statement (by function)
All amounts are stated in eurosThe notes appended to the accounts are an integral part of the financial statements
The Financial Manager and Chief Accountant
Daniela Marina Alves Fernandes Valle Santos
Board of Directors
João Manuel Lopes Fidalgo, Chairmain
Jorge Luís Ferrão de Mascarenhas Loureiro, Director
José Alfredo Manita Vaz, Director
António Bento Franco, Director
Rui Manuel de Carvalho Godinho, Director

EPAL Annual report 200670
Statement of changes in equityItem Share Adjustment Revaluation Legal Others Retained Net profit Total
capital reserves reserves reserves earnings for the year
1 January 2005 150,000,000 (4,064) 101,339,876 20,611,045 22,171,377 22,950,493 26,024,376 343,093,104
Appropriation of 2004 results - - - 2,602,438 - 23,421,939 (26,024,376) -
Dividend payment - employees - - - - - (1,456,190) - (1,456,190)
Dividend payment - shareholder - - - - - (19,518,282) - (19,518,282)
Adjustments (Note 16) - - 21,430,280 - - (21,430,280) - -
Realisation of revaluation reserves - - (5,174,177) - - 5,174,177 - -
Realisation of deferred tax - - 568,919 - - (568,919) - - on revaluations
Net profit for 2005 - - - - - - 23,787,526 23,787,526
31 December 2005 150,000,000 (4,064) 118,164,897 23,213,483 22,171,377 8,572,938 23,787,526 345,906,158
Appropriation of 2005 results - - - 2,378,753 - 21,408,774 (23,787,526) -
Dividend payment - employees - - - - - (976,407) - (976,407)
Dividend payment - shareholder - - - - - (17,840,645) - (17,840,645)
Realisation of revaluation reserves (Note 16) - - (4,968,456) - - 4,968,456 - -
Realisation of deferred tax - - 546,530 - (546,530) - - on revaluations (Note 16)
Change in the rate of deferred tax - - 362,428 - - - - 362,428 on revaluations (Notes 8 and 16)
Net profit for 2006 - - - - - - 16,328,528 16,328,528
31December 2006 150,000,000 (4,064) 114,105,399 25,592,236 22,171,377 15,586,586 16,328,528 343,780,062
All amounts are stated in eurosThe notes appended to the accounts are an integral part of the financial statements
The Financial Manager and Chief Accountant
Daniela Marina Alves Fernandes Valle Santos
Board of Directors
João Manuel Lopes Fidalgo, Chairmain
Jorge Luís Ferrão de Mascarenhas Loureiro, Director
José Alfredo Manita Vaz, Director
António Bento Franco, Director
Rui Manuel de Carvalho Godinho, Director
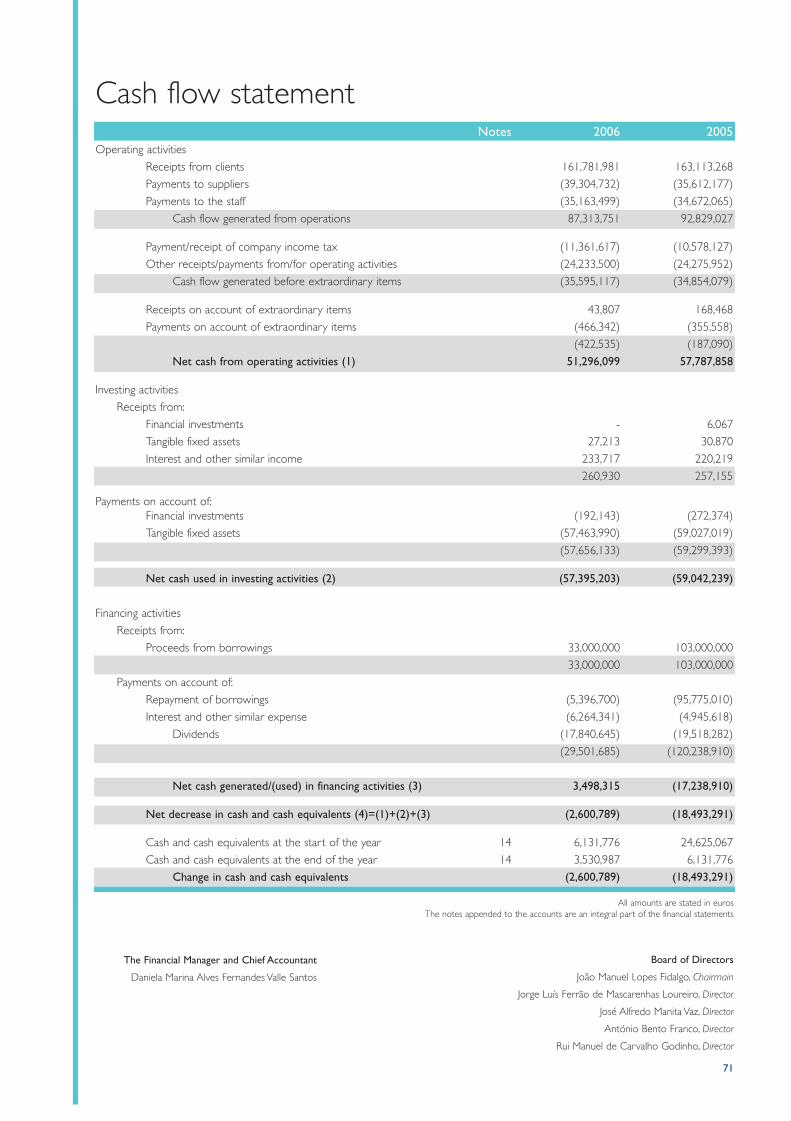
71
Cash flow statement
All amounts are stated in eurosThe notes appended to the accounts are an integral part of the financial statements
The Financial Manager and Chief Accountant
Daniela Marina Alves Fernandes Valle Santos
Board of Directors
João Manuel Lopes Fidalgo, Chairmain
Jorge Luís Ferrão de Mascarenhas Loureiro, Director
José Alfredo Manita Vaz, Director
António Bento Franco, Director
Rui Manuel de Carvalho Godinho, Director
Notes 2006 2005Operating activities
Receipts from clients 161,781,981 163,113,268
Payments to suppliers (39,304,732) (35,612,177)
Payments to the staff (35,163,499) (34,672,065)
Cash flow generated from operations 87,313,751 92,829,027
Payment/receipt of company income tax (11,361,617) (10,578,127)
Other receipts/payments from/for operating activities (24,233,500) (24,275,952)
Cash flow generated before extraordinary items (35,595,117) (34,854,079)
Receipts on account of extraordinary items 43,807 168,468
Payments on account of extraordinary items (466,342) (355,558)
(422,535) (187,090)
Net cash from operating activities (1) 51,296,099 57,787,858
Investing activities
Receipts from:
Financial investments - 6,067
Tangible fixed assets 27,213 30,870
Interest and other similar income 233,717 220,219
260,930 257,155
Payments on account of:Financial investments (192,143) (272,374)
Tangible fixed assets (57,463,990) (59,027,019)
(57,656,133) (59,299,393)
Net cash used in investing activities (2) (57,395,203) (59,042,239)
Financing activities
Receipts from:
Proceeds from borrowings 33,000,000 103,000,000
33,000,000 103,000,000
Payments on account of:
Repayment of borrowings (5,396,700) (95,775,010)
Interest and other similar expense (6,264,341) (4,945,618)
Dividends (17,840,645) (19,518,282)
(29,501,685) (120,238,910)
Net cash generated/(used) in financing activities (3) 3,498,315 (17,238,910)
Net decrease in cash and cash equivalents (4)=(1)+(2)+(3) (2,600,789) (18,493,291)
Cash and cash equivalents at the start of the year 14 6,131,776 24,625,067
Cash and cash equivalents at the end of the year 14 3,530,987 6,131,776
Change in cash and cash equivalents (2,600,789) (18,493,291)
EPAL Annual report 2006
Toutinegra-de-barrete - Sylvia atricapilla
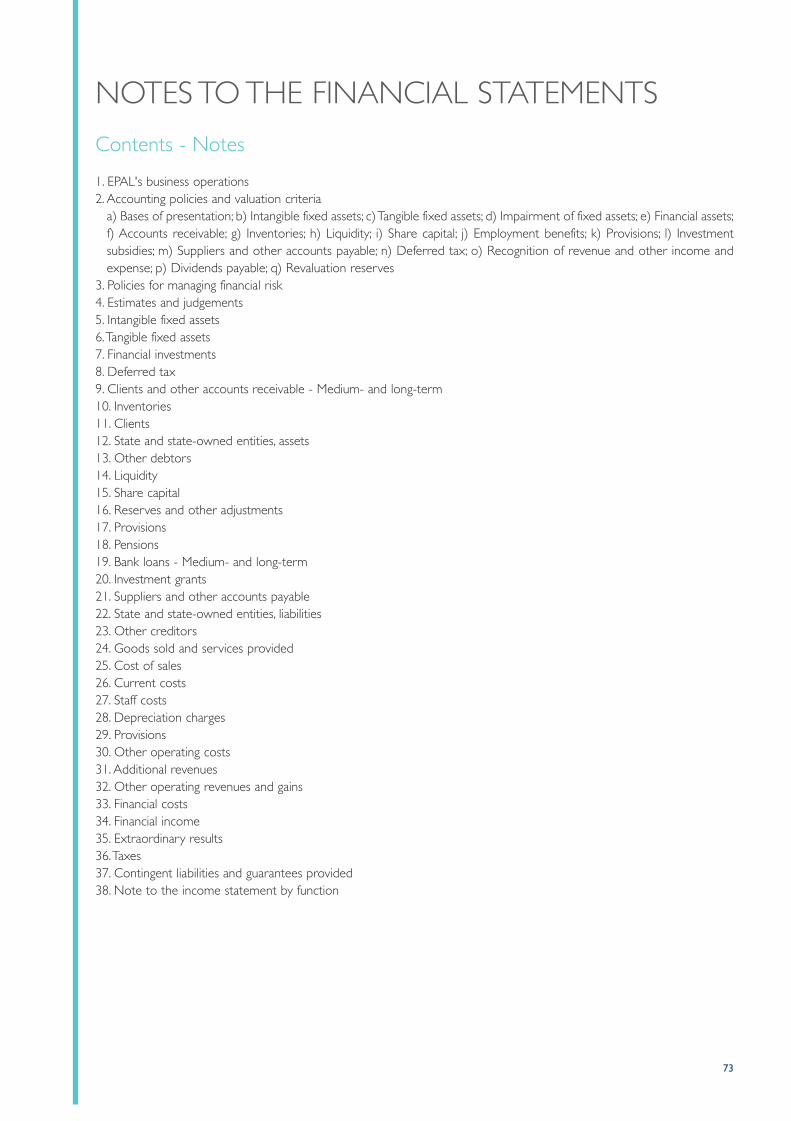
73
NOTES TO THE FINANCIAL STATEMENTS
Contents - Notes
1. EPAL's business operations2. Accounting policies and valuation criteria
a) Bases of presentation; b) Intangible fixed assets; c) Tangible fixed assets; d) Impairment of fixed assets; e) Financial assets;f) Accounts receivable; g) Inventories; h) Liquidity; i) Share capital; j) Employment benefits; k) Provisions; l) Investment subsidies; m) Suppliers and other accounts payable; n) Deferred tax; o) Recognition of revenue and other income andexpense; p) Dividends payable; q) Revaluation reserves
3. Policies for managing financial risk4. Estimates and judgements5. Intangible fixed assets6.Tangible fixed assets7. Financial investments8. Deferred tax9. Clients and other accounts receivable - Medium- and long-term10. Inventories11. Clients12. State and state-owned entities, assets13. Other debtors14. Liquidity15. Share capital16. Reserves and other adjustments17. Provisions18. Pensions19. Bank loans - Medium- and long-term20. Investment grants21. Suppliers and other accounts payable22. State and state-owned entities, liabilities23. Other creditors24. Goods sold and services provided25. Cost of sales26. Current costs27. Staff costs28. Depreciation charges29. Provisions30. Other operating costs31. Additional revenues32. Other operating revenues and gains33. Financial costs34. Financial income35. Extraordinary results36.Taxes 37. Contingent liabilities and guarantees provided38. Note to the income statement by function


75
Notes to the financial statements
1. EPAL's business operations
1.1 Introduction
EPAL is a limited liability company whose shares are entirely owned by public bodies and its full name is EPAL - EmpresaPortuguesa das Águas Livres, S.A. (“EPAL” or the “Company”).
The object of the company is to abstract, treat, transport and distribute water for public consumption as well as to undertake any complementary or related industrial, commercial or research activities or provision of services, namely thoserelated to the water cycle.
1.2 Business operations
EPAL abstracts, transports, treats and distributes water for human consumption and aims to provide a quality servicerespecting essential social and environmental concerns. Its supply services cover retail distribution in the city of Lisbon andthe bulk delivery of water to 23 municipalities in the Greater Lisbon area.
EPAL's water pricing regime is regulated by a government decree (Decreto-Lei nº 230/91 of 21 June 1991) that providesfor an agreement to be reached between EPAL and the Portuguese state as represented by the Ministry of Economy'sDirecção Geral da Empresa.
1.3 Approval of the financial statements
The reported financial statements have been approved in a meeting of the board of directors on 15 March 2007. Theboard's opinion is that they reflect in a reliable way EPAL's operations, financial position and performance and cash flows.
2. Accounting policies and valuation criteria
a) Bases of presentation
EPAL's financial statements for 2006 consisting of the balance sheet, income statement - by nature and by function - cashflow statement, statement of changes in equity and respective notes, have been prepared on a going concern assumption,on the basis of the company's books and accounting records, kept in accordance with accounting principles that are generally accepted in Portugal except for a waiver on Accounting Guideline nº 19 following the company's adoption in previous years of the “corridor” method as set out in IAS 19 for recording the obligations arising from its post-employmentbenefit plan (Note 2j).
The company's balance sheet at 31 December 2006 and the income statement by nature for the financial year ended onthat date are presented in a format that is different from the one provided in the official accounting plan (Plano Oficial deContabilidade), with the notes presented in sequential order for the balance sheet and the income statement. Despite thisdifference, the accounts and notes contain, together with the statement of changes in equity, the information required bythe Plano Oficial de Contabilidade; likewise, the total asset and equity amounts at 31 December 2006 and the net resultfor the year ended on that date are equal to those resulting from the presentation of the balance sheet and the incomestatement by nature according to the format required by the Plano Oficial de Contabilidade.These are also attached in thesection “Documents required by the Plano Oficial de Contabilidade”.
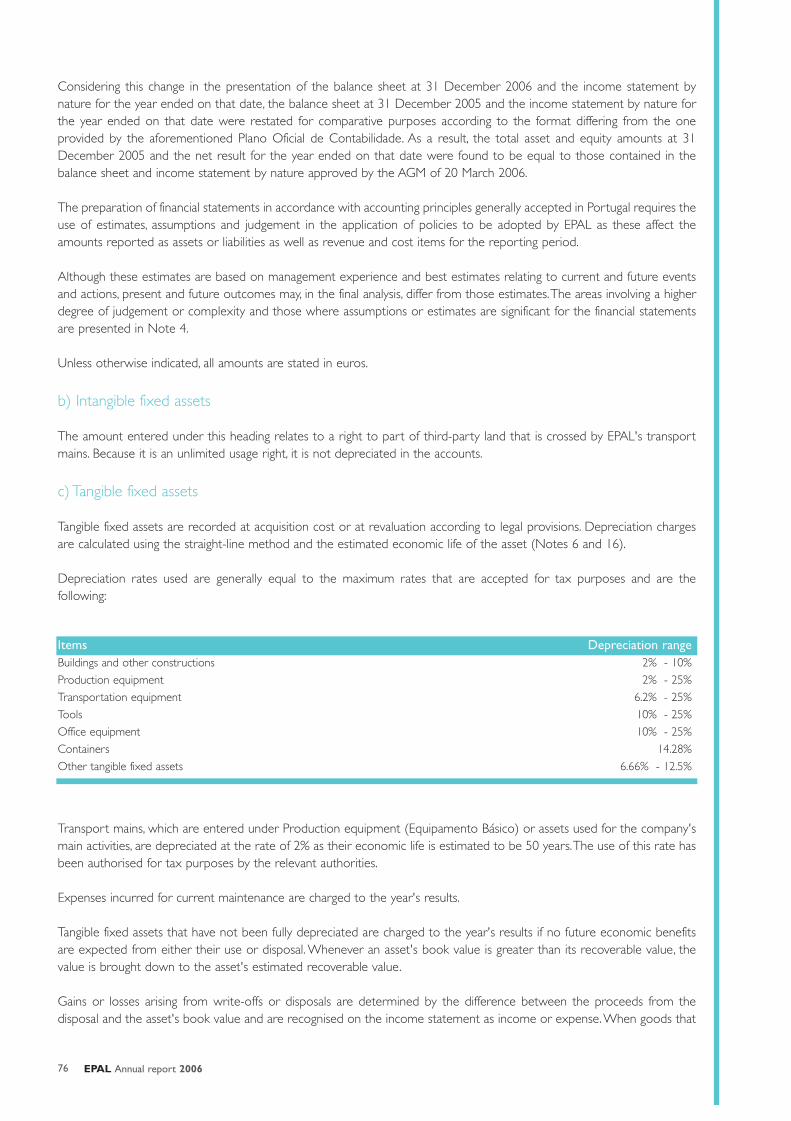
EPAL Annual report 200676
Considering this change in the presentation of the balance sheet at 31 December 2006 and the income statement bynature for the year ended on that date, the balance sheet at 31 December 2005 and the income statement by nature forthe year ended on that date were restated for comparative purposes according to the format differing from the one provided by the aforementioned Plano Oficial de Contabilidade. As a result, the total asset and equity amounts at 31December 2005 and the net result for the year ended on that date were found to be equal to those contained in the balance sheet and income statement by nature approved by the AGM of 20 March 2006.
The preparation of financial statements in accordance with accounting principles generally accepted in Portugal requires theuse of estimates, assumptions and judgement in the application of policies to be adopted by EPAL as these affect theamounts reported as assets or liabilities as well as revenue and cost items for the reporting period.
Although these estimates are based on management experience and best estimates relating to current and future eventsand actions, present and future outcomes may, in the final analysis, differ from those estimates.The areas involving a higherdegree of judgement or complexity and those where assumptions or estimates are significant for the financial statementsare presented in Note 4.
Unless otherwise indicated, all amounts are stated in euros.
b) Intangible fixed assets
The amount entered under this heading relates to a right to part of third-party land that is crossed by EPAL's transportmains. Because it is an unlimited usage right, it is not depreciated in the accounts.
c) Tangible fixed assets
Tangible fixed assets are recorded at acquisition cost or at revaluation according to legal provisions. Depreciation chargesare calculated using the straight-line method and the estimated economic life of the asset (Notes 6 and 16).
Depreciation rates used are generally equal to the maximum rates that are accepted for tax purposes and are the following:
Items Depreciation rangeBuildings and other constructions 2% - 10%
Production equipment 2% - 25%
Transportation equipment 6.2% - 25%
Tools 10% - 25%
Office equipment 10% - 25%
Containers 14.28%
Other tangible fixed assets 6.66% - 12.5%
Transport mains, which are entered under Production equipment (Equipamento Básico) or assets used for the company'smain activities, are depreciated at the rate of 2% as their economic life is estimated to be 50 years.The use of this rate hasbeen authorised for tax purposes by the relevant authorities.
Expenses incurred for current maintenance are charged to the year's results.
Tangible fixed assets that have not been fully depreciated are charged to the year's results if no future economic benefitsare expected from either their use or disposal. Whenever an asset's book value is greater than its recoverable value, thevalue is brought down to the asset's estimated recoverable value.
Gains or losses arising from write-offs or disposals are determined by the difference between the proceeds from the disposal and the asset's book value and are recognised on the income statement as income or expense.When goods that

77
have been revalued are sold, the amount entered in the revaluation reserve account (Reserva de Reavaliações) is transferred to the retained earnings account (Resultados Transitados).
d) Impairment of fixed assets
Assets under depreciation are tested for impairment whenever any events or changes in circumstances suggest that theamount at which they are carried on the financial statements may not be recoverable.
An impairment loss is recognised for the excess of the carrying amount of an asset over its recoverable amount. The recoverable amount is the higher of an asset's fair value less selling costs and its value in use. If it is not possible to determine the recoverable amount for a particular asset, it should be aggregated with other assets for the joint generationof independent cash flows and, thus, the set-up of a cash-generating unit (CGU).
An impairment loss is recognised through income statement in the year the circumstances arise for its record. Annually, itis added or reversed, in total or in part, whenever the circumstances having given rise to its initial record shall change orcease to exist.
e) Financial assets
Group companies and associates
Investments in equity holdings in group companies or associates are recorded at cost and valued according to the equitymethod. According to this method, gains and losses obtained by these companies are recorded, for the proportional stakeheld, as financial results.
Other investments
Other financial investments in securities or other placements are valued at cost after deduction of any adjustments for estimated losses on their disposal.
f) Accounts receivable
Third-party debts are recognised at nominal value except when their receipt has been deferred beyond one year, in whichcase they are recognised for the present value of their future cash flows.
Adjustments to doubtful debts are calculated on the basis of a specific economic evaluation of the total or partial lossesthat are estimated from the failure to collect receivables from clients or other debtors after considering the existence ofcollateral or any other form of security (Note 11).
g) Inventory
Inventory for EPAL's productive process includes primarily (i) reagents such as liquid chlorine, aluminium sulphate, carbon dioxideand other products used for water treatment and (ii) hydraulic equipment for civil construction.
Inventories are valued at the lower of acquisition cost (including all expenses until inventories are stored) and net realisable value(NRV). NRV is determined as the estimated selling price in the company's normal course of business, after deduction of any variable selling expenses.When NRV is lower than the carrying amount, a write-down is made for the difference.
Inventories sold are valued at average cost.
h) Liquidity
Liquidity includes cash and cash equivalents, bank deposits, other highly liquid, short-term investments maturing in up to oneyear and overdraft facilities. Overdraft facilities are presented on the balance sheet under current liabilities, “Debts to credit institutions - Short term”, and are also considered in the preparation of the cash flow statement.
EPAL Annual report 200678
Marketable securities are valued at the lower of acquisition cost and market value.
i) Share capital
Ordinary shares are classed under shareholders' equity.
j) Employee benefits - Pensions
A defined benefit plan is a pension plan that defines the benefit amount in respect of the complement to the pension theemployee will receive at retirement, usually depending on one or more factors such as age, length of service and remuneration.
The company has in force a system of social benefits for its employees (defined benefits) involving the payment of complements to retirement pensions (for long service or disability) while additionally sustaining the obligations arising fromearly retirement.
The obligations arising from the benefit plan in force are calculated annually by independent actuaries using the ProjectedUnit Credit Method.The present value of obligations is determined by discounting future benefit payments using the yieldon high-quality corporate bonds denominated in the currency in which the benefits will be paid, with a term to maturityclose to the term of the actual obligations.
The costs incurred by these obligations are recognised in accordance with IAS 19 (Note 18).
k) Provisions
Provisions are only recognised when there is a present obligation resulting from past events for whose settlement anoutflow of internal resources is probable and whose amount can be estimated reliably. Whenever one of these criteria is not met or the obligation's existence is subject to the occurrence (or non-occurrence) of a future event,EPAL will disclose such fact as a contingent liability, except when the possibility of an outflow of resources for settle-ment of the obligation is considered to be remote.
When there are a large number of similar obligations, the probability for an outflow of internal resources to occur isdetermined in combination.The provision is recognised even though the probability of outflow of internal resourcesin respect of a particular item in the class may be reduced.
Provisions are not recognised for future operating losses.
l) Investment grants
Investment grants are recognised when there is reasonable assurance that the grant will be received and EPAL will complywith the conditions attached to its receipt.
Investment grants for the acquisition of tangible fixed assets are recorded as non-current liabilities and are credited to theincome statement using the straight-line method for the expected remaining life of the related assets.
Other grants are deferred and recognised in the income statement in the same period as the expenses they are designedto offset.
m) Suppliers and other accounts payable
Suppliers and other accounts payable are carried at nominal value to the extent they are payable in the short term.

79
n) Deferred tax
Deferred taxes are recognised using the balance sheet liability method whereby such temporary differences are consideredthat arise from the difference between the tax base of assets and liabilities and their carrying amounts.
Deferred taxes are not recognised that arise from the initial recognition of an asset or liability other than in a business combination which, at the time of the transaction, does not affect either the accounting or the taxable profit.
Deferred taxes arising from temporary differences following from the application of the equity method are recognised onlywhen it is probable that the reversal will occur in the foreseeable future.
Deferred tax assets are recognised to the extent that it is probable that taxable profit will be available against which thedeductible temporary difference can be utilised or when the reversal of a deferred tax asset is expected for the same timeand the same authority.
Deferred taxes are measured at the tax rates that have been enacted or substantively enacted by the balance sheet dateand that are expected to apply when the deferred tax is reversed.The differences that may arise from expected changesin the rates at which the temporary taxable differences will be reversed are considered in the income statement.The annual entries in deferred tax assets or liabilities are made against the same accounts where the transactions or eventsthat originated them have been recorded. The revaluation reserve amount in shareholders' equity is carried net of the related deferred tax liability (Note 16).
Deferred tax assets and liabilities are not offset against each other.
o) Recognition of revenue and other income and expense
Revenue consists of the fair value of the sale of goods and provision of services, net of taxes and discounts, and is recognised as follows:
Water sales and service fee
The sale of water and service fee is supported by contracts signed with the clients whereby the price is clearly defined bymeans of a duly approved price grid.
During the year, revenue arising from the sale of water is recognised on the basis of metered consumption or, when consumption has not been metered, estimated consumption. At the end of the year, according to the matching principle,accrued income is recognised for the consumption estimated but not metered or invoiced.At the end of each financial year,the amount recorded as water sales relates to actual consumption in the year as measured by the quantities metered and,in the cases this is not feasible, reliable consumption estimates (Note 11).
Interest expense
Interest payable on obtained loans is recognised as a cost for the year in which interest payments fall due, even when thepurpose of the loans is to fund the acquisition of fixed assets (Note 23).
Other income and expense
Other income and expense is recorded in the year when it has been generated or incurred, regardless of the moment forits receipt or payment, in accordance with the matching principle.The differences between received or paid amounts andthe related income or expense are recorded as accruals or deferrals.
p) Dividend payable
Dividend payable is recognised in the year when the payment has been approved by the shareholder meeting.
EPAL Annual report 200680
q) Revaluation reserves
The amounts entered in the “Revaluation reserves” account are initially recorded for the net asset increase resulting fromrevaluations performed in accordance with the law (Note 6) and annually transferred to the “Retained earnings” accountas the assets are realised through sale, write-off or amortisation.
3. Policies for managing financial risk
Financial risk factors
EPAL's operations are exposed to a variety of financial risk factors: liquidity risk and cash flow risk linked to interest rates.
Liquidity risk
Management of liquidity risk requires readily available funds to be kept at a reasonable level, the consolidated fluctuatingdebt to be supported by an adequate amount of credit facilities and market positions to be closed selectively. EPAL aimsto ensure flexibility of the fluctuating debt and to maintain, to that end, available credit lines. EPAL manages liquidity risk bysecuring from financial institutions committed credit lines and funding facilities that provide immediate access to funds underflexible terms.
Cash flow risk and fair value risk linked to interest rates
As EPAL does not earn significant income on its assets, profit and operating cash flows are substantively independent fromchanges in market interest rates.
EPAL's interest rate risk arises primarily from its long-term borrowings. In this context, loans obtained at floating interestrates expose EPAL to cash flow risk while loans obtained at fixed interest rates expose EPAL to fair value risk linked tointerest rates. EPAL's policy is to keep a balance between fixed-rate and floating-rate loans.
4. Estimates and judgements
Estimates and judgements with an impact on EPAL's financial statements are continually evaluated and represent, at eachreporting date, management's best estimate considering historic performance, accumulated experience and expectationsabout future events which, under the circumstances, are believed to be reasonable.The very nature of estimates may lead to actual outcomes that may differ, for financial reporting purposes, from the estimated amounts.The estimates and judgements presenting a significant risk of material adjustments to the carrying amount of assets and liabilities in the ensuing financial year are the following:
Provisions
EPAL reviews periodically obligations arising from past events that should be the subject of recognition or disclosure.
The subjectivity that is inherent to determining the probability and amount of the outflow of internal resources requiredfor the settlement of obligations may lead to significant adjustments either because the assumptions have changed orbecause previously disclosed contingent liabilities will be recognised in the future as provisions.
Impairment of assets
At the date for presentation of EPAL's financial statements for the year ended on 31 December 2006, the existence of anysituation of impairment of reported assets is not considered as probable.
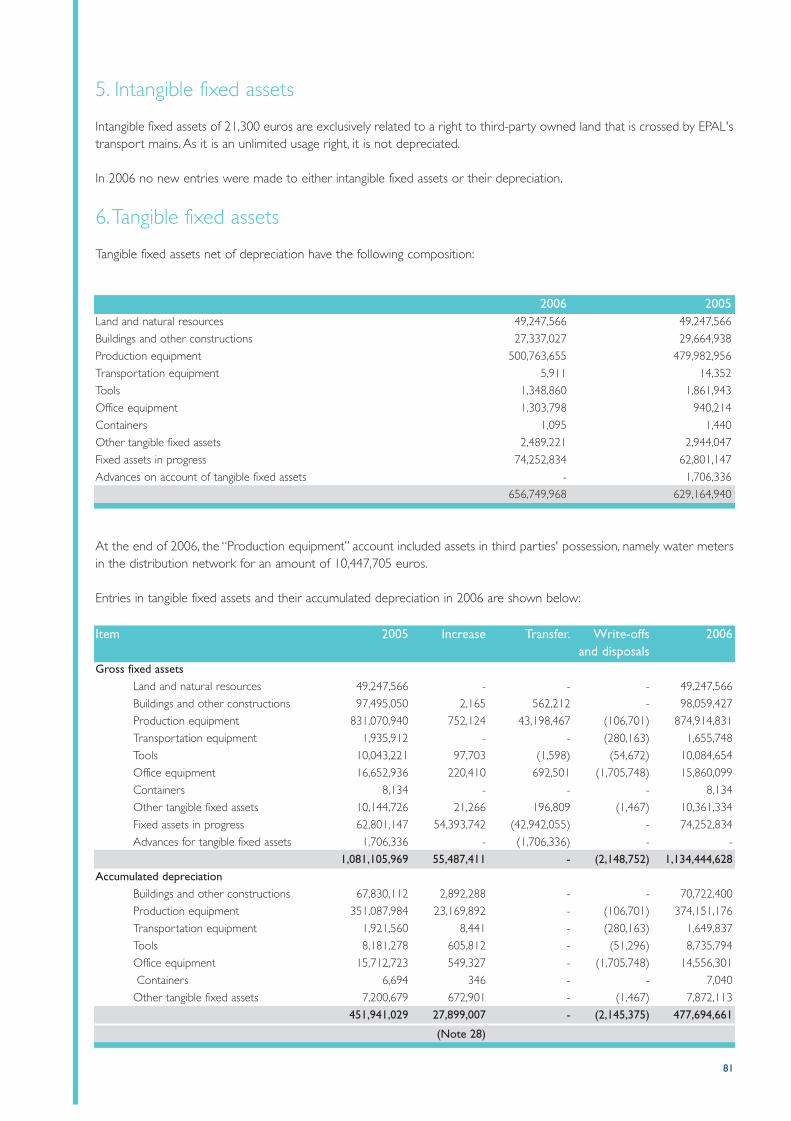
81
5. Intangible fixed assets
Intangible fixed assets of 21,300 euros are exclusively related to a right to third-party owned land that is crossed by EPAL'stransport mains. As it is an unlimited usage right, it is not depreciated.
In 2006 no new entries were made to either intangible fixed assets or their depreciation.
6.Tangible fixed assets
Tangible fixed assets net of depreciation have the following composition:
2006 2005 Land and natural resources 49,247,566 49,247,566
Buildings and other constructions 27,337,027 29,664,938
Production equipment 500,763,655 479,982,956
Transportation equipment 5,911 14,352
Tools 1,348,860 1,861,943
Office equipment 1,303,798 940,214
Containers 1,095 1,440
Other tangible fixed assets 2,489,221 2,944,047
Fixed assets in progress 74,252,834 62,801,147
Advances on account of tangible fixed assets - 1,706,336
656,749,968 629,164,940
At the end of 2006, the “Production equipment” account included assets in third parties' possession, namely water metersin the distribution network for an amount of 10,447,705 euros.
Entries in tangible fixed assets and their accumulated depreciation in 2006 are shown below:
Item 2005 Increase Transfer. Write-offs 2006 and disposals
Gross fixed assetsLand and natural resources 49,247,566 - - - 49,247,566
Buildings and other constructions 97,495,050 2,165 562,212 - 98,059,427
Production equipment 831,070,940 752,124 43,198,467 (106,701) 874,914,831
Transportation equipment 1,935,912 - - (280,163) 1,655,748
Tools 10,043,221 97,703 (1,598) (54,672) 10,084,654
Office equipment 16,652,936 220,410 692,501 (1,705,748) 15,860,099
Containers 8,134 - - - 8,134
Other tangible fixed assets 10,144,726 21,266 196,809 (1,467) 10,361,334
Fixed assets in progress 62,801,147 54,393,742 (42,942,055) - 74,252,834
Advances for tangible fixed assets 1,706,336 - (1,706,336) - -
1,081,105,969 55,487,411 - (2,148,752) 1,134,444,628 Accumulated depreciation
Buildings and other constructions 67,830,112 2,892,288 - - 70,722,400
Production equipment 351,087,984 23,169,892 - (106,701) 374,151,176
Transportation equipment 1,921,560 8,441 - (280,163) 1,649,837
Tools 8,181,278 605,812 - (51,296) 8,735,794
Office equipment 15,712,723 549,327 - (1,705,748) 14,556,301
Containers 6,694 346 - - 7,040
Other tangible fixed assets 7,200,679 672,901 - (1,467) 7,872,113
451,941,029 27,899,007 - (2,145,375) 477,694,661
(Note 28)

EPAL Annual report 200682
Historic Revaluations Revalued Costs a) a) b) (Note 16) amounts a)
Tangible fixed assetsLand and natural resources 12,575,508 33,102,726 45,678,234
Buildings and other constructions 8,125,151 5,120,391 13,245,542
Production equipment 112,631,543 85,485,678 198,117,221
Other tangible fixed assets 5,255 949 6,204
133,337,457 123,709,743 257,047,200
a) Net of depreciation
b) Include past revaluations
2006 2005 Equity holdings in group companies 250,000 265,025
Equity holdings in other investees 5,013,150 4,831,007
Securities and other financial investments 109,172 109,172
Adjustments to financial investments (5,003,174) (4,821,031)
369,148 384,173
New investments in tangible fixed assets in the year amounted to 57.2 million euros consisting of the “Increases” columntotal (55.5 million euros) and the 1.7 million euros resulting from the conversion into new investment of the amounts paidin advance for tangible fixed assets in the preceding year. The most significant investments in 2006 were the network'srenewal and the works for expansion of the Castelo do Bode system.The “Production equipment” account includes primarily the distribution network, transport mains, reservoirs, water andelectricity facilities, hydraulic works and meters.
The works related to the expansion of the Castelo do Bode system represent the bulk of the amount under “Fixed assetsin progress”.
Revaluations
Tangible fixed assets have been revalued in previous years pursuant to the following pieces of legislation:
Decreto-Lei n.º 430/78, as amended by Decreto-Lei n.º 24/82 of 30 January 1982
Decreto-Lei n.º 219/82 of 2 June 1982
Decreto-Lei n.º 399-G/84 of 28 December 1984
Decreto-Lei n.º 118-B/86 of 27 May 1986
Decreto-Lei n.º 111/88 of 2 April 1988
Decreto-Lei n.º 49/91 of 25 January 1991
Decreto-Lei n.º 264/92 of 24 November 1992
Decreto-Lei n.º 31/98 of 11 February 1998
Historic acquisition costs for tangible fixed assets and related revaluations at 31 December 2006 net of accumulated depre-ciation are detailed below:
7. Financial investments
Financial investments at 31 December 2006 and 2005 were as follows:
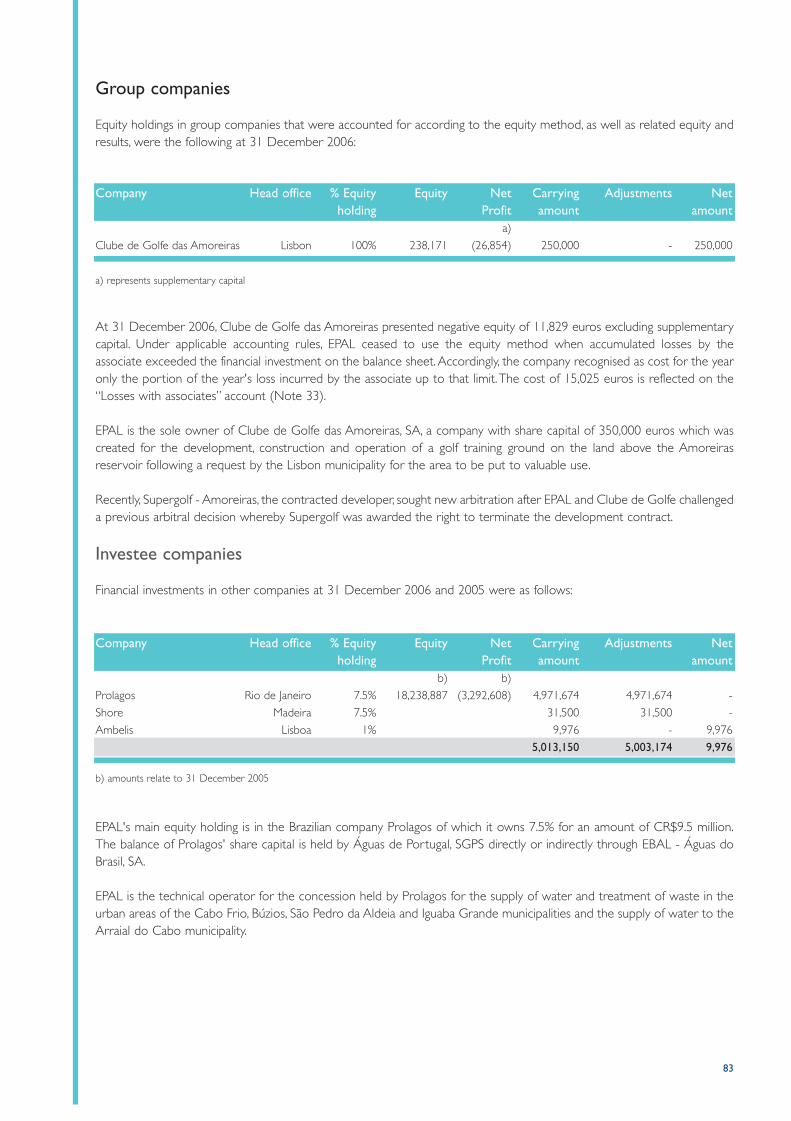
83
Group companies
Equity holdings in group companies that were accounted for according to the equity method, as well as related equity andresults, were the following at 31 December 2006:
At 31 December 2006, Clube de Golfe das Amoreiras presented negative equity of 11,829 euros excluding supplementarycapital. Under applicable accounting rules, EPAL ceased to use the equity method when accumulated losses by the associate exceeded the financial investment on the balance sheet.Accordingly, the company recognised as cost for the yearonly the portion of the year's loss incurred by the associate up to that limit.The cost of 15,025 euros is reflected on the“Losses with associates” account (Note 33).
EPAL is the sole owner of Clube de Golfe das Amoreiras, SA, a company with share capital of 350,000 euros which wascreated for the development, construction and operation of a golf training ground on the land above the Amoreiras reservoir following a request by the Lisbon municipality for the area to be put to valuable use.
Recently, Supergolf - Amoreiras, the contracted developer, sought new arbitration after EPAL and Clube de Golfe challengeda previous arbitral decision whereby Supergolf was awarded the right to terminate the development contract.
Investee companies
Financial investments in other companies at 31 December 2006 and 2005 were as follows:
Company Head office % Equity Equity Net Carrying Adjustments Netholding Profit amount amount
a)
Clube de Golfe das Amoreiras Lisbon 100% 238,171 (26,854) 250,000 - 250,000
a) represents supplementary capital
EPAL's main equity holding is in the Brazilian company Prolagos of which it owns 7.5% for an amount of CR$9.5 million.The balance of Prolagos' share capital is held by Águas de Portugal, SGPS directly or indirectly through EBAL - Águas doBrasil, SA.
EPAL is the technical operator for the concession held by Prolagos for the supply of water and treatment of waste in theurban areas of the Cabo Frio, Búzios, São Pedro da Aldeia and Iguaba Grande municipalities and the supply of water to theArraial do Cabo municipality.
Company Head office % Equity Equity Net Carrying Adjustments Netholding Profit amount amount
b) b)
Prolagos Rio de Janeiro 7.5% 18,238,887 (3,292,608) 4,971,674 4,971,674 -
Shore Madeira 7.5% 31,500 31,500 -
Ambelis Lisboa 1% 9,976 - 9,976
5,013,150 5,003,174 9,976
b) amounts relate to 31 December 2005
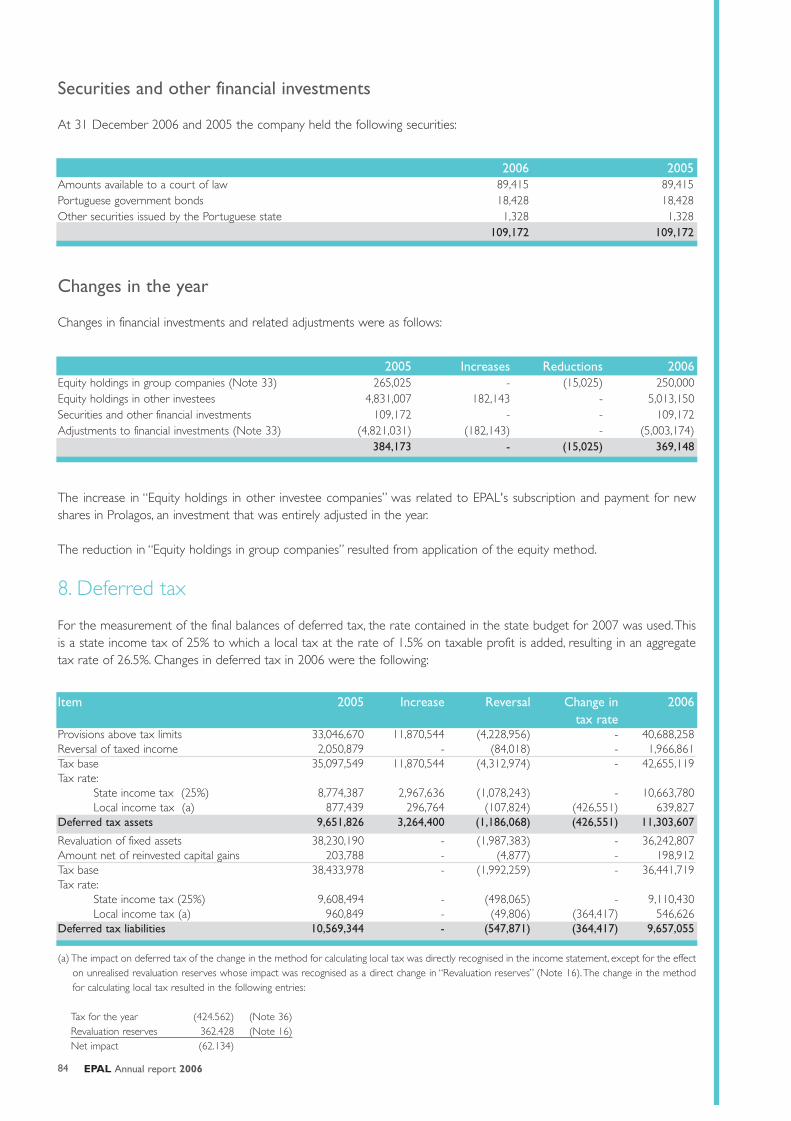
EPAL Annual report 200684
Item 2005 Increase Reversal Change in 2006tax rate
Provisions above tax limits 33,046,670 11,870,544 (4,228,956) - 40,688,258 Reversal of taxed income 2,050,879 - (84,018) - 1,966,861 Tax base 35,097,549 11,870,544 (4,312,974) - 42,655,119 Tax rate:
State income tax (25%) 8,774,387 2,967,636 (1,078,243) - 10,663,780 Local income tax (a) 877,439 296,764 (107,824) (426,551) 639,827
Deferred tax assets 9,651,826 3,264,400 (1,186,068) (426,551) 11,303,607
Revaluation of fixed assets 38,230,190 - (1,987,383) - 36,242,807 Amount net of reinvested capital gains 203,788 - (4,877) - 198,912 Tax base 38,433,978 - (1,992,259) - 36,441,719 Tax rate:
State income tax (25%) 9,608,494 - (498,065) - 9,110,430 Local income tax (a) 960,849 - (49,806) (364,417) 546,626
Deferred tax liabilities 10,569,344 - (547,871) (364,417) 9,657,055
(a) The impact on deferred tax of the change in the method for calculating local tax was directly recognised in the income statement, except for the effecton unrealised revaluation reserves whose impact was recognised as a direct change in “Revaluation reserves” (Note 16).The change in the methodfor calculating local tax resulted in the following entries:
Tax for the year (424.562) (Note 36)Revaluation reserves 362.428 (Note 16)Net impact (62.134)
Securities and other financial investments
At 31 December 2006 and 2005 the company held the following securities:
Changes in the year
Changes in financial investments and related adjustments were as follows:
2006 2005 Amounts available to a court of law 89,415 89,415 Portuguese government bonds 18,428 18,428 Other securities issued by the Portuguese state 1,328 1,328
109,172 109,172
2005 Increases Reductions 2006 Equity holdings in group companies (Note 33) 265,025 - (15,025) 250,000 Equity holdings in other investees 4,831,007 182,143 - 5,013,150 Securities and other financial investments 109,172 - - 109,172 Adjustments to financial investments (Note 33) (4,821,031) (182,143) - (5,003,174)
384,173 - (15,025) 369,148
The increase in “Equity holdings in other investee companies” was related to EPAL's subscription and payment for newshares in Prolagos, an investment that was entirely adjusted in the year.
The reduction in “Equity holdings in group companies” resulted from application of the equity method.
8. Deferred tax
For the measurement of the final balances of deferred tax, the rate contained in the state budget for 2007 was used.Thisis a state income tax of 25% to which a local tax at the rate of 1.5% on taxable profit is added, resulting in an aggregatetax rate of 26.5%. Changes in deferred tax in 2006 were the following:
85
9. Clients and other accounts receivable - non-current
The balances of this account at 31 December 2006 and 2005, for 710,979 and 738,324 euros, respectively, relate entirelyto “Other debtors”, namely a debt receivable and timely serviced in accordance with an annual instalment schedule withfinal maturity in 27 years.The debt is carried at its present value.
10. Inventories
At the end of 2006 and 2005, the balances of this account were 1,190,293 and 1,248,442 euros, respectively, and consisted exclusively of intermediate and consumption raw materials.
11. Clients
The composition of the “Clients” account at 31 December 2006 and 2005 was as follows:
Changes in the year
Changes in the balances for doubtful debtors and related adjustments in 2006 were the following:
2006 2005 Clients, current account 22,449,544 20,671,180
Clients, doubtful debtors 2,741,795 2,312,232
Adjustments for doubtful debtors (2,076,701) (1,760,123)
Subtotal, clients 23,114,637 21,223,289 Accrued income on account of water to be invoiced 7,373,361 7,528,920
Accrued income on service fee to be invoiced 1,941,492 1,886,239
Accrued income on services provided, to be invoiced 107,796 119,571
32,537,286 30,758,019
2005 Increases Decreases 2006 Doubtful debtors 2,312,232 517,386 (87,823) 2,741,795
Adjustments to doubtful debtors (1,760,123) (387,341) 70,763 (2,076,701)(Notes 28 and 32)
552,109 130,045 (17,060) 665,094
Increases in the balances of and adjustments to Doubtful debtors follow from the evaluation of collection risk to clientreceivables.
Decreases result primarily from the recovery of previously provided claims.
The balance of Doubtful debtors amounts to 2,741,795 euros and is composed of 2,076,701 euros where collection riskis borne by the company and entirely provided for and 665,094 euros relating to treatment fee and addition where therisk is borne by third parties.
EPAL Annual report 200686
14. Cash and cash equivalents
At 31 December 2006 and 2005 “Cash and cash equivalents had the following composition:
2006 2005 Associates 1,333,246 1,323,246
Staff 60,148 64,729
Other debtors, miscellaneous 1,059,636 1,551,222
Adjustments to other doubtful debtors (634,907) (614,395)
Subtotal 1,818,123 2,324,801 Other accrued income 35,070 18,502
Deferred cost for prepaid insurance premiums 901,093 767,599
Other deferred costs 415,855 499,185
3,170,141 3,610,087
2006 2005 Opening balance 614,395 585,981
Increase / Period charges (Note 28) 31,383 32,851
Reversal (Note 32) (10,871) (4,436)
Ending balance 634,907 614,395
2006 2005 Bank deposits 26,050 35,568
Cash on hand 3,504,937 2,696,208
Subtotal 3,530,987 2,731,776 Other treasury investments - 3,400,000
3,530,987 6,131,776
12. Claims on public-sector entities
At 31 December 2006 and 2005, claims receivable from the state and other public-sector entities for 5,601,240 and6,077,056 euros, respectively, related entirely to requests for value-added tax (VAT) refunds.
13. Other debtors
At 31 December 2006 and 2005 “Other debtors” had the following composition:
Associates
The amount recorded under “Group companies and associates” is exclusively related to shareholder loans extended toClube de Golfe das Amoreiras, S.A.
Changes in “Adjustments to other doubtful debtors”
Changes in the year were as follows:

87
15. Share capital
Share capital of 150 million euros consists of 30 million shares of 5 euros each and is fully paid up.
Shareholders
At 31 December 2006, the company was entirely owned by AdP - Águas de Portugal, SGPS, S.A..
Earnings per share
16. Reserves and other adjustments
At the end of the year, reserves and other adjustments were as follows:
2006 2005 Net profit for the year 16,328,528 23,787,526
Average number of shares 30,000,000 30,000,000
(Basic and diluted) earnings per share 0.54 0.79
2006 2005 Adjustments to equity holdings in associates (4,064) (4,064)
Revaluation reserves 114,105,399 118,164,897
Legal reserves 25,592,236 23,213,483
Free reserves 22,171,377 22,171,377
161,864,948 163,545,694
Note:View together with the statement of changes in equity
The change in “Revaluation reserves” in 2006 was as follows:
2005 Transfers Other 2006 Revaluation reserves
Revaluation reserves, booked 256,514,383 - - 256,514,383
Revaluation reserves, realised (127,836,183) (4,968,456) - (132,804,640)
(Note 6) 128,678,200 (4,968,456) - 123,709,743
Related deferred tax
Deferred tax, booked (21,042,483) - - (21,042,483)
Deferred tax, realised 10,529,180 546,530 362,428 11,438,139
(Note 8) (10,513,302) 546,530 362,428 (9,604,344)
Net amount of revaluation reserves 118,164,897 (4,421,926) 362,428 114,105,399
Transfers: Amounts in the “Transfers” column relate to the transfer to “Retained earnings” of the portion of revaluationreserves realised through amortisation, disposal or write-off of the related fixed assets and deferred taxes in 2006.
Legal reserve: Commercial law stipulates that at least 5% of net profit for the year - EPAL's articles of association raise thislevel to 10% - should be allocated to increasing legal reserves until these represent at least 20% of share capital. Thesereserves may not be distributed unless the company is liquidated but may be used to cover losses after the other reserveshave been used or to issue a stock dividend.
EPAL Annual report 200688
2006 2005 Litigation in progress 7,377,774 7,152,891
Workplace accidents 230,357 275,865
Other risks and charges 11,388,746 11,300,746
18,996,877 18,729,502
2005 Increases Reductions 2006(Note 29)
Litigation in progress 7,152,891 768,385 (543,501) 7,377,774
Workplace accidents 275,865 - (45,508) 230,357
Other risks and charges 11,300,746 200,500 (112,500) 11,388,746
18,729,502 968,885 (701,509) 18,996,877
Transferência:Para reservas legais 2,378,753
Para resultados transitados 2,591,721
4,970,474Distribuição:De dividendos à holding 17,840,645
De lucros ao pessoal 976,407
18,817,052
23,787,526
Appropriation of net profit: Pursuant to a resolution at the shareholder meeting of 20 March 2006, the company appropriated net profit of 23,787,526 for the year ended 31 December 2005 as follows:
Additional explanatory note to the Statement of changes in equity: In the year ended 31 December 2005 an accountingadjustment was made for 21,430,279.58 as a result of the analysis conducted on the amount of unrealised revaluationreserves at 1 January 2005. After this adjustment and the annual transfer of the revaluation reserves realised during 2005,the amount of 118,164,897 euros represented the amount of unrealised revaluation reserves, net of deferred taxes, at 31 December 2005.
17. Provisions
At 31 December 2006 and 2005 the composition of provisions was the following:
Changes in “Provisions” in 2006 are broken down as follows:
The company conducted a careful and thorough review of the situation regarding commitments, present, probable or contingent obligations, lawsuits, unsettled tax cases and complaints or contentious issues. On the basis of this review andafter a careful risk analysis, the company considered that the 18,996,877 euros in “Provisions” at 31 December 2006 is anadequate amount to provide against the identified risks.
The “Reductions” column total of 701,509 euros includes 656,001 euros recorded as extraordinary income (Note 35) and45,508 euros recorded as staff costs.
18. Pension obligations
EPAL has a social benefit plan for its employees entailing a commitment to pay a complement to the retirement pension (for longservice or disability) granted by the Social Security.Additionally, the company bears the obligations arising from early retirement.

89
The obligations in the above table were calculated on the basis of the following actuarial and financial assumptions:
Obligations deriving from the pension plan are funded by EPAL's pension fund, set up in November 1990, while early retirement is borne directly by the company.
The company's overall obligations are covered by the pension fund's assets and a specific provision recorded as a liability.
At 31 December 2006 and 2005 the obligations for past service linked to the social benefit plan were the following:
Change in obligations 2006 2005 Obligations at start of period 95,475,448 89,752,258
Current-service cost 2,262,000 2,003,446
Interest cost 4,394,000 4,510,919
Actuarial (gains)/losses (909,708) 5,099,030
Benefits paid (5,757,036) (5,890,206)
Obligations at end of period 95,464,704 95,475,448
2006 2005 Mortality table TV 88/90 TV 88/90
Disability table EVK 80 EVK 80
Annual discount rate 4.75% 4.75%
Annual rate of return 4.75% 4.75%
Salary growth rate 2,50% 2,50%
Salary growth rate, Social Security 2,50% 2,50%
Growth rate of pre-retirement contributions 2,50% 2,50%
The fund's assets progressed as follows:
Pension fund 2006 2005 Amount at start of period 41,383,875 36,676,983
Effective return 2,576,422 2,866,892
EPAL contribution 3,726,602 3,559,717
Benefits paid (1,726,602) (1,719,717)
Amount at end of period 45,960,297 41,383,875
2006 2005 Obligations at end of period 95,464,704 95,475,448
Asset value at end of period 45,960,297 41,383,875
Provision for pensions 25,775,964 18,484,000
Deferred actuarial losses 23,728,443 35,607,573
Prior service cost 2,650,036 11,887,000
Losses within the 10% corridor 9,546,470 9,547,545
Losses in excess of the 10% corridor 11,531,937 14,173,028
As a complement to the fund's assets, the company recognised at 31 December 2006, as a liability, a provision for pensionobligations for an amount of 25.8 million euros.
The overall situation is summed up in the following table:
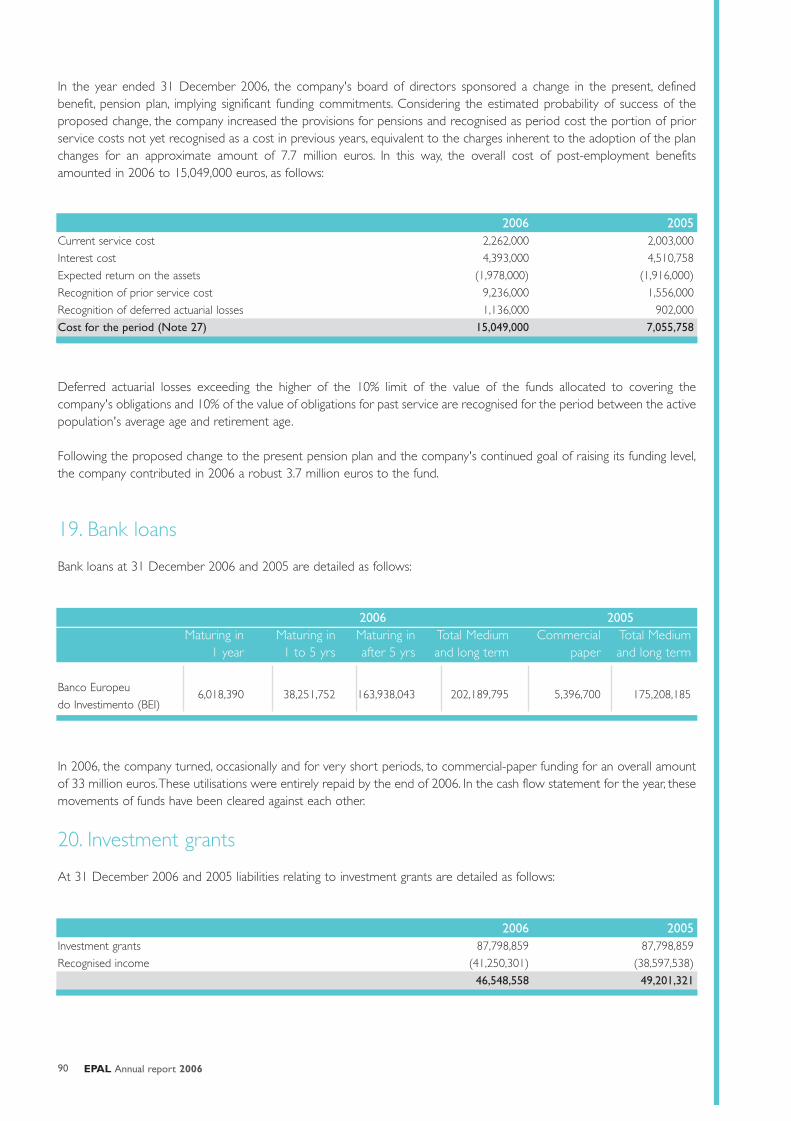
EPAL Annual report 200690
In 2006, the company turned, occasionally and for very short periods, to commercial-paper funding for an overall amountof 33 million euros.These utilisations were entirely repaid by the end of 2006. In the cash flow statement for the year, thesemovements of funds have been cleared against each other.
20. Investment grants
At 31 December 2006 and 2005 liabilities relating to investment grants are detailed as follows:
2006 2005 Current service cost 2,262,000 2,003,000
Interest cost 4,393,000 4,510,758
Expected return on the assets (1,978,000) (1,916,000)
Recognition of prior service cost 9,236,000 1,556,000
Recognition of deferred actuarial losses 1,136,000 902,000
Cost for the period (Note 27) 15,049,000 7,055,758
2006 2005 Maturing in Maturing in Maturing in Total Medium Commercial Total Medium
1 year 1 to 5 yrs after 5 yrs and long term paper and long term
Banco Europeu6,018,390 38,251,752 163,938,043 202,189,795 5,396,700 175,208,185
do Investimento (BEI)
In the year ended 31 December 2006, the company's board of directors sponsored a change in the present, defined benefit, pension plan, implying significant funding commitments. Considering the estimated probability of success of the proposed change, the company increased the provisions for pensions and recognised as period cost the portion of priorservice costs not yet recognised as a cost in previous years, equivalent to the charges inherent to the adoption of the planchanges for an approximate amount of 7.7 million euros. In this way, the overall cost of post-employment benefits amounted in 2006 to 15,049,000 euros, as follows:
Deferred actuarial losses exceeding the higher of the 10% limit of the value of the funds allocated to covering the company's obligations and 10% of the value of obligations for past service are recognised for the period between the activepopulation's average age and retirement age.
Following the proposed change to the present pension plan and the company's continued goal of raising its funding level,the company contributed in 2006 a robust 3.7 million euros to the fund.
19. Bank loans
Bank loans at 31 December 2006 and 2005 are detailed as follows:
2006 2005 Investment grants 87,798,859 87,798,859
Recognised income (41,250,301) (38,597,538)
46,548,558 49,201,321
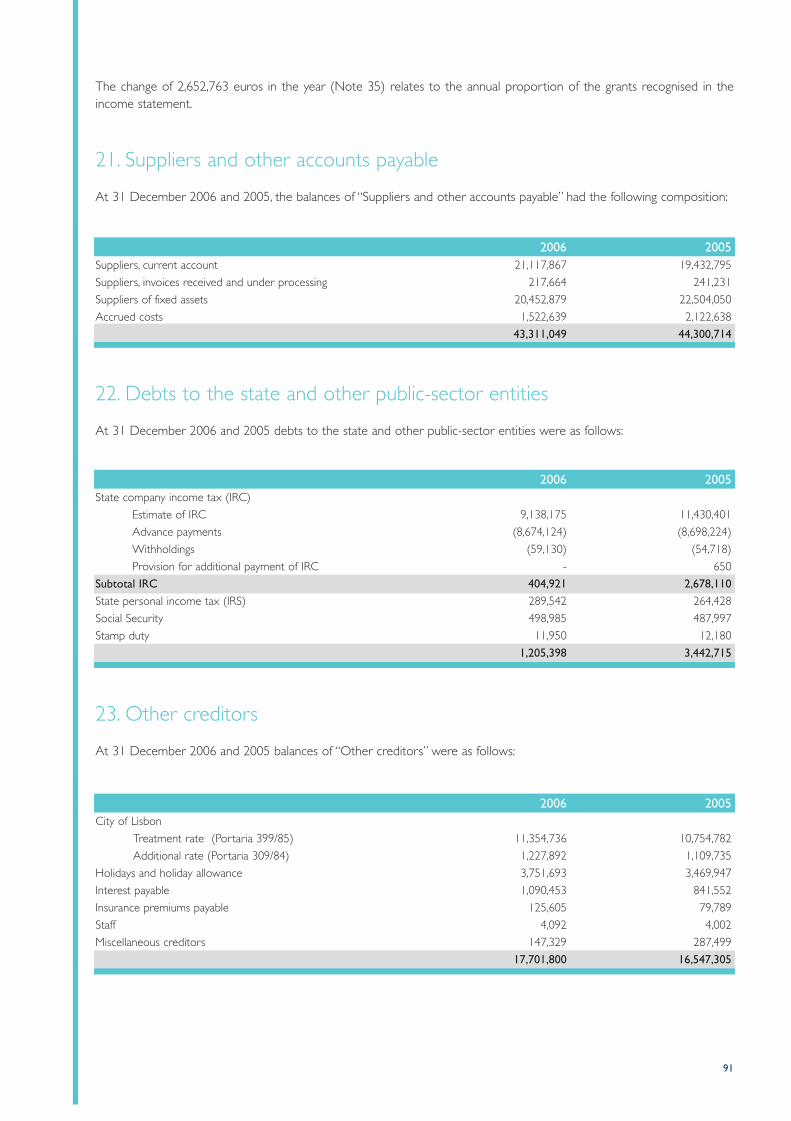
91
The change of 2,652,763 euros in the year (Note 35) relates to the annual proportion of the grants recognised in theincome statement.
21. Suppliers and other accounts payable
At 31 December 2006 and 2005, the balances of “Suppliers and other accounts payable” had the following composition:
22. Debts to the state and other public-sector entities
At 31 December 2006 and 2005 debts to the state and other public-sector entities were as follows:
2006 2005 Suppliers, current account 21,117,867 19,432,795
Suppliers, invoices received and under processing 217,664 241,231
Suppliers of fixed assets 20,452,879 22,504,050
Accrued costs 1,522,639 2,122,638
43,311,049 44,300,714
2006 2005 State company income tax (IRC)
Estimate of IRC 9,138,175 11,430,401
Advance payments (8,674,124) (8,698,224)
Withholdings (59,130) (54,718)
Provision for additional payment of IRC - 650
Subtotal IRC 404,921 2,678,110 State personal income tax (IRS) 289,542 264,428
Social Security 498,985 487,997
Stamp duty 11,950 12,180
1,205,398 3,442,715
2006 2005 City of Lisbon
Treatment rate (Portaria 399/85) 11,354,736 10,754,782
Additional rate (Portaria 309/84) 1,227,892 1,109,735
Holidays and holiday allowance 3,751,693 3,469,947
Interest payable 1,090,453 841,552
Insurance premiums payable 125,605 79,789
Staff 4,092 4,002
Miscellaneous creditors 147,329 287,499
17,701,800 16,547,305
23. Other creditors
At 31 December 2006 and 2005 balances of “Other creditors” were as follows:
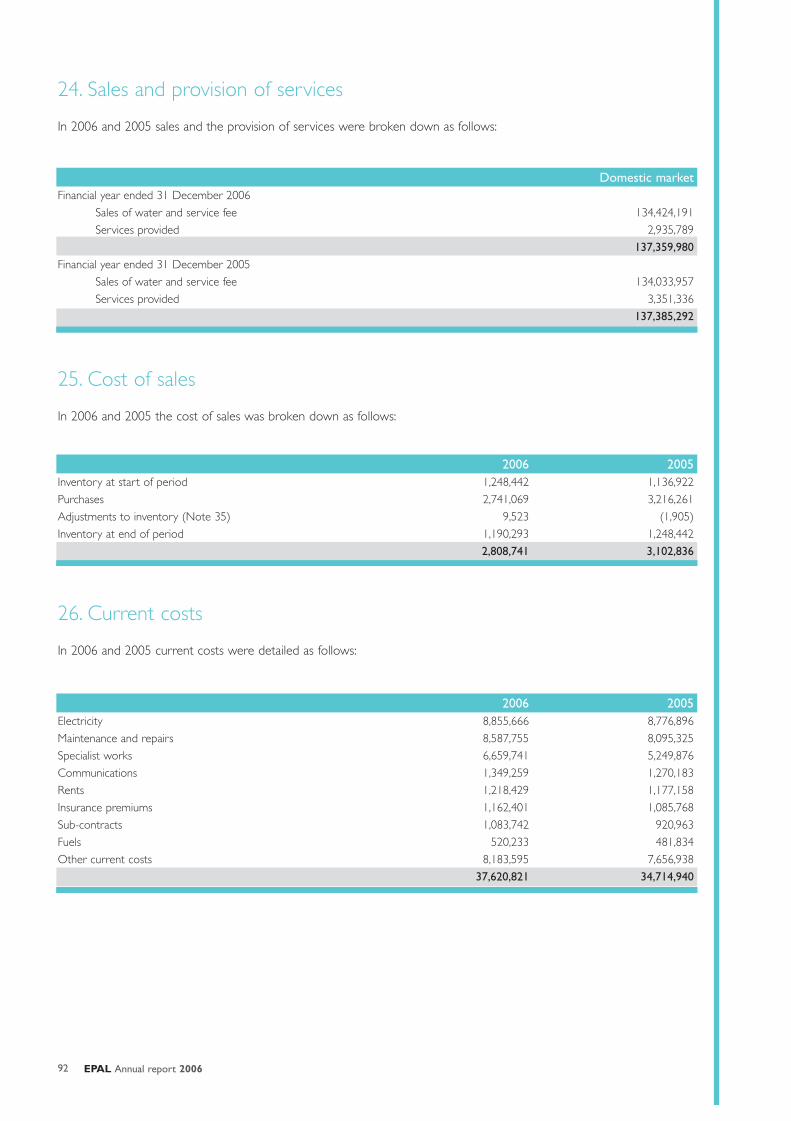
EPAL Annual report 200692
26. Current costs
In 2006 and 2005 current costs were detailed as follows:
2006 2005 Inventory at start of period 1,248,442 1,136,922
Purchases 2,741,069 3,216,261
Adjustments to inventory (Note 35) 9,523 (1,905)
Inventory at end of period 1,190,293 1,248,442
2,808,741 3,102,836
Domestic marketFinancial year ended 31 December 2006
Sales of water and service fee 134,424,191
Services provided 2,935,789
137,359,980 Financial year ended 31 December 2005
Sales of water and service fee 134,033,957
Services provided 3,351,336
137,385,292
24. Sales and provision of services
In 2006 and 2005 sales and the provision of services were broken down as follows:
25. Cost of sales
In 2006 and 2005 the cost of sales was broken down as follows:
2006 2005 Electricity 8,855,666 8,776,896
Maintenance and repairs 8,587,755 8,095,325
Specialist works 6,659,741 5,249,876
Communications 1,349,259 1,270,183
Rents 1,218,429 1,177,158
Insurance premiums 1,162,401 1,085,768
Sub-contracts 1,083,742 920,963
Fuels 520,233 481,834
Other current costs 8,183,595 7,656,938
37,620,821 34,714,940
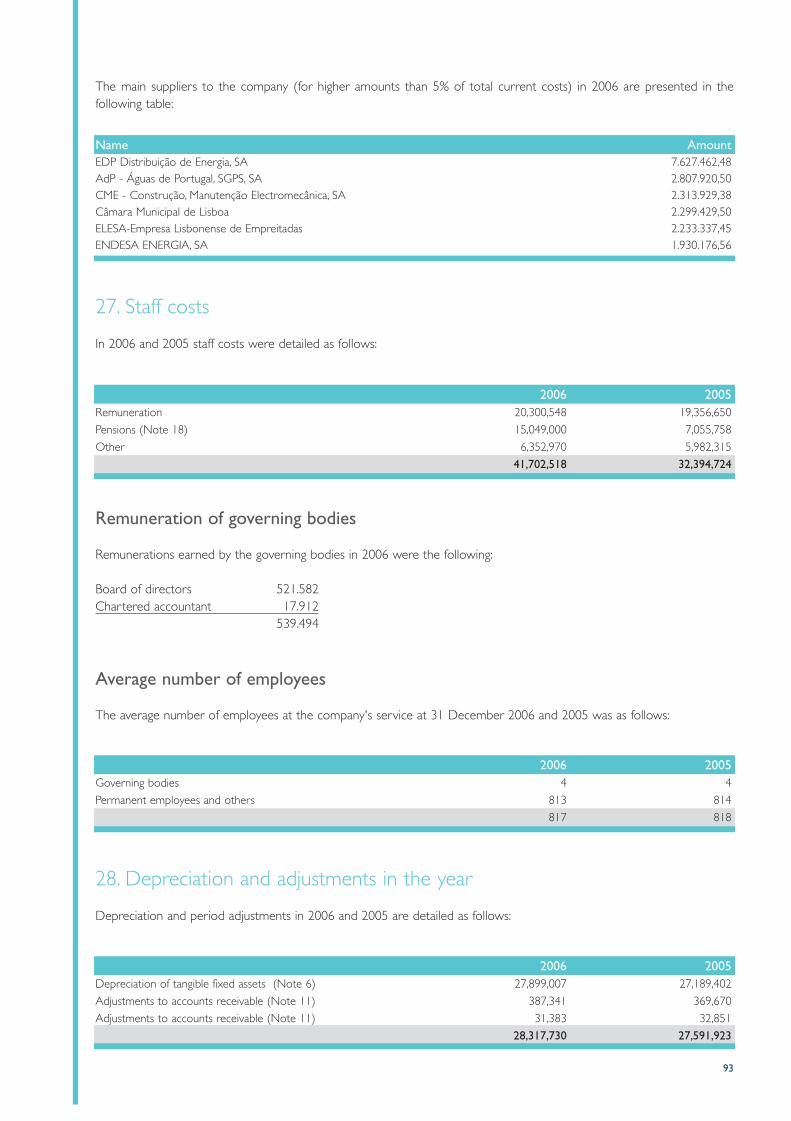
93
The main suppliers to the company (for higher amounts than 5% of total current costs) in 2006 are presented in the following table:
27. Staff costs
In 2006 and 2005 staff costs were detailed as follows:
Name AmountEDP Distribuição de Energia, SA 7.627.462,48AdP - Águas de Portugal, SGPS, SA 2.807.920,50CME - Construção, Manutenção Electromecânica, SA 2.313.929,38Câmara Municipal de Lisboa 2.299.429,50ELESA-Empresa Lisbonense de Empreitadas 2.233.337,45ENDESA ENERGIA, SA 1.930.176,56
2006 2005 Remuneration 20,300,548 19,356,650
Pensions (Note 18) 15,049,000 7,055,758
Other 6,352,970 5,982,315
41,702,518 32,394,724
Remuneration of governing bodies
Remunerations earned by the governing bodies in 2006 were the following:
Board of directors 521.582Chartered accountant 17.912
539.494
2006 2005 Governing bodies 4 4
Permanent employees and others 813 814
817 818
2006 2005 Depreciation of tangible fixed assets (Note 6) 27,899,007 27,189,402
Adjustments to accounts receivable (Note 11) 387,341 369,670
Adjustments to accounts receivable (Note 11) 31,383 32,851
28,317,730 27,591,923
Average number of employees
The average number of employees at the company's service at 31 December 2006 and 2005 was as follows:
28. Depreciation and adjustments in the year
Depreciation and period adjustments in 2006 and 2005 are detailed as follows:
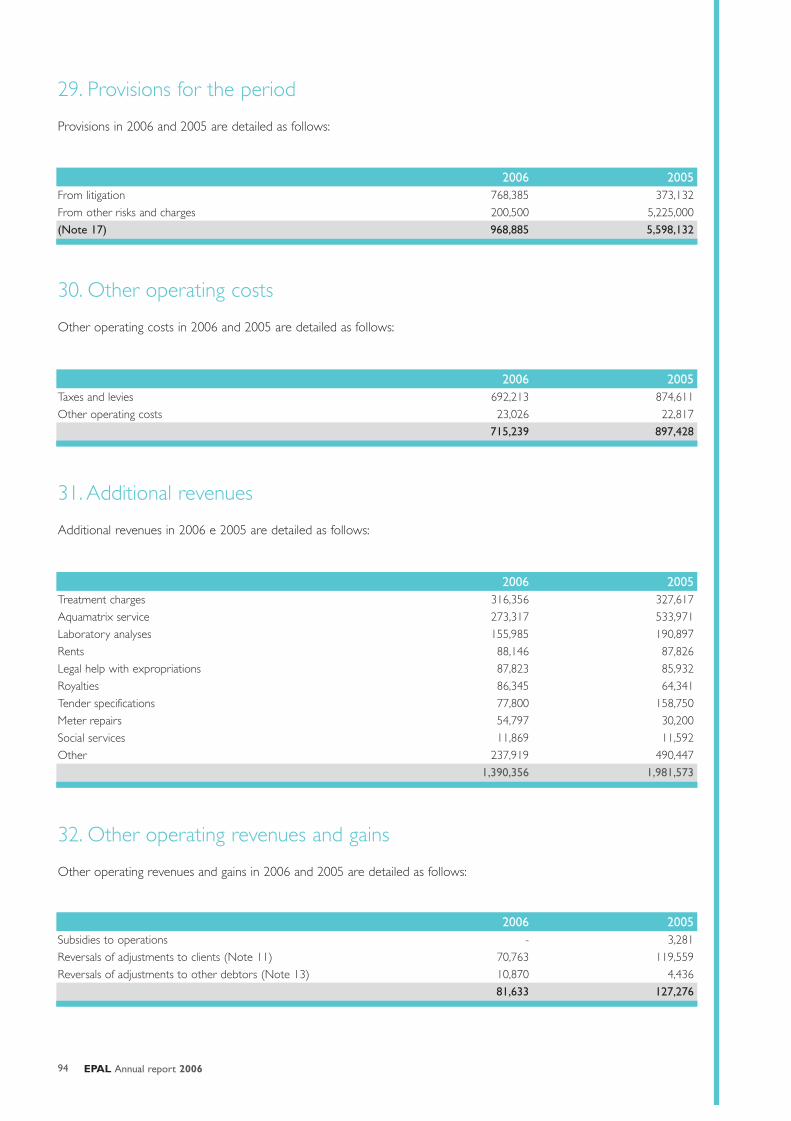
EPAL Annual report 200694
30. Other operating costs
Other operating costs in 2006 and 2005 are detailed as follows:
2006 2005 From litigation 768,385 373,132
From other risks and charges 200,500 5,225,000
(Note 17) 968,885 5,598,132
2006 2005 Taxes and levies 692,213 874,611
Other operating costs 23,026 22,817
715,239 897,428
31. Additional revenues
Additional revenues in 2006 e 2005 are detailed as follows:
32. Other operating revenues and gains
Other operating revenues and gains in 2006 and 2005 are detailed as follows:
29. Provisions for the period
Provisions in 2006 and 2005 are detailed as follows:
2006 2005 Treatment charges 316,356 327,617
Aquamatrix service 273,317 533,971
Laboratory analyses 155,985 190,897
Rents 88,146 87,826
Legal help with expropriations 87,823 85,932
Royalties 86,345 64,341
Tender specifications 77,800 158,750
Meter repairs 54,797 30,200
Social services 11,869 11,592
Other 237,919 490,447
1,390,356 1,981,573
2006 2005 Subsidies to operations - 3,281
Reversals of adjustments to clients (Note 11) 70,763 119,559
Reversals of adjustments to other debtors (Note 13) 10,870 4,436
81,633 127,276
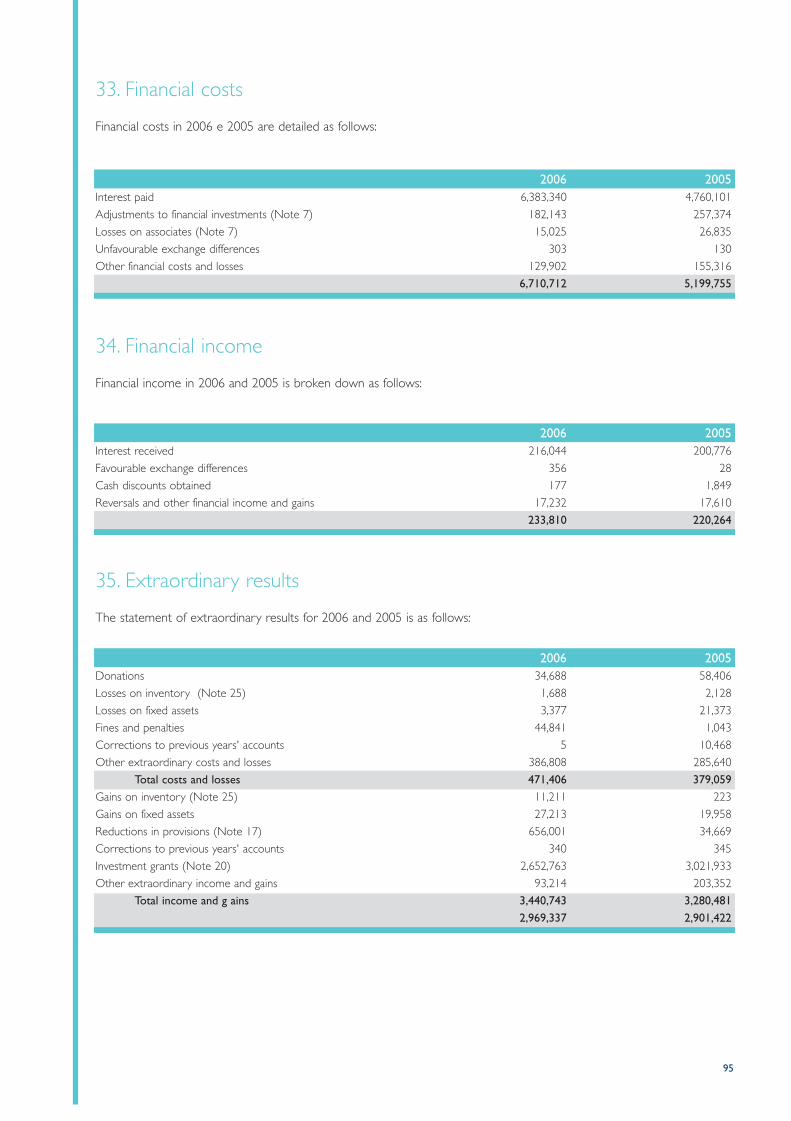
95
33. Financial costs
Financial costs in 2006 e 2005 are detailed as follows:
2006 2005 Interest paid 6,383,340 4,760,101
Adjustments to financial investments (Note 7) 182,143 257,374
Losses on associates (Note 7) 15,025 26,835
Unfavourable exchange differences 303 130
Other financial costs and losses 129,902 155,316
6,710,712 5,199,755
2006 2005 Donations 34,688 58,406
Losses on inventory (Note 25) 1,688 2,128
Losses on fixed assets 3,377 21,373
Fines and penalties 44,841 1,043
Corrections to previous years' accounts 5 10,468
Other extraordinary costs and losses 386,808 285,640
Total costs and losses 471,406 379,059 Gains on inventory (Note 25) 11,211 223
Gains on fixed assets 27,213 19,958
Reductions in provisions (Note 17) 656,001 34,669
Corrections to previous years' accounts 340 345
Investment grants (Note 20) 2,652,763 3,021,933
Other extraordinary income and gains 93,214 203,352
Total income and g ains 3,440,743 3,280,481 2,969,337 2,901,422
34. Financial income
Financial income in 2006 and 2005 is broken down as follows:
35. Extraordinary results
The statement of extraordinary results for 2006 and 2005 is as follows:
2006 2005 Interest received 216,044 200,776
Favourable exchange differences 356 28
Cash discounts obtained 177 1,849
Reversals and other financial income and gains 17,232 17,610
233,810 220,264
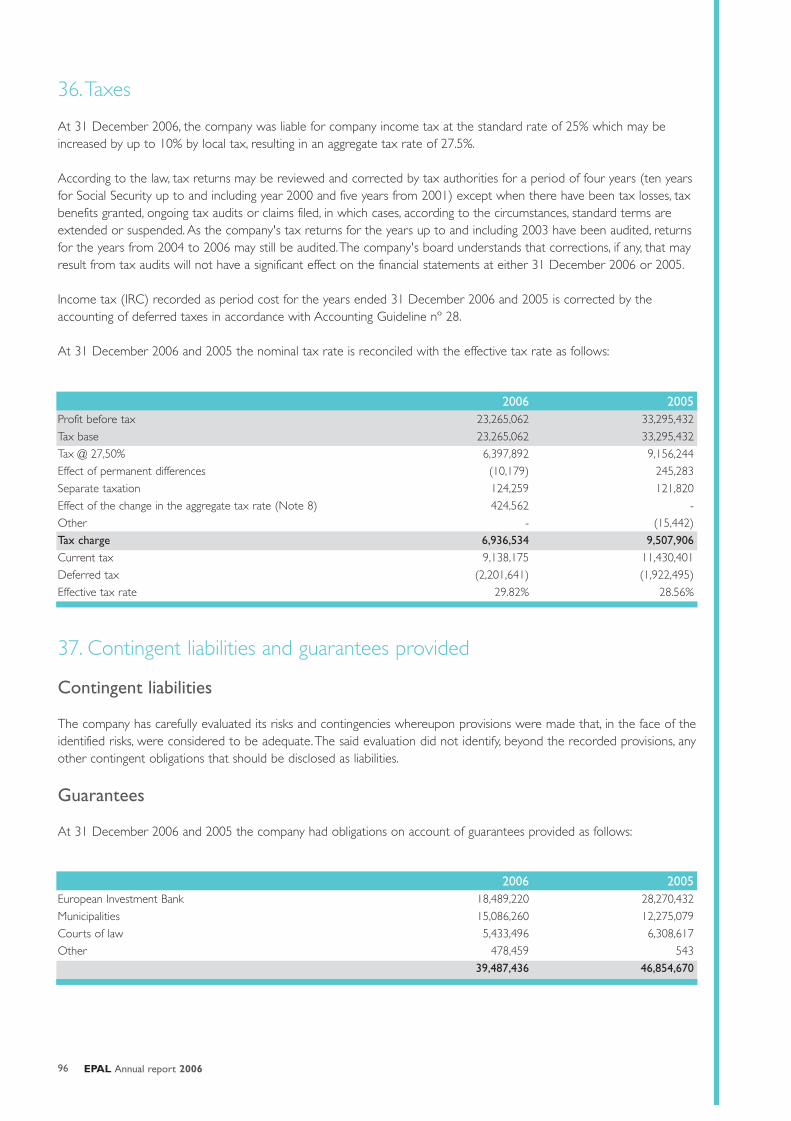
EPAL Annual report 200696
37. Contingent liabilities and guarantees provided
Contingent liabilities
The company has carefully evaluated its risks and contingencies whereupon provisions were made that, in the face of theidentified risks, were considered to be adequate.The said evaluation did not identify, beyond the recorded provisions, anyother contingent obligations that should be disclosed as liabilities.
Guarantees
At 31 December 2006 and 2005 the company had obligations on account of guarantees provided as follows:
2006 2005 Profit before tax 23,265,062 33,295,432
Tax base 23,265,062 33,295,432
Tax @ 27,50% 6,397,892 9,156,244
Effect of permanent differences (10,179) 245,283
Separate taxation 124,259 121,820
Effect of the change in the aggregate tax rate (Note 8) 424,562 -
Other - (15,442)
Tax charge 6,936,534 9,507,906 Current tax 9,138,175 11,430,401
Deferred tax (2,201,641) (1,922,495)
Effective tax rate 29.82% 28.56%
36.Taxes
At 31 December 2006, the company was liable for company income tax at the standard rate of 25% which may beincreased by up to 10% by local tax, resulting in an aggregate tax rate of 27.5%.
According to the law, tax returns may be reviewed and corrected by tax authorities for a period of four years (ten yearsfor Social Security up to and including year 2000 and five years from 2001) except when there have been tax losses, taxbenefits granted, ongoing tax audits or claims filed, in which cases, according to the circumstances, standard terms areextended or suspended. As the company's tax returns for the years up to and including 2003 have been audited, returnsfor the years from 2004 to 2006 may still be audited.The company's board understands that corrections, if any, that mayresult from tax audits will not have a significant effect on the financial statements at either 31 December 2006 or 2005.
Income tax (IRC) recorded as period cost for the years ended 31 December 2006 and 2005 is corrected by theaccounting of deferred taxes in accordance with Accounting Guideline nº 28.
At 31 December 2006 and 2005 the nominal tax rate is reconciled with the effective tax rate as follows:
2006 2005 European Investment Bank 18,489,220 28,270,432
Municipalities 15,086,260 12,275,079
Courts of law 5,433,496 6,308,617
Other 478,459 543
39,487,436 46,854,670
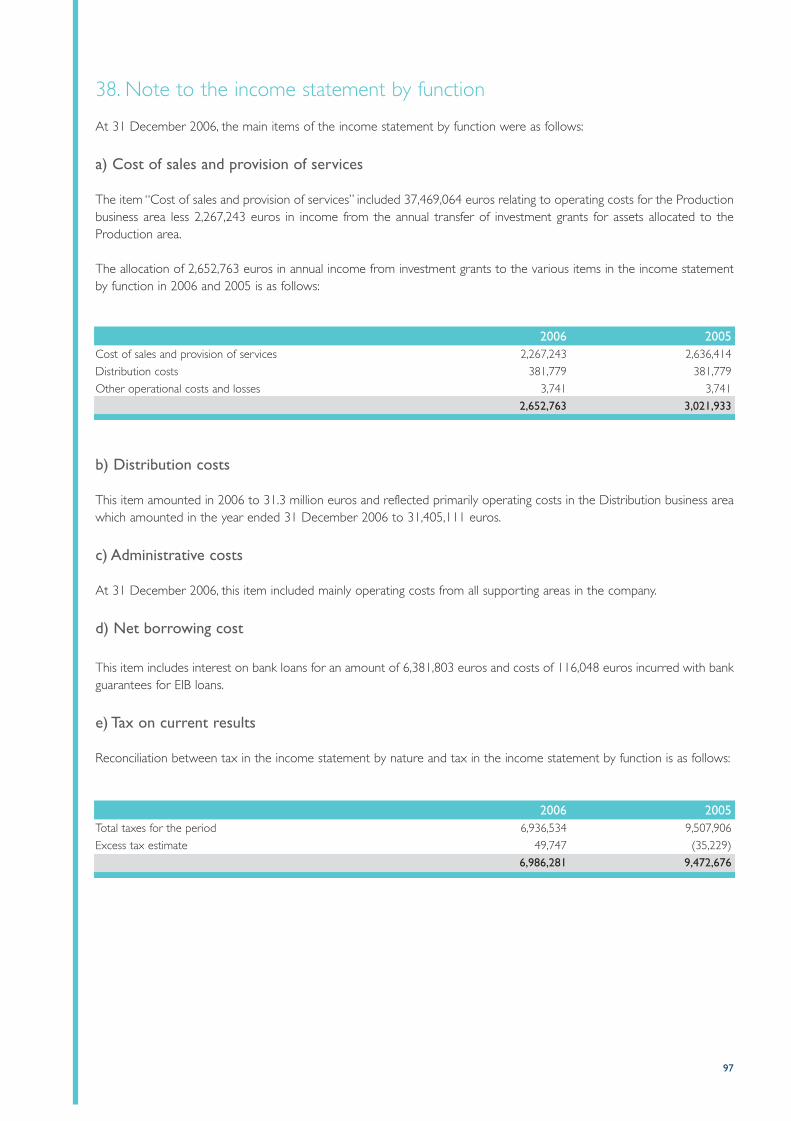
97
38. Note to the income statement by function
At 31 December 2006, the main items of the income statement by function were as follows:
a) Cost of sales and provision of services
The item “Cost of sales and provision of services” included 37,469,064 euros relating to operating costs for the Productionbusiness area less 2,267,243 euros in income from the annual transfer of investment grants for assets allocated to theProduction area.
The allocation of 2,652,763 euros in annual income from investment grants to the various items in the income statementby function in 2006 and 2005 is as follows:
2006 2005 Total taxes for the period 6,936,534 9,507,906
Excess tax estimate 49,747 (35,229)
6,986,281 9,472,676
2006 2005 Cost of sales and provision of services 2,267,243 2,636,414
Distribution costs 381,779 381,779
Other operational costs and losses 3,741 3,741
2,652,763 3,021,933
b) Distribution costs
This item amounted in 2006 to 31.3 million euros and reflected primarily operating costs in the Distribution business areawhich amounted in the year ended 31 December 2006 to 31,405,111 euros.
c) Administrative costs
At 31 December 2006, this item included mainly operating costs from all supporting areas in the company.
d) Net borrowing cost
This item includes interest on bank loans for an amount of 6,381,803 euros and costs of 116,048 euros incurred with bankguarantees for EIB loans.
e) Tax on current results
Reconciliation between tax in the income statement by nature and tax in the income statement by function is as follows:

Tyto alba

ACCOUNTING DOCUMENTS REQUIRED BY THE OFFICIAL ACCOUNTING PLAN
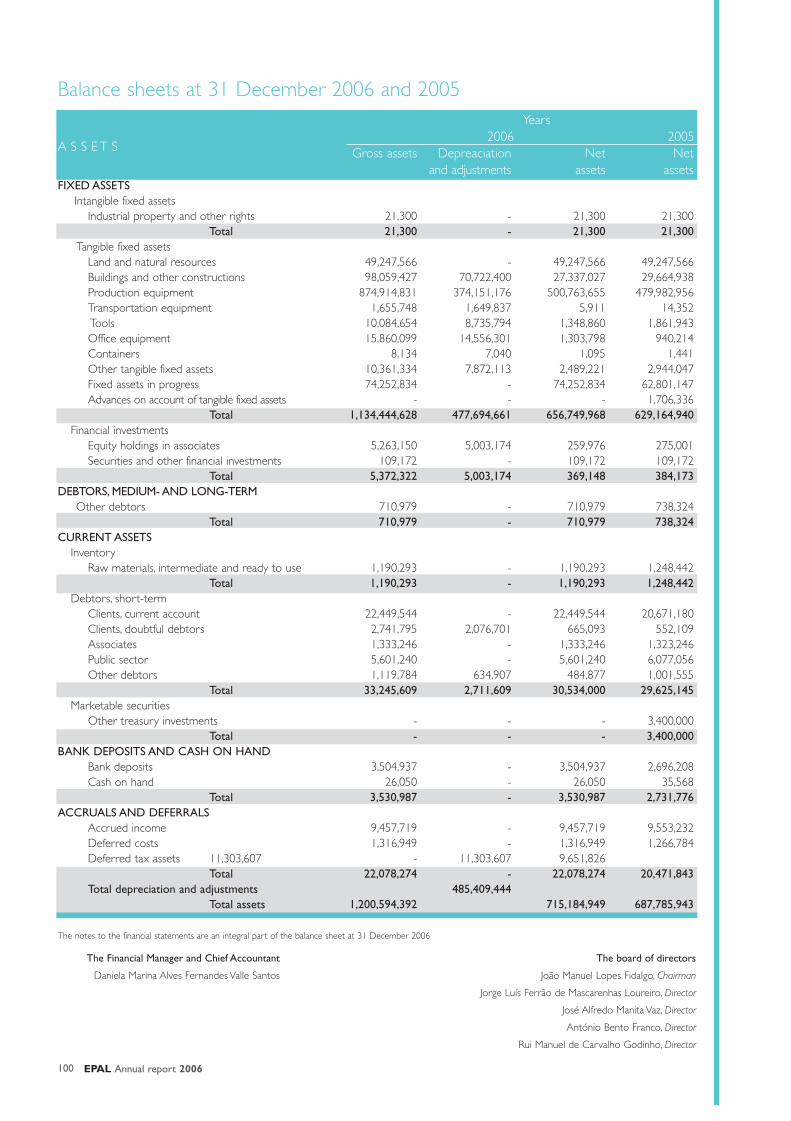
EPAL Annual report 2006100
A S S E T S
Years2006 2005
Gross assets Depreaciation Net Net and adjustments assets assets
FIXED ASSETSIntangible fixed assets
Industrial property and other rights 21,300 - 21,300 21,300 Total 21,300 - 21,300 21,300
Tangible fixed assetsLand and natural resources 49,247,566 - 49,247,566 49,247,566 Buildings and other constructions 98,059,427 70,722,400 27,337,027 29,664,938 Production equipment 874,914,831 374,151,176 500,763,655 479,982,956 Transportation equipment 1,655,748 1,649,837 5,911 14,352 Tools 10,084,654 8,735,794 1,348,860 1,861,943 Office equipment 15,860,099 14,556,301 1,303,798 940,214 Containers 8,134 7,040 1,095 1,441 Other tangible fixed assets 10,361,334 7,872,113 2,489,221 2,944,047 Fixed assets in progress 74,252,834 - 74,252,834 62,801,147 Advances on account of tangible fixed assets - - - 1,706,336
Total 1,134,444,628 477,694,661 656,749,968 629,164,940 Financial investments
Equity holdings in associates 5,263,150 5,003,174 259,976 275,001 Securities and other financial investments 109,172 - 109,172 109,172
Total 5,372,322 5,003,174 369,148 384,173 DEBTORS, MEDIUM- AND LONG-TERM
Other debtors 710,979 - 710,979 738,324 Total 710,979 - 710,979 738,324
CURRENT ASSETSInventory
Raw materials, intermediate and ready to use 1,190,293 - 1,190,293 1,248,442 Total 1,190,293 - 1,190,293 1,248,442
Debtors, short-termClients, current account 22,449,544 - 22,449,544 20,671,180 Clients, doubtful debtors 2,741,795 2,076,701 665,093 552,109 Associates 1,333,246 - 1,333,246 1,323,246 Public sector 5,601,240 - 5,601,240 6,077,056 Other debtors 1,119,784 634,907 484,877 1,001,555
Total 33,245,609 2,711,609 30,534,000 29,625,145 Marketable securities
Other treasury investments - - - 3,400,000 Total - - - 3,400,000
BANK DEPOSITS AND CASH ON HANDBank deposits 3,504,937 - 3,504,937 2,696,208 Cash on hand 26,050 - 26,050 35,568
Total 3,530,987 - 3,530,987 2,731,776 ACCRUALS AND DEFERRALS
Accrued income 9,457,719 - 9,457,719 9,553,232 Deferred costs 1,316,949 - 1,316,949 1,266,784 Deferred tax assets 11,303,607 - 11,303,607 9,651,826
Total 22,078,274 - 22,078,274 20,471,843 Total depreciation and adjustments 485,409,444
Total assets 1,200,594,392 715,184,949 687,785,943
The Financial Manager and Chief Accountant
Daniela Marina Alves Fernandes Valle Santos
The board of directors
João Manuel Lopes Fidalgo, Chairman
Jorge Luís Ferrão de Mascarenhas Loureiro, Director
José Alfredo Manita Vaz, Director
António Bento Franco, Director
Rui Manuel de Carvalho Godinho, Director
The notes to the financial statements are an integral part of the balance sheet at 31 December 2006
Balance sheets at 31 December 2006 and 2005
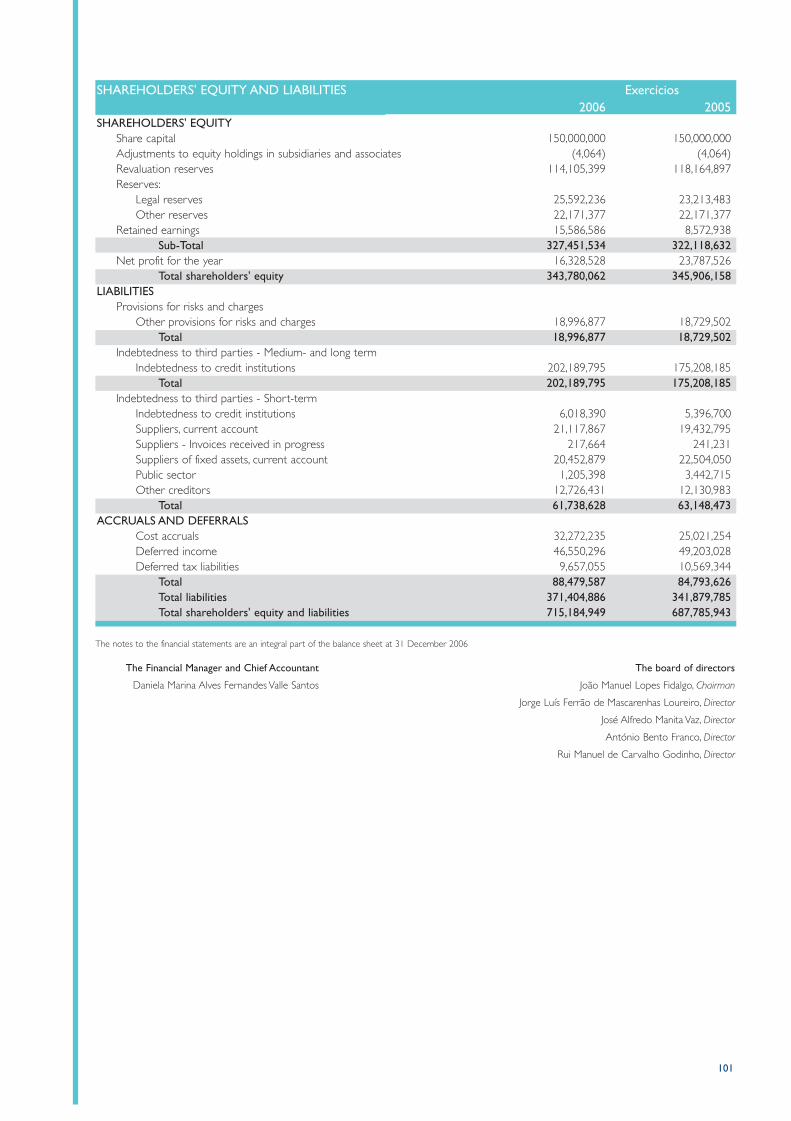
101
SHAREHOLDERS' EQUITY AND LIABILITIES Exercícios2006 2005
SHAREHOLDERS' EQUITY Share capital 150,000,000 150,000,000 Adjustments to equity holdings in subsidiaries and associates (4,064) (4,064)Revaluation reserves 114,105,399 118,164,897 Reserves:
Legal reserves 25,592,236 23,213,483 Other reserves 22,171,377 22,171,377
Retained earnings 15,586,586 8,572,938 Sub-Total 327,451,534 322,118,632
Net profit for the year 16,328,528 23,787,526 Total shareholders' equity 343,780,062 345,906,158
LIABILITIESProvisions for risks and charges
Other provisions for risks and charges 18,996,877 18,729,502 Total 18,996,877 18,729,502
Indebtedness to third parties - Medium- and long termIndebtedness to credit institutions 202,189,795 175,208,185
Total 202,189,795 175,208,185 Indebtedness to third parties - Short-term
Indebtedness to credit institutions 6,018,390 5,396,700 Suppliers, current account 21,117,867 19,432,795 Suppliers - Invoices received in progress 217,664 241,231 Suppliers of fixed assets, current account 20,452,879 22,504,050 Public sector 1,205,398 3,442,715 Other creditors 12,726,431 12,130,983
Total 61,738,628 63,148,473 ACCRUALS AND DEFERRALS
Cost accruals 32,272,235 25,021,254 Deferred income 46,550,296 49,203,028 Deferred tax liabilities 9,657,055 10,569,344
Total 88,479,587 84,793,626 Total liabilities 371,404,886 341,879,785 Total shareholders' equity and liabilities 715,184,949 687,785,943
The Financial Manager and Chief Accountant
Daniela Marina Alves Fernandes Valle Santos
The board of directors
João Manuel Lopes Fidalgo, Chairman
Jorge Luís Ferrão de Mascarenhas Loureiro, Director
José Alfredo Manita Vaz, Director
António Bento Franco, Director
Rui Manuel de Carvalho Godinho, Director
The notes to the financial statements are an integral part of the balance sheet at 31 December 2006
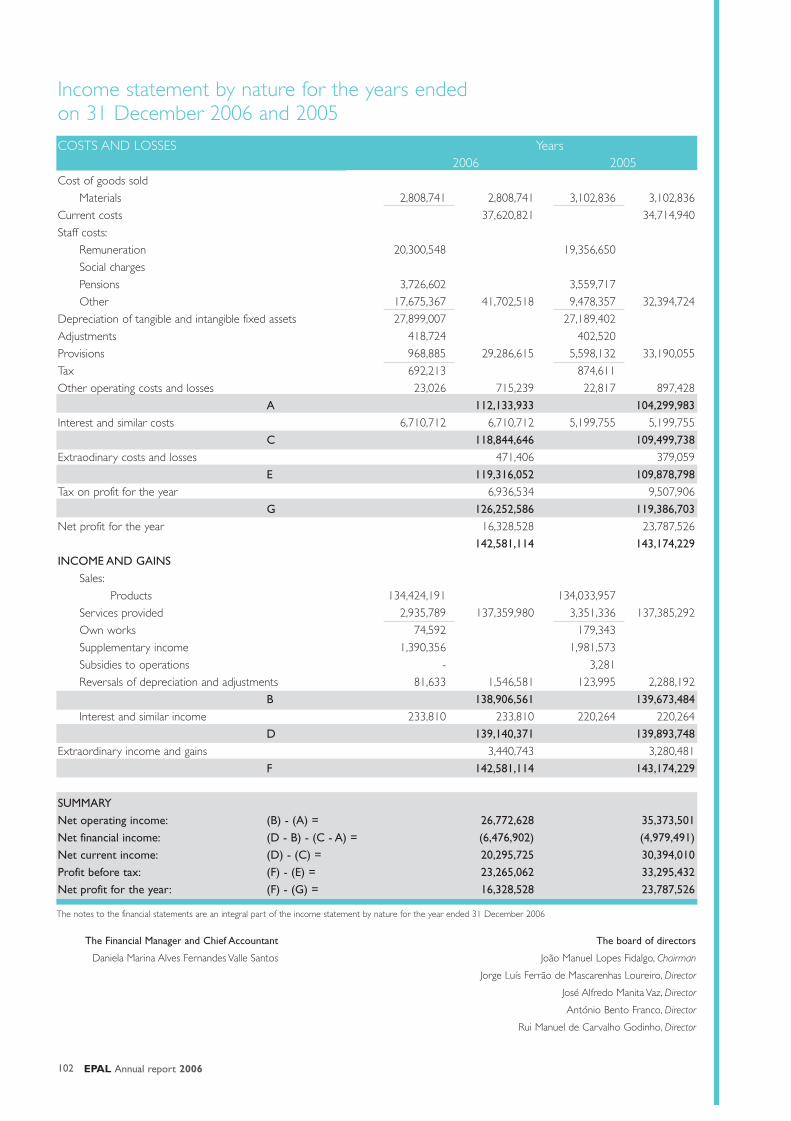
EPAL Annual report 2006102
The board of directors
João Manuel Lopes Fidalgo, Chairman
Jorge Luís Ferrão de Mascarenhas Loureiro, Director
José Alfredo Manita Vaz, Director
António Bento Franco, Director
Rui Manuel de Carvalho Godinho, Director
The notes to the financial statements are an integral part of the income statement by nature for the year ended 31 December 2006
COSTS AND LOSSES Years2006 2005
Cost of goods sold
Materials 2,808,741 2,808,741 3,102,836 3,102,836
Current costs 37,620,821 34,714,940
Staff costs:
Remuneration 20,300,548 19,356,650
Social charges
Pensions 3,726,602 3,559,717
Other 17,675,367 41,702,518 9,478,357 32,394,724
Depreciation of tangible and intangible fixed assets 27,899,007 27,189,402
Adjustments 418,724 402,520
Provisions 968,885 29,286,615 5,598,132 33,190,055
Tax 692,213 874,611
Other operating costs and losses 23,026 715,239 22,817 897,428
A 112,133,933 104,299,983 Interest and similar costs 6,710,712 6,710,712 5,199,755 5,199,755
C 118,844,646 109,499,738 Extraodinary costs and losses 471,406 379,059
E 119,316,052 109,878,798 Tax on profit for the year 6,936,534 9,507,906
G 126,252,586 119,386,703 Net profit for the year 16,328,528 23,787,526
142,581,114 143,174,229 INCOME AND GAINS
Sales:
Products 134,424,191 134,033,957
Services provided 2,935,789 137,359,980 3,351,336 137,385,292
Own works 74,592 179,343
Supplementary income 1,390,356 1,981,573
Subsidies to operations - 3,281
Reversals of depreciation and adjustments 81,633 1,546,581 123,995 2,288,192
B 138,906,561 139,673,484 Interest and similar income 233,810 233,810 220,264 220,264
D 139,140,371 139,893,748 Extraordinary income and gains 3,440,743 3,280,481
F 142,581,114 143,174,229
SUMMARYNet operating income: (B) - (A) = 26,772,628 35,373,501 Net financial income: (D - B) - (C - A) = (6,476,902) (4,979,491)Net current income: (D) - (C) = 20,295,725 30,394,010 Profit before tax: (F) - (E) = 23,265,062 33,295,432 Net profit for the year: (F) - (G) = 16,328,528 23,787,526
Income statement by nature for the years ended on 31 December 2006 and 2005
The Financial Manager and Chief Accountant
Daniela Marina Alves Fernandes Valle Santos

103
Note POC Description Notes appended1. POC rules waived in the period 22. Comparability n.a3. Bases of presentation and main valuation criteria 24. Share prices n.a5. Tax benefits relevant for the period n.a6. Income tax 367. Average number of employees 278. Note to the accounts for establishment costs and research and development n.a9. Explanation for depreciating establishment transmission value beyond five years n.a10. Changes in fixed assets and related depreciation and adjustments 5,6,7 e 2811. Funding of fixed assets booked for the period n.a12. Revaluation of tangible fixed assets (legislation) 6 13. Table detailing revaluations 6 14. Fixed assets in third parties' possession 6 15. Goods used under financial leases n.a16. Equity holdings in group companies and associates 717. Shares and parts of the Marketable securities account exceeding 5% of current assets n.a18. Breakdown of account 4154 - Funds n.a19. Materially relevant differences between market prices and valuation of current assets n.a20. Valuation of current-asset items below market prices n.a21. Adjustments 11 e 1322. Inventory in third parties' possession n.a23. Doubtful debts 11 e 1324. Loans extended to governing body members n.a25. Debts to and claims on company staff 13 e 2326. Debts materialised by balance sheet items but not reported on the balance sheet n.a27. Dated and undated bonds issued by the company n.a28. Overdue amounts on the Public sector account n.a29. Debts to third parties maturing after five years 1930. Debts to third parties backed by collateral n.a31. Commitments not reported on the balance sheet 1832. Guarantees provided 3733. Difference between debts payable and related amounts n.a34. Provisions 1735. Equity increases and reductions n.a36. Composition of the share capital 1537. Identification of legal persons owning more than 20% of the share capital 738. Shares and parts subscribed in the period n.a39. Change in revaluation reserves in the period 1640. Changes in Shareholders' equity Statement of changes in
equity41. Statement of cost of goods sold 2542. Statement of change in production n.a43. Remuneration of governing bodies 2744. Breakdown of sales and services provided 2445. Statement of net financial income 33 e 3446. Statement of net extraordinary income 3547. Disclosures required by law n.a48. Other relevant disclosures 12,13,14,19, 22 e 23
Appended notesThe numbering of the appended notes as required by the Official Accounting Plan is reconciled with the numbering of thepresented notes as follows:
n.a. - not applicable
EPAL Annual report 2006
Carduelis chloris

105
Delloite.
AUDIT REPORT
Introduction
1.We have examined the appended financial statements of EPAL - Empresa Portuguesa das Águas Livres, S.A. consisting ofthe balance sheet at 31 December 2006 that evidences a total of 715,184,949 euros, equity of 343,780,062 euros including a net result of 23,787,526.20 euros, the income statements by nature and function, the statement of changes inequity, the cash flow statement for 2006 as well as the relevant notes.
Responsibilities
2. It is the board of directors' responsibility to prepare such financial statements that shall, in a true and appropriate manner, present the financial position of the company, the result and cash flows of its operations, as well as adopt adequate accounting principles and policies and maintain an appropriate internal control system. Our responsibility consists of expressing a professional and independent opinion based on our examination of the aforementioned financial statements.
Scope
3. Our examination has been conducted in accordance with the Technical Standards and the Auditing Guidelines of theInstitute of Chartered Accountants, which require the examination to be planned and executed in such a manner thatan acceptable confidence level can be obtained that the financial statements do not contain materially relevant distortions.This examination has involved, on a sampling basis, checking the basis for the amounts and information disclosedin the financial statements, evaluating the estimates used for their preparation, based on judgements and criteria definedby the board of directors, assessing whether the adopted accounting principles and their disclosure are adequate in viewof the circumstances, checking the applicability of the continuity principle and judging the overall adequacy of the financial statements' presentation.We consider that our examination provides an acceptable basis for our opinion.
Opinion
4. In our opinion, the financial statements referred to in paragraph 1 present in a true and appropriate manner, in all materially relevant respects, the financial position of EPAL - Empresa Portuguesa das Águas Livres, S.A. at 31 December2006 as well as the result and the cash flows of its operations in 2006, in accordance with generally accepted accounting principles in Portugal.
Emphasis
5.The balance sheet and the income statement by nature (which have been, as mentioned in in Note 2.a), restated in orderto be presented in a different format from the one called for by Plano Oficial de Contabilidade), the income statementby function and the cash flow statement for the year ended 31 December 2005, which are presented for comparativepurposes, have been audited by another firm of chartered accountants, whose report of 10 March 2006 does not contain any qualifications.
Lisbon, 16 March 2007DELOITTE & ASSOCIADOS, SROC S.A.Represented by João Luís Falua Costa da Silva

ANNUAL REPORT 2006EPAL
Published by EPAL - Empresa Portuguesa das Águas Livres, S.A..Graphic design by GIC - Gabinete de Imagem e Comunicação da EPAL
Translation SINÓPTICA - Comunicação empresarial. Lda.
Illustrations courtesy of SPEA - Sociedade Portuguesa para o Estudo das Aves (Portuguese Bird Study Society)

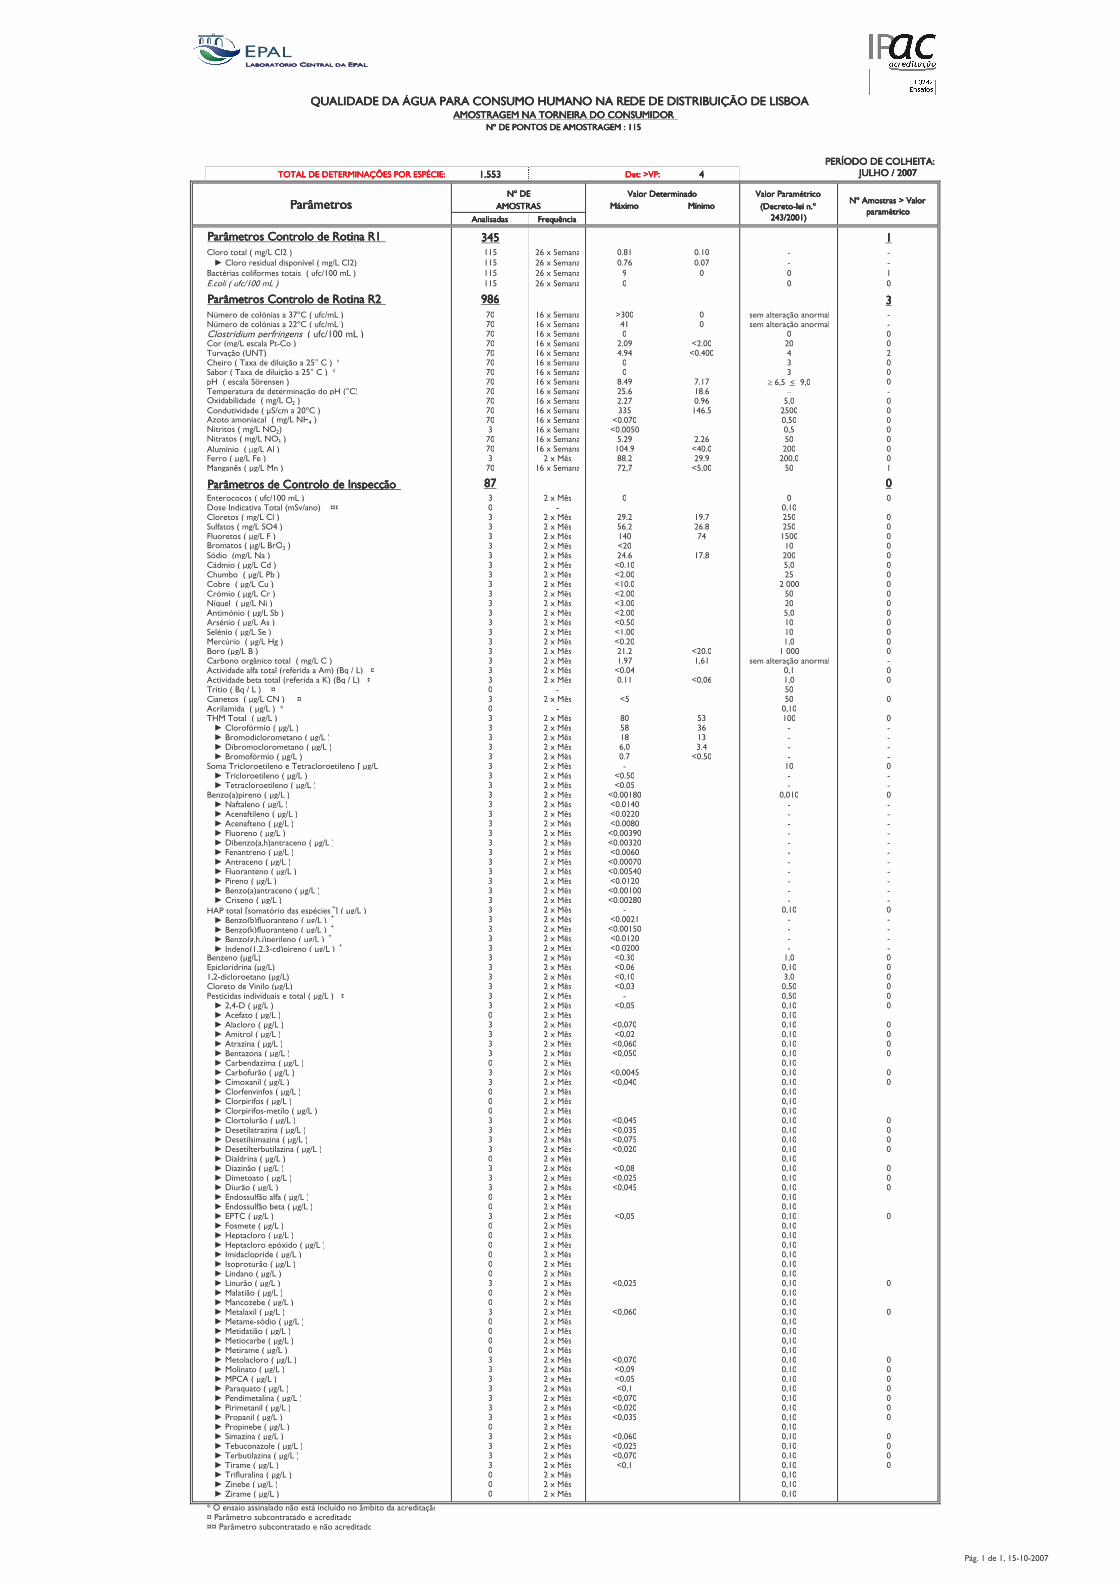
��������������������� �������������������������������������������������������������������� �������������������������������������������������������������������� �������������������������������������������������������������������� ������������������������������������������������������������������������ ���������������������������������� ���������������������������������� ���������������������������������� ���������
����������������������������������������������������������������������������������������������������������������������������
����������� ������������������� ������������������� ������������������� ��������������������������������������� ���������������������������������� ���������������������������������� ���������������������������������� ��� �������������������� � !��"#��� !��"#��� !��"#��� !��"#�� $$$$ %�����&�'(()%�����&�'(()%�����&�'(()%�����&�'(()
�������������������� #*+,-�� ! -./0*1,#*+,-�� ! -./0*1,#*+,-�� ! -./0*1,#*+,-�� ! -./0*1, #*+,-��*-*.2!-/3,#*+,-��*-*.2!-/3,#*+,-��*-*.2!-/3,#*+,-��*-*.2!-/3,�*-4. !-,5�*-4. !-,5�*-4. !-,5�*-4. !-,5 �������������������������������� �67/.,�67/.,�67/.,�67/., �80/.,�80/.,�80/.,�80/.,
�0*+/5*1*5�0*+/5*1*5�0*+/5*1*5�0*+/5*1*5 9- :;<03/*9- :;<03/*9- :;<03/*9- :;<03/*
�*-4. !-,5� ,0!-,+,�1 ��,!/0*����*-4. !-,5� ,0!-,+,�1 ��,!/0*����*-4. !-,5� ,0!-,+,�1 ��,!/0*����*-4. !-,5� ,0!-,+,�1 ��,!/0*��� �$��$��$��$� ���� +,-,�!,!*+�=�.>&�� +'�?�� ��� '@�7�� .*0* (�A� (��( B B����� +,-,�- 5/1;*+�1/5C,08D +�=�.>&�� +'?�� ��� '@�7�� .*0* (�)@ (�() B B�*3!2-/*5�3,+/E,-. 5�!,!*/5��=�;E3&�((�.��?�� ��� '@�7�� .*0* F ( ( ���3,+/�=�;E3&�((�.��?�� ��� '@�7�� .*0* ( ( (
�*-4. !-,5� ,0!-,+,�1 ��,!/0*��'�*-4. !-,5� ,0!-,+,�1 ��,!/0*��'�*-4. !-,5� ,0!-,+,�1 ��,!/0*��'�*-4. !-,5� ,0!-,+,�1 ��,!/0*��' FA@FA@FA@FA@ �����G. -,�1 �3,+H0/*5�*��)� �=�;E3&.��?�� )( �@�7�� .*0* "�(( ( 5 .�*+! -*IJ,�*0,-.*+ B�G. -,�1 �3,+H0/*5�*�''� �=�;E3&.��?�� )( �@�7�� .*0* $� ( 5 .�*+! -*IJ,�*0,-.*+ B +,5!-81/;.�C -E-/0> 05 �=�;E3&�((�.��?�� )( �@�7�� .*0* ( ( ( ,-�=.>&�� 53*+*��!B ,�?� )( �@�7�� .*0* '�(F K'�(( '( (�;-D*IJ,�=���? )( �@�7�� .*0* $�F$ K(�$(( $ ' L /-,�=��*7*�1 �1/+;/IJ,�*�'�M� �?��N )( �@�7�� .*0* ( � (�*O,-�=��*7*�1 �1/+;/IJ,�*�'�M� �?��N )( �@�7�� .*0* ( � (C���=� 53*+*��P- 05 0�?� )( �@�7�� .*0* A�$F )��) ≥ @Q�����FQ( (� .C -*!;-*�1 �1 ! -./0*IJ,�1,�C��=M ? )( �@�7�� .*0* '��@ �A�@ − B�7/1*O/+/1*1 ��=�.>&���'�?��� )( �@�7�� .*0* '�') (�F@ �Q( ( ,01;!/D/1*1 �=�R�&3.�*�'(� �?��� )( �@�7�� .*0* ��� �$@�� '�(( (�S,!,�*.,0/*3*+��=�.>&����$�?��� )( �@�7�� .*0* K(�()( (Q�( (�/!-/!,5�=�.>&����'?��� � �@�7�� .*0* K(�((�( (Q� (�/!-*!,5�=�.>&������?��� )( �@�7�� .*0* ��'F '�'@ �( (�+;.80/,��=�µ>&���+�?��� )( �@�7�� .*0* �($�F K$(�( '(( (9 --,�=�R>&��9 �?��� � '�7��<5 AA�' 'F�F '((Q( (�*0>*0<5�=�R>&���0�?��� )( �@�7�� .*0* )'Q) K�Q(( �( �
�*-4. !-,5�1 � ,0!-,+,�1 ��05C 3IJ,�*-4. !-,5�1 � ,0!-,+,�1 ��05C 3IJ,�*-4. !-,5�1 � ,0!-,+,�1 ��05C 3IJ,�*-4. !-,5�1 � ,0!-,+,�1 ��05C 3IJ, A)A)A)A) ((((�0! -,3,3,5�=�;E3&�((�.��?�� � '�7��<5 ( ( (�,5 ��01/3*!/D*��,!*+�=.�D&*0,?����TT ( B (Q�( +,- !,5�=�.>&�� +�?�� � '�7��<5 'F�' �F�) '�( (�;+E*!,5�=�.>&����$�?��� � '�7��<5 �@�' '@�A '�( (9+;,- !,5�=�R>&��9�?� � '�7��<5 �$( )$ ��(( (�-,.*!,5�=�R>&���-���?� � '�7��<5 K'( �( (�H1/,��=.>&���*�?��� � '�7��<5 '$�@ �)QA '(( ( 61./,�=�R>&�� 1�?��� � '�7��<5 K(��( �Q( ( L;.O,��=�R>&���O�?��� � '�7��<5 K'�(( '� ( ,O- ��=�R>&�� ;�?��� � '�7��<5 K�(�( '�((( ( -H./,�=�R>&�� -�?��� � '�7��<5 K'�(( �( (�8:; +��=�R>&���/�?��� � '�7��<5 K��(( '( (�0!/.H0/,�=�R>&���O�?��� � '�7��<5 K'�(( �Q( (�-520/,�=�R>&���5�?�� � '�7��<5 K(��( �( (� +20/,�=�R>&��� �?�� � '�7��<5 K��(( �( (� -3G-/,��=�R>&���>�?��� � '�7��<5 K(�'( �Q( (�,-,�=R>&����?��� � '�7��<5 '��' K'(�( ��((( ( *-O,0,�,->40/3,�!,!*+��=�.>&�� �?�� � '�7��<5 ��F) �Q@� 5 .�*+! -*IJ,�*0,-.*+ B�3!/D/1*1 �*+E*�!,!*+�=- E -/1*�*��.?�=�:�&��?���T � '�7��<5 K(�($ (Q� (�3!/D/1*1 �O !*�!,!*+�=- E -/1*�*�U?�=�:�&��?���T � '�7��<5 (��� K(Q(@ �Q( (�-8!/,����=��:�&���?����T ( B �( /*0 !,5��=�R>&�� ��?�����T � '�7��<5 K� �( (�3-/+*./1*��=�R>&��?��N ( B (Q�(�����,!*+��=�R>&��?��� � '�7��<5 A( �� �(( (����� +,-,EH-./,�=�R>&��? � '�7��<5 �A �@ B B������-,.,1/3+,-,. !*0,�=�R>&��? � '�7��<5 �A �� B B������/O-,.,3+,-,. !*0,�=�R>&��? � '�7��<5 @Q( ��$ B B������-,.,EH-./,�=�R>&��? � '�7��<5 (�) K(��( B B�,.*��-/3+,-, !/+ 0,� �� !-*3+,-, !/+ 0,�V�R>&��? � '�7��<5 B �( (������-/3+,-, !/+ 0,�=�R>&��? � '�7��<5 K(��( B B������ !-*3+,-, !/+ 0,�=�R>&��? � '�7��<5 K(�(� B B� 0S,=*?C/- 0,�=�R>&��? � '�7��<5 K(�((�A( (Q(�( (������*E!*+ 0,�=�R>&��? � '�7��<5 K(�(�$( B B������3 0*E!/+ 0,�=�R>&��? � '�7��<5 K(�(''( B B������3 0*E! 0,�=�R>&��? � '�7��<5 K(�((A( B B�����9+;,- 0,�=�R>&��? � '�7��<5 K(�((�F( B B������/O 0S,=*QL?*0!-*3 0,�=�R>&��? � '�7��<5 K(�((�'( B B�����9 0*0!- 0,�=�R>&��? � '�7��<5 K(�((@( B B������0!-*3 0,�=�R>&��? � '�7��<5 K(�((()( B B�����9+;,-*0! 0,�=�R>&��? � '�7��<5 K(�((�$( B B������/- 0,�=�R>&��? � '�7��<5 K(�(�'( B B������ 0S,=*?*0!-*3 0,�=�R>&��? � '�7��<5 K(�((�(( B B����� -/5 0,�=�R>&��? � '�7��<5 K(�(('A( B B����!,!*+�V5,.*!H-/,�1*5� 5C23/ 5�WX�=�R>&��?��� � '�7��<5 B (Q�( (������ 0S,=O?E+;,-*0! 0,�=�R>&��?��W � '�7��<5 K(�(('� B B������ 0S,=Y?E+;,-*0! 0,�=�R>&��?��W � '�7��<5 K(�((��( B B������ 0S,=>QLQ/?C -/+ 0,�=�R>&��?��W � '�7��<5 K(�(�'( B B������01 0,=�Q'Q�B31?C/- 0,�=�R>&��?��W � '�7��<5 K(�('(( B B� 0S 0,�=R>&�? � '�7��<5 K(��( �Q( (�C/3+,-/1-/0*�=R>&�?�� � '�7��<5 K(�(@ (Q�( (�Q'B1/3+,-, !*0,�=R>&�?�� � '�7��<5 K(Q�( �Q( ( +,- !,�1 �#/0/+,�=R>&�?�� � '�7��<5 K(Q(� (Q�( (� 5!/3/1*5�/01/D/1;*/5� �!,!*+�=�R>&��?���T � '�7��<5 B (Q�( (�����'Q$B��=�R>&��? � '�7��<5 K(Q(� (Q�( (������3 E*!,�=�R>&��? ( '�7��<5 (Q�(������+*3+,-,�=�R>&��? � '�7��<5 K(Q()( (Q�( (������./!-,+�=�R>&��? � '�7��<5 K(Q(' (Q�( (������!-*S/0*�=�R>&��? � '�7��<5 K(Q(@( (Q�( (������ 0!*S,0*�=�R>&��? � '�7��<5 K(Q(�( (Q�( (����� *-O 01*S/.*�=�R>&��? ( '�7��<5 (Q�(����� *-O,E;-J,�=�R>&��? � '�7��<5 K(Q(($� (Q�( (����� /.,7*0/+�=�R>&��? � '�7��<5 K(Q($( (Q�( (����� +,-E 0D/0E,5�=�R>&��? ( '�7��<5 (Q�(����� +,-C/-/E,5�=�R>&��? ( '�7��<5 (Q�(����� +,-C/-/E,5B. !/+,�=�R>&��? ( '�7��<5 (Q�(����� +,-!,+;-J,�=�R>&��? � '�7��<5 K(Q($� (Q�( (������ 5 !/+*!-*S/0*�=�R>&��? � '�7��<5 K(Q(�� (Q�( (������ 5 !/+5/.*S/0*�=�R>&��? � '�7��<5 K(Q()� (Q�( (������ 5 !/+! -O;!/+*S/0*�=�R>&��? � '�7��<5 K(Q('( (Q�( (������/*+1-/0*�=�R>&��? ( '�7��<5 (Q�(������/*S/0J,�=�R>&��? � '�7��<5 K(Q(A (Q�( (������/. !,*!,�=�R>&��? � '�7��<5 K(Q('� (Q�( (������/;-J,�=�R>&��? � '�7��<5 K(Q($� (Q�( (������01,55;+EJ,�*+E*�=�R>&��? ( '�7��<5 (Q�(������01,55;+EJ,�O !*�=�R>&��? ( '�7��<5 (Q�(�������� �=�R>&��? � '�7��<5 K(Q(� (Q�( (�����9,5. ! �=�R>&��? ( '�7��<5 (Q�(������ C!*3+,-,�=�R>&��? ( '�7��<5 (Q�(������ C!*3+,-,� CH7/1,�=�R>&��? ( '�7��<5 (Q�(������./1*3+,C-/1 �=�R>&��? ( '�7��<5 (Q�(������5,C-,!;-J,�=�R>&��? ( '�7��<5 (Q�(������/01*0,�=�R>&��? ( '�7��<5 (Q�(������/0;-J,�=�R>&��? � '�7��<5 K(Q('� (Q�( (������*+*!/J,�=�R>&��? ( '�7��<5 (Q�(������*03,S O �=�R>&��? ( '�7��<5 (Q�(������ !*+*7/+�=�R>&��? � '�7��<5 K(Q(@( (Q�( (������ !*. B5H1/,�=�R>&��? ( '�7��<5 (Q�(������ !/1*!/J,�=�R>&��? ( '�7��<5 (Q�(������ !/,3*-O �=�R>&��? ( '�7��<5 (Q�(������ !/-*. �=�R>&��? ( '�7��<5 (Q�(������ !,+*3+,-,�=�R>&��? � '�7��<5 K(Q()( (Q�( (������,+/0*!,�=�R>&��? � '�7��<5 K(Q(F (Q�( (������� ��=�R>&��? � '�7��<5 K(Q(� (Q�( (������*-*:;*!,�=�R>&��? � '�7��<5 K(Q� (Q�( (������ 01/. !*+/0*�=�R>&��? � '�7��<5 K(Q()( (Q�( (������/-/. !*0/+�=�R>&��? � '�7��<5 K(Q('( (Q�( (������-,C*0/+�=�R>&��? � '�7��<5 K(Q(�� (Q�( (������-,C/0 O �=�R>&��? ( '�7��<5 (Q�(������/.*S/0*�=�R>&��? � '�7��<5 K(Q(@( (Q�( (������ O;3,0*S,+ �=�R>&��? � '�7��<5 K(Q('� (Q�( (������ -O;!/+*S/0*�=�R>&��? � '�7��<5 K(Q()( (Q�( (������/-*. �=�R>&��? � '�7��<5 K(Q� (Q�( (������-/E+;-*+/0*�=�R>&��? ( '�7��<5 (Q�(�����Z/0 O �=�R>&��? ( '�7��<5 (Q�(�����Z/-*. �=�R>&��? ( '�7��<5 (Q�(
N��� 05*/,�*55/0*+*1,�0J,� 5!6�/03+;81,�0,�4.O/!,�1*�*3- 1/!*IJ,T��*-4. !-,�5;O3,0!-*!*1,� �*3- 1/!*1,TT��*-4. !-,�5;O3,0!-*!*1,� �0J,�*3- 1/!*1,
����.,5!-*5�"�#*+,-�����.,5!-*5�"�#*+,-�����.,5!-*5�"�#*+,-�����.,5!-*5�"�#*+,-�C*-*.2!-/3,C*-*.2!-/3,C*-*.2!-/3,C*-*.2!-/3,
=� 3- !,B+ /�0���=� 3- !,B+ /�0���=� 3- !,B+ /�0���=� 3- !,B+ /�0���'$�&'((�?'$�&'((�?'$�&'((�?'$�&'((�?
����������������������������[���[���[���[������� ������������������������������������������������������������
�6>����1 ��Q���B�(B'(()