Embed Size (px)
Citation preview
School Of Engineering
Drive-by Bridge Damage Evaluation
Using Relative Displacement History
Ahmed Ali El HattabNassim Uddin
NATIONAL CENTER FOR TRANSPORTATION SYSTEM PRODUCTIVITY AND MANAGEMENT
Most of the 40s’ or 50s’ bridges in North America and
Europe has deteriorated significantly.
Heavy truck weight in combination with deterioration
problems have led to plenty of U.S. bridges being classified
as structurally deficient or functionally obsolete.
Research Introduction

Bridge Visual Inspection
I-35W Mississippi River bridge
Research Introduction (Cont…)

Research Introduction (Cont…)
An Efficient Method is needed to inspect the bridges to
evaluate the damage.
Previously, bridge used to be instrumented in order to
inspect the bridge.
Recently many scientists transfer to instrument a vehicle
Pass over the bridge which known as “Drive-By Bridge
Inspection”

Research Introduction (Cont…)
What is Drive-By Bridge Inspection
Undamaged Bridge
Damaged Bridge

Research Objective
1) Develop Innovative and Novel “Apparent profile (AP)”
Concept As a Damage Indicator
2) Demonstrate “AP” for practical application of bridge
problems

1)AP Concept: What is AP?
Accelerometer
In Field
Computer Algorithm
Real Life truck
Unknown Road Profile
Measured acceleration
Input : Axle Acceleration
LS-DynaModel
Output : The Road Profile
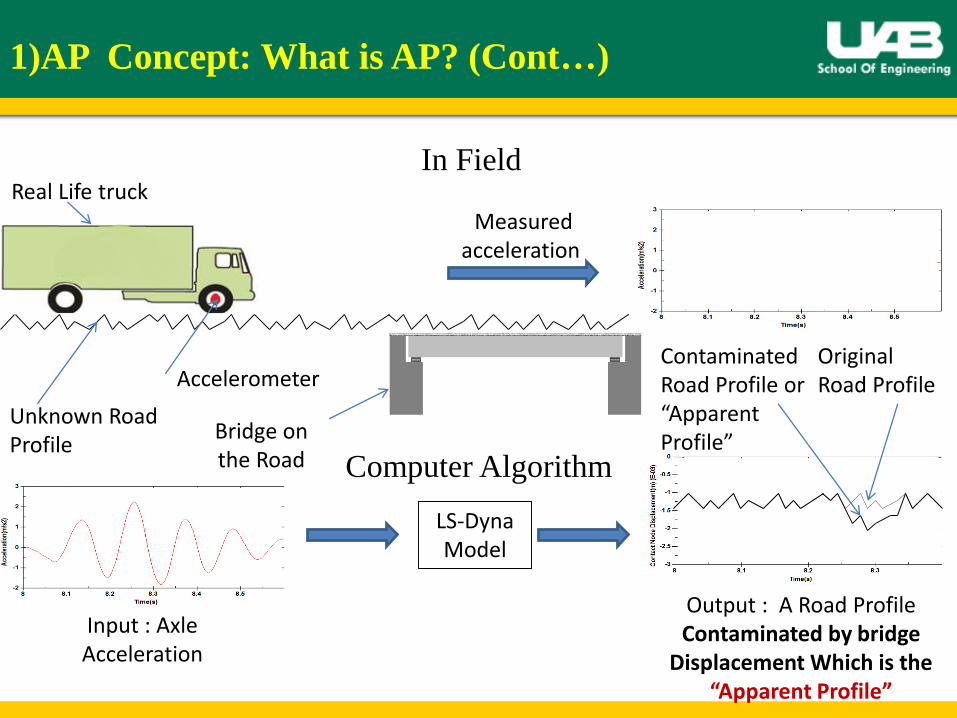
1)AP Concept: What is AP? (Cont…)
Accelerometer
In Field
Computer Algorithm
Real Life truck
Unknown Road Profile
Measured acceleration
Input : Axle Acceleration
LS-DynaModel
Output : A Road Profile Contaminated by bridge
Displacement Which is the “Apparent Profile”
Bridge on the Road
Original Road Profile
Contaminated Road Profile or “Apparent Profile”

1)AP Concept: How to use “AP “ in Bridge
Inspection
Measured acceleration
1) For Healthy Bridge
LS-DynaModel
Apparent Profile For Healthy
Bridge
Acceleration
2) For Damaged Bridge (ex: 10% damage)
LS-DynaModel
Apparent Profile For Damaged
Bridge

Apparent Profile For Healthy
Bridge
Apparent Profile For Damaged
Bridge
Subtracting the Healthy Apparent
Profile From Damaged
Apparent Profile to get the
“Difference In Apparent Profile”Which shows to
be a good damage indicator Difference in
Apparent Profile for 10% Damage
or Relative
Displacement History
1)AP Concept: How to use AP in Bridge
Inspection(Cont…)

1)AP Concept: Test “AP” as a damage indicator
1) Bridge ModelThree different bridges are studied in this study and their properties as shown in the table
Bridge First
Natural
Frequenc
y(Hz)
Moment of inertia around
horizontal axe (m4)
Section Area (m2)
10m 8.75 0.0434 2.04
20m 3.77 0.1518 2.40
30m 2.39 0.3534 2.76

1)AP Concept: Test “AP” as a damage indicator
(Cont…)
2) Vehicle Model A quarter Car model with 2DOF which allows for mass
bouncing is used in the study. The quarter car properties is as shown in the following table
Property Unit Symbol Quarter Car Model
Body Mass kg ms 17300
Axel Mass kg ma 700
Suspension Stiffness N/m ks 4 × 10⁵
Suspension Damping N.s/m cs 10 × 103
Tire Stiffness N/m ka 1.75 × 10⁶
Body mass frequency of vibration Hz fbounce 0.69
Axel mass frequency of vibration Hz faxle 8.8
1)AP Concept: Test “AP” as a damage indicator
(Cont…)
3) Vehicle Bridge Interaction Modelling LS-Dyna Finite Element Analysis program is used to model
the Vehicle Bridge Interaction

1)AP Concept: Test “AP” as a damage indicator
(Cont…)
4) Modelling Stages: 1. STAGE “1”: is to make an LS-Dyna quarter Car model
equivalent to the real life truck to get an acceleration data (to represent real life acceleration data)
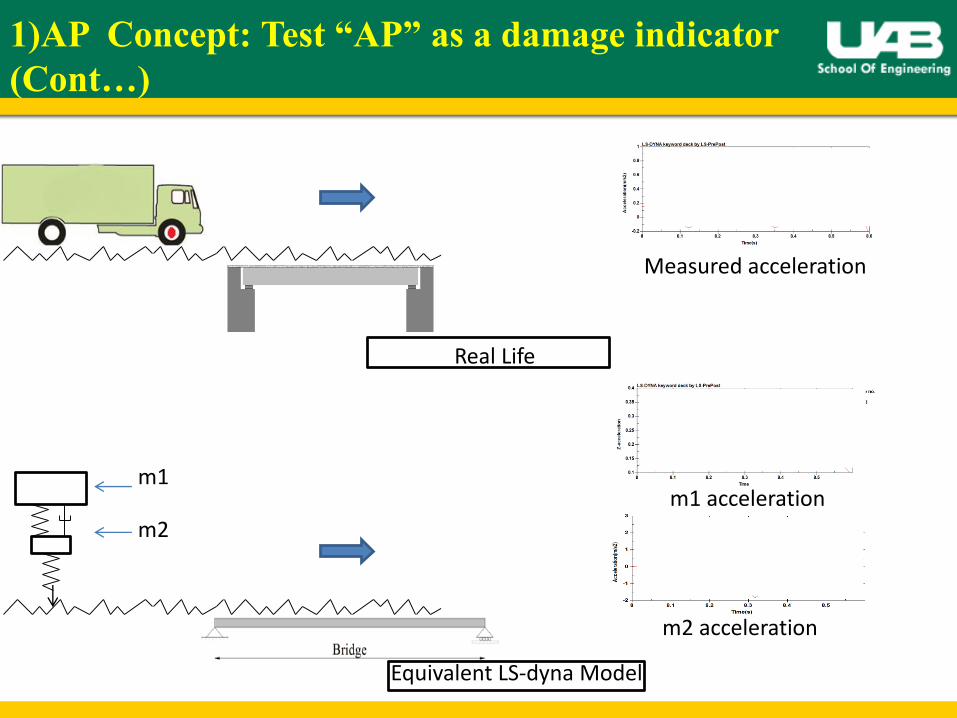
1)AP Concept: Test “AP” as a damage indicator
(Cont…)
Measured acceleration
Real Life
Equivalent LS-dyna Model
m1m1 acceleration
m2 acceleration
m2

1)AP Concept: Test “AP” as a damage indicator
(Cont…)
4) Modelling Stages: 2. STAGE “2”:
• To recalculate the “Apparent Profile” , the force applied by the truck on the road need to be calculated. It will indicate what known as “F stability“
m1 acceleration (Known)
m2 acceleration (Known)
“F stability”(Unknown: need to be
calculated)

1)AP Concept: Test “AP” as a damage indicator
(Cont…)
4) Modelling Stages: 2. STAGE “2”:
• Get “F stability” by applying Newton's Second Law
m1 acceleration
m2 acceleration
m1
m2
F stability
F stability = m1 x a1 + m2 x a2

1)AP Concept: Test “AP” as a damage indicator
(Cont…)
4) Modelling Stages: 2. STAGE “2”
• Apply the F stability,m1 acceleration and m2 acceleration as an input to get the “Apparent Profile”
m1 acceleration
m2 acceleration
F stability
input
input
input
LS-DynaQuarter Car Model
Output : Contact Node Displacement (Apparent Profile) Apparent Profile

1)AP Concept: Test “AP” as a damage indicator
(Cont…)
1) Study “AP” for Different “Road Roughness” Two different roughness are tested
A. Smooth road profile B. Rough Road Profile (Class “A” & “B”)
1) Study “AP” for Different “Damage Representation” Two different Damage Representation are used :
A. Increase in Structural DampingB. Loss in Structural Stiffness

1)AP Concept: Test “AP” as a damage indicator
(Cont…)
1) Study “AP” for Different “Road Roughness” two methods two cases are studied :
A. Smooth road profile B. Rough Road Profile (Class “A” & “B”)
b. Rough Profile a. Smooth Profile
For the two cases, Damage is presented as increase in Damping Ratio
The 10m,20m & 30m bridge were tested and show the same results, so the 20m bridge is discussed here only.

1)AP Concept: Test “AP” as a damage indicator
(Cont…)
A. Smooth Roughness :
m2 acceleration
LS-Model
1) For Damping ratio “ζ” =1%
2) For Damping ratio “ζ” =2%
3) For Damping ratio “ζ” =3%
4) For Damping ratio “ζ” =4%
5) For Damping ratio “ζ” =5%
m1 acceleration
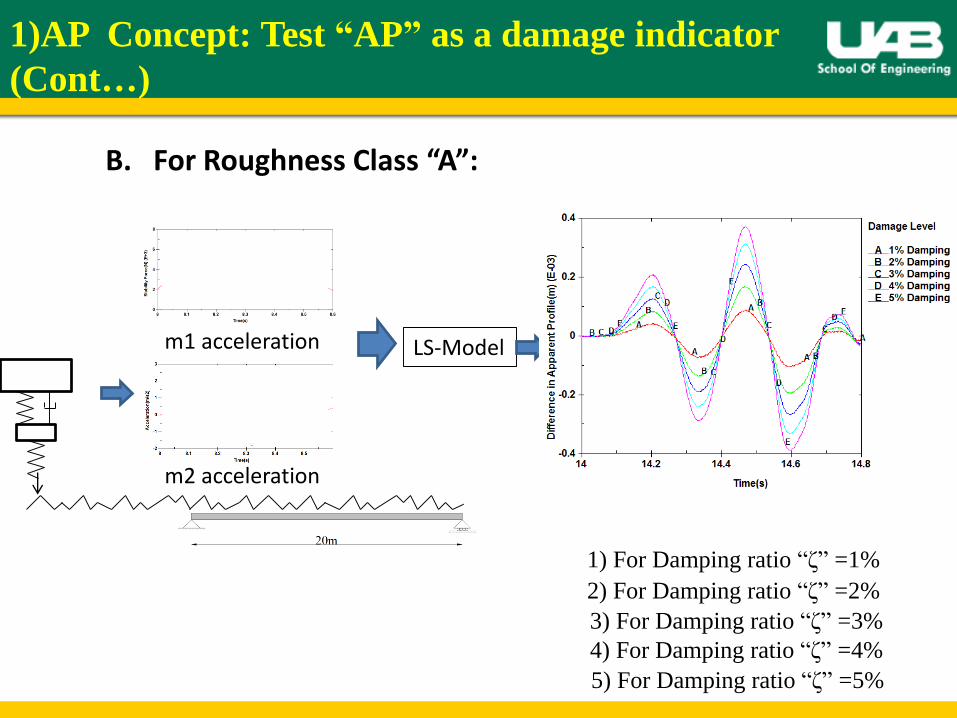
1)AP Concept: Test “AP” as a damage indicator
(Cont…)
B. For Roughness Class “A”:
m2 acceleration
LS-Model
1) For Damping ratio “ζ” =1%
2) For Damping ratio “ζ” =2%
3) For Damping ratio “ζ” =3%
4) For Damping ratio “ζ” =4%
5) For Damping ratio “ζ” =5%
m1 acceleration

1)AP Concept: Test “AP” as a damage indicator
(Cont…)
1) Study “AP” for Different “Damage Representation”A. As increase in damping ratio B. As reduction in Structural Stiffness
(At 1/3 of Bridge Span)
a. Increase in Damping Ratio(Example)
ζ original =1%
ζ damaged =5%
b. Loss in Structural Stiffness (Example)
20%h crack = 20% Damage
• A smooth Profile is used for the simulation

1)AP Concept: Test “AP” as a damage indicator
(Cont…)
A. Change in Damping
m2 acceleration
LS-Model
1) For Damping ratio “ζ” =1%
2) For Damping ratio “ζ” =2%
3) For Damping ratio “ζ” =3%
4) For Damping ratio “ζ” =4%
5) For Damping ratio “ζ” =5%
m1 acceleration

1)AP Concept: Test “AP” as a damage indicator
(Cont…)
B. Change in Structure Stiffness
m2 acceleration
LS-Modelm1 acceleration
1) For 10% Damage
2) For 20% Damage
3) For 30% Damage
4) For 40% Damage
5) For 50% Damage

2)”AP” Application in Bridge Damage Evaluation
Use Apparent Profile to Evaluate Bridge Damage • The goal here is to evaluate the damage of an existing bridge
using the Apparent Profile
1) Bridge under Study • The Damaged location is 20%L of the Span Length • The Damage Level is 30%
Bridge(m) First Natural Frequency
(Hz)
Moment of inertia around
horizontal axe (m4)
10 8.75 0.0434

2)”AP” Application in Bridge Damage Evaluation
(Cont…)
2) Vehicle Model A quarter Car model with 2DOF which allows for mass
bouncing is used in the study. The quarter car properties is as shown in the following table
Property Unit Symbol Quarter Car Model
Body Mass kg ms 17300
Axel Mass kg ma 700
Suspension Stiffness N/m ks 4 × 10⁵
Suspension Damping N.s/m cs 10 × 103
Tire Stiffness N/m ka 1.75 × 10⁶
Body mass frequency of vibration Hz fbounce 0.69
Axel mass frequency of vibration Hz faxle 8.8

2)”AP” Application in Bridge Damage Evaluation
(Cont…)
3) Vehicle Bridge Interaction Modelling LS-Dyna Finite Element Analysis program is used to model
the Vehicle Bridge Interaction
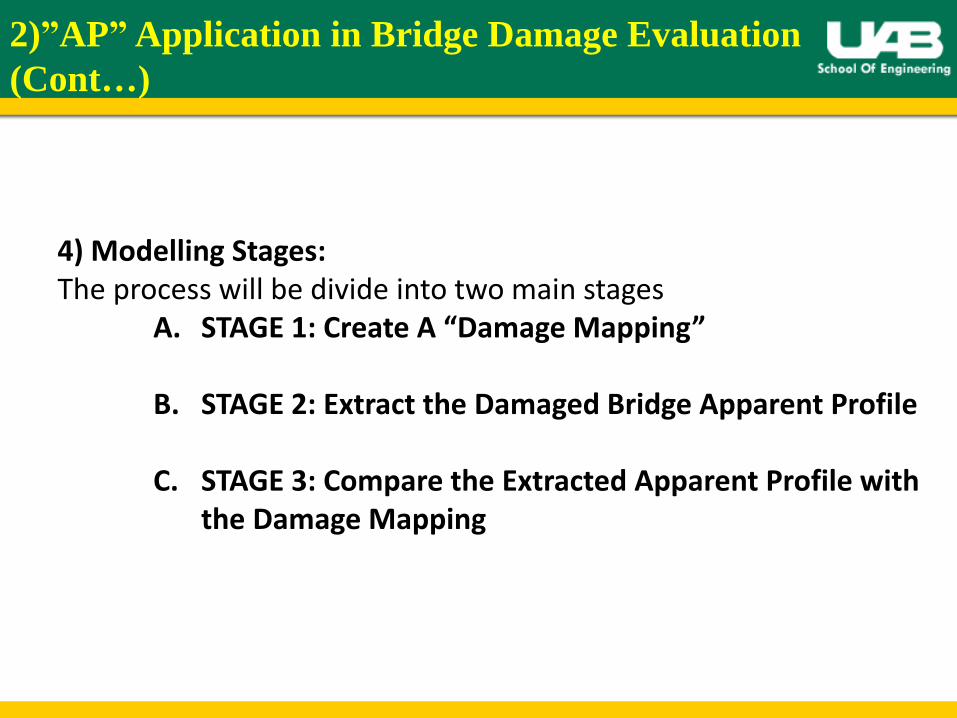
2)”AP” Application in Bridge Damage Evaluation
(Cont…)
4) Modelling Stages: The process will be divide into two main stages
A. STAGE 1: Create A “Damage Mapping”
B. STAGE 2: Extract the Damaged Bridge Apparent Profile
C. STAGE 3: Compare the Extracted Apparent Profile with the Damage Mapping

2)”AP” Application in Bridge Damage Evaluation:
STAGE 1 (Evaluate the Damage Mapping)
What is Damage Mapping?• Damage Mapping is a set of “Apparent Profiles” for different Damage
Values at different Damage Locations
• The process of creating the Damage Mapping is as follows
m2 acceleration
LS-Modelm1 acceleration
1) For Crack = 10%h (10% Damage)
2) For Crack = 20%h (20% Damage)
3) For Crack = 30%h (30% Damage)
4) For Crack = 40%h (40% Damage)
5) For Crack = 50%h (50% Damage)
1)Crack Located at 10% of bridge span
2) x=10% of h

2)”AP” Application in Bridge Damage Evaluation:
STAGE 1 (Evaluate the Damage Mapping) (Cont…)
What is Damage Mapping?• The processes repeated for different damage location
Crack Located at 20% of bridge span
Crack Located at 30% of bridge span
......... And So on then

2)”AP” Application in Bridge Damage Evaluation:
STAGE 1 (Evaluate the Damage Mapping) (Cont…)
Damage Mapping
1) For crack at 10%L 2) For crack at 20%L 3)For crack at 30%L
4) For crack at 40%L 5) For crack at 50%L 6)For crack at 60%L
7) For crack at 70%L 8) For crack at 80%L 9)For crack at 90%L

2)”AP” Application in Bridge Damage Evaluation:
STAGE 2 (Extract “AP” for Damaged Bridge)
B) Extract Bridge Apparent Profile : • As Described in the previous slides :
m2 acceleration
LS-Modelm1 acceleration
Apparent Profile For Damaged Bridge

2)”AP” Application in Bridge Damage Evaluation:
STAGE 3 (Compare Bridge “AP” with Damage Mapping )
1) For crack at 10%L 2) For crack at 20%L 3) For crack at 30%L
4) For crack at 40%L 5) For crack at 50%L 6) For crack at 60%L
7) For crack at 70%L 8) For crack at 80%L 9) For crack at 90%L

2)”AP” Application in Bridge Damage Evaluation:
STAGE 3 (Compare Bridge “AP” with Damage Mapping )
(Cont…)
2) For crack at 20%L
Bridge under Study
30% Damage
At 20% of bridge span
Result From Comparing “AP” with the Damage Mapping

1. The Apparent Profile shows to be good for smooth and rough profiles
2. The Apparent Profile shows to detect damage for both adopted damage criteria
3. The Apparent Profile can be used to evaluate the Damage value and location for bridges.
Conclusion

Questions

AP2AP1

For NO Roughness
For 1% Damping
Bridge Displacement under axle 1
Bridge Displacement under axle 2
For 2% Damping
Bridge Displacement under axle 1
Bridge Displacement under axle 2
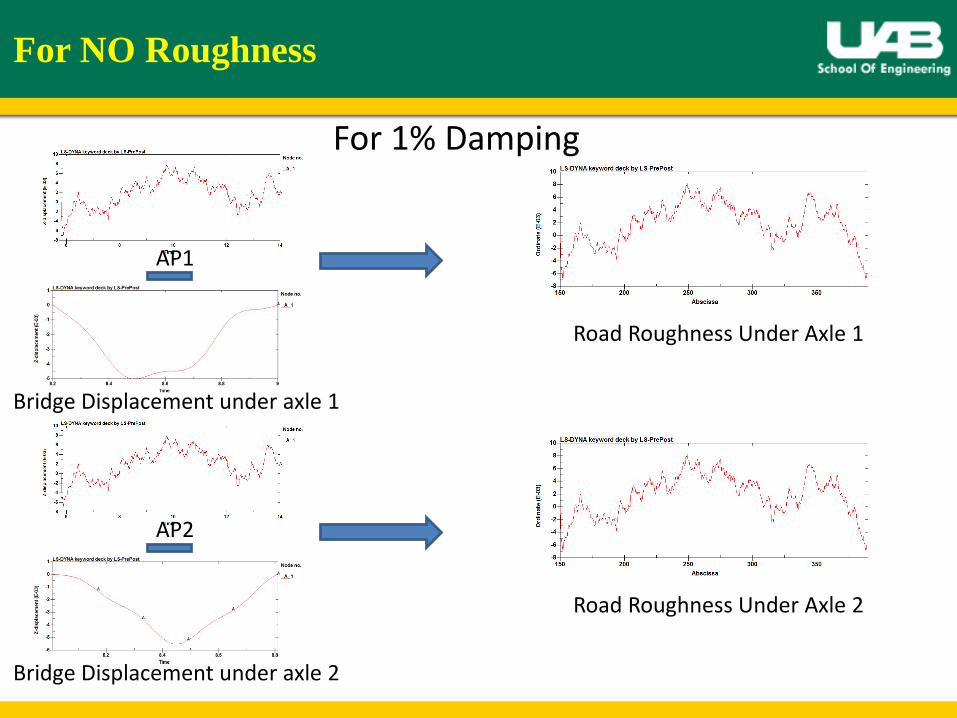
For NO Roughness
Bridge Displacement under axle 1
For 1% Damping
AP1
Road Roughness Under Axle 1
Bridge Displacement under axle 2
AP2
Road Roughness Under Axle 2