Embed Size (px)
Citation preview
Presenter: Dr. Asad J. KhattakBeaman Professor
Department of Civil & Environmental Engineering
The University of Tennessee, Knoxville
Driver Behavior at Highway-Rail Grade Crossings With Passive Traffic Controls
2014 Global Level Crossing SymposiumAugust 2014, Urbana, IL, USA
Jun Liu, Bryan Bartnik, Dr. Stephen Richards
- A Driving Simulator Study
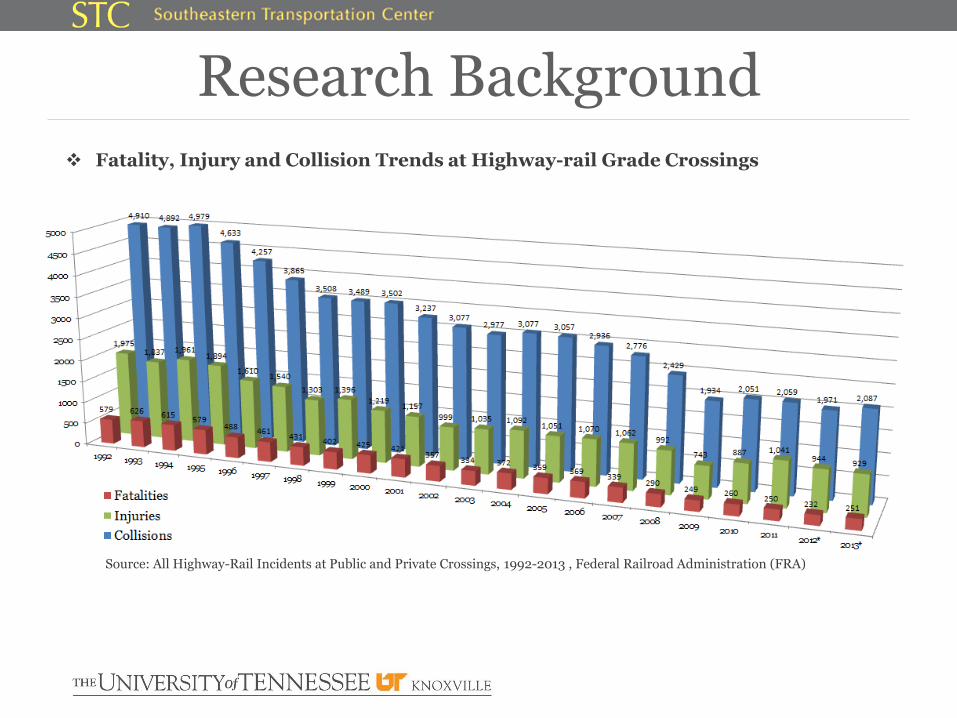
Research Background Fatality, Injury and Collision Trends at Highway-rail Grade Crossings
Source: All Highway-Rail Incidents at Public and Private Crossings, 1992-2013 , Federal Railroad Administration (FRA)
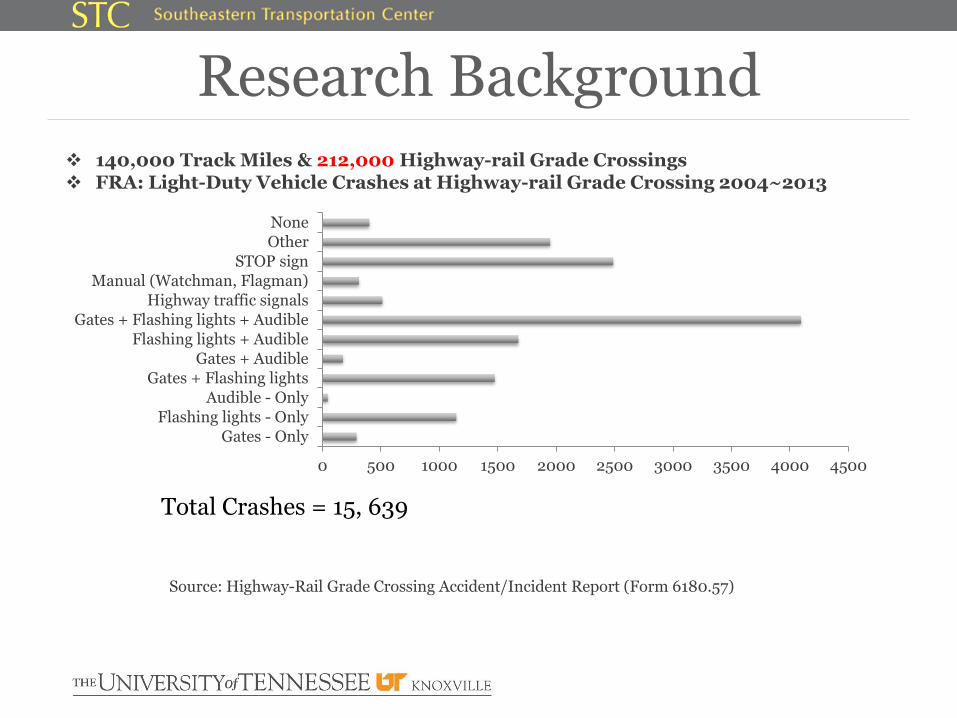
Research Background 140,000 Track Miles & 212,000 Highway-rail Grade Crossings FRA: Light-Duty Vehicle Crashes at Highway-rail Grade Crossing 2004~2013
Source: Highway-Rail Grade Crossing Accident/Incident Report (Form 6180.57)
0 500 1000 1500 2000 2500 3000 3500 4000 4500
Gates - Only
Flashing lights - Only
Audible - Only
Gates + Flashing lights
Gates + AudibleFlashing lights + Audible
Gates + Flashing lights + Audible
Highway traffic signals
Manual (Watchman, Flagman)
STOP sign
Other
None
Total Crashes = 15, 639
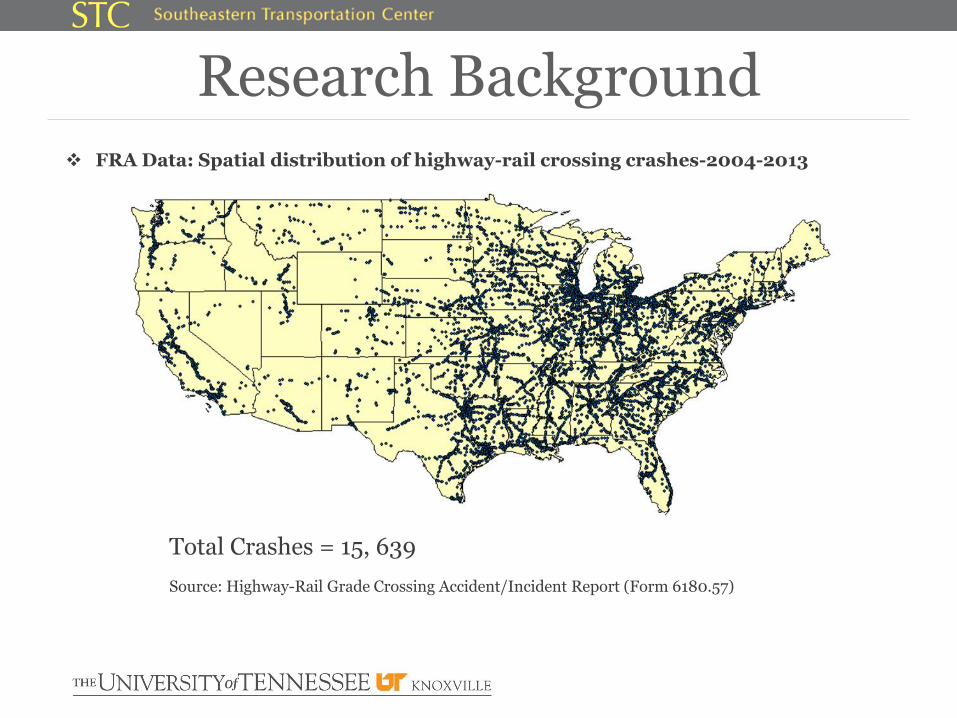
Research Background FRA Data: Spatial distribution of highway-rail crossing crashes-2004-2013
Source: Highway-Rail Grade Crossing Accident/Incident Report (Form 6180.57)
Total Crashes = 15, 639
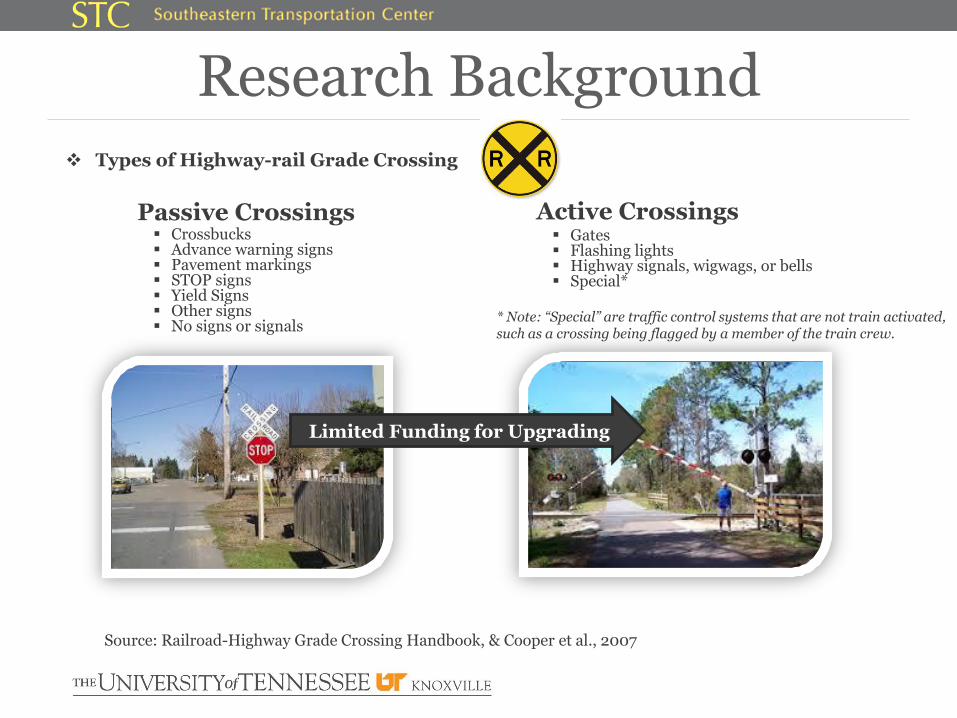
Research Background Types of Highway-rail Grade Crossing
Passive Crossings Active Crossings Crossbucks Advance warning signs Pavement markings STOP signs Yield Signs Other signs No signs or signals
Gates Flashing lights Highway signals, wigwags, or bells Special*
Source: Railroad-Highway Grade Crossing Handbook, & Cooper et al., 2007
* Note: “Special” are traffic control systems that are not train activated, such as a crossing being flagged by a member of the train crew.
Limited Funding for Upgrading
Issues High cost + Large # of passive crossings Not enough funding
Research on passive controls needed…
Low frequency of oncoming trains Hard to capture real crossing behaviors
Driving simulator: Behaviors at simulated crossings
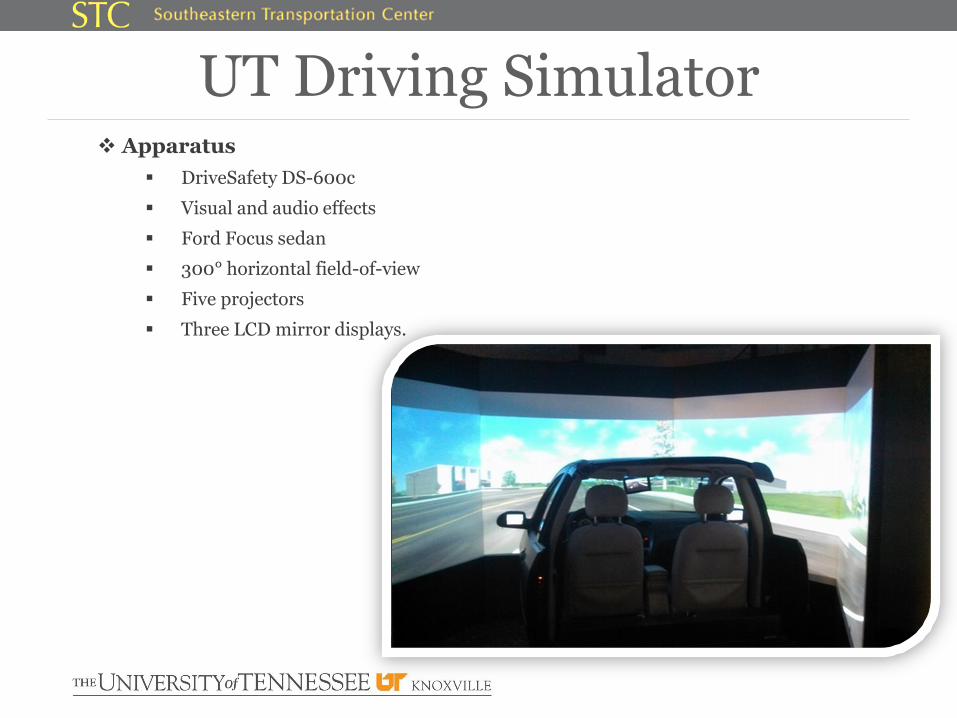
UT Driving Simulator Apparatus
DriveSafety DS-600c
Visual and audio effects
Ford Focus sedan
300° horizontal field-of-view
Five projectors
Three LCD mirror displays.
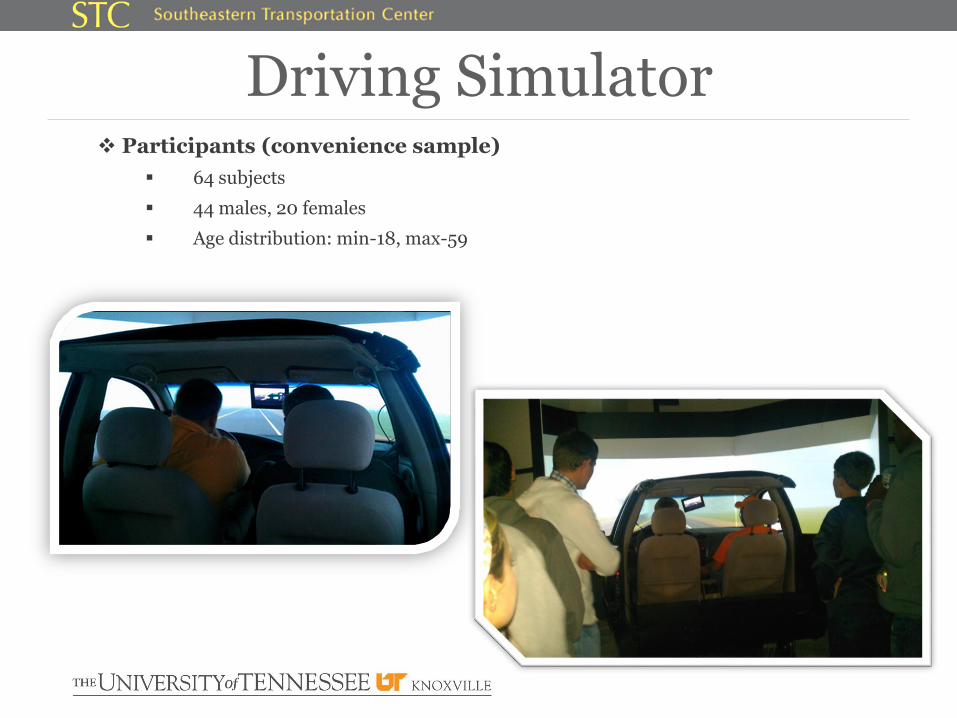
Driving Simulator Participants (convenience sample)
64 subjects
44 males, 20 females
Age distribution: min-18, max-59
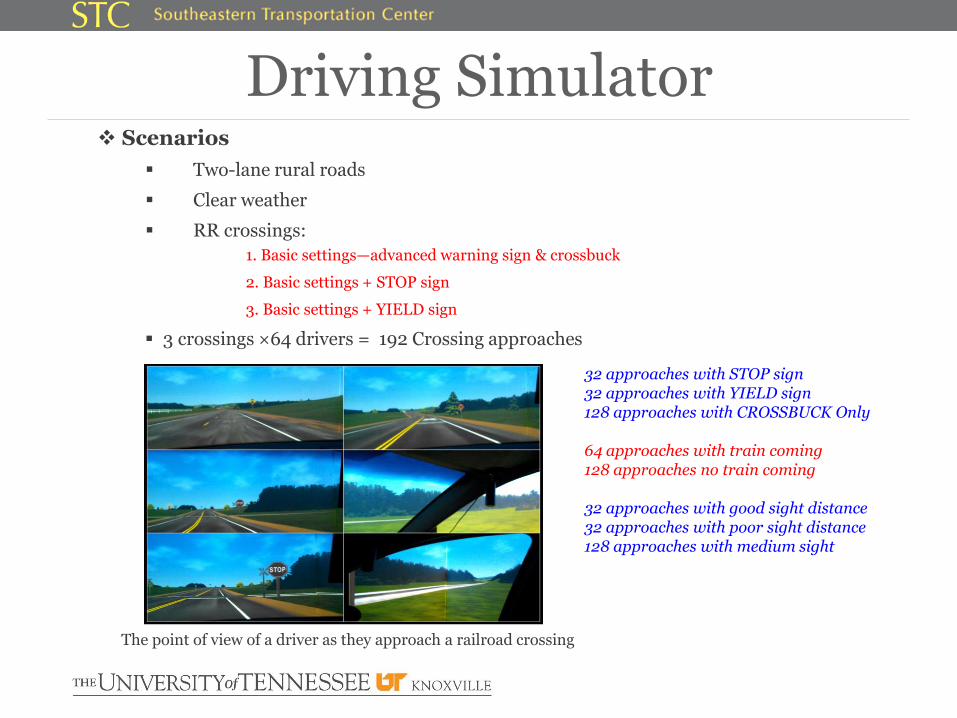
Driving Simulator Scenarios
Two-lane rural roads
Clear weather
RR crossings:
1. Basic settings—advanced warning sign & crossbuck
2. Basic settings + STOP sign
3. Basic settings + YIELD sign
3 crossings ×64 drivers = 192 Crossing approaches
The point of view of a driver as they approach a railroad crossing
32 approaches with STOP sign32 approaches with YIELD sign128 approaches with CROSSBUCK Only
64 approaches with train coming 128 approaches no train coming
32 approaches with good sight distance32 approaches with poor sight distance128 approaches with medium sight
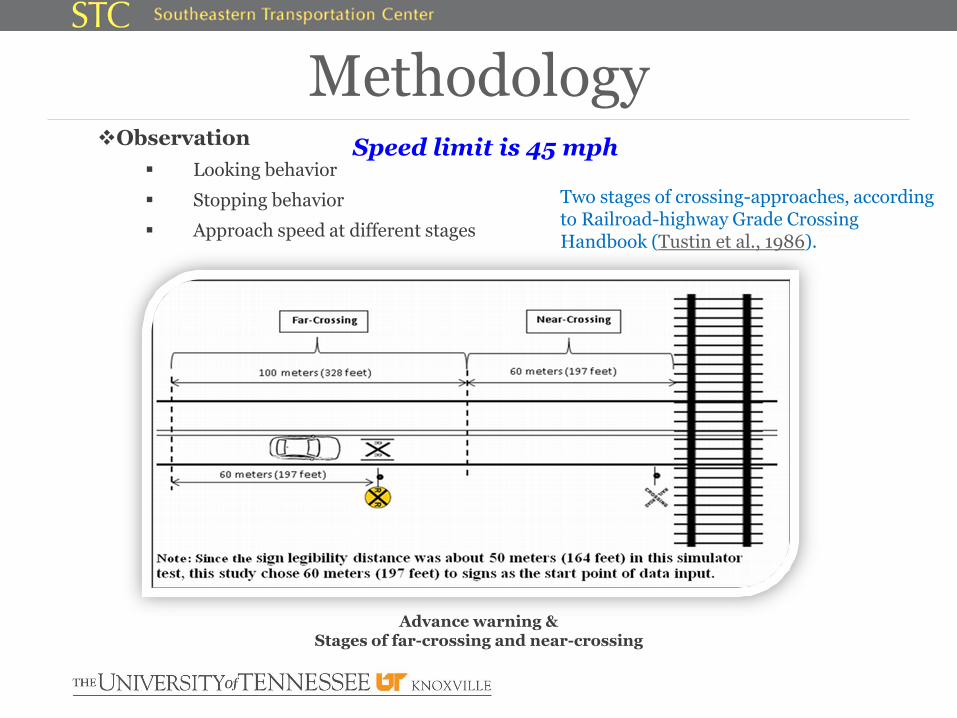
MethodologyObservation
Looking behavior
Stopping behavior
Approach speed at different stages
Advance warning & Stages of far-crossing and near-crossing
Two stages of crossing-approaches, according to Railroad-highway Grade Crossing Handbook (Tustin et al., 1986).
Speed limit is 45 mph
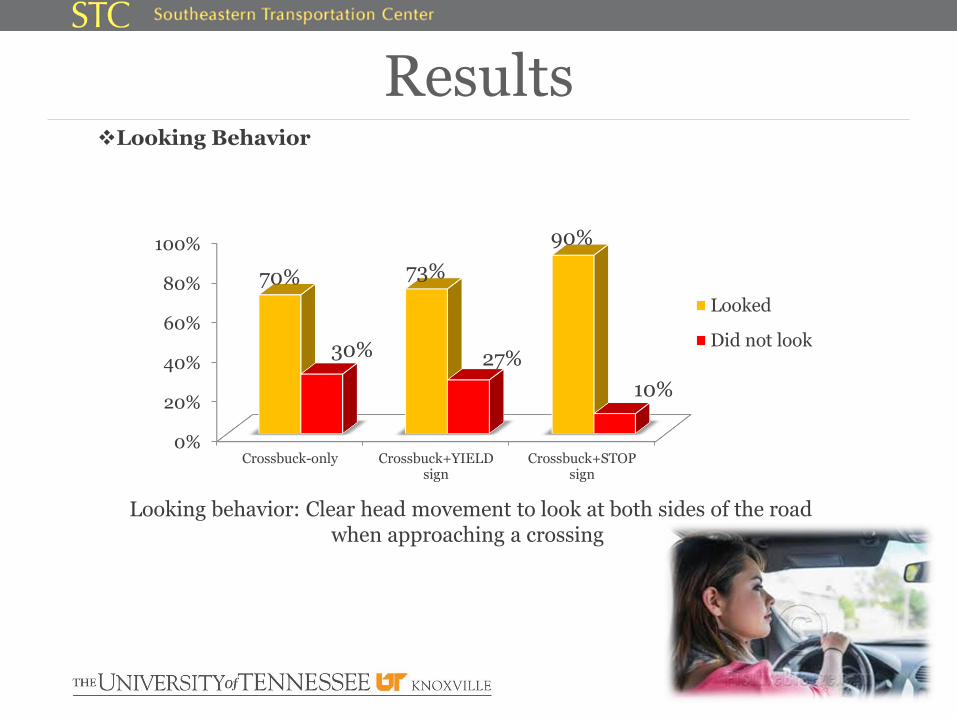
Looking Behavior
Results
0%
20%
40%
60%
80%
100%
Crossbuck-only Crossbuck+YIELDsign
Crossbuck+STOPsign
70% 73%
90%
30% 27%
10%
Looked
Did not look
Looking behavior: Clear head movement to look at both sides of the road when approaching a crossing
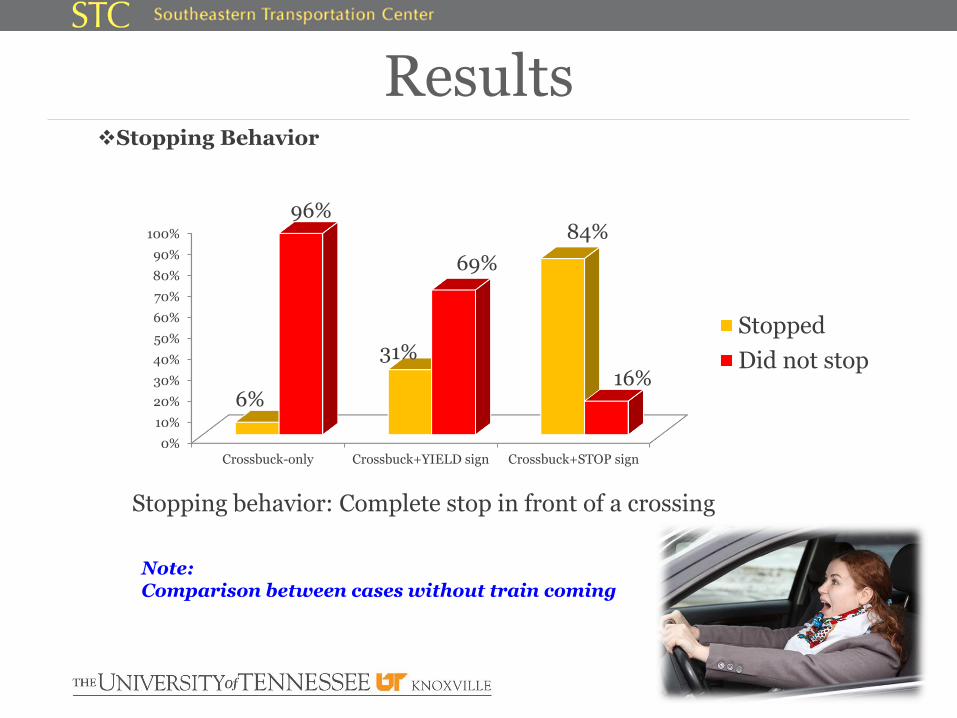
Stopping Behavior
Results
Stopping behavior: Complete stop in front of a crossing
0%
10%
20%
30%
40%
50%
60%
70%
80%
90%
100%
Crossbuck-only Crossbuck+YIELD sign Crossbuck+STOP sign
6%
31%
84%96%
69%
16%
Stopped
Did not stop
Note: Comparison between cases without train coming
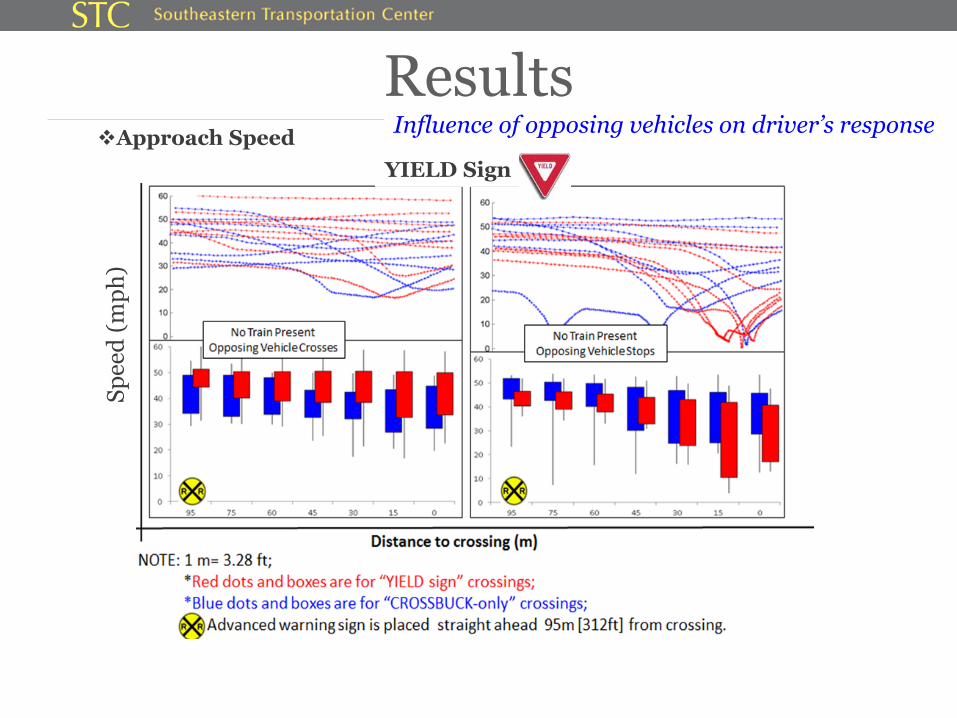
Approach Speed
Results
YIELD Sign
Sp
eed
(m
ph
)Influence of opposing vehicles on driver’s response
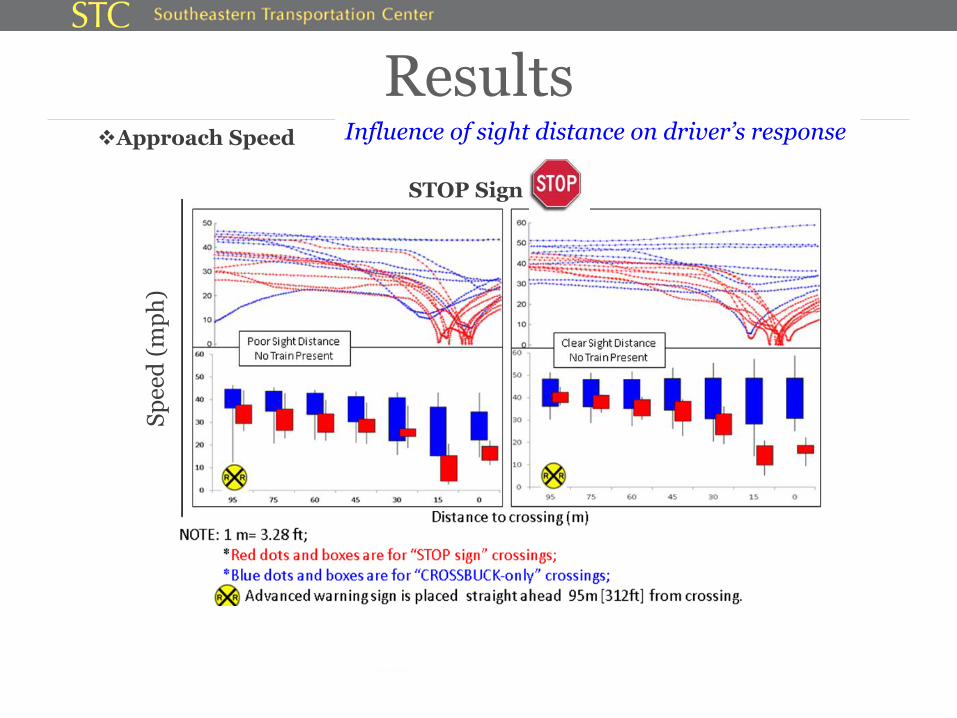
Approach Speed
Results
STOP Sign
Sp
eed
(m
ph
)Influence of sight distance on driver’s response
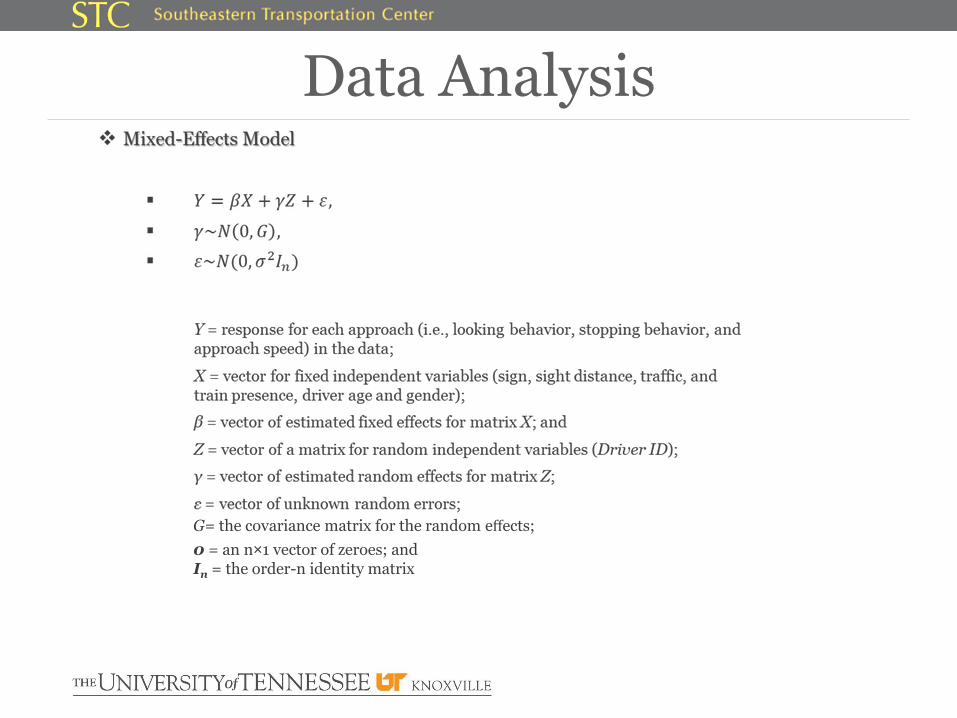
Data Analysis
0 = an n×1 vector of zeroes; and In = the order-n identity matrix
G= the covariance matrix for the random effects;
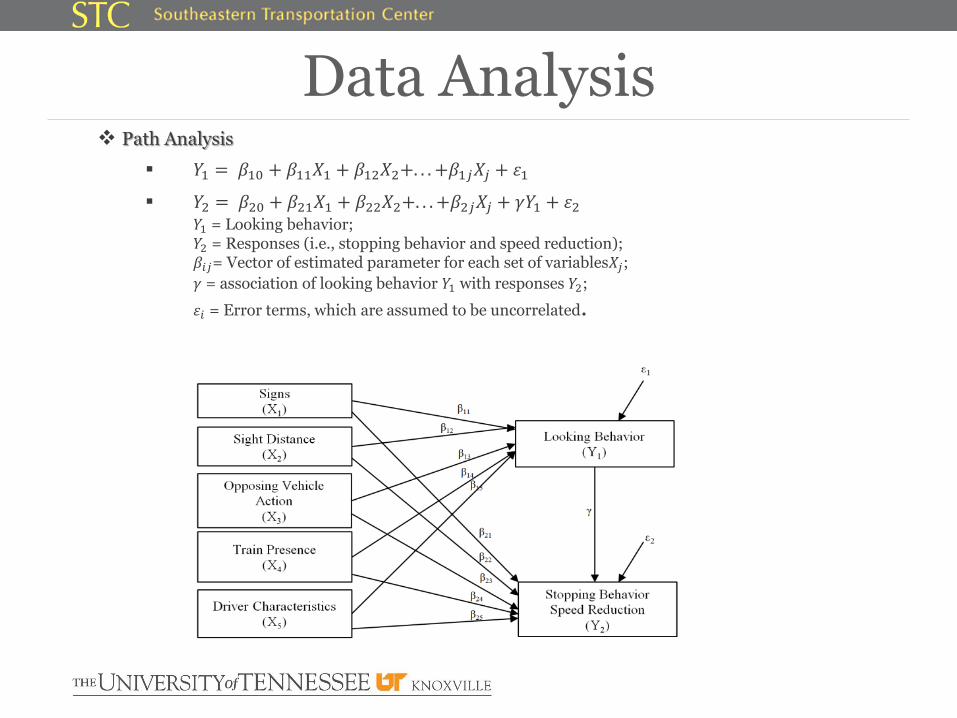
Path Analysis
𝑌1 = 𝛽10 + 𝛽11𝑋1 + 𝛽12𝑋2+. . . +𝛽1𝑗𝑋𝑗 + 𝜀1
𝑌2 = 𝛽20 + 𝛽21𝑋1 + 𝛽22𝑋2+. . . +𝛽2𝑗𝑋𝑗 + 𝛾𝑌1 + 𝜀2𝑌1 = Looking behavior;𝑌2 = Responses (i.e., stopping behavior and speed reduction);𝛽𝑖𝑗= Vector of estimated parameter for each set of variables𝑋𝑗;
𝛾 = association of looking behavior 𝑌1 with responses 𝑌2;
𝜀𝑖 = Error terms, which are assumed to be uncorrelated.
Data Analysis
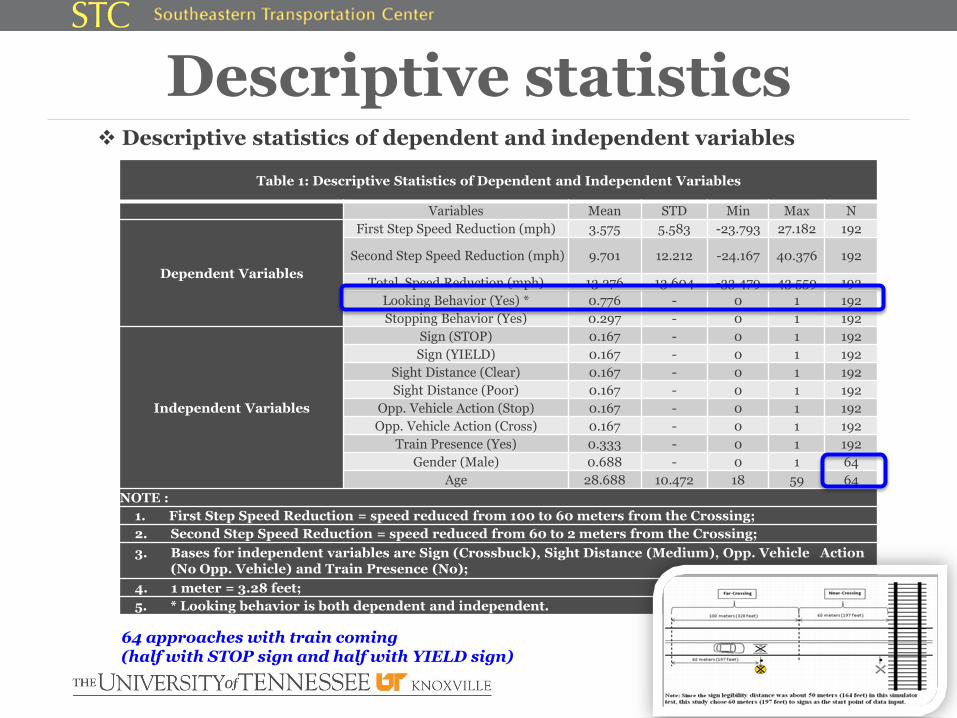
Descriptive statistics of dependent and independent variables
Descriptive statistics
Table 1: Descriptive Statistics of Dependent and Independent Variables
Variables Mean STD Min Max N
Dependent Variables
First Step Speed Reduction (mph) 3.575 5.583 -23.793 27.182 192
Second Step Speed Reduction (mph) 9.701 12.212 -24.167 40.376 192
Total Speed Reduction (mph) 13.276 13.604 -33.479 43.559 192
Looking Behavior (Yes) * 0.776 - 0 1 192
Stopping Behavior (Yes) 0.297 - 0 1 192
Independent Variables
Sign (STOP) 0.167 - 0 1 192
Sign (YIELD) 0.167 - 0 1 192
Sight Distance (Clear) 0.167 - 0 1 192
Sight Distance (Poor) 0.167 - 0 1 192
Opp. Vehicle Action (Stop) 0.167 - 0 1 192
Opp. Vehicle Action (Cross) 0.167 - 0 1 192
Train Presence (Yes) 0.333 - 0 1 192
Gender (Male) 0.688 - 0 1 64
Age 28.688 10.472 18 59 64
NOTE :
1. First Step Speed Reduction = speed reduced from 100 to 60 meters from the Crossing;
2. Second Step Speed Reduction = speed reduced from 60 to 2 meters from the Crossing;
3. Bases for independent variables are Sign (Crossbuck), Sight Distance (Medium), Opp. Vehicle Action (No Opp. Vehicle) and Train Presence (No);
4. 1 meter = 3.28 feet;
5. * Looking behavior is both dependent and independent.
64 approaches with train coming(half with STOP sign and half with YIELD sign)
Looking Behavior and Stopping Behavior
Modeling Results
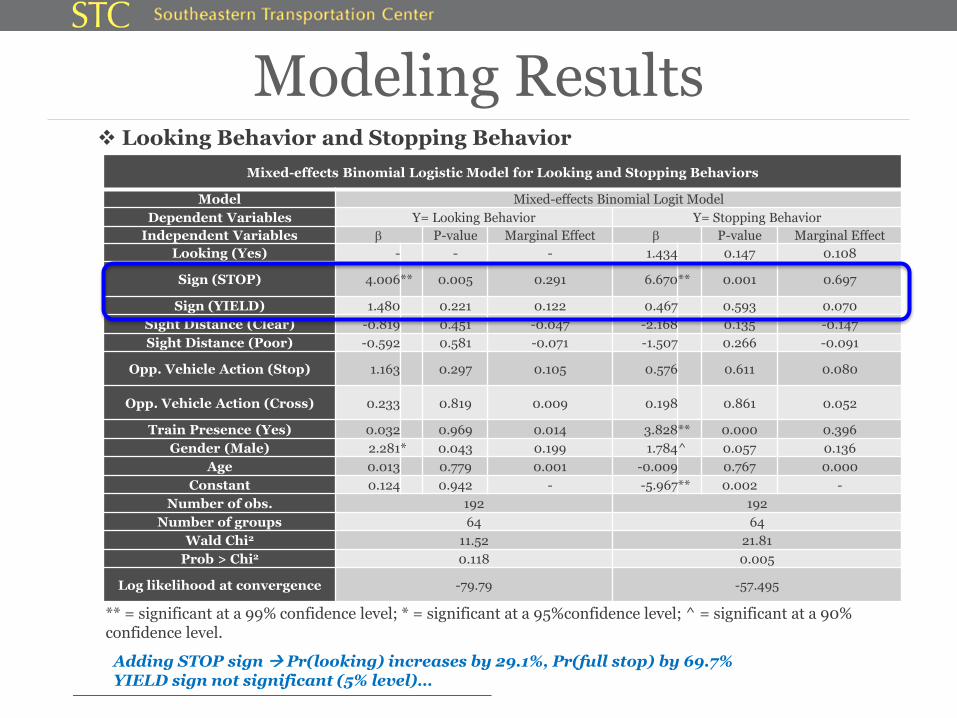
Mixed-effects Binomial Logistic Model for Looking and Stopping Behaviors
Model Mixed-effects Binomial Logit Model
Dependent Variables Y= Looking Behavior Y= Stopping Behavior
Independent Variables b P-value Marginal Effect b P-value Marginal Effect
Looking (Yes) - - - 1.434 0.147 0.108
Sign (STOP) 4.006** 0.005 0.291 6.670** 0.001 0.697
Sign (YIELD) 1.480 0.221 0.122 0.467 0.593 0.070
Sight Distance (Clear) -0.819 0.451 -0.047 -2.168 0.135 -0.147
Sight Distance (Poor) -0.592 0.581 -0.071 -1.507 0.266 -0.091
Opp. Vehicle Action (Stop) 1.163 0.297 0.105 0.576 0.611 0.080
Opp. Vehicle Action (Cross) 0.233 0.819 0.009 0.198 0.861 0.052
Train Presence (Yes) 0.032 0.969 0.014 3.828** 0.000 0.396
Gender (Male) 2.281* 0.043 0.199 1.784^ 0.057 0.136
Age 0.013 0.779 0.001 -0.009 0.767 0.000
Constant 0.124 0.942 - -5.967** 0.002 -
Number of obs. 192 192
Number of groups 64 64
Wald Chi2 11.52 21.81
Prob > Chi2 0.118 0.005
Log likelihood at convergence -79.79 -57.495
** = significant at a 99% confidence level; * = significant at a 95%confidence level; ^ = significant at a 90% confidence level.
Adding STOP sign Pr(looking) increases by 29.1%, Pr(full stop) by 69.7% YIELD sign not significant (5% level)…
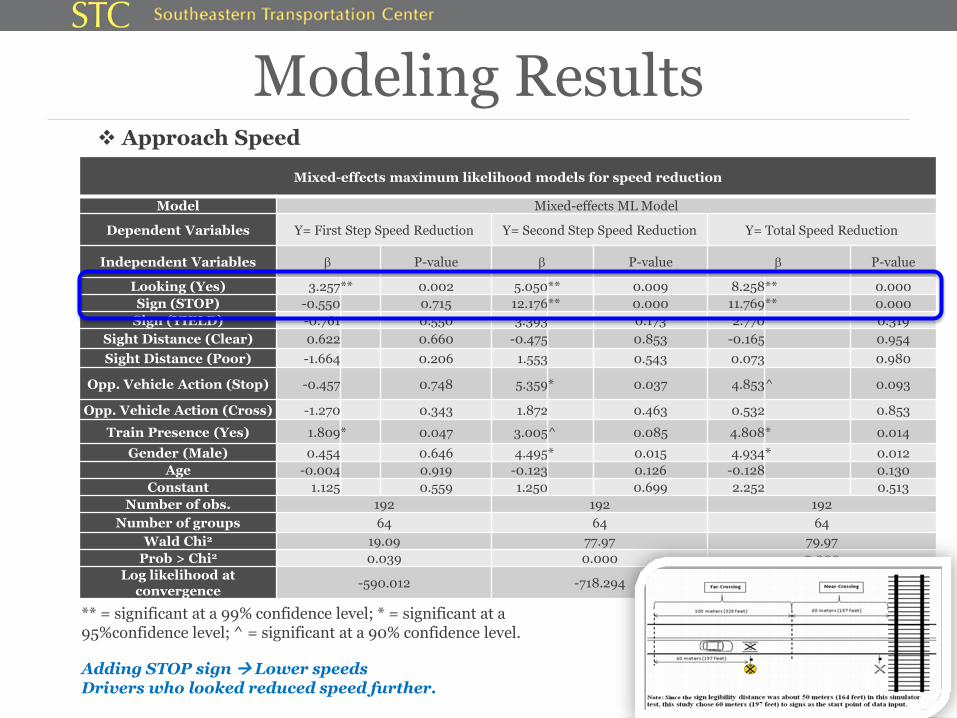
Mixed-effects maximum likelihood models for speed reduction
Model Mixed-effects ML Model
Dependent Variables Y= First Step Speed Reduction Y= Second Step Speed Reduction Y= Total Speed Reduction
Independent Variables b P-value b P-value b P-value
Looking (Yes) 3.257** 0.002 5.050** 0.009 8.258** 0.000
Sign (STOP) -0.550 0.715 12.176** 0.000 11.769** 0.000
Sign (YIELD) -0.761 0.550 3.393 0.173 2.770 0.319
Sight Distance (Clear) 0.622 0.660 -0.475 0.853 -0.165 0.954
Sight Distance (Poor) -1.664 0.206 1.553 0.543 0.073 0.980
Opp. Vehicle Action (Stop) -0.457 0.748 5.359* 0.037 4.853^ 0.093
Opp. Vehicle Action (Cross) -1.270 0.343 1.872 0.463 0.532 0.853
Train Presence (Yes) 1.809* 0.047 3.005^ 0.085 4.808* 0.014
Gender (Male) 0.454 0.646 4.495* 0.015 4.934* 0.012
Age -0.004 0.919 -0.123 0.126 -0.128 0.130
Constant 1.125 0.559 1.250 0.699 2.252 0.513
Number of obs. 192 192 192
Number of groups 64 64 64
Wald Chi2 19.09 77.97 79.97
Prob > Chi2 0.039 0.000 0.000
Log likelihood at convergence
-590.012 -718.294 -738.468
Approach Speed
Modeling Results
** = significant at a 99% confidence level; * = significant at a 95%confidence level; ̂ = significant at a 90% confidence level.
Adding STOP sign Lower speedsDrivers who looked reduced speed further.
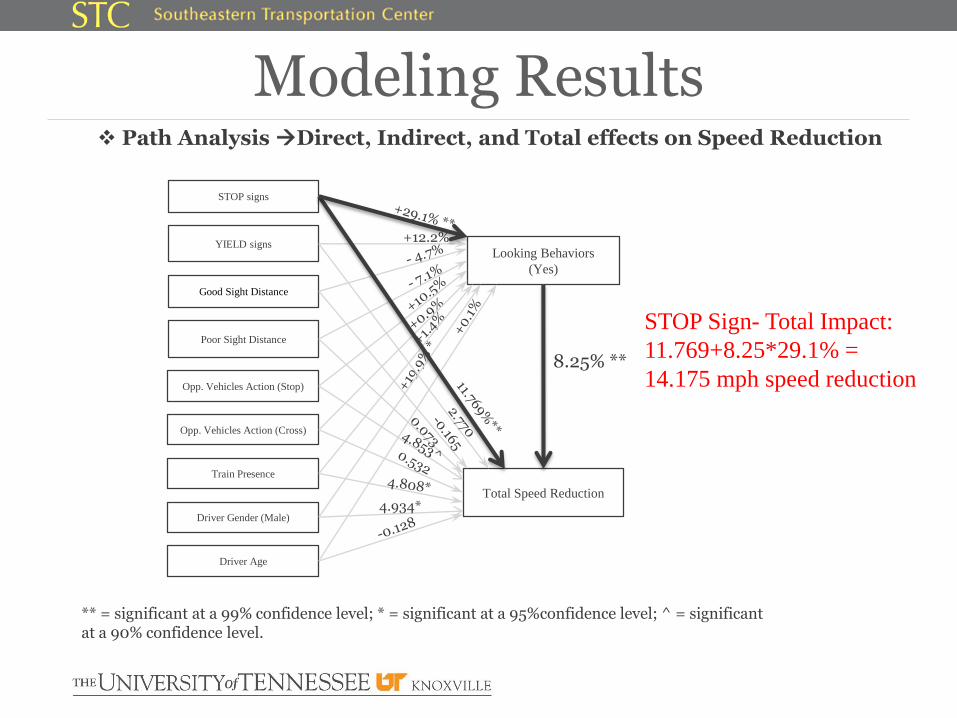
Path Analysis Direct, Indirect, and Total effects on Speed Reduction
Modeling Results
** = significant at a 99% confidence level; * = significant at a 95%confidence level; ^ = significant at a 90% confidence level.
STOP signs
Opp. Vehicles Action (Stop)
Good Sight Distance
YIELD signs
Total Speed Reduction
Looking Behaviors
(Yes)
Poor Sight Distance
Opp. Vehicles Action (Cross)
Train Presence
Driver Gender (Male)
Driver Age
+12.2%
8.25% **
4.934*
STOP Sign- Total Impact:
11.769+8.25*29.1% =
14.175 mph speed reduction
Conclusions STOP signs Hi Pr (Looking for oncoming train)
STOP signs Lo Pr (Approach speed)
YIELD signs Behavior very similarly to CROSSBUCK signs
Path analysis Deeper understanding of driver responses at
crossings through looking behaviors
Mixed-Effects Regression Model Driving simulator studies
which involve human subjects making repeated observations
Author ContactsJun LiuDepartment of Civil & Environmental EngineeringThe University of Tennessee311 John Tickle Building, Knoxville, TN 37996Phone: (865)456-8896Email: [email protected]
Bryan BartnikDepartment of Civil & Environmental EngineeringThe University of Tennessee311 John Tickle Building, Knoxville, TN 37996Phone: (815)865-3913Email: [email protected]
Asad J. Khattak, Ph.D.Beaman ProfessorDepartment of Civil & Environmental EngineeringThe University of Tennessee322 John Tickle Building, Knoxville, TN 37996Phone: (865)974-7792, Fax: (865)974-2669Email: [email protected]
Stephen H. Richards, Ph.D.Director, Southeastern Transportation CenterCenter for Transportation ResearchThe University of Tennessee309 Conference Center Building, Knoxville, TN 37996Phone: (865) 382-0123 Email: [email protected]
ACKNOWLEDGEMENTS Southeastern Transportation Center, the Region 4 University Transportation Center USDOT: Research and Innovative Technology Administration, UTC program


![welcome [railtec.illinois.edu]railtec.illinois.edu/wp/wp-content/uploads/pdf-archive/... · 2018. 2. 27. · Per and Poly Fluoralkyl Substances (PFAS) and the Railroad Industry. As](https://img.pdfslide.net/doc/110x75/60afd7cda1ba645bf236e91f/welcome-2018-2-27-per-and-poly-fluoralkyl-substances-pfas-and-the-railroad.jpg)