Embed Size (px)
Citation preview

FHWA-NJ–2007-020
Driver’s License Suspensions, Impacts and Fairness Study
FINAL REPORT
August 2007
Submitted by:
Jon A. Carnegie, AICP/PP Alan M. Voorhees Transportation Center
Rutgers, The State University of New Jersey New, Brunswick, New Jersey 08901
NJDOT Research Project Manager Edward S. Kondrath
In cooperation with
New Jersey Department of Transportation
Bureau of Research
New Jersey Motor Vehicle Commission
And
U.S. Department of Transportation Federal Highway Administration

This page intentionally left blank.

DISCLAIMER STATEMENT
The contents of this report reflect the views of the authors who are responsible for the facts and the accuracy of the data presented herein. The contents do not necessarily reflect the official views or policies of the New Jersey Department of Transportation, the New Jersey Motor Vehicle Commission or the Federal Highway Administration. This report does not constitute a standard, specification, or regulation.

This page intentionally left blank.

TECHNICAL REPORT STANDARD TITLE PAGE 1. Report No. 2.Government Accession No. 3. Recipient’s Catalog No. FHWA NJ-2007-020
4. Title and Subtitle 5. Report Date August 2007 6. Performing Organization Code
Driver’s License Suspensions, Impacts and Fairness Study
7. Author(s) 8. Performing Organization Report No. Carnegie, Jon A.
9. Performing Organization Name and Address 10. Work Unit No.
11. Contract or Grant No.
Alan M. Voorhees Transportation Center Rutgers, The State University of New Jersey 33 Livingston Avenue New Brunswick, NJ 08901
12. Sponsoring Agency Name and Address 13. Type of Report and Period Covered
14. Sponsoring Agency Code
15. Supplementary Notes
16. Abstract In New Jersey, as is the case in many other jurisdictions, the reasons for driver’s license suspension are diverse, complex and sometimes interrelated. License suspension in New Jersey is no longer only used to punish habitual bad driving. It is widely used as a punishment or deterrent for things completely unrelated to driving and as a means to compel appearance in court and/or payment of various fines, fees, and other financial obligations. Suspension patterns indicate that certain segments of the licensed driver population are more likely to be suspended than others. For all reasons, except suspensions for DUI and accumulation of motor vehicle points, drivers residing in urban and lower income zip codes are overrepresented. Suspension rates among male drivers residing in lower income areas are consistently the highest. The obvious and most direct impact of license suspension is loss of personal mobility. However, suspension may also have collateral and/or unintended consequences such as job loss, difficulty in finding employment, and reduced income. Consequences can also include other financial impacts, such as increased insurance premiums and other costs associated with suspension; as well as psychological and social impacts such as loss of freedom, increased stress, and family strain. Despite a limited menu of options to address the unintended or collateral impacts of suspension, there appear to be areas of possible reform in New Jersey. These include: reexamining the purpose and need for the NJ insurance surcharge program; assessing the fairness of the Parking Offenses Adjudication Act; addressing issues that contribute to license suspensions for failing to maintain proper insurance; and considering the creation of a restricted-use license program for at least certain suspended drivers under limited circumstances.
17. Key Words 18. Distribution Statement Driver license suspension, Impacts of license suspension, Restricted-use license
19. Security Classif (of this report) 20. Security Classif. (of this page) 21. No of Pages 22. Price
Unclassified Unclassified
Form DOT F 1700.7 (8-69)
Federal Highway Administration U.S. Department of Transportation Washington, D.C.
New Jersey Department of Transportation PO 600 Trenton, NJ 08625

This page intentionally left blank.

ii
ACKNOWLEDGMENTS
The author wishes to thank the following individuals without whom this study would not have been possible:
Members of the Voorhees Transportation Center’s Research Team Dr. Richard Brail, Research Advisor Jianye Chen, Graduate Research Assistant Dr. G. Lawrence Farmer, Research Advisor Aaron Kardon, Graduate Research Assistant Andrea Lubin, Project Manager Khabirah Myers, Legal Research Assistant Jeffrey Perlman, Graduate Research Assistant Yustina, Saleh, Graduate Research Assistant
Members of the Research Selection and Implementation Panel
Donald Borowski, NJMVC Carol Hollows, NJMVC Edward Kondrath, NJDOT Howard Pollak, NJMVC Robert Sasor, NJDOT
Staff from the New Jersey Motor Vehicle Commission
Gordon Deal, NJMVC Tom Flynn, NJMVC Lee Jackson, NJMVC Nancy King, NJMVC Sandra McCoy, NJMVC Jeffrey Pistol, NJMVC

iii
This page left intentionally blank.
iv
TABLE OF CONTENTS
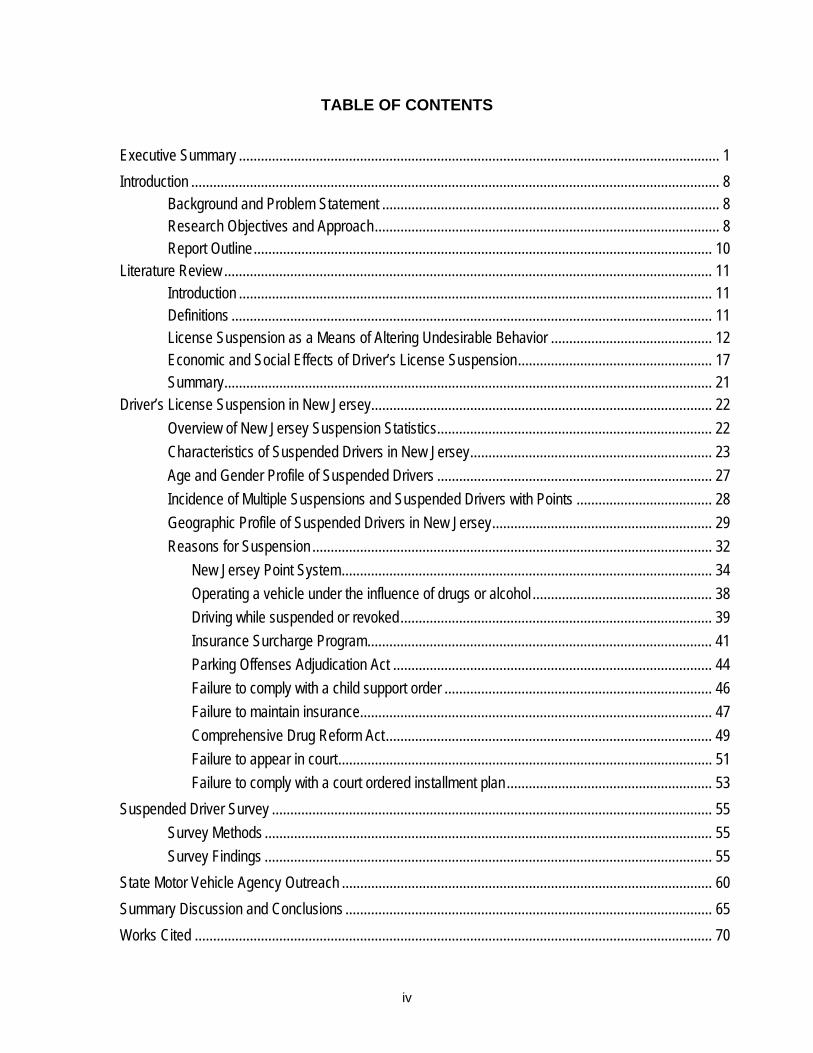
Executive Summary ................................................................................................................................... 1 Introduction ................................................................................................................................................ 8
Background and Problem Statement ............................................................................................ 8 Research Objectives and Approach.............................................................................................. 8 Report Outline............................................................................................................................. 10
Literature Review ..................................................................................................................................... 11 Introduction ................................................................................................................................. 11 Definitions ................................................................................................................................... 11 License Suspension as a Means of Altering Undesirable Behavior ............................................ 12 Economic and Social Effects of Driver’s License Suspension..................................................... 17 Summary..................................................................................................................................... 21
Driver’s License Suspension in New Jersey............................................................................................. 22 Overview of New Jersey Suspension Statistics........................................................................... 22 Characteristics of Suspended Drivers in New Jersey.................................................................. 23 Age and Gender Profile of Suspended Drivers ........................................................................... 27 Incidence of Multiple Suspensions and Suspended Drivers with Points ..................................... 28 Geographic Profile of Suspended Drivers in New Jersey............................................................ 29 Reasons for Suspension ............................................................................................................. 32
New Jersey Point System..................................................................................................... 34 Operating a vehicle under the influence of drugs or alcohol ................................................. 38 Driving while suspended or revoked..................................................................................... 39 Insurance Surcharge Program.............................................................................................. 41 Parking Offenses Adjudication Act ....................................................................................... 44 Failure to comply with a child support order ......................................................................... 46 Failure to maintain insurance................................................................................................ 47 Comprehensive Drug Reform Act......................................................................................... 49 Failure to appear in court...................................................................................................... 51 Failure to comply with a court ordered installment plan........................................................ 53
Suspended Driver Survey ........................................................................................................................ 55 Survey Methods .......................................................................................................................... 55 Survey Findings .......................................................................................................................... 55
State Motor Vehicle Agency Outreach ..................................................................................................... 60 Summary Discussion and Conclusions .................................................................................................... 65 Works Cited ............................................................................................................................................. 70

v
LIST OF TABLES
Table ES1: Suspension rates by area type and income class (May 2004)....................................................5 Table 1: Number of suspensions ordered or confirmed by MVC annually...................................................23 Table 2: Number of suspended drivers by gender and age group (May 2004) ...........................................27 Table 3: Suspension rates in other states ...................................................................................................28 Table 4: Incidence of multiple suspensions among suspended drivers (May 2004)................................... 29 Table 5: Point accumulation by suspended drivers (May 2004) .................................................................29 Table 6: Distribution of NJ licensed drivers by area type and income class (May 2004) .............................30 Table 7: Distribution of suspended drivers by area type and income class (May 2004) .............................30 Table 8: Suspension rates by area type and income class (May 2004) .....................................................32 Table 9: Average number of suspensions ordered/confirmed by MVC annually – Top twelve
“reasons” ........................................................................................................................................33 Table 10: Non-point violation events recorded annually by MVC ...............................................................34 Table 11: New Jersey point schedule .........................................................................................................35 Table 12: Suspension rates by area type and income – Point accumulation and other driving-
related reasons, excluding DUI (May 2004) ...................................................................................37 Table 13: Suspension rates by area type and income – Operating a motor vehicle under the
influence of alcohol or drugs (DUI) (May 2004) ..............................................................................39 Table 14: Suspension rates by area type and income – Driving while suspended or revoked (May
2004) ..............................................................................................................................................40 Table 15: Schedule of fines and penalties for driving while suspended/revoked.........................................41 Table 16: Offenses subject to insurance surcharge ....................................................................................42 Table 17: Suspension rates by area type and income – Non payment of MVC insurance
surcharges (May 2004) .................................................................................................................. 43 Table 18: Suspension rates by area type and income – Parking Offenses Adjudication Act (POAA)
(May 2004) .....................................................................................................................................45 Table 19: Suspension rates by area type and income – Failure to comply with a child support order
(May 2004)......................................................................................................................................47 Table 20: Suspension rates by area type and income – Failure to maintain proper insurance (May
2004) ..............................................................................................................................................49 Table 21: Suspension rates by area type and income – Drug offenses under the Comprehensive
Drug Reform Act (May 2004) .........................................................................................................50 Table 22: Suspension rates by area type and income – Failure to appear in court to answer a
summons for a motor vehicle moving violation (May 2004) ...........................................................52

vi
Table 23: Suspension rates by area type and income – Failure to appear in court to answer a summons issued for other non-driving reasons, excluding POAA (May 2004)................................53
Table 24: Suspension rates by area type and income – Failure to comply with a court ordered installment payment plan (May 2004) ............................................................................................54
Table 25: Economic impacts of license suspension across income groups. ...............................................57 Table 26: Economic impacts of license suspension across age groups......................................................57 Table 27: Summary of restricted use license programs .........................................................................63-64
LIST OF FIGURES Figure ES1: Proportion of suspended drivers by reason and area type – Income (2004) .............................4 Figure ES2: Proportion of suspended drivers by reason and area type – Population density (2004)............5 Figure 1: Ten year history of suspensions ordered or confirmed by MVC...................................................23 Figure 2: New Jersey Population Density (2000) ........................................................................................25 Figure 3: New Jersey Median Household Income (2000)............................................................................26 Figure 4: Proportion of suspended drivers by reason and area type – Income (2004) ................................31 Figure 5: Proportion of suspended drivers by reason and area type – Population density (2004) ..............31 Figure 6: Parking tickets pending over 60 days...........................................................................................44
Volume 2: Technical Appendices:
Appendix A: State Agency Outreach – Summary Report, Individual State Interview
Reports Appendix B: Suspended Driver Survey Questionnaire
NOTE: Volume 2 is available upon request as a separate document only.

vii
This page intentionally left blank.

1
EXECUTIVE SUMMARY
Introduction and Background
At any given time, approximately 300,000 (less than 5 percent) of the licensed drivers in New Jersey have their driving privileges suspended. Suspensions occur for a variety of reasons, both driving and non-driving related. Some estimates indicate that fifty percent of people with suspended driver’s licenses had their licenses suspended for reasons other than how safely they operate a vehicle. In addition, there is the perception that there has been a marked increase in suspensions, primarily for failing to pay fees, fines, surcharges, or other financial obligations rather than safe driving issues. Furthermore there is some evidence that it is more difficult for poorer drivers to pay the debt they owe to recover their driver’s licenses. If the debt is not paid on time, additional interest and penalties accrue, resulting in a decreased likelihood that the debt will ever be paid and that the individual will regain their driver’s license. There is a belief that this cycle may push poorer individuals out of jobs because many jobs are only accessible by personal automobile. Research is needed to analyze and assess patterns of license suspension in New Jersey and to investigate the impacts and fairness of New Jersey’s driver’s license suspension program.
Research Objectives and Approach
The objectives of the study were to:
1. Document the extent and nature of driver’s license suspension in New Jersey;
2. Determine the motor safety, financial, socio-economic, geographic and insurance impacts of license suspension; and
3. Examine methods for reducing or eliminating negative or unintended impacts of driver’s license suspension.
The research program undertaken to achieve these objectives included a review of national literature, key informant interviews, an analysis of driver history data provided by the NJ Motor Vehicle Commission, a survey of state agency suspension practices, an inventory of restricted-use license programs used in other states, and a survey of suspended drivers in New Jersey.
Key Findings
New Jersey has approximately six million licensed drivers. The vast majority of these drivers remain violation and suspension free throughout their driving years. Only a small percentage of drivers (five percent) have their driving privileges suspended or
2
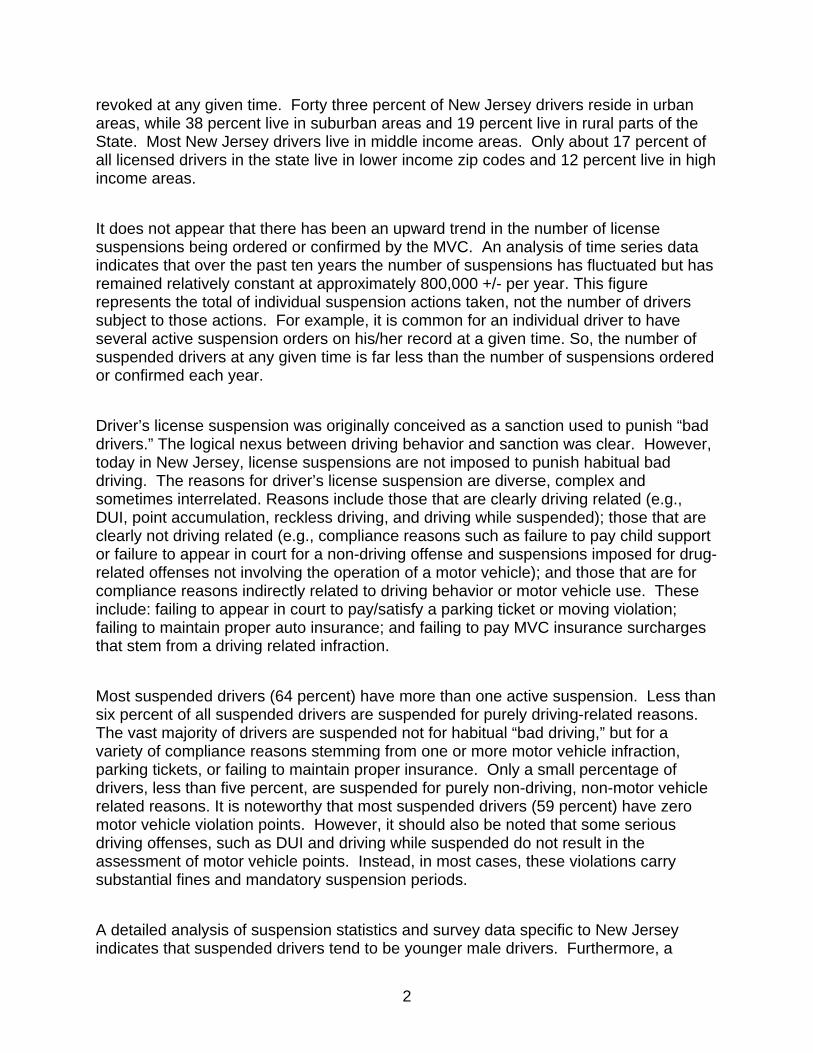
revoked at any given time. Forty three percent of New Jersey drivers reside in urban areas, while 38 percent live in suburban areas and 19 percent live in rural parts of the State. Most New Jersey drivers live in middle income areas. Only about 17 percent of all licensed drivers in the state live in lower income zip codes and 12 percent live in high income areas.
It does not appear that there has been an upward trend in the number of license suspensions being ordered or confirmed by the MVC. An analysis of time series data indicates that over the past ten years the number of suspensions has fluctuated but has remained relatively constant at approximately 800,000 +/- per year. This figure represents the total of individual suspension actions taken, not the number of drivers subject to those actions. For example, it is common for an individual driver to have several active suspension orders on his/her record at a given time. So, the number of suspended drivers at any given time is far less than the number of suspensions ordered or confirmed each year.
Driver’s license suspension was originally conceived as a sanction used to punish “bad drivers.” The logical nexus between driving behavior and sanction was clear. However, today in New Jersey, license suspensions are not imposed to punish habitual bad driving. The reasons for driver’s license suspension are diverse, complex and sometimes interrelated. Reasons include those that are clearly driving related (e.g., DUI, point accumulation, reckless driving, and driving while suspended); those that are clearly not driving related (e.g., compliance reasons such as failure to pay child support or failure to appear in court for a non-driving offense and suspensions imposed for drug-related offenses not involving the operation of a motor vehicle); and those that are for compliance reasons indirectly related to driving behavior or motor vehicle use. These include: failing to appear in court to pay/satisfy a parking ticket or moving violation; failing to maintain proper auto insurance; and failing to pay MVC insurance surcharges that stem from a driving related infraction.
Most suspended drivers (64 percent) have more than one active suspension. Less than six percent of all suspended drivers are suspended for purely driving-related reasons. The vast majority of drivers are suspended not for habitual “bad driving,” but for a variety of compliance reasons stemming from one or more motor vehicle infraction, parking tickets, or failing to maintain proper insurance. Only a small percentage of drivers, less than five percent, are suspended for purely non-driving, non-motor vehicle related reasons. It is noteworthy that most suspended drivers (59 percent) have zero motor vehicle violation points. However, it should also be noted that some serious driving offenses, such as DUI and driving while suspended do not result in the assessment of motor vehicle points. Instead, in most cases, these violations carry substantial fines and mandatory suspension periods.
A detailed analysis of suspension statistics and survey data specific to New Jersey indicates that suspended drivers tend to be younger male drivers. Furthermore, a

3
disproportionate number of suspended drivers reside in urban and low-income areas when compared to the distribution of all New Jersey licensed drivers. Although only 43 percent of New Jersey licensed drivers reside in urban areas, 63 percent of suspended drivers live there. At the same time only 16.5 percent of New Jersey licensed drivers reside in lower income zip codes, while 43 percent of all suspended drivers live there.
This may be due to a variety of reasons. For example, most parking infractions occur in urban areas because urban areas have more parking restrictions than suburban and rural areas. As such, urban residents have a greater chance of violating parking laws. Similarly, the street and highway network in urban areas is more dense, with higher levels of traffic, more intersections, stop signs, traffic lights, and slow speed zones than suburban and rural areas. Generally, there is also a greater law enforcement presence in urban communities. Consequently, there are more opportunities to violate traffic laws and urban residents may be at greater risk of being observed violating traffic laws. Finally and perhaps most importantly, low income residents are more concentrated in the state’s urban areas. This population may be less able to pay fines, fees and surcharges given their more limited financial resources.
The obvious and most direct impact of license suspension is loss of personal mobility. However, suspension may also have collateral and/or unintended consequences such as job loss, difficulty in finding employment, and reduced income. Consequences can also include other financial impacts, such as increased insurance premiums and other costs associated with suspension; as well as psychological and social impacts such as loss of freedom, increased stress, and family strain. In addition, suspension can also have broader economic and societal impacts such as limiting the labor force for specific industries such as automobile sales and services, home health care aides and the construction trades. Jobs in each of these industries depend on semi-skilled workers with a valid driver’s license. In addition, many employers use possession of a valid driver’s license as a pre-qualifying “screening” question. This may unnecessarily limit the available labor force when driving a motor vehicle is not integral to job responsibilities.
Although not available in New Jersey, conditional or restricted-use driver’s licenses are available in 39 states and the District of Colombia. These licenses allow some or all suspended/revoked drivers to receive limited driving privileges during the time they are suspended. Program eligibility varies widely from state to state. Some states offer restricted-use licenses to drivers suspended for compliance reasons, but most states limit the use of restricted-use licenses to drivers with time delimited suspensions, such as those imposed for a first time DUI offense, for point accumulation and for other traffic violations after a specified minimum period of suspension is served. Most often, the waiting period ranges from 30 to 90 days, although a few states require all conditional license applicants to serve half of their suspension/revocation period prior to being considered eligible for the license.

4
In most states, conditional or restricted-use licenses are not available to drivers suspended/revoked for multiple DUI offenses, negligent vehicular homicide, or habitual offenders. Furthermore, in most states, drivers suspended for compliance reasons are not eligible. Permitted travel and associated restrictions related to conditional use licenses also vary by state. Penalties for violating program restrictions most typically involve the cancellation of the restricted-use license and reinstatement of the original suspension or revocation. Some states also extend the original suspension/revocation period, between several months to double the original period.
Conclusions and Recommendations
It is clear from this study that license suspension in New Jersey is widely used as a punishment, a deterrent and as a means to compel appearance in court and/or payment of various fines, fees, and other financial obligations. It also appears that in some circumstances, license suspension or the threat of suspension can be effective in achieving these purposes. For example, the Parking Offenses Adjudication Act (POAA) which allows license suspension when a driver fails to appear in court to satisfy a parking summons has been very effective in reducing the number of outstanding parking tickets pending over 60 days. In 1990, there were almost 4.4 million parking tickets that remained unpaid longer than two months. That number dropped precipitously through the 1990’s after the law took effect and as more municipal court systems became automated. In 2004, the number of parking tickets pending over 60 days was less than 400,000.
-0.501.001.502.002.503.003.504.00
All Reasons
FTA - Parking
FTA - Moving vio
lation
Drug Offenses - CDRA
Uninsured motoris t
Nonpay child su
pport
Driving while s
uspended
Nonpay Ins surch
arges
Nonpay court p
ay plan
FTA - Nondrivi
ngPoints DUI
Lower Income Middle Income High Income Figure ES1. Proportion of suspended drivers to licensed drivers by reason and area
type – Income (May 2004)

5
-
0.50
1.00
1.50
2.00
2.50
All Reason
s
FTA - Park
ing
FTA - Movi
ng vio
lation
Drug Offen
ses - CDRA
Uninsured
motorist
Nonpay
child s
upport
Driving
while su
spende
d
Nonpay
Ins su
rcharg
es
Nonpay c
ourt pay
plan
FTA - Nondriv
ingPoin
ts DUI
Urban Suburban Rural Figure ES2. Proportion of suspended drivers to licensed drivers by reason and area
type – Population Density (May 2004)
Suspension patterns indicate that certain segments of the licensed driver population are more likely to be suspended than others. For all reasons, except suspensions for DUI and accumulation of motor vehicle points, drivers residing in urban and lower income zip codes are overrepresented (see figures 1 & 2). Suspension rates among male drivers residing in lower income areas are consistently the highest (see table 1).
Table ES1 - Suspension rates by area type and income class (May 2004)
Suspension Rates 1 Male Female Total Statewide 7% 3% 5% By Population Density 2
Urban (>800 p/sq mi) 10% 4% 7% Suburban (200-800 p/sq mi) 4% 2% 3% Rural (<200 p/sq mi) 4% 2% 3% Unknown *
By HH Income Class3 High (>$85,000) 2% 1% 1% Middle High ($65,001 - $85,000) 3% 1% 2% Middle ($40,001 - $65,000) 6% 3% 4% Low ($20,000 - $40,000) 16% 7% 12% Low-Low(<$20,000) 35% 14% 24%
Notes: 1 – Suspension rates were calculated by dividing the number of suspended drivers by the number of licensed drivers in each zip code. The rates reported in this table represent the ratio of suspended drivers to licensed drivers;
2- density calculation based on zip code data from 2000 US Census; 3 - income classifications based on zip code data from 2000 US Census;
Special Note: 1,788 records could not be matched to zip code reference file
6
Although the impacts of license suspension may vary by individual driver, the social implications of New Jersey suspension patterns should be of concern. Low-income urban residents face many challenges, not the least of which is obtaining and retaining a job and meeting basic family financial needs. Given the decentralization of employment opportunities over the past forty years in the state, the only viable means of transportation to work for many may be by private automobile. Having their driving privileges suspended can be a significant additional impediment to gainful employment.
Unfortunately, programs and interventions used in other states to address the potential collateral impacts of license suspension (especially economic impacts related to loss of employment) appear mostly limited to flexible fine/fee payment options, payment amnesty programs and the use of restricted-use licenses. Despite this limited menu of options, there appear to be areas of possible reform in New Jersey.
First, the New Jersey legislature should reexamine the purpose and need for the MVC insurance surcharge program. In 1983, the legislature enacted the New Jersey Merit Rating Plan (N.J.S.A. 17:29 A-35), which required MVC to assess “insurance” surcharges based on certain motor vehicle offenses. When enacted in 1983, the original purpose of the NJ Merit Rating Plan insurance surcharges was to provide revenue for the New Jersey Automobile Full Insurance Underwriting Association (a.k.a. - Joint Underwriters Association or JUA) to fund medical expenses from uninsured motorists. The original bonds issued to support the JUA have since been retired and the revenue stream has been earmarked to pay down other state debt.
New Jersey is one of only four states in the Nation with such a surcharge program. The other states include New York, Texas, and Michigan. Almost one-third of all suspension ordered annually by MVC (28 percent or 228,000 orders) are for failure to pay insurance surcharges. Given the volume of suspensions for this reason and the fact that the greatest burden of surcharge suspensions fall on low-income drivers – almost 40 percent of drivers suspended for failure to pay insurance surcharges reside in low income zip codes, it appropriate to weigh the proportionally high impact of surcharge suspensions on low-income drivers against the benefit of the program. Currently, the only public purpose for the program appears to be to provide an alternative revenue stream for the state.
Second, the legislature and administrative office of the courts should examine the fairness of POAA suspensions. Although extremely effective in reducing the number of parking scofflaws, currently, more than 60 percent of POAA suspensions are ordered against drivers residing in low income zip codes. A review of state statutes related to repayment of court fines/fees and license restoration fees indicates that the courts and MVC have only limited discretion to establish payment plans. Current statutory requirements limit the courts ability to provide flexible payment plans and options that fit the unique circumstances of each driver’s situation. Changes to these requirements

7
could be an important way to both ensure repayment of fees/fines as well as allow driver’s to retain their driving privileges.
Third, efforts should be undertaken to address issues that contribute to license suspensions for failing to maintain proper insurance (e.g., the high cost of insurance in New Jersey, especially for drivers residing in urban areas). Currently, approximately 40 percent of license suspensions for failing to maintain proper insurance are ordered against drivers residing in low-income zip codes. In addition, the state should consider regulating/limiting insurance premium increases that are based solely on license suspensions for non-driving reasons.
Finally, New Jersey lawmakers should consider creating a restricted-use license program for at least certain suspended drivers (e.g., those suspended for financial reasons) under certain circumstances (e.g., to travel to/from work). Such a program could be a means to address the unintended consequences of suspension, especially employment and economic effects. As is the case in other jurisdictions, the benefits of such a program will need to be weighed against potentially diminishing the deterrent or coercive effects of suspension. However, it is noteworthy that 39 states and the District of Columbia have such programs and state officials view them as effective.

8
INTRODUCTION
Background and Problem Statement
At any given time, approximately 300,000 (less than 5 percent) of the licensed drivers in New Jersey have their driving privileges suspended. Suspensions occur for a variety of reasons, both driving and non-driving related. The main reasons are (1) nonpayment of surcharges, (2) failure to appear in court to pay fines, (3) miscellaneous court-ordered suspensions, including for driving under the influence of drugs or alcohol (DUI), reckless driving, parking tickets, etc; and (4) other administrative suspensions (e.g., exceeding point limit).
Some estimates indicate that fifty percent of people with suspended driver’s licenses had their licenses suspended for reasons other than how safely they operate a vehicle. In addition, there is the perception that there has been a marked increase in suspensions, primarily for failing to pay fees, fines, surcharges, or other financial obligations rather than safe driving issues. Furthermore there is some evidence that it is more difficult for poorer drivers to pay the debt they owe to recover their driver’s licenses. If the debt is not paid on time, additional interest and penalties accrue, resulting in a decreased likelihood that the debt will ever be paid, and that the individual will regain their driver’s license. There is a belief that this cycle may push poorer individuals out of jobs because many jobs are only accessible by personal automobile.
Research is needed to analyze and assess patterns of license suspension in New Jersey and to document the consequences of New Jersey’s driver’s license suspension program.
Research Objectives and Approach
The objectives of the study were to:
1. Document the extent and nature of driver’s license suspension in New Jersey;
2. Determine the motor safety, financial, socio-economic, geographic and insurance impacts of license suspension; and
3. Examine methods for reducing or eliminating negative or unintended impacts of driver’s license suspension.
The research program undertaken to achieve these objectives included the following major components:

9
Literature review and key informant interviews – The research team conducted a review of national literature to document current state practices related driver’s license suspension and mitigation programs as well as past evaluation research related to the assessing the potential impacts of license suspension. This included a review of articles published in academic journals, as well as studies and reports made available through existing research and information repositories maintained by USDOT, Congressional Research Service, the American Association of Motor Vehicle Authorities (AAMVA), Transportation Research Board, the National Highway Traffic Safety Administration, state departments of transportation and motor vehicle agencies and other academic research centers. In addition, the research team conducted key informant interviews with representatives from the NJ Motor Vehicle Commission and reviewed state statutes to document the history and legal framework for license suspension in New Jersey.
Suspended driver data analysis – The research team conducted a detailed analysis of suspended driver data provided by the NJ Motor Vehicle Commission (MVC). The data provided by MVC was sampled from the its driver history database in May 2004. The sample included data on the most recent 15 suspension events for all past and current New Jersey drivers having at least one license suspension recorded on their record.
Suspended driver survey – The research team conducted a statewide mail survey to develop a more detailed demographic profile of suspended drivers, to document the collateral and unintended impacts of license suspension, and to gauge public opinion regarding restricted-use license programs. Areas of questioning included: suspension history; impacts of suspension on employment, income, job performance, travel behavior; costs of suspension and ability to pay; psychological impacts; opinions regarding various aspects of restricted-use license programs; and personal characteristics related to race, gender, income, education, and familial status. Surveys were mailed to 5,000 New Jersey drivers who were currently or had previously been suspended, as well as to 2,500 drivers who had never been suspended.
State motor vehicle agency outreach – The research team conducted a two phase survey of state motor vehicle agencies to document license suspension practices and to inventory programs aimed at mitigating the unintended impacts of license suspension. State motor vehicle agency contact information was provided by the American Association of Motor Vehicle Administrators (AAMVA). The first phase of the survey included a brief email survey requesting information about general suspension/mitigation programs. The second phase of the survey included follow-up telephone interviews with respondents who indicated that their states offered some type of mitigation/remedial program to address the unintended consequences of driver’s license suspensions/revocations.

10
Report Outline
Section one of this report provides an overview of suspension-related definitions and summarizes the national literature on license suspension, its effectiveness and impacts. Section two presents summary statistics related to driver’s license suspension in New Jersey, including a description of the various reasons for suspension and detailed statistics that document patterns of suspension in terms of age, gender and residence location. Section three describes the collateral and unintended consequences that result from license suspension as documented through a statewide survey of suspended drivers. Section four provides an overview of restricted use license programs used in other states; and finally, section five presents a summary of the research team’s key findings and highlights several areas of possible policy reform.

11
LITERATURE REVIEW
Introduction
The literature on the effectiveness and potential impacts of driver’s license suspension is generally recent. Articles and reports on the subject fall into two primary categories: 1) those that evaluate driver’s license suspension penalties as a means of altering undesirable behavior; and 2) those that evaluate the economic and social effects of driver’s license suspension penalties on the economically disadvantaged. A review of the literature reveals that no national studies have been done on the subject and no comprehensive studies have been conducted quantifying the motor safety, socio-economic and insurance impacts of driver’s license suspension on a state-wide basis. Those studies that have been conducted examine license suspension and its related impacts in the context of specific issues and/or on a smaller-scale geographic area.
Definitions
To understand better the literature on license suspension it is useful to first understand some key terms and concepts used throughout the literature on the topic. First and perhaps most important, driving in the United States is considered a privilege and not a fundamental right or freedom. As such, government agencies have the ability to define the circumstances under which individuals are granted the privilege to drive and when and for how long an individual’s driving privileges can be withdrawn to protect public health, safety and welfare or to promote some other public purpose.
The New Jersey Motor Vehicle Commission defines a license suspension as the “temporary (emphasis added) removal of privileges granted to the licensee by the licensing jurisdiction.” A license revocation is defined as the “withdrawal of license and privileges by the licensing jurisdiction.” This dichotomy of definition is similarly used in many other states throughout the country.1
The nuance between these terms is significant in that license suspension is understood in New Jersey as well as nationally as the temporary suspension of driving privileges for a limited period of time set by statue or regulation. License revocation on the other hand is a more permanent status that requires re-application and testing in addition to satisfying the conditions of the revocation before driving privileges can be restored. Driver’s license suspensions can either be mandatory, meaning that the law requires that a suspension be imposed, or discretionary, meaning that a judge or the motor vehicle licensing agency has the option to suspend a license, but the law does not require it. Driver’s license suspensions can be levied either by the motor vehicle
1 In 2004, the research team conducted a survey of state license suspension practices. Thirty of the 41 state licensing agencies that responded to the survey reported differentiating between suspension and revocation in a fashion similar to New Jersey. A summary of the survey results appears later in this report.
12
licensing agency, referred to as an administrative suspension, or by the courts, which is referred to as a court-ordered suspension.
Most court-ordered suspensions occur at the time of conviction for a crime or other action subject to license suspension or revocation; however, most states have adopted laws which allow administrative license revocation (ALR) when a driver is charged with driving under the influence of drugs or alcohol. This type of suspension remains in effect from the time a driver is charged with the offense until the outcome of court proceedings related to the offense are known. According to the National Highway Traffic Safety Administration (NHTSA) administrative license revocation laws allow police and driver licensing authorities to revoke a driver’s license swiftly, without long delays while waiting for a criminal trial, when a driver fails a blood alcohol test or when an offender violates ‘implied consent’ laws by refusing a blood alcohol test. NHTSA reports that as of December 2003, forty-one states and the District of Columbia have adopted some form of administrative license revocation (NHTSA, 2004 1). The State of New Jersey currently does not permit administrative license suspension.
According to a survey of state practices conducted by the research team in 2004, many states issue restricted-use licenses, sometimes referred to as occupational, conditional or hardship licenses to individuals who have had their license suspended. As the names imply, these licenses provide drivers with the ability to drive lawfully under limited circumstances. For example, an individual may be permitted to drive during the period of suspension with restrictions on the reasons for permissible travel and/or the routes and times of travel. Most often, restricted-use licenses are issued to permit the driver to travel to and from work during the period of suspension. Restricted-use licenses are either issued administratively by the motor vehicle licensing agency or by order of the courts. A detailed review of state practices related to restricted-use licenses appears later in this report.
License suspension as a means of altering undesirable behavior
Although originally intended as a sanction to address poor driving behavior, in the United States, driver’s license suspension is now commonly used as a means to punish individual’s engaged in criminal and/or otherwise socially undesirable behavior unrelated to the operation of a motor vehicle. In most states, laws now exist that suspend driving privileges for non-driving related offenses such as: failure to appear in court, controlled substance convictions, failure to pay fines/fees, failure to carry insurance, and failure to pay child support to name just a few.
Several states have recently conducted studies designed to specifically examine the effects of license suspension. In 2002, researcher Mark Joerger, conducted a study for the Oregon Department of Transportation that examined suspension patterns in relation to driver characteristics. His research showed that suspensions were highest among very young drivers, peaking around the age of 20, and steadily decreasing with age

13
(Joerger 6). Another observation was that while the number of average suspensions per person remains fairly constant between the ages of 25 to 40, the number of convictions for motor vehicle offenses drops off much more rapidly after the age of 25 (Joerger 14).
Interestingly, Joerger also found that many convictions and suspension types had nothing to do with safe driving. This he suggests indicates that behavior leading to a significant number of suspensions is not necessarily habitual bad driving among young drivers. Moreover, he found that the top reasons for suspension were failure to pay a fine or comply with a condition imposed by a court, followed by failure to appear for a court hearing, neither of which are related directly to driving (Joerger 9). The data also showed that license suspensions were more frequent in rural areas than in urban areas of Oregon and more frequent among men than women (Joerger 13).
Joerger also examined the incidence of convictions for driving while suspended. He found that driving while suspended was the most common non-speeding related conviction type. He further found that, in Oregon, more than 25% of all suspended drivers have been convicted of driving while suspended. He concluded that license suspension is not an effective means of preventing people from driving.
Also in 2002, Michael A. Gebers and David J. DeYoung from the California Department of Motor Vehicles published a study titled “An Examination of the Characteristics and Traffic Risk of Drivers Suspended/Revoked for Different Reasons.” According to the authors, the study was commissioned in part because of the increasing number of laws that provide for license suspension/revocation as punishment for a variety of offenses unrelated to driving. The study evaluated the relative traffic risk posed by drivers based upon the reason for their suspension.
The study classified suspended/revoked drivers into eleven different categories based on reason for suspension. Suspended drivers were then compared to a sample of validly licensed drivers in terms of total crash involvement, involvement in fatal or injury crashes, total traffic convictions, and total incidents (counting both crashes and convictions combined). Similar to the findings of the Oregon DOT study, drivers suspended for “failure to appear” (a non-driving reason) represented the largest proportion of suspended drivers in the random sample of all suspended/revoked drivers (Gebers & DeYoung 12).
Overall, Gebers and DeYoung reported that the relative traffic safety risk of suspended/revoked drivers varied widely depending on the category of suspension. For example, drivers that were suspended for negligent operation and serious traffic offenses presented the highest relative traffic safety risk. Drivers suspended for failing to pay child support, a non-driving offense, had the lowest crash risk of any suspended/revoked category. Further, the researchers found that drivers whose

14
suspensions derived from other non-driving offenses had a relatively low traffic safety risk, only slightly higher than the validly-licensed drivers. (30)
Based on their research, Gerbers and DeYoung concluded that suspended/revoked drivers are a heterogeneous group, both demographically and with regard to their driving behavior. They found all suspended driver groups have higher crash and conviction rates compared to validly-licensed drivers, but the rates vary widely based on the reason for suspension/revocation. They further found that drivers suspended for non-driving reasons posed the lowest traffic safety risks among the suspended driver groups with a risk comparable to those of the validly-licensed drivers (31).
The authors suggest that suspended/revoked drivers should not all be treated the same and that license suspension and revocation policies be altered to take into account potential traffic safety risk. They recommended that the current vehicle impoundment law in California be rewritten to more rationally reflect the risks posed by the suspended/revoked drivers to which it applies. They further recommended that license suspension/revocation laws be rewritten to exclude persons who have committed a non-driving offense. According to Gerbers and DeYoung, the study findings reinforce earlier research showing that although license suspension/revocation policies may alter behavior, they do not make high-risk drivers more safe (34).
In 1998, the Center for Policy Research (CPR) conducted a study to evaluate the impact of driver’s license suspension on child support payments. The study report, authored by Nancy Thoennes and Jessica Pearson is entitled “Multiple Intervention Grant: “Driver’s License Suspension as a Tool of Child Support Enforcement.” The authors explored two questions related to license suspension: 1) for those individuals who received an initial suspension and began to comply but subsequently stopped paying, will additional suspensions bring these individuals back into compliance; and 2) do subsequent suspensions result in diminishing returns in bringing individuals back into compliance with their child support obligations (1)?
Thoennes and Pearson found that only 39 percent of those individuals who were reported to the department of motor vehicles for license suspension held a valid license; two-thirds of the individuals who were eligible for suspension had a previous suspension or revocation on their driving record, predominantly because of a lack of insurance; and most payment activity among those who had licenses suspended occurred around the time they were notified of their suspension. Following this payment activity, most obligors returned to non-payment patterns (2).
The researchers also observed that child support payments increased as a result of the initial suspension process compared with those obligors who were not suspended. However, a significant number (44 percent) of obligors in the study moved in and out of compliance, and a small number (18 percent) who were non-compliant after the first

15
license suspension, remained non-compliant even after subsequent suspension notifications (6). They concluded that some individuals only respond to the continual threat of further license suspension; and that the threat of driver’s license suspension works best with people who have a valid license and would be disadvantaged without it. It should be noted that, although this study examined the response of obligors who had a driver’s license, it did not evaluate the remaining 60 percent of obligors who did not have a license at the time of suspension eligibility. The authors further concluded that this population (i.e., non-license holders) is likely to be unresponsive to additional notifications of non-compliance for child support (9-10).
In a number of states, the threat of driver’s license suspension is used to discourage underage drinking, truancy, and other delinquent behaviors by minors.2 In 2000, researcher John Pawasarat published a study titled “Removing Transportation Barriers to Employment: The Impact of Driver’s License Suspension Policies on Milwaukee County Teens.” The study examined the impact of driver’s license suspension policies on teenagers in Milwaukee County, Wisconsin. The research sought to determine whether current license suspension and/or revocation policies create a barrier to employment for Milwaukee County youth. The research focused on the special problems of youth in securing and keeping valid driver’s licenses due to municipal and circuit court fine and forfeiture collection policies.
In Wisconsin, teenage offenses including truancy, graffiti, and violation of curfew can result in the withholding of a teen’s driver’s license application if past fines are not paid. Pawasarat reviewed Wisconsin Department of Transportation records and analyzed the driver’s license status of all Milwaukee County teenagers (16-18 years of age) to determine what happened to suspended teens as they reached working age. He found that 87 percent of suspended teens had suspensions solely for non-payment of fines (2); and that nearly all (93 percent) of suspension orders were issued to teens that did not possess a driver’s license (2).
Pawasarat further found that license suspensions in Milwaukee County were not evenly distributed geographically, but rather most suspensions (89 percent) were issued to city residents and 64 percent to teens from central city neighborhoods (2). He notes that more teens in the City of Milwaukee have their driving privileges suspended than have valid driver’s licenses. Suburban teens were much less likely to be suspended. Only one in seven teens living in suburban areas of the county had a suspended license (2).
Based on his analysis, Pawasarat suggests that teens, especially those in the central neighborhoods of Milwaukee, enter the job market with several disadvantages. These teens reside in areas with an insufficient number of entry-level jobs, while also
2In 2004, the research team conducted a survey of state license suspension practices. A summary of the survey results appears later in this report.

16
containing a high concentration of job seekers. Moreover, entry-level jobs are located in areas that are not well served by transit. The results suggest that the policy of suspending the driver’s license of juveniles did not result in the payment of the fines and forfeitures and may provide a barrier to teens seeking employment (4).
A 2002 study conducted by NHTSA sought to determine the potential effectiveness of penalty harshness on discouraging driving under the influence (DUI) offenders from driving while suspended. The study examined the proportion of first-time alcohol-impaired driving offenders who drove while suspended and their reasons for driving. Two sample populations were studied in the report – first-time offenders in Milwaukee (WI) and Bergen County (NJ). These sites were chosen primarily because of their different DUI suspension laws. New Jersey laws were more harsh than those in Wisconsin. For example, Wisconsin law allows for the issuance of an occupational license for first-time offenders provided that the individual does not have any other suspensions within the prior year. Drivers convicted of first-time DUI offenses in New Jersey receive a court-ordered mandatory minimum “hard” license suspension of 6 months, with no occupational license available (McCartt et al. 3).
The investigators observed suspended drivers in Milwaukee, WI who were ineligible for an occupational license and suspended drivers in Bergen County, NJ. both during and after their suspensions in order to determine their driving patterns. The study population included 57 offenders in Milwaukee and 36 offenders in Bergen County. Analysis of driving patterns revealed that 53 percent of the Milwaukee subjects drove at least once while suspended, while only 22 percent of Bergen County subjects did (McCartt et al. 4).
The researchers also conducted focus groups among both sample populations to gather qualitative information on behaviors and attitudes of persons who recently experienced a license suspension as a result of a first-time DUI offense. They found differences between the two groups. New Jersey participants indicated that the suspension was a hardship that required them to make changes to their work and personal lives to comply with the suspension. Few Milwaukee participants reported similar changes. New Jersey participants also demonstrated a greater knowledge and fear of the sanctions for driving while suspended than did the Milwaukee participants. Participants at both sites reported having driven on some occasions while their license was suspended. However, the researchers concluded that differences in the severity of the states’ laws appeared to be an important factor with respect to driving patterns among suspended drivers. They further suggest that strong sanctions for driving while suspended coupled with strong enforcement may increase compliance with licensing sanctions (McCartt et al. 6).
It should be noted, however, that several factors complicate the observations in the study and may have skewed its results. First, Milwaukee drivers that obtained a conditional license were excluded from the study because of their ability to drive (25 percent of the initial subject pool). Therefore, those subjects included in the Milwaukee

17
pool were individuals with overall poorer driving records, as compared to the Bergen County subjects. In fact, the researchers state that a much larger percentage of the Milwaukee subjects had problematic driving histories. For example, 39 percent of Milwaukee subjects were convicted of at least one other driving offense compared to 17 percent of Bergen County subjects. (14).
Further, McCartt et al. stated that Milwaukee subjects were more likely to have had prior license suspensions, often based on the failure to pay fines and fees when arrested for DUI. A review of the subjects driving records indicated a more pronounced cycle of license suspension among Milwaukee drivers than those in Bergen County, NJ. The driver abstracts showed convictions for moving or non-moving offenses, followed by failure to pay fines associated with these offenses, followed by license suspension, followed by additional violations and fines. The researchers noted that 50 percent of all Milwaukee subjects in the study already had a license suspension prior to the DUI conviction. The authors indicated that this pattern may be evidence that license suspension is not a fully effective deterrent for these offenders. The authors however, do not state how the pattern of license suspensions affects the results of the study (14).
Economic and social effects of driver’s license suspension
The Employment and Training Institute at the University of Wisconsin published a report in 1998 entitled “Removing Transportation Barriers to Employment: Assessing Driver’s License and Vehicle Ownership Patterns of Low-Income Populations.” The report was authored by John Pawasarat and Frank Stetzer. The study sought to understand better the relationship between driver’s license retention and employment and child care for low-income families. Researchers examined Wisconsin Department of Transportation (DOT) driver’s license records, vehicle registration records, public school data and U.S. census data for Milwaukee County residents. The data was analyzed to identify patterns of recent suspensions and revocations by type and number of actions, to determine auto ownership rates and to determine driver’s license and suspension rates for teenagers by zip code, central city, and suburban areas (Pawasarat & Stetzer 1).
Pawasarat and Stetzer combined driver license suspension data with data related to welfare status in “an effort to provide a first-time census of transportation problems of low-income residents.” With respect to driver’s license suspensions, the data showed that 58 percent of suspended drivers were suspended due to non-payment of fines and civil forfeitures, rather than for traffic-related violations; and these suspensions were concentrated in poor Milwaukee neighborhoods. Adults with suspensions often continue driving (1). For Low-Income drivers, 47 percent of men and 27 percent of women with non-traffic suspensions ended up with license revocations for driving while suspended (2). Finally, the analysis showed that almost as many welfare recipients had their driving privileges suspended or revoked (22 percent) as had a valid license in good standing (25 percent) (2).
18
The authors state that adults in central city neighborhoods are much more likely to be suspended for non-payment of fines and may find it even more difficult to retain a job necessary to pay the required fines and fees. In addition, millions of dollars in transportation funds for welfare recipients are targeted to expensive van pooling to transport workers who in many cases have had their licenses suspended or revoked for failure to pay fines. Finally, Pawasarat and Stetzer found that single parent women households with children under 6 years of age had significantly higher employment levels when there was a car available (42 percent) compared to those who did not have a car available (12 percent). The authors conclude that license suspensions create a barrier to employment and that in most cases, such suspensions are due to non-traffic related violations. (3)
In 2001, the National Center for State Courts published a report entitled “New Strategies Addressing the Impact of Driver’s License Suspensions”. The report was authored by Marti Maxwell, Records Manager for the Municipal Court of Seattle as part of NCSC’s Institute for Court Management Program. IN the report, Maxwell examines the State of Washington’s license suspension program and whether re-licensing programs set up as an alternative to vehicle impoundment had a positive impact on payment compliance and recidivism – defined as reduction in the number of individuals charged with 3rd
degree driving while suspended (DWLS).
Maxwell studied four county-based programs in Washington State that are aiding in the re-licensing of suspended drivers rather than impounding their vehicles as required by law for those convicted for 3rd degree DWLS. These programs included the following:
King’s County – In King’s County, WA, a defendant charged with 3rd degree DWLS can enter a repayment program with the court; the court then continues the defendant’s case for an additional 12 months. If the defendant complies with the program, the court will dismiss the pending DWLS charge. The benefit of this program is the ability for the courts to re-call accounts in collection if a defendant fails to pay (Maxwell 36).
Spokane County – In Spokane County, WA, a “restorative justice” program was established, whereby defendants charged with 3rd degree DWLS can be was diverted into a re-licensing program. Participants must meet with community volunteers who provide assistance in setting up a customized plan for the defendant to follow. Participation in the program is a one-time-only opportunity. Anyone who drops out or violates the restrictions cannot participate again. The program resulted in reduction of court time spent on those individuals participating in the diversion program which purportedly saved the City of Spokane at least $10,000 in the first year of the program’s existence (Maxwell 36).

19
Clark County – In Clark County, WA, the Department of Corrections runs the re-licensing program and works closely with the county’s collection agency to craft special re-payment plans. The program is open to persons who meet the following criteria: a) suspended for simple Failure to Appear (FTA) ; b) enrolled in a payment program to pay tickets not yet in collections; c) have fines in excess of $500; and d) have a steady, dependable income. Participants must also attend DWLS class and pay a $40 fee. The program has a community service component that allows participants to reduce their fines by $45 each day they work. Participation in the program is a one-time only opportunity (Maxwell 39).
City of Seattle: In Seattle, WA where nearly one-third of all cases heard in municipal court involve DWLS charges, an active social service agency, the Central Area Motivation Program (CAMP) provides re-licensing services to its clients, including: setting up payment plans for offenders, assisting with collection disputes and persuading court offices to contact the Department of Licensing in order to remove suspensions. The program has allowed drivers to retain their license and has educed court and jail expenses. It has been so successful that the Seattle Municipal Court has signed a contract with other social service providers to help offenders regain their licenses (Maxwell 41-42).
Based on her research, Maxwell concluded that absent the re-licensing programs, drivers charged with 3rd degree DWLS are very likely to remain in suspended status since most cannot pay the original fine or new fines for DWLS. He recommends that alternative sanction programs such as the re-licensing programs examined be considered to reduce the economic impact of suspension on low-income individuals (Maxwell 51-52).
Another study completed in 2001, was published by the New Jersey Institute for Social Justice (NJISJ). It examined license suspension patterns in New Jersey. The study report was titled “Roadblock on the Way to Work: Driver’s License Suspension in New Jersey.” The authors of the study, Ken Zimmerman and Nancy Fishman, argue that license suspension is a barrier to employment for many low-income New Jersey residents. They go on to identify a number of steps that could be taken to address this barrier. The study summarized common reasons for license suspension, including: driving-related suspensions, including DUI; criminal justice code and juvenile code sanctions; failure to pay parking violations; failure to pay insurance surcharge fees; failure to appear in municipal court; failure to pay child support; and driving while suspended (4-6).
Zimmerman and Fishman compiled and analyzed data from the NJ Division of Motor Vehicles. According to the authors, license suspension in New Jersey is frequently used as an economic sanction. The data showed that the largest numbers of license suspensions for the year 2000 were imposed for failure to pay insurance surcharge fees, 220,427 out of a total of 867,065 license suspensions. The next highest were
20
imposed for failure to pay parking tickets or failure to appear for a hearing on a parking offense, while only 24,497 were imposed for driving under the influence. Overall, suspensions related to non-driving offenses accounted for more than half of all suspensions in 2000 (9). As discussed earlier, these findings are similar to the results of similar studies conducted in the states of Wisconsin and Washington.
The authors state that the largest numbers of suspensions are being imposed for financial failures. Moreover, anecdotal evidence from interviews conducted by NJISJ with workforce development program participants, as well as individuals impacted by insurance surcharge fees and fines, indicate that all suspensions, particularly those for failure to pay, negatively impact low-income New Jersey residents. According to Zimmerman and Fishman, license suspensions are a systematic, major barrier to employment, especially for those who are inner city residents and receive public assistance (9).
In 2003, the Dieringer Research Group (DRG) published a study for the Wisconsin Department of Transportation titled “Evaluation of the Effectiveness of the Occupational Licensing Program.” The purpose of the study was, in part, to evaluate the impact of occupational licensing programs on traffic safety and unemployment. The study examined rates of crash involvement and convictions for moving traffic violations for those operating under an occupational license before, during, and after they held an occupational license. The study also used interviews, focus groups and surveys to assess how well the current occupational license program is understood by the general public, elected officials, law enforcement, and whether or not it meets their expectations (DRG 3).
DRG Researchers concluded that the occupational license program was perceived positively among interviewed groups of experts and most focus group participants. They further found that people generally have a good understanding of the occupational license initiative. Finally, the researchers concluded that, although more lenient than the programs utilized in most other states, Wisconsin’s occupational license program is effective and is accomplishing its goal of keeping offenders employed while protecting the public from unsafe drivers. Controlling for age and gender, former occupational license holders had similar rates of citations and accidents as the general population of all Wisconsin drivers (6).
Summary
As stated previously, the literature on the effectiveness and potential impacts of driver’s license suspension is generally recent and somewhat limited. Most studies examined basic suspension statistics to document the reasons for suspension. On this point, the results are consistent across studies and indicate that although license suspension was originally conceived as an administrative sanction intended to alter bad driving behavior, today it is commonly used as a sanction to punish behaviors unrelated to operating a

21
motor vehicle. In fact, in those jurisdictions examined in the literature (including New Jersey) the primary reasons for suspension were for failure to pay and failure to appear violations (Joerger, Gebers & DeYoung, Pawasarat & Stetzer, Zimmerman & Fishman).
The results of studies aimed at assessing the effectiveness of license suspension have been mixed. For example, one study found that suspension or the threat of suspension has been deemed effective as a means of compelling payment of child support payments among some obligors but not all (Thoennes & Pearson). Another study found that suspension is generally ineffective as a means of discouraging truancy, graffiti, and curfew violations by minors, especially for urban youth (Pawasarat). Still another study found that the harshness of DUI suspension laws may influence driver behavior during and after the suspension period, suspensions are only partially effective in preventing drivers from driving while suspended (McCartt et al.).
Those studies that examined the highway safety, economic and social effects of license suspensions have resulted in generally consistent findings. First, relative to highway safety, two studies found that the population of suspended drivers is not homogeneous. As might be expected, drivers suspended for poor driving behavior pose a comparatively higher safety risk than validly licensed drivers. However, drivers suspended for primarily non-driving reasons (e.g., failure to pay child support) pose only a slightly greater risk for future crashes and violations (Joerger, Gebers & DeYoung, DRG). Several studies have concluded that license suspension can have negative economic and social effects (e.g., barrier to work) especially among lower income drivers (Pawasarat, Pawasarat & Stetzer, Maxwell, Zimmerman & Fishman).
Finally, the few studies that have been done to evaluate programs designed to address the unintended consequences of suspension (i.e., court re-licensing programs in Washington State and the occupational license program in Wisconsin) have concluded that these programs can be effective with regard to improving employment outcomes and subsequent repayment of fines and fees (Maxwell, DRG).

22
DRIVER’S LICENSE SUSPENSION IN NEW JERSEY
New Jersey has approximately six million licensed drivers. The vast majority of these drivers remain violation and suspension free throughout their driving years. Only a small percentage of drivers (approximately five percent) have their driving privileges suspended or revoked at any given time.
In New Jersey, driving and registering a motor vehicle are considered privileges, not rights, which may be removed (“suspended”) for reasonable grounds. New Jersey utilizes the term suspension, instead of revocation, to denote a temporary, rather than permanent, withdrawal of the privilege(s). Driver’s license suspensions are distinguished broadly in New Jersey by the following factors:
1. Whether the suspension(s) is imposed by court action or by the MVC (administrative);
2. Whether the suspension(s) is for a finite or indefinite period of time. The latter term indicates that the suspension period is dependent upon compliance with some requirement or payment;
3. Whether the suspension(s) is mandatory (e.g., DUI penalties) or discretionary (e.g., point system with option for a hearing at MVC); and
4. What privilege(s) are affected by the suspension(s): driving, registration, driving & registration, or specific endorsements on commercial licenses (e.g., carrying school-age children).
When a driver’s license is suspended by court action, the MVC’s role involves record-keeping and confirmation to the customer only. When the MVC suspends a driver’s license, the Commission is responsible for giving notice of the proposed suspension and for providing procedural due process in the form of pre-hearing conferences at the MVC and hearings before the Office of Administrative Law.
Overview of New Jersey Suspension Statistics
Over the past ten years, a yearly average of approximately 838,000 suspensions have been ordered and/or confirmed by MVC (see table 1 and figure 1). The number of annual suspensions has ranged from a high of approximately 900,000 in 1995 to a low of approximately 740,000 in 1998. These figures represent totals of individual suspension actions taken, NOT the number of drivers subject to those actions. For example, it is common for an individual driver to have several active suspension orders on his/her record at a given time. It is valuable to note that overall, at any given time,
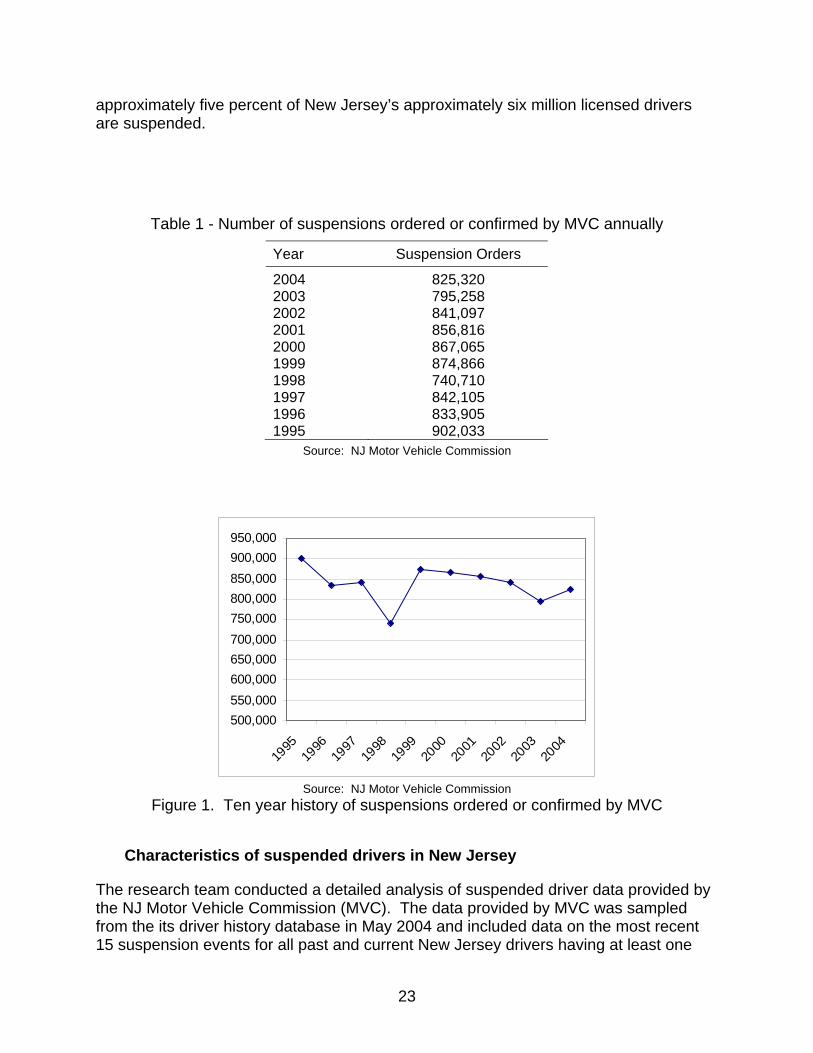
23
approximately five percent of New Jersey’s approximately six million licensed drivers are suspended.
Table 1 - Number of suspensions ordered or confirmed by MVC annually
Year Suspension Orders
2004 825,320 2003 795,258 2002 841,097 2001 856,816 2000 867,065 1999 874,866 1998 740,710 1997 842,105 1996 833,905 1995 902,033
Source: NJ Motor Vehicle Commission
500,000550,000600,000650,000700,000750,000800,000850,000900,000950,000
1995
1996
1997
1998
1999
2000
2001
2002
2003
2004
Source: NJ Motor Vehicle Commission
Figure 1. Ten year history of suspensions ordered or confirmed by MVC
Characteristics of suspended drivers in New Jersey
The research team conducted a detailed analysis of suspended driver data provided by the NJ Motor Vehicle Commission (MVC). The data provided by MVC was sampled from the its driver history database in May 2004 and included data on the most recent 15 suspension events for all past and current New Jersey drivers having at least one

24
license suspension order recorded on their record. The original data sample included 1,456,207 records. Of the original 1.4 million records, approximately 700,000 were “in-state drivers” (i.e., they possessed a New Jersey residence address). This included both current and expired/deceased license holders as well as records for individuals who have never possessed a valid New Jersey driver’s license but have driver’s license numbers created by MVC to track motor vehicle violations, crashes and/or suspension orders issued against those individuals. As a matter of policy, the NJ MVC does not delete driver history records after licenses expire for what ever reason. For the purpose of this study, only license holders with valid New Jersey address and those identified as “active” suspended drivers were included in the data analysis. Active suspended drivers were defined as New Jersey drivers possessing a current (not expired) driver’s license and those with driver’s licenses that expired after May 2001 who had one or more suspension orders recorded on their driver history record.
Data for active suspended drivers were mapped using residence address location and aggregated by zip code to provide a total number of suspended drivers in each zip code. Suspension rates for each zip code were then calculated by dividing the number of suspended drivers by the number of licensed drivers in each zip code to control for the density of licensed drivers in different parts of the state. Suspension rates for each zip code were associated with population density and household income data from Census 2000. Population density was used as a surrogate for area type (e.g., urban, suburban and rural). Suspension rates were compared across area types and income levels to derive the tables presented in this section.
It should be noted that the MVC driver history database does not include specific demographic data. As such, it is important to understand how to interpret the data tables with regard to income. No direct relationship can be drawn between individual suspended drivers and their income level. The data must be interpreted in the aggregate. Suspension rates reported in the tables represent the ratio of suspended drivers to licensed drivers in any given zip code. For example, in zip codes with a population density of greater than 800 persons/sq. mile (urban), almost 10% of male licensed drivers are suspended. Similarly, in zip codes with a median household income of less than $20,000 (low-low income), almost 35% of licensed male drivers have their driving privileges suspended.
Two maps are included for reference purposes. Figure 2 depicts population density by zip code for the State of New Jersey. Figure 3 depicts median household income by zip code for the State of New Jersey.

25
Figure 2. New Jersey Population Density (2000)

26
Figure 3. New Jersey Median Household Income

27
Age and gender profile of suspended drivers
In May 2004, there were 289,600 suspended New Jersey drivers (see table 2). This represents slightly less than five percent of the State’s approximately six million licensed drivers. As shown in table 2, the vast majority of suspended drivers in New Jersey are male (70 percent); and most (59 percent) are between the ages of 25 and 44. A review of driver’s license suspension statistics in other states reveals that suspension rates in New Jersey are slightly less than the rates observed in other states (see table 3). Furthermore, a review of driver’s license suspension studies conducted in other states indicates that suspended drivers in those states tend to also be male and between the ages of 25 and 44.
Table 2 - Number of suspended drivers by gender and age group (May 2004)
Male Drivers Female Drivers All Drivers Age Group Number Percent Number Percent Number Percent
16-17 194 0.1% 52 0.1% 246 0.1% 18-24 35,046 17.2% 12,875 14.9% 47,921 16.5% 25-34 69,082 34.0% 28,062 32.5% 97,144 33.5% 35-44 51,958 25.6% 22,098 25.6% 74,056 25.6% 45-54 26,778 13.2% 11,942 13.8% 38,720 13.4% 55-64 10,269 5.1% 4,662 5.4% 14,931 5.2% 65-84 7,657 3.8% 4,867 5.6% 12,524 4.3% 85+ 2,322 1.1% 1,736 2.0% 4,058 1.4% Total 203,306 100.0% 86,294 100.0% 289,600 100.0%

28
Table 3 – Suspension rates in other states
State
# of Licensed Drivers
# of Suspended
Drivers Rate Alabama 480,000 27,213 6% Arkansas 1,900,000 101,500 5% Connecticut 2,300,000 134,000 6% Delaware 570,000 78,660 14% Idaho 1,000,000 70,000 7% Illinois 8,400,000 258,511 3% Iowa 2,000,000 57,000 3% Kansas 1,900,000 103,000 5% Minnesota 3,600,000 163,500 5% Missouri 3,500,000 320,344 9% Montana 450,000 31,931 7% Nebraska 1,300,000 53,539 4% New Jersey 6,100,000 290,000 5% North Dakota 457,000 27,000 6% Ohio 8,728,546 611,064 7% Oklahoma 2,300,000 81,040 4% Pennsylvania 8,300,000 600,000 7% Tennessee 4,200,000 246,000 6% Texas 15,000,000 430,000 3% Washington 4,300,000 364,000 8% Wisconsin 3,700,000 403,586 11% Wyoming 455,000 15,000 3% Average 6%
Incidence of multiple suspensions and suspended drivers with points
It is quite common for suspended drivers in New Jersey to have more than one suspension (see table 4). Almost two thirds (64 percent) of suspended drivers have two or more active suspensions and almost one quarter (21 percent) have 10 or more active suspensions.
As described more fully later in this section, the MVC monitors driving behavior by means of a point system under which drivers are assessed points for motor vehicle moving violations. The accumulation of points is used as an indicator of “bad” driving behavior. It is interesting to note that most suspended drivers in New Jersey (59 percent) have zero points (see table 5). The vast majority (85 percent) have six points or fewer, the threshold used by MVC to trigger advisory notification of potential corrective actions to be taken to address bad driving behavior.
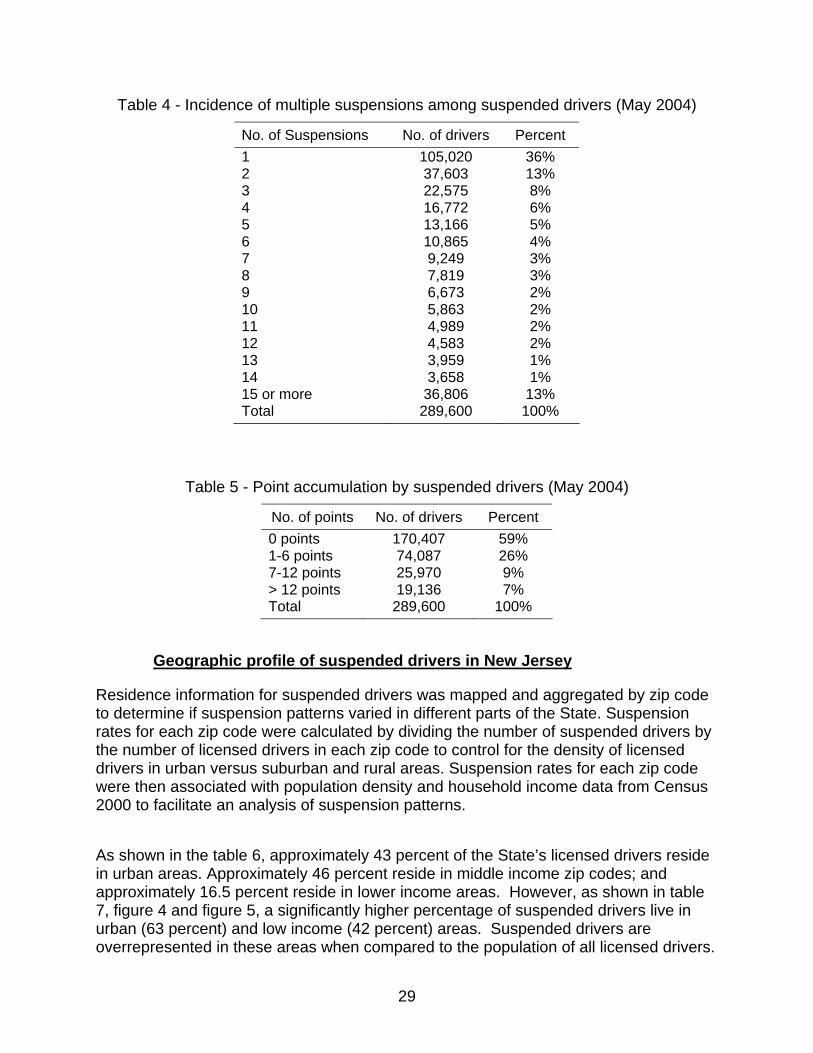
29
Table 4 - Incidence of multiple suspensions among suspended drivers (May 2004)
No. of Suspensions No. of drivers Percent 1 105,020 36% 2 37,603 13% 3 22,575 8% 4 16,772 6% 5 13,166 5% 6 10,865 4% 7 9,249 3% 8 7,819 3% 9 6,673 2% 10 5,863 2% 11 4,989 2% 12 4,583 2% 13 3,959 1% 14 3,658 1% 15 or more 36,806 13% Total 289,600 100%
Table 5 - Point accumulation by suspended drivers (May 2004)
No. of points No. of drivers Percent 0 points 170,407 59% 1-6 points 74,087 26% 7-12 points 25,970 9% > 12 points 19,136 7% Total 289,600 100%
Geographic profile of suspended drivers in New Jersey
Residence information for suspended drivers was mapped and aggregated by zip code to determine if suspension patterns varied in different parts of the State. Suspension rates for each zip code were calculated by dividing the number of suspended drivers by the number of licensed drivers in each zip code to control for the density of licensed drivers in urban versus suburban and rural areas. Suspension rates for each zip code were then associated with population density and household income data from Census 2000 to facilitate an analysis of suspension patterns.
As shown in the table 6, approximately 43 percent of the State’s licensed drivers reside in urban areas. Approximately 46 percent reside in middle income zip codes; and approximately 16.5 percent reside in lower income areas. However, as shown in table 7, figure 4 and figure 5, a significantly higher percentage of suspended drivers live in urban (63 percent) and low income (42 percent) areas. Suspended drivers are overrepresented in these areas when compared to the population of all licensed drivers.

30
Table 6 - Distribution of NJ licensed drivers by area type and income class (May 2004)
Licensed Drivers Male Female Total % of total Statewide 3,042,560 3,130,632 6,173,192 100% By Population Density 1
Urban (>800 p/sq mi) 1,322,677 1,335,069 2,657,746 43.1% Suburban (200-800 p/sq mi) 1,155,525 1,207,671 2,363,196 38.3% Rural (<200 p/sq mi) 564,358 587,892 1,152,250 18.7%
By HH Income Class 2 High (>$85,000) 367,170 381,658 748,828 12.1% Middle High ($65,001 - $85,000) 767,114 798,038 1,565,152 25.4% Middle ($40,001 - $65,000) 1,402,046 1,439,537 2,841,583 46.0% Low ($20,000 - $40,000) 492,436 496,546 988,982 16.0% Low-Low(<$20,000) 13,794 14,853 28,647 0.5%
Notes: 1- density calculation based on zip code data from 2000 US Census; 2 - income classifications based on zip code data from 2000 US Census
Special Note: 1,788 records could not be matched to zip code reference file
Table 7 - Distribution of suspended drivers by area type and income class (May 2004)
Suspended Drivers Male Female Total % of total Statewide 203,306 86,294 289,600 100.0% By Population Density 1
Urban (>800 p/sq mi) 127,960 55,047 183,007 63.2% Suburban (200-800 p/sq mi) 50,290 20,538 70,828 24.5% Rural (<200 p/sq mi) 23,753 10,224 33,977 11.7% Unknown * 1,303 485 1,788 0.6%
By HH Income Class 2 High (>$85,000) 7,129 2,952 10,081 3.5% Middle High ($65,001 - $85,000) 25,238 10,288 35,526 12.3% Middle ($40,001 - $65,000) 85,184 36,255 121,439 41.9% Low ($20,000 - $40,000) 79,646 34,172 113,818 39.3% Low-Low(<$20,000) 4,806 2,142 6,948 2.4%
Notes: 1- density calculation based on zip code data from 2000 US Census; 2 - income classifications based on zip code data from 2000 US Census
Special Note: 1,788 records could not be matched to zip code reference file

31
-0.501.001.502.002.503.003.504.00
All Reasons
FTA - Parking
FTA - Moving vio
lation
Drug Offenses - CDRA
Uninsured motorist
Nonpay child su
pport
Driving while s
uspended
Nonpay Ins surch
arges
Nonpay court p
ay plan
FTA - Nondrivi
ngPoints DUI
Lower Income Middle Income High Income
Figure 4. Proportion of suspended drivers to licensed drivers by reason and area type – Income (May 2004)
-
0.50
1.00
1.50
2.00
2.50
All Reaso
ns
FTA - Park
ing
FTA - Movin
g violati
on
Drug Offen
ses - C
DRA
Uninsured m
otorist
Nonpay
child s
upport
Driving while
suspe
nded
Nonpay In
s surc
harges
Nonpay c
ourt pa
y plan
FTA - Nondr
ivingPoin
ts DUI
Urban Suburban Rural Figure 5. Proportion of suspended drivers to licensed drivers by reason and area type –
Population Density (May 2004)

32
Table 8 - Suspension rates by area type and income class (May 2004)
Suspension Rates 1 Male Female Total Statewide 7% 3% 5% By Population Density 2
Urban (>800 p/sq mi) 10% 4% 7% Suburban (200-800 p/sq mi) 4% 2% 3% Rural (<200 p/sq mi) 4% 2% 3% Unknown *
By HH Income Class3 High (>$85,000) 2% 1% 1% Middle High ($65,001 - $85,000) 3% 1% 2% Middle ($40,001 - $65,000) 6% 3% 4% Low ($20,000 - $40,000) 16% 7% 12% Low-Low(<$20,000) 35% 14% 24%
Notes: 1 – Suspension rates were calculated by dividing the number of suspended drivers by the number of licensed drivers in each zip code. The rates reported in this table represent the ratio of suspended drivers to licensed drivers;
2- density calculation based on zip code data from 2000 US Census; 3 - income classifications based on zip code data from 2000 US Census;
Special Note: 1,788 records could not be matched to zip code reference file
As shown in table 8, suspension rates among certain classes of drivers are disproportionately high. For example, 35 percent of male drivers residing in low-low income zip codes have suspended licenses, compared to the statewide average of seven percent for all male drivers. Although there are only 4,806 suspended male drivers residing in low-low income zip codes, the disparity between income classes is significant. Also noteworthy is the finding that drivers living in urban areas (population density greater than 800 persons/mi2) have suspension rates more than two times higher than their suburban and rural counterparts, seven percent versus three percent.
When reviewing the data presented in table 8, it is important to note that the MVC driver history database does not include specific demographic data on individual drivers. As such, the reader should be careful when interpreting the data with regard to income. No direct relationship can be drawn between individual suspended drivers and their income level. The data must be interpreted in the aggregate. Suspension rates reported in the table represent the ratio of suspended drivers to licensed drivers in any given zip code.
Reasons for Suspension
The MVC utilizes event codes to denote suspensions on driver history records. There are far fewer “reasons” for suspensions in New Jersey than there are “event codes.” For example, there are at least seven event codes used to denote drivers suspended for accumulating motor vehicle violation points. Specifically, there are over 600 suspension event codes, but approximately twelve underlying “reasons” for suspension that account for the vast majority (90 percent) of suspensions ordered or confirmed

33
each year. Overall, the two categories of suspensions with the highest annual volume are failure to pay MVC insurance surcharges, followed by failure to appear in court to answer/pay parking tickets. Table 9 presents the average number of suspensions ordered or confirmed by MVC each year for the top twelve “reasons” for suspension.
Table 9 - Average number of suspensions ordered/confirmed by MVC annually – Top twelve “reasons”
Reason for suspension Number of suspension
orders
Percent of total
1. Failure to pay MVC insurance surcharge 228,000 28% 2. Failure to appear in court to satisfy a parking summons
(Parking Offenses Adjudication Act) 140,000 17%
3. Failure to appear in court to satisfy a summons (moving violations, municipal ordinances)
121,000 15%
4. Failure to comply with a court ordered installment plan or to satisfy other requirements of a court sentence (rehabilitation program, community service, court surcharges or assessments)
70,000 8%
5. Driving while suspended 47,000 6% 6. Failure to comply with a child support order 25,000 3% 7. Operating a vehicle under the influence of alcohol or
drugs 25,000 3%
8. Uninsured motorist – Insurance cancelled or court ordered suspension for driving an uninsured motor vehicle
25,000 3%
9. Accumulation of points from moving violations/persistent violator
22,000 3%
10. Drug related offenses under the Comprehensive Drug Reform Act
20,500 2%
11. Failure to make good on dishonored checks submitted to courts and/or MVC for fees
9,000 1%
12. Serious moving violations (reckless driving, leaving the scene of accident, high speed)
6,000 1%
Source: NJ Motor Vehicle Commission
As recognized in table 9, in New Jersey, driver’s license suspensions are imposed for both driving and non-driving related reasons. Some of the non-driving related reasons for license suspension, such as drug offenses and failure to pay child support, were instituted by the State in response to Federal statutory requirements.

34
New Jersey Point System
The MVC monitors driving behavior by means of a point system. The current point system has been in effect since March 1, 1977. As shown in table11, points are given to drivers for various moving violations. Ninety percent of New Jersey’s licensed drivers have zero points on their driving records. Approximately one half of one percent has six points, the threshold for MVC advisory action/notice. Less than one half of one percent has twelve or more points, which places them at the level for MVC action in terms of suspension or mandatory Driver Improvement Program (DIP) attendance.
As noted earlier, the MVC utilizes “event codes” to record violations, suspensions and other MVC and court actions on driver history records. There are a total of 1,795 individual event codes. Of these, 332 are used to denote violations events. Of the latter, there are 100 codes for point-carrying violations, and 232 codes for non-point violations. In July 2000, the New Jersey Legislature passed legislation (N.J.S.A. 39:4-97.2, effective July 24, 2000) creating a new traffic violation, unsafe operation of a motor vehicle, for which no points are assessed for first and second offenses. The law makes it unlawful to operate a motor vehicle in an “…unsafe manner likely to endanger a person or property.” This law change, which created the non-point carrying “unsafe driving” offense, provided an increased opportunity for prosecutors and the courts to downgrade point-carrying violations into penalties that only carry a fine. In 2004, the law was amended to add a $250 surcharge to the fines, fees and other charges already assessed when convicted of unsafe driving pursuant to N.J.S.A. 39:4-97.2
In terms of non-point violations, according to data provide by the MVC, the most numerous violations entered on driver history records appear in table 10.
Table 10: Non-point violation events recorded annually by MVC
Offense Citation Annual number of events Unsafe driving 39:4-97.2 150-200,000 Fictitious plates 39:3-33 65,000 Unlicensed driving 39:3-10 52,000 Operate while suspended 39:3-40 41,000 Obstructing passage 39:4-67 25,000 DUI 39:4-50a 24,000 Uninsured vehicle 39:6B-2 10,000
Source: NJ Motor Vehicle Commission
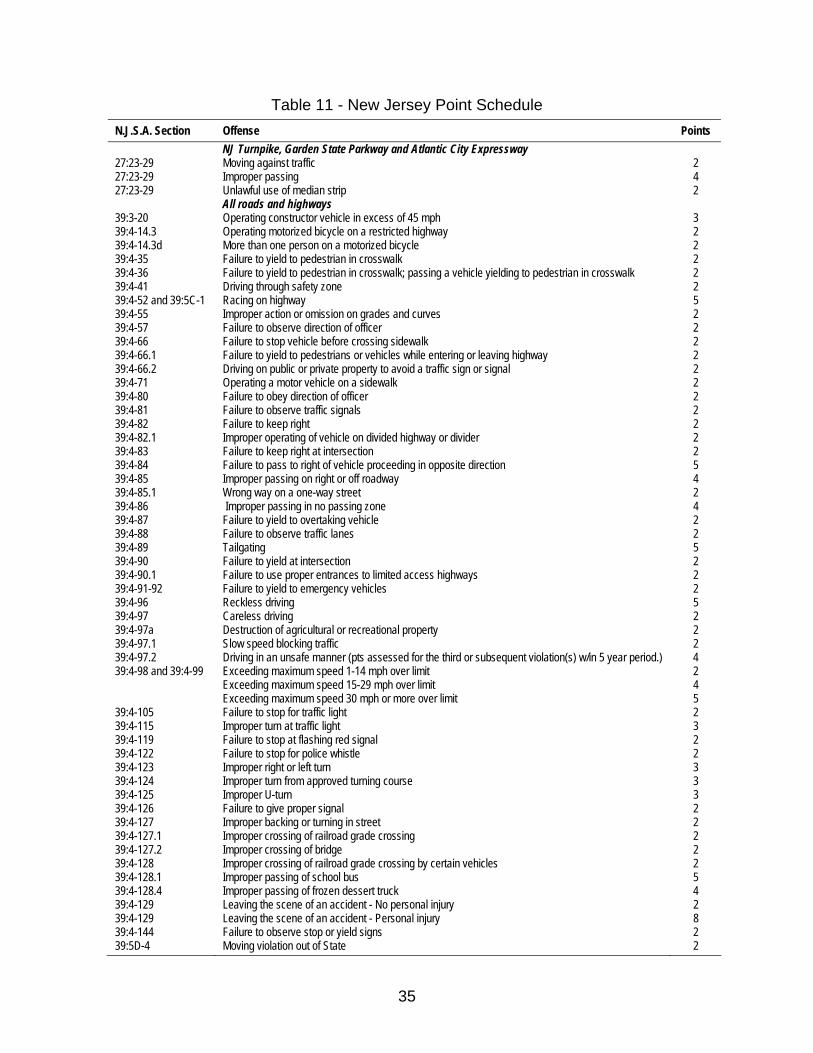
35
Table 11 - New Jersey Point Schedule N.J.S.A. Section Offense Points NJ Turnpike, Garden State Parkway and Atlantic City Expressway 27:23-29 Moving against traffic 2 27:23-29 Improper passing 4 27:23-29 Unlawful use of median strip 2 All roads and highways 39:3-20 Operating constructor vehicle in excess of 45 mph 3 39:4-14.3 Operating motorized bicycle on a restricted highway 2 39:4-14.3d More than one person on a motorized bicycle 2 39:4-35 Failure to yield to pedestrian in crosswalk 2 39:4-36 Failure to yield to pedestrian in crosswalk; passing a vehicle yielding to pedestrian in crosswalk 2 39:4-41 Driving through safety zone 2 39:4-52 and 39:5C-1 Racing on highway 5 39:4-55 Improper action or omission on grades and curves 2 39:4-57 Failure to observe direction of officer 2 39:4-66 Failure to stop vehicle before crossing sidewalk 2 39:4-66.1 Failure to yield to pedestrians or vehicles while entering or leaving highway 2 39:4-66.2 Driving on public or private property to avoid a traffic sign or signal 2 39:4-71 Operating a motor vehicle on a sidewalk 2 39:4-80 Failure to obey direction of officer 2 39:4-81 Failure to observe traffic signals 2 39:4-82 Failure to keep right 2 39:4-82.1 Improper operating of vehicle on divided highway or divider 2 39:4-83 Failure to keep right at intersection 2 39:4-84 Failure to pass to right of vehicle proceeding in opposite direction 5 39:4-85 Improper passing on right or off roadway 4 39:4-85.1 Wrong way on a one-way street 2 39:4-86 Improper passing in no passing zone 4 39:4-87 Failure to yield to overtaking vehicle 2 39:4-88 Failure to observe traffic lanes 2 39:4-89 Tailgating 5 39:4-90 Failure to yield at intersection 2 39:4-90.1 Failure to use proper entrances to limited access highways 2 39:4-91-92 Failure to yield to emergency vehicles 2 39:4-96 Reckless driving 5 39:4-97 Careless driving 2 39:4-97a Destruction of agricultural or recreational property 2 39:4-97.1 Slow speed blocking traffic 2 39:4-97.2 Driving in an unsafe manner (pts assessed for the third or subsequent violation(s) w/in 5 year period.) 4 39:4-98 and 39:4-99 Exceeding maximum speed 1-14 mph over limit 2 Exceeding maximum speed 15-29 mph over limit 4 Exceeding maximum speed 30 mph or more over limit 5 39:4-105 Failure to stop for traffic light 2 39:4-115 Improper turn at traffic light 3 39:4-119 Failure to stop at flashing red signal 2 39:4-122 Failure to stop for police whistle 2 39:4-123 Improper right or left turn 3 39:4-124 Improper turn from approved turning course 3 39:4-125 Improper U-turn 3 39:4-126 Failure to give proper signal 2 39:4-127 Improper backing or turning in street 2 39:4-127.1 Improper crossing of railroad grade crossing 2 39:4-127.2 Improper crossing of bridge 2 39:4-128 Improper crossing of railroad grade crossing by certain vehicles 2 39:4-128.1 Improper passing of school bus 5 39:4-128.4 Improper passing of frozen dessert truck 4 39:4-129 Leaving the scene of an accident - No personal injury 2 39:4-129 Leaving the scene of an accident - Personal injury 8 39:4-144 Failure to observe stop or yield signs 2 39:5D-4 Moving violation out of State 2

36
In 2003 and 2004 the annual percentages of point and non-point violations have held steady at around 45 percent point and 55 percent non-point violations as reported to MVC by the courts. However, since the year 2000, when the unsafe driving violation took effect, the percentage of non-point violations increased from 46 percent to 56 percent of total violations, and the percentage of point violations decreased from 54 percent to 44 percent of total.
Points are reduced for unbroken twelve month periods of violation-free driving and for attending mandatory State-run DIP, Probationary Driver Programs (PDP) and voluntary Defensive Driving Programs (DDP) approved by MVC. The DIP is designed as a three-hour classroom session managed by the MVC. The target audience for the program is experienced drivers who have accumulated twelve or more points under the MVC point system. There is a $100 “school” fee for participating in the Program (payable to MVC) and there are fifteen “school” sites located throughout New Jersey offering the Program.
Drivers who have accumulated 12-14 points in a period greater than two years are offered the program on their scheduled suspension notice as an option to suspension. Other drivers may go to school in lieu of part or all of a proposed point suspension as a result of a pre-hearing settlement conference, an administrative law judge's decision that is affirmed by the MVC, or a final MVC decision. Drivers who fail to attend the program as scheduled are suspended for the period specified in their original scheduled suspension notice, settlement agreement or hearing decision.
The PDP is a four hour classroom program managed by the MVC for new drivers who have accumulated four or more points for two violations committed within a two year period after their first driver exam permit is issued. The fee for participating in the program is $100, payable to MVC. PDPs are held at the same sites as the DIPs. If the offender fails to complete the program, he/she is suspended indefinitely until the course is completed and restoration fee paid.
Drivers who have completed the DIP or PDP receive a point reduction credit of three points against any points on their driving record. These credits may only be received once in any given two year period. Drivers are also warned they are subject to license suspension for any motor vehicle violation committed within one year after completing the course, with the precise suspension period dependent upon how soon the violation is committed following program completion.
Drivers who complete a voluntary DDP approved by MVC receive a point reduction credit of two points against any points on their driving record. DDP credit is given for one program every five years.

37
As previously noted, an average of 22,000 license suspensions are ordered annually for accumulation of points (see table 9). Another 6,000 are ordered for serious moving violations. In May 2004, approximately 17,000 suspended drivers had at least one active suspension for accumulating points or other driving-related reasons. This excludes those suspended for driving while under the influence of alcohol or drugs (DUI). Of those, less than 10 percent (1,452) had only one active suspension for point accumulation, reckless driving or failing to complete a Probationary Driver Program with no other suspensions for other reasons. It is noteworthy that drivers suspended for purely driving-related reasons account for less than six percent of all suspended drivers.
Table 12 - Suspension rates by area type and income – Point accumulation and other driving-related reasons, excluding DUI (May 2004)
Distribution of Suspended Drivers 1 Suspension Rates 2
Distribution of licensed
drivers Male Female Total % of total Male Female Total
Statewide 15,312 1,908 17,220 0.5% 0.1% 0.3% By Population Density 3 Urban (>800 p/sq mi) 43% 8,033 814 8,847 51% 0.6% 0.1% 0.3% Suburban (200-800 p/sq mi) 38% 4,810 681 5,491 32% 0.4% 0.1% 0.2% Rural (<200 p/sq mi) 19% 2,348 394 2,742 16% 0.4% 0.1% 0.2% Unknown 4 121 19 140 1% TOTAL 100% 15,312 1,908 17,220 100% By HH Income Class 5 High (>$85,000) 12% 636 107 743 4% 0.2% 0.0% 0.1% Middle High ($65,001 - $85,000) 25% 2,536 354 2,890 17% 0.3% 0.0% 0.2% Middle ($40,001 - $65,000) 46% 7,498 1,013 8,511 49% 0.5% 0.1% 0.3% Low ($20,000 - $40,000) 16% 4,360 396 4,756 28% 0.9% 0.1% 0.5% Low-Low(<$20,000) 0.5% 161 19 180 1% 1.2% 0.1% 0.6% Unknown 4 121 19 140 1% TOTAL 100% 15,312 1,908 17,220
Notes: 1 - Suspended drivers include currently suspended drivers who have had their driving privileges withdrawn at least one time for the stated reason. Includes point accumulation (PTPA+ PTPB+ PTPC+ PTPD), reckless driving (0496), failure to complete probationary driver program (FCPD) & persistent violator (PVPS); 2 - Ratio of suspended drivers to licensed drivers; 3 - Density calculation based on zip code data from 2000 US Census; 4 - Records could not be matched to zip code reference file; 5 - Income classifications based on zip code data from 2000 US Census
Special Note: 1,788 records could not be matched to zip code reference file

38
Table 12 presents the distribution of suspended drivers and suspension rates for those drivers suspended for point accumulation or selected other driving-related reasons (excluding DUI). As shown in the table, the distribution of drivers suspended for driving reasons is somewhat higher in urban areas than suburban and rural areas when compared to the distribution of all New Jersey licensed drivers. The same is true for lower income zip codes. However, suspension rates for driving reasons are generally similar in urban, suburban and rural areas when compared to the statewide rate of 0.3 percent. Suspension rates for driving reasons are slightly higher in lower income zip codes are slightly less than twice that of rates in higher income areas.
Operating a vehicle under the influence of drugs or alcohol
Under New Jersey law, a person who operates a motor vehicle, with a blood alcohol concentration (BAC) of 0.08 percent or above is considered to be driving under the influence (N.J.S.A. 39:4-50). Drivers convicted of driving under the influence are subject to serious fines and penalties, including court fines and fees, MVC surcharges and fees, license suspension, imprisonment, community service and participation in intoxicated driver/alcohol education programs. Mandatory driver’s license suspension for DUI offenses is required by federal law.
In New Jersey, license suspensions for DUI offenses are ordered by the courts and confirmed administratively by MVC. Suspension periods range from three months for a first time DUI offense where the driver’s BAC is 0.08 percent or higher but less than 0.10 percent, to 20 years when a driver is convicted of a third offense of DUI in a school zone or crossing. A complete schedule of DUI-related fines, fees and penalties is included in Appendix F.
As reported in table 9, approximately 25,000 DUI suspensions are confirmed by MVC each year. This represents three percent of total annual suspensions. In May 2004, approximately 32,000 suspended drivers had at least one active suspension for operating a vehicle under the influence of alcohol or drugs. As shown in table 13, the distribution of drivers suspended for DUI was very similar to the distribution of licensed drivers in urban, suburban and rural areas, slightly lower in higher income areas and slightly higher in lower income zip codes. Similarly, there is little variation in suspension rates by area type and income classification when comparing different groups to each other or to Statewide suspension rates for DUI offenses.

39
Table 13 - Suspension rates by area type and income – Operating a motor vehicle under the influence of alcohol or drugs (DUI) (May 2004)
Distribution of Suspended Drivers 1 Suspension Rates 2
Distribution of licensed
drivers Male Female Total % of total Male Female Total Statewide 26,764 5,182 31,946 0.9% 0.2% 0.5% By Population Density 3 Urban (>800 p/sq mi) 43% 11,589 1,898 13,487 42% 0.9% 0.1% 0.5% Suburban (200-800 p/sq mi) 38% 9,305 1,958 11,263 35% 0.8% 0.2% 0.5% Rural (<200 p/sq mi) 19% 5,658 1,269 6,927 22% 1.0% 0.2% 0.6% Unknown 4 212 57 269 1% TOTAL 100% 26,764 5,182 31,946 100% By HH Income Class 5 High (>$85,000) 12% 1,467 310 1,777 6% 0.4% 0.1% 0.2% Middle High ($65,001 - $85,000) 25% 4,991 1,042 6,033 19% 0.7% 0.1% 0.4% Middle ($40,001 - $65,000) 46% 14,118 2,971 17,089 53% 1.0% 0.2% 0.6% Low ($20,000 - $40,000) 16% 5,820 791 6,611 21% 1.2% 0.2% 0.7% Low-Low(<$20,000) 0.5% 156 11 167 1% 1.1% 0.1% 0.6% Unknown 4 212 57 269 1% TOTAL 100% 26,764 5,182 31,946 100%
Notes: 1 - Suspended drivers include currently suspended drivers who have their driving privilege withdrawn for a DUI offense (0450); 2 - Ratio of suspended drivers to licensed drivers; 3 - Density calculation based on zip code data from 2000 US Census; 4 - Records could not be matched to zip code reference file; 5 - Income classifications based
on zip code data from 2000 US Census
Special Note: 1,788 records could not be matched to zip code reference file
Driving while suspended or revoked
New Jersey law establishes strict penalties for driving while suspended or revoked (N.J.S.A. 39:3-40). Depending on the offense and the reason for the original suspension, drivers convicted of driving while suspended or revoked are subject to fines ranging from $500 to $3,000, up to 180 days imprisonment, and mandatory license suspension for periods ranging from up to six months to 30 months in addition to the period of the original suspension. Table 15 provides a schedule of mandatory minimum and maximum fines and penalties for driving while suspended/revoked.
Approximately 47,000 suspensions for driving while suspended/revoked are confirmed by MVC each year. This accounts for about six percent of all annual suspensions. In May 2004, 58,726 suspended drivers had at least one active suspension for this reason. Table 14 presents the distribution of suspended drivers and suspension rates for those suspended for driving while suspended/revoked. As shown in the table, the distribution of drivers suspended for this reason is significantly higher in urban and lower income areas than in suburban and rural areas when compared to the distribution of all licensed drivers. Although less than half of the State’s licensed drivers reside in urban areas, 60 percent of drivers suspended for driving while suspended live in urban zip codes.

40
The same is true for lower income zip codes. Although drivers living in lower income zip codes make up only 16.5 percent of all licensed drivers in the state, 43 percent of drivers suspended for driving while suspended reside in low income areas. This pattern can also be seen when reviewing suspension rates by area type and income class. Suspension rates for driving while suspended or revoked for urban residents are two times higher than suspension rates for this reason among suburban and rural residents. In low income areas, suspension rates are 1.5 to five times higher than the statewide average for both male and female drivers.
Table 14 - Suspension rates by area type and income – Driving while suspended or revoked (May 2004)
Distribution of Suspended Drivers 1 Suspension Rates 2
Distribution of licensed
drivers Male Female Total % of total Male Female Total
Statewide 48,136 10,590 58,726 1.6% 0.3% 1.0% By Population Density 3 Urban (>800 p/sq mi) 43% 29,193 6,146 35,339 60% 2.2% 0.5% 1.3% Suburban (200-800 p/sq mi) 38% 12,328 2,811 15,139 26% 1.1% 0.2% 0.6% Rural (<200 p/sq mi) 19% 6,320 1,578 7,898 13% 1.1% 0.3% 0.7% Unknown 4 295 55 350 1% TOTAL 48,136 10,590 58,726 100%
By HH Income Class 5 High (>$85,000) 12% 990 235 1,225 2% 0.3% 0.1% 0.2% Middle High ($65,001 - $85,000) 25% 4,820 1,110 5,930 10% 0.6% 0.1% 0.4% Middle ($40,001 - $65,000) 46% 20,770 4,923 25,693 44% 1.5% 0.3% 0.9% Low ($20,000 - $40,000) 16% 20,096 4,019 24,115 41% 4.1% 0.8% 2.4% Low -low(<$20,000) 0.5% 1,165 248 1,413 2% 8.4% 1.7% 4.9% Unknown 4 295 55 350 1% TOTAL 48,136 10,590 58,726 100%
Notes: 1 - Suspended drivers include currently suspended drivers who have their driving privilege withdrawn for a driving while suspended (0340); 2 - Ratio of suspended drivers to licensed drivers; 3 - Density calculation based on
zip code data from 2000 US Census; 4 - Records could not be matched to zip code reference file; 5 - Income classifications based on zip code data from 2000 US Census
Special Note: 1,788 records could not be matched to zip code reference file

41
Table 15 - Schedule of fines and penalties for driving while suspended/revoked
Original reason for suspension Suspension of license and/or registration
Court Fine Prison
General provisions [N.J.S.A. 39:3-40] 1st Offense Up to 6 months $500 n/a 2nd Offense Up to 6 months $750 Up to 5 days 3rd Offense or subsequent Up to 6 months $1,000 10 days
Driving without insurance [N.J.S.A. 39:3-40 (f)(1)]
1st Offense 12-30 months $1,000 Up to 90 days 2nd Offense 12-30 months $1,250 Up to 90 days 3rd Offense or subsequent 12-30 months $1,500 10 - 90 days
DUI; Refusal to submit to a breath/chemical test; Habitual offender [N.J.S.A. 39:3-40 (f) (2)]
1st Offense 12-30 months $1,000 Up to 90 days 2nd Offense 12-30 months $1,250 10-90 days 3rd Offense or subsequent 12-30 months $1,500 10-90 days
DUI or refusal to submit to a breath/chemical test while in a school zone or crossing; [N.J.S.A. 39:3-40 (f) (3)]
1st Offense 12-30 months $1,000 60-90 days 2nd Offense 12-30 months $1,250 120-150 days 3rd Offense or subsequent 12-30 months $1,500 180 days
Non-payment of MVC insurance surcharge [39:3-40 (g)]
1st Offense Up to 6 months $500 n/a 2nd Offense Up to 6 months $750 Up to 5 days 3rd Offense or subsequent Up to 6 months $1,000 10 days Note: An additional fine of $3,000 is collected by MVC if the total surcharge imposed is not paid prior to court appearance.
Failure to appear in court or pay a parking judgment [N.J.S.A. 39:3-40 (i)]
n/a Up to $100
Source: N.J.S.A. 39:3-40
Insurance Surcharge Program
In 1983, the New Jersey Legislature enacted the New Jersey Merit Rating Plan (N.J.S.A. 17:29 A-35), which required MVC to assess “insurance” surcharges based on certain motor vehicle offenses. According to the statute, motorists accumulating six or more points in a three year period are subject to a surcharge of $150 for the first six points and $25 for each additional point thereafter. Currently, New Jersey is one of only four States in the Nation with such a surcharge program. The other states include New York, Texas, and Michigan.

42
Surcharges are levied each year for three years and are in addition to any court-imposed fines and/or penalties. Point totals are based on the date the violation was posted, not when the violation occurred. Point system reductions received for participation in a DIP, PDP or through annual point reductions for violation-free driving do not apply to the surcharge program.
In addition to point-related surcharges, the statute also requires MVC to impose surcharges for certain other offenses. Table 16 lists the offenses which are subject to surcharge, annual surcharge amounts and the total surcharges to be paid at the end of the three year surcharge period.
Table 16 - Offenses subject to insurance surcharge
Offense Annual Surcharge
Total Surcharge
Driving Under the Influence (DUI) and/or refusal to submit to chemical test (1st & 2nd offense)
$1,000 $3,000
DUI – 3rd offense in three year period $1500 $4,500 Unlicensed driver $100 $300 No insurance (Moped) $100 $300 Driving while suspended $250 $750 No liability insurance $250 $750
Source: NJ Motor Vehicle Commission
Note: Surcharges apply each year for three years.
All new surcharges must be paid within 12 months of assessment either in full or as part of a payment plan. If a driver fails to make surcharge payments or fails to pay the full surcharge amount within 12 months, MVC will suspend all driving privileges indefinitely and file judgment action in the State Superior Court. Actions may include a lien against real property, garnishment of wages, or other similar actions.
As highlighted earlier in the report, the top “reason” for driver’s license suspension in New Jersey is failure to pay MVC insurance surcharges. On average, 228,000 license suspensions are ordered for this reason annually. This represents 28 percent of all suspensions ordered or confirmed by MVC each year. In May 2004, more than 132,000 drivers with active suspensions had at least one suspension for failing to pay MVC insurance surcharges. Of those, slightly more than 10 percent (14,132 drivers) had only one suspension for this reason and no other suspensions for other reasons.

43
As shown in table 17, the distribution of drivers suspended for failing to pay MVC insurance surcharges is significantly higher in urban areas than in suburban and rural areas. While 43 percent of all New Jersey licensed drivers reside in urban zip codes, 59 percent of drivers suspended for failing to pay surcharges live there. Even more significant is the fact that although only 16.5 percent of licensed drivers reside in lower income zip codes, a full 40 percent of those suspended for failing to pay MVC insurance surcharges live there.
These patterns are similarly apparent when reviewing suspension rates among different groups of drivers. Suspension rates for non-payment of insurance surcharges are two times higher in urban areas than suburban and rural parts of the State. In lower income areas, suspension rates are two to four times higher than the Statewide average for both male and female drivers.
Table 17 - Suspension rates by area type and income – Non-payment of MVC insurance surcharges (May 2004)
Suspended Drivers 1 Suspension Rates 2
Distribution of licensed
drivers Male Female Total % of total Male Female Total
Statewide 103,097 29,558 132,655 3.4% 0.9% 2.1% By Population Density 3 Urban (>800 p/sq mi) 43% 61,929 16,809 78,738 59% 4.7% 1.3% 3.0% Suburban (200-800 p/sq mi) 38% 26,847 8,035 34,882 26% 2.3% 0.7% 1.5% Rural (<200 p/sq mi) 19% 13,580 4,507 18,087 14% 2.4% 0.8% 1.6% Unknown 4 741 207 948 1% TOTAL 103,097 29,558 132,655 100%
By HH Income Class 5 High (>$85,000) 12% 2,894 807 3,701 3% 0.8% 0.2% 0.5% Middle High ($65,001 - $85,000) 25% 12,299 3,554 15,853 12% 1.6% 0.4% 1.0% Middle ($40,001 - $65,000) 46% 45,538 13,914 59,452 45% 3.2% 1.0% 2.1% Low ($20,000 - $40,000) 16% 39,574 10,544 50,118 38% 8.0% 2.1% 5.1% Low-Low(<$20,000) 0.5% 2,051 532 2,583 2% 14.9% 3.6% 9.0% Unknown 4 1,303 485 1,788 1% TOTAL 103,659 29,836 133,495 101%
Notes: 1 - Suspended drivers include currently suspended drivers who have their driving privilege withdrawn for a non-payment of insurance surcharge (ISNP); 2 - Ratio of suspended drivers to licensed drivers; 3 - Density
calculation based on zip code data from 2000 US Census; 4 - Records could not be matched to zip code reference file; 5 - Income classifications based on zip code data from 2000 US Census
Special Note: 1,788 records could not be matched to zip code reference file

44
The Parking Offenses Adjudication Act (POAA)
According to the New Jersey Administrative Office of the Courts (AOC), in fiscal year 2005 (July 1, 2004 to June 30, 2005), municipal jurisdictions in New Jersey issued more than 2.9 million parking tickets. Fines, which are established by municipal ordinance, range from $17 to $130 with most under $50.
The vast majority of parking tickets are paid without court action. The Parking Offenses Adjudication Act, N.J.S.A. 39:4-139.2 et seq., was enacted in January 1985 and became effective in July of the same year. The law authorized municipal court judges to suspend driving privileges when an individual cited for a parking offense fails to pay the fine and then fails to appear in court to pay or satisfy the ticket. Therefore, under the law, parking offense suspensions originate in the municipal court system.
As shown in figure 6, the POAA has been very effective in reducing the number of outstanding parking tickets pending over 60 days. In 1990, there were almost 4.4 million parking tickets that remained unpaid longer than two months. That number dropped precipitously through the 1990’s as more municipal court systems became automated. In 2004, the number of parking tickets pending over 60 days was less than 400,000.
0
500,000
1,000,000
1,500,000
2,000,000
2,500,000
3,000,000
3,500,000
4,000,000
4,500,000
5,000,000
1990
1991
1992
1993
1994
1995
1996
1997
1998
1999
2000
2001
2002
2003
2004
Court Year
Parking Tickets Pending Over60 DaysParking Tickets Filed
Figure 6 – Parking tickets pending over 60 days
Source: NJ Administrative Office of the Courts

45
In May 2004, 68,614 suspended drivers had at least one active suspension for failing to appear in court to answer/satisfy a parking ticket. One third, or 22,738, were suspended for only parking offenses. Of those, 14,290 had only one POAA suspension and no other suspensions for other reasons; and 8,448 had more than one POAA suspension but no other suspensions for other reasons. This represents about eight percent of all active suspended drivers.
Table 18 shows suspension rates and the distribution of drivers suspended under POAA. Patterns of POAA suspension are even more pronounced than those observed for suspensions due to non-payment of insurance surcharge. The distribution of drivers suspended for parking offenses in urban areas is significantly higher than in suburban and rural areas. Although 43 percent of licensed drivers reside in urban zip codes, 85 percent of drivers suspended for parking offenses live there. Even more significant, 59 percent of those suspended for parking offenses live in lower income areas, while only 16.5 percent of licensed drivers reside there. It is worth noting that parking restrictions are far more common in urban areas. Consequently, urban residents have a greater chance of receiving a summons for parking violations than suburban or rural residents.
Table 18 - Suspension rates by area type and income – Parking Offenses Adjudication Act (POAA) (May 2004)
Suspended Drivers 1 Suspension Rates 2
Distribution of licensed
drivers Male Female Total % of total Male Female Total
Statewide 39,271 29,343 68,614 1.3% 0.9% 1.1%
By Population Density 3 Urban (>800 p/sq mi) 43% 33,555 25,079 58,634 85% 2.5% 1.9% 2.2% Suburban (200-800 p/sq mi) 38% 4,468 3,270 7,738 11% 0.4% 0.3% 0.3% Rural (<200 p/sq mi) 19% 1,085 899 1,984 3% 0.2% 0.2% 0.2% Unknown 4 163 95 258 0% TOTAL 39,271 29,343 68,614 100%
By HH Income Class 5 High (>$85,000) 12% 888 530 1,418 2% 0% 0% 0% Middle High ($65,001 - $85,000) 25% 2,951 2,126 5,077 7% 0% 0% 0% Middle ($40,001 - $65,000) 46% 12,307 9,403 21,710 32% 1% 1% 1% Low ($20,000 - $40,000) 16% 21,560 16,023 37,583 55% 4% 3% 4% Low-Low(<$20,000) 0.5% 1,402 1,166 2,568 4% 10% 8% 9% Unknown 4 163 95 258 0% TOTAL 39,271 29,343 68,614 100%
Notes: 1 - Suspended drivers include currently suspended drivers who have their driving privilege withdrawn in accordance with the Parking Offenses Adjudication Act (POAA); 2 - Ratio of suspended drivers to licensed drivers; 3 -
Density calculation based on zip code data from 2000 US Census; 4 - Records could not be matched to zip code reference file; 5 - Income classifications based on zip code data from 2000 US Census
Special Note: 1,788 records could not be matched to zip code reference file
46
These patterns are similarly apparent when reviewing suspension rates among different groups of drivers. For urban drivers of both genders, suspension rates due to parking offenses are more than twice that of the statewide average rates and are seven to ten times greater than residents living in suburban and rural areas. For lower income residents, suspension rates are more than ten times higher than statewide rates for both male and female drivers.
Failure to Comply with a Child Support Order
The law mandating license suspension for failing to comply with a child support order was enacted originally in March 1996 and amended in March 1998 (N.J.S.A. 2A:17-56.41a). The genesis of the law can be traced to the federal Personal Responsibility and Work Opportunity Reconciliation Act of 1996, which required states to have statutes suspending the driver’s license of those who owed outstanding child support.
The law allows for suspension under the following conditions: failure to pay child support for a period of 6 months or more; failure to provide health coverage for the child for 6 months; or if the obligor fails to respond to a subpoena related to a paternity test or child support action. An obligor has 30 days from the postmark date of the notice to take the required action or make a request for a court hearing. It is critical to note that if the suspension will result in a significant hardship, a 12-month payment plan can be arranged with the court once 25 percent of the arreared monies are paid.
In New Jersey, a suspension for failing to comply with a child support order becomes effective by operation of law upon the issuance of a child support-related warrant. The suspension may be terminated when the person who owes child support pays the amount due or otherwise satisfies the court's child support order, and pays the MVC license restoration fee. Recent statistics indicate that there were 24,613 suspensions for failing to comply with a child support order in 2004 and 25,506 in 2003.
In May 2004, almost 24,000 suspended drivers had at least one suspension for failing to comply with a child support order. Of those, about 13 percent or 3,053 drivers had only one active suspension for this reason with no other suspensions for any other reason. As was the case with POAA suspensions and suspension for failing to pay insurance surcharge, a disproportionate number of drivers suspended for failing to comply with a child support order reside in urban and lower income areas (see table 19).
Once again, while 43 percent of licensed drivers reside in urban zip codes, 60 percent of drivers suspended for failing to pay child support live there. Fifty one percent of those suspended for child support reasons live in lower income areas, while only 16.5 percent of all licensed drivers reside there. Failure to pay child support suspension rates for drivers residing in lower income areas are ten times higher than the Statewide average for all drivers suspended for failing to pay child support.

47
Table 19 - Suspension rates by area type and income – Failure to comply with a child support order (May 2004)
Suspended Drivers 1 Suspension Rates 2
Distribution of licensed
drivers Male Female Total % of total Male Female Total
Statewide 21,763 2,131 23,894 0.7% 0.1% 0.4%
By Population Density 3 Urban (>800 p/sq mi) 43% 13,358 1,058 14,416 60% 1.0% 0.1% 0.5% Suburban (200-800 p/sq mi) 38% 5,265 632 5,897 25% 0.5% 0.1% 0.2% Rural (<200 p/sq mi) 19% 3,044 430 3,474 15% 0.5% 0.1% 0.3% Unknown 4 96 11 107 0% TOTAL 21,763 2,131 23,894 100% By HH Income Class 5 High (>$85,000) 12% 274 30 304 1% 0.1% 0.0% 0.0% Middle High ($65,001 - $85,000) 25% 1,702 182 1,884 8% 0.2% 0.0% 0.1% Middle ($40,001 - $65,000) 46% 8,405 912 9,317 39% 0.6% 0.1% 0.3% Low ($20,000 - $40,000) 16% 10,546 934 11,480 48% 2.1% 0.2% 1.2% Low-Low(<$20,000) 0.5% 740 62 802 3% 5.4% 0.4% 2.8% Unknown 4 96 11 107 0% TOTAL 21,763 2,131 23,894 100%
Notes: 1 - Suspended drivers include currently suspended drivers who have their driving privilege withdrawn for failing to comply with a child support order (FPCS); 2 - Ratio of suspended drivers to licensed drivers; 3 - Density
calculation based on zip code data from 2000 US Census; 4 - Records could not be matched to zip code reference file; 5 - Income classifications based on zip code data from 2000 US Census
Special Note: 1,788 records could not be matched to zip code reference file
Failure to Maintain Insurance
New Jersey became a compulsory insurance state in January 1973. A motor vehicle may not be registered or, if already registered, may not be operated, unless it is covered by specified limits of liability insurance coverage (N.J.S.A. 39:6B-1). If convicted of violations of the compulsory insurance statute, uninsured drivers/owners are suspended by the courts pursuant to the provisions of N.J.S.A. 39:6B-2. The current penalty for a first offense includes a mandatory one-year license suspension, a fine, and a period of community service. An MVC insurance surcharge is also imposed upon such offenders.
In addition, MVC enforces the law by means of the Uninsured Motorist Identification and Notification System (UMIS), administered by the New Jersey Office of Information Technology. Every month, insurance companies report auto insurance policies canceled or not renewed because of non-payment of policy premiums. The companies also report new business, replacement coverage, and reinstatement of policies without breaks in coverage.

48
One time each month, this clearinghouse identifies to MVC the vehicles affected by canceled policies not replaced by new coverage. MVC edits this data to determine if the target vehicles have been taken off the road, re-registered out-of-state, reported stolen or sold, or have lapsed registrations, and plates surrendered. Any target vehicle with current registration and plates is linked to its owner who receives a notice of scheduled suspension allowing 30 days to produce proof of current insurance or surrender of registration and plates. If the owner complies, the action is canceled. If there is no response, the owner's registration privilege is suspended indefinitely and MVC schedules the suspension of driving privileges effective in 30 days. Once both driving and registration privileges are suspended, they will not be restored until the owner complies with the above-mentioned requirements and pays MVC a $100 restoration fee for each privilege affected.
UMIS has been in operation since 1992, and since that time, over one million initial scheduled suspensions have been issued. Recent statistics indicate that court ordered suspensions for operating an uninsured vehicle numbered 9,047 in 2004 and 9,718 in 2003. MVC initiated 46,559 and 58,509 suspensions for failing to maintain proper insurance in calendar years 2004 and 2003 respectively.
In May 2004, 53,252 suspended drivers had active suspensions for failing to maintain proper insurance. Of those, 14,698 or 28 percent had only one active suspension for this reason and no other suspensions for any other reason. Table 20 shows suspension rates and the distribution of drivers suspended for failing to maintain proper insurance. Drivers suspended for this reason are more heavily concentrated in urban and low-income areas than licensed drivers as a whole. Again, more than 60 percent of drivers suspended for insurance reasons reside in urban areas. Forty percent reside in lower income zip codes.
Similar to the patterns observed for other primarily money-related reasons for suspension, there appears to be a relationship between suspension rates for failing to maintain proper insurance and income. Failure to maintain insurance suspension rates for drivers residing in lower income zip codes are almost seven times higher than the statewide average rates for that offense.

49
Table 20 - Suspension rates by area type and income – Failure to maintain proper insurance (May 2004)
Suspended Drivers 1 Suspension Rates 2
Distribution of licensed
drivers Male Female Total % of total Male Female Total
Statewide 34,641 18,611 53,252 1.1% 0.6% 0.9% By Population Density 3 Urban (>800 p/sq mi) 43% 21,860 11,082 32,942 62% 1.7% 0.8% 1.2% Suburban (200-800 p/sq mi) 38% 8,391 4,796 13,187 25% 0.7% 0.4% 0.6% Rural (<200 p/sq mi) 19% 4,204 2,638 6,842 13% 0.7% 0.4% 0.6% Unknown 4 186 95 281 1% TOTAL 34,641 18,611 53,252 100%
By HH Income Class 5 High (>$85,000) 12% 1,131 606 1,737 3% 0.3% 0.2% 0.2% Middle High ($65,001 - $85,000) 25% 4,311 2,324 6,635 12% 0.6% 0.3% 0.4% Middle ($40,001 - $65,000) 46% 14,712 8,413 23,125 43% 1.0% 0.6% 0.8% Low ($20,000 - $40,000) 16% 13,524 6,799 20,323 38% 2.7% 1.4% 2.1% Low-Low(<$20,000) 0.5% 777 374 1,151 2% 5.6% 2.5% 4.0% Unknown 4 186 95 281 1% TOTAL 34,641 18,611 53,252 100%
Notes: 1 - Suspended drivers include currently suspended drivers who have their driving privilege withdrawn for failing to maintain proper insurance (06B2+ICRG+ICLC); 2 - Ratio of suspended drivers to licensed drivers; 3 -
Density calculation based on zip code data from 2000 US Census; 4 - Records could not be matched to zip code reference file; 5 - Income classifications based on zip code data from 2000 US Census
Special Note: 1,788 records could not be matched to zip code reference file
Comprehensive Drug Reform Act (CDRA)
The New Jersey Code of Criminal Justice (N.J.S.A. 2C:35-16) previously required mandatory driver’s license suspension for those convicted of an offense involving a controlled dangerous substance (CDS) or drug paraphernalia. This law was enacted in 1987 in response to a federal law requiring states to enact license suspension for drug offenses as a condition of continuing to receive certain federal funds (e.g., Temporary Aid to Needy Families and others).
Federal requirements in this regard allow states several options for compliance. These include: 1) require driver’s license suspension in all CDS cases; 2) require driver’s license suspension in CDS cases unless there are “compelling circumstances warranting an exception”; and 3) certification by the Governor and the State Legislature that they are opposed to enacting such a law. Until January 5, 2006, New Jersey law required drivers’ license suspension in all CDS cases. On January 5, 2006, the New Jersey Legislature passed an amendment to N.J.S.A. 2C:35-16 authorizing courts to

50
refrain from imposing driver’s license suspension on defendants convicted of CDS offenses if “compelling circumstances” exist.
Table 21 - Suspension rates by area type and income – Drug offenses under the Comprehensive Drug Reform Act (May 2004)
Suspended Drivers 1 Suspension Rates 2
Distribution of licensed
drivers Male Female Total % of total Male Female Total
Statewide 28,174 4,878 33,052 0.9% 0.2% 0.5% By Population Density 3 Urban (>800 p/sq mi) 43% 19,097 3,181 22,278 67% 1.4% 0.2% 0.8% Suburban (200-800 p/sq mi) 38% 6,157 1,152 7,309 22% 0.5% 0.1% 0.3% Rural (<200 p/sq mi) 19% 2,788 525 3,313 10% 0.5% 0.1% 0.3% Unknown 4 132 20 152 0% TOTAL 28,174 4,878 33,052 100% By HH Income Class 5 High (>$85,000) 12% 416 66 482 1% 0.1% 0.0% 0.1% Middle High ($65,001 - $85,000) 25% 2,081 413 2,494 8% 0.3% 0.1% 0.2% Middle ($40,001 - $65,000) 46% 9,824 1,945 11,769 36% 0.7% 0.1% 0.4% Low ($20,000 - $40,000) 16% 14,447 2,190 16,637 50% 2.9% 0.4% 1.7% Low-Low(<$20,000) 0.5% 1,274 244 1,518 5% 9.2% 1.6% 5.3% Unknown 4 132 20 152 0% TOTAL 28,174 4,878 33,052 100%
Notes: 1 - Suspended drivers include currently suspended drivers who have their driving privilege withdrawn for convictions under the Comprehensive Drug Reform Act (CDRA); 2 - Ratio of suspended drivers to licensed drivers; 3
- Density calculation based on zip code data from 2000 US Census; 4 - Records could not be matched to zip code reference file; 5 - Income classifications based on zip code data from 2000 US Census
Special Note: 1,788 records could not be matched to zip code reference file
The MVC serves a purely administrative function regarding CDRA suspensions. MVC actions are limited to confirming suspension ordered by the courts. In 2003 and 2004, MVC confirmed 23,131 and 20,567 CDRA suspensions respectively. In May 2004, 33,052 suspended drivers had at least one active CDRA suspension. Of those, 4,199 or 12 percent had only one CDRA suspension and no other suspensions for any other reason.
Table 21 shows suspension rates and the distribution of drivers with CDRA suspensions. Once again, drivers suspended for this reason are more heavily concentrated in urban and low-income areas. Sixty seven percent of drivers suspended for drug offenses reside in urban areas. Fifty five percent reside in lower income zip codes. CDRA suspension rates for drivers residing in lower income zip codes are seven to ten times higher than the statewide average rates.

51
Failure to appear in court
As noted earlier in this report, driver’s license suspension as a result of failing to appear in court (FTA) for reasons other than parking offenses is the third most frequent suspension ordered or confirmed by MVC each year. FTA suspensions can occur for both motor vehicle moving violations and for other violations of municipal ordinances.
The process for suspensions related to failure to appear in court for moving violations is generally as follows: The offender is ordered to appear in court. If s/he fails to appear, the judge can issue an arrest warrant. This course of action is rarely pursued. More typically, a Failure to Appear Notice (FTA) is generated and sent to the offender. If s/he fails to address the FTA within 30 days, the courts send the FTA to MVC who initiate the administrative suspension process. MVC provides FTA moving violation offenders 60 days to resolve the issue.
In terms of suspension for failure to appear for a non-traffic matter such as a local ordinance violation, a warrant is most typically issued; however, if the court has the license number of the offender, suspension can also be ordered. The MVC serves a purely administrative function regarding FTA suspensions for non-driving reasons. Its actions are limited to confirming suspension ordered by the courts. In 2004, MVC confirmed 15,316 suspensions ordered by the courts because defendants failed to appear to answer a summons for non-driving reasons other than parking offenses.
In 2004, MVC imposed 105,971 suspensions ordered against drivers who failed to appear in court to answer a summons for a moving violation. In May 2004, 119,733 suspended drivers had at least one suspension for failing to appear in a court of law to answer/satisfy a summons issued for a motor vehicle moving violation. This represents 41 percent of all drivers with active suspensions. While drivers suspended for FTA on a moving violation are not technically being suspended as a direct result of their driving behavior, it is important to note that the underlying reason for them being called to court is because they violated a traffic law.
Table 22 shows suspension rates and the distribution of drivers suspended for FTA for moving violations. As shown in the table, the distribution of drivers suspended for this reason is disproportionately high in urban and lower income areas. While 46 percent of licensed drivers live in urban areas, 70 percent of those suspended for FTA on moving violations reside there. Similarly, only 16.5 percent of the State’s licensed drivers reside in lower income zip codes, while 49 percent of drivers suspended for FTA on moving violations live there.
These patterns are also evident when reviewing suspension rates for this offense. Suspension rates for drivers residing in urban areas are three times higher than for

52
drivers living in suburban and rural areas. Suspension rates for drivers residing in lower income zip codes are seven times higher than residents living in higher income areas.
Table 22 - Suspension rates by area type and income – Failure to appear in court to answer a summons for a motor vehicle moving violation (May 2004)
Suspended Drivers 1 Suspension Rates 2
Distribution of licensed
drivers Male Female Total % of total Male Female Total
Statewide 90,011 29,722 119,733 3.0% 0.9% 1.9%
By Population Density 3 Urban (>800 p/sq mi) 43% 63,180 20,439 83,619 70% 4.8% 1.5% 3.1% Suburban (200-800 p/sq mi) 38% 18,541 6,263 24,804 21% 1.6% 0.5% 1.0% Rural (<200 p/sq mi) 19% 7,851 2,888 10,739 9% 1.4% 0.5% 0.9% Unknown 4 439 132 571 0% TOTAL 90,011 29,722 119,733 100% By HH Income Class 5 High (>$85,000) 12% 1,978 650 2,628 2% 0.5% 0.2% 0.4% Middle High ($65,001 - $85,000) 25% 8,556 2,860 11,416 10% 1.1% 0.4% 0.7% Middle ($40,001 - $65,000) 46% 34,255 11,676 45,931 38% 2.4% 0.8% 1.6% Low ($20,000 - $40,000) 16% 41,751 13,378 55,129 46% 8.5% 2.7% 5.6% Low-Low(<$20,000) 0.5% 3,032 1,026 4,058 3% 22.0% 6.9% 14.2% Unknown 4 439 132 571 0% TOTAL 90,011 29,722 119,733 100%
Notes: 1 - Suspended drivers include currently suspended drivers who have their driving privilege withdrawn for failing to appear in a court of law to answer/satisfy a summons issued for a motor vehicle moving violation (FSFA);
2 - Ratio of suspended drivers to licensed drivers; 3 - Density calculation based on zip code data from 2000 US Census; 4 - Records could not be matched to zip code reference file; 5 - Income classifications based on zip code
data from 2000 US Census
Special Note: 1,788 records could not be matched to zip code reference file
In May 2004, 25,285 suspended drivers had at least one suspension for failing to appear in a court to answer/satisfy a summons issued for violations of municipal ordinance other than moving violations and parking (i.e., FTA for non-driving reasons). This figure represents approximately nine percent of all drivers with active suspensions.
Table 23 shows suspension rates and the distribution of drivers suspended for FTA for non-driving reasons. As shown in the table, the distribution of drivers suspended for FTA associated with non-driving offenses is once again higher in urban and lower income areas. While 46 percent of licensed drivers live in urban areas, 55 percent of those suspended for FTA on non-moving violations reside there. Similarly, only 16.5 percent of the State’s licensed drivers reside in lower income zip codes, while 40 percent of drivers suspended for FTA on non-moving violations live there. Suspension rates for drivers residing in urban areas are 1.6 times higher than for drivers living in

53
suburban and rural areas. Suspension rates for drivers residing in lower income zip codes are almost four times higher than for residents living in higher income areas.
Table 23 - Suspension rates by area type and income – Failure to appear in court to answer a summons issued for other non-driving reasons, excluding POAA (May 2004)
Suspended Drivers 1 Suspension Rates 2
Distribution of licensed
drivers Male Female Total % of total Male Female Total
Statewide 19,104 6,181 25,285 0.6% 0.2% 0.4%
By Population Density 3 Urban (>800 p/sq mi) 43% 10,516 3,326 13,842 55% 0.8% 0.2% 0.5% Suburban (200-800 p/sq mi) 38% 5,654 1,809 7,463 30% 0.5% 0.1% 0.3% Rural (<200 p/sq mi) 19% 2,833 1,014 3,847 15% 0.5% 0.2% 0.3% Unknown 4 101 32 133 1% TOTAL 19,104 6,181 25,285 100%
By HH Income Class 5 High (>$85,000) 12% 390 125 515 2% 0.1% 0.0% 0.1% Middle High ($65,001 - $85,000) 25% 2,166 669 2,835 11% 0.3% 0.1% 0.2% Middle ($40,001 - $65,000) 46% 8,964 2,851 11,815 47% 0.6% 0.2% 0.4% Low ($20,000 - $40,000) 16% 7,157 2,377 9,534 38% 1.5% 0.5% 1.0% Low-Low(<$20,000) 0.5% 326 127 453 2% 2.4% 0.9% 1.6% Unknown 4 101 32 133 1% TOTAL 19,104 6,181 25,285 100%
Notes: 1 - Suspended drivers include currently suspended drivers who have their driving privilege withdrawn for failing to appear in a court of law to answer/satisfy a summons issued for non-driving reason other than POAA
(COFA); 2 - Ratio of suspended drivers to licensed drivers; 3 - Density calculation based on zip code data from 2000 US Census; 4 - Records could not be matched to zip code reference file; 5 - Income classifications based on zip code
data from 2000 US Census
Special Note: 1,788 records could not be matched to zip code reference file
Failure to comply with a court-ordered installment plan
In accordance with N.J.S.A. 39:4-203.1, any defendant convicted of a traffic or parking offense shall, upon a satisfactory showing of indigent status or participation in a government-based income maintenance program, be permitted by the court to pay the fine in installments. According to the statute, the courts have authority to set the amount and frequency of each installment, as long as the final installment is due no later than 12 months from the date of conviction.
In accordance with N.J.S.A. 39:4-203.2, if the defendant fails to comply with any of the terms of the installment order, the court may, in addition to any other penalties it may impose, order the suspension of the defendant's driver's license. Each year, the MVC confirms an average of 70,000 suspensions ordered by the courts for defendants that

54
fail to make payments on court ordered installment plans. In terms of overall annual volume, this is the fourth most frequent reason for suspension. In May 2004, more than 75,000 suspended drivers had at least one active suspension for this reason.
As shown in table 24, the distribution of drivers suspended for failing to comply with a court ordered installment plan is higher in urban and lower income areas than the distribution of licensed drivers in these areas. While 58 percent of drivers suspended for failing to make payments on an installment plan reside in urban areas, only 43 percent of the State’s licensed drivers live there. Similarly, 43 percent of drivers suspended for this reason live in lower income zip codes. Only 16.5 percent of licensed drivers live in lower income areas.
Suspension rates for drivers suspended for failing to comply with a court ordered installment plan living in urban areas are two times higher than for those living in suburban and rural areas; and rates for those living in lower income zip codes are more than 4 times higher than for those living in higher income areas.
Table 24 - Suspension rates by area type and income – Failure to comply with a court ordered installment payment plan (May 2004)
Suspended Drivers 1 Suspension Rates 2
Distribution of licensed drivers Male Female Total % of
total Male Female Total
Statewide 58,135 17,042 75,177 1.9% 0.5% 1.2%
By Population Density 3 Urban (>800 p/sq mi) 43% 34,303 9,611 43,914 58% 2.6% 0.7% 1.7% Suburban (200-800 p/sq mi) 38% 15,279 4,632 19,911 26% 1.3% 0.4% 0.8% Rural (<200 p/sq mi) 19% 8,217 2,708 10,925 15% 1.5% 0.5% 0.9% Unknown 4 336 91 427 1% TOTAL 58,135 17,042 75,177 100% By HH Income Class 5 High (>$85,000) 12% 1,075 306 1,381 2% 0.3% 0.1% 0.2% Middle High ($65,001 - $85,000) 25% 5,794 1,658 7,452 10% 0.8% 0.2% 0.5% Middle ($40,001 - $65,000) 46% 25,663 7,943 33,606 45% 1.8% 0.6% 1.2% Low ($20,000 - $40,000) 16% 24,043 6,737 30,780 41% 4.9% 1.4% 3.1% Low-Low(<$20,000) 0.5% 1,224 307 1,531 2% 8.9% 2.1% 5.3% Unknown 4 336 91 427 1% TOTAL 58,135 17,042 75,177 100%
Notes: 1 - Suspended drivers include currently suspended drivers who have their driving privilege withdrawn for failing to with a court ordered installment payment plan (FCIO); 2 - Ratio of suspended drivers to licensed drivers;
3 - Density calculation based on zip code data from 2000 US Census; 4 - Records could not be matched to zip code reference file; 5 - Income classifications based on zip code data from 2000 US Census
Special Note: 1,788 records could not be matched to zip code reference file

55
SUSPENDED DRIVER SURVEY
As described in detail in section two, driver’s license suspension is used as both a sanction to punish undesirable behavior(s), such as driving under the influence of drugs or alcohol and as a tool to encourage compliance with socially desirable behavior, such as paying fines and surcharges and making child support payments. While it is obvious that the threat of license suspension is intended to have deterrent as well as coercive affects, the actual suspension of someone’s driving privileges may have collateral and unintended consequences. This section describes some of the collateral and unintended consequences that result from license suspension as documented through a survey of suspended drivers in New Jersey
Survey methods
In December 2004, the research team conducted a survey of suspended drivers. The purpose of the survey was to develop a more detailed demographic profile of suspended drivers, to document the collateral and unintended impacts of license suspension, and to gauge public opinion regarding restricted-use license programs. Areas of questioning included: suspension history; impacts of suspension on employment, income, job performance, travel behavior; costs of suspension and ability to pay; psychological impacts; opinions regarding various aspects of restricted-use license programs; and personal characteristics related to race, gender, income, education, and familial status. A copy of the survey questionnaire is included in Volume 2: Technical Appendices.
Surveys were mailed to 5,000 New Jersey drivers who were currently or had previously been suspended, as well as to 2,500 drivers who had never been suspended. Three hundred eighty drivers with a history of suspension and more than 700 drivers who were never suspended returned the survey.
Survey findings
The following is a summary of key findings from the survey:
More than half (51 percent) of the survey respondents with a history of suspension were or had been suspended for non-driving related reasons.
Survey respondents with a history of suspension were more likely to be low income (household income less than $30,000); younger (under 55 years of age); single; less educated; and non-white. In addition, drivers with a history of suspension were more likely to live in urban areas and to have children under the age of 18 living at home. While no causal relationships between these variables and suspension were confirmed by the survey analysis, when controlled for the effect of other independent variables, each of these variables remained highly correlated with license
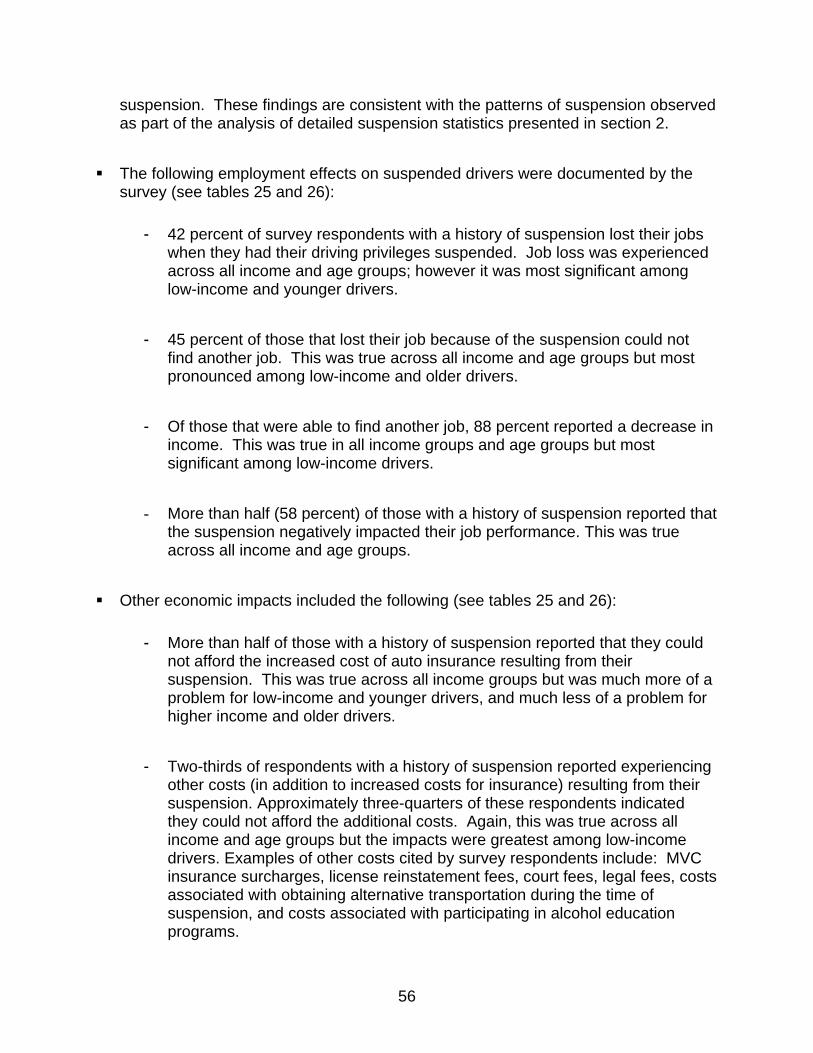
56
suspension. These findings are consistent with the patterns of suspension observed as part of the analysis of detailed suspension statistics presented in section 2.
The following employment effects on suspended drivers were documented by the survey (see tables 25 and 26):
- 42 percent of survey respondents with a history of suspension lost their jobs when they had their driving privileges suspended. Job loss was experienced across all income and age groups; however it was most significant among low-income and younger drivers.
- 45 percent of those that lost their job because of the suspension could not find another job. This was true across all income and age groups but most pronounced among low-income and older drivers.
- Of those that were able to find another job, 88 percent reported a decrease in income. This was true in all income groups and age groups but most significant among low-income drivers.
- More than half (58 percent) of those with a history of suspension reported that the suspension negatively impacted their job performance. This was true across all income and age groups.
Other economic impacts included the following (see tables 25 and 26):
- More than half of those with a history of suspension reported that they could not afford the increased cost of auto insurance resulting from their suspension. This was true across all income groups but was much more of a problem for low-income and younger drivers, and much less of a problem for higher income and older drivers.
- Two-thirds of respondents with a history of suspension reported experiencing other costs (in addition to increased costs for insurance) resulting from their suspension. Approximately three-quarters of these respondents indicated they could not afford the additional costs. Again, this was true across all income and age groups but the impacts were greatest among low-income drivers. Examples of other costs cited by survey respondents include: MVC insurance surcharges, license reinstatement fees, court fees, legal fees, costs associated with obtaining alternative transportation during the time of suspension, and costs associated with participating in alcohol education programs.

57
Table 25 – Economic impacts of license suspension across income groups
Low Income Middle Income High Income (Under
$30,000) ($30,000 to $100,000-)
(Over $100,000)
Economic Impact (N=102) (N=174) (N=52)
Job status: Not able to keep job after suspension 64% 33% 17% Job search: Unable to find new job after suspension (if not
able to keep job after suspension) 51% 37% 13%
Income: negatively affected income (if not able to keep job after suspension)
96% 87% 86%
Job performance: Suspension negatively affected job performance
66% 50% 60%
Insurance costs: Not able to pay increased insurance costs 65% 48% 21% Other costs: Experienced other costs related to suspension
64%
61%
51%
Not able to pay other costs? 90% 68% 33%
Table 26 – Economic impacts of license suspension across age groups
Economic Impact 18-24 years 25-54 years 55 and up
Job status: Not able to keep job after suspension 62% 39 % 39% Job search: Unable to find new job after suspension (if not
able to keep job after suspension) 29% 39% 90%
Income: negatively affected income (if not able to keep job after suspension)
89% 90% 75%
Job performance: Suspension negatively affected job performance
59% 58% 55%
Insurance costs: Not able to pay increased insurance costs 79% 49% 35% Other costs:
Experienced other costs related to suspension
63%
59%
64% Not able to pay other costs? 82% 75% 60%

58
Most survey respondents with a history of suspension also reported experiencing psychological and social impacts associated with license suspension:
- 85 percent of those with a history of suspension noted that they “often” or “sometimes” thought about the suspension when not intending to.
- 72 percent reported that any reminder of their suspension brought back negative feelings about it.
- 69 percent felt ashamed of their suspension; and 68 percent noted they were embarrassed to tell anyone about their suspension.
- 81 percent reported experiencing a loss of freedom.
- 83 percent experienced increased stress.
- 74 percent reported that suspension placed a strain on family, friends and colleagues.
- 46 percent reported lacking a form of identification.
Controlling for the effects of income and age, male drivers with a history of suspension were 2.6 times more likely to lose their jobs because of the suspension than female drivers.
Male drivers were also more likely to experience negative psychological and social impacts from suspension compared to female drivers. However, there were no significant differences observed between the two groups in terms of finding a new job, income performance after suspension, or experiencing other economic effects such as increased costs of insurance and other suspension-related costs.
Although race was highly correlated with having a history of suspension, there were no significant differences between whites and non-whites relative to employment, economic, psychological or social impacts of suspension.
Residential location was also highly correlated with having a suspension history; however, with one exception, there were no significant differences observed between drivers living in urban, suburban or rural areas relative to the impacts of

59
suspension. The one exception involved suspended drivers living in rural areas. This group was more likely to report that their suspension put a strain on family, friends and colleagues.
As briefly mentioned above, the survey was also used to gauge opinions regarding conditional or restricted use driver’s license programs. More than three-quarters of survey respondents supported the creation of a restricted-use license program for at least some suspended drivers under certain circumstances. Although support was greatest among drivers with a history of suspension, 69 percent of those drivers that have never been suspended expressed support for such a license. More than half of the respondents thought that persons suspended for “money-related reasons” such as failing to pay insurance surcharges should be eligible to receive a restricted use license. Fewer respondents supported allowing those suspended for failing to pay child support (39 percent) and failing to appear in court (28 percent) to receive such a license.
The overwhelming majority (96 percent) of those respondents that supported the creation of a restricted-use license favored using the license for employment purposes. Three-quarters (75 percent) supported use of the license for medical purposes. About two-thirds supported using the license for school purposes (68 percent) and for child/elder care (65 percent). Slightly more than half (57 percent) supported using the license for rehabilitation and counseling purposes and slightly less than half (46 percent) supported use of the license for personal/family needs (Carnegie, forthcoming).
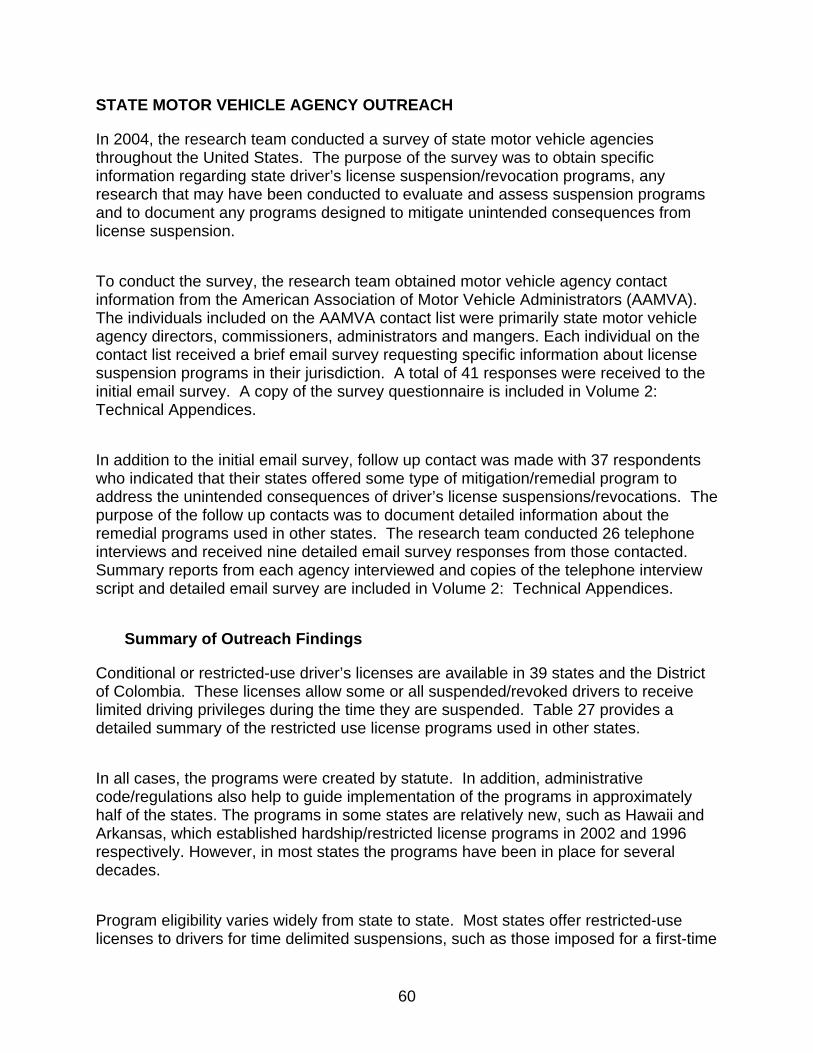
60
STATE MOTOR VEHICLE AGENCY OUTREACH
In 2004, the research team conducted a survey of state motor vehicle agencies throughout the United States. The purpose of the survey was to obtain specific information regarding state driver’s license suspension/revocation programs, any research that may have been conducted to evaluate and assess suspension programs and to document any programs designed to mitigate unintended consequences from license suspension.
To conduct the survey, the research team obtained motor vehicle agency contact information from the American Association of Motor Vehicle Administrators (AAMVA). The individuals included on the AAMVA contact list were primarily state motor vehicle agency directors, commissioners, administrators and mangers. Each individual on the contact list received a brief email survey requesting specific information about license suspension programs in their jurisdiction. A total of 41 responses were received to the initial email survey. A copy of the survey questionnaire is included in Volume 2: Technical Appendices.
In addition to the initial email survey, follow up contact was made with 37 respondents who indicated that their states offered some type of mitigation/remedial program to address the unintended consequences of driver’s license suspensions/revocations. The purpose of the follow up contacts was to document detailed information about the remedial programs used in other states. The research team conducted 26 telephone interviews and received nine detailed email survey responses from those contacted. Summary reports from each agency interviewed and copies of the telephone interview script and detailed email survey are included in Volume 2: Technical Appendices.
Summary of Outreach Findings
Conditional or restricted-use driver’s licenses are available in 39 states and the District of Colombia. These licenses allow some or all suspended/revoked drivers to receive limited driving privileges during the time they are suspended. Table 27 provides a detailed summary of the restricted use license programs used in other states.
In all cases, the programs were created by statute. In addition, administrative code/regulations also help to guide implementation of the programs in approximately half of the states. The programs in some states are relatively new, such as Hawaii and Arkansas, which established hardship/restricted license programs in 2002 and 1996 respectively. However, in most states the programs have been in place for several decades.
Program eligibility varies widely from state to state. Most states offer restricted-use licenses to drivers for time delimited suspensions, such as those imposed for a first-time

61
DUI offense, for point accumulation and for other traffic violations after a specified minimum period of suspension is served. Most often, the waiting period ranges from 30 to 90 days, although a few states require all conditional license applicants to serve half of their suspension/revocation period prior to being considered eligible for the license.
In most states, conditional or restricted-use licenses are not available to drivers suspended/revoked for multiple DUI offenses, negligent vehicular homicide, habitual offenders and for failure to render aid. Furthermore, in most states, drivers suspended for compliance reasons are not eligible. Drivers suspended for failing to maintain insurance are eligible in California, New York, Pennsylvania, Alaska and the District of Colombia. In addition, certain states, such as New York, Minnesota, Nebraska, Wisconsin and Wyoming permit those suspended for failing to pay child support to receive a conditional license. Finally, there are a few states, including Washington, South Dakota and Arizona that permit the issuance of a conditional use license when a driver is suspended for failure to pay fines and/or failure to appear in court.
Permitted travel and associated restrictions related to conditional use licenses also vary by state. Some limit travel for employment purposes while others are more lenient and allow travel for many other reasons including for medical purposes, school, child/elder care, “homemaker” duties and travel to and from religious services.
All states with conditional or restricted-use license programs reported that enforcement of license restrictions is primarily limited to law enforcement personnel during the conduct of day to day traffic law enforcement. Some states also require participants to periodically return to court to demonstrate continued compliance; require employers to notify the motor vehicle agency if the conditions of a participant’s employment change; or conduct follow-up audits to verify a participant’s employment status.
Penalties for violating program restrictions most typically involve the cancellation of the license and reinstatement of the original suspension or revocation. Some states also extend the original suspension/revocation period, between several months to double the original period. Tennessee noted that if a participant is convicted of violating program restrictions, a fine is levied but the license is not rescinded. Oregon reported that those who violate program restrictions may lose the hardship/probationary license and are not eligible for another such license for a period of one year. Colorado reported that those who are convicted of violating program restrictions lose the license and are not eligible for a conditional license for any subsequent suspensions. Finally, program violators in New York lose their conditional or restricted license and the period during which they held the license is not credited when computing their compliance with the originally specified suspension/revocation period.
Most states considered their conditional license programs to be “effective.” Officials in Iowa specifically noted that their program has reduced the number of habitual offenders.

62
The State of Washington noted that while they do not have a procedure in place to track the effectiveness of the program, only a small number of occupational/limited licenses are ever cancelled.
Wisconsin is the only state to report having completed a comprehensive evaluation of their occupational licensing program. In 2003, they issued a report that concluded the program was successful because program participants were generally satisfied with various aspects of the program and experts familiar with the use of Wisconsin’s occupational licenses agreed that the occupational licenses reduced unemployment and helped families avoid serious hardships. In addition, an analysis of motor vehicle violation and crash data revealed that occupational license holders tended to receive fewer citations and be involved in fewer accidents in the year after using occupational licenses than in the year before using such licenses (Wisconsin Department of Transportation 2003).

Table 27 - Summary of Restricted-Use License Programs
Alaska
Arizona
◊ Arka
nsas
Californ
ia
Colorado
Connectic
ut
Delaware
◊ Dist
rict o
f
Columbia
Georg
ia
Hawaii
Idaho
Illinois
Iowa
Kansa
s
◊ Louisi
ana
Michigan
Minnesota
Background and Eligibility
Differentiate b/w suspension & revocation Yes Yes Yes Yes Yes No Yes Yes Yes No Yes Yes Yes Yes Yes Yes Yes
Title of mitigation program Limited Driver License Restricted Driving Privilege
Restricted Driver License
Restricted Driving Permit
Conditional/Job-related Probationary License Employment Permit
Conditional/ Occupational Driver
License
Limited Occupational License Limited License Hardship/Restricted
License Restricted Driver
License Restricted Driving
Permit Temporary Restricted
License Restricted License Restricted License Restricted License Work/School Limited License
Statute & administrative code reference for program
AS 28.15.201 and AAC Title 13, Chapt 4-8
ARS 28-3159 and AAC R17-4-402
AS Title 5, Chapter 65 Section 120 CVC Section 13352.5 CRS 42-2-126 CSL Title 14-37a-1 and
Regs 14-37a
DC 21-2-27 Section 302.2733(a)(4) and
Regs. 45
DCMR Title 18, Section 310 GC 40-5-64 HRC 286-109
IC 18-002(A), 49-325, 49-326 and AC
39.02.70
Chapt. 625 ILCS 5/6 – 205 (c), 206 (c)3, 206.1
IC Chapt. 321.215 and Regs. 761-615 KS Chapt. 8 Sec. 292 LRC 32.415.1 MCL 257.323c,
257.319(17) MS Chapt. 171.30
*Types of offenses eligible for program1st DUI
1st & 2nd Failure to maintain insurance
1st DUI Point violations
▼Some compliance issues
DUI offenders 1st Refusal to submit
Point violations
DUI offenders Repeated traffic
convictions Failure to maintain
insurance
1st DUI Point violations
1st DUI 1st refusal to submit
Point violations
1st & 2nd DUI Repeated traffic
convictions Reckless driving
Point violations ▼Some compliance
issues
1st & 2nd DUI Point violations
1st DUI Point violations
1st DUI Reckless driving Point violations
Leaving the scene
1st & 2nd DUI Repeated traffic
convictions
1st & 2nd DUI Habitual traffic
offenders 1st Drag racing
DUI convictions Habitual traffic violators
Reckless driving
DUI convictions Refusal to submit Reckless driving
▼Some compliance issues
1st DUI offenders 1st Refusal to submit
Habitual traffic offenders
DUI & Refusal to submit
Habitual traffic offenders
Child support
*Types of offenses not eligible for program Refusal to submit ▼Compliance issues
2nd or more DUI Refusal to submit Habitual offenders ▼Some compliance
issues
2nd or more Refusal ▼Compliance issues
Refusal to submit ▼Compliance issues
2nd or more DUI Revoked licenses
▼Compliance issues
DWLS Reckless driving
Leaving the scene ▼Compliance issues
Habitual traffic offenders
▼Compliance issues
DUI Reckless driving
Leaving the scene
3rd DUI ▼Compliance issues
2nd or more DUI ▼Compliance issues
Refusal to submit Vehicular manslaughter ▼Compliance issues
▼Compliance issues 3rd or more DUI ▼Compliance issues ▼Compliance issues ▼Some compliance
issues
2nd or more DUI 2nd or more Refusal ▼Compliance issues
Fleeing law enforcement ▼Compliance issues
Mandatory minimum waiting period for program eligibility
1st DUI - 30 days 1st DUI - 3 months 2nd & 3rd DUI - 1 year 1st DUI - 30 days 1st DUI - 30 days Refusal - 3 months 1st DUI - 3 months
2nd DUI - 1 year None 2nd DUI - 1 year 1st DUI - 30 days 1st DUI - 30 days
1st DUI - 30 days Under 21 DUI - 1 year 2nd or more DUI - 1
year
1st DUI - 30 days 2nd DUI - 1 year
1st DUI - 30 days 2nd or more DUI - 1
year2nd & 3rd DUI - 1 year 1st DUI - 30 days
1st DUI - 15 days 2nd or more DUI -
90 days Refusal - 180 days
Enrollment Process & RequirementsApplication Yes No No Yes No Yes Yes No Yes Yes Yes Yes Yes No Yes No Yes - Child Support
Application and/or license fee $100 - DUI only N/A No fee $15 $5 No fee $10 N/A $25 N/A $35 $8 each $20 No fee $50 N/A N/A
In-person/phone interview No No Yes No Yes No No No No Courts No Yes No No Courts No Yes
Entity determining program(s) acceptance Agency & Courts Agency only Agency & Courts Agency only Agency only Agency only Agency only Agency only Agency only Courts only Agency & Courts Agency only Agency & Courts Agency & Courts Courts only Agency & Courts Agency only
Appeals process Yes Yes Yes No Yes No Yes No Yes Yes Yes Yes Yes Yes Yes Yes No
Ignition Interlock Device (IID) No vendors No Yes - 2nd or more DUI Court Discretion Court Discretion No Yes - 2nd DUI No Yes - 2nd DUI No Court Discretion No Yes - 2nd or more DUI Yes - 2nd or more DUI Court Discretion No No
Permitted TravelEmployment X X X X X X X X X X X X X X X X X
Education (self and/or dependent) X X X X N/A X X X X X X XSubstance abuse treatment X N/A X X X X X X X X
Medical (self and/or dependent) X X X X N/A X X X X X X XEssential needs X X X N/A X X X
New Document IssuedSurrender license X X X X X X X X X X X X X X X
License or permit w/ restrictions X X X X X X X X X X X X X XAuthorization letter X X X X
Photo ID X XDriving Restrictions
Purpose X X X X X X X X X X X X X X X X XGeography X X X X X X X X X X X X X X X X
Hours of operation X X X X X X X X X X X X X X X X XNotification Of Eligibility
No notification X X X XMail from agency X X X X X X X X X X X
Courts XInformation on website X X X X
Program AdministrationLicensed drivers 480,000 3.8 million 1.9 million 22 million N/A 2.3 million 570,000 N/A 6.1 million 787,820 1 million 8.4 million 2 million 1.9 million 3 million 7.1 million 3.6 million
Suspended/revoked drivers 27,213 N/A 101,500 N/A N/A 134,000 78,660 N/A N/A N/A 70,000 258,511 5,700 103,000 N/A not tracked 163,500
Program participants 485 N/A N/A N/A N/A 6,000 253 N/A 16,000 N/A 1,200 9,213 4,200 N/A N/A not tracked 16,560
Peer Advice/Comment Conditional permits should go to first time offenders only and the program should be based on statute. N/A
Statutes determining participant eligibility must be clear and explicit.
Design and administer the program with clear rules/restrictions.
N/A
Expressed mixed feelings, but noted the value and importance of the program, especially due to the lack of statewide transportation options.
Long-term suspensions/ revocations are not effective. Impose severe burdens on offenders & offenders are less likely to pay fines/fees. N/A N/A N/A
Programs should be based upon statute and administrative rules allowing for administrative ease by providing objectivity.
Automation of the restricted permit process is necessary. Should also be designed in a dynamic and flexible manner so it can adjust to potential legislative changes.
Their program is effective in reducing number of habitual offenders and the program’s eligibility is expanding over time. N/A N/A
Issuance of a restricted license should be based on state statute and on the type and prior frequency of the conviction in question.
Eligibility criteria must be clear and law enforcement/courts should be involved with program. Advertising program is beneficial.
Notes:* - List not extensive, refer to full reportN/A - Information not available▼ - Compliance issues include failure to pay fines and forfeitures, failure to appear, failure to maintain insurance, and child support◊ - States also offering a payment reinstatement plan

Table 27 - Summary of Restricted-Use License Programs
Missouri
Montana
Nebras
ka
Nevad
a
New York
North C
arolin
a
North D
akota
◊ Ohio
Oklahoma
Oregon
Pennsy
lvania
South Dak
ota
◊ Ten
nesse
e
Texas
Virginia
Washington
Wisconsin
Wyoming
Background and Eligibility
Differentiate b/w Suspension & Revocation Yes Yes Yes Yes Yes No Yes No No Yes Yes Yes Yes Yes Yes Yes Yes Yes
Type of mitigation program Limited Driving Privilege
Restricted/Probationary License
Medical Hardship License & Employment
Drive Permit
Restricted Driver License
Conditional Use License & Restricted
Use License
Limited Privilege License
Work/School Permit Program
Limited Driving Privileges Modified License Hardship/Probationary
LicenseOccupational Limited
License Work/School Permit
Program Restricted License Essential Needs License Restricted License Occupational and
Limited Driver License Occupational License Probationary/Job Related License
Statute & administrative code reference for program
MRS Title 19, Chapt. 302 Sec. 010 & 309
MCS 61-2-206 and ARM 23.2.122
NS 60-4,130.1; 60-4,130.2; 60-4,129; 60-
4,130
NRS 483.490, 483.270, 483.390 and NAS
Chapt. 483.200
NYCL RUL-Article 21A Sect. 530 and
Regs. Part 134-CUL & Part 135-RUL
NCGS 20-179.3 NDCC 39-06.1-10.1 and Regs. 37.03 ORC 4510.021
OS Chapt 47-6-113 and OAC Title 595,
Subchapt. 7, Sect. 10-7-15
ORS 813.500, 807.240 & 270 & OAC 735-064-
0020
PCS Title 75, Chapt. 15:53 and PAC Chapt.
86.1-3
SDS 32-12-49.4 and SDC 61.19
TS Title 55, Chapt. 50, Sec. 502
TS 521.241; 521.242 and TAC Chapt. 15 CV Title 18.2-271.1 RCW 46.20.391;
46.20.394WS 343.10(2)(a)1 and
WAC Chapt.117
WS Title 31, Chapt. 7, Sec. 105 and WDOT 4182, Sec.
20
*Types of offenses eligible for programDUI offenders
Point violations Reckless driving
1st DUI Reckless driving Repeated traffic
violations
1st DUI Point violations Child support
1st DUI Repeated traffic
violations
DUI offenders Repeated traffic
convictions ▼Some compliance
issues
1st DUI 1st Refusal to submit
Point violations
DUI offenders Point violations
DUI offenders Refusal to submit Point violations
DUI violators Reckless driving Point violations
1st & 2nd DUI 1st & 2nd Refusal
Repeat traffic violations
Habitual offenders
1st DUI 1st & 2nd Refusal Repeated traffic
convictions ▼Some compliance
issues
1st & 2nd DUI 1st & 2nd Refusal Point violations
▼Compliance issues
1st & 2nd DUI Point violations
▼Some compliance issues
DUI offenders Point violations
DUI offenders Reckless driving
Repeat traffic convictions
1st DUI ▼Compliance issues
DUI offenders Habitual traffic
convictions Child support
1st Drag racing
1st DUI Point violations Child support
*Types of offenses not eligible for programHabitual traffic
offenders 2nd or more refusal ▼Compliance issues
2nd or more DUI Refusal to submit
▼Compliance isseus
2nd or more DUI Refusal to submit
▼Compliance issues
Habitual traffic offenders
2nd or more DUI ▼Compliance issues
Leaving the scene Refusal to submit ▼Some compliance
issues
2 or more DUI Leaving the scene
▼Compliance issues
Refusal to submit Revoked licenses
▼Compliance Issues
4th DUI 4th Refusal
▼Compliance Issues
Vehicular homicide ▼Compliance issues
Vehicular homicide Underage DUI
▼Compliance issues
2nd or more DUI Revoked licenses
▼Some compliance issues
Child support 3rd or more DUI
3rd Refusal Fleeing law
▼Some compliance issues ▼Compliance issues
Refusal to submit Vehicular homicide ▼Compliance issues
Refusal to submit 2nd or more DUI Habitual traffic
offenders
Underage DUI ▼Compliance issues
2nd or more DUI Refusal to submit
▼Compliance issues
Mandatory minimum waiting period for program eligibility
1st DUI - 30 days 2nd DUI - 1 year None 1st DUI - 30 days 1st DUI - 45 days None 1st DUI - 30 days
1st refusal - 6 monthsDUI - 30 days
Point violations-7 days
1st DUI - 15 days 2nd DUI - 30 days 3rd DUI - 6 months
2nd or more DUI - 1 year
1st DUI - 30 days 2nd DUI - 90 days
1st Refusal- 90 days
1st DUI - 60 days 1st Refusal - 1 year Certain DWLS - 3
months
None 2nd DUI - 1 year 2nd or more DUI - 90 days to 1 year
2nd DUI - 1 year 3rd DUI - 3 year 1st DUI - 30 days
2nd DUI - 60 days 3rd or more DUI-
90 daysNone
Enrollment Process & RequirementsApplication Yes Yes Yes Yes Yes Yes Yes No Yes Yes Yes Yes Yes No Yes Yes Yes Yes
Application and/or license fee No fee N/A $45 N/A $75 N/A N/A No $150 $50 $50 N/A $67 $10 N/A $25 $40 $15
In-person/phone interview No No No No No No No No Yes - DUI or Points No No No No Yes - DUI No No No No
Entity determining program(s) acceptance Agency & Courts Agency & Courts Agency & Courts Agency only Agency only Courts only Agency only Courts only Agency & Courts Agency & Courts Agency only Agency & Courts Agency & Courts Agency & Courts Agency & Courts Agency only Agency only Agency only
Appeals process Yes No Yes Yes No No No No Yes Yes Yes Yes Yes - Cts No - DMV Yes Yes Yes Yes Yes
Ignition Interlock Device (IID) Yes - 2nd or more DUI Court Discretion No Court Discretion Court Discretion No No vendors Court Discretion Yes - 2nd or more DUI Yes Yes - Refusal to
submit No Yes - 2nd DUI Court DiscretionCourt Discretion 1st DUI & required - 2nd or more
DUINo Yes - 2nd or more
DUI No vendors
Permitted TravelEmployment X X X X X X X X X X X X X X X X X X
Education X X X X X X X X X X X X X X XSubstance abuse treatment X X X X X X X X X X X X X
Medical X X X X X X X X X X X XEssential needs X X X X X X X X X X
New Document IssuedSurrender license X X X X X X X X X X X X X X X X X
License or permit w/ restrictions X X X X X X X X X X X X X X X X XAuthorization letter X X X X X X X
Photo IDDriving Restrictions
Purpose X X X X X X X X X X X X X X X X X XGeography X X X X X X X X X X X X X X X X X X
Hours of operation X X X X X X X X X X X X X X X X X XNotification Of Eligibility
No notification X X X X X X X XMail from Agency X X X X X X X
Courts X X X X X X XWebsite X X X X X X X X X X X
Program AdministrationNumber of Licensed Drivers 3.5 million 450,000 1.3 million 1.5 million 11 miilion 5.5 million 457,000 8,728,546 2.3 million 2.6 million 8.3 million 550,000 4.2 million 15 million 5 million 4.3 million 3.7 million 455,000
Number of suspended/revoked drivers 320,344 31,931 53,539 N/A N/A N/A 27,000 611,064 81,040 N/A 600,000 N/A 246,000 430,000 13,200 for Points 364,000 403,586 15,000
Number of program participants 3,508 1,716 for DUI 738 1,499 60,297 6,000 747 N/A 3,269 5,897 N/A 240 by DMV 5,000 12,197 15,600-18,000 for DUI 36,400 29,445 3,000
Peer Advice/Comment Automated system is very successful. Program helps reduce the number of people driving while suspended by providing them with viable options.
Program helps achieve compliance while harsher sanctions make offenders more likely to violate their suspension/revocation. N/A
Program is effective. A program's statutory language should be simple and eligibility made clear. N/A N/A
Regulations of program should be based upon statute and clear administrative rules.
Implementation of Limited Driving Privileges has been successful.
N/A N/A
The program is difficult to enforce but is necessary due to lack of viable transit options.
If program is implemented by both agency and court, then a driver record sharing system must be in place between both entities.
Their suspended/ revoked driving population is often frustrated why most offenses other than DUI are not eligible for the restricted license.
To prevent fraud, occupational licenses should be issued as a photo license.
Program eligibility should be clear in statues, but if it is too rigid, DMV flexibility is sacrificed.
N/A
Program successful and keeps people working. License revocations are overused and the Tax Intercept program should be used to collect unpaid fines.
Eligibility for any conditional license program should be very specific.
Notes:* - List not extensive, refer to full reportN/A - Information not available▼ - Compliance issues include failure to pay fines and forfeitures, failure to appear, failure to maintain insurance, and child support◊ - States also offering a payment reinstatement plan
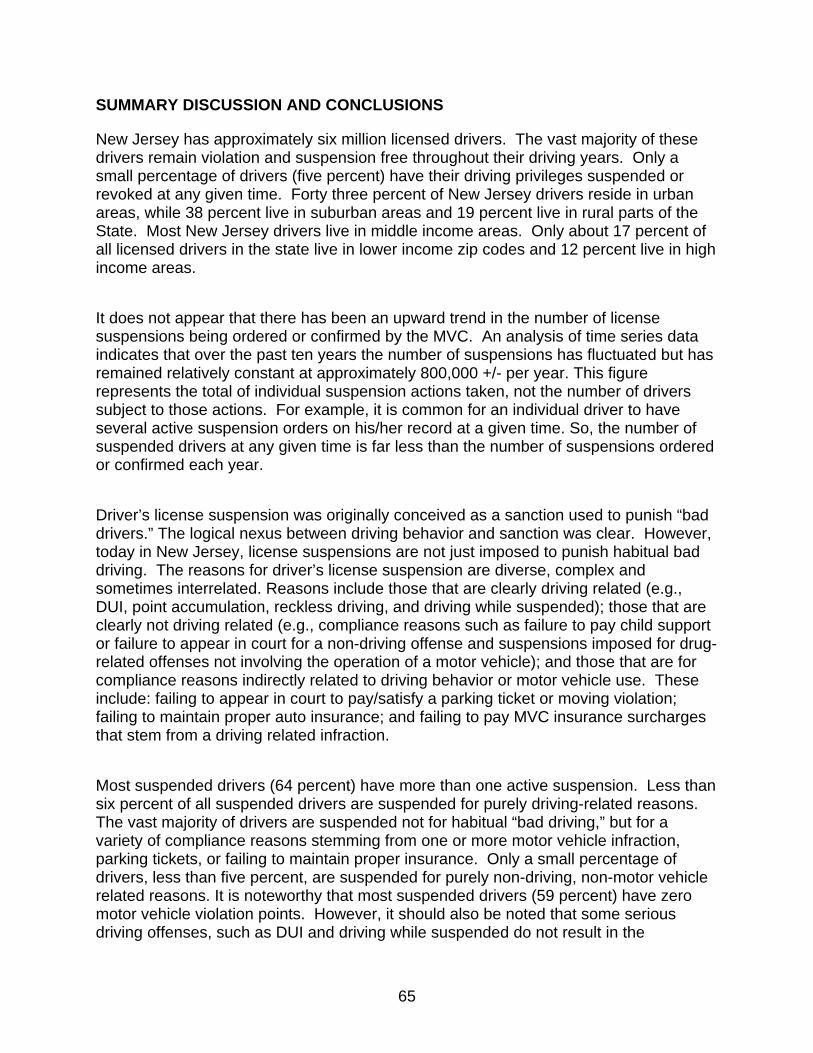
65
SUMMARY DISCUSSION AND CONCLUSIONS
New Jersey has approximately six million licensed drivers. The vast majority of these drivers remain violation and suspension free throughout their driving years. Only a small percentage of drivers (five percent) have their driving privileges suspended or revoked at any given time. Forty three percent of New Jersey drivers reside in urban areas, while 38 percent live in suburban areas and 19 percent live in rural parts of the State. Most New Jersey drivers live in middle income areas. Only about 17 percent of all licensed drivers in the state live in lower income zip codes and 12 percent live in high income areas.
It does not appear that there has been an upward trend in the number of license suspensions being ordered or confirmed by the MVC. An analysis of time series data indicates that over the past ten years the number of suspensions has fluctuated but has remained relatively constant at approximately 800,000 +/- per year. This figure represents the total of individual suspension actions taken, not the number of drivers subject to those actions. For example, it is common for an individual driver to have several active suspension orders on his/her record at a given time. So, the number of suspended drivers at any given time is far less than the number of suspensions ordered or confirmed each year.
Driver’s license suspension was originally conceived as a sanction used to punish “bad drivers.” The logical nexus between driving behavior and sanction was clear. However, today in New Jersey, license suspensions are not just imposed to punish habitual bad driving. The reasons for driver’s license suspension are diverse, complex and sometimes interrelated. Reasons include those that are clearly driving related (e.g., DUI, point accumulation, reckless driving, and driving while suspended); those that are clearly not driving related (e.g., compliance reasons such as failure to pay child support or failure to appear in court for a non-driving offense and suspensions imposed for drug-related offenses not involving the operation of a motor vehicle); and those that are for compliance reasons indirectly related to driving behavior or motor vehicle use. These include: failing to appear in court to pay/satisfy a parking ticket or moving violation; failing to maintain proper auto insurance; and failing to pay MVC insurance surcharges that stem from a driving related infraction.
Most suspended drivers (64 percent) have more than one active suspension. Less than six percent of all suspended drivers are suspended for purely driving-related reasons. The vast majority of drivers are suspended not for habitual “bad driving,” but for a variety of compliance reasons stemming from one or more motor vehicle infraction, parking tickets, or failing to maintain proper insurance. Only a small percentage of drivers, less than five percent, are suspended for purely non-driving, non-motor vehicle related reasons. It is noteworthy that most suspended drivers (59 percent) have zero motor vehicle violation points. However, it should also be noted that some serious driving offenses, such as DUI and driving while suspended do not result in the

66
assessment of motor vehicle points. Instead, in most cases, these violations carry substantial fines and mandatory suspension periods.
A detailed analysis of suspension statistics and survey data specific to New Jersey indicates that suspended drivers tend to be younger male drivers. Furthermore, a disproportionate number of suspended drivers reside in urban and low-income areas when compared to the distribution of all New Jersey licensed drivers. Although only 43 percent of New Jersey licensed drivers reside in urban areas, 63 percent of suspended drivers live there. At the same time only 16.5 percent of New Jersey licensed drivers reside in lower income zip codes, while 43 percent of all suspended drivers live there.
This may be due to a variety of reasons. For example, most parking infractions occur in urban areas because urban areas have more parking restrictions than suburban and rural areas. As such, urban residents have a greater chance of violating parking laws. Similarly, the street and highway network in urban areas is more dense, with higher levels of traffic, more intersections, stop signs, traffic lights, and slow speed zones than suburban and rural areas. Generally, there is also a greater law enforcement presence in urban communities. Consequently, there are more opportunities to violate traffic laws and urban residents may be at greater risk of being observed violating traffic laws. Finally and perhaps most importantly, low income residents are more concentrated in the state’s urban areas. This population may be less able to pay fines, fees and surcharges given their more limited financial resources.
The obvious and most direct impact of license suspension is loss of personal mobility. However, suspension may also have collateral and/or unintended consequences such as job loss, difficulty in finding employment, and reduced income. Consequences can also include other financial impacts, such as increased insurance premiums and other costs associated with suspension; as well as psychological and social impacts such as loss of freedom, increased stress, and family strain. In addition, suspension can also have broader economic and societal impacts such as limiting the labor force for specific industries such as automobile sales and services, home health care aides and the construction trades. Jobs in each of these industries depend on semi-skilled workers with a valid driver’s license. In addition, many employers use possession of a valid driver’s license as a pre-qualifying “screening” question. This may unnecessarily limit the available labor force when driving a motor vehicle is not integral to job responsibilities.
Although not available in New Jersey, conditional or restricted-use driver’s licenses are available in 39 states and the District of Colombia. These licenses allow some or all suspended/revoked drivers to receive limited driving privileges during the time they are suspended. Program eligibility varies widely from state to state. Some states offer restricted-use licenses to drivers suspended for compliance reasons, but most states limit the use of restricted-use licenses to drivers with time delimited suspensions, such as those imposed for a first time DUI offense, for point accumulation and for other traffic

67
violations after a specified minimum period of suspension is served. Most often, the waiting period ranges from 30 to 90 days, although a few states require all conditional license applicants to serve half of their suspension/revocation period prior to being considered eligible for the license.
In most states, conditional or restricted-use licenses are not available to drivers suspended/revoked for multiple DUI offenses, negligent vehicular homicide, or habitual offenders. Furthermore, in most states, drivers suspended for compliance reasons are not eligible. Permitted travel and associated restrictions related to conditional use licenses also vary by state. Some limit travel for employment purposes, while others are more lenient and allow travel for many other reasons, including medical purposes, school, child/elder care, “homemaker” duties and travel to and from religious services. Penalties for violating program restrictions most typically involve the cancellation of the restricted-use license and reinstatement of the original suspension or revocation. Some states also extend the original suspension/revocation period, between several months to double the original period.
It is clear from this study that license suspension in New Jersey is widely used as a punishment, a deterrent and as a means to compel appearance in court and/or payment of various fines, fees, and other financial obligations. It also appears that in some circumstances, license suspension or the threat of suspension can be effective in achieving these purposes. A clear example is the ability of municipal courts to order a driver’s license suspended for failing to appear in court to satisfy a parking summons. As discussed earlier, the Parking Offenses Adjudication Act has been very effective in reducing the number of outstanding parking tickets pending over 60 days. In 1990, there were almost 4.4 million parking tickets that remained unpaid longer than two months. That number dropped precipitously through the 1990’s after the law took effect and as more municipal court systems became automated. In 2004, the number of parking tickets pending over 60 days was less than 400,000.
As noted earlier, suspension patterns indicate that certain segments of the licensed driver population are more likely to be suspended than others. For all reasons, except suspensions for DUI and accumulation of motor vehicle points, drivers residing in urban and lower income zip codes are overrepresented. Suspension rates among male drivers residing in lower income areas are consistently the highest. Although the impacts of license suspension may vary by individual driver, the social implications of New Jersey suspension patterns should be of concern. Low-income urban residents face many challenges, not the least of which is obtaining and retaining a job and meeting basic family financial needs. Given the decentralization of employment opportunities over the past forty years in the state, the only viable means of transportation to work for many may be by private automobile. Having their driving privileges suspended can be a significant additional impediment to gainful employment.

68
Unfortunately, programs and interventions used in other states to address the potential collateral impacts of license suspension (especially economic impacts related to loss of employment) appear mostly limited to flexible fine/fee payment options, payment amnesty programs and the use of restricted-use licenses. Despite this limited menu of options, there appear to be areas of possible reform in New Jersey.
First, the New Jersey Legislature should reexamine the purpose and need for the MVC insurance surcharge program. In 1983, the Legislature enacted the New Jersey Merit Rating Plan (N.J.S.A. 17:29 A-35), which required MVC to assess “insurance” surcharges based on certain motor vehicle offenses. According to the statute, surcharges are levied against motorists for various non-point driving offenses. When enacted in 1983, the original purpose of the NJ Merit Rating Plan insurance surcharges was to provide revenue for the New Jersey Automobile Full Insurance Underwriting Association (a.k.a. - Joint Underwriters Association or JUA) to fund medical expenses from uninsured motorists. The original bonds issued to support the JUA have since been retired and the revenue stream has been earmarked to pay down other state debt.
New Jersey is one of only four States in the Nation with such a surcharge program. The other states include New York, Texas, and Michigan. Almost one-third of all suspension ordered annually by MVC (28 percent or 228,000 orders) are for failure to pay insurance surcharges. Given the volume of suspensions for this reason and the fact that the greatest burden of surcharge suspensions fall on low-income drivers – almost 40 percent of drivers suspended for failure to pay insurance surcharges reside in low income zip codes, it appropriate to weigh the proportionally high impact of surcharge suspensions on low-income drivers against the benefit of the program. Currently, the only public purpose for the program appears to be to provide an alternative revenue stream for the state.
Second, the legislature and administrative office of the courts should examine the fairness of the Parking Offense Adjudication Act. Although extremely effective in reducing the number of parking scofflaws, currently, more than 60 percent of POAA suspensions are ordered against drivers residing in low income zip codes. A review of state statutes related to repayment of court fines/fees and license restoration fees indicates that the courts and MVC have only limited discretion to establish payment plans. Current statutory requirements related to flexible payment plans and options appear to limit the courts ability to provide options that fit the unique circumstances of each driver’s situation. Changes to these requirements could be an important way to both ensure repayment of fees/fines as well as allow driver’s to retain their driving privileges when the only reason for suspension relates to financial compliance.
Third, efforts should be undertaken to address issues that contribute to license suspensions for failing to maintain proper insurance (e.g., the high cost of insurance in New Jersey, especially for drivers residing in urban areas). Currently, approximately 40 percent of license suspensions for failing to maintain proper insurance are ordered

69
against drivers residing in low-income zip codes. In addition, the state should consider regulating and/or limiting insurance premium increases that are based solely on license suspensions for non-driving reasons.
Finally, New Jersey lawmakers should consider creating a restricted-use license program for at least certain suspended drivers (e.g., those suspended for financial reasons) under certain circumstances (e.g., to travel to/from work). Such a program could be a means to address the unintended consequences of suspension, especially employment and economic effects. As is the case in other jurisdictions, the benefits of such a program will need to be weighed against potentially diminishing the deterrent or coercive effects of suspension. However, it is noteworthy that 39 states and the District of Columbia have such programs and state officials view them as effective.

70
WORKS CITED Dieringer Research Group, Inc. Evaluation of the Effectiveness of the Occupational
Licensing Program: Comprehensive Analysis and Interpretation of Study Findings. Wisconsin: Wisconsin Department of Transportation, 2003.
Gebers, Michael A. and DeYoung, David J. An Examination of the Characteristics and
Traffic Risk of Drivers Suspended/Revoked for Different Reasons. California: California Department of Motor Vehicles, 2002.
Joerger, Mark. Profile of Driver Problems Follow-up Evaluation: An Examination of
Driver Demographic Information and Driving Record. Oregon: Oregon Department of Transportation, 2002.
Maxwell, Marti. New Strategies Addressing the Impact of Driver’ License Suspensions.
Virginia: National Center for State Courts Institute for Court Management, 2001. Accessed online at: http://www.ncsconline.org/D_ICM/programs/cedp/papers/Research_Papers_2001/The_Suspended_Driver.pdf.
McCartt, Anne T., Geary, Lori L. and Nissen, William J. “Observational Study of the
Extent of Driving While Suspended for Alcohol-Impaired Driving.” Washington, D.C.: U.S. Department of Transportation National Highway Traffic Safety Administration, 2002. Accessed online at: http://www.nhtsa.dot.gov/people/injury/research/observation_study/index.htm
N.J.S.A. 39:2A-30 N.J.S.A. 39:4-97.2 N.J.S.A. 39:4-50 N.J.S.A. 39:3-40 N.J.S.A. 17:29 A-35 N.J.S.A. 39:4-139.2 N.J.S.A. 2A:17-56.41a N.J.S.A. 39:6B-1 N.J.S.A. 39:6B-2 N.J.S.A. 39:4-203.1-2

71
Pawasarat, John. Removing Transportation Barriers to Employment: The Impact of Driver’s License Suspension Policies on Milwaukee County Teens. Wisconsin: University of Wisconsin-Milwaukee, 2000. Accessed online at: http://www.uwm.edu/Dept/ETI/barriers/teensdot.htm.
Pawasarat, John and Stetzer, Frank. Removing Transportation Barriers to
Employment: Assessing Driver’s License and Vehicle Ownership Patterns of Low-Income Populations. Wisconsin: University of Wisconsin-Milwaukee, 2000. Accessed online at: http://www.uwm.edu/Dept/ETI/dot.htm.
Thoennes, Nancy and Pearson, Jessica. “Multiple Intervention Grant: Driver’s License
Suspension as a Tool of Child Support Enforcement.” Colorado: Center for Policy Research, 2000. Accessed online at: http://www.acf.hhs.gov/programs/cse/pubs/reports/colorado/bk03ar02.html.
U.S. Department of Transportation National Highway Traffic Safety Administration.
Traffic Safety Facts Laws: Volume2: Number 1. “Administrative License Revocation ”Washington, D.C.: NHTSA, 2004. Accessed online at: http://www.nhtsa.dot.gov/people/injury/New-fact-sheet03/fact-sheets04/Laws-ALR.pdf
Zimmerman, Ken and Fishman, Nancy. Roadblock on the Way to Work: Driver’s
License Suspension in New Jersey. New Jersey: New Jersey Institute for Social Justice, 2001.