Embed Size (px)
Citation preview
St. Petersburg State University
Graduate School of Management
Master in Management Program
DRIVERS OF CUSTOMER SATISFACTION WITH THE ONLINE GROCERY
SHOPPING EXPERIENCE IN THE CONDITIONS OF COVID-19 PANDEMIC
Master’s thesis by the 2nd year student, Concentration — Marketing, Vorobeva Aleksandra
Research advisor: Senior lecturer, Candidate of Economic Sciences, Alkanova Olga
Reviewer: Marketing Director, LLC «Компания Благо», Kirill Melnikov
Saint Petersburg
2021
2
ЗАЯВЛЕНИЕ О САМОСТОЯТЕЛЬНОМ ХАРАКТЕРЕ ВЫПОЛНЕНИЯ
ВЫПУСКНОЙ КВАЛИФИКАЦИОННОЙ РАБОТЫ
Я, Воробьева Александра Юрьевна, студент второго курса магистратуры
направления «Менеджмент», заявляю, что в моей магистерской диссертации на тему « Факторы, влияющие на удовлетворенность покупателей онлайн-покупками
продуктов питания в условиях пандемии COVID-19», представленной в службу
обеспечения программ магистратуры для последующей передачи в государственную
аттестационную комиссию для публичной защиты, не содержится элементов плагиата.
Все прямые заимствования из печатных и электронных источников, а также из
защищенных ранее выпускных квалификационных работ, кандидатских и докторских
диссертаций имеют соответствующие ссылки.
Мне известно содержание п. 9.7.1 Правил обучения по основным образовательным
программам высшего и среднего профессионального образования в СПбГУ о том, что «ВКР
выполняется индивидуально каждым студентом под руководством назначенного ему
научного руководителя», и п. 51 Устава федерального государственного бюджетного
образовательного учреждения высшего образования «Санкт-Петербургский
государственный университет» о том, что «студент подлежит отчислению из Санкт-
Петербургского университета за представление курсовой или выпускной
квалификационной работы, выполненной другим лицом (лицами)».
Воробьева А.Ю. (Подпись студента)
25 июня 2021г. (Дата)
STATEMENT ABOUT THE INDEPENDENT CHARACTER OF
THE MASTER THESIS
I, Vorobeva Aleksandra, (second) year master student, program «Management», state that
my master thesis on the topic «Drivers of Customer Satisfaction with the Online Grocery
Shopping Experience in the Conditions of COVID Pandemic», which is presented to the Master
Office to be submitted to the Official Defense Committee for the public defense, does not contain
any elements of plagiarism.
All direct borrowings from printed and electronic sources, as well as from master theses,
PhD and doctorate theses which were defended earlier, have appropriate references.
I am aware that according to paragraph 9.7.1. of Guidelines for instruction in major
curriculum programs of higher and secondary professional education at St. Petersburg University
«A master thesis must be completed by each of the degree candidates individually under the
supervision of his or her advisor», and according to paragraph 51 of Charter of the Federal State
Institution of Higher Education Saint-Petersburg State University «a student can be expelled from
St. Petersburg University for submitting of the course or graduation qualification work developed
by other person (persons)».
Vorobeva A. (Student’s signature)
June 25th, 2021 (Date)
3
АННОТАЦИЯ
Автор Воробьева Александра Юрьевна
Название ВКР Факторы, влияющие на удовлетворенность покупателей онлайн-покупками
продуктов питания в условиях пандемии COVID-19
Образовательная
программа Менеджмент
Направление
подготовки Менеджмент (Master in Management – MiM)
Год 2020 - 2021
Научный
руководитель
Алканова Ольга Николаевна, Кандидат экономических наук, Старший
преподаватель кафедры маркетинга
Описание цели,
задач и основных
результатов
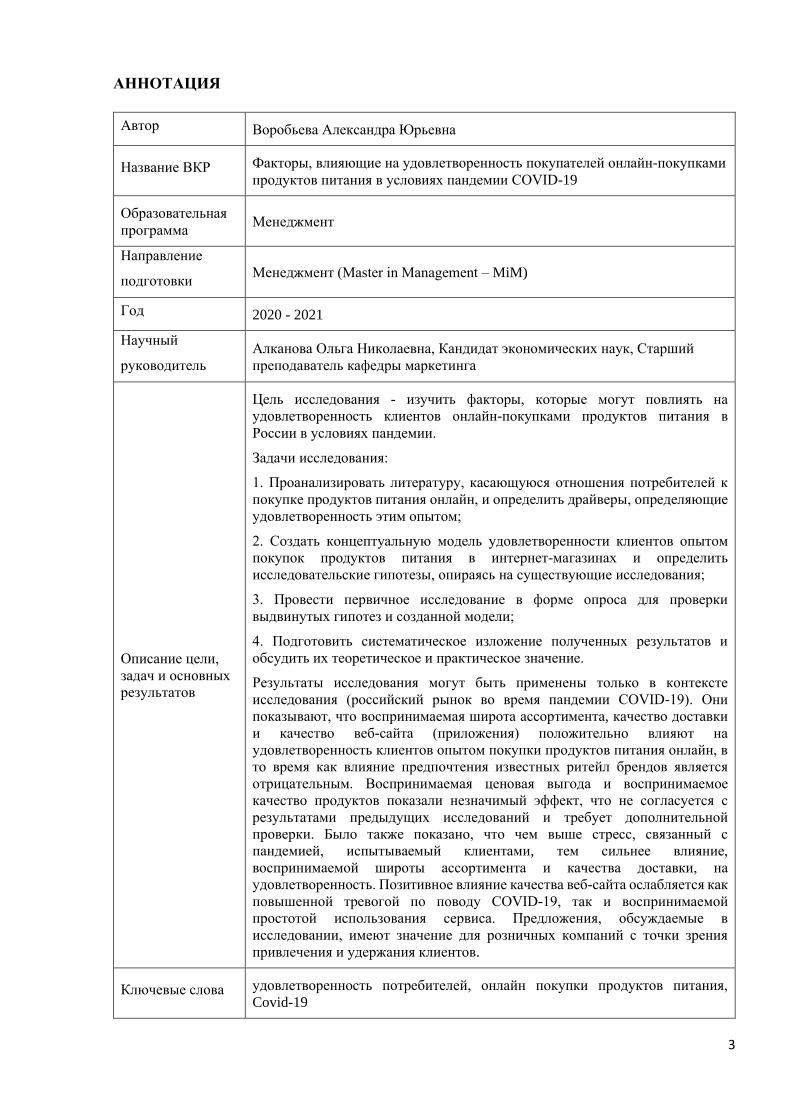
Цель исследования - изучить факторы, которые могут повлиять на
удовлетворенность клиентов онлайн-покупками продуктов питания в
России в условиях пандемии.
Задачи исследования:
1. Проанализировать литературу, касающуюся отношения потребителей к
покупке продуктов питания онлайн, и определить драйверы, определяющие
удовлетворенность этим опытом;
2. Создать концептуальную модель удовлетворенности клиентов опытом
покупок продуктов питания в интернет-магазинах и определить
исследовательские гипотезы, опираясь на существующие исследования;
3. Провести первичное исследование в форме опроса для проверки
выдвинутых гипотез и созданной модели;
4. Подготовить систематическое изложение полученных результатов и
обсудить их теоретическое и практическое значение.
Результаты исследования могут быть применены только в контексте
исследования (российский рынок во время пандемии COVID-19). Они
показывают, что воспринимаемая широта ассортимента, качество доставки
и качество веб-сайта (приложения) положительно влияют на
удовлетворенность клиентов опытом покупки продуктов питания онлайн, в
то время как влияние предпочтения известных ритейл брендов является
отрицательным. Воспринимаемая ценовая выгода и воспринимаемое
качество продуктов показали незначимый эффект, что не согласуется с
результатами предыдущих исследований и требует дополнительной
проверки. Было также показано, что чем выше стресс, связанный с
пандемией, испытываемый клиентами, тем сильнее влияние,
воспринимаемой широты ассортимента и качества доставки, на
удовлетворенность. Позитивное влияние качества веб-сайта ослабляется как
повышенной тревогой по поводу COVID-19, так и воспринимаемой
простотой использования сервиса. Предложения, обсуждаемые в
исследовании, имеют значение для розничных компаний с точки зрения
привлечения и удержания клиентов.
Ключевые слова удовлетворенность потребителей, онлайн покупки продуктов питания,
Covid-19
4
ABSTRACT
Master Student’s name Vorobeva Aleksandra
Master Thesis Title Drivers of Customer Satisfaction with the Online Grocery
Shopping Experience in the Conditions of COVID-19 Pandemic
Educational Program Master in Management Program
Main field of study Management
Year 2020 - 2021
Academic Advisor’s name Alkanova Olga Nikolaevna, Candidate of Economic Sciences,
Senior lecturer
Description of the goal,
tasks and main results
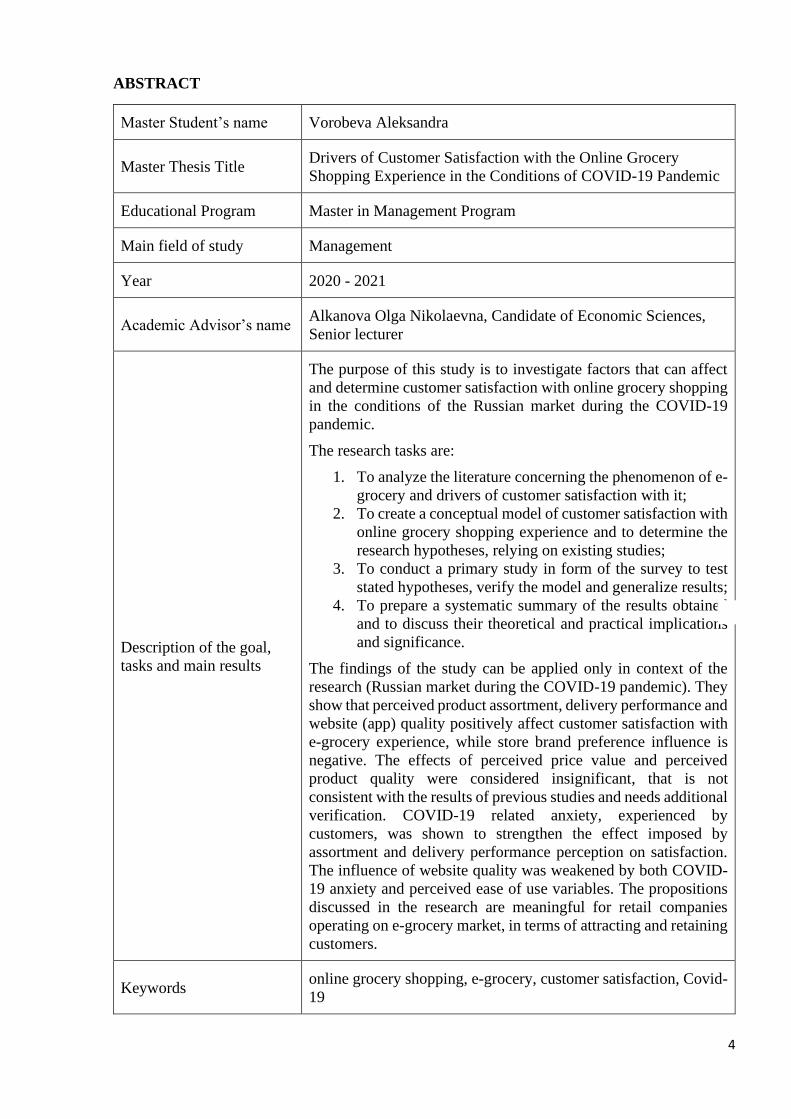
The purpose of this study is to investigate factors that can affect
and determine customer satisfaction with online grocery shopping
in the conditions of the Russian market during the COVID-19
pandemic.
The research tasks are:
1. To analyze the literature concerning the phenomenon of e-
grocery and drivers of customer satisfaction with it;
2. To create a conceptual model of customer satisfaction with
online grocery shopping experience and to determine the
research hypotheses, relying on existing studies;
3. To conduct a primary study in form of the survey to test
stated hypotheses, verify the model and generalize results;
4. To prepare a systematic summary of the results obtained
and to discuss their theoretical and practical implications
and significance.
The findings of the study can be applied only in context of the
research (Russian market during the COVID-19 pandemic). They
show that perceived product assortment, delivery performance and
website (app) quality positively affect customer satisfaction with
e-grocery experience, while store brand preference influence is
negative. The effects of perceived price value and perceived
product quality were considered insignificant, that is not
consistent with the results of previous studies and needs additional
verification. COVID-19 related anxiety, experienced by
customers, was shown to strengthen the effect imposed by
assortment and delivery performance perception on satisfaction.
The influence of website quality was weakened by both COVID-
19 anxiety and perceived ease of use variables. The propositions
discussed in the research are meaningful for retail companies
operating on e-grocery market, in terms of attracting and retaining
customers.
Keywords online grocery shopping, e-grocery, customer satisfaction, Covid-
19
5
TABLE OF CONTENTS
INTRODUCTION ........................................................................................................................... 6
CHAPTER 1. ONLINE GROCERY SHOPPING AND DRIVERS OF CUSTOMER
SATISFACTION WITH THIS EXPERIENCE ............................................................................ 10
1.1. E-grocery, difference between offline and online shopping experience......................... 10
1.2. Customer satisfaction ...................................................................................................... 12
1.3. Drivers of customer satisfaction with online grocery shopping ..................................... 16
1.4. COVID-19 pandemic as a situational factor, affecting customers ................................. 23
1.5. Research model and hypotheses ..................................................................................... 25
CHAPTER 2. DEVELOPMENT OF THE RESEARCH DESIGN AND COLLECTION OF THE
DATA ............................................................................................................................................ 26
2.1. Methods and research design .......................................................................................... 26
2.2. Sample and data collection ............................................................................................. 28
2.3. Data analysis ................................................................................................................... 33
CHAPTER 3. MODEL ANALYSIS AND DISCUSSION ........................................................... 35
3.1. Exploratory and confirmatory factor analysis ................................................................ 35
3.2. Research model and hypotheses testing .......................................................................... 38
3.3. Theoretical and practical implications ............................................................................ 50
3.4. Limitations and future research directions ...................................................................... 54
CONCLUSION ............................................................................................................................. 56
APPENDIX 1. Questionnaire ........................................................................................................ 58
APPENDIX 2. Sources of variables’ scales .................................................................................. 72
APPENDIX 3. EFA results ........................................................................................................... 76
APPENDIX 4. Results of model testing ........................................................................................ 78
REFERENCES .............................................................................................................................. 80
6
INTRODUCTION
Relevance of the study
With the expansion of the internet and its acceptance as a new sales and marketing channel,
online shopping has emerged as a viable purchasing mode with significant growth potential.
Companies from completely different spheres are now actively offering their products and services
on the Internet, and customers are increasingly switching to digital channels. In this respect, the
retail companies are not an exception – the global e-commerce sales and their share in total sales
of retail companies shows consistent growth. According to statistics, e-commerce sales almost
tripled, comparing 2014 and 2019 figures (Statista, 2020), and the share increased by 4% (from 10
to 14%) in three years from 2017 to 2019 (eMarketer, 2019). So, online purchases of goods are
continuously gaining popularity.
In this respect, Russia currently is not lagging behind and even surpasses other countries
in some ways. Initially, Russia was adopting e-commerce much slower than the majority of
developed countries. However, in last years and, especially, with the advent of COVID-19
pandemic industry has shown a dramatic and one of the fastest growths (22%, 28% and 44% in
2018, 2019 and 2020, respectively) (Data Insight, 2021), while customers have demonstrated great
pace of new technologies acceptance. According to the research done by Online Retail
Association, in the 2020 the share of e-commerce in the total retail turnover reached 9.6% (with
absolute maximum of 10,9% in the first half of the year), compared with only 6.1% in 2019 and
around 4% in 2018 (Online Retail Association, 2021, 2020, 2019). So, Russia is now approaching
the level of the most developed countries in terms of online sales, such as the United States and
China, with shares of 14% and 24.9% respectively (UNCTAD, 2021).
Online grocery has been also expanding its presence in Russia in the last years, catching
up with western trends. It showed stable high growth (50% in 2018, 70% in 2019), but its share in
total grocery market was still only 0.15% in 2018, while already in 2016, the share of online
grocery in South Korea was 16,6% (the largest), 6,9% in the United Kingdom and around 4% in
the US (Statista, 2019). According to PWC’s Global Consumer Insight survey (PWC, 2019),
around 54% of Russian consumers were interested in purchasing groceries online in 2018 that was
really close to the figure for the US which is 59% (eMarketer, 2019). However, the share of people
who really bought some food products online in Russia was only 16% in 2019, comparing with
48% in the US. At the same time, the research has shown that positive online grocery shopping
experience has a great favorable effect on repeating purchase intention (e.g. Mortimer et al., 2016;

7
Chiu et al., 2014; Abdul-Muhmin, 2010). From this we can conclude that people in Russia needed
some trigger to start buying food online and 2020 has given such a push with COVID-19 pandemic.
Due to the COVID-19 related introduction of self-isolation and increased health concerns
people were trying not to leave their apartments without a serious need which has led to boost in
delivery services use and online shopping. In 2020 online grocery sales in Russia soared by 314%
compared to 2019 - from 43 billion to 135 billion rubles (INFOLine, 2021). Moreover, according
to the survey, conducted by Yandex, 56% of customers are not planning to reduce the share of
online grocery purchases even after all restrictions are lifted (Yandex, 2020).
Relying on this evidence, we can suppose that online grocery will develop actively further
even when the situation with COVID-19 will stabilize. So, to catch up with trends and to gain a
competitive advantage more and more conventional retailers will be using internet shopping as
part of their business strategy. And pure online services will also grow. At the same time, the
importance of customer satisfaction in traditional and online shopping has been recognized largely
in the literature, showing that it has a significant impact on acquisition of new customers and
retention of already existing ones (Yi and La, 2004; Fraering and Minor, 2013; Rita et al., 2019).
Thus, currently it is very appropriate and relevant to study customer perception of grocery e-
commerce to get better understanding which factors affect customer satisfaction with the service
in order to provide companies with the basis to improve their services, retain and attract clients.
Research gap
The review of fundamental and current literature on a global scale showed a great number
of research has been conducted concerning online grocery customer experience, including ones
identifying what consumers see as positive and negative aspects of this experience, what motivate
them for its adoption (e.g. Morganosky and Cude, 2000; Robinson et al., 2007; Blitstein et al.,
2020), what barriers interfere customers from shopping for groceries online (e.g. Ramus and
Nielsen, 2005; Huang and Oppewal, 2006; Alam et al., 2016) and so on. Customer satisfaction
with e-grocery was also studied from different perspectives, considering its drivers (e.g. Souitaris,
and Balabanis, 2007; Sreeram et al., 2017) and how it influences other constructs such as trust or
loyalty (e.g. Mortimer et al., 2016; Park and Thangam, 2019). So, even though, online grocery
shopping is rather narrow topic (compared with the whole online shopping experience which is
investigated to a much greater extent), due to its active adoption in some countries and high interest
from real business, there is a certain interest for exploration and large applicability of obtained
results.
8
However, most of the existing models and frameworks have been derived mainly from the
research conducted in limited number of countries, due to uneven geographical expansion of
grocery e-commerce. The factor of different cultural, social and economic background cannot be
fully eliminated, so the results cannot be transferred directly to any other context. As it was
mentioned, online grocery was developing actively in Russia only during last years. Before, there
was only a small number of offers and the number of customers was limited. Thus, there is a lack
of researches on the topic that was applied specifically to Russian context. It is still quite new
experience for people and for investigators as well.
Moreover, the COVID-19 pandemic definitely has introduced changes in the global and
national environment, modifying customer behavior in many spheres, including traditional and
online grocery shopping. Researches, understanding that such serious shift can create new
behavioral patterns, change motivational factors and people's perception of the service, already
have started to include COVID-19 context in their studies (e.g. Dannenberg et al., 2020; Chang
and Meyerhoefer, 2020; Bauerová, 2021). Thus, consideration of the customer's position toward
online grocery in connection with the changed external conditions is another gap that exists.
So, according to the defined issues, the research gap, to be addressed, lies in the lack of
research of online grocery, as a whole, and customer shopping experience and attitude towards it
specifically in Russia and taking into account the influence of COVID-19 pandemic.
Research purpose and tasks
Hence, taking into account specified research gap, the purpose of this study is to investigate
factors that can affect and determine customer satisfaction with online grocery shopping in the
conditions of the Russian market during the COVID-19 pandemic. Moreover, the following
research questions were formulated:
RQ1. What are the drivers of customer satisfaction with online grocery shopping
experience?
RQ2. Is there any impact, imposed by COVID-19 pandemic on customers’ evaluation of
these drivers?
RQ3. Do findings, obtained on the sample including Russian customers, correspond with
existing findings for other countries?
The work involves conducting a primary study, that is, collecting real data, on the basis of
which hypotheses defined by analyzing the available literature on the topic will be tested. To
achieve the stated goal and answer the research questions, the following tasks were set:
9
1. To analyze the literature concerning the phenomenon of e-grocery and drivers of
customer satisfaction with it;
2. To create a conceptual model of customer satisfaction with online grocery shopping
experience and to determine the research hypotheses, relying on existing studies;
3. To conduct a primary study in form of the survey to test stated hypotheses, verify
the model and generalize results;
4. To prepare a systematic summary of the results obtained and to discuss their
theoretical and practical implications and significance.
At last, since the topic of interest is rather novel and not so much studies are available on
it, the research of this master’s thesis will be of exploratory type. The structure of this work
corresponds to the tasks set. The first chapter provides an analysis of the existing literature and
theoretical basis necessary for understanding the object and subject of research, namely, the e-
grocery service concept and customer satisfaction construct are considered. In addition, the first
chapter contains a brief description of the main differences between offline and online shopping
experience, a specification of drivers of customer satisfaction with online grocery shopping, and
at the end the research model and the hypotheses of the current study are presented. The second
chapter is devoted to the methodology of the primary research, the description of the general
population and obtained sample, the structure of the survey, statistical data processing tools. The
third chapter presents the substantive results of the conducted research and verification of the
proposed hypotheses, accompanied by the description of theoretical and practical implications,
limitations and areas for future research.
10
CHAPTER 1. ONLINE GROCERY SHOPPING AND DRIVERS OF
CUSTOMER SATISFACTION WITH THIS EXPERIENCE
1.1. E-grocery, difference between offline and online shopping experience
The Internet for a long time has not been a new channel of interaction between business
and its customers, most companies now apply multi-channel strategy or even go completely online
as well as their clients who demand more and more online presence. Retail industry and
specifically grocery sector is not an exception. Generally, e-grocery represents services of ordering
food products online with the possibility of home delivery. Companies, offering this type of
service, can be divided into 3 groups. The first is online branches of traditional grocery retailers –
it appears when company extends its offline presence to the Internet and offers customers to form
an order on the website. Then products are picked at a local supermarket and delivered or the client
is invited to take it away from a store. In Russia many food retailers already provide such
opportunity, among them there are Lenta, Perekrestok and VkusVill. A second type of Internet
grocery is delivery service. It is an intermediary between traditional offline stores and customers.
Such companies conclude contracts with retailers and offer customers a possibility to order food
from their favorite shops to be delivered. The Russian representatives of this type of e-grocery
service are, for example, Sbermarket and Igooods. The last type is pure online retailers. They don’t
cooperate with traditional grocery retailers and offer customers food products from their own
warehouses. In Russia there are Samokat, Utkonos, Yandex.Lavka and currently many others.
Researchers, conducted many studies, have long proved that traditional (offline) and
online shopping experiences are very different and consumer perception of risks and benefits of
the Internet store is in a way distinct from the ones of in-store shopping (Broekhuizen, 2006;
Featherman and Wells, 2010). This also applies directly to e-grocery (Anesbury et al., 2016;
Munson et al., 2017). Thus, in order to get a better understanding of research background and form
a basis for building the model, we need to have an overview of the most noticeable difference
between online and offline shopping. Doing it, we will be relying on online shopping attributes,
investigated by a number of researchers (Szymanski and Hise, 2000; Dholakia and Zhao, 2010;
Jiang et al., 2013). These studies have classified the attributes of online stores into four categories:
merchandise (including product related characteristics such as assortment and product
information), customer service and promotions, navigation and convenience, and security.
The first and the most general point, differentiating offline and online shopping, lays in
total difference between website and traditional store. For example, online shops cannot use in-
store marketing, in traditional understanding, while marketing specialist have investigated and
11
developed various methods of using traditional distribution channels for promotion (Fam et al.,
2011). The whole environment of the store, including the sequence of sections, background music,
products at the cash desk, shelf space use, promotional events (such as testing) and many others,
influences consumer behavior. The packaging of the products is also actively used in these
practices, for example, Chandon et al. (2009) demonstrate that the number of facings has a strong
positive impact on brand evaluation. Another way to bring larger attention to brand is to place
product in specific locations on the shelf, for example, study by Atalay et al. (2012) shown that
brands in the horizontal center receive more visual attention. It is clear that in online store all these
practices cannot be applied in the same manner. What determines the success of attracting and
retaining customers, and also has a primary influence on the decision to make a purchase, is the
design and functionality of the website (Zhou et al., 2009), which includes such technological
aspects as navigation, appearance, and layout (Cyr, 2008). The interface of an online store affects
the experience of consumers (Griffith, 2001) and, if well designed, it can reduce costumers' search
costs and the time required to process information, which will minimize the effort required to
perform selection and purchase tasks (Hoque and Lohse, 1999). Moreover, offering products or
services online give an opportunity to use specific promotional activities, such creating
personalized recommendations or discounts, by collecting information about customer preferences
(Lee and Kwon, 2008). So, both online and offline companies carefully design their stores, but
their tools are different and customers are subject to dissimilar stimuli.
The next distinction will be intangibility of the products (Alba et al., 1997). Its most
obvious element is physical intangibility, meaning that in online store there is no chance to hold
product in hands, examine it from every side, check its integrity or freshness. However,
intangibility in online context is a multi-dimensional construct (Laroche et al., 2001) which affects
not only goods, but also services, and the influence will differ for various group inside these two
categories. As it creates the additional risk for customer, intangibility becomes one of the key
inhibitors of adopting electronic commerce (Featherman and Pavlou, 2003). To mitigate the risks
of product intangibility and make a final decision customers demand more information and
additional security measures (such as opportunity of the return). At the same time, this factor can
have a positive influence on brand loyalty (Arce-Urriza and Cebollada, 2012). People, afraid of
making a mistake and buying bad product, tend to believe well-known brands and, thus, some
studies indicate advantages enjoyed by such brands in virtual environments (Ho-Dac et al., 2013;
González-Benito et al., 2015).
As it was mentioned, to decrease the level of perceived risk of buying products online,
customers seek for additional information. In general, customers have long been using the Internet
12
as the source of prepurchase information search (Rowley, 2000; Maignan and Lukas,1997),
looking for availability, comparing different offers, checking the reliability of the company and so
on. In order to reassure customer to make a final decision and buy product online, there have to be
all necessary information about product on the website, so that person has less doubts about its
intangibility (Park and Kim, 2006). Thus, many researches, dedicated to the factors influencing
consumer purchase behavior in an e-commerce environment, are focused on the availability of
information (Wolfinbarger and Gilly, 2001). Taking this into account, e-stores provide pictures,
written descriptions of product characteristics, reviews which serve as a reference point and many
other additional information, intending to make decision-making easier and the probability of the
wrong choice lower. Another side of great information availability in the Internet is a possibility
to compare. In online store products can be easily compared by price, weight, content or other
characteristics and not even within one platform. Consumer can find the best offer for the moment
and make an order from several places at once, saving money with less extra efforts.
The last factor that substantially differentiate online shopping is security risk (Miyazaki
and Fernandez, 2001). Studies show that online shopping security and privacy is great concern for
customers (Chen et al., 2016), users are worried about possible disclosure of their private
information and about safety of financial transactions (Malhotra, Kim, & Agarwal, 2004). With
the development of the digital technologies, the Internet, on the one hand, is becoming a safer
place, but, at the same time, there appear new kinds of fraudulent activities, and scandals related
to the disclosure of user information do not subside.
So, of course, there are factors that are important for any shopping experience, no matter
online or offline, such as product quality, price, service and others. However, also there are many
factors that differentiate these experiences, making it impossible to replicate best practices to
attract and retain customers and leaving wide space for research. Therefore, it is crucial to
understand what particularly drives customer satisfaction in online shopping environment (for the
purposes of this work, in e-grocery), hence, what elements of the offer should be managed properly
to bring the buyer to the purchase and build his/her loyalty to the company.
1.2. Customer satisfaction
Customer shopping definition
In marketing, customer satisfaction is one of the most examined constructs. It is defined
as an end result of meeting customer's expectations for product (service) performance and
determined by comparing prior expectations with the impression of what was actually received
(Oliver, 1980). If real performance of something is at the level or better than customer’s
13
expectations, customers will be satisfied, and if this performance is less, they will be dissatisfied,
followed by them spreading this negative experience among other customers. It is also determined
as «customer’s fulfilment response» which is an evaluation as well as an emotion-based response,
so it is both cognitive and affective in nature (Oliver, 1997). An affective component includes a
pleasurable state of accomplishment from emotions such as happiness, surprise or delight during
the shopping experience (Ha and Perks, 2005), while a cognitive component is based on attribute
assessment and perceived performance (Oliver and Swan, 1989). Customer satisfaction is
generally agreed to be a post-purchase and/or post-use evaluation (Oliver, 1981; Fornell, 1992).
As it was previously stated a number of times, customer satisfaction plays an important
role in shopping (both online and offline), as it is one of the determinants influencing consumer
decisions to continue buying or not and as it affects many other critical shopping experience related
constructs, such as trust or loyalty (Szymanski and Hise, 2000; Yi and La, 2004; Fraering and
Minor, 2013; Rita et al., 2019). Customer satisfaction in an online field is also argued to be a key
factor of profitability (Guo et al., 2012), including since satisfied consumers are more likely to
purchase more in the future than dissatisfied ones (Sánchez‐García et al., 2012). At the same time
maintaining customer satisfaction is one of the hard challenges. Therefore, exploring customer
satisfaction is necessary, especially for relatively new products and services, such as e-grocery. In
order to improve business performance, online retailers should have systematic and deep
comprehension of its drivers and how to manage them properly. Thus, many researches have been
conducted to get a profound understanding on what form and exert customer satisfaction in
different contexts. For the sake of selecting drivers that can be included in the model of this
particular study, it is necessary to explore what models have been already created by previous
researchers in the general context of online shopping and directly in relation to online grocery
shopping. There will be a short review on some of them.
Models of customer satisfaction with online shopping
In the academic field a great variety of researches of customer attitude and behavior in
online shopping context is presented. Some of them propose quite simple models, including a
couple of exogeneous (independent) variables and one endogenous variable. Such mono-models
usually investigate factors or drivers directly influencing the construct of interest (e.g. customer
satisfaction). An example of this type of study can be a research of Guo et al. (2012), evaluating
factors influencing consumer satisfaction towards online shopping in China. It has explored the
effect imposed by eight major drivers on satisfaction, including website design, security,
information quality, payment method, e-service quality, product quality and variety, and delivery
service. The conceptual model, created and analyzed in the paper, is presented below (see figure
14
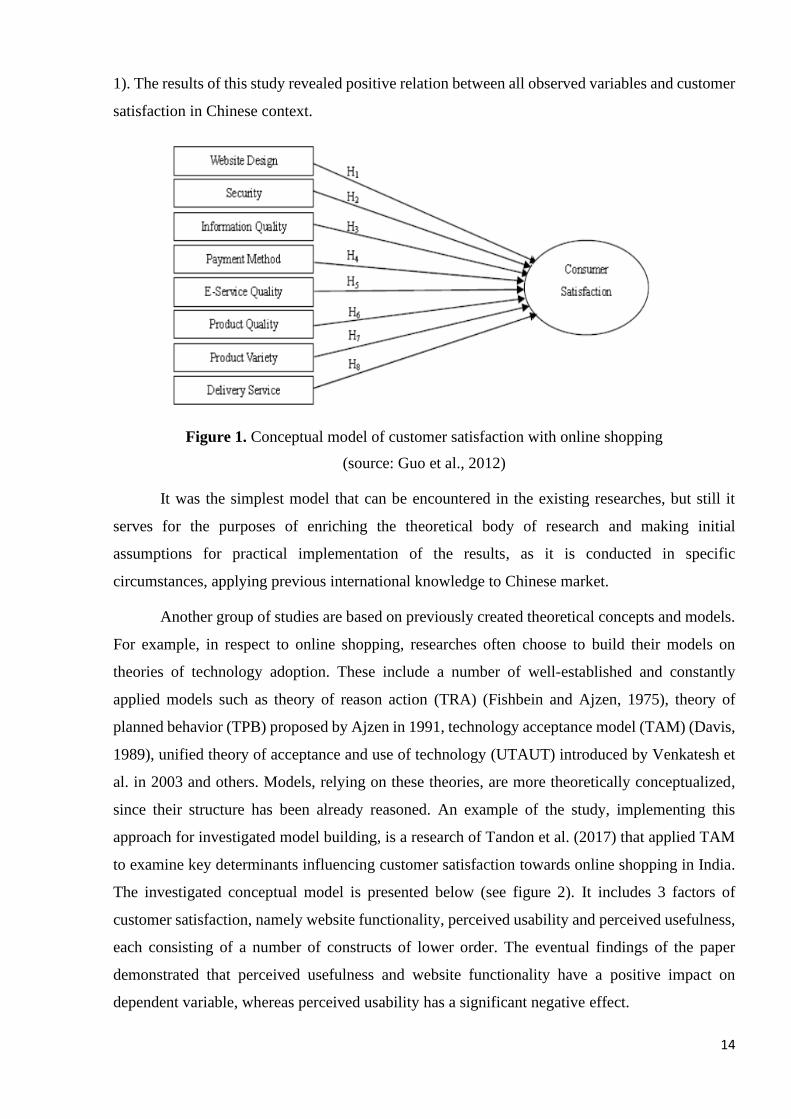
1). The results of this study revealed positive relation between all observed variables and customer
satisfaction in Chinese context.
Figure 1. Conceptual model of customer satisfaction with online shopping
(source: Guo et al., 2012)
It was the simplest model that can be encountered in the existing researches, but still it
serves for the purposes of enriching the theoretical body of research and making initial
assumptions for practical implementation of the results, as it is conducted in specific
circumstances, applying previous international knowledge to Chinese market.
Another group of studies are based on previously created theoretical concepts and models.
For example, in respect to online shopping, researches often choose to build their models on
theories of technology adoption. These include a number of well-established and constantly
applied models such as theory of reason action (TRA) (Fishbein and Ajzen, 1975), theory of
planned behavior (TPB) proposed by Ajzen in 1991, technology acceptance model (TAM) (Davis,
1989), unified theory of acceptance and use of technology (UTAUT) introduced by Venkatesh et
al. in 2003 and others. Models, relying on these theories, are more theoretically conceptualized,
since their structure has been already reasoned. An example of the study, implementing this
approach for investigated model building, is a research of Tandon et al. (2017) that applied TAM
to examine key determinants influencing customer satisfaction towards online shopping in India.
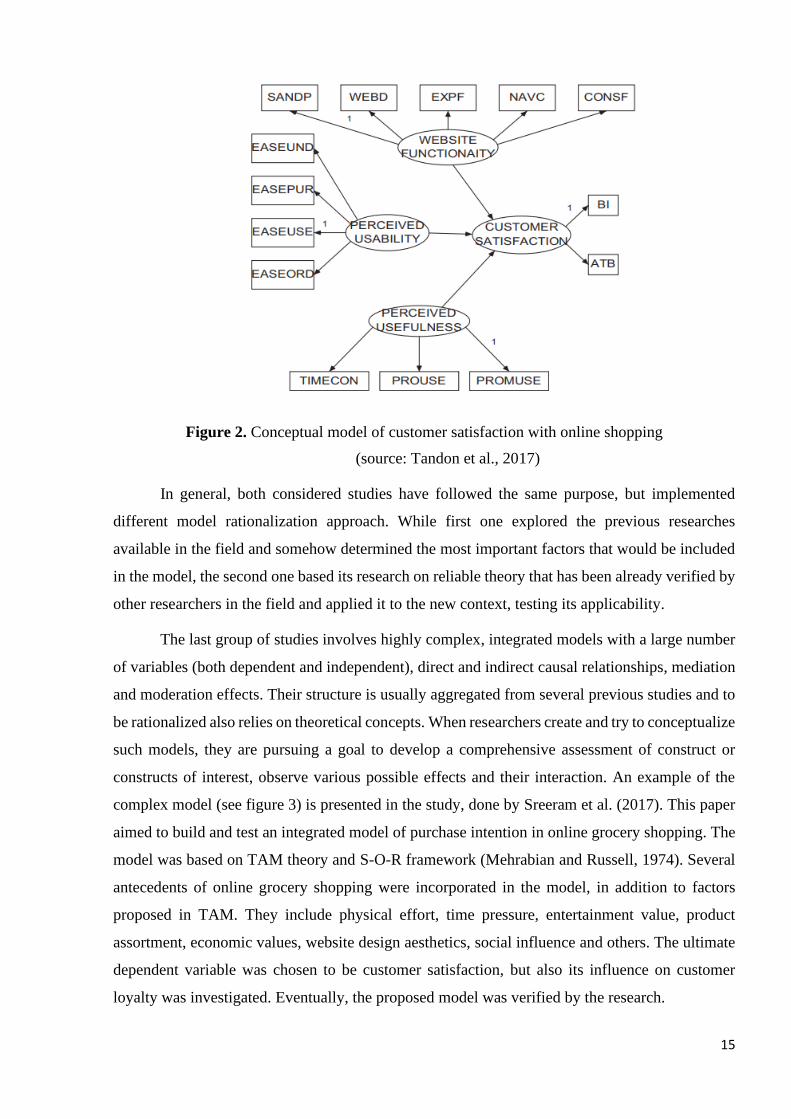
The investigated conceptual model is presented below (see figure 2). It includes 3 factors of
customer satisfaction, namely website functionality, perceived usability and perceived usefulness,
each consisting of a number of constructs of lower order. The eventual findings of the paper
demonstrated that perceived usefulness and website functionality have a positive impact on
dependent variable, whereas perceived usability has a significant negative effect.
15
Figure 2. Conceptual model of customer satisfaction with online shopping
(source: Tandon et al., 2017)
In general, both considered studies have followed the same purpose, but implemented
different model rationalization approach. While first one explored the previous researches
available in the field and somehow determined the most important factors that would be included
in the model, the second one based its research on reliable theory that has been already verified by
other researchers in the field and applied it to the new context, testing its applicability.
The last group of studies involves highly complex, integrated models with a large number
of variables (both dependent and independent), direct and indirect causal relationships, mediation
and moderation effects. Their structure is usually aggregated from several previous studies and to
be rationalized also relies on theoretical concepts. When researchers create and try to conceptualize
such models, they are pursuing a goal to develop a comprehensive assessment of construct or
constructs of interest, observe various possible effects and their interaction. An example of the
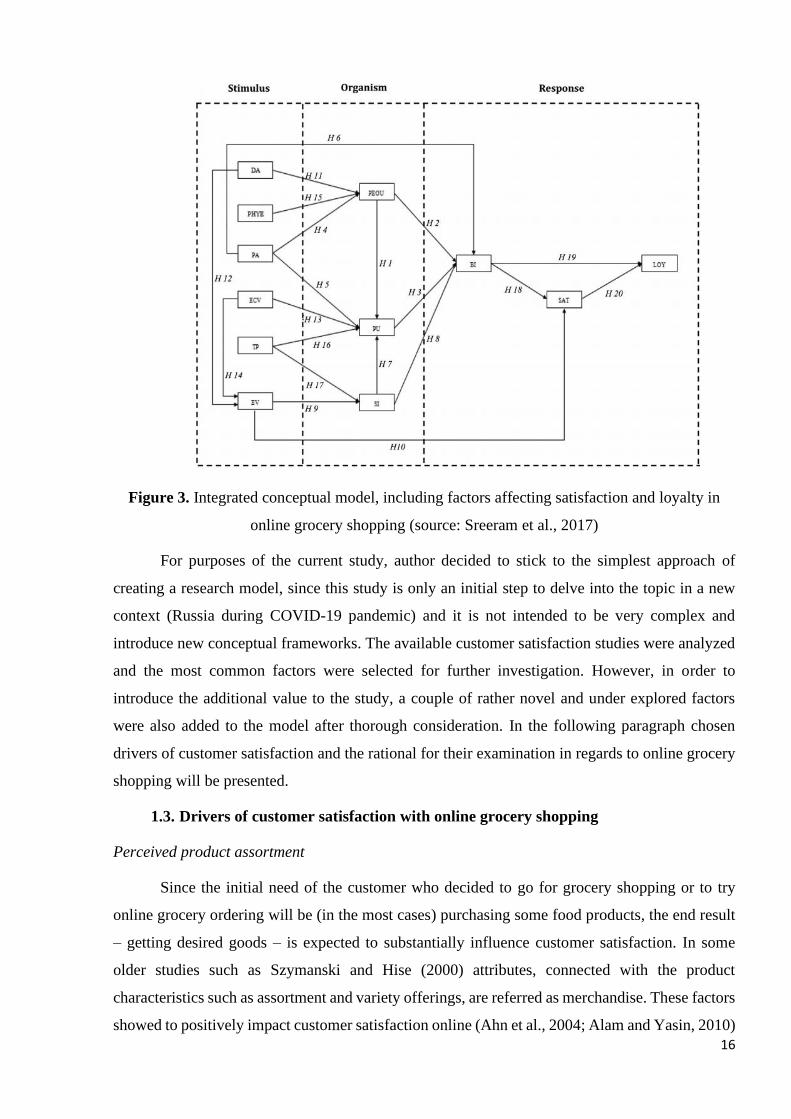
complex model (see figure 3) is presented in the study, done by Sreeram et al. (2017). This paper
aimed to build and test an integrated model of purchase intention in online grocery shopping. The
model was based on TAM theory and S-O-R framework (Mehrabian and Russell, 1974). Several
antecedents of online grocery shopping were incorporated in the model, in addition to factors
proposed in TAM. They include physical effort, time pressure, entertainment value, product
assortment, economic values, website design aesthetics, social influence and others. The ultimate
dependent variable was chosen to be customer satisfaction, but also its influence on customer
loyalty was investigated. Eventually, the proposed model was verified by the research.
16
Figure 3. Integrated conceptual model, including factors affecting satisfaction and loyalty in
online grocery shopping (source: Sreeram et al., 2017)
For purposes of the current study, author decided to stick to the simplest approach of
creating a research model, since this study is only an initial step to delve into the topic in a new
context (Russia during COVID-19 pandemic) and it is not intended to be very complex and
introduce new conceptual frameworks. The available customer satisfaction studies were analyzed
and the most common factors were selected for further investigation. However, in order to
introduce the additional value to the study, a couple of rather novel and under explored factors
were also added to the model after thorough consideration. In the following paragraph chosen
drivers of customer satisfaction and the rational for their examination in regards to online grocery
shopping will be presented.
1.3. Drivers of customer satisfaction with online grocery shopping
Perceived product assortment
Since the initial need of the customer who decided to go for grocery shopping or to try
online grocery ordering will be (in the most cases) purchasing some food products, the end result
– getting desired goods – is expected to substantially influence customer satisfaction. In some
older studies such as Szymanski and Hise (2000) attributes, connected with the product
characteristics such as assortment and variety offerings, are referred as merchandise. These factors
showed to positively impact customer satisfaction online (Ahn et al., 2004; Alam and Yasin, 2010)
17
and, in general, it seems obviously reasonable to expect that satisfaction level would be higher
when consumers perceive online stores to offer advantageous product range. This is especially true
for the situation when customers seek for not widely available products or when in traditional
supermarkets there is a deficit for some reason.
In addition, product assortment can be considered as an element of such often studied factor
of behavioral intention and technology acceptance as performance expectancy (Pappas et al., 2014;
Tandon et al., 2018). It is defined as «a degree to which individuals believe that using a system
will help them to attain gains in job performance» (Venkatesh et al., 2003, p. 24). Thus, since job
performance, as I have mentioned, in case of e-grocery lays in purchasing goods, performance
expectancy includes anticipation to receive a wide range of products, offered by one store, so that
there is no need to look for something in others, not getting the desired result. The following
hypothesis was formulated, regarding this factor:
H1. Perceived product assortment has a significant positive influence on customer
satisfaction with online grocery shopping experience in Russia
Perceived product quality
Another factor which is closely related to the previous one and may be even more important
for customers is product quality. It is an integral property of the product, expected standard of
service excellence. As it was revealed earlier, intangibility can be considered one of the main
barriers for adoption of e-commerce. While buying food or any other products online, customers
can rely only on the information presented at the website of the store and on the reviews from other
costumers. It is impossible to fully verify the quality and freshness of the product before it is
delivered and even if there is a possibility to return or change the spoiled good, the negative
experience will be already obtained and satisfaction may be negatively influenced. This idea also
has been supported by previous studies where researchers have included product performance risk
as a variable determining customer attitude and behavior (Yu et al., 2012; Tandon et al., 2018). It
implies «the possibility of the product malfunctioning and not performing as it was designed and
advertised and therefore failing to deliver the desired benefits» (Featherman and Pavlou, 2003, p.
5). So, it should be important for e-grocery companies to ensure good product quality perception
among their customers to maintain high level of satisfaction due to the fact that it is one of the
most raising doubts issues.
H2. Perceived product quality has a significant positive influence on customer satisfaction
with online grocery shopping experience in Russia
18
Perceived price value
Price is defined as the amount of money a product or service cost, or the amount of value
exchanged by customers to benefit from owning or using a product or service (Kotler and
Armstrong, 2010). It is another P (after product) in the renowned marketing 4P’s model, proposed
by Edmund McCarthy in the 1960s, which show that it is one of the 4 main dimensions of product
or service, managing which marketer can increase the perceived value. Regarding ordinary
shopping and e-grocery experience, while product itself is the end result that customer receive and
that is usually perceived as a gain, price and the end sum (which may include delivery costs) which
is paid are perceived as loss and customers strive to reduce them. However, it is not always the
real price that affects decision making. In this respect, Jacoby and Olson (1997) propose to separate
the concept of the objective price and the price perception that customers imply. Hence, perceived
price can be defined as the level of (monetary) price at a vendor in comparison with the customer’s
reference price (Kim et al., 2012). In its turn, customer’s reference price is formed by their
experience (e.g. by prices in traditional stores or prices of other e-retailers). Several investigations
have been conducted, confirming the role of price perception as an attribute of customer
satisfaction and purchase intention (Jiang and Rosenbloom, 2005; Lin et al., 2011; Tandon et al.,
2018). Moreover, in online environment with higher performance risk, price perceptions
significance shown to be increasing, again since the product is not available for physical evaluation
before purchase and costumers rely on price cues as additional quality indicator. Therefore, it is
reasonable to add it in the model.
H3. Perceived price value has a significant positive influence on customer satisfaction with
online grocery shopping experience in Russia
Perceived delivery performance
Time and cost savings are usually mention by buyers as the main advantages of performing
shopping online (Lee and Koshi, 2007). In their turn, perceived time savings can involve a reduced
duration of purchase at the store itself and, additionally, avoidance of long travels, heavy traffic
and time for searching a parking space. According to Verhoef and Langerak (2001), costumers
also perceive the reduction of the physical effort, as an important advantage of online grocery
shopping. All these are creating a special convenience of the experience and are provided by the
main offering of the e-commerce – delivery (Morganosky and Cude, 2000; Harris et al., 2017).
Researches indicate that the on time and safe delivery increase customer satisfaction and stimulate
repurchase intention (Ahn et al., 2004; Lee and Koshi, 2007; Guo and Liu, 2012). However,
delivery is usually more than anything is prone to errors. Delivery problem is a common
phenomenon that exists in the online shopping environment. There can be a delay, damage of the
19
products during transportation, errors in order assembly, leading to missing or wrong goods
shipped. These situations, if they are experienced by customer, have a great negative impact on
satisfaction. Consequently, the perceived delivery performance should be also added to the model,
since existing findings on online shopping reveal that it can explain much of the variation in
customer satisfaction.
H4. Perceived delivery performance has a significant positive influence on customer
satisfaction with online grocery shopping experience in Russia
Store brand preference
Even though evaluating consumer attitude to brands is a popular topic in the marketing
literature, its applicability to food retailing, and especially to e-grocery purchases, has not yet been
established. Existing studies place more attention to the exploration of product brands and their
perception by customers online and offline (Pozzi, 2012; Anesbury et al., 2016), and not to brands
of the stores. However, still the latter is observed by some researchers. For example, Rafiq and
Fulford (2005) support the proposition that customers loyal towards a given retailer brand are
ready to adopt brand extensions and use them more preferably than other e-stores because of the
name awareness, perceived quality, and other brand associations. Schoenbachler and Gordon
(2002) also proposed that hybrid firms, maintaining both online and physical channels, are favored
over e-tailers by customers, because of the higher trust level. This is again can be explained by
higher degree of perceived risk in online environment, hence, customers try to stay safe in this
way. However, Melis et al. (2015) suggest that such behavior is typical for customer only at the
beginning of their e-commerce adoption. Their findings show that new multi-channel grocery
shoppers tend to choose the online store of their preferred offline chain, but when online grocery
shopping experience increases, their focus switches to a comparison between stores within the
online channel and other characteristics than brand become more influential. Therefore, it is
interesting to add the store brand preference attribute in the model and see if it affects customer
satisfaction in Russia, since many of them just entered e-grocery market.
H5. Store brand preference has a significant positive influence on customer satisfaction
with online grocery shopping experience in Russia
Perceived website (app) quality
Website characteristics seems to be the most researched factor, added almost in every
model concerning online shopping (Szymanski and Hise, 2000; Alam and Yasin, 2010; Guo and
Liu, 2012; Tandon et al., 2018). However, in the last years with the raising rate of smartphones
usage, mobile applications also have become a point of interest for studying (Kim et al., 2017). In
20
general, the majority of website and app characteristics and elements are analogous, but attitude
towards their usage and perceived convenience and usability of these means can be different for
customers (Almarashdeh et al., 2018). Still, it can be supposed that overall customer usage
experience is similar for both website and apps, thus, further in the text when website
characteristics are discussed, the same will be applicable to mobile applications. Though, in the
final research model customers, using different means, will be separately analyzed.
Customers interact with the company primarily through the website, so its every element
from visual first impression to transaction process significantly affects customer satisfaction with
the whole online shopping experience. It was proved that a website with good system quality,
information quality, and e-service quality is the main factor to achieve a success in e-commerce
(Sharma and Lijuan, 2015). There have also been developed a great number of dimensions of
website design and functionality among which there are visual appeal (appearance) (Cyr, 2008;
Blut, 2016), navigation (Park and Kim, 2006; Lee and Kozar, 2012), content and information
availability (Wolfinbarger and Gilly, 2003; Dholakia and Zhao, 2010), convenience and usability
(Lee and Kozar, 2012), website service quality (Wu, 2011; Guo et al., 2012), security (Szymanski
and Hise, 2000; Guo et al., 2012), customization (Liang et al., 2007) and others. Based on the
review of the literature, for the purposes of this research the following attributes will be proposed
as components of perceived website (app) quality – perceived website (app) appearance,
perceived content quality, perceived navigability, perceived customization and perceived security.
These features should have a positive impact on customer satisfaction.
H6. Perceived website (app) quality is a multidimensional construct, consisting of
perceived website (app) appearance, perceived content quality, perceived navigability, perceived
customization, perceived security.
H7. Perceived website (app) quality has a significant positive influence on customer
satisfaction with online grocery shopping experience in Russia
Website (app) appearance is the attribute that influence the first impression of the customer
toward e-store and is considered as a key component of website quality. Visual design of a
shopping website can have an influence on various factors of online buying behavior such as
perceived ease of use, perceived usefulness, perceived enjoyment, and ultimately acceptance of
online shopping (Hasan, 2016). Users can be either attracted or distracted by the color scheme,
layout, structure and display of the website on the device screen. Though, design of the site has to
be visually appealing and functional at the same time, so that it was easy for users to learn how to
operate. Wells et al. (2011) suggested that attractive visual website design can enhance customer
perception of product and vendor quality, building trust. Cyr (2008) explored 3 perspectives of the
21
website design, including information design, navigation design and visual design, as factors of
the website trust, satisfaction and e-loyalty. The visual design among all was proved to have a
positive influence on customer satisfaction.
Content of the grocery e-store consist of various different elements, including pictures,
product information, price information, reviews, information about services and optionally
additional content such as thematic sets, recipes and so on. Customers need all this information to
make a right final decision and the absence of at least one of them can negatively affect the
perceived reliability of the website and, consequently, willingness to buy due to the increasing
risk. Customer satisfaction also depend on the ease with which relevant information can be found.
Information availability (Wolfinbarger and Gilly, 2003) is considered as a significant influential
factor in online shopping context and the researches also show that high level of information
quality (consisting of information accuracy, comprehensibility, completeness and relevance) will
enhance customer satisfaction in online shopping (Liu et al., 2008). So, e-stores are expected to
provide enriched and comprehensible content to support and assist customer shopping experience,
facilitating making better decisions and increasing satisfaction.
Navigation, search and filtering functions greatly affect the usability of the website and
overall convenience of the online shopping experience (Szymanski and Hise, 2000). Customers
can find needed goods by category, price, brand or any other characteristic, they can enter the
name of the product in the search and immediately get what they want. Accordingly, a well-design
and structured interface and navigation function create time and browsing benefits, reducing effort
involved and leading to higher online shopping satisfaction. For instance, Lee and Kozar (2012)
confirmed that navigability has a strong positive influence on purchase intention. The similar
conclusion was reached by Park and Kim (2006) who stated that user interface quality and
navigability among other attributes affects relational benefit which is significantly related to each
consumer’s site commitment and actual purchase behavior.
Customization can be defined as tailoring the products to the individual needs and
preferences of the customers. In the e-retailing environment companies can provide additional
benefits for consumers by utilizing customization strategies, since it is much easier to gather
different customer related information in the Internet, even without any active customer
involvement, track the behavioral patterns and understand what a particular individual wants.
Thus, investing in personalization technologies, e-retailers can satisfy unique needs of each
customer, providing the right information or product to the right client at the right time. Thirumalai
and Sinha (2009) have investigated an applicability of 3 customization strategies (transaction,
decision and product customization) in regard to three well-established product types –
22
convenience goods (which includes groceries), shopping goods and specialty goods. The results
of the study showed that for convenience goods customer value will be highest in response to the
transaction customization. This means that for products such as groceries which are purchased
frequently and characterized by a routinized purchase behavior, customers are highly receptive to
technologies that make the transaction process (ordering, payment) more convenient, personal,
and interactive. In this respect, Liang et al. (2007) also explored the relation between personalized
content recommendation and user satisfaction and came to a conclusion that personalization of
shopping experience can reduce information overload and, hence, increase customer satisfaction.
Therefore, perceived customization of the website and overall ordering experience also will be
included in the research model.
Security is the last attribute of perceived website quality which will be added in the model.
It is usually concerned with website’s ability of protecting consumer personal (privacy) and
financial (security) information, collected from transactions, from an unauthorized use or
intentional disclosure (Guo et al., 2012). In this research concepts of privacy and security will be
combined and presented as security. So, security and privacy issues are one of the most disturbing
for customers adopting online shopping. Their first concern is connected with payment and safety
of credit/debit card usage and another one implies unwillingness or fear to provide honest personal
data, often customers avoid websites that require it for registration or just give incorrect or
incomplete details. Miyazaki and Fernandez (2001) in their study found out that longer Internet
experience may lead to lower security risk perception towards online shopping and, in contrast, to
more concerns regarding online privacy due to accumulated knowledge. All in all, as researches
show (Guo et al., 2012; Tandon et al., 2018; Tran et al., 2020) security (and privacy) risk tend to
have a negative impact on customer satisfaction and trust in e-companies, while offering proper
safety measures can enhance perceived website reliability and increase trust in e-store.
Perceived ease of use
Perceived ease of use (or usability) has been identified as one of the factors affecting not
only online shopping experience and satisfaction, but also primarily adoption of e-commerce.
When digital technologies and the Internet was only starting to develop and extend globally, Davis
(1989) has presented the Technology Acceptance Model (TAM) which was intended to explain
the acceptance of information technology for different tasks. In further researches it (and its
updated versions) was actively used to explore internet shopping adoption intention. The model
suggests that an attitude toward using an information system is based on two primary factors –
perceived usefulness and perceived ease of use. The first is defined as «the prospective user’s
subjective probability that using a specific application system will increase his or her job

23
performance within an organizational context». While perceived ease of use is determined as «the
degree to which the prospective user expects the target system to be free of effort» and logically
how easy it is to learn to use the system (Davis et al., 1989). Both this technology adoption drivers
were proved to have a considerable positive impact on customer satisfaction (either direct or
through attitude to online shopping), as the more convenient, beneficial and effortless the online
shopping experience is, the more people would be pleased with the experience and be willing to
continue its utilization (Featherman and Pavlou, 2003; Tandon et al., 2017). However, Prasetyo et
al. (2021) at their most recent study, dedicated to online food delivery service (OFDS) and
conducted in the context of COVID-19 pandemic, got the results showing that usability factors,
such as navigational design and perceived ease of use were not significant to customer satisfaction
and loyalty in OFDS during the current situation. One possible explanation to this finding is that
customers were forced to use OFDS due to the situational factors and, hence, used the relevant
services anyway, paying less attention to their convenience. Thus, it is interesting to include the
ease-of-use variable in the research model. Moreover, not only the direct influence will be tested,
but also the possible moderation of perceived ease of use on the effect of perceived website (app)
quality on customer satisfaction.
H7b. Perceived ease of use will moderate the effect of perceived website (app) quality on
customer satisfaction with online grocery shopping experience in Russia
1.4. COVID-19 pandemic as a situational factor, affecting customers
In addition to the just described factors, there are others that can influence customers’
behavior and attitudes in the online shopping environment. Another large group of such parameters
can be defined as situational factors. These factors may become significant when some external
influence create specific conditions that temporarily change consumers’ preference, attitude or
intention toward a certain service, which may eventually affect their permanent preferences and
behaviors (Kim et al., 2017). Belk (1975), who was one of the first researchers considering
situational factors for offline shopping, specified five variables that affect purchase behavior:
antecedent states, physical surrounding, temporal perspective, social surroundings and task
definition. Particular examples can include illness, hurry, unemployment and which is interesting
for this particular research – COVID-19 pandemic. Situational factors are somehow less usually
investigated in consumer behavior research, both in general and specifically in regards to internet
shopping, and they are rarely added in the research models. However, some authors still recognize
their role and state that these may be very important in the understanding of different processes
and constructs, including internet services adoption, purchase intention and customer satisfaction.
For example, Dabholkar and Bagozzi (2002) claim that situational factors may prevent consumers
24
from adopting a new product (or technology), even if they possess right consumer traits and are
ready to do it under other circumstances. Hand et al. (2009) in their study, considering e-grocery,
came to a conclusion that situational factors such as having a baby or health problems can become
triggers for starting to buy groceries online. At the same time, this was found to be just temporary
impact - many customers gave up e-grocery with the change in initial situation.
Since COVID-19 has dramatically changed the word and somehow influenced every single
customer, it has to be addressed as the most visible and strong situational factor currently. And
there are already some studies that explore online grocery shopping in the pandemic context
(Dannenberg et al., 2020; Bauerová, 2021; Alaimo et al., 2021). For example, Bauerová (2021)
has investigated whether COVID-19 has influenced the structure of customers (by generations)
buying groceries online in the Czech Republic. It was found out that the acceptance of e-grocery
accelerated dramatically not only in the Millennial generation, but also in the Baby Boomers
generation which had the slowest acceptance rate in the last five years. So, as it is obvious from
the market review presented in the introduction, in Russia due to the COVID-19 pandemic the
percentage of groceries being bought online has increased significantly and customers have shown
raised interest to its adoption. Hence, it is reasonable to include the situational factor, addressing
costumer life during the pandemic, into the research model and explore its direct impact on
customer satisfaction together with the possible moderating effect it poses on the influence of
drivers on satisfaction.
H1a. Variable, concerning consumer life during COVID-19 pandemic, will moderate the
effect of perceived product assortment on customer satisfaction with online grocery shopping
experience in Russia
H2a. Variable, concerning consumer life during COVID-19 pandemic, will moderate the
effect of perceived product quality on customer satisfaction with online grocery shopping
experience in Russia
H3a. Variable, concerning consumer life during COVID-19 pandemic, will moderate the
effect of perceived price value on customer satisfaction with online grocery shopping experience
in Russia
H4a. Variable, concerning consumer life during COVID-19 pandemic, will moderate the
effect of perceived delivery performance on customer satisfaction with online grocery shopping
experience in Russia
25
H5a. Variable, concerning consumer life during COVID-19 pandemic, will moderate the
effect of store brand preference on customer satisfaction with online grocery shopping experience
in Russia
H7a. Variable, concerning consumer life during COVID-19 pandemic, will moderate the
effect of perceived website (app) quality on customer satisfaction with online grocery shopping
experience in Russia
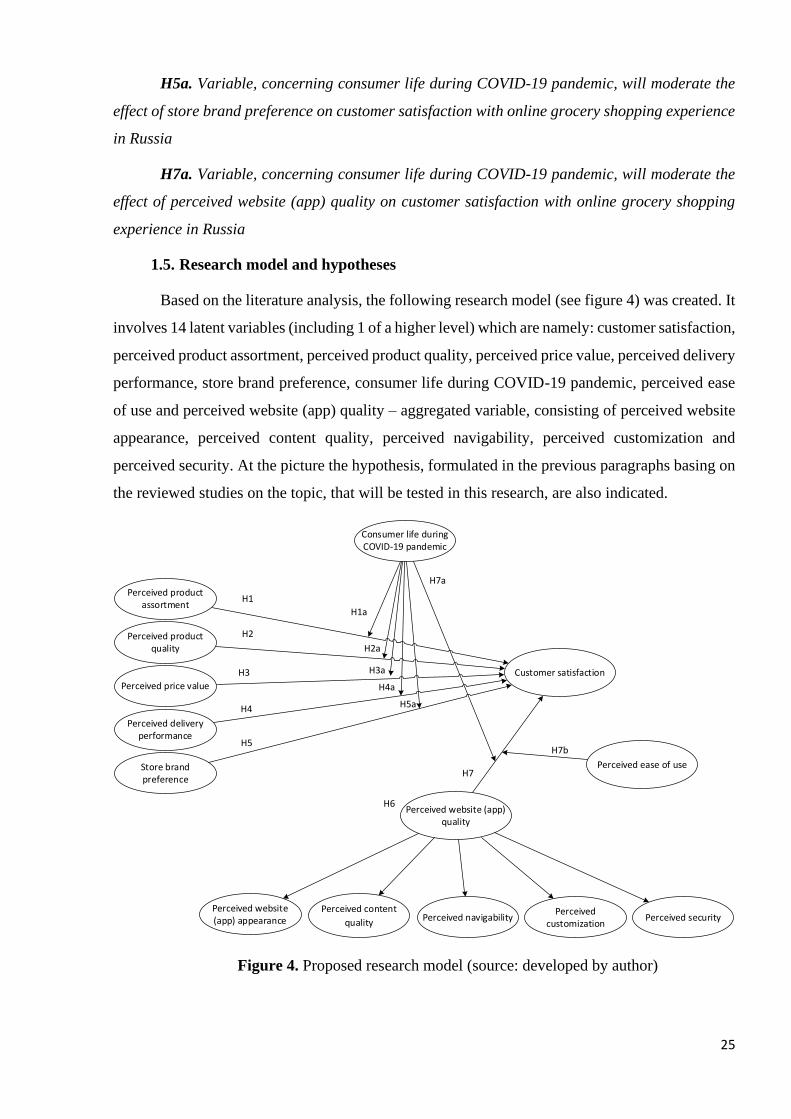
1.5. Research model and hypotheses
Based on the literature analysis, the following research model (see figure 4) was created. It
involves 14 latent variables (including 1 of a higher level) which are namely: customer satisfaction,
perceived product assortment, perceived product quality, perceived price value, perceived delivery
performance, store brand preference, consumer life during COVID-19 pandemic, perceived ease
of use and perceived website (app) quality – aggregated variable, consisting of perceived website
appearance, perceived content quality, perceived navigability, perceived customization and
perceived security. At the picture the hypothesis, formulated in the previous paragraphs basing on
the reviewed studies on the topic, that will be tested in this research, are also indicated.
Perceived website (app) quality
Customer satisfaction
Consumer life during COVID-19 pandemic
Perceived ease of use
Perceived product assortment
Perceived product quality
Perceived price value
Perceived delivery performance
Store brand preference
Perceived website (app) appearance Perceived navigability
Perceived customization
Perceived securityPerceived content
quality
H1
H2
H3
H4
H5
H7
H6
H7b
H7a
H1a
H2a
H3a
H4a
H5a
Figure 4. Proposed research model (source: developed by author)
26
CHAPTER 2. DEVELOPMENT OF THE RESEARCH DESIGN AND
COLLECTION OF THE DATA
2.1. Methods and research design
The research design of this master’s thesis is aimed at testing hypotheses, which were
developed by performing the analysis of the literature and by making an overview of the current
e-grocery market situation in Russia, using empirical means. Thus, the present study follows
quantitative methodology.
Quantitative methods imply the collection and analysis (usually with the help of statistical
tools) of numerical data and can be used to for different purposes such as searching for patterns
and average trends, doing forecast, discovering or testing cause-and-effect relationships and so on.
Under certain conditions (i.e. sufficient level of data quality) the results of the quantitative
researches, gained on an established sample, can be generalized for the whole investigated
population. There are four main quantitative research methods, including observation, survey,
experiment and using secondary data, previously collected for other purposes. For the purposes of
this research, it was decided to use survey as data collection method, since it seems to be the most
frequently utilized method in the studies on the topic and the most easy and convenient mean of
obtaining quantitative data. Survey was conducted online, because the Internet is the easiest
approachable source of getting respondents from target group and since COVID-19 is still present,
it is hardly possible to address people directly. Besides, questionnaire was translated into Russian,
since it is a native language for respondents and this way misunderstandings and misinterpretations
of questions and core concepts can be eliminated.
Designed questionnaire (see appendix 1) consists of 34 questions, aimed at filtering
respondents, understanding their demographics, behavior patterns and attitude towards (online)
grocery shopping and COVID-19. The first part of the questionnaire is introductory and focuses
on eliminating respondents without relevant experience and characteristics. People were asked to
indicate their city of residents (general and particularly during the pandemic), availability of
experience and frequency of online purchases in a number of product categories (including
grocery), the moment of the first online order of groceries in relation to the pandemic (before or
after) and motivation for it. Then, respondents were asked about their typical approach towards
buying groceries and what e-stores they use and through which mean (website or app).
The second part of the questionnaire includes questions regarding drivers of customer
satisfaction which will be analyzed to test the proposed hypotheses. In this part when respondents
were asked to evaluate perceived website (app) quality, they were divided into to corresponding
27
groups, so that they have better understanding the quality of which mean they should assess. In
addition, in this part respondents were requested to respond questions about their life during
COVID-19 pandemic.
In order to receive an evaluation of the investigated constructs, their scales had to be
developed. Operational definitions of the variables and their scales were adopted from prior
research on online shopping and were adapted to country and topic (e-grocery) specifics. Though,
it is important to specify that elements for such variables as store brand preference, perceived
content quality and perceived customization were more seriously redesigned or even formulated
from scratch by author. It was done because exactly these constructs, in the form in which they
were intended to be used in this study, were not presented in any available research (among those
which were reached during literature analysis), therefore, no complete needed scales have been
found. However, in the process of creating the wording of statements, the author still relied heavily
on reliable sources. The sources for variables’ items are presented in the appendix (see appendix
2) and the questions themselves can be seen directly in the questionnaire (see appendix 1).
COVID-19 related construct was the only one which scale was developed specifically,
totally from scratch, since it is, generally, rather new variable which is not yet operationalized.
Moreover, this construct bears rather unique meaning (assessing consumer life during COVID-19
in Russia) which is important particularly for the present study. Thus, the questions for this variable
were formulated on the basis of the analysis of current investigations and trends in consumer
behavior in Russia (Deloitte, 2020; PWC, 2020; IPSOS, 2020). According to these studies, people
were greatly influenced by uncertainty and turbulence that the pandemic have brought to all
spheres of life from economical to social. They expectedly pointed out that care and well-being
were their general priorities and value of money was the most important need for them as
consumers. The situational factors that were supposed to have an impact on customers’ groceries
buying behavior and that were consequently added in the research involve overall attitude towards
risks of getting the virus, preference or obligation to stay at home, change in financial well-being
and experienced deficit of food products, and level of emotional distress. The final version of
included items can be seen in the questionnaire (question 29).
Statements of all items were positively worded and respondents were asked to assess them
in regards to their online grocery shopping experience. Respondents could vary their level of
agreement according to individual perception. It is also necessary to mention that all items were
measured by the standard 5-point Likert scale where 1 correspond to «strongly disagree» and 5 to
«strongly agree».
28
Finally, the last part of the questionnaire comprises general questions on respondents’
socio-demographic characteristics: gender, age, level of education, field of employment and
income level.
2.2. Sample and data collection
Residents of Moscow and St. Petersburg aged 18 to 45 years with experience in online
grocery shopping were taken as the general population for this research.
Implementation of geographical limitation is connected with the fact that in these regions
citizens have experienced (and still experience) the pandemic to the greatest extent. In these cities
the severest restrictions related to the spread of coronavirus infection were introduced, including
self-isolation and lockdown. Moreover, there were observed the largest rates of contamination and
mortality. Therefore, people were subjected to lasting significant changes in their lifestyle. Apart
from that, Moscow and St. Petersburg were the leaders in the volume of food sales via the Internet
channel in 2020, there the e-grocery has reached 2,2% share of total turnover of food products,
which is in a way bigger than in other areas (INFOLine, 2021). So, residents of these cities are the
most active users of online grocery services. In addition, it was these cities that became the first
markets for the largest grocery delivery companies even before the COVID-19 outbreak and,
hence, all national and many local services are operating there. Accordingly, due to all the factors
specified above, in sample were added only people that permanently live in Moscow or St,
Petersburg or ones who have stayed in there at least a month from the beginning of March 2020.
The age constraint also was developed due to some specific reasons. Firstly, studies show
that in Russia the highest rates of overall digital literacy are demonstrated by people under the age
of 44 (NAFI, 2020), meaning that people inside this age boundary show the best capability to be
active in the Internet and are more prone to adopt new technologies. Besides, according to many
studies, most often purchases in the Internet are made by people in the age group of 25-45 years,
along with this the most active segment of online buyers is users aged 25-34 years (PWC, 2019;
PPC.World, 2019). The same patterns can be observed on the e-grocery market (Vc.ru, 2019;
Rusopros, 2020). Approximately 40% of customers of food products delivery services are
considered to be family people aged 35 with a planned budget and a high value of their own time.
The most promising audience is people under 35, who generate about 40% of orders (INGATE,
2020). In addition, respondents from the age group 18-24 were not excluded from the population,
since they are also actively use Internet channel for shopping and they are definitely a perspective
target audience. In this research were not included people over 45 years, because they bear distinct
characteristics (e.g. lower level of digital literacy and, thus, lower readiness and willingness to use
29
Internet for shopping purposes) and presumably have different behavioral patterns and attitude in
relation to e-grocery.
After defining the general population, it was also decided to set quotas by age and gender
in order to increase the representativeness of the data obtained on the reached sample. For these
purposes, a non-probability quota sampling method is used. Withall, the exact demographic
structure of the general population is not determined (it is not of a significant importance for the
current study) and quotas are decided to be equal. 50% of males and females should be present as
well as the equal quantity of the respondents of 3 defined age sub-groups: 18-25, 26-35, 36-45.
Regarding the total number of the answers needed to create a reliable sample, it was
decided to set the goal at obtaining at least 200 respondents. This target was established to
correspond with the chosen exploratory research type and to be sufficient for conducting statistical
analysis, using SEM method. For problem or phenomenon exploration studies the minimum
sample size is set to be 150-200 respondents (Malhotra, Birks, Wills, 2012). In regards to SEM,
the required sample size depends on various factors, including number of latent variables,
indicators, paths, required accuracy and so on. Taking into consideration the characteristics of the
research model and relying on the available literature (Kline, 2011; Hair Jr et al., 2016), the
recommended sample size will also be around 200 respondents, since the model is not very
complex.
To acquire necessary number of responses the convenience and snowball sampling
methods were used. Questionnaire was distributed online via two main channels. The first one is
Russian social network Vkontakte which is the 3rd website by traffic in Russia and the 2nd most
popular social media platform, used by 78% of internet users aged 18-60 (GlobalWebIndex, 2020).
The posts with an appeal to fill out the questionnaire were proposed to different pages and
communities where target audience was expected to be found, which include pages of e-grocery
services and universities’ communities (for the younger respondents). In addition, some direct
requests were sent to people from an older age group. The second channel of obtaining respondents
was online panel of «Anketolog» webservice. Here needed audience was targeted in accordance
with the limitations of the research and each answer was paid. In total, through the second source
60 answers on the questionnaire were acquired.
The overall number of received answers amount to 220. The number of views on different
posts containing the link to the questionnaire was around 8600, so the approximate response rate
is 2.1%. Additionally, it can be mentioned that in complete there were 301 clicks on the
questionnaire link, so 81 individuals refused or could not complete the survey for some reason.
There was no missing data because all the questions were marked as mandatory for filling.
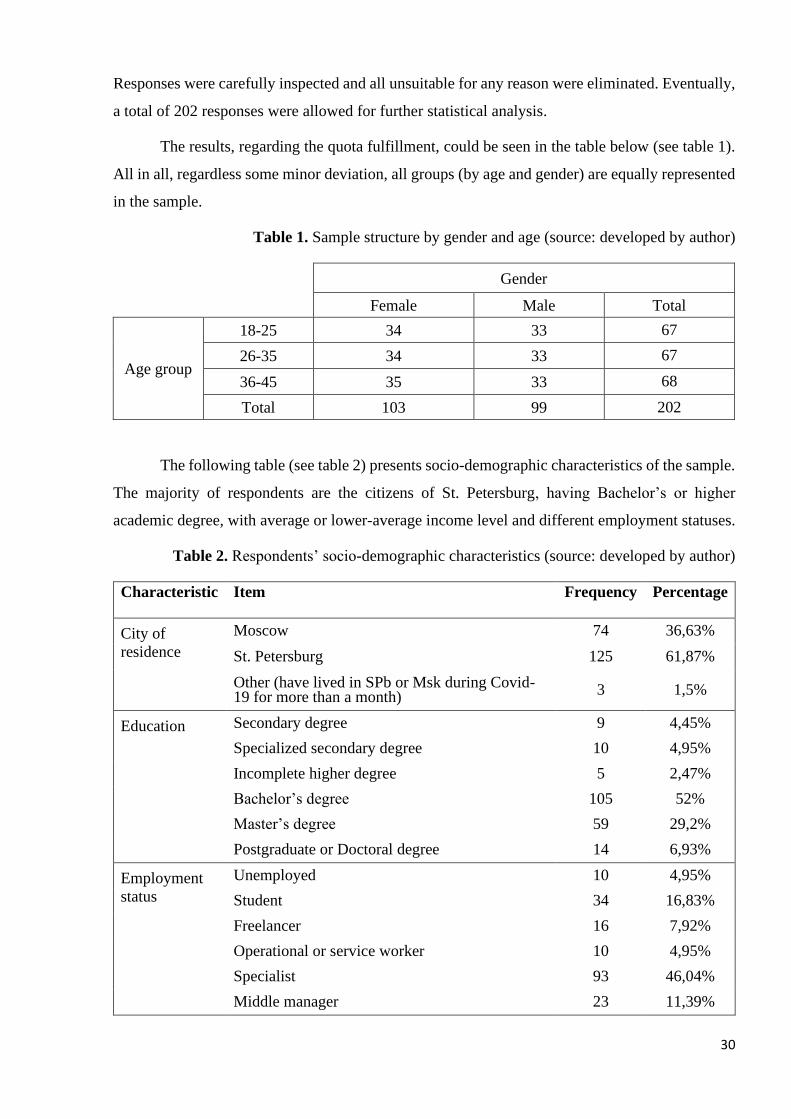
30
Responses were carefully inspected and all unsuitable for any reason were eliminated. Eventually,
a total of 202 responses were allowed for further statistical analysis.
The results, regarding the quota fulfillment, could be seen in the table below (see table 1).
All in all, regardless some minor deviation, all groups (by age and gender) are equally represented
in the sample.
Table 1. Sample structure by gender and age (source: developed by author)
Gender
Female Male Total
Age group
18-25 34 33 67
26-35 34 33 67
36-45 35 33 68
Total 103 99 202
The following table (see table 2) presents socio-demographic characteristics of the sample.
The majority of respondents are the citizens of St. Petersburg, having Bachelor’s or higher
academic degree, with average or lower-average income level and different employment statuses.
Table 2. Respondents’ socio-demographic characteristics (source: developed by author)
Characteristic Item Frequency Percentage
City of
residence
Moscow 74 36,63%
St. Petersburg 125 61,87%
Other (have lived in SPb or Msk during Covid-19 for more than a month)
3 1,5%
Education Secondary degree 9 4,45%
Specialized secondary degree 10 4,95%
Incomplete higher degree 5 2,47%
Bachelor’s degree 105 52%
Master’s degree 59 29,2%
Postgraduate or Doctoral degree 14 6,93%
Employment
status
Unemployed 10 4,95%
Student 34 16,83%
Freelancer 16 7,92%
Operational or service worker 10 4,95%
Specialist 93 46,04%
Middle manager 23 11,39%
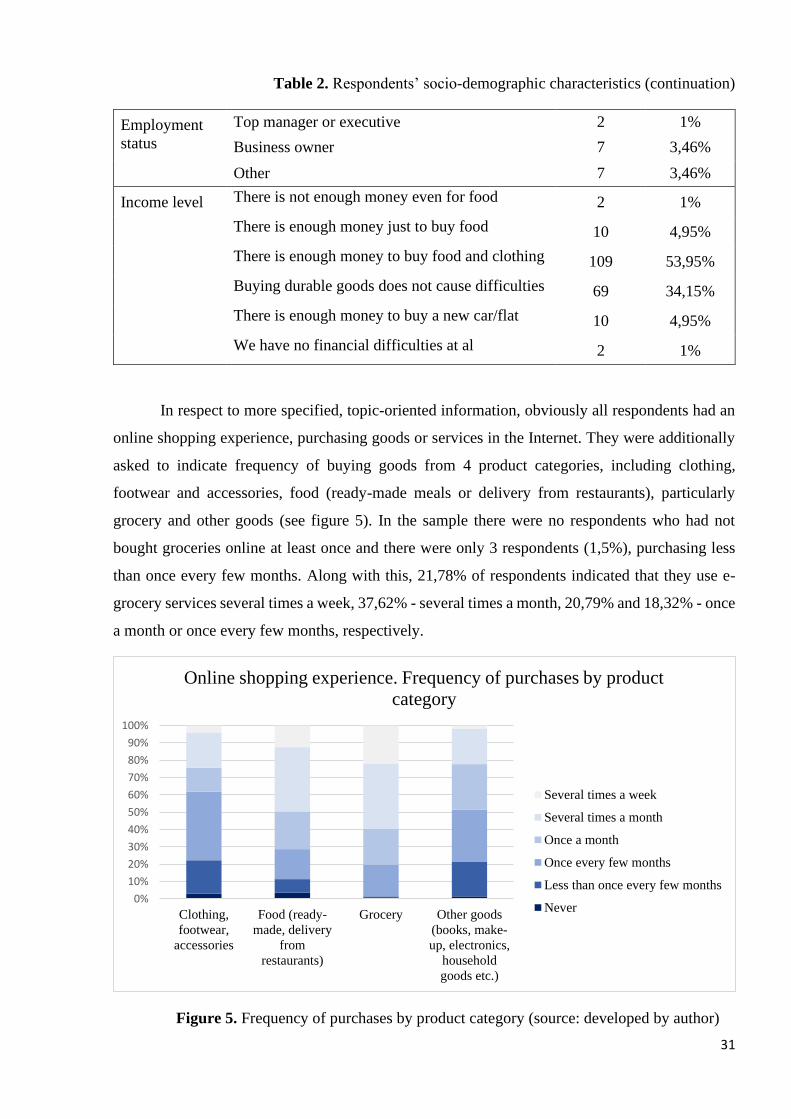
31
Table 2. Respondents’ socio-demographic characteristics (continuation)
Employment
status
Top manager or executive 2 1%
Business owner 7 3,46%
Other 7 3,46%
Income level There is not enough money even for food 2 1%
There is enough money just to buy food 10 4,95%
There is enough money to buy food and clothing 109 53,95%
Buying durable goods does not cause difficulties 69 34,15%
There is enough money to buy a new car/flat 10 4,95%
We have no financial difficulties at al 2 1%
In respect to more specified, topic-oriented information, obviously all respondents had an
online shopping experience, purchasing goods or services in the Internet. They were additionally
asked to indicate frequency of buying goods from 4 product categories, including clothing,
footwear and accessories, food (ready-made meals or delivery from restaurants), particularly
grocery and other goods (see figure 5). In the sample there were no respondents who had not
bought groceries online at least once and there were only 3 respondents (1,5%), purchasing less
than once every few months. Along with this, 21,78% of respondents indicated that they use e-
grocery services several times a week, 37,62% - several times a month, 20,79% and 18,32% - once
a month or once every few months, respectively.
Figure 5. Frequency of purchases by product category (source: developed by author)
0%
10%
20%
30%
40%
50%
60%
70%
80%
90%
100%
Clothing,
footwear,
accessories
Food (ready-
made, delivery
from
restaurants)
Grocery Other goods
(books, make-
up, electronics,
household
goods etc.)
Online shopping experience. Frequency of purchases by product
category
Several times a week
Several times a month
Once a month
Once every few months
Less than once every few months
Never
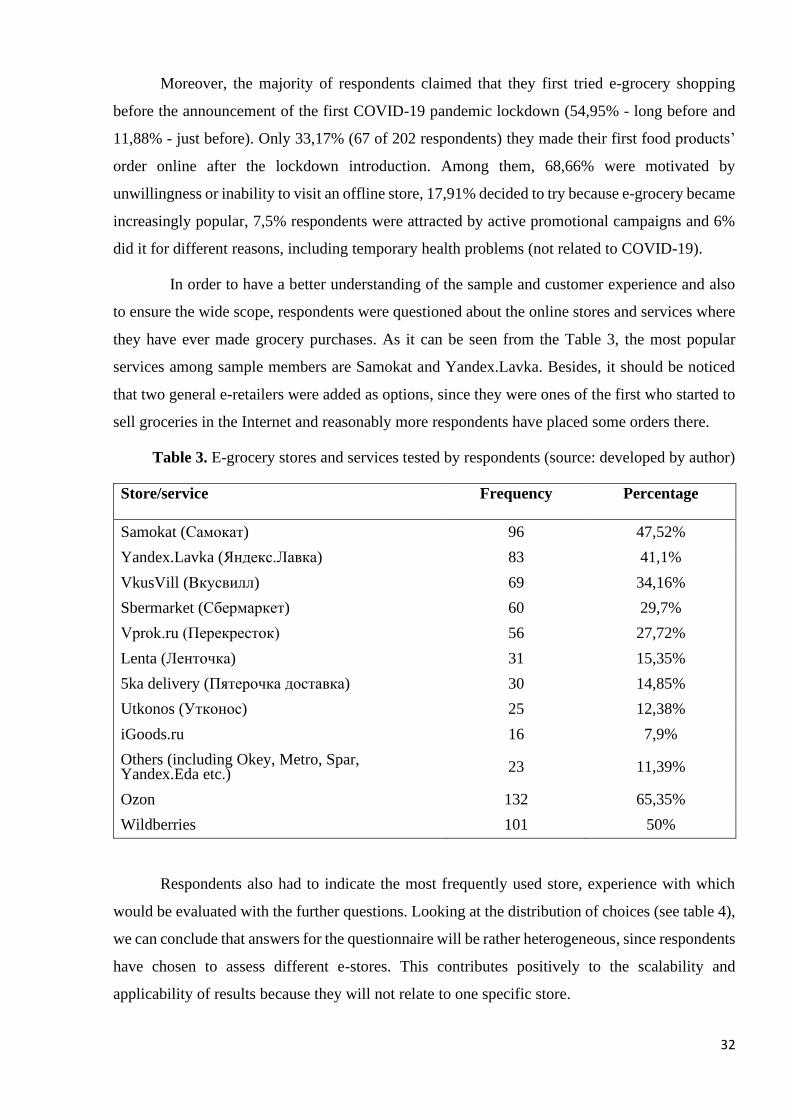
32
Moreover, the majority of respondents claimed that they first tried e-grocery shopping
before the announcement of the first COVID-19 pandemic lockdown (54,95% - long before and
11,88% - just before). Only 33,17% (67 of 202 respondents) they made their first food products’
order online after the lockdown introduction. Among them, 68,66% were motivated by
unwillingness or inability to visit an offline store, 17,91% decided to try because e-grocery became
increasingly popular, 7,5% respondents were attracted by active promotional campaigns and 6%
did it for different reasons, including temporary health problems (not related to COVID-19).
In order to have a better understanding of the sample and customer experience and also
to ensure the wide scope, respondents were questioned about the online stores and services where
they have ever made grocery purchases. As it can be seen from the Table 3, the most popular
services among sample members are Samokat and Yandex.Lavka. Besides, it should be noticed
that two general e-retailers were added as options, since they were ones of the first who started to
sell groceries in the Internet and reasonably more respondents have placed some orders there.
Table 3. E-grocery stores and services tested by respondents (source: developed by author)
Store/service Frequency Percentage
Samokat (Самокат) 96 47,52%
Yandex.Lavka (Яндекс.Лавка) 83 41,1%
VkusVill (Вкусвилл) 69 34,16%
Sbermarket (Сбермаркет) 60 29,7%
Vprok.ru (Перекресток) 56 27,72%
Lenta (Ленточка) 31 15,35%
5ka delivery (Пятерочка доставка) 30 14,85%
Utkonos (Утконос) 25 12,38%
iGoods.ru 16 7,9%
Others (including Okey, Metro, Spar, Yandex.Eda etc.)
23 11,39%
Ozon 132 65,35%
Wildberries 101 50%
Respondents also had to indicate the most frequently used store, experience with which
would be evaluated with the further questions. Looking at the distribution of choices (see table 4),
we can conclude that answers for the questionnaire will be rather heterogeneous, since respondents
have chosen to assess different e-stores. This contributes positively to the scalability and
applicability of results because they will not relate to one specific store.
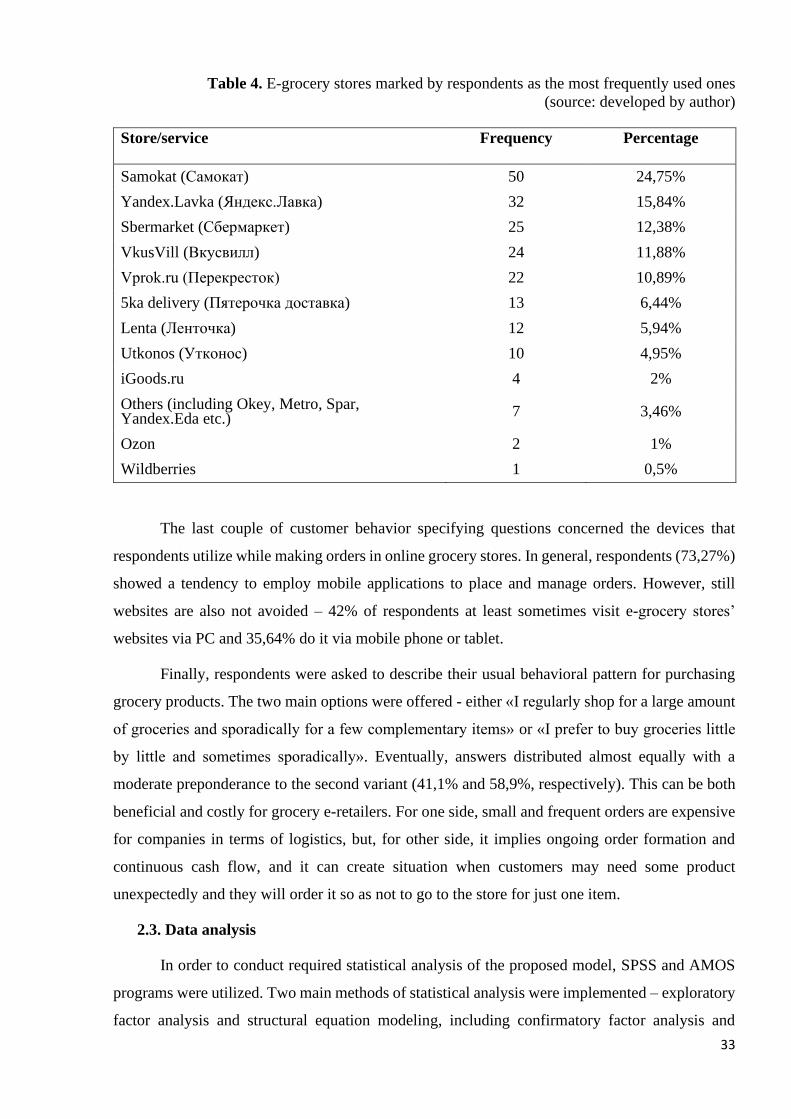
33
Table 4. E-grocery stores marked by respondents as the most frequently used ones
(source: developed by author)
Store/service Frequency Percentage
Samokat (Самокат) 50 24,75%
Yandex.Lavka (Яндекс.Лавка) 32 15,84%
Sbermarket (Сбермаркет) 25 12,38%
VkusVill (Вкусвилл) 24 11,88%
Vprok.ru (Перекресток) 22 10,89%
5ka delivery (Пятерочка доставка) 13 6,44%
Lenta (Ленточка) 12 5,94%
Utkonos (Утконос) 10 4,95%
iGoods.ru 4 2%
Others (including Okey, Metro, Spar, Yandex.Eda etc.)
7 3,46%
Ozon 2 1%
Wildberries 1 0,5%
The last couple of customer behavior specifying questions concerned the devices that
respondents utilize while making orders in online grocery stores. In general, respondents (73,27%)
showed a tendency to employ mobile applications to place and manage orders. However, still
websites are also not avoided – 42% of respondents at least sometimes visit e-grocery stores’
websites via PC and 35,64% do it via mobile phone or tablet.
Finally, respondents were asked to describe their usual behavioral pattern for purchasing
grocery products. The two main options were offered - either «I regularly shop for a large amount
of groceries and sporadically for a few complementary items» or «I prefer to buy groceries little
by little and sometimes sporadically». Eventually, answers distributed almost equally with a
moderate preponderance to the second variant (41,1% and 58,9%, respectively). This can be both
beneficial and costly for grocery e-retailers. For one side, small and frequent orders are expensive
for companies in terms of logistics, but, for other side, it implies ongoing order formation and
continuous cash flow, and it can create situation when customers may need some product
unexpectedly and they will order it so as not to go to the store for just one item.
2.3. Data analysis
In order to conduct required statistical analysis of the proposed model, SPSS and AMOS
programs were utilized. Two main methods of statistical analysis were implemented – exploratory
factor analysis and structural equation modeling, including confirmatory factor analysis and
34
relationships testing. Such research design is traditional and was applied in many previous studies.
The objective of exploratory factor analysis lays in confirming the reliability and internal
consistency of factors included in the model. The questionnaire allows to collect only estimates of
the observed variables (items) which then comprise the meaningful latent constructs. Even though
the majority of the variables in the model were measured using multi-item scales that were
previously tested and verified by other researchers, it was still necessary to reconfirm the reliability
of the resulting latent constructs. Additionally, some items for a number of variables were
reformulated to comply with the research topic and respondents’ background, and scale for the
factor «Customer life during COVID-19 pandemic» was developed from scratch, thus, they
particularly need validation.
After ensuring factors’ consistency, the next method can be applied to directly investigate
regression paths and hypothesized relationships between exogeneous and endogenous variables.
SEM modelling is often used for these purposes in marketing and management research. It enables
researchers to simultaneously examine a series of interrelated dependence relations between a set
of variables while accounting for measurement error. It provides functionality for checking overall
goodness of fit (validity and reliability) for measurement and structural model. Moreover, in
comparison with the traditional regression analysis, SEM allows to add higher order latent
constructs into the model and check their internal consistency and validity. In regards to this study,
there is one higher order latent variable - perceived website (app) quality, presumably consisting
of 5 first order latent variables. Additionally, moderation effects imposed by not only nominal
(such as age group or gender), but also interval variables can be tested, using this statistical method.
There are two major methods of SEM: the covariance-based SEM (CB-SEM) and the partial least
squares SEM (PLS-SEM). In this thesis, the first method will be utilized with the Maximum
Likelihood estimation approach. Even though PLS-SEM is mostly used for exploratory researches
(Hair et al., 2017), when investigated theory is less developed which is a case for current research,
the CB-SEM can be also used for this purpose. It is implemented if the goal of the research is
theory or model testing and confirmation, or comparison of alternative theories. After all, there are
no exact restrictions and properly negotiated conditions for using this or that type of analysis.
35
CHAPTER 3. MODEL ANALYSIS AND DISCUSSION
3.1. Exploratory and confirmatory factor analysis
In order to primarily evaluate the reliability of scales, the Cronbach’s alpha (CA) indicator
was calculated. It shows internal consistency of factor measurement items if higher than 0,7 and it
serves as a prerequisite for conducting exploratory factor analysis (EFA). For all predetermined
variables, except the COVID-19 related one, CA was estimated to be higher than 0,7 threshold
(for majority – 8 out of 13 - it is even higher than 0,8). The indicator for the covid scale is 0,676,
which is not too bad, but it needs further investigation.
After the Cronbach’s alphas were checked, it was possible to move on to EFA which
explains how and to what extent are the observed variables (items) related to the underlying latent
construct. So, it is conducted in order to check for unidimensionality of the latent variables – that
all involved items measure the same concept. It was done in a number of steps. First of all,
independent variables were separated by their meaning, forming two big groups. One includes
direct drivers of customer satisfaction, namely perceived product assortment (assortment),
perceived product quality, perceived price value, perceived delivery performance (delivery) and
store brand preference. The second consists of the components of perceived website (app) quality:
perceived website (app) appearance (appearance), perceived content quality (content), perceived
navigability, perceived customization and perceived security. Dependent variable (customer
satisfaction) and moderators (covid and perceived ease of use) were tested separately.
To perform exploratory factor analysis, the principal component method and the Varimax
rotation technique were utilized as the most frequently used. The following indicators of reliability
and validity of scales were measured and evaluated:
• Kaiser-Meyer Measure (KMO) - shows unconditional adequacy of factor analysis if
higher than 0,6. Also the Bartlett’s Test has to be significant (p<0,05) to reject the null
hypothesis about the absence of correlation between items.
• Cumulative percent of variance explained - should be higher than 0,5-0,6 to indicate
the internal consistency of the factor.
• Communalities - the extent to which an item correlates with all other items. Higher
communalities are better, the usual threshold is 0,5. If communalities for a particular
variable are low (between 0.0-0.4), then that variable may struggle to load significantly
on any factor.
• Factor loadings - should be higher than 0,5 to prove convergent validity for EFA. Cross-
loadings (when one variable is loading on two factors) also should be detected. If
36
difference between factor loadings for variable is lower than 0,1, it can be nominated
for deletion from model. It is also an indicator of violation of discriminant validity.
For the first group of variables aggregate EFA presented good results with KMO equal to
0,871 (p<0,05), communalities more than 0,6 (except for price_3 item = 0,509) and factor loadings
higher than 0,5. Overall, 4 factors were extracted instead of 5 predetermined – delivery and product
quality items were loaded on one factor. The cumulative percent of variance explained amount for
67%. However, for the purposes of the research it is not preferable to combine variables, so
individual EFA should be conducted for delivery and product quality to ensure the possibility to
divide them in two different factors. Besides, one item (delivery_4) showed a minor cross-loading
between price and delivery factors, so the final structure of constructs has to be reviewed. After
running separate EFAs for each variable and relocation of two items for other factors (delivery_4
to price value and delivery_5 to product quality), the desired structure was achieved (resulting in
5 factors) and all reliability and validity requirements were met (see appendix 3). It was meaningful
to relocate 2 delivery items to other factors, since one of them is connected with the price of
delivery (so it logically corresponds to the general price value of the service) and the second
corresponds to the carefulness of delivery in terms of saving good product quality.
For the second group of variables, involving elements of perceived website (app) quality,
aggregate EFA was also good, but it detected some possible problems. KMO for the model was
0,895 (p<0,05), factor loadings were mostly higher than 0,5, however, there appeared problems
with communalities of the 3 items that was a sign to nominate them for a deletion from the model
or restructuring final variables. The cumulative percent of variance explained amount for 63%,
however, again only 4 instead of 5 factors were extracted and their structure hardly represented
the initial scales. Thus, again individual EFAs for every factor had to be conducted. Eventually,
the appropriate structure of factors was obtained (6 final constructs) and all reliability and validity
requirements were met (see appendix 3). The perceived content quality variable was divided into
two factors which were named «perceived completeness and usefulness of product information»
and «perceived usefulness of additional content», relying on the meaning of items included. One
item (navigation_5) from perceived navigability variable was decided to be deleted, since it
showed low loading and communality and weakened the reliability of the whole construct.
Regarding the validity and reliability of customer satisfaction and ease of use variables, no
problems were detected, their item structures were saved in its original form (see appendix 3). In
its turn, COVID-19 related variable was the most difficult to form properly. Initially, EFA showed
not best results in terms of reliability (involving problems with communalities for some items) and
offered to create 2 factors: one including covid_1,2,3,6 items and another including covid_4 and
37
5 items. After conducting proper analysis, it was decided to keep only 3 items (covid_1,2 and 6)
and rename the final factor as «COVID-19 anxiety». It consists of the fear of getting the virus, the
desire to stay at home and perceived level of anxiety and stress associated with the pandemic. The
second possible factor indicated too low reliability measures, so it was eliminated.
After performing exploratory factor analysis, as we have a clearer view on the factor
structure, measurement model should be also tested using confirmatory factor analysis (CFA). In
this type of statistical investigation, the following indicators have to be measured and evaluated:
• Critical ratios (C.R.) - when higher than 1,96 for variables confirm unidimensionality
of the constructs which is a good sign for a model, proving the convergent validity.
• Standardized regression weights (SRW) - should be higher than 0,5. It also contributes
to confirming unidimensionality and to proving convergent validity.
• Average Variance Extracted (AVE) - should be higher than 0,5 for latent variables
(contribute to proving convergent validity) and it also should be higher than squared
correlations between constructs to meet (fulfill) Fornell-Lacker criterion of
discriminant validity. If it is met, it means that latent variables account for more
variance in their associated indicator variables than it shares with other constructs in
the same model.
• Composite reliability (CR) - should be higher than 0,7, confirming reliability, implying
that items have shared high covariances and measure same underlying concepts.
• Face validity also should be measured. It implies that factors should make sense
regarding the logic of the research topic and model.
• Modification indexes (MI) for errors covariance - should not exceed 9. If there are
higher values for MI between errors of variables in one construct it can mean that there
is external factors influencing both of them. If there are higher values of MI between
error and construct this can show cross-loading of factors.
Face validity of the constructs can be claimed right away, since all latent variables are
meaningful and proved to be applicable for the analysis by previous researches. Moreover, critical
ratios were above the threshold for all items. Some higher than acceptable modification indexes
were found, but they were fixed by adding covariances between problematic errors. The final
indicators for constructs appeared to be pretty high (see appendix 4), confirming validity and
reliability of the measurement model. The most problematic latent variable is newly created
«Perceived usefulness of additional content». Its AVE is significantly lower than 0,5 (0,4) and
composite reliability slightly lower than the 0,7 threshold (0,67). Even though it is not very good
condition for future analysis and it is a sign to remove the latent variable from the model, it was
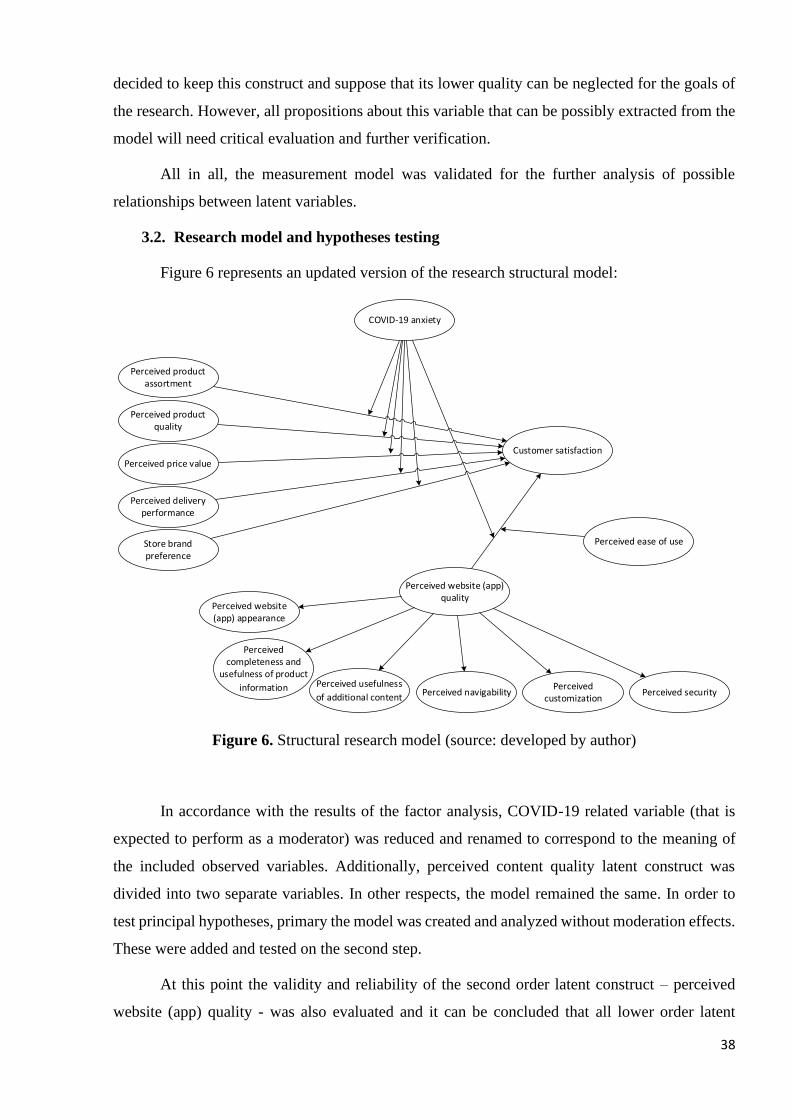
38
decided to keep this construct and suppose that its lower quality can be neglected for the goals of
the research. However, all propositions about this variable that can be possibly extracted from the
model will need critical evaluation and further verification.
All in all, the measurement model was validated for the further analysis of possible
relationships between latent variables.
3.2. Research model and hypotheses testing
Figure 6 represents an updated version of the research structural model:
Perceived website (app) quality
Customer satisfaction
COVID-19 anxiety
Perceived ease of use
Perceived product assortment
Perceived product quality
Perceived price value
Perceived delivery performance
Store brand preference
Perceived website (app) appearance
Perceived completeness and
usefulness of product
information Perceived navigabilityPerceived
customizationPerceived security
Perceived usefulness
of additional content
Figure 6. Structural research model (source: developed by author)
In accordance with the results of the factor analysis, COVID-19 related variable (that is
expected to perform as a moderator) was reduced and renamed to correspond to the meaning of
the included observed variables. Additionally, perceived content quality latent construct was
divided into two separate variables. In other respects, the model remained the same. In order to
test principal hypotheses, primary the model was created and analyzed without moderation effects.
These were added and tested on the second step.
At this point the validity and reliability of the second order latent construct – perceived
website (app) quality - was also evaluated and it can be concluded that all lower order latent
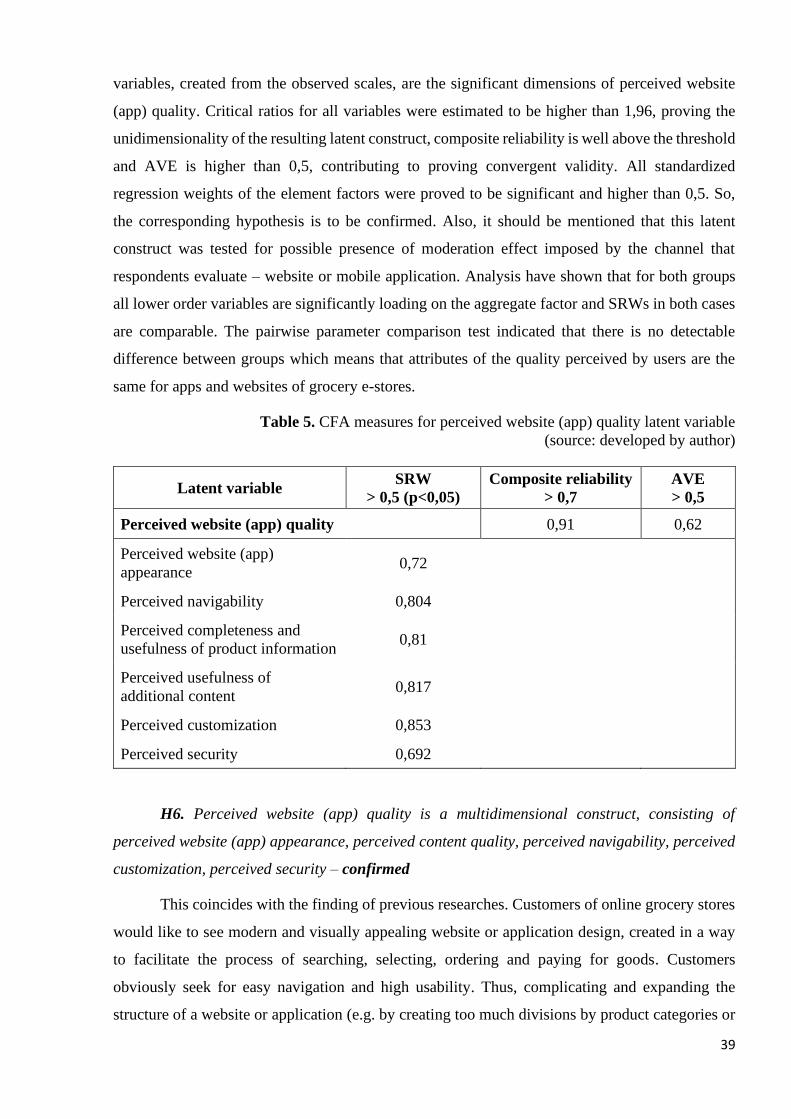
39
variables, created from the observed scales, are the significant dimensions of perceived website
(app) quality. Critical ratios for all variables were estimated to be higher than 1,96, proving the
unidimensionality of the resulting latent construct, composite reliability is well above the threshold
and AVE is higher than 0,5, contributing to proving convergent validity. All standardized
regression weights of the element factors were proved to be significant and higher than 0,5. So,
the corresponding hypothesis is to be confirmed. Also, it should be mentioned that this latent
construct was tested for possible presence of moderation effect imposed by the channel that
respondents evaluate – website or mobile application. Analysis have shown that for both groups
all lower order variables are significantly loading on the aggregate factor and SRWs in both cases
are comparable. The pairwise parameter comparison test indicated that there is no detectable
difference between groups which means that attributes of the quality perceived by users are the
same for apps and websites of grocery e-stores.
Table 5. CFA measures for perceived website (app) quality latent variable
(source: developed by author)
Latent variable SRW
> 0,5 (p<0,05)
Composite reliability
> 0,7
AVE
> 0,5
Perceived website (app) quality 0,91 0,62
Perceived website (app)
appearance 0,72
Perceived navigability 0,804
Perceived completeness and
usefulness of product information 0,81
Perceived usefulness of
additional content 0,817
Perceived customization 0,853
Perceived security 0,692
H6. Perceived website (app) quality is a multidimensional construct, consisting of
perceived website (app) appearance, perceived content quality, perceived navigability, perceived
customization, perceived security – confirmed
This coincides with the finding of previous researches. Customers of online grocery stores
would like to see modern and visually appealing website or application design, created in a way
to facilitate the process of searching, selecting, ordering and paying for goods. Customers
obviously seek for easy navigation and high usability. Thus, complicating and expanding the
structure of a website or application (e.g. by creating too much divisions by product categories or
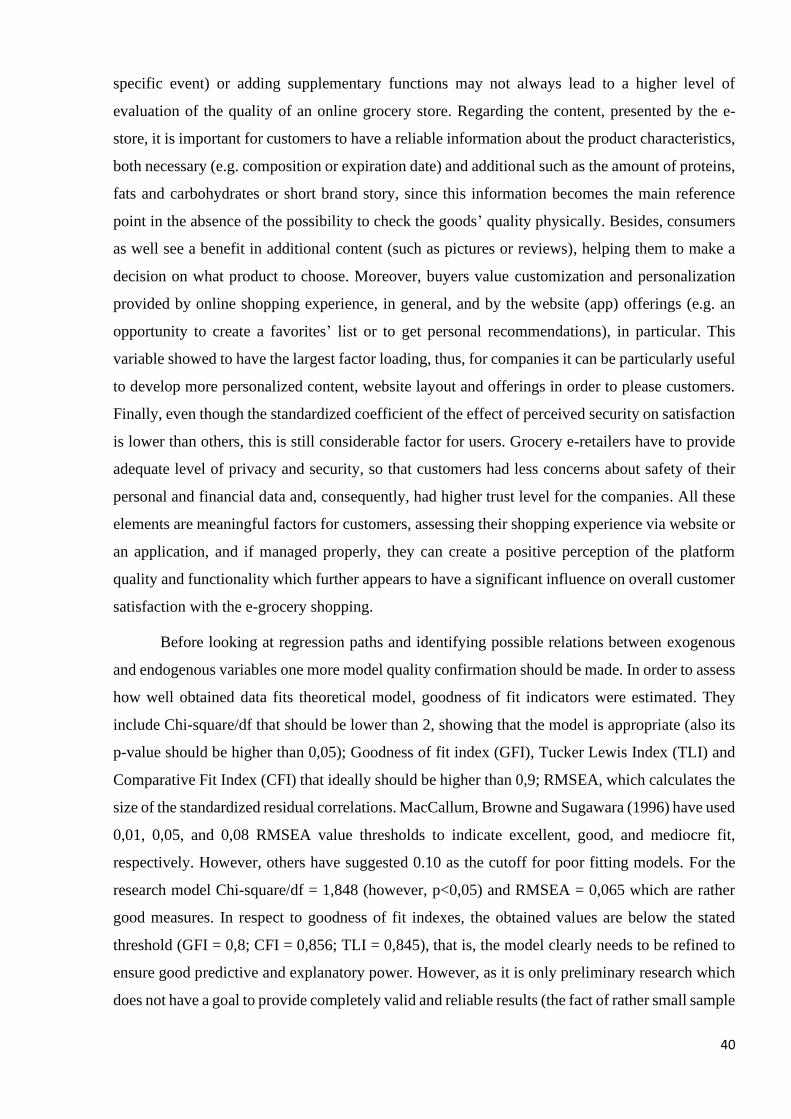
40
specific event) or adding supplementary functions may not always lead to a higher level of
evaluation of the quality of an online grocery store. Regarding the content, presented by the e-
store, it is important for customers to have a reliable information about the product characteristics,
both necessary (e.g. composition or expiration date) and additional such as the amount of proteins,
fats and carbohydrates or short brand story, since this information becomes the main reference
point in the absence of the possibility to check the goods’ quality physically. Besides, consumers
as well see a benefit in additional content (such as pictures or reviews), helping them to make a
decision on what product to choose. Moreover, buyers value customization and personalization
provided by online shopping experience, in general, and by the website (app) offerings (e.g. an
opportunity to create a favorites’ list or to get personal recommendations), in particular. This
variable showed to have the largest factor loading, thus, for companies it can be particularly useful
to develop more personalized content, website layout and offerings in order to please customers.
Finally, even though the standardized coefficient of the effect of perceived security on satisfaction
is lower than others, this is still considerable factor for users. Grocery e-retailers have to provide
adequate level of privacy and security, so that customers had less concerns about safety of their
personal and financial data and, consequently, had higher trust level for the companies. All these
elements are meaningful factors for customers, assessing their shopping experience via website or
an application, and if managed properly, they can create a positive perception of the platform
quality and functionality which further appears to have a significant influence on overall customer
satisfaction with the e-grocery shopping.
Before looking at regression paths and identifying possible relations between exogenous
and endogenous variables one more model quality confirmation should be made. In order to assess
how well obtained data fits theoretical model, goodness of fit indicators were estimated. They
include Chi-square/df that should be lower than 2, showing that the model is appropriate (also its
p-value should be higher than 0,05); Goodness of fit index (GFI), Tucker Lewis Index (TLI) and
Comparative Fit Index (CFI) that ideally should be higher than 0,9; RMSEA, which calculates the
size of the standardized residual correlations. MacCallum, Browne and Sugawara (1996) have used
0,01, 0,05, and 0,08 RMSEA value thresholds to indicate excellent, good, and mediocre fit,
respectively. However, others have suggested 0.10 as the cutoff for poor fitting models. For the
research model Chi-square/df = 1,848 (however, p<0,05) and RMSEA = 0,065 which are rather
good measures. In respect to goodness of fit indexes, the obtained values are below the stated
threshold (GFI = 0,8; CFI = 0,856; TLI = 0,845), that is, the model clearly needs to be refined to
ensure good predictive and explanatory power. However, as it is only preliminary research which
does not have a goal to provide completely valid and reliable results (the fact of rather small sample
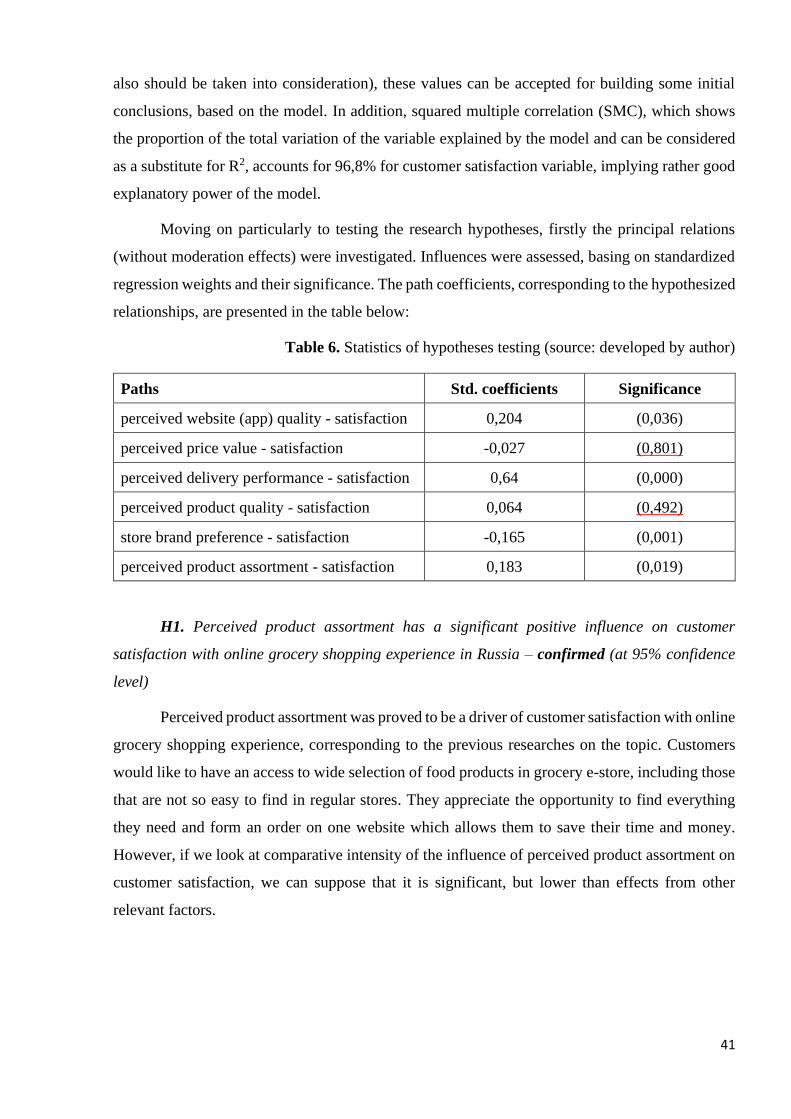
41
also should be taken into consideration), these values can be accepted for building some initial
conclusions, based on the model. In addition, squared multiple correlation (SMC), which shows
the proportion of the total variation of the variable explained by the model and can be considered
as a substitute for R2, accounts for 96,8% for customer satisfaction variable, implying rather good
explanatory power of the model.
Moving on particularly to testing the research hypotheses, firstly the principal relations
(without moderation effects) were investigated. Influences were assessed, basing on standardized
regression weights and their significance. The path coefficients, corresponding to the hypothesized
relationships, are presented in the table below:
Table 6. Statistics of hypotheses testing (source: developed by author)
Paths Std. coefficients Significance
perceived website (app) quality - satisfaction 0,204 (0,036)
perceived price value - satisfaction -0,027 (0,801)
perceived delivery performance - satisfaction 0,64 (0,000)
perceived product quality - satisfaction 0,064 (0,492)
store brand preference - satisfaction -0,165 (0,001)
perceived product assortment - satisfaction 0,183 (0,019)
H1. Perceived product assortment has a significant positive influence on customer
satisfaction with online grocery shopping experience in Russia – confirmed (at 95% confidence
level)
Perceived product assortment was proved to be a driver of customer satisfaction with online
grocery shopping experience, corresponding to the previous researches on the topic. Customers
would like to have an access to wide selection of food products in grocery e-store, including those
that are not so easy to find in regular stores. They appreciate the opportunity to find everything
they need and form an order on one website which allows them to save their time and money.
However, if we look at comparative intensity of the influence of perceived product assortment on
customer satisfaction, we can suppose that it is significant, but lower than effects from other
relevant factors.
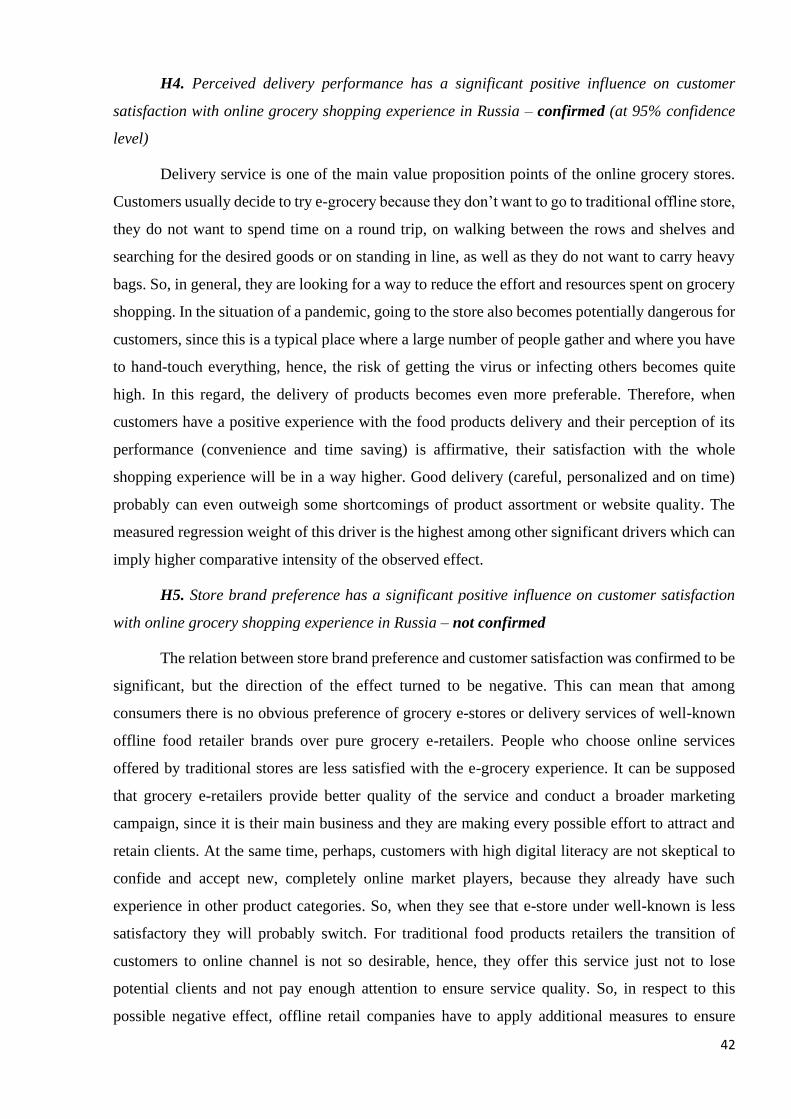
42
H4. Perceived delivery performance has a significant positive influence on customer
satisfaction with online grocery shopping experience in Russia – confirmed (at 95% confidence
level)
Delivery service is one of the main value proposition points of the online grocery stores.
Customers usually decide to try e-grocery because they don’t want to go to traditional offline store,
they do not want to spend time on a round trip, on walking between the rows and shelves and
searching for the desired goods or on standing in line, as well as they do not want to carry heavy
bags. So, in general, they are looking for a way to reduce the effort and resources spent on grocery
shopping. In the situation of a pandemic, going to the store also becomes potentially dangerous for
customers, since this is a typical place where a large number of people gather and where you have
to hand-touch everything, hence, the risk of getting the virus or infecting others becomes quite
high. In this regard, the delivery of products becomes even more preferable. Therefore, when
customers have a positive experience with the food products delivery and their perception of its
performance (convenience and time saving) is affirmative, their satisfaction with the whole
shopping experience will be in a way higher. Good delivery (careful, personalized and on time)
probably can even outweigh some shortcomings of product assortment or website quality. The
measured regression weight of this driver is the highest among other significant drivers which can
imply higher comparative intensity of the observed effect.
H5. Store brand preference has a significant positive influence on customer satisfaction
with online grocery shopping experience in Russia – not confirmed
The relation between store brand preference and customer satisfaction was confirmed to be
significant, but the direction of the effect turned to be negative. This can mean that among
consumers there is no obvious preference of grocery e-stores or delivery services of well-known
offline food retailer brands over pure grocery e-retailers. People who choose online services
offered by traditional stores are less satisfied with the e-grocery experience. It can be supposed
that grocery e-retailers provide better quality of the service and conduct a broader marketing
campaign, since it is their main business and they are making every possible effort to attract and
retain clients. At the same time, perhaps, customers with high digital literacy are not skeptical to
confide and accept new, completely online market players, because they already have such
experience in other product categories. So, when they see that e-store under well-known is less
satisfactory they will probably switch. For traditional food products retailers the transition of
customers to online channel is not so desirable, hence, they offer this service just not to lose
potential clients and not pay enough attention to ensure service quality. So, in respect to this
possible negative effect, offline retail companies have to apply additional measures to ensure
43
customer satisfaction with online shopping experience, for example, by further improving the
performance of the drivers reviewed in work or by actively introducing online channel for existing
customers, in this way utilizing the benefit of brand trust and loyalty.
H7. Perceived website (app) quality has a significant positive influence on customer
satisfaction with online grocery shopping experience in Russia – confirmed (at 95% confidence
level)
Coinciding with the previously conducted researches, the proposed model show that the
better users assess website functionality or, in conditions of the present research, perceived website
(application) quality with all its internal elements, the higher is their satisfaction with the online
grocery shopping experience. As it was previously said, the website or app is the only channel
through which customers communicate and interact with the online store and also it is a first
critical point of evaluation of service reliability and performance. Delivery is evaluated after the
purchase is done and assessment of its performance influences the re-purchase decision, while
website is evaluated during the first acquaintance with the service. If it is inconvenient to use, has
an unattractive design or does not provide the necessary information about products, potential
consumer can refuse even to try making an order. Therefore, in addition to providing good product
(assortment, quality, price) and service (delivery and customer support) performance, it is
necessary for e-grocery stores to ensure high website (app) quality, taking into consideration all
elements indicated in the model.
H2. Perceived product quality has a significant positive influence on customer satisfaction
with online grocery shopping experience in Russia - rejected
H3. Perceived price value has a significant positive influence on customer satisfaction with
online grocery shopping experience in Russia - rejected
The influence of perceived price value and perceived product quality on customer
satisfaction was not confirmed for the current research model. Effects were estimated to be
insignificant. However, it doesn’t mean that these factors are totally out of customers attention.
Such results could be obtained due to many reasons that require further study. We can only make
some assumptions. For instance, regarding price value, probably its influence turned out to be
negligible because when people turn to online grocery shopping, they don’t expect to save money.
Their primary request is convenience and reduction of efforts, so most of them are not comparing
prices or special offers (discounts) in digital and traditional stores intentionally and possible
savings go unnoticed, without affecting overall satisfaction with the service. As for perceived
product quality, it can be supposed that customers who already use food product delivery services
44
have managed to make sure that when ordering online (in a particular store) they will receive
exactly the same product and in the same quality as in a regular store. Besides, the reason for the
effect insignificance may lie in the category of products that people more frequently buy online.
If it is, for example, not fresh vegetables or fruits or not fragile products (such as eggs), it is quite
difficult to spoil them. Perhaps they perceive companies’ performance in this area as consistently
good. Consequently, the satisfaction with the service depends more on other factors in which
possible problems are more expected to arise. In any case, it seems hardly possible that customer
satisfaction will not be negatively affected if they receive stale or damaged product. Many previous
studies have indicated that perceived product performance risk can be a significant inhibitor for
adopting e-grocery and for re-purchase intention (Yu et al., 2012; Tandon et al., 2018). Therefore,
additional research taking into account possible effects' moderators and situational variables are
needed to obtain a better understanding of the influence imposed by this factor.
Moderation effects
After testing the hypotheses on general effects imposed by the observed drivers on
customer satisfaction, situational factor, referring to anxiety that customers experience due to
COVID-19 pandemic, and perceived e-grocery service usability (or ease of use) factor were added
to the model as moderators. The first was tested for interaction with effects of all other independent
latent variables on the dependent one, while second was applied only to the relation between
perceived website (app) quality and satisfaction.
The goodness of fit indicators of the model, containing moderation, turned out to be highly
satisfactory. Chi-square/df measure was estimated to be much lower than 2 (0,558) with the p-
value being higher than 0,05 (0,572) that allow to confirm the null hypothesis and verify
appropriateness of the model. GFI, CFI and TLI indicators all are higher than 0,95 and RMSEA
value is lower than 0,05 (p>0,05). In addition, squared multiple correlation (similar to R2 meaning)
for dependent variable accounts for 80,7%. All these imply that this model has good explanatory
power and is reliable.
Starting with the newly added variables, the statistical analysis has shown that there is no
significant direct influence of COVID-19 anxiety on customer satisfaction with online grocery
shopping experience. In contrast, ease of use was confirmed to influence customer satisfaction.
However, some significant interaction effects were detected for both moderators. COVID-19
moderated the effects of perceived price value, perceived delivery performance, perceived
assortment and perceived website (app) quality on satisfaction. Further each confirmed hypothesis
will be considered in more details.
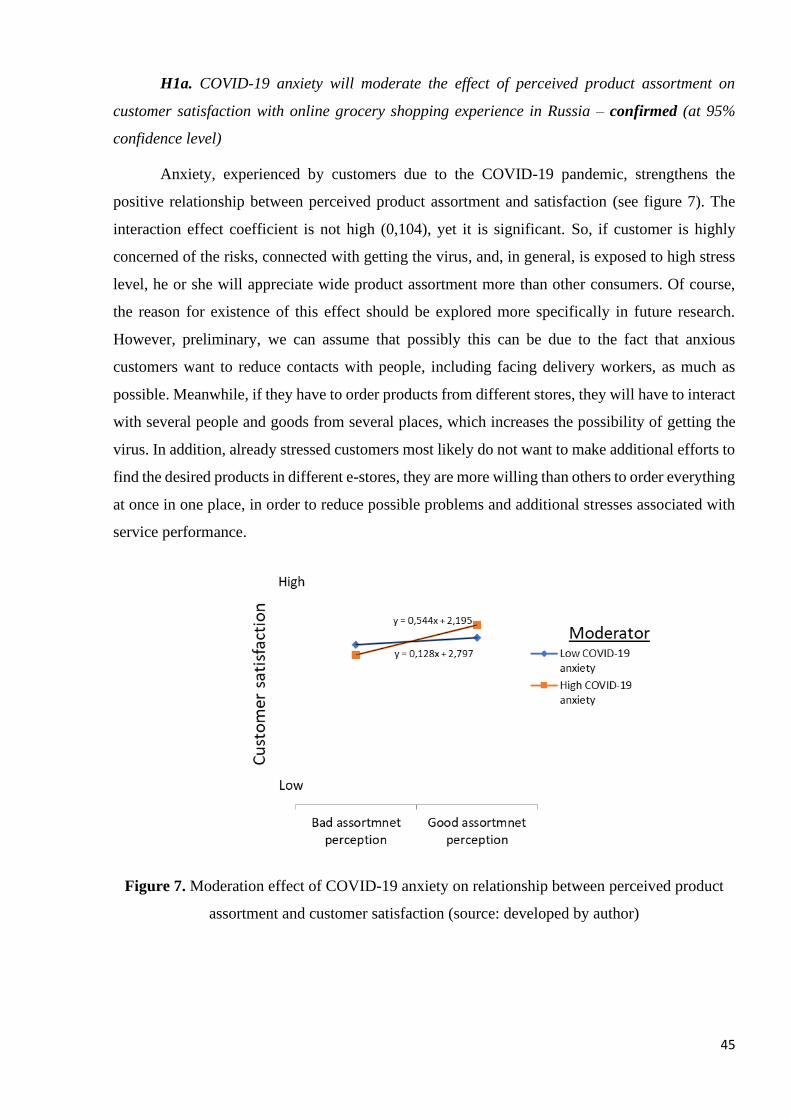
45
H1a. COVID-19 anxiety will moderate the effect of perceived product assortment on
customer satisfaction with online grocery shopping experience in Russia – confirmed (at 95%
confidence level)
Anxiety, experienced by customers due to the COVID-19 pandemic, strengthens the
positive relationship between perceived product assortment and satisfaction (see figure 7). The
interaction effect coefficient is not high (0,104), yet it is significant. So, if customer is highly
concerned of the risks, connected with getting the virus, and, in general, is exposed to high stress
level, he or she will appreciate wide product assortment more than other consumers. Of course,
the reason for existence of this effect should be explored more specifically in future research.
However, preliminary, we can assume that possibly this can be due to the fact that anxious
customers want to reduce contacts with people, including facing delivery workers, as much as
possible. Meanwhile, if they have to order products from different stores, they will have to interact
with several people and goods from several places, which increases the possibility of getting the
virus. In addition, already stressed customers most likely do not want to make additional efforts to
find the desired products in different e-stores, they are more willing than others to order everything
at once in one place, in order to reduce possible problems and additional stresses associated with
service performance.
Figure 7. Moderation effect of COVID-19 anxiety on relationship between perceived product
assortment and customer satisfaction (source: developed by author)
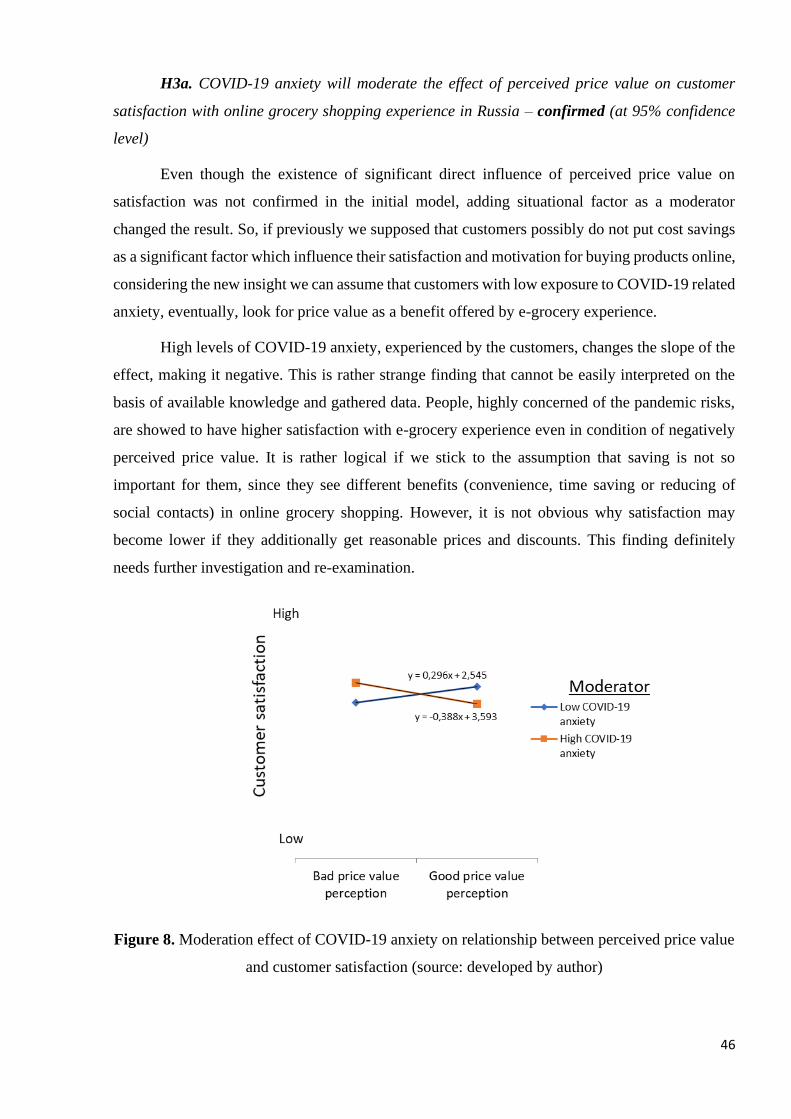
46
H3a. COVID-19 anxiety will moderate the effect of perceived price value on customer
satisfaction with online grocery shopping experience in Russia – confirmed (at 95% confidence
level)
Even though the existence of significant direct influence of perceived price value on
satisfaction was not confirmed in the initial model, adding situational factor as a moderator
changed the result. So, if previously we supposed that customers possibly do not put cost savings
as a significant factor which influence their satisfaction and motivation for buying products online,
considering the new insight we can assume that customers with low exposure to COVID-19 related
anxiety, eventually, look for price value as a benefit offered by e-grocery experience.
High levels of COVID-19 anxiety, experienced by the customers, changes the slope of the
effect, making it negative. This is rather strange finding that cannot be easily interpreted on the
basis of available knowledge and gathered data. People, highly concerned of the pandemic risks,
are showed to have higher satisfaction with e-grocery experience even in condition of negatively
perceived price value. It is rather logical if we stick to the assumption that saving is not so
important for them, since they see different benefits (convenience, time saving or reducing of
social contacts) in online grocery shopping. However, it is not obvious why satisfaction may
become lower if they additionally get reasonable prices and discounts. This finding definitely
needs further investigation and re-examination.
Figure 8. Moderation effect of COVID-19 anxiety on relationship between perceived price value
and customer satisfaction (source: developed by author)
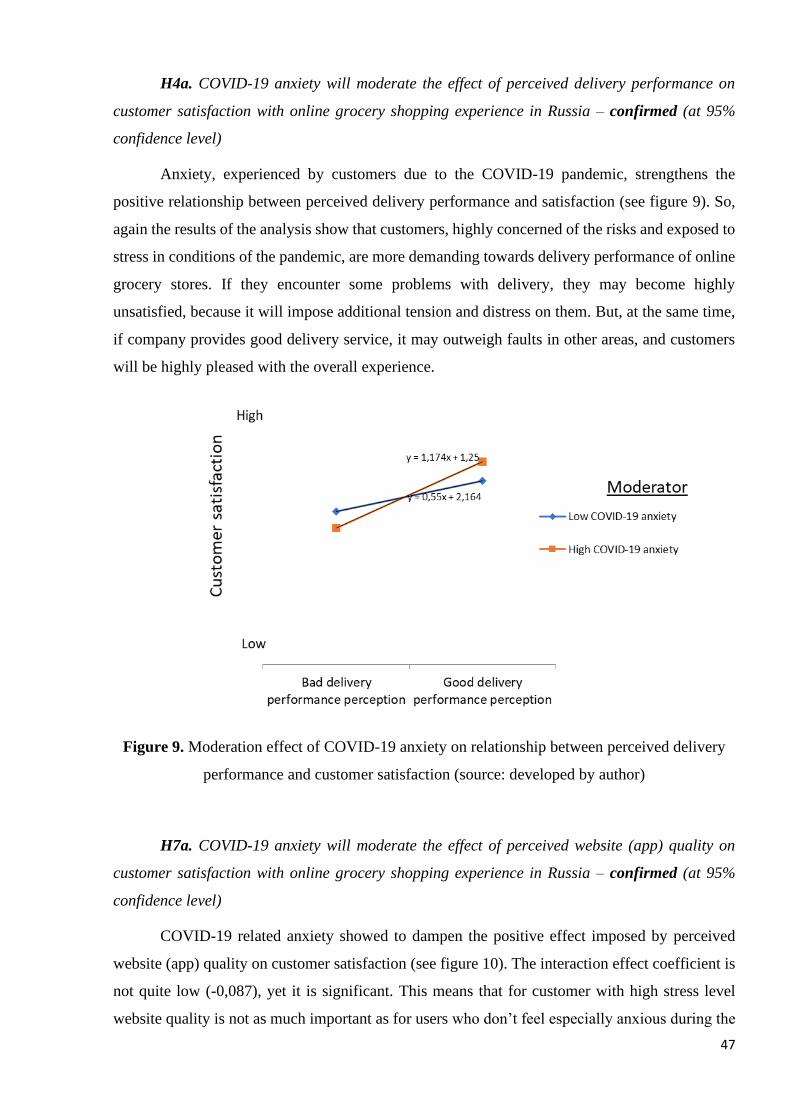
47
H4a. COVID-19 anxiety will moderate the effect of perceived delivery performance on
customer satisfaction with online grocery shopping experience in Russia – confirmed (at 95%
confidence level)
Anxiety, experienced by customers due to the COVID-19 pandemic, strengthens the
positive relationship between perceived delivery performance and satisfaction (see figure 9). So,
again the results of the analysis show that customers, highly concerned of the risks and exposed to
stress in conditions of the pandemic, are more demanding towards delivery performance of online
grocery stores. If they encounter some problems with delivery, they may become highly
unsatisfied, because it will impose additional tension and distress on them. But, at the same time,
if company provides good delivery service, it may outweigh faults in other areas, and customers
will be highly pleased with the overall experience.
Figure 9. Moderation effect of COVID-19 anxiety on relationship between perceived delivery
performance and customer satisfaction (source: developed by author)
H7a. COVID-19 anxiety will moderate the effect of perceived website (app) quality on
customer satisfaction with online grocery shopping experience in Russia – confirmed (at 95%
confidence level)
COVID-19 related anxiety showed to dampen the positive effect imposed by perceived
website (app) quality on customer satisfaction (see figure 10). The interaction effect coefficient is
not quite low (-0,087), yet it is significant. This means that for customer with high stress level
website quality is not as much important as for users who don’t feel especially anxious during the
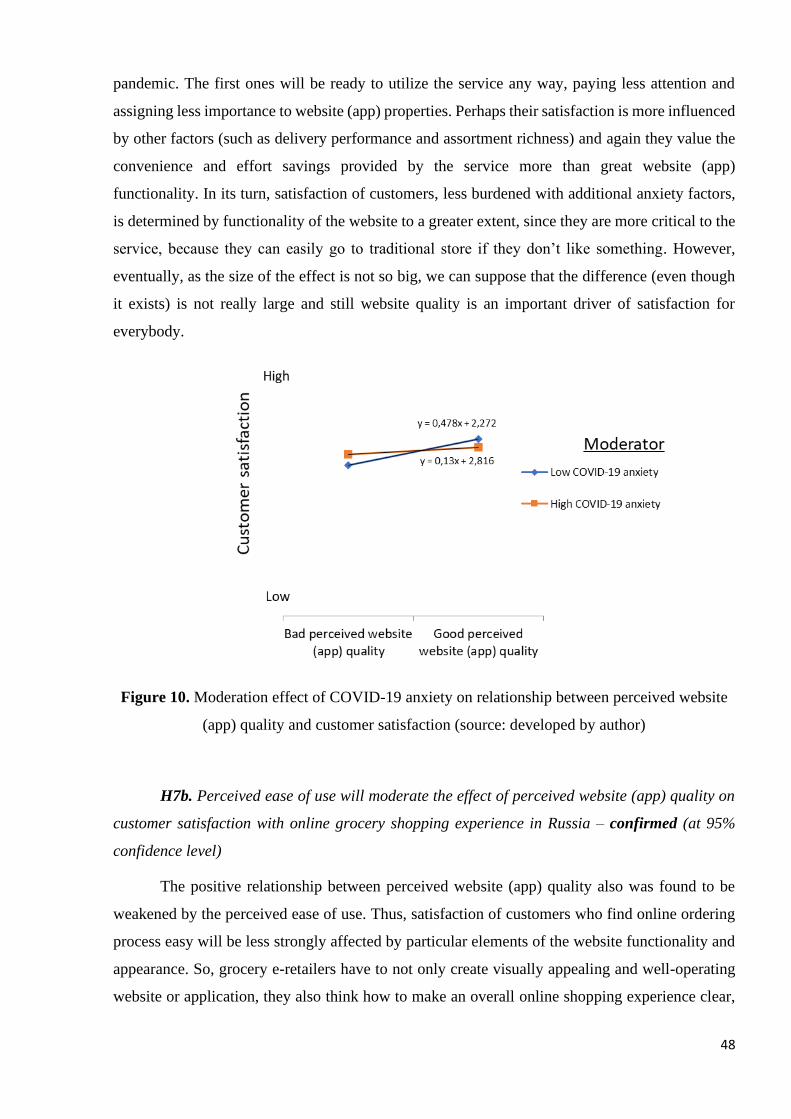
48
pandemic. The first ones will be ready to utilize the service any way, paying less attention and
assigning less importance to website (app) properties. Perhaps their satisfaction is more influenced
by other factors (such as delivery performance and assortment richness) and again they value the
convenience and effort savings provided by the service more than great website (app)
functionality. In its turn, satisfaction of customers, less burdened with additional anxiety factors,
is determined by functionality of the website to a greater extent, since they are more critical to the
service, because they can easily go to traditional store if they don’t like something. However,
eventually, as the size of the effect is not so big, we can suppose that the difference (even though
it exists) is not really large and still website quality is an important driver of satisfaction for
everybody.
Figure 10. Moderation effect of COVID-19 anxiety on relationship between perceived website
(app) quality and customer satisfaction (source: developed by author)
H7b. Perceived ease of use will moderate the effect of perceived website (app) quality on
customer satisfaction with online grocery shopping experience in Russia – confirmed (at 95%
confidence level)
The positive relationship between perceived website (app) quality also was found to be
weakened by the perceived ease of use. Thus, satisfaction of customers who find online ordering
process easy will be less strongly affected by particular elements of the website functionality and
appearance. So, grocery e-retailers have to not only create visually appealing and well-operating
website or application, they also think how to make an overall online shopping experience clear,
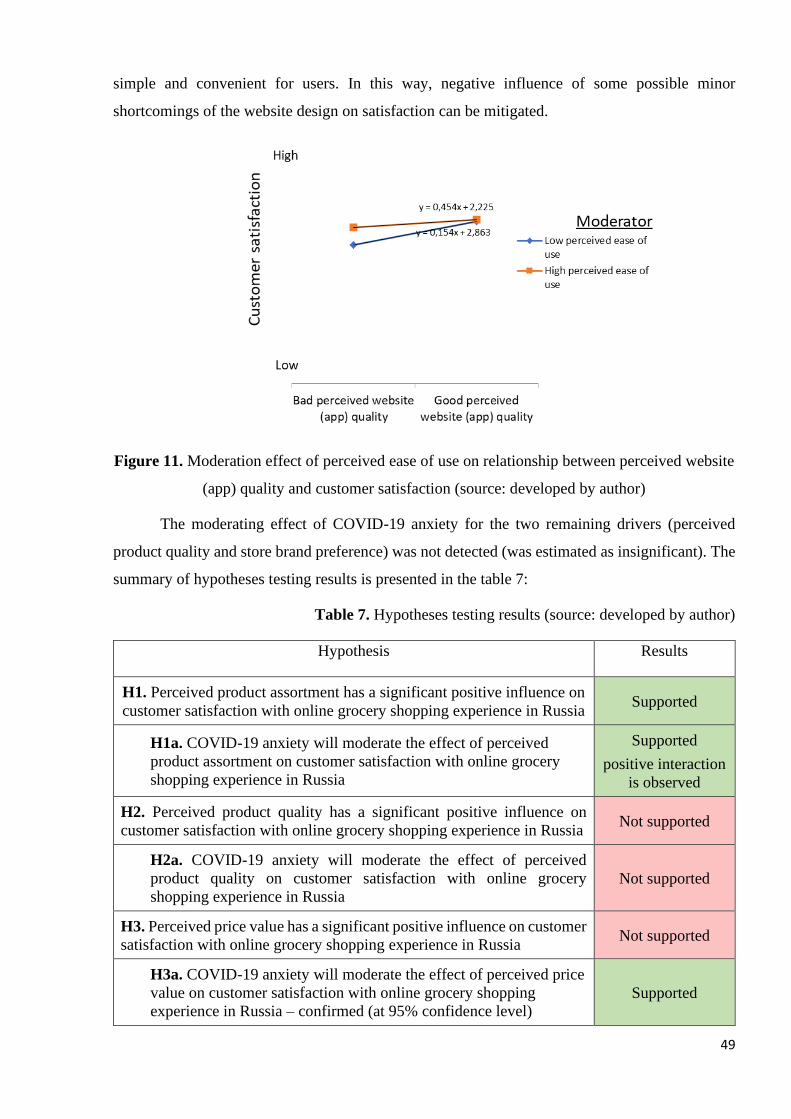
49
simple and convenient for users. In this way, negative influence of some possible minor
shortcomings of the website design on satisfaction can be mitigated.
Figure 11. Moderation effect of perceived ease of use on relationship between perceived website
(app) quality and customer satisfaction (source: developed by author)
The moderating effect of COVID-19 anxiety for the two remaining drivers (perceived
product quality and store brand preference) was not detected (was estimated as insignificant). The
summary of hypotheses testing results is presented in the table 7:
Table 7. Hypotheses testing results (source: developed by author)
Hypothesis Results
H1. Perceived product assortment has a significant positive influence on
customer satisfaction with online grocery shopping experience in Russia Supported
H1a. COVID-19 anxiety will moderate the effect of perceived
product assortment on customer satisfaction with online grocery
shopping experience in Russia
Supported
positive interaction
is observed
H2. Perceived product quality has a significant positive influence on
customer satisfaction with online grocery shopping experience in Russia Not supported
H2a. COVID-19 anxiety will moderate the effect of perceived
product quality on customer satisfaction with online grocery
shopping experience in Russia
Not supported
H3. Perceived price value has a significant positive influence on customer
satisfaction with online grocery shopping experience in Russia Not supported
H3a. COVID-19 anxiety will moderate the effect of perceived price
value on customer satisfaction with online grocery shopping
experience in Russia – confirmed (at 95% confidence level)
Supported
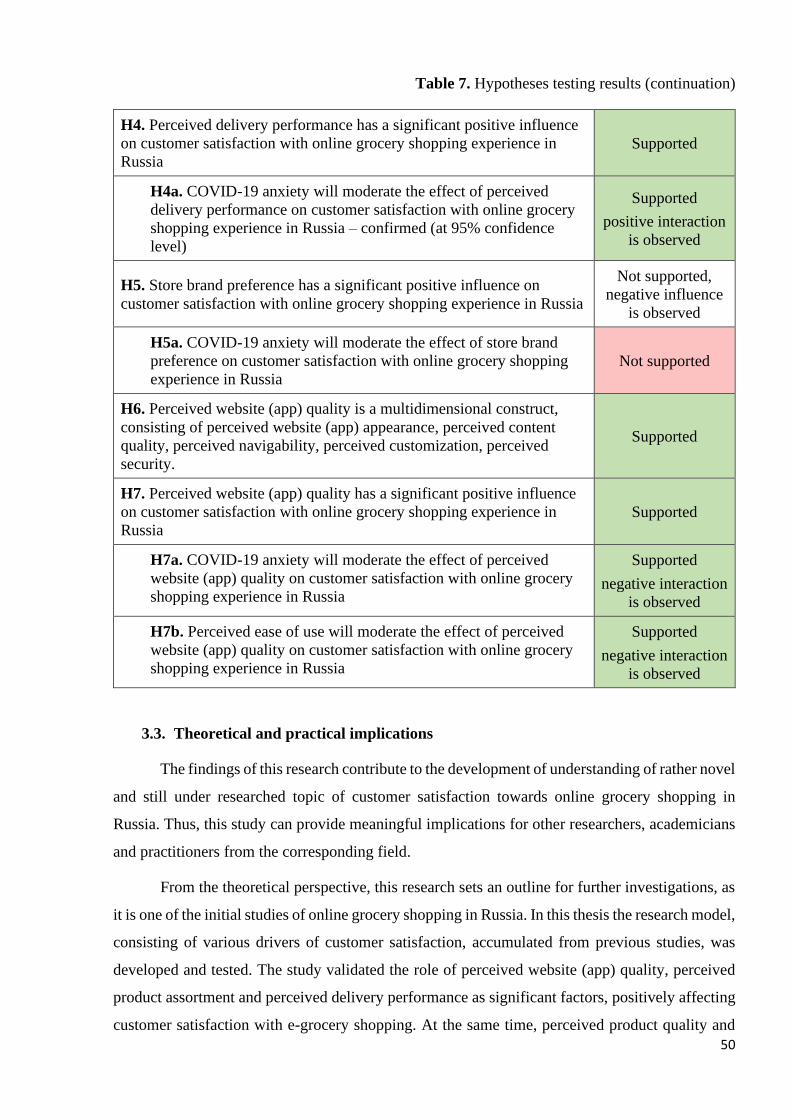
50
Table 7. Hypotheses testing results (continuation)
H4. Perceived delivery performance has a significant positive influence
on customer satisfaction with online grocery shopping experience in
Russia
Supported
H4a. COVID-19 anxiety will moderate the effect of perceived
delivery performance on customer satisfaction with online grocery
shopping experience in Russia – confirmed (at 95% confidence
level)
Supported
positive interaction
is observed
H5. Store brand preference has a significant positive influence on
customer satisfaction with online grocery shopping experience in Russia
Not supported,
negative influence
is observed
H5a. COVID-19 anxiety will moderate the effect of store brand
preference on customer satisfaction with online grocery shopping
experience in Russia
Not supported
H6. Perceived website (app) quality is a multidimensional construct,
consisting of perceived website (app) appearance, perceived content
quality, perceived navigability, perceived customization, perceived
security.
Supported
H7. Perceived website (app) quality has a significant positive influence
on customer satisfaction with online grocery shopping experience in
Russia
Supported
H7a. COVID-19 anxiety will moderate the effect of perceived
website (app) quality on customer satisfaction with online grocery
shopping experience in Russia
Supported
negative interaction
is observed
H7b. Perceived ease of use will moderate the effect of perceived
website (app) quality on customer satisfaction with online grocery
shopping experience in Russia
Supported
negative interaction
is observed
3.3. Theoretical and practical implications
The findings of this research contribute to the development of understanding of rather novel
and still under researched topic of customer satisfaction towards online grocery shopping in
Russia. Thus, this study can provide meaningful implications for other researchers, academicians
and practitioners from the corresponding field.
From the theoretical perspective, this research sets an outline for further investigations, as
it is one of the initial studies of online grocery shopping in Russia. In this thesis the research model,
consisting of various drivers of customer satisfaction, accumulated from previous studies, was
developed and tested. The study validated the role of perceived website (app) quality, perceived
product assortment and perceived delivery performance as significant factors, positively affecting
customer satisfaction with e-grocery shopping. At the same time, perceived product quality and
51
perceived price value that were demonstrated by other studies to also have direct influence on
satisfaction, in this particular model appeared to be insignificant. Store brand preference - a
variable which was proposed by author as an additional dimension of customer satisfaction and
was not previously added in reviewed models - was found to negatively affect satisfaction. It
supposes to mean that customers don’t perceive e-stores of well-known offline retailers as more
preferable in comparison to pure e-retailer services just because of their brand name.
Besides, in this research the elements of perceived grocery e-store website or application
quality were examined, including perceived appearance, navigability, content quality (which was
divided into to variables - perceived completeness and usefulness of product information and
perceived usefulness of additional content), customization and security. All these components
have been already tested together or separately by various researchers and they have been claimed
to be parameters forming customer perception of the website. The current research confirmed this
finding as well – all factors were significantly loaded on the higher order construct of perceived
website quality with relatively large standardized coefficients (> 0,7), indicating high general
importance of all components. However, it is difficult to estimate the relative importance of each
element in building positive website perception, this is a point for further investigation. Moreover,
it should be mentioned that studies usually focus particularly on website properties and not talk
much about applicability of the results towards mobile applications that nowadays are very
popular, including on the e-grocery market. This research has shown that both website and mobile
application users consider all introduced variables while making orders in online stores, but again
their relative importance for different platforms is only to be explored in future researches.
In addition to the perceived website quality, ease of use factor was incorporated in the
research model. It involves the perception of the simplicity of working with the website and
general easiness of adoption of e-grocery shopping process, and it also has been already
incorporated in many researches on the corresponding topic. This variable was considered not as
another element of the website quality, rather as a moderator of the relationship between the
respective driver and customer satisfaction. Basing on the results of the statistical analysis, both
direct effect of the ease of use and moderation on the influence of perceived website quality on
satisfaction were found out to exist. Herewith, the interaction turned to be negative.
Withal, the COVID-19 context was taken into consideration and was added as a situational
variable, expected to moderate the effects imposed by drivers on customer satisfaction. It was done
since currently the pandemic significantly affects all spheres of customers’ life and it has changed
a great number of purchasing behavior patterns. In addition, online grocery in Russia experienced
a dramatic expansion during the last 2 years, in large part owing to COVID-19 coming. In the
52
research an attempt was made to create a scale for COVID-19 related variable that was intended
to assess the major issues, encountered by customers during the pandemic. From 6 initial questions,
formulated by author, relying on recent consumer behavior investigations and public opinion polls
in Russia, only 3 were showed to be enough consistent to form a meaningful variable that was
named «COVID-19 anxiety». They include the following statements: «I am concerned of getting
the virus», «I am trying to stay home as much as possible due to Covid-19 pandemic», « I have
experienced increased stress and anxiety during Covid-19 pandemic». The resulting factor was
proved to be a significant moderator for effect imposed on customer satisfaction by only four out
of six drivers, including perceived product assortment, delivery performance, price value and
website (app) quality. The positive influence of assortment and delivery performance was
strengthened by COVID-19 anxiety, while positive effect of website quality was weakened. The
direct influence of COVID-19 anxiety on customer satisfaction with online grocery shopping
experience was not detected. In respect to perceived price quality, discovered interaction is not
very obvious in terms of making any preliminary conclusions, therefore, further investigation is
needed.
So, generalizing the theoretical implications of the present study, it can be said that it has
extended an application of previous findings, obtained in researches on the topic of customer
online grocery shopping experience, to the Russian context in conditions of evolving popularity
of e-grocery services and COVID-19 pandemic. Besides, a factor of store brand preference was
introduced and proved as a new possible dimension of customer satisfaction, initializing a direction
for future research. Finally, author has made an attempt to operationalize variable, concerning
consumer life during COVID-19 pandemic, and obtained small and rather general, but still
internally consistent construct, appealing to COVID-19 related anxiety which further (after
additional testing and adjustment) can be used as a factor in various models.
In respect to the practical implications, the findings of the present study can be useful for
online grocery retailers in various ways, primarily since they can get valuable insights about factors
leading to higher satisfaction with the service which is very important in terms of attracting and
retaining customers.
Research have shown that Russian e-grocery retailers and delivery services should pay
special attention to development of the website (app) components, ensuring wide product
assortment and providing careful and on time delivery. While designing website or mobile
application layout for grocery e-store, companies have to thoroughly consider all components,
including functionality, usability, visual attractiveness, complete and useful content,
personalization and security. All of them affect customers’ perception of website quality, which
53
in its turn influences their overall satisfaction with the online shopping experience. Users
appreciate appealing and modern visual design; it is the initial point that they evaluate during the
first website (app) visit. Then, customers will try to find the information or desired products, this
process should be facilitated by convenient navigation and filtering functions. Moreover, the
necessary and supplementary information about the products, as well as additional content such as
goods’ visuals and reviews, also have to be offered in order to create reliable reference points by
means of which customers can make deliberate decisions and reduce the perceived risks associated
with the intangibility of the products. Providing more personalized shopping experience (by giving
an opportunity to create list of favorites, by offering personalized recommendations or special
discounts based on the purchase history) is likewise strengthens customer satisfaction. The final
concern is ensuring security of customers’ personal and financial information and providing safe
transaction procedures. In addition, it should be mentioned that some drawbacks in the
functionality and overall quality of the website could be possibly moderated by high usability of
the service. If website and its functions are perceived clear and easy to use, customers’ satisfaction
becomes less affected by individual components quality.
However, good website is only part of the success. The great service and wide range of
products seems to be more weighty parameters, especially during COVID-19. The primary model
has shown that delivery performance has the largest regression coefficient, which means that
probably this driver among all imposes the strongest effect on satisfaction. Customers, first of all,
seek convenience and time-saving while shopping for grocery online, so when they get their order
fast, in a convenient way, at a suitable time and place, they are more likely to continue purchasing
from e-store, even though it may have some shortcomings with the website (app). This cause-
effect relationship is now strengthened for some customers by increased anxiety due to COVID-
19 pandemic. The delivery performance and wide product assortment become even more critical
in building customer satisfaction, while website quality fades into the background. Yet companies
should not discount this driver, as soon as the situation with the coronavirus subsides and when all
market players reach the stage of maturity, providing services of comparable quality, the quality
and usability of the website can become a serious competitive advantage.
As for the perceived price value and quality of products, influence of which on customer
satisfaction was found out to be insignificant in the present research, they also cannot be
completely ignored. Even though, as it was already assumed, now customers don’t seek for price
advantage when they decide to purchase groceries online, because they are more motivated by
other benefits. It does not mean that in future with stabilization of COVID-19 situation and further
market development this won’t change. Herewith, the significant moderation effect of increased
54
anxiety on perceived price value influence to some extent confirms the likelihood of this
assumption. For customers with low COVID-19 related anxiety (compared to ones with high)
perceived price value differently (in a positive way) affects the satisfaction with e-grocery
experience.
The last, but not least point that can be considered by practitioners is the customers’
preference of either online stores of the well-known offline retailer brands (the first group) or
grocery pure e-retailers (the second group). This dimension of customer satisfaction is novel for
analysis and definitely needs additional research. However, relying on the results of this particular
study, the proposition can be made that the first group stores in Russia should not expect that
customers will trust them more or will be more likely to choose them from all the available
alternatives, just because of the brand name. If such companies treat the online store only as an
additional channel, they may eventually lose customers.
3.4. Limitations and future research directions
This study has several limitations that could be covered in future researches. First of all,
the sample collected for the analysis was acceptable, but still rather small, and the general
population, on which the research was focused, also was limited. So, in further studies extended
population can be investigated in order to obtain more generalizable and more widely applicable
results, as well as larger samples should be gathered to observe patterns more clearly and
accurately. Or, at the same time, another particular group of customers can be examined and its
difference from others, for example, older people who was excluded from this study. Besides,
another limitation of this research is not perfect model fit, which can lead to lower explanatory
power and reliability of the findings. So, additional testing is preferred.
Moreover, researches of e-grocery market both during COVID-19 and after the situation
stabilizes are needed, because it seems that COVID-19 context significantly affects customer
behavior and preferences. In this study only one specific dimension of consumer life during the
pandemic was initially addressed (perceived COVID-19 related anxiety), so it requires further
refinement itself and also influence of other possible dimensions could be detected and analyzed.
Furthermore, the present study included only some of the main factors that can affect
customer satisfaction with online grocery shopping experience, while there are many others that
can be also investigated such as perceived risks associated with online shopping, customer service
quality, perceived usefulness, social influence, entertainment value, payment method etc. (Guo et
al., 2012; Sreeram et al., 2017; Tandon et al., 2018). Besides, in this study only their general
importance was tested, so there is a gap to investigate the relative importance, in order to give an

55
advice for companies about the areas of principal concentration. Likewise, other dependent
variables can be explored which also important for companies in terms of retaining and attracting
customers. Among them there are trust, loyalty, purchase and re-purchase intention and others.
Since website functionality and its components have been proved to significantly influence
customer satisfaction, further researches may also expand in this direction. There are again the
great variety of elements of the website and to test them all it will take more than one study. In
addition, as it has been already mentioned, previous researches for the most part focused just on
website properties, while the applicability of the findings to mobile applications which, according
to statistics, e-grocery customers use more frequently was not widely discovered.
Investigation of all indicated aspects in condition of Russian realities can considerably
expand the understanding of customer attitude and behavior towards online grocery shopping that
now is gaining an increased popularity. It is highly relevant for practitioners and companies,
operating in the sphere, especially while the market is still developing.
56
CONCLUSION
In conclusion, a short review of the main parts of the present study will be made and one
more time the results of this master's thesis research will be outlined.
The purpose of the research was to investigate factors that can affect and determine
customer satisfaction with online grocery shopping in the conditions of the Russian market during
the COVID-19 pandemic. This purpose was successfully accomplished. First of all, the relevance
and practical applicability of the research were confirmed by reviewing current trends on the
Russian grocery retail market and determining the gap in available academic studies. In the process
of conducting the study, online grocery concept was explored as well as major differences between
online and offline shopping experience for customers. Relying on existing literature on the topic,
the major drivers of customer satisfaction with e-grocery shopping were discovered and the model,
involving direct effects of perceived website (application) quality, perceived product assortment,
perceived product quality, perceived price value, perceived delivery performance and store brand
preference on satisfaction, was proposed. It should be mentioned that perceived website quality
construct was designed to be a higher order latent variable and it comprised from 5 elements
initially, including website (app) appearance, content quality, navigability, customization and
security. Later, during the model testing, content component was divided into two variables –
completeness and usefulness of products’ information and usefulness of additional content.
Moreover, model was enriched by two moderator variables: perceived ease of use of e-grocery
service (moderating relationship between website quality and satisfaction) and situational factor,
related to customer life during COVID-19 pandemic (moderating all observed direct effects
imposed by factors on satisfaction). An attempt to create a scale for this variable was made by
author and, eventually, initial construct has changed its meaning and become more specific,
evaluating COVID-19 related anxiety experienced by customers.
To test the suggested model an empirical study was conducted in form of the online survey.
The general population for the research was determined, involving residents of Moscow and St.
Petersburg aged 18 to 45 years with experience in online grocery shopping. A questionnaire was
designed, based on the literature review, and answers were collected through social media and
targeted respondents’ panel. Final sample, utilized for statistical analysis, comprised of 202
respondents. Received data was prepared for future processing.
Two methods were used to conduct a statistical analysis of the data – exploratory factor
analysis (for confirming the internal consistency and reliability of considered constructs) and
structural equation modeling (for testing effects and confirming model validity and fit). Based on
57
the analysis results, 9 out of 14 hypotheses were supported. Perceived product assortment, delivery
performance and website (app) quality were found out to positively affect customer satisfaction,
while store brand preference influence was proved to be negative. COVID-19 anxiety, in its turn,
was showed to further strengthen the effect imposed by assortment and delivery performance
perception on satisfaction. The influence of website quality was weakened by both COVID-19
anxiety and perceived ease of use variables.
Relying on obtained results, several propositions and possible insights for practitioners
were discussed. Theoretical contribution of the study was also reviewed. For the most part,
research findings correspond to the results, obtained by researchers in previous studies. However,
due to specific context of the investigation and existing limitations, provided conclusions and
propositions need further exploration and verifying.
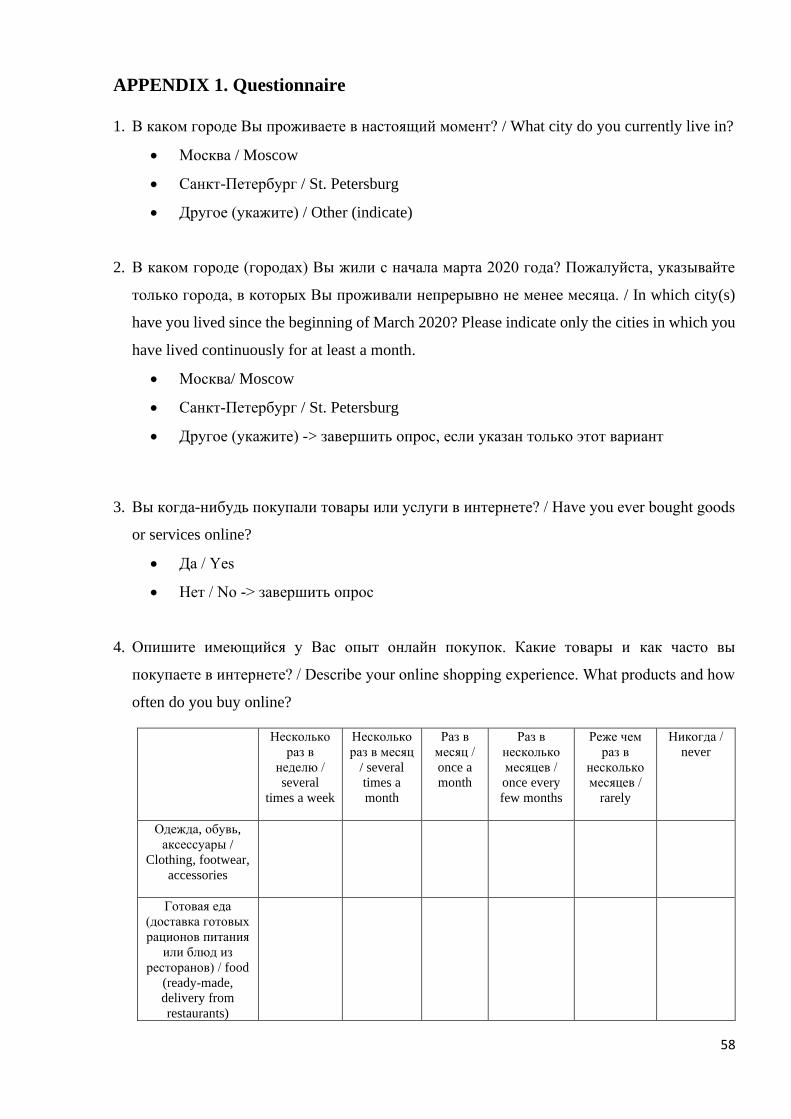
58
APPENDIX 1. Questionnaire
1. В каком городе Вы проживаете в настоящий момент? / What city do you currently live in?
• Москва / Moscow
• Санкт-Петербург / St. Petersburg
• Другое (укажите) / Other (indicate)
2. В каком городе (городах) Вы жили с начала марта 2020 года? Пожалуйста, указывайте
только города, в которых Вы проживали непрерывно не менее месяца. / In which city(s)
have you lived since the beginning of March 2020? Please indicate only the cities in which you
have lived continuously for at least a month.
• Москва/ Moscow
• Санкт-Петербург / St. Petersburg
• Другое (укажите) -> завершить опрос, если указан только этот вариант
3. Вы когда-нибудь покупали товары или услуги в интернете? / Have you ever bought goods
or services online?
• Да / Yes
• Нет / No -> завершить опрос
4. Опишите имеющийся у Вас опыт онлайн покупок. Какие товары и как часто вы
покупаете в интернете? / Describe your online shopping experience. What products and how
often do you buy online?
Несколько
раз в
неделю /
several
times a week
Несколько
раз в месяц
/ several
times a
month
Раз в
месяц /
once a
month
Раз в
несколько
месяцев /
once every
few months
Реже чем
раз в
несколько
месяцев /
rarely
Никогда /
never
Одежда, обувь,
аксессуары /
Clothing, footwear,
accessories
Готовая еда
(доставка готовых
рационов питания
или блюд из
ресторанов) / food
(ready-made,
delivery from
restaurants)
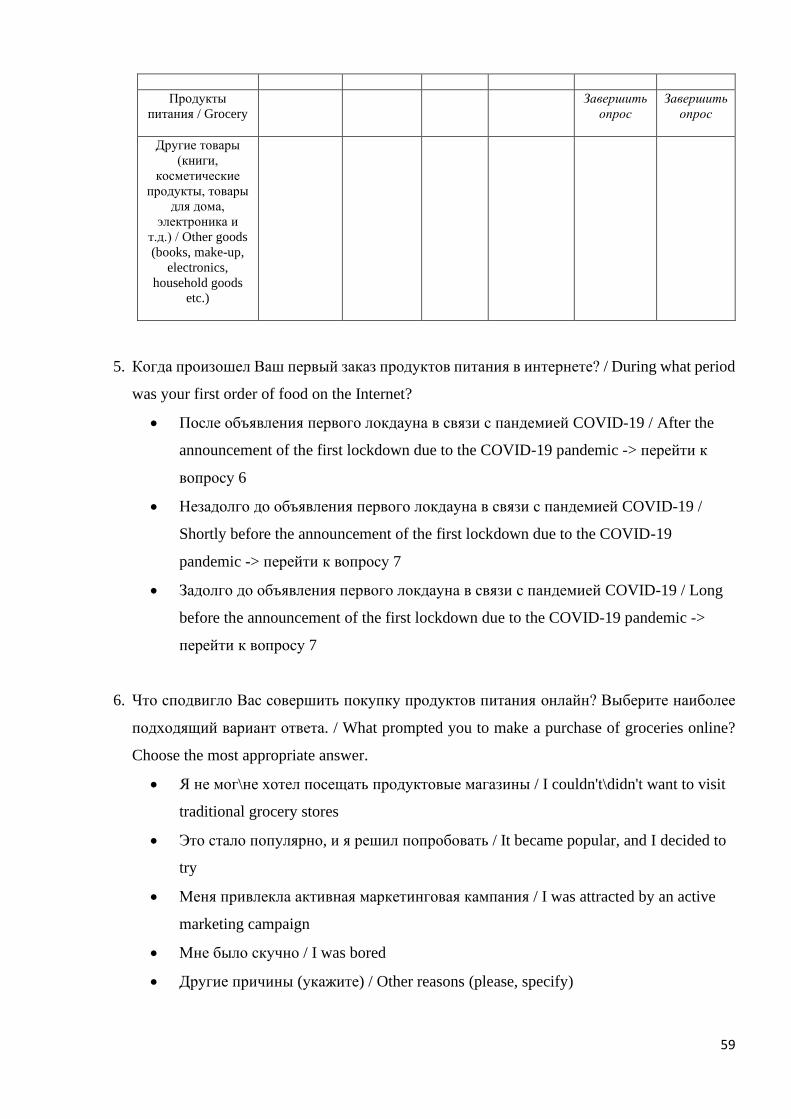
59
Продукты
питания / Grocery
Завершить
опрос
Завершить
опрос
Другие товары
(книги,
косметические
продукты, товары
для дома,
электроника и
т.д.) / Other goods
(books, make-up,
electronics,
household goods
etc.)
5. Когда произошел Ваш первый заказ продуктов питания в интернете? / During what period
was your first order of food on the Internet?
• После объявления первого локдауна в связи с пандемией COVID-19 / After the
announcement of the first lockdown due to the COVID-19 pandemic -> перейти к
вопросу 6
• Незадолго до объявления первого локдауна в связи с пандемией COVID-19 /
Shortly before the announcement of the first lockdown due to the COVID-19
pandemic -> перейти к вопросу 7
• Задолго до объявления первого локдауна в связи с пандемией COVID-19 / Long
before the announcement of the first lockdown due to the COVID-19 pandemic ->
перейти к вопросу 7
6. Что сподвигло Вас совершить покупку продуктов питания онлайн? Выберите наиболее
подходящий вариант ответа. / What prompted you to make a purchase of groceries online?
Choose the most appropriate answer.
• Я не мог\не хотел посещать продуктовые магазины / I couldn't\didn't want to visit
traditional grocery stores
• Это стало популярно, и я решил попробовать / It became popular, and I decided to
try
• Меня привлекла активная маркетинговая кампания / I was attracted by an active
marketing campaign
• Мне было скучно / I was bored
• Другие причины (укажите) / Other reasons (please, specify)
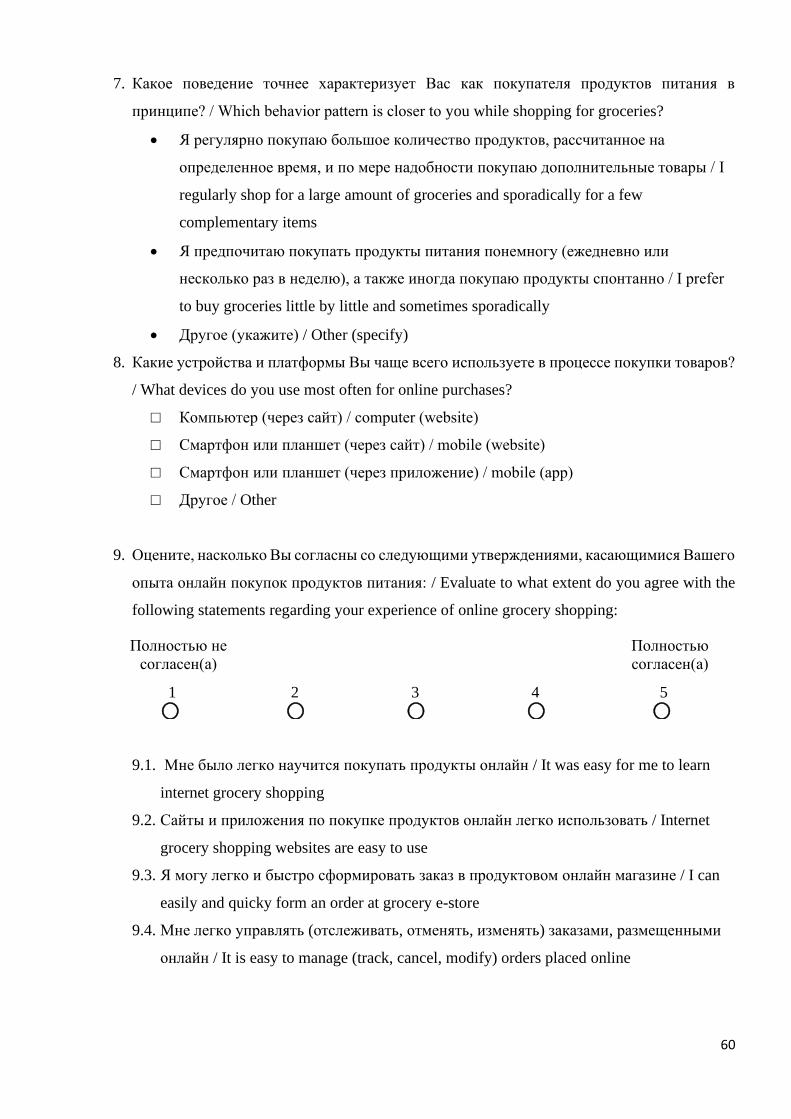
60
7. Какое поведение точнее характеризует Вас как покупателя продуктов питания в
принципе? / Which behavior pattern is closer to you while shopping for groceries?
• Я регулярно покупаю большое количество продуктов, рассчитанное на
определенное время, и по мере надобности покупаю дополнительные товары / I
regularly shop for a large amount of groceries and sporadically for a few
complementary items
• Я предпочитаю покупать продукты питания понемногу (ежедневно или
несколько раз в неделю), а также иногда покупаю продукты спонтанно / I prefer
to buy groceries little by little and sometimes sporadically
• Другое (укажите) / Other (specify)
8. Какие устройства и платформы Вы чаще всего используете в процессе покупки товаров?
/ What devices do you use most often for online purchases?
□ Компьютер (через сайт) / computer (website)
□ Смартфон или планшет (через сайт) / mobile (website)
□ Смартфон или планшет (через приложение) / mobile (app)
□ Другое / Other
9. Оцените, насколько Вы согласны со следующими утверждениями, касающимися Вашего
опыта онлайн покупок продуктов питания: / Evaluate to what extent do you agree with the
following statements regarding your experience of online grocery shopping:
Полностью не
согласен(а)
Полностью
согласен(а)
1
⃝ 2
⃝ 3
⃝ 4
⃝ 5
⃝
9.1. Мне было легко научится покупать продукты онлайн / It was easy for me to learn
internet grocery shopping
9.2. Сайты и приложения по покупке продуктов онлайн легко использовать / Internet
grocery shopping websites are easy to use
9.3. Я могу легко и быстро сформировать заказ в продуктовом онлайн магазине / I can
easily and quicky form an order at grocery e-store
9.4. Мне легко управлять (отслеживать, отменять, изменять) заказами, размещенными
онлайн / It is easy to manage (track, cancel, modify) orders placed online
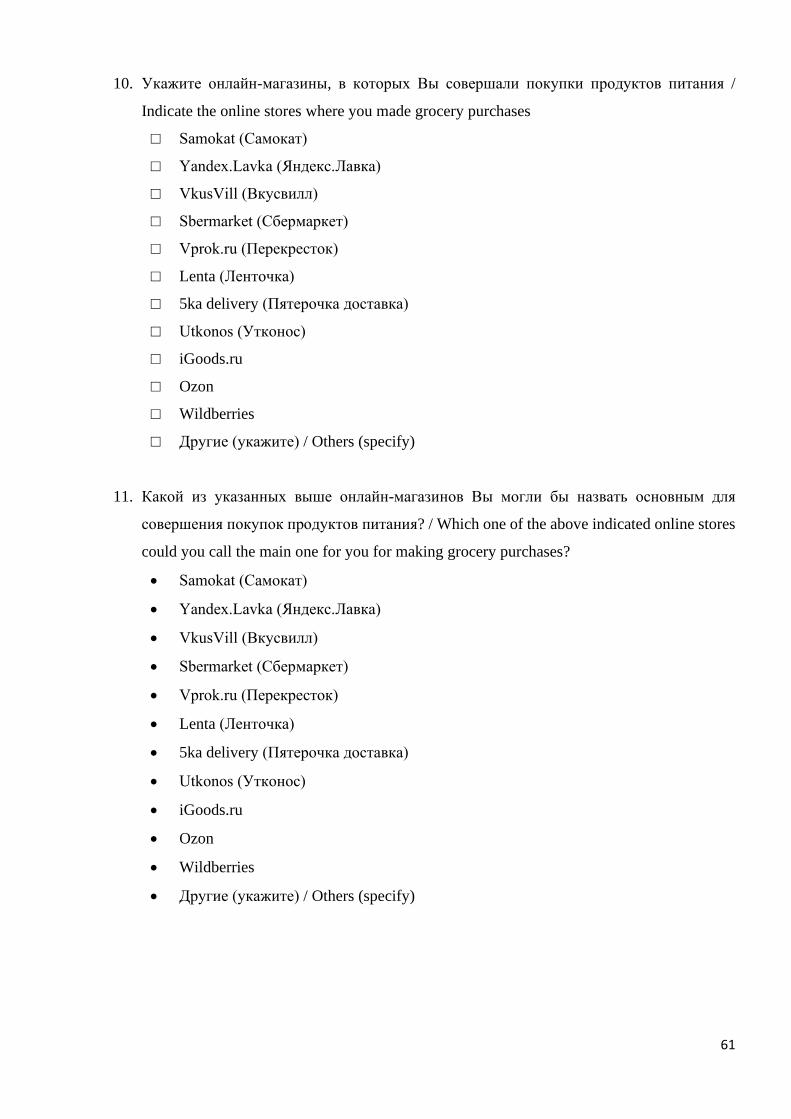
61
10. Укажите онлайн-магазины, в которых Вы совершали покупки продуктов питания /
Indicate the online stores where you made grocery purchases
□ Samokat (Самокат)
□ Yandex.Lavka (Яндекс.Лавка)
□ VkusVill (Вкусвилл)
□ Sbermarket (Сбермаркет)
□ Vprok.ru (Перекресток)
□ Lenta (Ленточка)
□ 5ka delivery (Пятерочка доставка)
□ Utkonos (Утконос)
□ iGoods.ru
□ Ozon
□ Wildberries
□ Другие (укажите) / Others (specify)
11. Какой из указанных выше онлайн-магазинов Вы могли бы назвать основным для
совершения покупок продуктов питания? / Which one of the above indicated online stores
could you call the main one for you for making grocery purchases?
• Samokat (Самокат)
• Yandex.Lavka (Яндекс.Лавка)
• VkusVill (Вкусвилл)
• Sbermarket (Сбермаркет)
• Vprok.ru (Перекресток)
• Lenta (Ленточка)
• 5ka delivery (Пятерочка доставка)
• Utkonos (Утконос)
• iGoods.ru
• Ozon
• Wildberries
• Другие (укажите) / Others (specify)
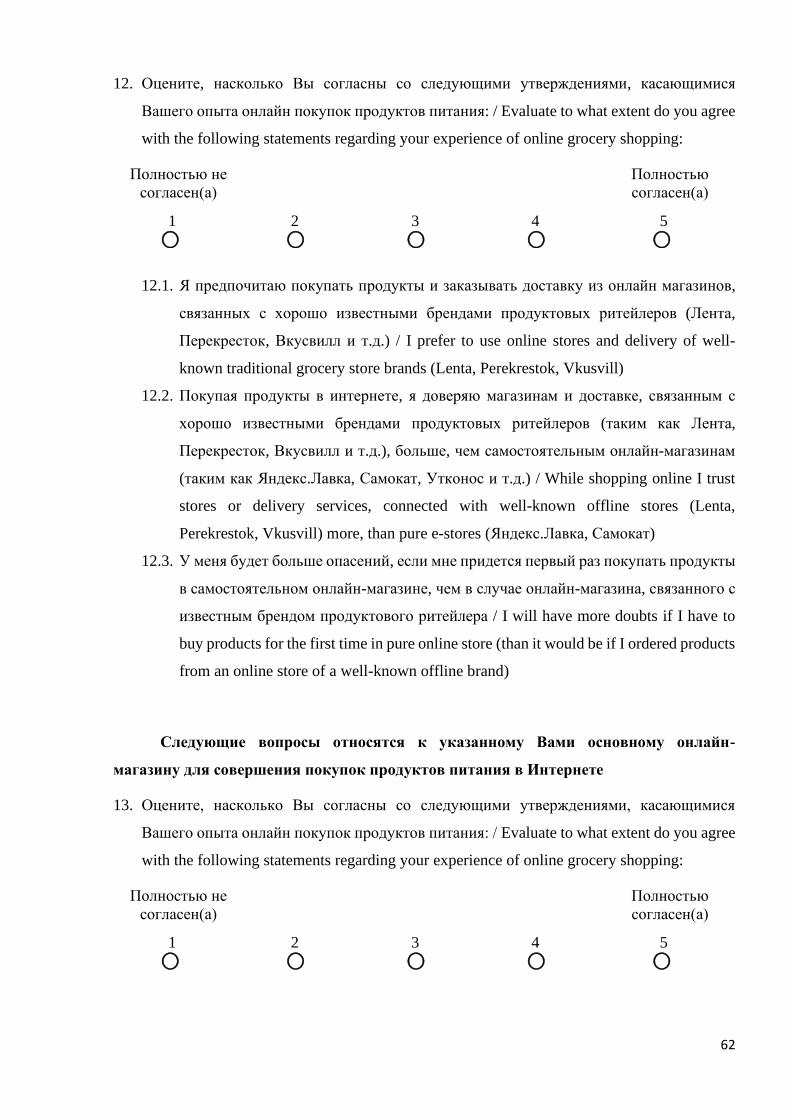
62
12. Оцените, насколько Вы согласны со следующими утверждениями, касающимися
Вашего опыта онлайн покупок продуктов питания: / Evaluate to what extent do you agree
with the following statements regarding your experience of online grocery shopping:
Полностью не
согласен(а)
Полностью
согласен(а)
1
⃝ 2
⃝ 3
⃝ 4
⃝ 5
⃝
12.1. Я предпочитаю покупать продукты и заказывать доставку из онлайн магазинов,
связанных с хорошо известными брендами продуктовых ритейлеров (Лента,
Перекресток, Вкусвилл и т.д.) / I prefer to use online stores and delivery of well-
known traditional grocery store brands (Lenta, Perekrestok, Vkusvill)
12.2. Покупая продукты в интернете, я доверяю магазинам и доставке, связанным с
хорошо известными брендами продуктовых ритейлеров (таким как Лента,
Перекресток, Вкусвилл и т.д.), больше, чем самостоятельным онлайн-магазинам
(таким как Яндекс.Лавка, Самокат, Утконос и т.д.) / While shopping online I trust
stores or delivery services, connected with well-known offline stores (Lenta,
Perekrestok, Vkusvill) more, than pure e-stores (Яндекс.Лавка, Самокат)
12.3. У меня будет больше опасений, если мне придется первый раз покупать продукты
в самостоятельном онлайн-магазине, чем в случае онлайн-магазина, связанного с
известным брендом продуктового ритейлера / I will have more doubts if I have to
buy products for the first time in pure online store (than it would be if I ordered products
from an online store of a well-known offline brand)
Следующие вопросы относятся к указанному Вами основному онлайн-
магазину для совершения покупок продуктов питания в Интернете
13. Оцените, насколько Вы согласны со следующими утверждениями, касающимися
Вашего опыта онлайн покупок продуктов питания: / Evaluate to what extent do you agree
with the following statements regarding your experience of online grocery shopping:
Полностью не
согласен(а)
Полностью
согласен(а)
1
⃝ 2
⃝ 3
⃝ 4
⃝ 5
⃝
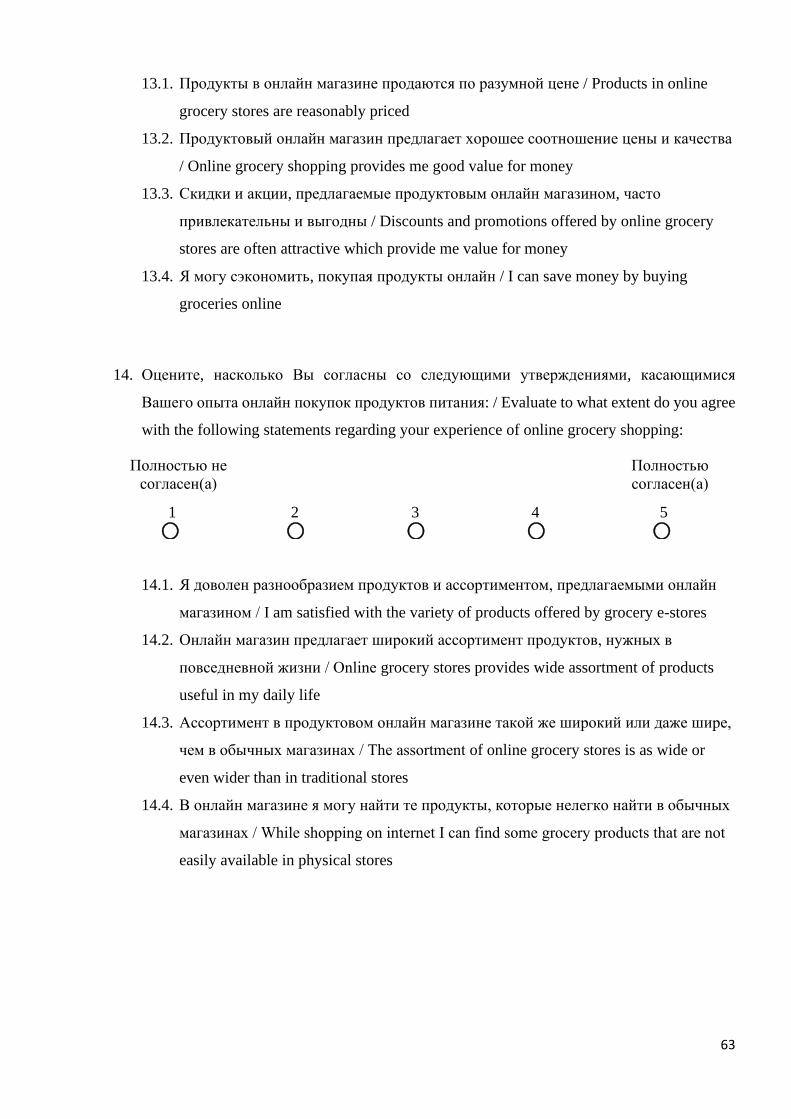
63
13.1. Продукты в онлайн магазине продаются по разумной цене / Products in online
grocery stores are reasonably priced
13.2. Продуктовый онлайн магазин предлагает хорошее соотношение цены и качества
/ Online grocery shopping provides me good value for money
13.3. Скидки и акции, предлагаемые продуктовым онлайн магазином, часто
привлекательны и выгодны / Discounts and promotions offered by online grocery
stores are often attractive which provide me value for money
13.4. Я могу сэкономить, покупая продукты онлайн / I can save money by buying
groceries online
14. Оцените, насколько Вы согласны со следующими утверждениями, касающимися
Вашего опыта онлайн покупок продуктов питания: / Evaluate to what extent do you agree
with the following statements regarding your experience of online grocery shopping:
Полностью не
согласен(а)
Полностью
согласен(а)
1
⃝ 2
⃝ 3
⃝ 4
⃝ 5
⃝
14.1. Я доволен разнообразием продуктов и ассортиментом, предлагаемыми онлайн
магазином / I am satisfied with the variety of products offered by grocery e-stores
14.2. Онлайн магазин предлагает широкий ассортимент продуктов, нужных в
повседневной жизни / Online grocery stores provides wide assortment of products
useful in my daily life
14.3. Ассортимент в продуктовом онлайн магазине такой же широкий или даже шире,
чем в обычных магазинах / The assortment of online grocery stores is as wide or
even wider than in traditional stores
14.4. В онлайн магазине я могу найти те продукты, которые нелегко найти в обычных
магазинах / While shopping on internet I can find some grocery products that are not
easily available in physical stores
64
15. Оцените, насколько Вы согласны со следующими утверждениями, касающимися
Вашего опыта онлайн покупок продуктов питания: / Evaluate to what extent do you agree
with the following statements regarding your experience of online grocery shopping:
Полностью не
согласен(а)
Полностью
согласен(а)
1
⃝ 2
⃝ 3
⃝ 4
⃝ 5
⃝
15.1. Покупка продуктов онлайн позволяет мне тратить меньше времени, чем покупка
продуктов в обычных магазинах благодаря доставке/ Online grocery shopping
enables me to accomplish shopping more quickly than traditional stores, owing to
delivery
15.2. Доставка продуктов – это очень удобно / Delivery of groceries is very convenient
15.3. Покупка продуктов онлайн позволяет мне выбрать удобный метод доставки /
Online grocery shopping allows me to choose a convenient delivery method (pick up,
contactless delivery, courier delivery, express)
15.4. Доставка продуктов из онлайн магазина осуществляется по разумной цене /
Delivery from online grocery stores is reasonably priced
15.5. Продукты обычно доставляются аккуратно и не повреждаются в процессе
транспортировки / Grocery products from online stores are delivered carefully and
they are not damaged during transportation
16. Оцените, насколько Вы согласны со следующими утверждениями, касающимися
Вашего опыта онлайн покупок продуктов питания: / Evaluate to what extent do you agree
with the following statements regarding your experience of online grocery shopping:
Полностью не
согласен(а)
Полностью
согласен(а)
1
⃝ 2
⃝ 3
⃝ 4
⃝ 5
⃝
16.1. Продукты, доставляемые из онлайн магазина, обычно свежие / Grocery products
from online stores are fresh
16.2. Продукты из онлайн магазина выглядят привлекательно после доставки /
Grocery products from online stores look appealing after being delivered
65
16.3. Покупая продукты онлайн, я получаю именно те товары, которые я заказал, в
том виде, в каком они представлены на сайте / While shopping for groceries online
I receive exactly the products that I ordered
Поговорим подробнее о Вашем опыте покупок продуктов питания в выбранном
онлайн-магазине
17. В выбранном онлайн-магазине Вы чаще всего совершаете покупки… / In the selected
online grocery store, you most often make purchases …
• На интернет-сайте онлайн-магазина / On the website -> вести по ветке вопросов
со словом «сайт»
• В приложении онлайн-магазина для смартфона/планшета / In the
smartphone/tablet app -> вести по ветке вопросов со словом «приложение»
*Далее две разные ветки были предложены респондентам, в зависимости от того, какой
вариант они выбрали в предыдущем вопросе. Ветки отличались только тем, какое слово
было указано в вопросах – сайт или приложение
18. Оцените, насколько Вы согласны со следующими утверждениями, касающимися
Вашего опыта онлайн покупок продуктов питания: / Evaluate to what extent do you agree
with the following statements regarding your experience of online grocery shopping:
Полностью не
согласен(а)
Полностью
согласен(а)
1
⃝ 2
⃝ 3
⃝ 4
⃝ 5
⃝
18.1. Дизайн и структура сайта (приложения) онлайн магазина облегчает процесс
покупки товаров / The layout of grocery online retailing and delivery websites
facilitates shopping
18.2. Дизайн сайта (приложения) онлайн магазина современный и привлекательный /
The design of online grocery retailing and delivery websites is modern and appealing
18.3. Сайт (приложение) онлайн магазина выглядит и работает одинаково хорошо при
доступе с разных устройств / Online grocery retailing and delivery websites look
and work equally good from different devices
66
19. Оцените, насколько Вы согласны со следующими утверждениями, касающимися
Вашего опыта онлайн покупок продуктов питания: / Evaluate to what extent do you agree
with the following statements regarding your experience of online grocery shopping:
Полностью не
согласен(а)
Полностью
согласен(а)
1
⃝ 2
⃝ 3
⃝ 4
⃝ 5
⃝
19.1. Навигация на сайте (в приложении) онлайн магазина облегчает процесс покупки
товаров / Navigation at online grocery retailing and delivery websites facilitates
shopping
19.2. Функции поиска и фильтрации на сайте (в приложении) онлайн магазина
полезны и облегчают процесс покупки товаров / The search and filter functions at
online grocery retailing and delivery websites are helpful and facilitate shopping
19.3. Навигация на сайте (в приложении) онлайн магазина помогает мне быстро найти
информацию и желаемые товары / Navigation helps me to find information or
product within the shortest time frame
19.4. Сайт (приложение) онлайн магазина прост в использовании, даже если
используется в первый раз / Online grocery retailing and delivery websites are easy
to use, even if used for the first time
19.5. Тематические подборки (акции, для детей, для пикника и т.д.) на сайте (в
приложении) онлайн магазина облегчают процесс покупки товаров / Thematic
sets at online grocery retailing and delivery websites (promotion, for picnic, for kids)
facilitate shopping
20. Оцените, насколько Вы согласны со следующими утверждениями, касающимися
Вашего опыта онлайн покупок продуктов питания: / Evaluate to what extent do you agree
with the following statements regarding your experience of online grocery shopping:
Полностью не
согласен(а)
Полностью
согласен(а)
1
⃝ 2
⃝ 3
⃝ 4
⃝ 5
⃝
67
20.1. На сайте (в приложении) онлайн магазина представлена вся информация о
продуктах (состав, срок хранения, страна производства и т.д.) необходимая для
совершения покупки/ Grocery e-stores provide complete information about products
(content, storage life, country of production etc.) necessary for making purchase
decision
20.2. На сайте (в приложении) онлайн магазина представлена дополнительная
информация о продуктах (например, количество белков, жиров и углеводов), что
облегчает процесс покупки / Grocery e-stores provide additional information about
products (the amount of proteins, fats and carbs, product story etc.) which facilitates
shopping
20.3. Информация о продуктах, представленная на сайте (в приложении) онлайн
магазина, достаточна для принятия решения о покупке без сомнений / The
information provided in online grocery stores is sufficient to make a purchase without
doubts
20.4. Дополнительный контент (например, рецепты готовых блюд), предлагаемый на
сайте (в приложении) онлайн магазина, облегчает процесс покупки / Additional
content (e.g. recipes), offered by grocery e-stores, facilitates shopping
20.5. Фотографии продуктов, представленные на сайте (в приложении) онлайн
магазина, облегчают процесс принятия решения о покупке / Pictures of the
products displayed at online grocery retailing and delivery websites provide ease for
purchasing
20.6. Наличие отзывов и оценок на сайте (в приложении) онлайн магазина облегчает
процесс принятия решения о покупке / Presence of reviews or marks of the
products at online grocery retailing and delivery websites facilitates decision making
process
21. Оцените, насколько Вы согласны со следующими утверждениями, касающимися
Вашего опыта онлайн покупок продуктов питания: / Evaluate to what extent do you agree
with the following statements regarding your experience of online grocery shopping:
Полностью не
согласен(а)
Полностью
согласен(а)
1
⃝ 2
⃝ 3
⃝ 4
⃝ 5
⃝
68
21.1. Покупая продукты онлайн, можно получить персональные скидки и
рекомендации / While shopping for groceries online one can get more special
discounts and personal recommendations
21.2. Покупая продукты онлайн, можно сформировать список избранных товаров и
тратить меньше времени на формирование заказа / Online grocery shopping
provides an opportunity to create a list of favorite products and spend less time
ordering
21.3. Процесс покупки продуктов онлайн более персонализирован, чем процесс
покупки продуктов в обычном магазине / Online grocery shopping experience is
more personalized than traditional one
22. Оцените, насколько Вы согласны со следующими утверждениями, касающимися
Вашего опыта онлайн покупок продуктов питания: / Evaluate to what extent do you agree
with the following statements regarding your experience of online grocery shopping:
Полностью не
согласен(а)
Полностью
согласен(а)
1
⃝ 2
⃝ 3
⃝ 4
⃝ 5
⃝
22.1. Сайт (приложение) онлайн магазина обеспечивают надлежащие меры
безопасности / Online grocery retailing and delivery websites have adequate security
measures
22.2. Я чувствую себя защищенно, используя платежную карту на сайте (в
приложении) онлайн магазина / I feel safe while using my credit card/debit card on
online grocery retailing and delivery websites
22.3. Я верю, что сайт (приложение) онлайн магазина не будет раскрывать мою
персональную информацию без моего разрешения / I trust that online grocery
retailing and delivery websites will not reveal my personal details without my
permission
А теперь поговорим о том, насколько Вы довольны своим основным онлайн-
магазином для покупки продуктов питания
69
23. Оцените, насколько Вы согласны со следующими утверждениями, касающимися
Вашего опыта онлайн покупок продуктов питания: / Evaluate to what extent do you agree
with the following statements regarding your experience of online grocery shopping:
Полностью не
согласен(а)
Полностью
согласен(а)
1
⃝ 2
⃝ 3
⃝ 4
⃝ 5
⃝
23.1. В целом я довольна опытом покупки продуктов онлайн / Overall, I am satisfied
with online grocery shopping experience
23.2. Покупка продуктов онлайн – довольно простой процесс / Buying grocery products
online is generally very simple
23.3. Покупка продуктов онлайн довольно удобна / Buying grocery products online is
generally very convenient
23.4. Покупка продуктов онлайн имеет больше достоинств, чем недостатков / Online
grocery shopping has more advantages than disadvantages
23.5. Я планирую продолжать покупать продукты онлайн / I plan to continue buying
groceries online
24. Оцените, насколько Вы согласны со следующими утверждениями, касающимися
Вашей жизни в условиях пандемии Covid-19: / Evaluate to what extent do you agree with
the following statements regarding your life during COVID-19 pandemic:
Полностью не
согласен(а)
Полностью
согласен(а)
1
⃝ 2
⃝ 3
⃝ 4
⃝ 5
⃝
24.1. Я обеспокоен тем, что могу заразиться вирусом Covid-19 / I am concerned of
getting the virus
24.2. Я стараюсь оставаться дома в периоды пиковой активности распространения
Covid-19 / I am trying to stay home as much as possible during Covid-19 pandemic
24.3. Я какое-то время работал дома удаленно в период пандемии Covid-19 / I have
been working from home during Covid-19 pandemic for some time
70
24.4. Я столкнулся с нехваткой продуктов в обычных магазинах во время пандемии
Covid-19 / I encountered deficit of grocery products in offline stores during Covid-19
pandemic
24.5. С начала пандемии Covid-19 я испытал финансовые трудности (потеря работы,
снижение доходов/увеличение расходов, увеличение цен и т.д.) / During Covid-19
pandemic I have experienced financial difficulties (job loss, reduced income/increased
expenses, price rise)
24.6. Я ощущаю повышенный стресс и тревогу в связи с пандемией Covid-19 / I
experience increased stress and anxiety due to Covid-19 pandemic
25. Укажите свой пол: / Indicate your gender
• Мужской / Male
• Женский / Female
26. Укажите свой возраст: / Indicate your age
• Младше 18 / less than 18
• 18-24
• 25-29
• 30-34
• 35-39
• 40-44
• 45-49
• 50 и старше / more than 50
27. Отметьте свой уровень образования:
• Незаконченное среднее образование
• Полное среднее (11 классов)
• Среднее специальное (техникум, колледж и т.д.)
• Высшее: Бакалавриат/специалитет
• Высшее: Магистратура
• Высшее: Докторантура и аспирантура
• Другое
71
28. Выберите свою сферу занятости:
• Безработный/безработная, домохозяин/домохозяйка
• Студент/студентка
• Рабочий или сотрудник обслуживающего персонала (в компании)
• Специалист (в компании)
• Руководитель среднего звена (в компании)
• Руководитель высшего звена (в компании), управляющий компании
• Фрилансер, самозанятый
• Владелец собственного бизнеса
• Другое
29. Какое утверждение лучше всего описывает Ваш уровень дохода?
• Денег не хватает даже на приобретение продуктов питания
• Денег хватает только на приобретение продуктов питания
• Денег достаточно для приобретения необходимых продуктов питания и одежды,
но на более крупные покупки приходится откладывать
• Покупка большинства товаров длительного пользования (холодильник,
телевизор) не вызывает трудностей, однако приобрести автомобиль или
квартиру мы не можем
• Мы можем позволить себе приобрести автомобиль или квартиру
• Денег достаточно, чтобы вообще ни в чем себе не отказывать
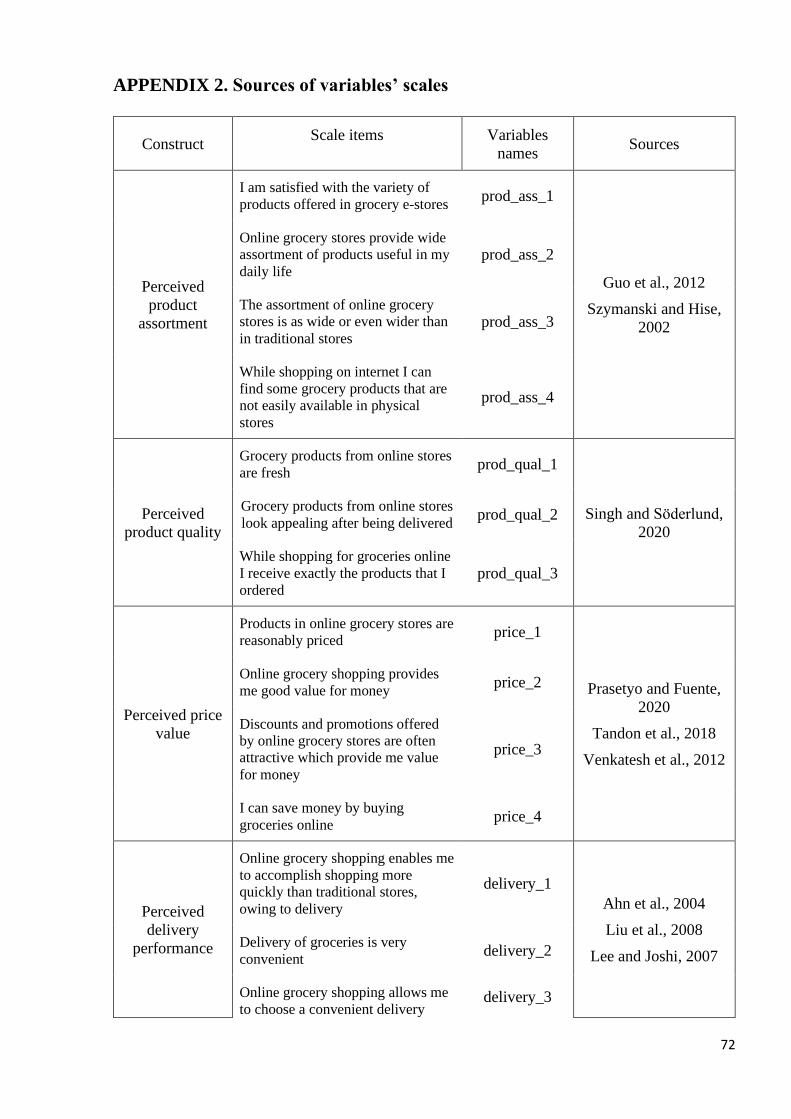
72
APPENDIX 2. Sources of variables’ scales
Construct Scale items Variables
names Sources
Perceived
product
assortment
I am satisfied with the variety of
products offered in grocery e-stores prod_ass_1
Guo et al., 2012
Szymanski and Hise,
2002
Online grocery stores provide wide
assortment of products useful in my
daily life prod_ass_2
The assortment of online grocery
stores is as wide or even wider than
in traditional stores prod_ass_3
While shopping on internet I can
find some grocery products that are
not easily available in physical
stores
prod_ass_4
Perceived
product quality
Grocery products from online stores
are fresh prod_qual_1
Singh and Söderlund,
2020
Grocery products from online stores
look appealing after being delivered prod_qual_2
While shopping for groceries online
I receive exactly the products that I
ordered prod_qual_3
Perceived price
value
Products in online grocery stores are
reasonably priced price_1
Prasetyo and Fuente,
2020
Tandon et al., 2018
Venkatesh et al., 2012
Online grocery shopping provides
me good value for money price_2
Discounts and promotions offered
by online grocery stores are often
attractive which provide me value
for money
price_3
I can save money by buying
groceries online price_4
Perceived
delivery
performance
Online grocery shopping enables me
to accomplish shopping more
quickly than traditional stores,
owing to delivery
delivery_1
Ahn et al., 2004
Liu et al., 2008
Lee and Joshi, 2007 Delivery of groceries is very
convenient delivery_2
Online grocery shopping allows me
to choose a convenient delivery delivery_3
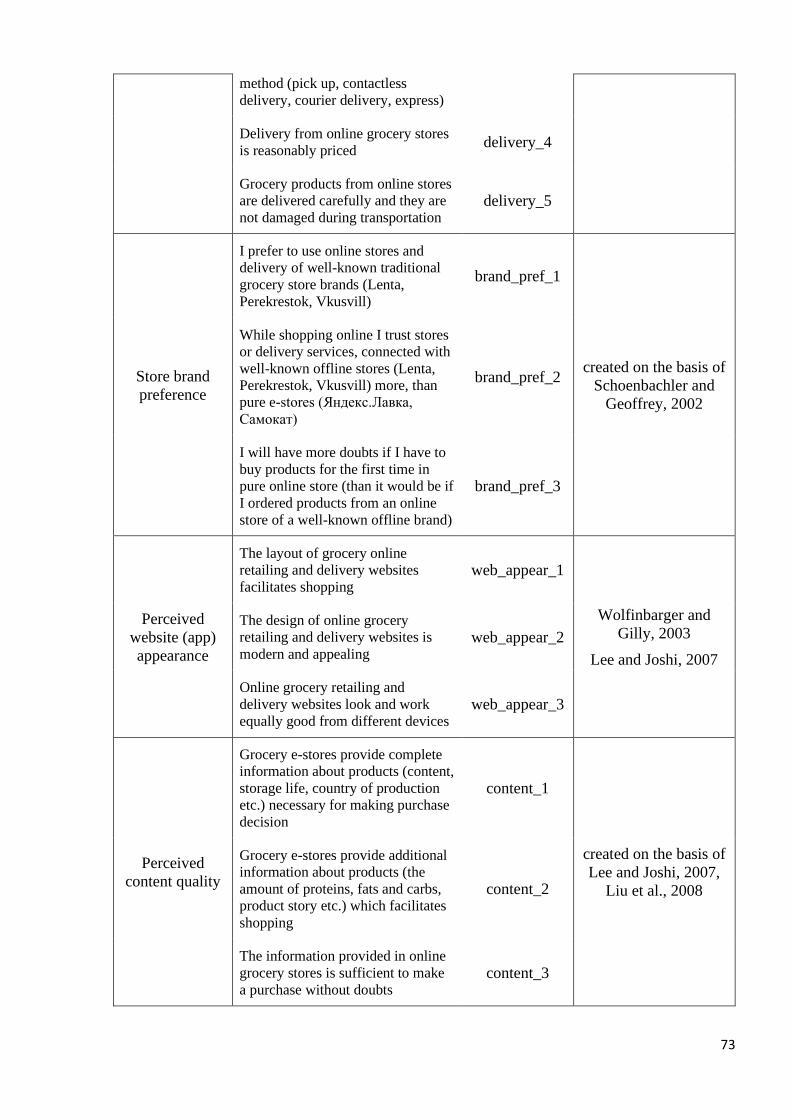
73
method (pick up, contactless
delivery, courier delivery, express)
Delivery from online grocery stores
is reasonably priced delivery_4
Grocery products from online stores
are delivered carefully and they are
not damaged during transportation delivery_5
Store brand
preference
I prefer to use online stores and
delivery of well-known traditional
grocery store brands (Lenta,
Perekrestok, Vkusvill)
brand_pref_1
created on the basis of
Schoenbachler and
Geoffrey, 2002
While shopping online I trust stores
or delivery services, connected with
well-known offline stores (Lenta,
Perekrestok, Vkusvill) more, than
pure e-stores (Яндекс.Лавка,
Самокат)
brand_pref_2
I will have more doubts if I have to
buy products for the first time in
pure online store (than it would be if
I ordered products from an online
store of a well-known offline brand)
brand_pref_3
Perceived
website (app)
appearance
The layout of grocery online
retailing and delivery websites
facilitates shopping web_appear_1
Wolfinbarger and
Gilly, 2003
Lee and Joshi, 2007
The design of online grocery
retailing and delivery websites is
modern and appealing web_appear_2
Online grocery retailing and
delivery websites look and work
equally good from different devices web_appear_3
Perceived
content quality
Grocery e-stores provide complete
information about products (content,
storage life, country of production
etc.) necessary for making purchase
decision
content_1
created on the basis of
Lee and Joshi, 2007,
Liu et al., 2008
Grocery e-stores provide additional
information about products (the
amount of proteins, fats and carbs,
product story etc.) which facilitates
shopping
content_2
The information provided in online
grocery stores is sufficient to make
a purchase without doubts content_3
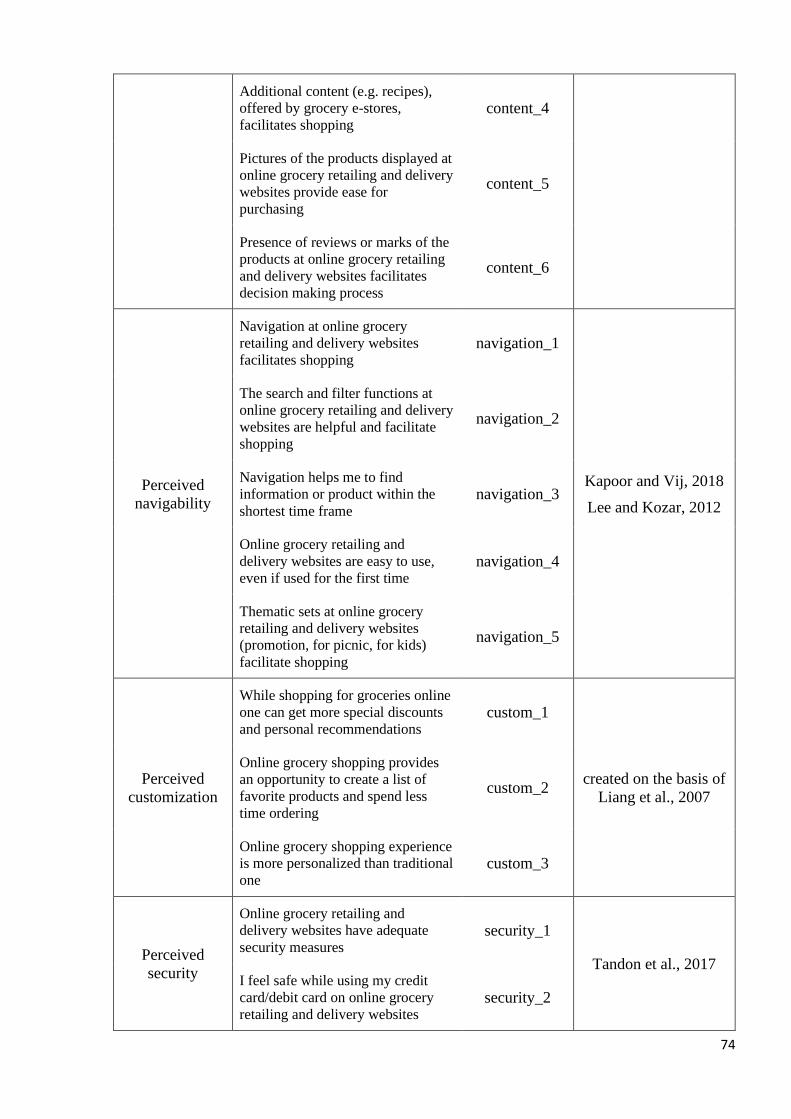
74
Additional content (e.g. recipes),
offered by grocery e-stores,
facilitates shopping content_4
Pictures of the products displayed at
online grocery retailing and delivery
websites provide ease for
purchasing
content_5
Presence of reviews or marks of the
products at online grocery retailing
and delivery websites facilitates
decision making process
content_6
Perceived
navigability
Navigation at online grocery
retailing and delivery websites
facilitates shopping navigation_1
Kapoor and Vij, 2018
Lee and Kozar, 2012
The search and filter functions at
online grocery retailing and delivery
websites are helpful and facilitate
shopping
navigation_2
Navigation helps me to find
information or product within the
shortest time frame navigation_3
Online grocery retailing and
delivery websites are easy to use,
even if used for the first time navigation_4
Thematic sets at online grocery
retailing and delivery websites
(promotion, for picnic, for kids)
facilitate shopping
navigation_5
Perceived
customization
While shopping for groceries online
one can get more special discounts
and personal recommendations custom_1
created on the basis of
Liang et al., 2007
Online grocery shopping provides
an opportunity to create a list of
favorite products and spend less
time ordering
custom_2
Online grocery shopping experience
is more personalized than traditional
one custom_3
Perceived
security
Online grocery retailing and
delivery websites have adequate
security measures security_1
Tandon et al., 2017 I feel safe while using my credit
card/debit card on online grocery
retailing and delivery websites security_2
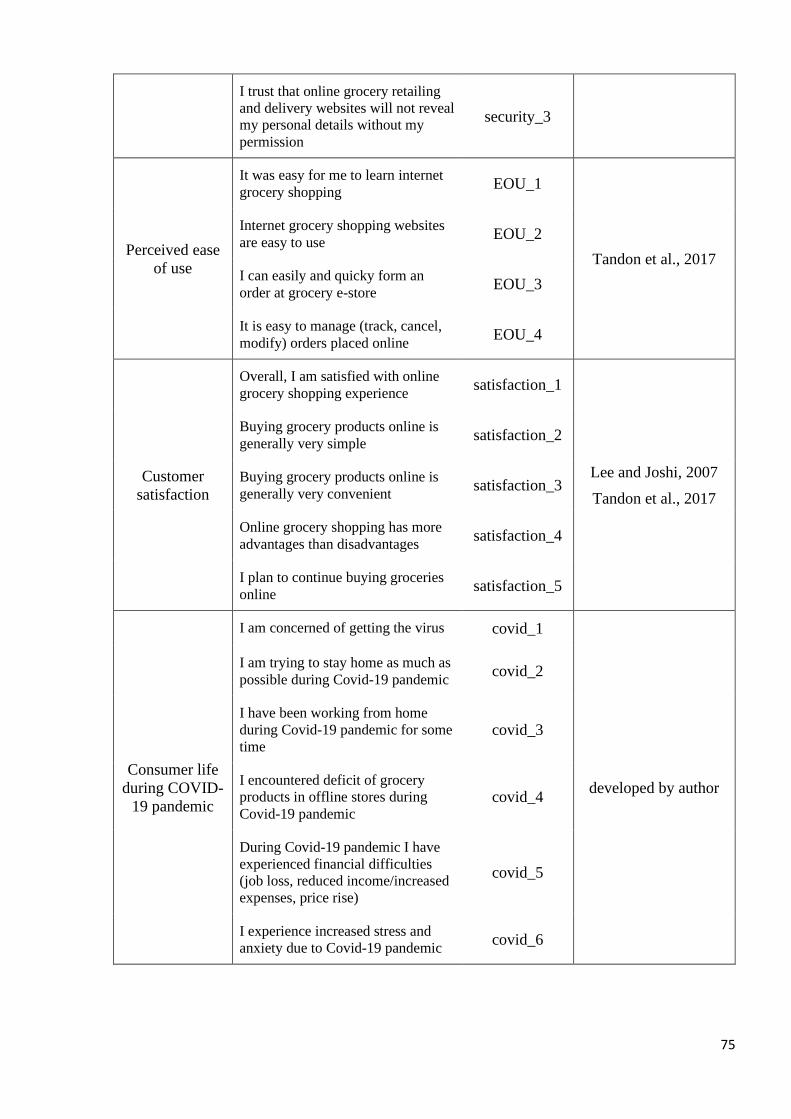
75
I trust that online grocery retailing
and delivery websites will not reveal
my personal details without my
permission
security_3
Perceived ease
of use
It was easy for me to learn internet
grocery shopping EOU_1
Tandon et al., 2017
Internet grocery shopping websites
are easy to use EOU_2
I can easily and quicky form an
order at grocery e-store EOU_3
It is easy to manage (track, cancel,
modify) orders placed online EOU_4
Customer
satisfaction
Overall, I am satisfied with online
grocery shopping experience satisfaction_1
Lee and Joshi, 2007
Tandon et al., 2017
Buying grocery products online is
generally very simple satisfaction_2
Buying grocery products online is
generally very convenient satisfaction_3
Online grocery shopping has more
advantages than disadvantages satisfaction_4
I plan to continue buying groceries
online satisfaction_5
Consumer life
during COVID-
19 pandemic
I am concerned of getting the virus covid_1
developed by author
I am trying to stay home as much as
possible during Covid-19 pandemic covid_2
I have been working from home
during Covid-19 pandemic for some
time covid_3
I encountered deficit of grocery
products in offline stores during
Covid-19 pandemic covid_4
During Covid-19 pandemic I have
experienced financial difficulties
(job loss, reduced income/increased
expenses, price rise)
covid_5
I experience increased stress and
anxiety due to Covid-19 pandemic covid_6
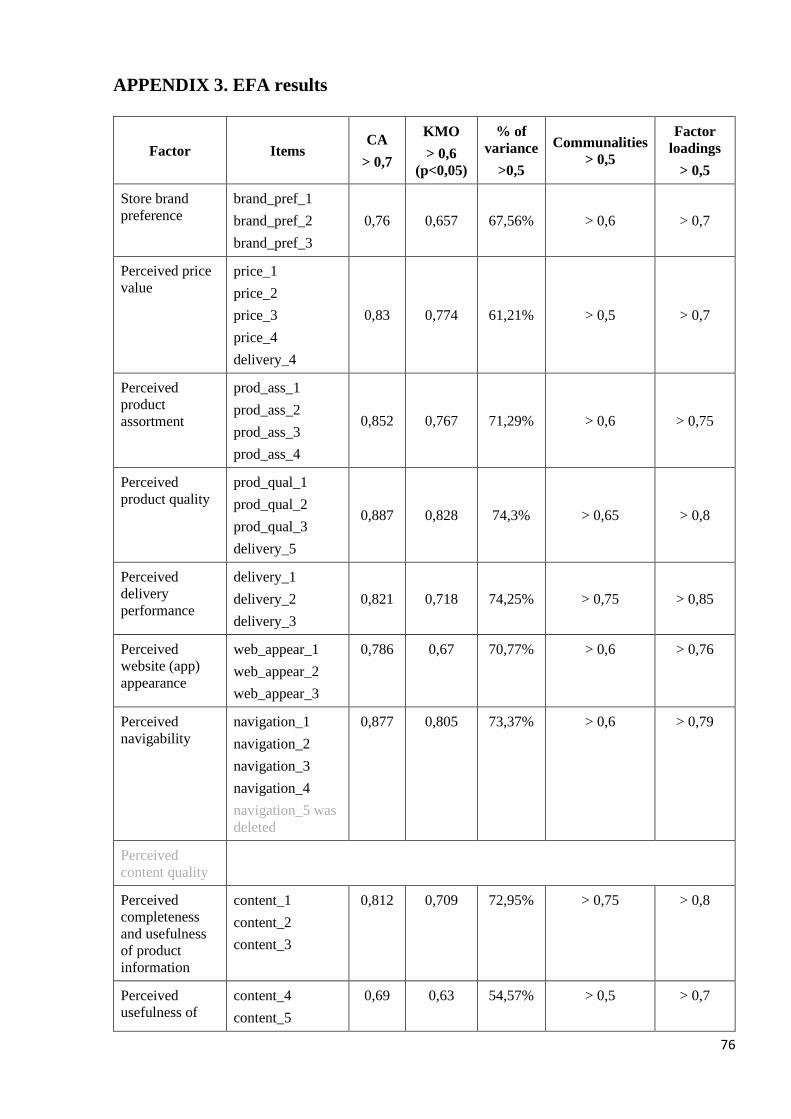
76
APPENDIX 3. EFA results
Factor Items CA
> 0,7
KMO
> 0,6
(p<0,05)
% of
variance
>0,5
Communalities
> 0,5
Factor
loadings
> 0,5
Store brand
preference
brand_pref_1
brand_pref_2
brand_pref_3
0,76 0,657 67,56% > 0,6 > 0,7
Perceived price
value
price_1
price_2
price_3
price_4
delivery_4
0,83 0,774 61,21% > 0,5 > 0,7
Perceived
product
assortment
prod_ass_1
prod_ass_2
prod_ass_3
prod_ass_4
0,852 0,767 71,29% > 0,6 > 0,75
Perceived
product quality
prod_qual_1
prod_qual_2
prod_qual_3
delivery_5
0,887 0,828 74,3% > 0,65 > 0,8
Perceived
delivery
performance
delivery_1
delivery_2
delivery_3
0,821 0,718 74,25% > 0,75 > 0,85
Perceived
website (app)
appearance
web_appear_1
web_appear_2
web_appear_3
0,786 0,67 70,77% > 0,6 > 0,76
Perceived
navigability
navigation_1
navigation_2
navigation_3
navigation_4
navigation_5 was
deleted
0,877 0,805 73,37% > 0,6 > 0,79
Perceived
content quality
Perceived
completeness
and usefulness
of product
information
content_1
content_2
content_3
0,812 0,709 72,95% > 0,75 > 0,8
Perceived
usefulness of
content_4
content_5
0,69 0,63 54,57% > 0,5 > 0,7
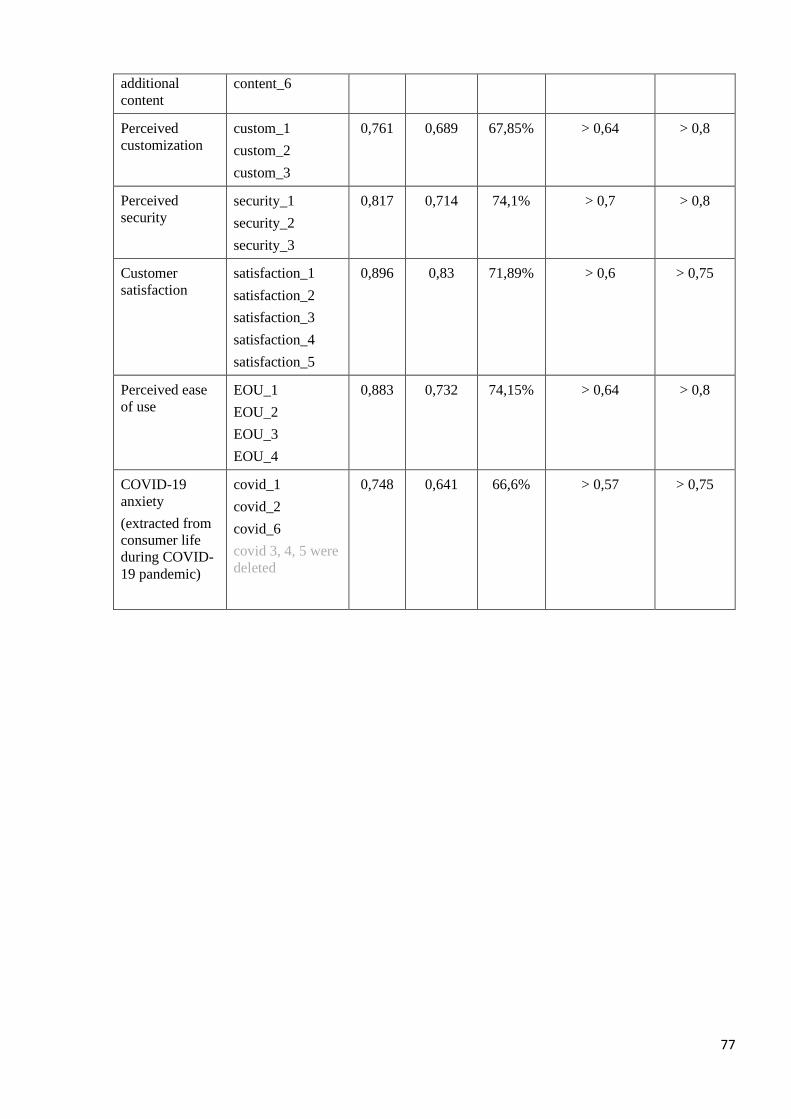
77
additional
content
content_6
Perceived
customization
custom_1
custom_2
custom_3
0,761 0,689 67,85% > 0,64 > 0,8
Perceived
security
security_1
security_2
security_3
0,817 0,714 74,1% > 0,7 > 0,8
Customer
satisfaction
satisfaction_1
satisfaction_2
satisfaction_3
satisfaction_4
satisfaction_5
0,896 0,83 71,89% > 0,6 > 0,75
Perceived ease
of use
EOU_1
EOU_2
EOU_3
EOU_4
0,883 0,732 74,15% > 0,64 > 0,8
COVID-19
anxiety
(extracted from
consumer life
during COVID-
19 pandemic)
covid_1
covid_2
covid_6
covid 3, 4, 5 were
deleted
0,748 0,641 66,6% > 0,57 > 0,75
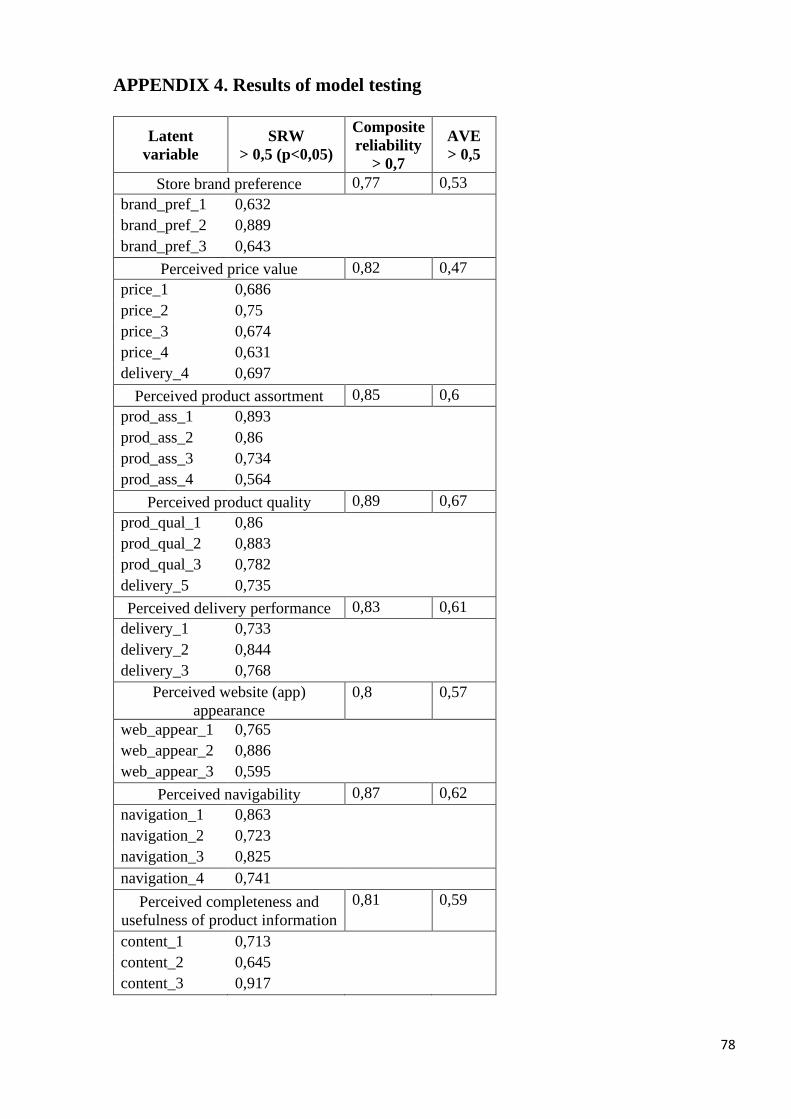
78
APPENDIX 4. Results of model testing
Latent
variable
SRW
> 0,5 (p<0,05)
Composite
reliability
> 0,7
AVE
> 0,5
Store brand preference 0,77 0,53
brand_pref_1 0,632
brand_pref_2 0,889
brand_pref_3 0,643
Perceived price value 0,82 0,47
price_1 0,686
price_2 0,75
price_3 0,674
price_4 0,631
delivery_4 0,697
Perceived product assortment 0,85 0,6
prod_ass_1 0,893
prod_ass_2 0,86
prod_ass_3 0,734
prod_ass_4 0,564
Perceived product quality 0,89 0,67
prod_qual_1 0,86
prod_qual_2 0,883
prod_qual_3 0,782
delivery_5 0,735
Perceived delivery performance 0,83 0,61
delivery_1 0,733
delivery_2 0,844
delivery_3 0,768
Perceived website (app)
appearance
0,8 0,57
web_appear_1 0,765
web_appear_2 0,886
web_appear_3 0,595
Perceived navigability 0,87 0,62
navigation_1 0,863
navigation_2 0,723
navigation_3 0,825
navigation_4 0,741
Perceived completeness and
usefulness of product information
0,81 0,59
content_1 0,713
content_2 0,645
content_3 0,917
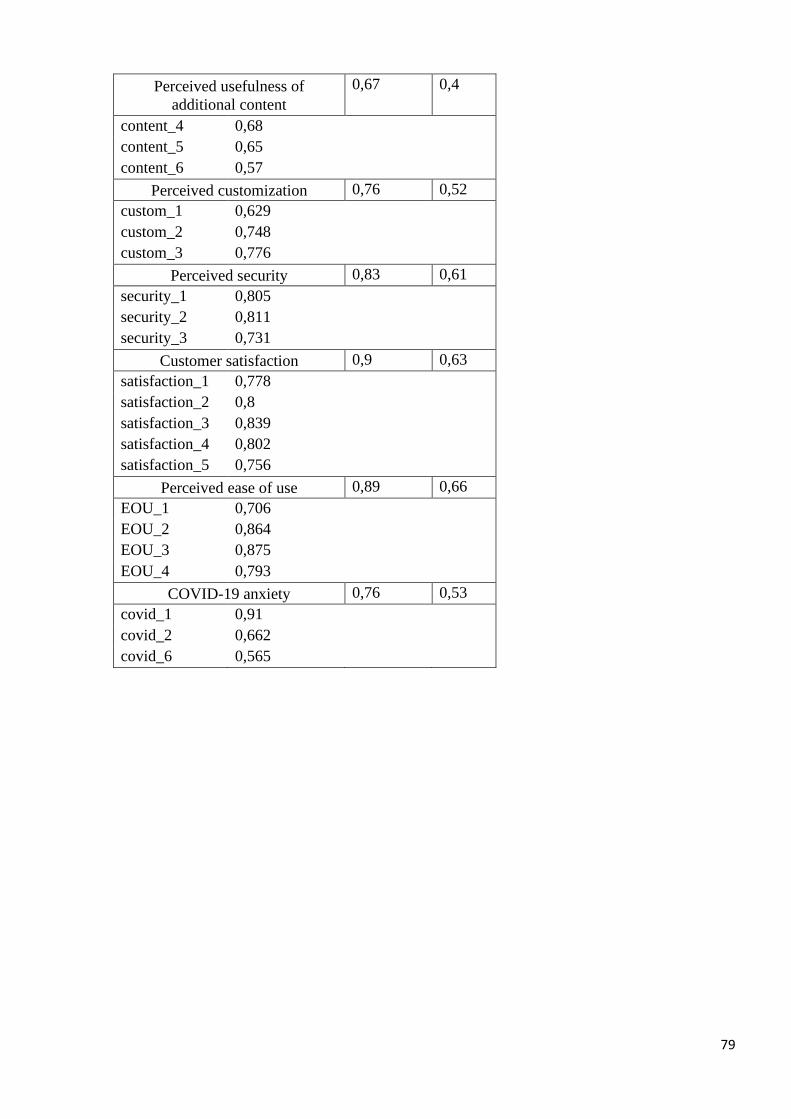
79
Perceived usefulness of
additional content
0,67 0,4
content_4 0,68
content_5 0,65
content_6 0,57
Perceived customization 0,76 0,52
custom_1 0,629
custom_2 0,748
custom_3 0,776
Perceived security 0,83 0,61
security_1 0,805
security_2 0,811
security_3 0,731
Customer satisfaction 0,9 0,63
satisfaction_1 0,778
satisfaction_2 0,8
satisfaction_3 0,839
satisfaction_4 0,802
satisfaction_5 0,756
Perceived ease of use 0,89 0,66
EOU_1 0,706
EOU_2 0,864
EOU_3 0,875
EOU_4 0,793
COVID-19 anxiety 0,76 0,53
covid_1 0,91
covid_2 0,662
covid_6 0,565
80
REFERENCES
1. Ahn, T., Ryu, S., & Han, I. (2004). The impact of the online and offline features on the
user acceptance of Internet shopping malls. Electronic commerce research and
applications, 3(4), 405-420.
2. Alaimo, L. S., Fiore, M., & Galati, A. (2021). Measuring consumers’ level of satisfaction
for online food shopping during COVID-19 in Italy using POSETs. Socio-Economic
Planning Sciences, 101064.
3. Alam, A., Malik, O. M., Hadi, N. U., & Gaadar, K. (2016). Barriers of online shopping
in developing countries: case study of Saudi Arabia. European Academic Research, 3(12),
12957-12971.
4. Alam, S. S., & Yasin, N. M. (2010). An investigation into the antecedents of customer
satisfaction of online shopping. Journal of Marketing Development and Competitiveness,
5(1), 71-78.
5. Alba, J., Lynch, J., Weitz, B., Janiszewski, C., Lutz, R., Sawyer, A., & Wood, S.
(1997). Interactive home shopping: consumer, retailer, and manufacturer incentives to
participate in electronic marketplaces. Journal of marketing, 61(3), 38-53.
6. Almarashdeh, I., Eldaw, K. E., AlSmadi, M., Badawi, U., Haddad, F., Abdelkader, O. A.,
... & Qawqzeh, Y. (2018). Search Convenience and Access Convenience: The Difference
Between Website Shopping and Mobile Shopping. In International Conference on Soft
Computing and Pattern Recognition (pp. 33-42). Springer, Cham.
7. Anesbury, Z., Nenycz‐Thiel, M., Dawes, J., & Kennedy, R. (2016). How do shoppers
behave online? An observational study of online grocery shopping. Journal of Consumer
Behaviour, 15(3), 261-270.
8. Bauerová, R. (2021). Online grocery shopping is a privilege of millennial customers. Still
truth in covid-19 pandemic? Acta academica, 21(1), 15-28.
9. Belk, R. W. (1975). The objective situation as a determinant of consumer behavior.
Advances in Consumer Research, 2(1), 427-437.
10. Blitstein, J. L., Frentz, F., & Jilcott Pitts, S. B. (2020). A mixed-method examination of
reported benefits of online grocery shopping in the United States and Germany: Is health
a factor? Journal of Food Products Marketing, 26(3), 212-224.
11. Blut, M. (2016). E-service quality: development of a hierarchical model. Journal of
Retailing, 92(4), 500-517.
12. Broekhuizen, T. L. (2006). Understanding channel purchase intentions: measuring online
and offline shopping value perceptions. Ridderkerk: Labyrinth Publications.
81
13. Chang, H. H., & Meyerhoefer, C. D. (2020). COVID‐19 and the Demand for Online Food
Shopping Services: Empirical Evidence from Taiwan. American Journal of Agricultural
Economics.
14. Chen, H. M., Wu, C. H., Tsai, S. B., Yu, J., Wang, J., & Zheng, Y. (2016). Exploring key
factors in online shopping with a hybrid model. SpringerPlus, 5(1), 1-19.
15. Cyr, D. (2008). Modeling web site design across cultures: relationships to trust,
satisfaction, and e-loyalty. Journal of management information systems, 24(4), 47-72.
16. Dabholkar, P. A., & Bagozzi, R. P. (2002). An attitudinal model of technology-based self-
service: moderating effects of consumer traits and situational factors. Journal of the
academy of marketing science, 30(3), 184-201.
17. Dannenberg, P., Fuchs, M., Riedler, T., & Wiedemann, C. (2020). Digital transition by
COVID‐19 pandemic? The German food online retail. Tijdschrift voor economische en
sociale geografie, 111(3), 543-560.
18. Data Insight (2021). Логистика для электронной торговли 2020. Datainsight.
https://datainsight.ru/sites/default/files/Logistics_2020.pdf (acсessed: 25.02.2021)
19. Davis, F. D., Bagozzi, R. P., & Warshaw, P. R. (1989). User acceptance of computer
technology: A comparison of two theoretical models. Management science, 35(8), 982-
1003.
20. Deloitte (2020). Consumption in Russia. Deloitte.
https://www2.deloitte.com/content/dam/Deloitte/ru/Documents/consumer-
business/CBT-2020-EN.pdf (accessed: 02.02.2021)
21. Dholakia, R.R. & Zhao, M. (2010) Effects of online store attributes on customer
satisfaction and repurchase intentions. International Journal of Retail & Distribution
Management, 38, 482–496.
22. eMarketer (2018, October 31). Online Grocery Shopping Is Reaching a Tipping Point.
Emarketer. https://www.emarketer.com/content/online-grocery-shopping-is-reaching-a-
tipping-point (Accessed: 03.06.2020)
23. eMarketer (2019, May). Global Ecommerce 2019. eMarketer.
https://www.emarketer.com/content/global-ecommerce-2019 (accessed: 03.06.2020)
24. Fam, K. S., Merrilees, B., Richard, J. E., Jozsa, L., Li, Y., & Krisjanous, J. (2011). In‐
store marketing: a strategic perspective. Asia Pacific Journal of Marketing and Logistics.
25. Featherman, M. S., & Pavlou, P. A. (2003). Predicting e-services adoption: a perceived
risk facets perspective. International journal of human-computer studies, 59(4), 451-474.
82
26. Featherman, M. S., & Wells, J. D. (2010). The intangibility of e-services: Effects on
perceived risk and acceptance. ACM SIGMIS Database: the DATABASE for Advances in
Information Systems, 41(2), 110-131.
27. Fornell, C. (1992). A national customer satisfaction barometer: The Swedish experience.
Journal of marketing, 56(1), 6-21.
28. Fraering, M., & Minor, M. S. (2013). Beyond loyalty: customer satisfaction, loyalty, and
fortitude. Journal of Services Marketing.
29. GlobalWebIndex (2020). Интернет и соцсети в России в 2021 году — вся статистика.
Web-canape. https://www.web-canape.ru/business/internet-i-socseti-v-rossii-v-2021-
godu-vsya-statistika/ (accessed: 10.03.2021)
30. Griffith, D. A., Krampf, R. F., & Palmer, J. W. (2001). The role of interface in electronic
commerce: Consumer involvement with print versus on-line catalogs. International
Journal of Electronic Commerce, 5(4), 135-153.
31. Guo, X., Ling, K. C., & Liu, M. (2012). Evaluating factors influencing consumer
satisfaction towards online shopping in China. Asian Social Science, 8(13), 40.
32. Ha, H. Y., & Perks, H. (2005). Effects of consumer perceptions of brand experience on
the web: Brand familiarity, satisfaction and brand trust. Journal of Consumer Behaviour:
An International Research Review, 4(6), 438-452.
33. Hair Jr, J. F., Hult, G. T. M., Ringle, C., & Sarstedt, M. (2016). A primer on partial least
squares structural equation modeling (PLS-SEM). Sage publications.
34. Hand, C., Riley, F. D. O., Harris, P., Singh, J., & Rettie, R. (2009). Online grocery
shopping: the influence of situational factors. European journal of Marketing.
35. Harris, P., Riley, F. D. O., Riley, D., & Hand, C. (2017). Online and store patronage: a
typology of grocery shoppers. International Journal of Retail & Distribution
Management.
36. Hasan, B. (2016). Perceived irritation in online shopping: The impact of website design
characteristics. Computers in Human Behavior, 54, 224-230.
37. Hoque, A. Y., & Lohse, G. L. (1999). An information search cost perspective for
designing interfaces for electronic commerce. Journal of marketing research, 36(3), 387-
394.
38. Huang, Y., & Oppewal, H. (2006). Why consumers hesitate to shop online: An
experimental choice analysis of grocery shopping and the role of delivery fees.
International Journal of Retail & Distribution Management, 34(4), 334-353.
39. INFOLine (2021). Отраслевой обзор "Foodtech: онлайн-торговля и службы
доставки. Рейтинг INFOLine Russia TOP online food retail. Итоги 2020 года. Vc.
83
https://vc.ru/trade/206375-infoline-onlayn-prodazhi-produktov-v-2020-godu-vyrosli-na-
314-do-135-mlrd-rubley (accessed: 10.05.2021)
40. INGATE (2020, June 17). Сервисы по доставке продуктов: реалии и перспективы.
Ingate. https://promo.ingate.ru/publications/servisy-po-dostavke-produktov/ (accessed:
10.03.2021)
41. IPSOS (2020). Динамика коронакризиса. Ipsos. https://www.ipsos.com/ru-
ru/dinamika-koronakrizisa-zdes-sobrany-vse-nashi-materialy-po-etoy-teme-upd-11-
fevralya (accessed: 02.02.2021)
42. Jiang, L. A., Yang, Z., & Jun, M. (2013). Measuring consumer perceptions of online
shopping convenience. Journal of Service management.
43. Jiang, P., & Rosenbloom, B. (2005). Customer intention to return online: price
perception, attribute‐level performance, and satisfaction unfolding over time. European
Journal of Marketing.
44. Jocoby, J. & Olson, J. C. (1977). Consumer response to price: an attitudinal, information
processing perspective. In Y. Wind and M. Greenberg (eds.), Moving Ahead with
Attitude Research, American Marketing Association, Chicago, IL,
45. Kapoor, A. P., & Vij, M. (2018). Technology at the dinner table: Ordering food online
through mobile apps. Journal of Retailing and Consumer Services, 43, 342-351.
46. Kim, E., Park, M. C., & Lee, J. (2017). Determinants of the intention to use Buy-Online,
Pickup In-Store (BOPS): The moderating effects of situational factors and product type.
Telematics and Informatics, 34(8), 1721-1735.
47. Kim, H. W., Xu, Y., & Gupta, S. (2012). Which is more important in Internet shopping,
perceived price or trust?. Electronic commerce research and applications, 11(3), 241-252.
48. Kim, M., Kim, J., Choi, J., & Trivedi, M. (2017). Mobile shopping through applications:
Understanding application possession and mobile purchase. Journal of Interactive
Marketing, 39, 55-68.
49. Kline, R. (2011). Convergence of structural equation modeling and multilevel modeling.
The SAGE handbook of innovation in social research methods (pp. 562-589). SAGE
Publications
50. Kotler, P., & Armstrong, G. (2010). Principles of marketing. Pearson education.
51. Laroche, M., Bergeron, J., & Goutaland, C. (2001). A three-dimensional scale of
intangibility. Journal of Service Research, 4(1), 26-38.
52. Lee, K. C., & Kwon, S. (2008). Online shopping recommendation mechanism and its
influence on consumer decisions and behaviors: A causal map approach. Expert Systems
with Applications, 35(4), 1567-1574.

84
53. Lee, K., & Joshi, K. (2007). An empirical investigation of customer satisfaction with
technology mediated service encounters in the context of online shopping. Journal of
information technology management, 18(2), 18-37.
54. Lee, Y., & Kozar, K. A. (2012). Understanding of website usability: Specifying and
measuring constructs and their relationships. Decision support systems, 52(2), 450-463.
55. Liang, T., Lai, H. and Ku, Y. (2007). Personalised content recommendation and user
satisfaction: theoretical synthesis and empirical findings. Journal of Management
Information Systems, Vol. 23 No. 3, pp. 45-70.
56. Lin, C. C., Wu, H. Y., & Chang, Y. F. (2011). The critical factors impact on online
customer satisfaction. Procedia Computer Science, 3, 276-281.
57. Maignan, I., & Lukas, B. A. (1997). The nature and social uses of the Internet: A
qualitative investigation. Journal of Consumer Affairs, 31(2), 346-371.
58. Malhotra, N., & Birks, D., Wills, P. (2012). Marketing Research: An applied approach:
4th European Edition. Pearson education.
59. Melis, K., Campo, K., Breugelmans, E., & Lamey, L. (2015). The impact of the multi-
channel retail mix on online store choice: does online experience matter? Journal of
Retailing, 91(2), 272-288.
60. Miyazaki, A. D., & Fernandez, A. (2001). Consumer perceptions of privacy and security
risks for online shopping. Journal of Consumer affairs, 35(1), 27-44.
61. Morganosky, M. A., & Cude, B. J. (2000). Consumer response to online grocery
shopping. International Journal of Retail & Distribution Management.
62. Mortimer, G., Fazal e Hasan, S., Andrews, L., & Martin, J. (2016). Online grocery
shopping: the impact of shopping frequency on perceived risk. The International Review
of Retail, Distribution and Consumer Research, 26(2), 202-223.
63. Munson, J., Tiropanis, T., & Lowe, M. (2017). Online grocery shopping: Identifying
change in consumption practices. In International Conference on Internet Science (pp.
192-211). Springer, Cham.
64. NAFI (2020, April 10). Цифровая грамотность россиян: исследование 2020. Nafi.
https://nafi.ru/analytics/tsifrovaya-gramotnost-rossiyan-issledovanie-2020/ (accessed:
10.03.2021)
65. Oliver, R. L. (1980). A cognitive model of the antecedents and consequences of
satisfaction decisions. Journal of marketing research, 17(4), 460-469.
66. Oliver, R. L. (1981). Measurement and Evaluation of Satisfaction Processes in Retail
Settings. Journal of Retailing, 57(3), 25-48.
85
67. Oliver, R. L. (1997). Satisfaction: a behavioural perspective on the customer. McGraw-
Hill, New York
68. Oliver, R. L., & Swan, J. E. (1989). Equity and disconfirmation perceptions as influences
on merchant and product satisfaction. Journal of consumer research, 16(3), 372-383.
69. Online Retail Association (2019). Аналитика по рынку e-commerce в России 2018.
Akit. https://yadi.sk/i/0fF9iSibAkpUnw (accessed: 28.11.2020)
70. Online Retail Association (2020). Рынок интернет-торговли в России. Результаты
2019 года. Akit. https://www.akit.ru/wp-content/uploads/2020/08/Аналитика-2019.pdf
(accessed: 28.11.2020)
71. Online Retail Association (2021). Рынок интернет-торговли в России. Итоги 2020
года. Akit. https://akit.ru/wp-content/uploads/2021/02/Аналитика-АКИТ-2020.pdf
(accessed: 25.02.2021)
72. Pappas, I. O., Pateli, A. G., Giannakos, M. N., & Chrissikopoulos, V. (2014). Moderating
effects of online shopping experience on customer satisfaction and repurchase intentions.
International Journal of Retail & Distribution Management.
73. Park, C. H., & Kim, Y. G. (2006). The effect of information satisfaction and relational
benefit on consumers' online shopping site commitments. Journal of Electronic
Commerce in Organizations (JECO), 4(1), 70-90.
74. Park, J. Y., & Thangam, D. (2019). What Makes Customers Repurchase Grocery
Products from Online Stores in Korea. International Journal of E-Business Research
(IJEBR), 15(4), 24-39.
75. Pozzi, A. (2012). Shopping cost and brand exploration in online grocery. American
Economic Journal: Microeconomics, 4(3), 96-120.
76. PPC.World (2019, May 20). Интернет-покупатели в возрасте 14-25 лет: сейчас и
через пять лет. Ppc.world. https://ppc.world/articles/internet-pokupateli-v-vozraste-14-
25-let-seychas-i-cherez-pyat-let/ (accessed: 10.03.2021)
77. Prasetyo, Y. T., & Fuente, D. G. D. D. (2020, September). Determinant Factors Affecting
Customer Satisfaction among Filipinos in Lazada Online Shopping during COVID-19
Pandemic: A Structural Equation Modeling Approach. In 2020 7th International
Conference on Frontiers of Industrial Engineering (ICFIE) (pp. 48-52). IEEE.
78. Prasetyo, Y. T., Tanto, H., Mariyanto, M., Hanjaya, C., Young, M. N., Persada, S. F., ...
& Redi, A. A. N. P. (2021). Factors affecting customer satisfaction and loyalty in online
food delivery service during the covid-19 pandemic: Its relation with open innovation.
Journal of Open Innovation: Technology, Market, and Complexity, 7(1), 76.

86
79. PWC (2019). Global Consumer Insight survey: Russia. Pwc.
https://www.pwc.ru/en/retail-consumer/publications/gcis-2019-en.pdf (accessed:
03.06.2020)
80. PWC (2020). The consumer transformed. https://www.pwc.ru/en/retail-
consumer/publications/assets/pwc-global-customer-insights-survey-2020-russia-en.pdf
(accessed: 02.02.2021)
81. Rafiq, M., & Fulford, H. (2005). Loyalty transfer from offline to online stores in the UK
grocery industry. International Journal of Retail & Distribution Management.
82. Ramus, K. and Asger Nielsen, N. (2005), Online grocery retailing: what do consumers
think? Internet Research, Vol. 15 No. 3, pp. 335-352.
83. Rita, P., Oliveira, T., & Farisa, A. (2019). The impact of e-service quality and customer
satisfaction on customer behavior in online shopping. Heliyon, 5(10), e02690.
84. Robinson, H., Dall'Olmo Riley, F., Rettie, R., & Rolls-Willson, G. (2007). The role of
situational variables in online grocery shopping in the UK. The Marketing Review, 7(1),
89-106.
85. Rowley, J. (2000). Product searching with shopping bots. Internet Research. Vol. 10 No.
3, pp. 203-14.
86. Rusopros (2020). Исследование доставки продуктов. Rus-opros. https://rus-
opros.com/about/articles/dostavka-produktov/ (accessed: 10.03.2021)
87. Sánchez‐García, I., Pieters, R., Zeelenberg, M., & Bigné, E. (2012). When satisfied
consumers do not return: variety seeking's effect on short‐and long‐term intentions.
Psychology & Marketing, 29(1), 15-24.
88. Schoenbachler, D. D. and Geoffrey L. G. (2002). Multi-Channel Shopping:
Understanding What Drives Channel Choice. Journal of Consumer Marketing, 19 (1),
42–53.
89. Sharma, G., & Lijuan, W. (2015). The effects of online service quality of e-commerce
Websites on user satisfaction. The Electronic Library.
90. Singh, R., & Söderlund, M. (2020). Extending the experience construct: an examination
of online grocery shopping. European Journal of Marketing.
91. Souitaris, V., & Balabanis, G. (2007). Tailoring online retail strategies to increase
customer satisfaction and loyalty. Long range planning, 40(2), 244-261.
92. Sreeram, A., Kesharwani, A., & Desai, S. (2017). Factors affecting satisfaction and
loyalty in online grocery shopping: an integrated model. Journal of Indian Business
Research.
87
93. Statista (2019). Share of online grocery penetration worldwide in 2016, by country.
Statista. https://www.statista.com/statistics/1042779/worldwide-share-online-grocery-
penetration-by-country/#statisticContainer (accessed: 28.11.2020)
94. Statista (2020, December). Retail e-commerce sales worldwide from 2014 to 2023.
Statista. https://www.statista.com/statistics/379046/worldwide-retail-e-commerce-sales/
(accessed: 03.06.2020)
95. Szymanski, D.M. & Hise, R.T. (2000) E-satisfaction: an initial examination. Journal of
Retailing, 76, 309–322.
96. Tandon, U., Kiran, R., & Sah, A. (2017). Analyzing customer satisfaction: users
perspective towards online shopping. Nankai Business Review International.
97. Tandon, U., Kiran, R., & Sah, A. N. (2018). The influence of website functionality,
drivers and perceived risk on customer satisfaction in online shopping: an emerging
economy case. Information Systems and e-Business Management, 16(1), 57-91.
98. Thirumalai, S., & Sinha, K. K. (2009). Customization strategies in electronic retailing:
Implications of customer purchase behavior. Decision Sciences, 40(1), 5-36.
99. Tran, V. D. (2020). The relationship among product risk, perceived satisfaction and
purchase intentions for online shopping. The Journal of Asian Finance, Economics, and
Business, 7(6), 221-231.
100. UNCTAD (2021, May 3). Online retail sales, selected economies, 2018-2020. Unctad.
https://unctad.org/press-material/global-e-commerce-jumps-267-trillion-covid-19-
boosts-online-retail-sales (accessed: 10.05.2021)
101. Vc.ru (2019). На чём зарабатывают сервисы по доставке продуктов и когда этот
бизнес станет прибыльным в России. Vc.ru. https://vc.ru/food/65111-na-chem-
zarabatyvayut-servisy-po-dostavke-produktov-i-kogda-etot-biznes-stanet-pribylnym-
v-rossii (accessed: 10.03.2021)
102. Venkatesh, V., Morris, M. G., Davis, G. B., & Davis, F. D. (2003). User acceptance of
information technology: Toward a unified view. MIS quarterly, 425-478.
103. Venkatesh, V., Thong, J. Y., & Xu, X. (2012). Consumer acceptance and use of
information technology: extending the unified theory of acceptance and use of
technology. MIS quarterly, 157-178.
104. Verhoef, P. C., & Langerak, F. (2001). Possible determinants of consumers’ adoption
of electronic grocery shopping in the Netherlands. Journal of Retailing and Consumer
Services, 8(5), 275-285.
88
105. Wells, J. D., Valacich, J. S., & Hess, T. J. (2011). What signal are you sending? How
website quality influences perceptions of product quality and purchase intentions. MIS
quarterly, 373-396.
106. Wolfinbarger, M., & Gilly, M. C. (2001). Shopping online for freedom, control, and
fun. California management review, 43(2), 34-55.
107. Wolfinbarger, M., & Gilly, M. C. (2003). eTailQ: dimensionalizing, measuring and
predicting etail quality. Journal of retailing, 79(3), 183-198.
108. Wu, K. W. (2011). Customer loyalty explained by electronic recovery service quality:
Implications of the customer relationship re-establishment for consumer electronics e-
tailers. Contemporary Management Research, 7(1).
109. Yandex (2020, June). FMCG: эффекты самоизоляции. Yandex.
https://yandex.ru/adv/solutions/analytics/fmcg-effekty-samoizolyatsii (accessed:
28.11.2020)
110. Yi, Y., & La, S. (2004). What influences the relationship between customer satisfaction
and repurchase intention? Investigating the effects of adjusted expectations and
customer loyalty. Psychology & Marketing, 21(5), 351-373.
111. Yu, U. J., Lee, H. H., & Damhorst, M. L. (2012). Exploring multidimensions of product
performance risk in the online apparel shopping context: Visual, tactile, and trial risks.
Clothing and Textiles Research Journal, 30(4), 251-266.
112. Zhou, T., Lu, Y., & Wang, B. (2009). The relative importance of website design quality
and service quality in determining consumers’ online repurchase behavior. Information
Systems Management, 26(4), 327-337.