Embed Size (px)
Citation preview
Indian Council of Forestry Research and EducationNew Forest, Dehradun-248006, India
Drivers of Deforestation and Forest Degradation in Mizoram


Indian Council of Forestry Research and EducationP. O. New Forest, Dehradun-248006 (INDIA)
2017
Drivers of Deforestation and Forest Degradation in Mizoram

©ICFRE, 2017
Published by: Biodiversity and Climate Change Division Directorate of ResearchIndian Council of Forestry Research and EducationP.O. New Forest, Dehradun – 248006 (Uttarakhand), INDIA
ISBN: 978-81-936157-0-6
Contributors:V.R.S. Rawat, Assistant Director General (Biodiversity and Climate Change), ICFREDr. R.S. Rawat, Scientist ‘D’, Biodiversity and Climate Change Division, ICFREDr. Nemit Verma, Consultant, Biodiversity and Climate Change Division, ICFRE
Citation:Rawat, V.R.S., Rawat, R.S., Verma, N. (2017). Drivers of Deforestation and Forest Degradation in Mizoram. Indian Council of Forestry Research and Education, Dehradun (INDIA).

Foreword
MkW- lqjs'k xSjksyk] Hkk-o-ls-Dr. Suresh Gairola, IFS
egkfuns'kdHkkjrh; okfudh vuqla/kku ,oa f'k{kk ifj"kn~
Mkd?kj U;w QkWjsLV] nsgjknwu&248006(vkbZ-,l-vks- 9001%2008 izekf.kr laLFkk)
Director GeneralIndian Council of Forestry Research and Education
P. O. New Forest, Dehradun – 248006(An ISO 9001:2008 Certified Organisation)
Globally, role of forests is well recognized as low cost carbon mitigation option along with significant co-benefits. REDD+ is one of the climate change mitigation actions in developing countries relating to reducing emissions
from deforestation and forest degradation, role of conservation, sustainable management of forests and enhancement of forest carbon stocks. Currently REDD+ is under different phases of implementation in developing countries at national as well as sub national level for getting financial incentives under different REDD+ mechanisms.
India is among the few developing countries where forests are net sink of greenhouse gases and the trend is likely to move upwards with more and more carbon is getting locked in forests and also in the tree outside forest. India’s efforts in forest conservation have helped in sequestering the substantial amount of carbon. India can rightfully claim the financial benefits by giving the comprehensive shape to the mitigation actions in the forest sector by way of implementation of REDD+.
Indian Council of Forestry Research and Education (ICFRE) is proactive in the field of forest and climate change. It is significantly contributing to relevant climate change mitigation and adaptation issues in the forestry at national and international level. ICFRE is providing continuous technical support to the Ministry of Environment, Forest and Climate Change, Government of India for implementing REDD+ at national level. Besides this, ICFRE is regularly conducting capacity building programmes for the officers of the Indian Forest Service on climate change and REDD+ issues.
ICFRE in collaboration with International Centre for Integrated Mountain Development is implementing a project titled ‘REDD+ Himalayas: Developing and using experience in implementing REDD+ in the Himalayas’. The study report “Drivers of deforestation and forest degradation in Mizoram” brought under aforesaid project has highlighted the importance of different drivers of deforestation and forest degradation in the project area which will be helpful in framing the strategy for addressing the drivers of deforestation and forest degradation, state REDD+ action plan and further implementation of REDD+ in the North-Eastern parts of the country. I compliment the officers and staff of Biodiversity and Climate Change Division, Directorate of Research, ICFRE for bringing out this study report under above mentioned project.
(Dr. Suresh Gairola)


Preface
In the Himalayan Region, local communities are highly dependent on forest resources for their livelihood support
and other day to day needs of fodder and fuel wood etc. Local communities of the Himalayan states are involved
in managing the forests (van panchayat and community forest) under their control. However, forests in this part are
under different stage of degradation due to various direct and indirect drivers of deforestation and forest degradation.
Identification of area specific and comprehensive analysis of the drivers of deforestation and forest degradation is
required to complete the REDD+ readiness process.
Indian Council of Forestry Research and Education in collaboration with International Centre for Integrated Mountain
Development is implementing a project “REDD+ Himalayas: Developing and using experience in implementing
REDD+ in the Himalayas” in the state of Mizoram. Identification of the drivers of deforestation and forest degradation
is one of the activities under this project. This study will be helpful for preparing a strategy document for addressing the
drivers of deforestation and forest degradation. The study report on “Drivers of Deforestation and Forest Degradation in
Mizoram” has highlighted various direct and indirect drivers responsible for forest degradation in the state of Mizoram.
This report will also provide the reference and baseline information to estimate the effectiveness of a particular activity
for addressing the drivers of deforestation and forest degradation.
Financial support provided by ICIMOD, GIZ and BMUB (Federal Ministry for the Environment, Nature Conservation,
Building and Nuclear Safety) for implementing this collaborative project in trans-boundary landscape is highly
acknowledged. Guidance and support provided by Director General, ICFRE and Dy. Director General (Research), ICFRE
for implementing the aforesaid project are gratefully acknowledged. We are thankful to ICIMOD for reviewing this
report. We take this opportunity to offer our sincere thanks to all the officers, scientists and staff of Biodiversity and
Climate Change Division, Directorate of Research, ICFRE who are directly or indirectly involved towards preparation
of this report.
Contributors REDD+ Himalayas Project
ICFRE, Dehradun

S. No. Contents Page No.
Abbreviations Used
Executive Summary
1 Introduction1.1 Background
1.2 Drivers of Deforestation and Forest Degradation
1.3 REDD+ Himalayas: Developing and Using Experience in implementing REDD+ in Himalayas
1-41
2
4
2 Characteristics of Mizoram State2.1 Introduction
2.2 Climatic Conditions
2.3 Land Tenure System
2.4 Shifting Cultivation
2.5 Other Sources of Income
2.6 Forests of Mizoram
2.7 Demography of Mizoram State
2.8 Project Area
5-125
5
6
6
7
10
11
11
3 Methodology and Site Description3.1 Designing of Questionnaire
3.2 Sampling Method
13-1413
13
4 Identification of Drivers of Deforestation and Forest Degradation4.1 Forest Degradation and Statement of the Problem
4.2 Forest Type of Project Area
4.3 Drivers of Deforestation and Forest Degradation
4.4 Socio-economic profile highlighting the drivers of deforestation and forest degradation in study area
4.5 Source of Energy
4.6 Dependency on Forest Produces
4.7 Gender and Governance
4.8 Significant contribution of each drivers of forest degradation on people’s perception
15-3115
17
18
19
23
26
27
28
References 33-34Annexure-I : Questionnaire for Socio-Ecological Survey of Forest Adjoining Village 35Annexure-II: List of Respondents 41
Contents


Abbreviations UsedAFOLU : Agriculture, Forestry and Other Land UseBDA : Bamboo Development AgencyBMUB : Federal Ministry for the Environment, Nature Conservation, Building and Nuclear SafetyCF : Community ForestCOP : Conference of PartiesFREL : Forest Reference Emission LevelFRL : Forest Reference LevelGCF : Green Climate FundGIZ : Deutsche Gessellschaft fur Internationale Zusammenarbeitha : HectareHH : HouseholdICFRE : Indian Council of Forestry Research and EducationICIMOD : International Centre for Integrated Mountain DevelopmentIPCC : Intergovernmental Panel on Climate ChangeISFR : India State of Forest Reportkm : KilometerLPG : Liquefied Petroleum GasMoEF&CC : Ministry of Environment, Forest and Climate ChangeMRV : Measuring, Reporting and VerificationNAP : National Afforestation ProgrammeNFMS : National Forest Monitoring SystemNGOs : Non Governmental OrganizationsNLUP : New Land Use PolicyNBM : National Bamboo MissionREDD : Reducing Emissions from Deforestation and Forest DegradationREDD+ : Reducing emissions from deforestation and forest degradation, and role of conservation, sustainable
management of forests and enhancement of forest carbon stocksSFD : State Forest Departmentsq : SquareUNFCCC : United Nations Framework Convention on Climate ChangeVC : Village CouncilYMA : Young Mizo Association


Executive Summary
Globally, REDD+ has become an important initiative to mitigate climate change by incentivizing the developing countries for reducing emission through addressing deforestation, forest degradation and capturing forest carbon through various forest conservation activities and policy measures. It aims to lower the rate of deforestation and forest degradation as well as to sequester more carbon with the active involvement of the local communities in sustainable management of forests. In the Himalayan region, local communities are dependent on forest resources for their livelihoods and the countries are taking serious steps to adopt various REDD+ activities for the effective implementation of REDD+ at national as well as sub-national level.
India is one of the few countries with a documented forest policy since 1894. The first forest policy of independent India came in 1952, and it recognized the need of forest conservation and also emphasized the role of forests for meeting needs of industry and society. National Forest Policy of 1988 emphasizes that derivation of direct economic benefits from natural forests is to be subordinated to the principal aim of maintaining ecological balance. The concept of joint forest management (JFM) in India is a step towards the conversion of low-productivity forests to productive forests. Improving the stocking of poorly stocked forests will also increase carbon stocks in turn. Currently, JFM covers approximately 30% of the total forest area of the country. According to the series of India State of Forest Reports (ISFR) by Forest Survey of India (FSI), total forest area of the country is increasing since 2005.
In context to support REDD+ at country level, Government of India is in the process of developing its National Strategy and Action Plan for REDD+. Ministry of Environment, Forest and Climate Change has prepared a draft National REDD+ Policy and Strategy with the broad objectives to create REDD+ architecture at National and Sub-National levels. The draft National REDD+ Strategy lays emphasis on developing a robust REDD+ framework at national level through establishing a National REDD+ Authority. Implementation of REDD+ aims at improving the livelihood of forest dependent communities along with improving the quality of forest. Active involvement of relevant stakeholders at regional level will help in addressing drivers of deforestation and forest degradation which eventually improves the quality of forest ecosystem.
Indian Council of Forestry Research and Education (ICFRE) is involved in the implementation and piloting of REDD+ at regional level in different landscapes. As a part of REDD+ implementation, ICFRE in collaboration with International Centre for Integrated Mountain Development (ICIMOD), Kathmandu, Nepal is developing and implementing REDD+ project in Mizoram, which focuses on trainings, technology sharing and knowledge dissemination in context of REDD+ in northeast region of the country. A study to identify the drivers of deforestation and forest degradation was conducted in REDD+ project area of Mamit District in Mizoram.
During the interaction with local communities, it has been observed that shifting cultivation and fuel wood collection are the major drivers of forest degradation in

Drivers of Deforestation and Forest Degradation in Mizoram Executive Summary
xii Indian Council of Forestry Research and Education
the region. Shifting cultivation has a major contribution towards the economic status of local community and 70% of the population of the region is involved in this practice. The per capita per day consumption of fuel wood in the region is estimated to be 31.42 kg causing loss of forest resources. Along with the shifting cultivation and fuel wood collection there are certain other indirect drivers (excessive exploitation of non-timber forest products, unemployment, lack of industries, connectivity of roads, lack of knowledge and awareness) of forest degradation.
Activities like restoration of shifting farms patches, introduction of horticultural cash crops, terrace farming, shaded coffee plantation, development of entrepreneurship, handicraft industry, introduction of fuel efficient cook stoves, employment generation opportunities and regular supply of LPG can directly improve the living standards as well as economic well being of local communities in the state and will also be helpful in checking the forest degradation in the region.
Bamboo forest (Melocanna baccifera: Muli bamboo) in Mizoram

Introduction 1
1.1 Background
Globally, deforestation and forest degradation has become one of the major causes of greenhouse gas (GHG) emissions besides burning of fossil fuels. According to fifth assessment report of Intergovernmental Panel on Climate Change (IPCC), annual greenhouse gas emission flux from land use, land-use change and forestry activities accounted for approximately 4.3-5.5 GtCO2eq/yr or about 9-11% of total anthropogenic greenhouse gas emissions (Smith et al.,2014). The overall contribution from agriculture forestry and other land use (AFOLU) sector is around one quarter of the global anthropogenic greenhouse gas emissions. Broadly forests are known as source as well as sink of carbon. Deforestation and forest degradation leads to the release of carbon in the form of carbon dioxide which has been stored in the tree biomass. Therefore, in order to address the deforestation and forest degradation as a part of integrated strategy to reduce global GHG emissions the concept of ‘REDD (reducing emissions from deforestation and forest degradation in developing countries)’ as climate change mitigation option was first introduced in 11th session of Conference of Parties of United Nation Framework Convention on Climate Change (UNFCCC) at Montreal in 2005.
Further in 13th session of COP of UNFCCC at Bali in 2007, India proposed for inclusion of conservation
efforts and increment of forest cover to compensate the countries for maintaining and increasing their forest’s carbon pools by means of strong conservation efforts as well as enhancement in forest cover and this approach later become the “+” part of the REDD mechanism in UNFCCC. The Para1b (iii) of Bali Action Plan is known as REDD+ which states that the “Policy approach and positive incentive on issues relating to reducing emissions from deforestation and forest degradation in developing countries and the role of conservation, sustainable management of forests and enhancement of forest carbon stocks in developing countries”. The Bali Action Plan also recognizes “the complexity of the problem, different national circumstances and the multiple drivers of deforestation and forest degradation” (Rawat and Kishwan, 2008).
Understanding drivers of deforestation and forest degradation is fundamental for the development of policies and measures that aim to alter current trends in forest activities toward a more climate and biodiversity friendly outcomes. In 15th session of COP, decision 4/CP.15 encourages the Non-Annex countries “to identify drivers of deforestation and forest degradation resulting in emissions and also the means to address these and to identify activities within the country that result in reduced emissions and increased removals,
1 https://unfccc.int/resource/docs/2010/cop16/eng/07a01.pdf
2 Indian Council of Forestry Research and Education
Drivers of Deforestation and Forest Degradation in Mizoram Introduction
and stabilization of forest carbon stocks”. Further the issue of identifying drivers and activities causing change in forest carbon stock in context of monitoring and implementation of REDD+ at national level had received attention during the 16th session of COP at Cancun in 2010. Decision 1/CP.16 paragraph 70 of Cancun Agreement1 encouraged developing countries parties to contribute to mitigate actions in the forest sector by undertaking the following activities, as deemed appropriate by each party and in accordance with their respective capabilities and national circumstances:
(a) Reducing emissions from deforestation
(b) Reducing emissions from forest degradation
(c) Conservation of forest carbon stocks
(d) Sustainable management of forest
(e) Enhancement of forest carbon stocks
COP decision further request the developing country Parties to develop the following elements:
(a) A National REDD+ Strategy or Action Plan.
(b) A National Forest Reference Emission Level (FREL) or Forest Reference Level (FRL) or if appropriate interim measure, subnational forest reference emission levels/or forest reference levels.
(c) A robust and transparent National Forest Monitoring System (NFMS) for the monitoring and reporting of REDD+ activities, if appropriate, subnational monitoring and reporting as an interim measure.
(d) A system for providing information on how the safeguards are being addressed and respected throughout the implementation of the REDD+ activities while respecting sovereignty.
In order to achieve the above REDD+ element the initial step is to understand the drivers of deforestation and forest degradation at regional as well as national level. To design effective REDD+ policy, national REDD+ strategy and implementation plans there is a need to assess the forest dynamics (Boucher et al., 2011; Rudorff et al., 2011). Forest reference levels (FRL) can be estimated, if drivers as well as the activities addressing the drivers of deforestation and forest degradation are identified at regional level (Huettner et al., 2009). As a result, for implementation of REDD+ activities, there is a need of database at regional as well as country level on drivers of deforestation and forest degradation along with the information on change in forest cover and forest carbon stocks.
1.2 Drivers of Deforestation and Forest Degradation
The forest dynamics and transitions can be studied well by understanding the drivers of deforestation and forest degradation at regional as well as national level. Depending upon the causes there are two different types of the drivers i.e. proximate/direct drivers and underlying/indirect drivers. Proximate/direct drivers of deforestation are anthropogenic activities that directly affect the loss of forest, which can be grouped into different categories such as agriculture expansion, expansion of infrastructure and wood extraction (Geist and Lambin, 2001). Agricultural expansion has been identified as a key driver of deforestation in the tropics (Gibbs et al., 2010), drivers vary regionally and temporally (Rudel et al., 2009; Boucher et al.,
2011). Development and implementation of policies specifically addressing the issues of livelihood of forest dependent communities and protection of environment can play an important role in conservation of forests.
Globally, over a period of 130 years i.e. from 1850 to 1980, it was found that about 15% of the world’s forest and forest resources were cleared out of which 43% constitute from Asia (Sharma et al., 1992 and WRI, 1987). According to the latest India State Forest Report, 2015 (FSI, 2015) there is the decrease of 628 sq km of forest area in the region as compared to India State of Forest Report, 2013. Socio economic conditions at national or sub-national level and structural problems

Indian Council of Forestry Research and Education 3
Drivers of Deforestation and Forest Degradation in Mizoram Introduction
related to the international economic regime are the major causes of the forest degradation particularly in the developing countries (Tarasofsky, 1995).
Hence to overcome the impact of direct and indirect drivers on landuse and forestry, the Parties to the UNFCCC agreed a package of decisions on financial mechanism and methodological guidance for REDD+ in COP 19 at Warsaw also known as “Warsaw Framework for REDD+”. COP decision for REDD+ finance says “result based finance provided to developing country Parties for implementation of REDD+ activities” which may come from variety of sources, public and private, bilateral and multilateral, including alternative sources. Decision 9/CP.19 encourages entities financing the REDD+ activities through wide variety of sources, including the Green Climate Fund (GCF) in a key role, to collectively channel adequate and predictable result-based finance in a fair and equitable manner, taking in account different approaches2.
For addressing the drivers of deforestation and forest degradation the decision 15/CP.19 encourages all parties, relevant organizations, private sector and other relevant stakeholders to take activities and to continue their work to address drivers of deforestation and forest degradation and further encourages developing country parties to take note of the information shared as a result of their work3.
Further in COP 22 at Paris in 2015, Parties recognized the role of forests as carbon sink for mitigation of climate change and devoted a whole section (Article 5 of Paris Agreement) to REDD+. Article 5 encourages all parties from developed as well as developing countries, to take action to conserve and enhance sinks and reservoirs of greenhouse gases including forests. It also encourages countries to take action towards the implementation of REDD+ activities through results based payments4.
Box 1. Drivers of Deforestation and Forest Degradation
2 http://unfccc.int/land_use_and_climate_change/redd/items/8180.php).3 http://redd.unfccc.int/fact-sheets/unfccc-documents-relevant-for-redd.html?decId=13&print=14 hhttps://unfccc.int/resource/docs/2015/cop21/eng/l09r01.pdf

4 Indian Council of Forestry Research and Education
Drivers of Deforestation and Forest Degradation in Mizoram Introduction
1.3 REDD+ Himalayas: Developing and Using Experience in Implementing
REDD+ in Himalayas
In 2015, ICIMOD-GIZ has initiated a programme on ‘REDD+ Himalayas: Developing and using experience in implementing REDD+ in Himalayas’ to build the capacity of REDD+ focal points in transboundary landscapes of India, Nepal, Bhutan and Myanmar.
In Indian part, with active collaboration of ICFRE, REDD+ capacity building is being focused on North-East. The programme will assist developing and implementing of REDD+ projects which will focus on trainings, technology sharing and knowledge dissemination. The broad objectives of the programme are:
• Development of methods for calculating, modeling and forecasting carbon storage.
• Developing instruments in preparation for regional REDD+ readiness.
• In working towards harmonization in the region, an exchange of experience and mutual learning on good REDD+ implementation practices are established as South-South cooperation.
The expected output will be enhanced capacity for development and implementation of REDD+ Strategy and Action Plan at each level (community, national and sub-national /state levels) and improved understanding of scientific knowledge for precise estimation of carbon stocks. Under this project, stakeholder’s and village council member’s consultation followed by household survey was conducted for identification of drivers of deforestation and forest degradation” for implementation of REDD+ programme in Mamit District of Mizoram.
Cultivation of orange on shifting farm

Characteristics of Mizoram State 22.1 Introduction
Mizoram state is among the seven sister’s states lies in the Northeastern part of the country. Geographically it lies between 21°58’ to 24°35’N latitudes and 92°15’ to 93°29’ E longitudes. It shares interstate border with states of Assam, Manipur and Tripura along with the international borders of Myanmar and Bangladesh. Total geographical area of the state is 21,081sq km which constitutes 0.64% of the total geographical area of the country. The state has 8 districts viz. Aizawl, Champhai,
Kolasib, Lunglei, Mamit, Lawngtlai, Saiha, and Serchhip and, 23 sub-divisions. The total population of Mizoram is 10,97,206 (Census of India, 2011) with overall density of 52 persons per sq. km. Population of Mizoram has increased by 23.48% in the decade of 2001-2011 compared to preceding decade of 1991-2001. The literacy rate of the state is 91.58% which is the 3rd highest in the country.
Box-2.1
Types of land ownership in the state
• Land Settlement Certificate: Land settlement certificates are issued to the individuals who are involved in some kind of permanent farming practices i.e. terrace farming, wet rice cultivation, horticulture plantations etc.
• PeriodicPass:For the purpose of gardening or other form of cultivation over a period of 5 years and one time periodic pass is given for the individuals of the state.
• LandLeasePass: This is a temporary pass which can be issued to the Government Departments, Organizations or Corporate Bodies without any time bound limit. Hence it can be withdrawn at any time if there is any breach in their working against their rights.
• RevenuePass: This type of pass is issued to the individual for building temporary house and later on with the consent of competent authority it can be converted to land settlement certificate.
State has typical monsoon type of climate. The climate is also influenced by the periodic cyclonic disturbances, local mountains and valley breezes and extensive forest cover. The state receives rainfall from both northeast and
southwest monsoons. The climate is humid tropical, characterized by short winter, long summer and heavy rainfall. Temperature (on an average) ranges from 25°C to 30°C during summer, 18°C to 25°C in autumn and
2.2 Climatic Conditions
6 Indian Council of Forestry Research and Education
Drivers of Deforestation and Forest Degradation in Mizoram Characteristics of Mizoram State
11°C to 23°C in winter season. The average rainfall in Mizoram ranges between 200 to 300 cm per year. Generally, it rains during May to September, while July
In Mizoram, the majority of the land comes under the customary rights of the local communities which provide a significant land for shifting cultivation to the local communities. Shifting cultivation is a most common form of agriculture practice in the state. The communities involved in this practice are known as Jhumias. In every village of the Mizoram, there is Village Council (VC) which has control over the complete village land and VC allots land for shifting cultivation, for construction of houses and for taking up other farming practices etc. to
the villagers. Apart from the shifting cultivation, terrace farming is also being practiced in the state. This practice is generally being implemented on the private land i.e., the ownership of the land belong to individuals with permanent, heritable and transferable rights under the guidance of land settlement certificates. The transfer of land ownership occurs within the same tribe with the consent of the village communities. The transfer of land ownership is restricted to locals only. Outsiders are not allowed to own land in the state of Mizoram.
2.3LandTenureSystem
2.4 Shifting Cultivation
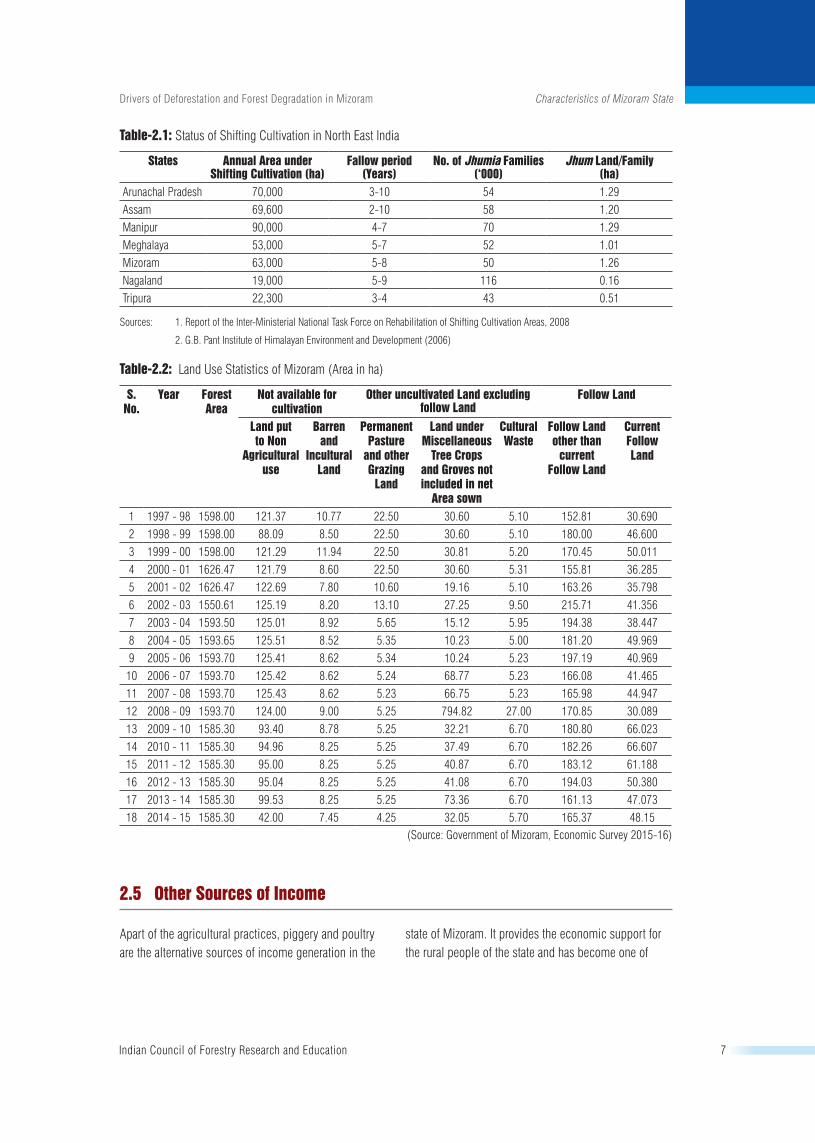
More than 60 per cent population in rural areas of Mizoram depends on the agricultural sector for their livelihood. Shifting cultivation is an age-old practice of farming in all the northeastern states of India in which each family clears a patch of forest by cutting down whatever is growing in that patch and later dry and burn whatever has been cut down on the ground. The ashes left behind act as fertilizer and this cleared and burnt patch of land is used for the cultivation of rice and other subsidiary crops such as tobacco, cotton, chilli and vegetables etc. Shifting cultivation is also known as jhum cultivation/ jhumming or slash burn agriculture practice. Over the time, the productivity of the land diminishes and left as fallow land. So a new patch of land has to be cleared and burnt year after year. This unscientific farming system has resulted in patchy deforestation, soil & nutrient loss, moisture loss, and loss of indigenous biodiversity. This has also resulted in drying up of springs and rivers as well as depletion of underground water reserves. Jhumming is mainly confined on rotational basis usually ranges from 5 to 10 years. The status of shifting cultivation in north-eastern states is given in Table-2.1.
The area allotted for jhumming in the state of Mizoram to a particular family varies from one acre to five acres depending on the family size. In this practice the
ownership and rights related to the land remain with the family for a certain period of time and after that it again comes under the control of village council. Earlier in Mizoram, around one third of the cultivated area of the state was under shifting cultivation. Economic Survey 2015-16 of Government of Mizoram highlighted that the total jhum area and the total number of jhumia families in Mizoram during 2010-11 were 28562 hectare and 68433 families, respectively. As a result of the implementation of New Land Use Policy, the total jhum area as recorded during 2014-15 is 20064 hectare which shows decrease in jhum area of about 29.75 per cent during the last 5 years. Similarly, the total number of jhumia families also decreased from 68433 families in 2010-11 to 60338 families in 2014-15 which accounts for about 11.83 per cent decrease during the last 5 years (Government of Mizoram, nd). Introduction of horticultural cash crops on shifting farms has converted the shifting farms to permanent farming lands and hence, it also becomes one of the major reasons behind reduction in total area under shifting cultivation. Now, the jhumias are growing horticultural crops like banana, orange, ginger, turmeric etc instead of traditional crops. Table-2.2 represents land use statistics of Mizoram state.
and August being the rainiest months. November to January is the dry period with minimum rainfall.
Indian Council of Forestry Research and Education 7
Drivers of Deforestation and Forest Degradation in Mizoram Characteristics of Mizoram State
Table-2.1: Status of Shifting Cultivation in North East India
States Annual Area under Shifting Cultivation (ha)
Fallow period (Years)
No. of Jhumia Families (‘000)
JhumLand/Family(ha)
Arunachal Pradesh 70,000 3-10 54 1.29Assam 69,600 2-10 58 1.20Manipur 90,000 4-7 70 1.29Meghalaya 53,000 5-7 52 1.01Mizoram 63,000 5-8 50 1.26Nagaland 19,000 5-9 116 0.16Tripura 22,300 3-4 43 0.51
Sources: 1. Report of the Inter-Ministerial National Task Force on Rehabilitation of Shifting Cultivation Areas, 2008
2. G.B. Pant Institute of Himalayan Environment and Development (2006)
Table-2.2: Land Use Statistics of Mizoram (Area in ha)
S. No.
Year Forest Area
Not available for cultivation
OtheruncultivatedLandexcludingfollowLand
FollowLand
Landputto Non
Agricultural use
Barren and
Incultural Land
Permanent Pasture
and other Grazing Land
LandunderMiscellaneous
Tree Crops and Groves not included in net
Area sown
Cultural Waste
FollowLandother than
current FollowLand
Current Follow Land
1 1997 - 98 1598.00 121.37 10.77 22.50 30.60 5.10 152.81 30.6902 1998 - 99 1598.00 88.09 8.50 22.50 30.60 5.10 180.00 46.6003 1999 - 00 1598.00 121.29 11.94 22.50 30.81 5.20 170.45 50.0114 2000 - 01 1626.47 121.79 8.60 22.50 30.60 5.31 155.81 36.2855 2001 - 02 1626.47 122.69 7.80 10.60 19.16 5.10 163.26 35.7986 2002 - 03 1550.61 125.19 8.20 13.10 27.25 9.50 215.71 41.3567 2003 - 04 1593.50 125.01 8.92 5.65 15.12 5.95 194.38 38.4478 2004 - 05 1593.65 125.51 8.52 5.35 10.23 5.00 181.20 49.9699 2005 - 06 1593.70 125.41 8.62 5.34 10.24 5.23 197.19 40.96910 2006 - 07 1593.70 125.42 8.62 5.24 68.77 5.23 166.08 41.46511 2007 - 08 1593.70 125.43 8.62 5.23 66.75 5.23 165.98 44.94712 2008 - 09 1593.70 124.00 9.00 5.25 794.82 27.00 170.85 30.08913 2009 - 10 1585.30 93.40 8.78 5.25 32.21 6.70 180.80 66.02314 2010 - 11 1585.30 94.96 8.25 5.25 37.49 6.70 182.26 66.60715 2011 - 12 1585.30 95.00 8.25 5.25 40.87 6.70 183.12 61.18816 2012 - 13 1585.30 95.04 8.25 5.25 41.08 6.70 194.03 50.38017 2013 - 14 1585.30 99.53 8.25 5.25 73.36 6.70 161.13 47.07318 2014 - 15 1585.30 42.00 7.45 4.25 32.05 5.70 165.37 48.15
(Source: Government of Mizoram, Economic Survey 2015-16)
2.5 Other Sources of Income
Apart of the agricultural practices, piggery and poultry are the alternative sources of income generation in the
state of Mizoram. It provides the economic support for the rural people of the state and has become one of

8 Indian Council of Forestry Research and Education
Drivers of Deforestation and Forest Degradation in Mizoram Characteristics of Mizoram State
the important sources of their income. Along with the economic gain from livestock, Mizoram is dominated by bamboo in terms of natural resource which has proved a major contribution towards the socio-economic development in the state and covers around 31% (about 6,446 sq.km) of its geographical area. As many as about 34 species of bamboo have been identified in the state of which Melocanna baccifera (mautak) contributes about 77% of the total area covered by bamboo (Table-2.3). Density-wise details, number of culms by soundness and equivalent green weight are given in Table-2.4.
Table-2.3: Common bamboo species of Mizoram state
S. No.
Species S. No.
Species
1 Bambusa balcooa 18 Dendrocalamus manipureanus
2 B. bambos 19 D. sikkimensis
3 B. dampeana 20 D. strictus
4 B. mizorameana 21 Melocalamus compactiflorus
5 B. multiplex 22 Melocanna baccifera
6 B. nagalandiana 23 Neomicrocalamusmannii
7 B. nutans 23 Phyllostachys edulis
8 B. tulda 25 P. manni
9 B. vulgaris 26 Schizostachyum dullooa
10 B. vulgaris var. vittata 27 S. fuchsianum
11 B. vulgaris var. waminii 28 S. mannii
12 Dendrocalamus asper 29 S. munroi
13 D. giganteus 30 S. pergracile
14 D. hamiltoni 31 S. polymorphum
15 D. hookeri 32 Sinarundinaria falcata
16 D. laetiflorus 33 S. griffithiana
17 D. longispathus 34 Thyrsostachys oliveri
(Source: Bisht, 2016)
Table-2.4: Total bamboo bearing area by density and equivalent green weight of bamboo in Mizoram state
Bamboo bearing area by density in recorded forest area (Area in Km)
Recorded Forest Area
Pure Bamboo Dense Bamboo Scattered bamboo Clumps hacked
Bamboo regeneration
No bamboo
16,717 226 6,116 2,757 104 42 7,472
Estimated number of bamboo culms and equivalent green weightNumber of culms (in millions) Equivalent Green Weight (in 000 tonnes)
Green Dry Decayed Total Green Dry Total
1953 185 67 2205 11150 2037 13187
(Source: Government of Mizoram, Economic Survey 2015-16)
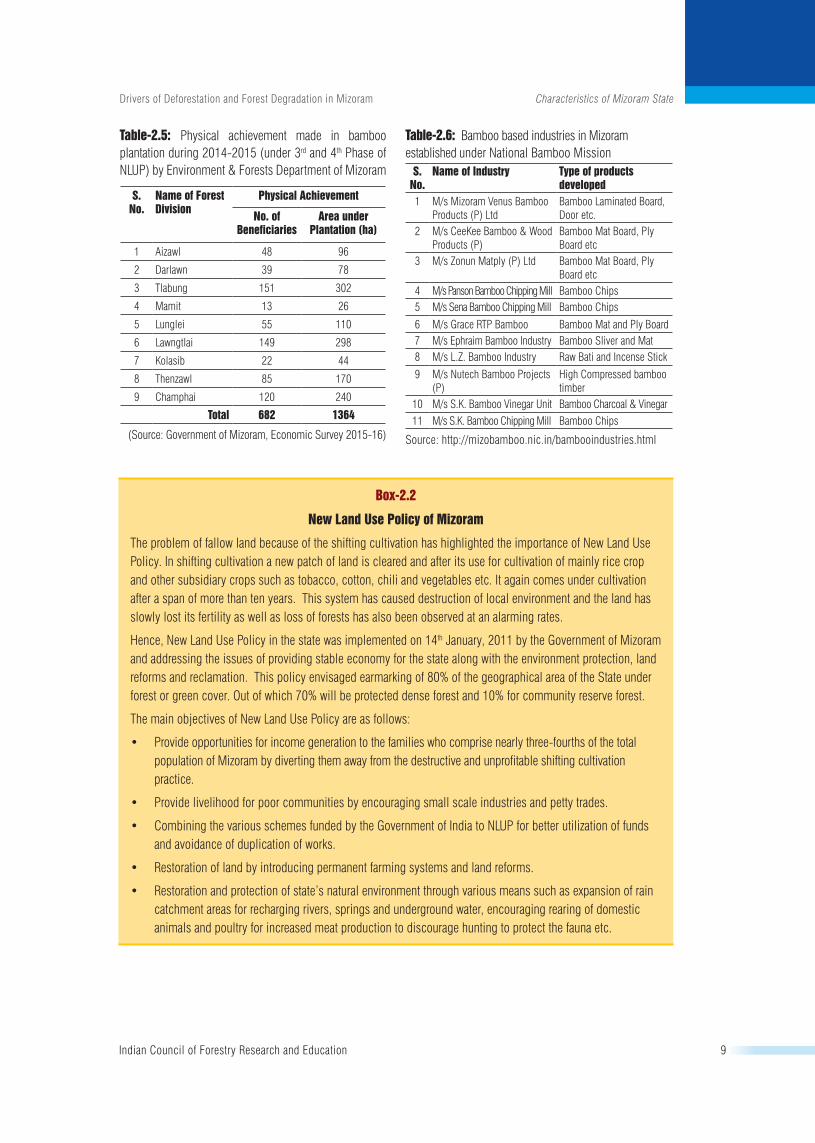
Major initiatives have been taken by the Government for improving the bamboo sector in the state. Bamboo plantations of about 1364 hectares were raised by the Environment, Forest and Climate Change Department of Mizoram Government during the years 2014-15 under the 3rd and 4th Phase of New Land Use Policy (Table-2.5). Under the National Bamboo Mission (NMB) activities for bamboo promotion in the state are taken up in both forest and non-forest areas. Forest areas come directly under the control of State Department of Environment and Forest whereas non-forest areas are handled by the Bamboo Development Agency (BDA). Table-2.6 is showing the list of bamboo based industries in the state supported by BDA.
Traditional use of bamboo as bamboo baskets and bamboo cage for birds
Indian Council of Forestry Research and Education 9
Drivers of Deforestation and Forest Degradation in Mizoram Characteristics of Mizoram State
Table-2.5: Physical achievement made in bamboo plantation during 2014-2015 (under 3rd and 4th Phase of NLUP) by Environment & Forests Department of Mizoram
S. No.
Name of Forest Division
Physical Achievement
No. of Beneficiaries
Area under Plantation (ha)
1 Aizawl 48 96
2 Darlawn 39 78
3 Tlabung 151 302
4 Mamit 13 26
5 Lunglei 55 110
6 Lawngtlai 149 298
7 Kolasib 22 44
8 Thenzawl 85 170
9 Champhai 120 240
Total 682 1364
(Source: Government of Mizoram, Economic Survey 2015-16)
Table-2.6: Bamboo based industries in Mizoram established under National Bamboo Mission
S. No.
Name of Industry Type of products developed
1 M/s Mizoram Venus Bamboo Products (P) Ltd
Bamboo Laminated Board, Door etc.
2 M/s CeeKee Bamboo & Wood Products (P)
Bamboo Mat Board, Ply Board etc
3 M/s Zonun Matply (P) Ltd Bamboo Mat Board, Ply Board etc
4 M/s Panson Bamboo Chipping Mill Bamboo Chips5 M/s Sena Bamboo Chipping Mill Bamboo Chips
6 M/s Grace RTP Bamboo Bamboo Mat and Ply Board7 M/s Ephraim Bamboo Industry Bamboo Sliver and Mat8 M/s L.Z. Bamboo Industry Raw Bati and Incense Stick
9 M/s Nutech Bamboo Projects (P)
High Compressed bamboo timber
10 M/s S.K. Bamboo Vinegar Unit Bamboo Charcoal & Vinegar11 M/s S.K. Bamboo Chipping Mill Bamboo Chips
Source: http://mizobamboo.nic.in/bambooindustries.html
Box-2.2
NewLandUsePolicyofMizoram
The problem of fallow land because of the shifting cultivation has highlighted the importance of New Land Use Policy. In shifting cultivation a new patch of land is cleared and after its use for cultivation of mainly rice crop and other subsidiary crops such as tobacco, cotton, chili and vegetables etc. It again comes under cultivation after a span of more than ten years. This system has caused destruction of local environment and the land has slowly lost its fertility as well as loss of forests has also been observed at an alarming rates.
Hence, New Land Use Policy in the state was implemented on 14th January, 2011 by the Government of Mizoram and addressing the issues of providing stable economy for the state along with the environment protection, land reforms and reclamation. This policy envisaged earmarking of 80% of the geographical area of the State under forest or green cover. Out of which 70% will be protected dense forest and 10% for community reserve forest.
The main objectives of New Land Use Policy are as follows:
• Provideopportunitiesforincomegenerationtothefamilieswhocomprisenearlythree-fourthsofthetotalpopulation of Mizoram by diverting them away from the destructive and unprofitable shifting cultivation practice.
• Providelivelihoodforpoorcommunitiesbyencouragingsmallscaleindustriesandpettytrades.
• CombiningthevariousschemesfundedbytheGovernmentofIndiatoNLUPforbetterutilizationoffundsand avoidance of duplication of works.
• Restorationoflandbyintroducingpermanentfarmingsystemsandlandreforms.
• Restorationandprotectionofstate’snaturalenvironmentthroughvariousmeanssuchasexpansionofraincatchment areas for recharging rivers, springs and underground water, encouraging rearing of domestic animals and poultry for increased meat production to discourage hunting to protect the fauna etc.
10 Indian Council of Forestry Research and Education
Drivers of Deforestation and Forest Degradation in Mizoram Characteristics of Mizoram State
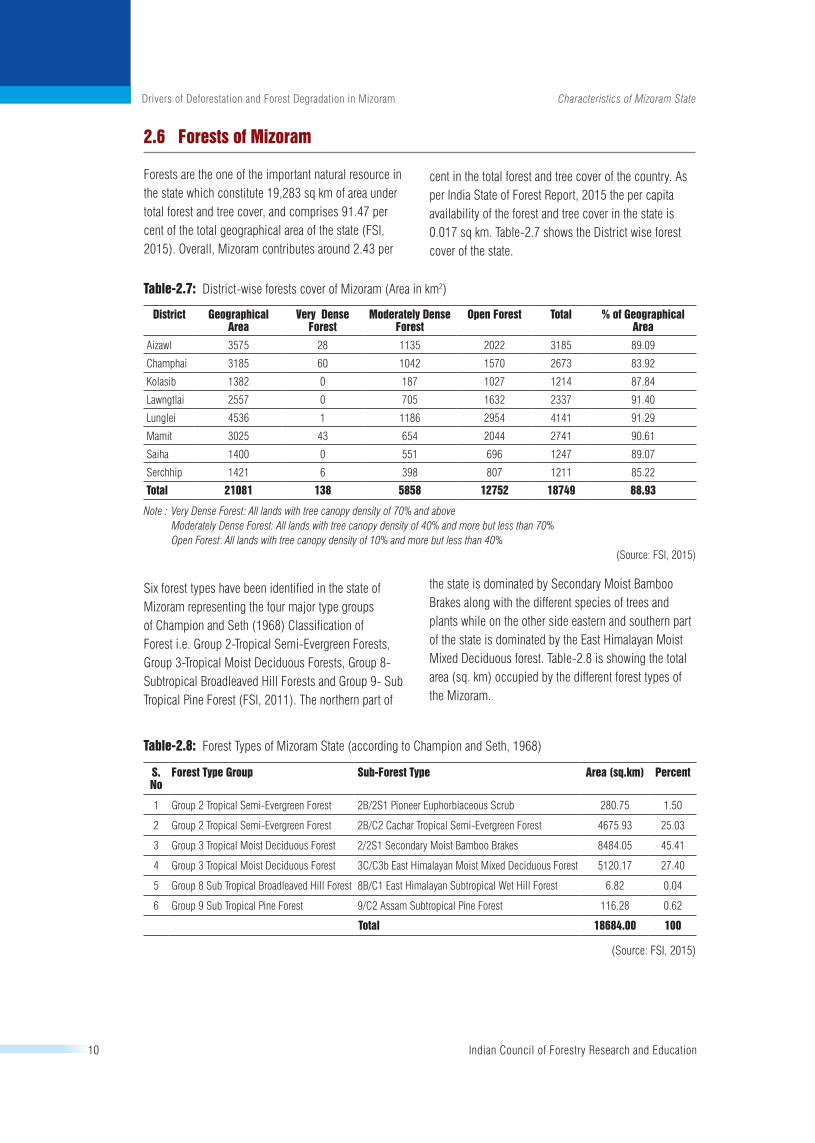
2.6 Forests of Mizoram
Forests are the one of the important natural resource in the state which constitute 19,283 sq km of area under total forest and tree cover, and comprises 91.47 per cent of the total geographical area of the state (FSI, 2015). Overall, Mizoram contributes around 2.43 per
cent in the total forest and tree cover of the country. As per India State of Forest Report, 2015 the per capita availability of the forest and tree cover in the state is 0.017 sq km. Table-2.7 shows the District wise forest cover of the state.
Table-2.7: District-wise forests cover of Mizoram (Area in km2)
District Geographical Area
Very Dense Forest
Moderately Dense Forest
Open Forest Total % of Geographical Area
Aizawl 3575 28 1135 2022 3185 89.09
Champhai 3185 60 1042 1570 2673 83.92
Kolasib 1382 0 187 1027 1214 87.84
Lawngtlai 2557 0 705 1632 2337 91.40
Lunglei 4536 1 1186 2954 4141 91.29
Mamit 3025 43 654 2044 2741 90.61
Saiha 1400 0 551 696 1247 89.07
Serchhip 1421 6 398 807 1211 85.22
Total 21081 138 5858 12752 18749 88.93
Note : Very Dense Forest: All lands with tree canopy density of 70% and above Moderately Dense Forest: All lands with tree canopy density of 40% and more but less than 70% Open Forest: All lands with tree canopy density of 10% and more but less than 40%
(Source: FSI, 2015)
Six forest types have been identified in the state of Mizoram representing the four major type groups of Champion and Seth (1968) Classification of Forest i.e. Group 2-Tropical Semi-Evergreen Forests, Group 3-Tropical Moist Deciduous Forests, Group 8- Subtropical Broadleaved Hill Forests and Group 9- Sub Tropical Pine Forest (FSI, 2011). The northern part of
the state is dominated by Secondary Moist Bamboo Brakes along with the different species of trees and plants while on the other side eastern and southern part of the state is dominated by the East Himalayan Moist Mixed Deciduous forest. Table-2.8 is showing the total area (sq. km) occupied by the different forest types of the Mizoram.
Table-2.8: Forest Types of Mizoram State (according to Champion and Seth, 1968)
S. No
Forest Type Group Sub-Forest Type Area (sq.km) Percent
1 Group 2 Tropical Semi-Evergreen Forest 2B/2S1 Pioneer Euphorbiaceous Scrub 280.75 1.50
2 Group 2 Tropical Semi-Evergreen Forest 2B/C2 Cachar Tropical Semi-Evergreen Forest 4675.93 25.03
3 Group 3 Tropical Moist Deciduous Forest 2/2S1 Secondary Moist Bamboo Brakes 8484.05 45.41
4 Group 3 Tropical Moist Deciduous Forest 3C/C3b East Himalayan Moist Mixed Deciduous Forest 5120.17 27.40
5 Group 8 Sub Tropical Broadleaved Hill Forest 8B/C1 East Himalayan Subtropical Wet Hill Forest 6.82 0.04
6 Group 9 Sub Tropical Pine Forest 9/C2 Assam Subtropical Pine Forest 116.28 0.62
Total 18684.00 100
(Source: FSI, 2015)

Indian Council of Forestry Research and Education 11
Drivers of Deforestation and Forest Degradation in Mizoram Characteristics of Mizoram State
2.7 Demography of Mizoram State
According to the Census of India 2011 the total population of Mizoram is 10,97,206. In comparison to census of India, 2001 data, the population of the state has increased by 0.209 millions in 2011. Table-2.9 represents
district wise population, decadal growth rate, sex ratio and population density of the state.
Table-2.9: District wise Population Profile of the Mizoram State in 2011
S. No. District Population Increase Sex Ratio Literacy Density(Person/km2)
1 Aizawl 400,309 22.92 % 1009 97.89 % 112
2 Lunglei 161,428 17.64 % 947 88.86 % 36
3 Champhai 125,745 16.01 % 984 95.91 % 39
4 Lawngtlai 117,894 60.14 % 945 65.88 % 46
5 Mamit 86,364 37.56 % 927 84.93 % 29
6 Kolasib 83,955 27.28 % 956 93.50 % 61
7 Serchhip 64,937 20.56 % 977 97.91 % 46
8 Saiha 56,574 -7.34 % 979 90.01 % 40
Total 1,097,206(Source: http://www.census2011.co.in/census/state/districtlist/mizoram.html)
2.8 Project Area
In consultation with the Department of Forest, Environment and Climate Change, Government of Mizoram during the inception workshop of project (REDD+ Himalayas: Developing and Using Experience in Implementing REDD+ in the Himalayas) in 2016, it was agreed to implement the project activities in the
Mamit district of Mizoram for developing a REDD+ pilot project. The project area constitutes 12 villages having 1583 households (Table-2.10) with the total population of 8174 under Mamit District. Map of project area is given in the Fig 2.1.
Table-2.10: Village wise population status under REDD+ Project Area under Mamit District
S. No. Name of Village No. of Households Total Population Male Population Female Population
1 Reiek 360 1627 786 841
2 W.Lungdar 109 668 340 328
3 Lengte 88 406 211 195
4 Nghalchawm 60 302 161 141
5 Rulpuihlim 78 392 233 159
6 Chungtlang 54 327 174 153
7 N. Kanghmun 166 858 432 426
8 Khawrihnim 128 789 401 388
9 Ailawng 104 510 267 243
10 Rawpuichhip 241 1244 620 624
11 Tuahzawl 80 381 198 183
12 Hruiduk 115 670 356 314
Total 1583 8174 4179 3995

12 Indian Council of Forestry Research and Education
Drivers of Deforestation and Forest Degradation in Mizoram Characteristics of Mizoram State
Fig. 2.1. Map of REDD+ project area in Mizoram
Methodology and Site Description 3
3.1 Designing of Questionnaire
In order to identify the different driver of deforestation and forest degradation in the project area, a detailed household survey followed by consultation with the forest department and village council members was conducted in the REDD+ project area in Mamit District of Mizoram state. To study the drivers of deforestation
and forest degradation in the state of Mizoram, a questionnaire was designed in consultation with the relevant stakeholders. The questionnaire was pre-tested in the field and after that necessary improvement was made before the actual survey conducted.
3.2 Sampling Method
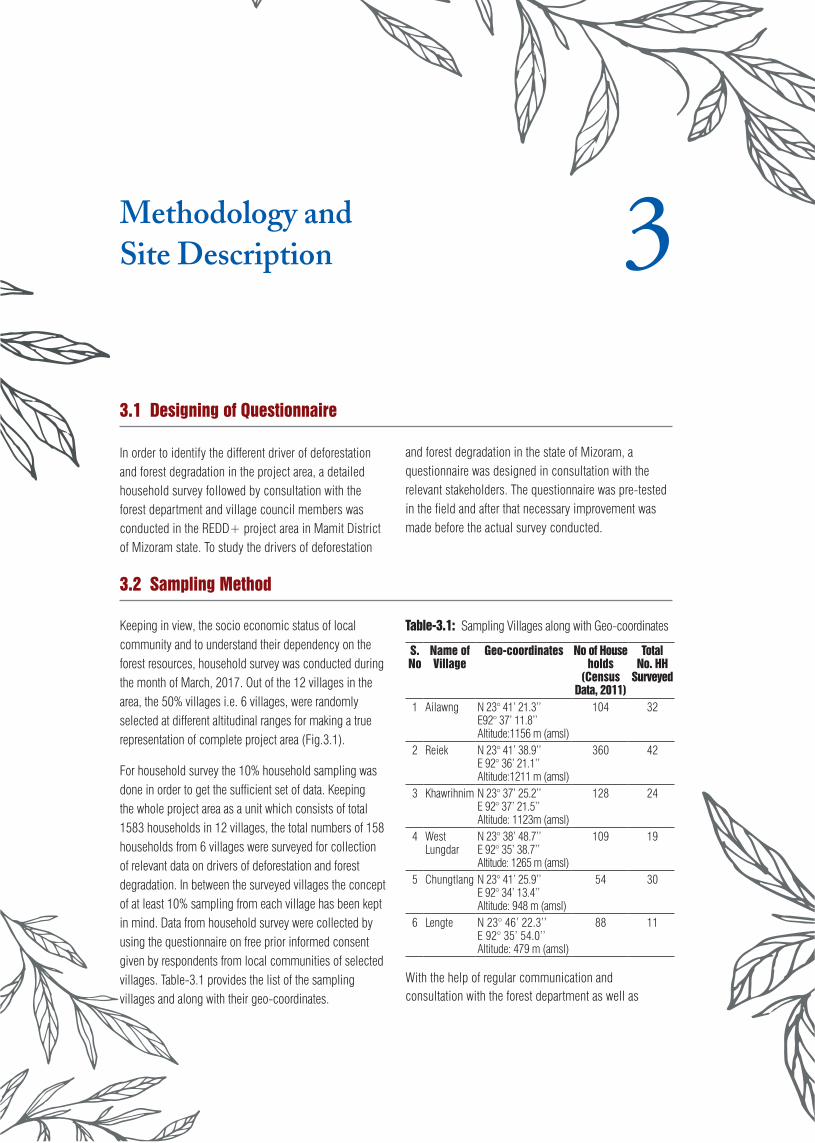
Keeping in view, the socio economic status of local community and to understand their dependency on the forest resources, household survey was conducted during the month of March, 2017. Out of the 12 villages in the area, the 50% villages i.e. 6 villages, were randomly selected at different altitudinal ranges for making a true representation of complete project area (Fig.3.1).
For household survey the 10% household sampling was done in order to get the sufficient set of data. Keeping the whole project area as a unit which consists of total 1583 households in 12 villages, the total numbers of 158 households from 6 villages were surveyed for collection of relevant data on drivers of deforestation and forest degradation. In between the surveyed villages the concept of at least 10% sampling from each village has been kept in mind. Data from household survey were collected by using the questionnaire on free prior informed consent given by respondents from local communities of selected villages. Table-3.1 provides the list of the sampling villages and along with their geo-coordinates.
Table-3.1: Sampling Villages along with Geo-coordinates
S.No
Name of Village
Geo-coordinates No of House holds
(Census Data, 2011)
Total No. HH
Surveyed
1 Ailawng N 23° 41’ 21.3’’E92° 37’ 11.8’’Altitude:1156 m (amsl)
104 32
2 Reiek N 23° 41’ 38.9’’E 92° 36’ 21.1’’Altitude:1211 m (amsl)
360 42
3 Khawrihnim N 23° 37’ 25.2’’E 92° 37’ 21.5’’Altitude: 1123m (amsl)
128 24
4 West Lungdar
N 23° 38’ 48.7’’E 92° 35’ 38.7’’Altitude: 1265 m (amsl)
109 19
5 Chungtlang N 23° 41’ 25.9’’E 92° 34’ 13.4’’Altitude: 948 m (amsl)
54 30
6 Lengte N 23° 46’ 22.3’’E 92° 35’ 54.0’’Altitude: 479 m (amsl)
88 11
With the help of regular communication and consultation with the forest department as well as
14 Indian Council of Forestry Research and Education
Drivers of Deforestation and Forest Degradation in Mizoram Methodology and Site Description
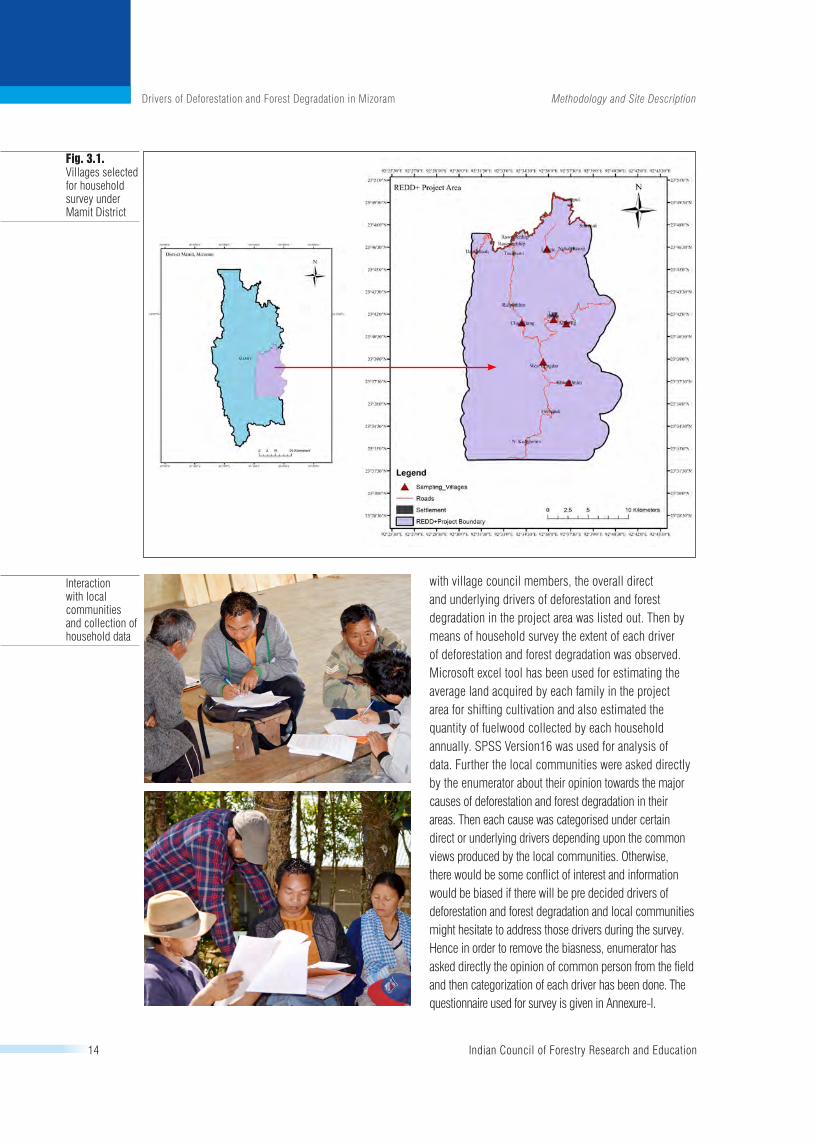
with village council members, the overall direct and underlying drivers of deforestation and forest degradation in the project area was listed out. Then by means of household survey the extent of each driver of deforestation and forest degradation was observed. Microsoft excel tool has been used for estimating the average land acquired by each family in the project area for shifting cultivation and also estimated the quantity of fuelwood collected by each household annually. SPSS Version16 was used for analysis of data. Further the local communities were asked directly by the enumerator about their opinion towards the major causes of deforestation and forest degradation in their areas. Then each cause was categorised under certain direct or underlying drivers depending upon the common views produced by the local communities. Otherwise, there would be some conflict of interest and information would be biased if there will be pre decided drivers of deforestation and forest degradation and local communities might hesitate to address those drivers during the survey. Hence in order to remove the biasness, enumerator has asked directly the opinion of common person from the field and then categorization of each driver has been done. The questionnaire used for survey is given in Annexure-I.
Fig. 3.1. Villages selected for household survey under Mamit District
Interaction with local communities and collection of household data

Identification of Drivers of Deforestation and Forest Degradation
4
4.1 Forest Degradation and Statement of the Problem
Forest ecosystem plays an important role in providing various environmental benefits and life support systems to maintain the ecological balance between various anthropogenic activities and natural phenomenon. Carbon sequestration, nutrient cycling, watershed protection, abatement of pollution along with the micro-climatic regulation are the important processes provided by the forests of a particular area towards its environmental benefits. Broadly the term “degradation of forests” has
been emerged as a result of various anthropogenic activities that contribute towards deteriorating the quality of forests. A clearing of forest was not only confined to the settlement of villages but also used for the cultivation and expansion of pastures. Further it has caused over exploitation of land, water resources etc. and ultimately disturbs the quality of a forests locally. Hence the extent of forest degradation can be easily observed at the regional level (Hosonuma et al., 2012).
Fig. 4.1. Trend in forest cover of India (sq km) since 2005
(Source: FSI, 2005; 2009; 2011; 2013; 2015)
16 Indian Council of Forestry Research and Education
Drivers of Deforestation and Forest Degradation in Mizoram Identification of Drivers of Deforestation and Forest Degradation
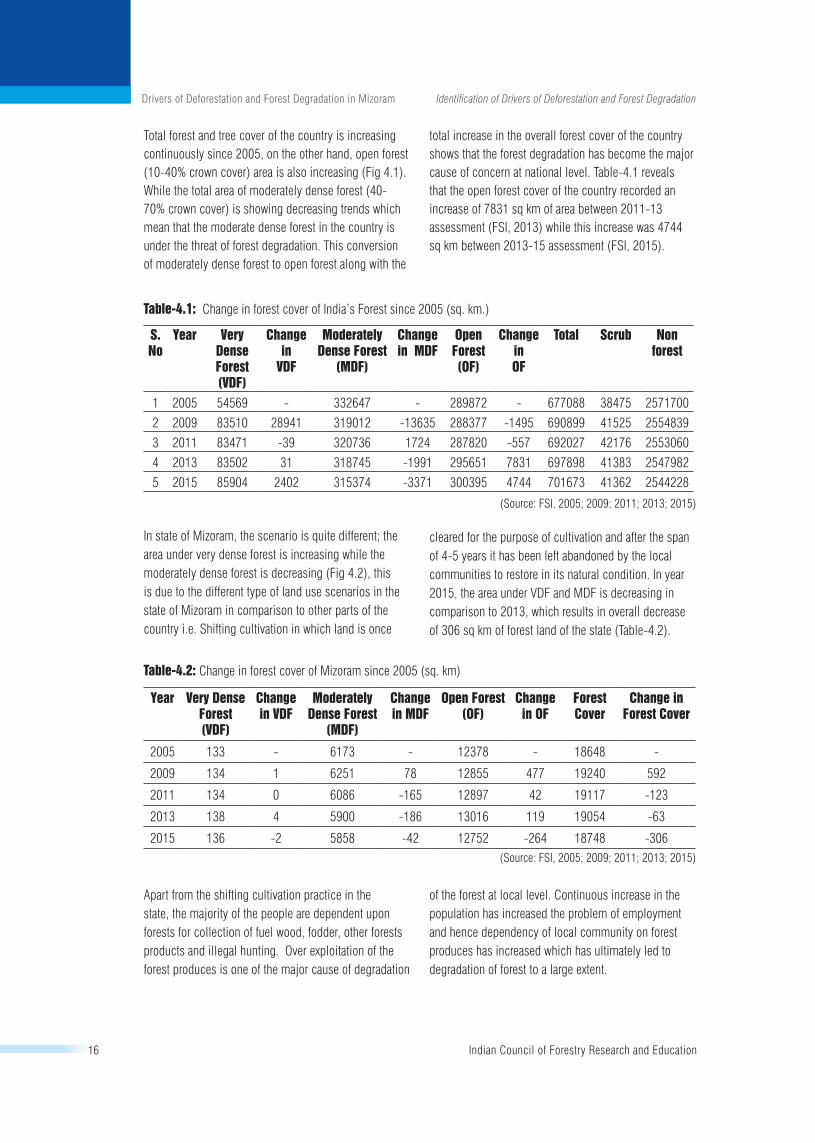
Total forest and tree cover of the country is increasing continuously since 2005, on the other hand, open forest (10-40% crown cover) area is also increasing (Fig 4.1). While the total area of moderately dense forest (40-70% crown cover) is showing decreasing trends which mean that the moderate dense forest in the country is under the threat of forest degradation. This conversion of moderately dense forest to open forest along with the
total increase in the overall forest cover of the country shows that the forest degradation has become the major cause of concern at national level. Table-4.1 reveals that the open forest cover of the country recorded an increase of 7831 sq km of area between 2011-13 assessment (FSI, 2013) while this increase was 4744 sq km between 2013-15 assessment (FSI, 2015).
Table-4.1: Change in forest cover of India’s Forest since 2005 (sq. km.)
S. No
Year Very Dense Forest (VDF)
Change in
VDF
Moderately Dense Forest
(MDF)
Change in MDF
Open Forest(OF)
Change in OF
Total Scrub Non forest
1 2005 54569 - 332647 - 289872 - 677088 38475 25717002 2009 83510 28941 319012 -13635 288377 -1495 690899 41525 25548393 2011 83471 -39 320736 1724 287820 -557 692027 42176 25530604 2013 83502 31 318745 -1991 295651 7831 697898 41383 25479825 2015 85904 2402 315374 -3371 300395 4744 701673 41362 2544228
(Source: FSI, 2005; 2009; 2011; 2013; 2015)
In state of Mizoram, the scenario is quite different; the area under very dense forest is increasing while the moderately dense forest is decreasing (Fig 4.2), this is due to the different type of land use scenarios in the state of Mizoram in comparison to other parts of the country i.e. Shifting cultivation in which land is once
cleared for the purpose of cultivation and after the span of 4-5 years it has been left abandoned by the local communities to restore in its natural condition. In year 2015, the area under VDF and MDF is decreasing in comparison to 2013, which results in overall decrease of 306 sq km of forest land of the state (Table-4.2).
Table-4.2: Change in forest cover of Mizoram since 2005 (sq. km)
Year Very Dense Forest(VDF)
Change in VDF
Moderately Dense Forest
(MDF)
Change in MDF
Open Forest (OF)
Change in OF
Forest Cover
Change in Forest Cover
2005 133 - 6173 - 12378 - 18648 -
2009 134 1 6251 78 12855 477 19240 592
2011 134 0 6086 -165 12897 42 19117 -123
2013 138 4 5900 -186 13016 119 19054 -63
2015 136 -2 5858 -42 12752 -264 18748 -306(Source: FSI, 2005; 2009; 2011; 2013; 2015)
Apart from the shifting cultivation practice in the state, the majority of the people are dependent upon forests for collection of fuel wood, fodder, other forests products and illegal hunting. Over exploitation of the forest produces is one of the major cause of degradation
of the forest at local level. Continuous increase in the population has increased the problem of employment and hence dependency of local community on forest produces has increased which has ultimately led to degradation of forest to a large extent.

Indian Council of Forestry Research and Education 17
Drivers of Deforestation and Forest Degradation in Mizoram Identification of Drivers of Deforestation and Forest Degradation
4.2 Forest Type of Project Area
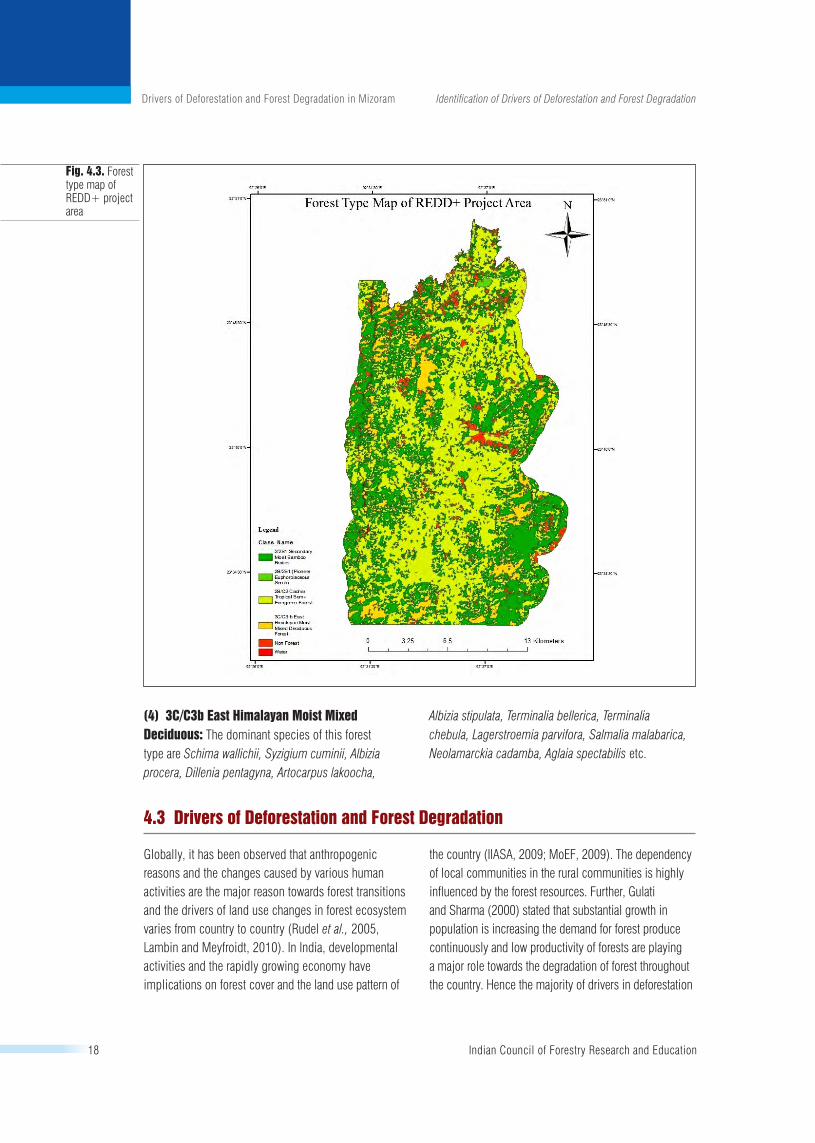
The proposed REDD+ project area constitute the total forest area of 42288.96 ha along with the four major forest type group according to Champion and Seth (1968) forest type of India classification (Table-4.3) and forest types map of the project area is given in Fig. 4.3.
Table-4.3: Sub-forest Type group of Project Area
S. No.
Forest Type Area (ha)
1 2/2S1 Secondary Moist Bamboo Brakes 16220.15
2 2B/2S1 Pioneer Euphorbiaceous Scrub 80.69
3 2B/C2 Cachar Tropical Semi-Evergreen Forest 22691.43
4 3C/C3b East Himalayan Moist Mixed Deciduous 3296.69
(1)2/2S1SecondaryMoistBambooBrakes:The project area is dominated by this forest type with total area of 16220.15 ha. Melocanna bambusoides,
Fig. 4.2. Trend in forest cover of Mizoram (sq.km) since 2005
Dendrocalamus hamiltonii etc are the dominant species of this forest type. Due to the disturbances caused by the shifting cultivation, the majority of area in the state is predominated by the bamboo species.
(2)2B/2S1PioneerEuphorbiaceousScrub: This forest type is generally found in the degraded forests and exposed lands present on the higher slopes and on top of the hills. Vegetation has stunted and species like Macaranga spp., Mallotus spp. which grows as comparatively fast rate generally found there.
(3)2B/C2CacharTropicalSemi-EvergreenForest: Species like Dipterocarpus turbinatus, D. tuberculatus, Terminalia chebula, Emblica spp., Careya arborea etc are the major species of this forest type.
18 Indian Council of Forestry Research and Education
Drivers of Deforestation and Forest Degradation in Mizoram Identification of Drivers of Deforestation and Forest Degradation
(4)3C/C3bEastHimalayanMoistMixedDeciduous: The dominant species of this forest type are Schima wallichii, Syzigium cuminii, Albizia procera, Dillenia pentagyna, Artocarpus lakoocha,
Albizia stipulata, Terminalia bellerica, Terminalia chebula, Lagerstroemia parvifora, Salmalia malabarica, Neolamarckia cadamba, Aglaia spectabilis etc.
Fig. 4.3. Forest type map of REDD+ project area
4.3 Drivers of Deforestation and Forest Degradation
Globally, it has been observed that anthropogenic reasons and the changes caused by various human activities are the major reason towards forest transitions and the drivers of land use changes in forest ecosystem varies from country to country (Rudel et al., 2005, Lambin and Meyfroidt, 2010). In India, developmental activities and the rapidly growing economy have implications on forest cover and the land use pattern of
the country (IIASA, 2009; MoEF, 2009). The dependency of local communities in the rural communities is highly influenced by the forest resources. Further, Gulati and Sharma (2000) stated that substantial growth in population is increasing the demand for forest produce continuously and low productivity of forests are playing a major role towards the degradation of forest throughout the country. Hence the majority of drivers in deforestation

Indian Council of Forestry Research and Education 19
Drivers of Deforestation and Forest Degradation in Mizoram Identification of Drivers of Deforestation and Forest Degradation
and forest degradation are induced by the livelihood activities of the forest dependent communities.
In this study, the drivers of deforestation and forest degradation have been identified in the REDD+ project area of Mamit District for the further implementation of project activities to address those drivers. Majority of population living near to forest areas are highly dependent on the forest for a variety of resources e.g. food, fodder, agriculture, housing, and non-timber forest produces which are potentially contributing towards the deforestation and forest degradation. According to Davidar et al. (2010); Mishra et al. (2008); Arjunan et al. (2005), it has been observed that this dependency of local communities living near the forest areas in rural parts of country are resulting in forest degradation. Hence on a broad scale the drivers of deforestation and forest degradation were discussed through the consultation process with forest
department, village council members and then house hold survey was conducted to observe the people’s perception on drivers of deforestation and forest degradation in their respective areas. However, after the collection of data from the household survey a correlation was made for better understanding of drivers of deforestation and forest degradation with various socio-economic parameters. Fig 4.4 represents the proximate and underlying drivers of deforestation and forest degradation observed during the consultation meeting with forest department and local village council members. Further, the enumerators were asked to directly inquire the drivers of deforestation and forest degradation at household level. Further, the percent contribution of each observed drivers of deforestation and forest degradation was analyzed on the basis of people’s perception highlighted during household survey.
Fig. 4.4. Observed drivers of deforestation and forest degradation in the project area
4.4 Socio-economic profile highlighting the drivers of deforestation and forest degradation in study area
Analysis of household data reveals that 59 per cent of the overall population of surveyed villages constitutes the female population above 18 years followed by 22 per cent from 8 to 18 years and 19 per cent up to 8
years. In males, 58 per cent of the overall population of the households is above 18 years followed by 23% up to 8years and 19 per cent from 8 to 18 years (Table-4.4).

20 Indian Council of Forestry Research and Education
Drivers of Deforestation and Forest Degradation in Mizoram Identification of Drivers of Deforestation and Forest Degradation
Table-4.4: Percentage of Age wise family distribution
Gender Up to 8 yrs (%) From8 to 18 years (%)
Above 18 year (%)
Male 23 19 58Female 19 22 59
Figure 4.5 represents that the education status of majority of individuals (i.e. approximately 55 per cent) was only upto primary standard and nearly 35 per cent of the individuals have metric standard. None of the female was post graduate and even only 1 per cent of male population holds post graduate university degree (Table-4.5).
Fig. 4.5. Education status of the respondents
Table-4.5: Family-wise education status (%)
Table-4.6: Percentage of annual income from all assets
Annual IncomeRs 10,000-30,000 28%Rs 31,000-60,000 33%Rs 61,000-90,000 16%Rs 91,000-120,000 6%Rs 1,21,000-1,50,000 4%Above Rs 1,50,000 13%Maximum Income 1200000Minimum 10000Average Annual Income 100664.60Standard Error 12404.20
Table-4.7: Percent distribution of types of houses
Village Katcha Semi-Pucca KatchaReiek 18 18 6Ailawng 11 19 2West Lungdhar 11 8 0
Khawrihnim 12 12
Lengte 1 10 0
Chungtlang 14 15 1
Total 67 82 9Percentage 43% 51% 6%
Survey revealed that the standard of living in the surveyed villages is not so high. Majority of the individuals have semi-pucca (semi-strong) house (52%) followed by kutcha (not strong) house (43%) and only 9% of the population have pucca (strong) house (Table-4.7).
Fig. 4.6. Percent distribution of primary occupation of the individuals
Analysis of the data revealed that 69.62 per cent of the average population is involved in the shifting cultivation which has been the major driver of deforestation and forest degradation from the decades while other 2.37 per cent of the population is practicing permanent /terrace farming on their own land. The land pass has been given by the representative of the village
Gender Illiterate Primary Metric Inter-mediate
Gradua-tion
Above Graduation
Male 7 41 35 11 5 1Female 7 42 36 12 4 0
The survey reflects that’s the agriculture is the main source of livelihoods among the most of the local communities. 72 per cent of the individuals were involved in agriculture and other 28 per cent were engaged in government/private jobs, self employed/business and daily wages workers (Fig 4.6). The average per capita landholding was 2.71 hectare although there were 22 per cent of the families were landless. The landless families are engaged in other occupations like local kitty business, labour works etc. The average annual income of the individual was approximately Rs.1, 00,601.30 (Table-4.6). Among all the respondents it has been found that about 61 per cent of the population have annual income ranges from Rs. 10,000 to Rs. 60,000. There is only 13 per cent population which has annual income above than Rs. 1,50,000 with maximum of Rs. 12,00,000.
Indian Council of Forestry Research and Education 21
Drivers of Deforestation and Forest Degradation in Mizoram Identification of Drivers of Deforestation and Forest Degradation
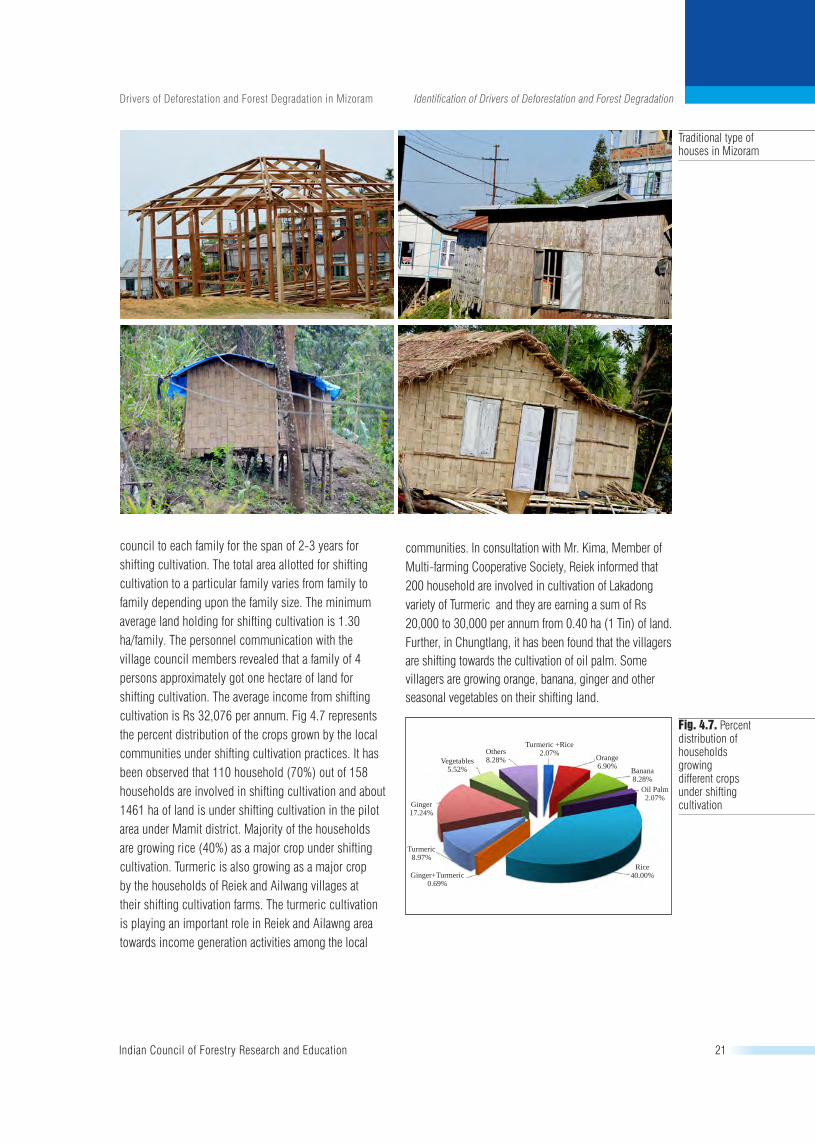
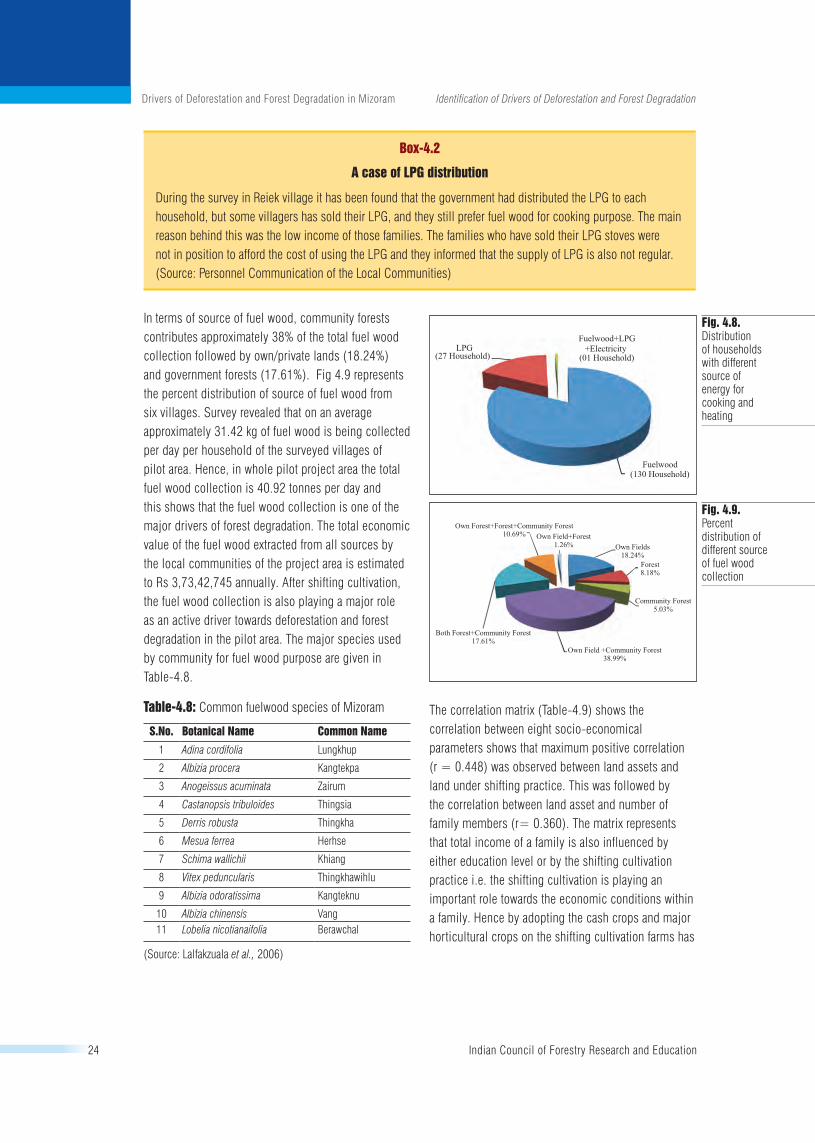
council to each family for the span of 2-3 years for shifting cultivation. The total area allotted for shifting cultivation to a particular family varies from family to family depending upon the family size. The minimum average land holding for shifting cultivation is 1.30 ha/family. The personnel communication with the village council members revealed that a family of 4 persons approximately got one hectare of land for shifting cultivation. The average income from shifting cultivation is Rs 32,076 per annum. Fig 4.7 represents the percent distribution of the crops grown by the local communities under shifting cultivation practices. It has been observed that 110 household (70%) out of 158 households are involved in shifting cultivation and about 1461 ha of land is under shifting cultivation in the pilot area under Mamit district. Majority of the households are growing rice (40%) as a major crop under shifting cultivation. Turmeric is also growing as a major crop by the households of Reiek and Ailwang villages at their shifting cultivation farms. The turmeric cultivation is playing an important role in Reiek and Ailawng area towards income generation activities among the local
communities. In consultation with Mr. Kima, Member of Multi-farming Cooperative Society, Reiek informed that 200 household are involved in cultivation of Lakadong variety of Turmeric and they are earning a sum of Rs 20,000 to 30,000 per annum from 0.40 ha (1 Tin) of land. Further, in Chungtlang, it has been found that the villagers are shifting towards the cultivation of oil palm. Some villagers are growing orange, banana, ginger and other seasonal vegetables on their shifting land.
Traditional type of houses in Mizoram
Fig. 4.7. Percent distribution of households growing different crops under shifting cultivation
Vegetables 5.52%
Others8.28%
Turmeric +Rice2.07% Orange
6.90% Banana8.28%
Oil Palm2.07%
Rice40.00%Ginger+Turmeric
0.69%
Turmeric8.97%
Ginger17.24%

22 Indian Council of Forestry Research and Education
Drivers of Deforestation and Forest Degradation in Mizoram Identification of Drivers of Deforestation and Forest Degradation
Clearing of forests for shifting cultivation
Turmeric powder production

Indian Council of Forestry Research and Education 23
Drivers of Deforestation and Forest Degradation in Mizoram Identification of Drivers of Deforestation and Forest Degradation
4.5 Source of Energy
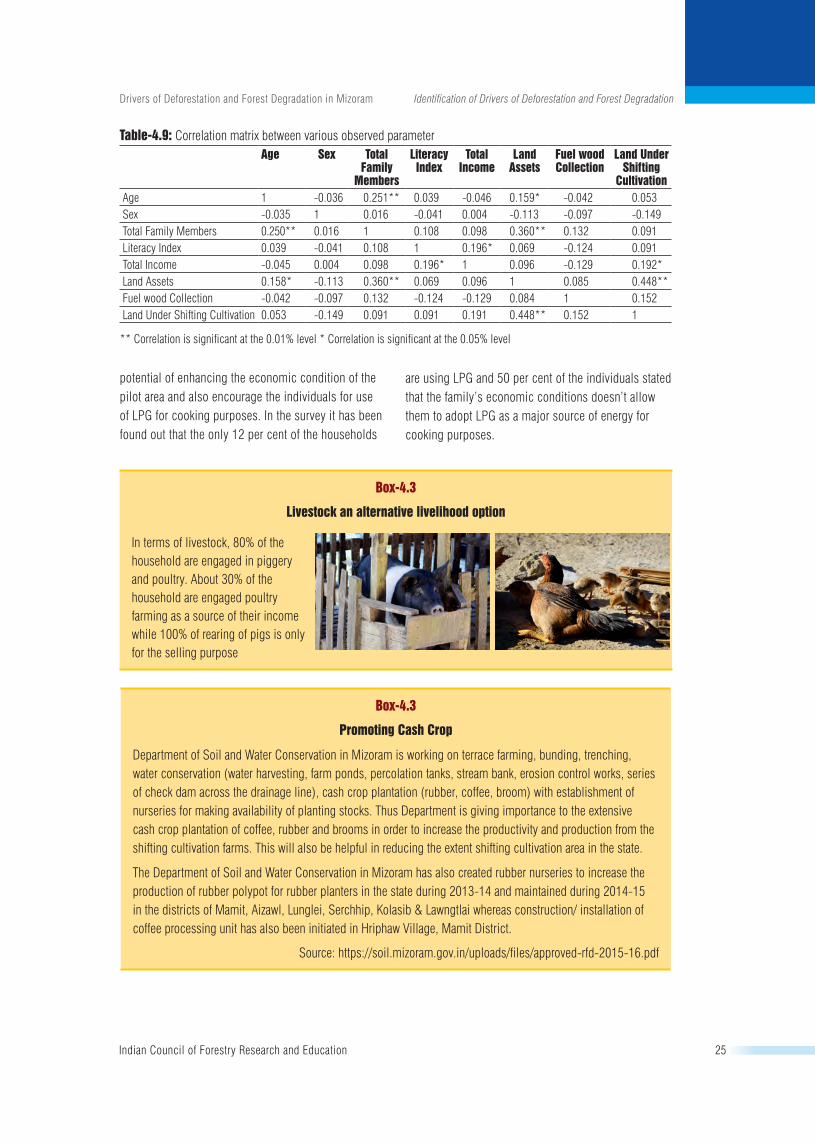
During the household survey, it has been found that the local communities are using fuel wood on large scale for meeting their energy requirement for cooking purpose. Out of total household surveyed in the pilot area, 130 households (82%) are using fuel wood as a major source of energy for cooking as well as heating purpose. Only 27 households (12%) households are
using LPG and one household is using electricity (induction plate) for cooking purpose (Fig 4.8). The reason for more dependency on fuel wood in spite of LPG is attributed to irregular supply of LPG and easy availability of fuel wood, poverty and lack of awareness are other reasons.
Fuel wood contribution at local level
24 Indian Council of Forestry Research and Education
Drivers of Deforestation and Forest Degradation in Mizoram Identification of Drivers of Deforestation and Forest Degradation
Box-4.2
AcaseofLPGdistribution
During the survey in Reiek village it has been found that the government had distributed the LPG to each household, but some villagers has sold their LPG, and they still prefer fuel wood for cooking purpose. The main reason behind this was the low income of those families. The families who have sold their LPG stoves were not in position to afford the cost of using the LPG and they informed that the supply of LPG is also not regular. (Source: Personnel Communication of the Local Communities)
In terms of source of fuel wood, community forests contributes approximately 38% of the total fuel wood collection followed by own/private lands (18.24%) and government forests (17.61%). Fig 4.9 represents the percent distribution of source of fuel wood from six villages. Survey revealed that on an average approximately 31.42 kg of fuel wood is being collected per day per household of the surveyed villages of pilot area. Hence, in whole pilot project area the total fuel wood collection is 40.92 tonnes per day and this shows that the fuel wood collection is one of the major drivers of forest degradation. The total economic value of the fuel wood extracted from all sources by the local communities of the project area is estimated to Rs 3,73,42,745 annually. After shifting cultivation, the fuel wood collection is also playing a major role as an active driver towards deforestation and forest degradation in the pilot area. The major species used by community for fuel wood purpose are given in Table-4.8.
Table-4.8: Common fuelwood species of Mizoram
S.No. Botanical Name Common Name
1 Adina cordifolia Lungkhup
2 Albizia procera Kangtekpa
3 Anogeissus acuminata Zairum
4 Castanopsis tribuloides Thingsia
5 Derris robusta Thingkha
6 Mesua ferrea Herhse
7 Schima wallichii Khiang
8 Vitex peduncularis Thingkhawihlu
9 Albizia odoratissima Kangteknu
10 Albizia chinensis Vang11 Lobelia nicotianaifolia Berawchal
(Source: Lalfakzuala et al., 2006)
The correlation matrix (Table-4.9) shows the correlation between eight socio-economical parameters shows that maximum positive correlation (r = 0.448) was observed between land assets and land under shifting practice. This was followed by the correlation between land asset and number of family members (r= 0.360). The matrix represents that total income of a family is also influenced by either education level or by the shifting cultivation practice i.e. the shifting cultivation is playing an important role towards the economic conditions within a family. Hence by adopting the cash crops and major horticultural crops on the shifting cultivation farms has
Fig. 4.8. Distribution of households with different source of energy for cooking and heating
Fig. 4.9. Percent distribution of different source of fuel wood collection
Indian Council of Forestry Research and Education 25
Drivers of Deforestation and Forest Degradation in Mizoram Identification of Drivers of Deforestation and Forest Degradation
potential of enhancing the economic condition of the pilot area and also encourage the individuals for use of LPG for cooking purposes. In the survey it has been found out that the only 12 per cent of the households
Box-4.3
Livestockanalternativelivelihoodoption
In terms of livestock, 80% of the household are engaged in piggery and poultry. About 30% of the household are engaged poultry farming as a source of their income while 100% of rearing of pigs is only for the selling purpose
Box-4.3
Promoting Cash Crop
Department of Soil and Water Conservation in Mizoram is working on terrace farming, bunding, trenching, water conservation (water harvesting, farm ponds, percolation tanks, stream bank, erosion control works, series of check dam across the drainage line), cash crop plantation (rubber, coffee, broom) with establishment of nurseries for making availability of planting stocks. Thus Department is giving importance to the extensive cash crop plantation of coffee, rubber and brooms in order to increase the productivity and production from the shifting cultivation farms. This will also be helpful in reducing the extent shifting cultivation area in the state.
The Department of Soil and Water Conservation in Mizoram has also created rubber nurseries to increase the production of rubber polypot for rubber planters in the state during 2013-14 and maintained during 2014-15 in the districts of Mamit, Aizawl, Lunglei, Serchhip, Kolasib & Lawngtlai whereas construction/ installation of coffee processing unit has also been initiated in Hriphaw Village, Mamit District.
Source: https://soil.mizoram.gov.in/uploads/files/approved-rfd-2015-16.pdf
Table-4.9: Correlation matrix between various observed parameterAge Sex Total
Family Members
LiteracyIndex
Total Income
LandAssets
Fuel woodCollection
LandUnderShifting
CultivationAge 1 -0.036 0.251** 0.039 -0.046 0.159* -0.042 0.053Sex -0.035 1 0.016 -0.041 0.004 -0.113 -0.097 -0.149Total Family Members 0.250** 0.016 1 0.108 0.098 0.360** 0.132 0.091Literacy Index 0.039 -0.041 0.108 1 0.196* 0.069 -0.124 0.091Total Income -0.045 0.004 0.098 0.196* 1 0.096 -0.129 0.192*Land Assets 0.158* -0.113 0.360** 0.069 0.096 1 0.085 0.448**Fuel wood Collection -0.042 -0.097 0.132 -0.124 -0.129 0.084 1 0.152Land Under Shifting Cultivation 0.053 -0.149 0.091 0.091 0.191 0.448** 0.152 1
** Correlation is significant at the 0.01% level * Correlation is significant at the 0.05% level
are using LPG and 50 per cent of the individuals stated that the family’s economic conditions doesn’t allow them to adopt LPG as a major source of energy for cooking purposes.

26 Indian Council of Forestry Research and Education
Drivers of Deforestation and Forest Degradation in Mizoram Identification of Drivers of Deforestation and Forest Degradation
4.6 Dependency on Forest Produces
Local communities are highly dependent upon forest produce for their day to day needs. The forest provides the major livelihood option for the local communities. Local communities are getting timber for the construction of their house from the forest, and wild fruits and other plants as a source of their food as well as medicine. Hence by observing the dependency of local communities on the forest produce it has
been concluded that it is contributing towards both deforestation as well as forest degradation. Among all, in whole north east India bamboo has its own significance in the daily life. Table-4.10 represents the common species of bamboo and their uses based on the people’s perception observed during the survey.
Table-4.10: Bamboo species available in the project area
S.No. Species LocalName Common Uses1 Bambusa bambos Rawhling •Construction of houses and huts
•Fencing around the agricultural fields•Bamboo shoots (fresh and dried) as a food source.•Baskets and hats•Curtains and chicks•Small houses for livestock •Furniture at house (stools and benches)•Bamboo brooms
2 Bambusa tulda Rawthing
3 Schizostachyum munroi Nat
4 Dendrocalamus hamiltonii Phulrua
5 Schizostachyum polymorphum Chal
6 Dendrocalamus longispathus Rawnal
7 Melocanna baccifera Mautak
8 Bambusa mizorameana Talan
Apart from bamboo there are other common species which has been used as a source of food available in the forests. The common species available in the forests which has been used by the local communities as a
source of food are given in Table-4.11 and plants used by rural households for their health care needs are given in Table-4.12.
Table-4.11: Plants available in the forests for food
S. No. Scientific Name LocalName Plant Part Used1 Homalomena aromatica Anchiri Stem2 Calamus erectus Hruizik Young Stem3 Zanthoxylum budrunga Chingit Leaf4 Musa superba Saisu Young Shoot5 Trevesia palmata Kawh-te-bel Young Shoot6 Schizophyllum commune Pasi Complete Plant7 Amomumde albatum Aidu Tuber8 Musa spp. Tumbu Young inflorescence9 Protium serrata Bil Fruit10 Acacia sp. Khanghu Young Leaf11 Dysoxylum gobara Thingthupui Leaf12 Mikania micrantha Japanhlo Leaf
Table-4.12: Medicinal plants and their local use
S.No. Scientific Name LocalName Plant Part Used1 Calamus tribuloides Thingsia Leaf used in stomach pain2 Oroxylum indicum Archangkawn Bark used in fever3 Aporusa octandra Chhawntual Bark used for stomach ulcer 4 Blumea lanceolaria Buarze Leaves used for stomach ulcer5 Hedyotis cepitellata Lawminutuibur Whole plant used for stomach pain6 Phyllanthus fraternus MithiSunhlu Plant for Liver ailments and fever
Indian Council of Forestry Research and Education 27
Drivers of Deforestation and Forest Degradation in Mizoram Identification of Drivers of Deforestation and Forest Degradation
7 Artemisia indica Sai Whole plant is used for diarrhea, dysentery and abdominal pains. Paste of plant is used to treat wounds
8 Alstonia scholaris Thuamriat Bark is used for malaria, diarrhea, heart diseases and hypertension.9 Hedyotis scandens Laikingtuibur Infusion of leaves is good for removal of kidney stone and treating urinary tract
infection.10 Dysoxylum gobara Thingthupui Leaf & bud decoction in diarrhea & dysentery.11 Mikania micrantha Japanhlo Leaf juice for dysentery, as haemostatic. Leaves boiled with Vitex peduncularis
are taken against fever.12 Eupatorium odoratum Tlangsam Antiseptic13 Schima wallichii Khiang Fruit decoction used against snake and insect bites
4.7 Gender and Governance
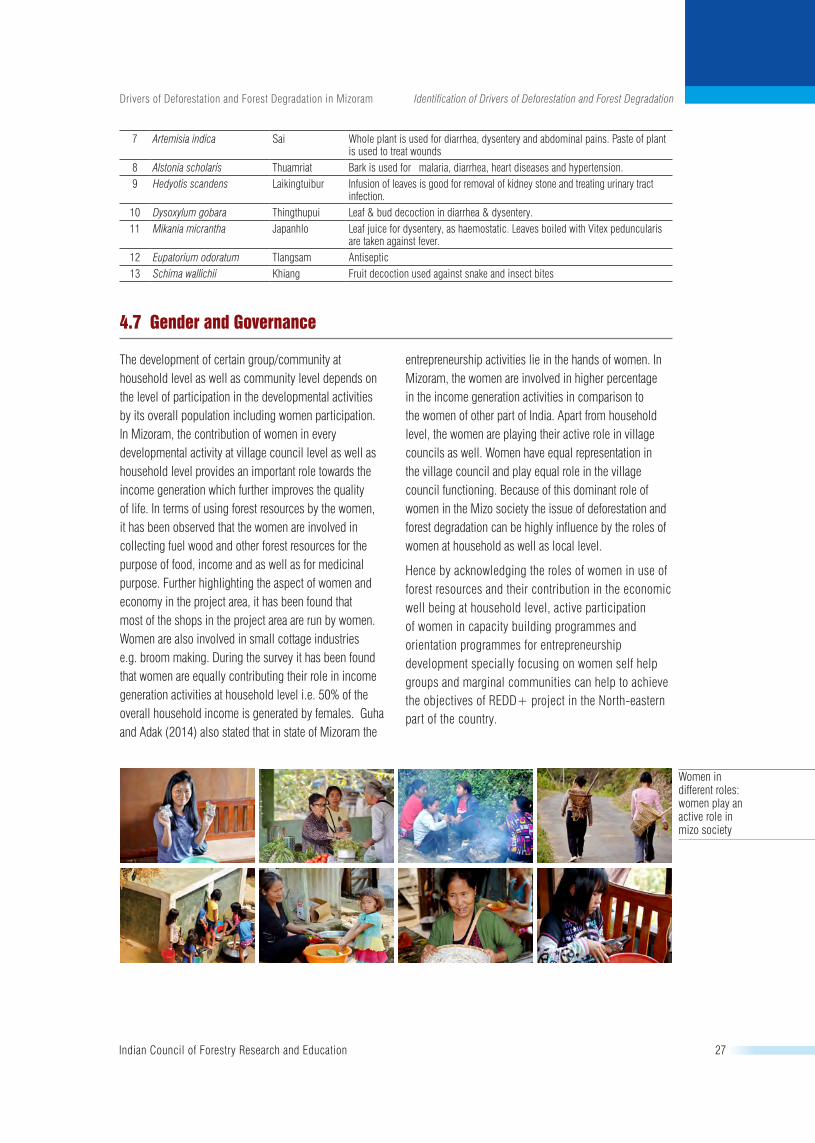
The development of certain group/community at household level as well as community level depends on the level of participation in the developmental activities by its overall population including women participation. In Mizoram, the contribution of women in every developmental activity at village council level as well as household level provides an important role towards the income generation which further improves the quality of life. In terms of using forest resources by the women, it has been observed that the women are involved in collecting fuel wood and other forest resources for the purpose of food, income and as well as for medicinal purpose. Further highlighting the aspect of women and economy in the project area, it has been found that most of the shops in the project area are run by women. Women are also involved in small cottage industries e.g. broom making. During the survey it has been found that women are equally contributing their role in income generation activities at household level i.e. 50% of the overall household income is generated by females. Guha and Adak (2014) also stated that in state of Mizoram the
entrepreneurship activities lie in the hands of women. In Mizoram, the women are involved in higher percentage in the income generation activities in comparison to the women of other part of India. Apart from household level, the women are playing their active role in village councils as well. Women have equal representation in the village council and play equal role in the village council functioning. Because of this dominant role of women in the Mizo society the issue of deforestation and forest degradation can be highly influence by the roles of women at household as well as local level.
Hence by acknowledging the roles of women in use of forest resources and their contribution in the economic well being at household level, active participation of women in capacity building programmes and orientation programmes for entrepreneurship development specially focusing on women self help groups and marginal communities can help to achieve the objectives of REDD+ project in the North-eastern part of the country.
Women in different roles: women play an active role in mizo society
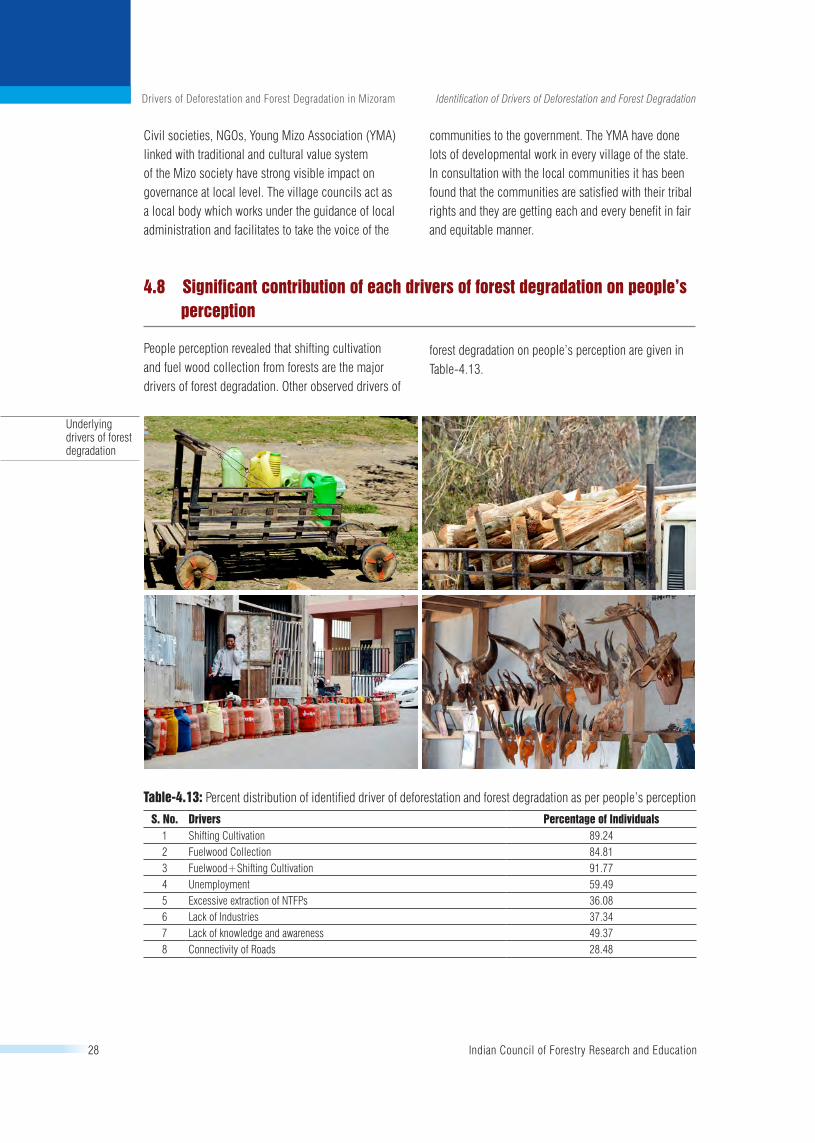
28 Indian Council of Forestry Research and Education
Drivers of Deforestation and Forest Degradation in Mizoram Identification of Drivers of Deforestation and Forest Degradation
Civil societies, NGOs, Young Mizo Association (YMA) linked with traditional and cultural value system of the Mizo society have strong visible impact on governance at local level. The village councils act as a local body which works under the guidance of local administration and facilitates to take the voice of the
communities to the government. The YMA have done lots of developmental work in every village of the state. In consultation with the local communities it has been found that the communities are satisfied with their tribal rights and they are getting each and every benefit in fair and equitable manner.
4.8 Significant contribution of each drivers of forest degradation on people’s perception
People perception revealed that shifting cultivation and fuel wood collection from forests are the major drivers of forest degradation. Other observed drivers of
forest degradation on people’s perception are given in Table-4.13.
Underlying drivers of forest degradation
Table-4.13: Percent distribution of identified driver of deforestation and forest degradation as per people’s perception
S. No. Drivers Percentage of Individuals1 Shifting Cultivation 89.242 Fuelwood Collection 84.813 Fuelwood+Shifting Cultivation 91.774 Unemployment 59.495 Excessive extraction of NTFPs 36.086 Lack of Industries 37.347 Lack of knowledge and awareness 49.378 Connectivity of Roads 28.48
Indian Council of Forestry Research and Education 29
Drivers of Deforestation and Forest Degradation in Mizoram Identification of Drivers of Deforestation and Forest Degradation
WayForward/Recommendations
During survey and interaction with the local communities, it was revealed that there are certain activities which are playing their roles directly or indirectly towards deforestation and forest degradation. The drivers of deforestation and forest degradation, proposed activities to enhance livelihoods of local community and to check the drivers of deforestation and forest degradation from the pilot area are given below:
(1) Shifting cultivation: Shifting cultivation is also known as slash and burn practice which is the traditional type of agricultural practice in Northeast India. As per survey, it has been found that majority of individuals are submitting their views about the shifting cultivation that it is the major cause of forest degradation in their areas. The farmers use the specific allocated area for a period of 2-3 years and after that period those areas become abandoned. Farmers further shift to new forest area which is causing land degradation and increasing the availability of degraded land in the state. According to the people’s perception the solution to abate the extent of shifting cultivation is the wet rice cultivation. The rice is the major crop of the state and wet rice cultivation is the most favorable type of cultivation technique to increase the production of rice. The total area under the wet rice cultivation in the state has also been increased from last few years which have also increased the rice production in the state.
Further some individuals suggested that terrace farming and permanent farming can also decrease the extent of shifting cultivation in the state. Terrace farming and allotment of land on permanent basis to the farmers can increase their interest and responsibility towards it.
Restoration of the shifting patched can also play an important role, because of shifting cultivation the famers give attention to land for 2-3 years and after that there is no any provision towards the maintenance of that particular patch. The area has been left abandoned by the local communities without using any scientific method of eco restoration. Hence at the village council level, a team with the active participation of local communities can be formed which can work towards the restoration of that abandoned patches of land under the
guidance and support of State Forest Department and other Forestry Research Organizations.
From the survey it has been found that introduction of horticultural crop can also play an important role. Promoting horticultural crops can increase the income from a particular patch of land. This can further encourage farmers for opting a regular source of income. Oil palm, ginger, turmeric, coffee and tea plantation can play an important role in reducing the extent of shifting cultivation from the project area.
(2) Fuel wood collection: Promoting high density energy plantation of local fast growing species can also ease pressure on forests for fuel wood collection. During the survey it has been found that the villagers are using traditional type of cook stoves in their houses which is using large quantity of fuel wood with poor efficiency and also causing the indoor smoke problem and respiratory health diseases. Not even a single household was equipped with improved fuel efficient cook stove. The fuel wood collection can be reduced by introducing the fuel wood efficient improved cook stoves in the project area.
Further the individuals who can afford to pay for LPG are not getting the regular supply of LPG refills. Hence continuous supply of LPG can play an important role to switch the local communities towards the use of LPG cook stoves instead of traditional cook stoves. From The field survey reveals that economic as well as education status of a family can also help to reduce the extent of fuel wood collection in the villages. Alternate livelihood opportunities will help in improving economic status of the families/local communities. The additional income will further encourage them to meet cost of LPG usages. Awareness generation programmes, seminars and training programmes can also play an important role in checking the problem of shifting cultivation.
(3)Lackofemploymentopportunitiesandindustries: Employment status is also playing an important role towards the degradation of forests. The employment opportunities are very less and most of the people depend on farming practices and collection of forest produces. During the survey, it has been

30 Indian Council of Forestry Research and Education
Drivers of Deforestation and Forest Degradation in Mizoram Identification of Drivers of Deforestation and Forest Degradation
found that majority of farmers (72%) are involved in farming practices and only 13% of the population are in government and private jobs. The villagers pointed out that the introduction of cottage industry for example bamboo industry, improved processing of locally available raw material and entrepreneurship, handicraft industry etc. can play an important role towards generating the alternative employment opportunities for local communities. Hence by acknowledging the traditional knowledge and skills of the local communities, emphasis should be given to promote various livelihood activities on traditional and indigenous knowledge based in improving their livelihood options and ultimately provide positive incentives for improving their economic status.
(4) Excessive extraction of non-timber forest products (NTFPs): Non-timber forest products play an important role towards local livelihood and economy. Individuals are spending more hours of their daily time in collecting NTFP from their nearby forest areas and selling them in the town markets. During the interaction with local communities, it has been observed that there is not enough control of government agency towards collection as well as sale and purchase of the NTFPs from the forests. In Mizo society the local communities are very fond of NTFPs and on weekends the town markets are full of local vendors selling variety of wild food at very low and fluctuating prices. With the active participation of forest department and village council members, scientific harvesting of NTFPs, and a block
level market of NTFPs can be established in which the records for demand and supply of NTFPs can also be maintained.
Lackofknowledgeandawareness
Overall, we can say that dependency of local communities on forest produce is one of the factors affecting the rate of forest degradation. There is a need for the local communities to sensitize the issue of deforestation and forest degradation by providing the seminars and awareness campaigns highlighting the various Government programmes/ incentives, negative impacts of the using forest resources in unsustainable manner. The involvement of local communities in every project activity can catch their interest and this can become more success if there is some financial gain at individual level by implementation of the project activity. Hence there is need to give more emphasis on income generation activities of the local communities by ensuring sustainable use of forest resources and conservation of local biodiversity.
Coordination between the local communities and state forest department for management of forests can provide an alternative for reducing the forest degradation. The capacity building of local communities on various conservation strategies and measure, sustainable harvesting of NTFPs and by increasing the economic status of the local communities can decrease the dependency of indigenous communities on the forest produce.
Alternate uses of forest produce
Indian Council of Forestry Research and Education 31
Drivers of Deforestation and Forest Degradation in Mizoram Identification of Drivers of Deforestation and Forest Degradation
Overall, 25% of the individuals suggested that there is need of industrial growth and infrastructure development so that the villagers can become self sufficient thus reducing their dependency on the forests. In infrastructure development connectivity of roads can also play an important role towards improving the economic status of area.
Project activities for addressing drivers of deforestation and forest degradation
In consultation with the local community members of Reiek Village under Mamit District (Mizoram) during the project inception workshop, it has been highlighted that the farmers are cultivating organic turmeric and they suggested that solar drier can be better option for drying turmeric which will also contribute in income generation activity in pilot area. Solar drier can reduce the time taken by the raw turmeric to dry up completely before processing it into powder form
otherwise it takes one month time for complete drying. This will promote the local communities to grow more turmeric on their agricultural land and can also play a significant role in improving the economy at household level. Such activity can help in reducing the extent of shifting cultivation from the area because the natural regeneration capacity of turmeric plantation is comparatively very high and this can be helpful for the local communities to grown turmeric on same piece of land.
On the other side, with active support of Mizoram State Department of Environment and Forests, it has been found that the some of the farmers are converting the shifting farms to the coffee garden which is providing an alternative source of income generation. Hence to raise the alternative livelihood options, the coffee plantation has also been proposed in the project area as one of the activity to improve the livelihood and economic status of the local communities as well as to reduce the extent of shifting cultivation.

References
Arjunan, M., Puyravaud, J-Ph, and Davidar, P. (2005). The impact of resource collection by local communities on the dry forests of the Kalakad–Mundanthurai Tiger Reserve. Tropical Ecology 46; 135–144.
Bisht, N.S. (2016). Valuation of goods and services from forests of Mizoram, Dehradun.
Boucher, D., Elias P., Lininger, K., May-Tobin, C., Roquemore, S. and Saxon, E. (2011). The Root of the Problem: What ’s Driving Tropical Deforestation Today? Union of Concerned Scientists. Cambridge, Massachusetts.
Census of India (2011). Ministry of Home Affairs, Government of India.
Champion, H.G. and Seth, S.K. (1968). A Revised Survey of Forest Types of India.Controller of Publications, Govt. of India, Delhi.
Davidar, P., Sahoo, S.Mammen,P. C., Acharya, P., Puyravaud, J. P., Arjunan, M., Garrigues, J .P. and Roessingh, K. (2010). Assessing the Extent and Causes of Forest Degradation in India: Where do we Stand? Biological Conservation 43(12); 2937–2944.
FSI (2005). India State of Forest Report, 2005. Forest Survey of India, Dehradun.
FSI (2009). India State of Forest Report, 2009. Forest Survey of India, Dehradun.
FSI (2011). India State of Forest Report, 2011. Forest Survey of India, Dehradun.
FSI (2013).India State of Forest Report, 2013. Forest Survey of India, Dehradun.
FSI (2015). India State of Forest Report, 2015. Forest Survey of India, Dehradun.
Geist, H. and Lambin, E. (2001). What drives tropical deforestation? A meta-analysis of proximate and underlying causes of deforestation based on subnational case study evidence.Land-Use and Land-Cover Change (LUCC) Project, International Geosphere-Biosphere Programmeme (IGBP). LUCC Report Series: 4.
Gibbs, H.K., Ruesch, A.S., Achard, F., Clayton, M.K., Holmgren, P., Ramankutty, N., and Foley, J.A. (2010). Tropical forests were the primary sources of new agricultural land in the 1980s and 1990s. PNAS August 31, 2010.
Government of India (1982). Change in Forest Cover in India.National Remote sensing Agency, Department of Space, Hyderabad.
Government of Mizoram (nd). Economic Survey 2015-16. Planning & Programme Implementation Department Government of Mizoram, India.
Guha, P. and Adak, K. (2014). Gender Influence on Entrepreneurship: A Case Study of Aizawl District of Mizoram. Journal of Entrepreneurship and Management 3 (2).
Gulati, S.C. and Sharma, S. (2000). Population Pressure and Deforestation in India. Population Research Centre, Institute of Economic Growth, University Enclave.

34 Indian Council of Forestry Research and Education
Drivers of Deforestation and Forest Degradation in Mizoram References
Hosonuma, N., Herold, M., De Sy, V., S De Friess, R., Brockhaus, M.,Verchot,L., Angelsen A., and Romijn, E. (2012). An assessment of deforestation and forest degradation drivers in developing countries. Environmental Research Letter, 7:044009.
Huettner, M., Leemans, R., Kok, K. and Ebeling, J. (2009). A comparison of baseline methodologies for reducing emissions from deforestation and degradation. Carbon Balance Management, 44.
IIASA. (2009). The Challenges for Indian Forestry Sector. IIASA Policy Brief 05. Laxenburg: IIASA. 4 pp.
Lalfakzuala, R., Lalramnghinglova, H. and Kayang, H. (2006). Ethnobotanical usages of plants in western Mizoram. Indian Journal of Traditional Knowledge, 6(3); 486-493,
Lambin, E. and Meyfroidt, P. (2010). Land use transitions: socio-ecological feedback versus socio-economic change Land Use Policy, 27: 108–118.
Maithani, B.P. (2005). Shifting cultivation in north-east India: Policy, issues and options. Mittal Publications, New Delhi, India.
Ministry of Environment and Forests (2009). Asia-Pacific Forestry Sector Outlook Study II: India Country Report. Working Paper No. APFSOS II/WP/2009/06. Bangkok: FAO, pp. 78.
Mishra, P. C., Tripathy, P. K., Behera, N. and Mishra, K. (2008). Socioeconomic and Socio-ecological study of Sambalpur Forest Division, Orissa. Journal of Human Ecology, 23(2):135-146.
Rawat, V.R.S. and Kishwan, J. (2008). Forest conservation-based, climate change-mitigation approach for India. International Forestry Review, 10(2):269-280.
Rudel, T.K., Schneider, L., Uriarte, M., Turner, B.L., DeFries, R., Lawrence, D., Geoghegan J., Hecht, S., Ickowitz, A. and Lambin, E.F. (2009). Agricultural intensification and changes in cultivated areas, 1970–2005. PNAS 106: 20675–20680.
Rudel, T.K., Coomes, O.T., Moran, E., Achard, E., Angelsen, A., Xu, J. and Lambin, E. (2005). Forest
transitions: towards a global understanding of land use change Glob. Environ. Change, 15: 23–31.
Rudorff, B.F.T, Adami, M., Aguilar, D.A., Moreira, M. A., Mello, M. P.,Fabiani, L., Amaral, D. F. and Pires, B. M. (2011).The soymoratorium in the Amazon biome monitored by remote sensing images. Remote Sensing, 3: 185–202.
Sharma, N.P., Rowe, R., Openshaw, K. and Jacobson, M. (1992). World’s forests in perspective. In: Managing the World’s Forests (NP Sharma, Ed.), Kendall /Hunt Publishing Company, Iowa, USA.
Smith, P., Bustamante, M., Ahammad, H.,Clark, H.,Dong, H., Elsiddig, E.A., Haberl, H., Harper, R., House, J., Jafari, M., Masera, O., Mbow, C., Ravindranath, N.H., Rice, C.W. Robledo Abad, C., Romanovskaya, A., Sperling, F. and Tubiello, F. (2014). Agriculture, Forestry and Other Land Use (AFOLU). In: Climate Change 2014: Mitigation of Climate Change. Contribution of Working Group III to the Fifth Assessment Report of the Intergovernmental Panel on Climate Change [Edenhofer, O., R. Pichs-Madruga, Y. Sokona, E. Farahani, S. Kadner, K. Seyboth, A. Adler, I. Baum, S. Brunner, P. Eickemeier, B. Kriemann, J. Savolainen, S. Schlömer, C. von Stechow, T. Zwickel and J.C. Minx (eds.)]. Cambridge University Press, Cambridge, United Kingdom and New York, NY, USA.
Tarasofsky, P. (1995). Man and the Forest. Duke University Press, Durham.
UNFCCC (2007b). Decision -/CP.13 Bali Action Plan http://unfccc.int/files/meetings/cop_13/application/pdf/cp_bali_action.pdf.
UNFCCC (2007c). Decision -/CP. 13 Reducing emissions from deforestation in developing countries: approaches to stimulate action, http://unfccc.int/files/meetings/cop_13/application/pdf/cp_redd.pdf.
WRI (1987). World Resources 1987. New York: Basic Books.

Questionnaire for Socio-Ecological Survey of Forest Adjoining Village
INFORMED CONSENT
Please read the following that explains this research study including the associated risks and benefits, if any. You are being asked to take part in the research being conducted by ICFRE under the guidance of Assistant Director General (Biodiversity and Climate Change), ICFRE, Dehradun. This should help you decide whether or not you want to participate in the study. Agreeing to this will confirm that you have been informed about the study and you want to participate. Taking part in this study is completely voluntary and anonymous.
Research Description
This research is about the preparation of project development document for REDD+. REDD+ stands for countries' efforts to reduce emissions from deforestation and forest degradation, and foster conservation, sustainable management of forests, and enhancement of forest carbon stocks. It is desire to facilitate incentivisation against REDD+ financial mechanism. Ultimately we hope this survey result will provide synergy between climate change mitigation and financial benefits against carbon enhancement and other co-benefits of the forests to the local communities. Roughly 250 households will be invited to participate in this research study.
Annexure - I
Risks and Benefits
There are no foreseeable risks or discomforts for participating in this study. You may not receive any direct benefit from taking part in this study. However, by participating in this study you support the research community about the informed decisions and for assisting appropriate plans for addressing potential consequences for mitigation of climate change. Data that we collect detailing household forest dependency can be used to inform and direct future research, besides facilitation for REDD+ mechanism in the area.
Ending your Participation
You have the right to withdraw your consent or stop participating at any time. You have the right to refuse to answer any question(s) or refuse to participate in any procedure for any reason. Refusing to participate in this study will not result in any penalty or loss of benefits to which you are otherwise entitled.
Description of Procedures
If you agree to take part in this study, you will be asked to complete a survey that will last approximately 45 minutes.
Confidentiality
We will make every effort to maintain the confidentiality of your responses. Only the team of the project will have

36 Indian Council of Forestry Research and Education
Drivers of Deforestation and Forest Degradation in Mizoram Annexure
access to the data and information about participation and will not be shared with others, except for scientific publication and community necessities.
The researcher can be reached through email to ADG (BCC):[email protected]
Authorization
I have read this information about the study or it was read to me. I, ...........................................solemnly declare that the information provided by me are correct to best of my knowledge and belief, and is for research purpose only.
Signature of respondent
Questionnaire No. Date:
Geographical Information of Village
1. Name of Village:..................................................................................................................................................
2. GPS Location: Latitude: ..............º.................’..................” N Longitude: ...............º.................’...................” E
3. Altitude :.............................................................................(m) amsl
4 Landmark:............................................................................................................................................................
Socio-Demographic Profile of Household
5. Name of Respondent : .......................................................................................................................................
6. Age:.......................................................................years 7. Sex M F 8. Education: Illiterate Primary High School Intermediate Bachelor and above 9. Religion: 10. Caste: General / OBC / SC /ST
11. What type of house do you have?a) Kachha House b) Semi-pakka House c) Pakka House
12. Age wise distribution of household members:
Gender below 8 years between 8 to 18 years above 18 years
MaleFemale
13. Family Education Status:
EducationalLevel
Illiterate Primary High School Intermediate Bachelor Above Bachelor
MaleFemale
14. Profession:Primary Profession:
Agriculture Service Self Employed Labour Any Other .........................
Secondary Profession:
Agriculture Service Self Employed Labour Any Other .........................
Approximate Annual Income (Rs.).....................................................................

Indian Council of Forestry Research and Education 37
Drivers of Deforestation and Forest Degradation in Mizoram Annexure
15. Land Asset:
a. Cultivable Land (Unit): i) Irrigated Land: ii) Unirrigated b. Uncultivated Land (Unit):
16. Major energy sources used: Purpose Kerosene Fuelwood Dung cakes LPG Bio Gas Electricity Crop Residue Cooking
Heating
17. General CharacteristicsAvailability of fuel efficient stoves:
Preferred source of energy for cooking: Ist IInd IIIrd
Farming Practices
18. Agriculture Practices:
a. Crop Cultivation
Major CropArea(unit)
Production Quantity Expenditure in Cultivation
IncomeFor Self Consumption For Selling
WheatRice
Total
•Do you grow traditional variety of crops: Yes/ No Reason: ……….
•Do you grow high yielding variety of crops: Yes/ No Reason: ……….
•Do you use seed from outside for cultivation: Yes/ No Reason: ……….
b. Horticulture
Major Fruit CropArea(unit)
NumberProduction Quantity
Expenditure IncomeFor Self Consumption For Selling
Total
•DoyougrowHighYieldingVarietyofFruitTree:Yes/NoReason:……….
c. Agroforestry
Major Tree CropArea(unit)
Number (Planted/Natural)
ProductExpenditure IncomeFor Self Consumption For Selling
Total
d. Livestock Resources
Livestock Number Product Expenditure IncomeDesi Breed Cross Breed For Self Consumption For Selling
Total
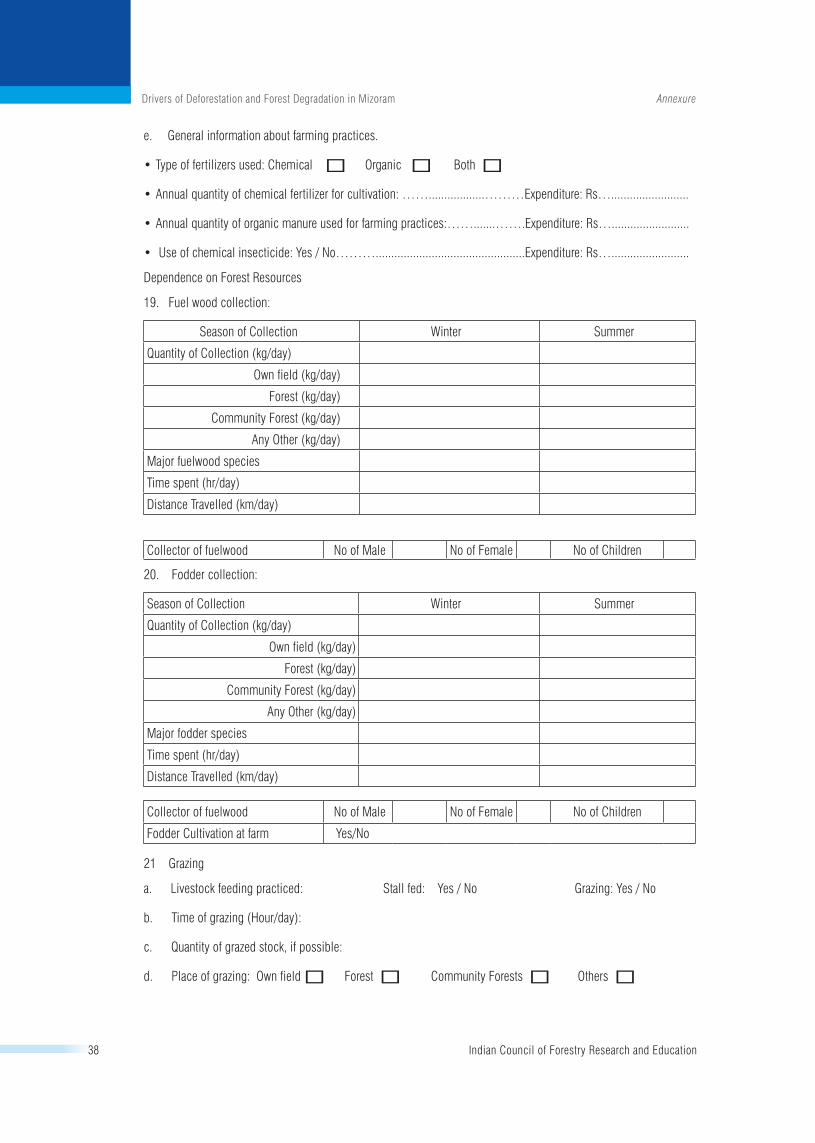
38 Indian Council of Forestry Research and Education
Drivers of Deforestation and Forest Degradation in Mizoram Annexure
e. General information about farming practices.
•Type of fertilizers used: Chemical Organic Both
•Annual quantity of chemical fertilizer for cultivation: ……..................………Expenditure: Rs….........................
•Annual quantity of organic manure used for farming practices:…….......…….Expenditure: Rs….........................
• Use of chemical insecticide: Yes / No………................................................Expenditure: Rs….........................
Dependence on Forest Resources
19. Fuel wood collection:
Season of Collection Winter Summer
Quantity of Collection (kg/day)
Own field (kg/day)
Forest (kg/day)
Community Forest (kg/day)
Any Other (kg/day)
Major fuelwood species
Time spent (hr/day)
Distance Travelled (km/day)
Collector of fuelwood No of Male No of Female No of Children
20. Fodder collection:
Season of Collection Winter Summer
Quantity of Collection (kg/day)
Own field (kg/day)
Forest (kg/day)
Community Forest (kg/day)
Any Other (kg/day)
Major fodder species
Time spent (hr/day)
Distance Travelled (km/day)
Collector of fuelwood No of Male No of Female No of Children
Fodder Cultivation at farm Yes/No
21 Grazing
a. Livestock feeding practiced: Stall fed: Yes / No Grazing: Yes / No
b. Time of grazing (Hour/day):
c. Quantity of grazed stock, if possible:
d. Place of grazing: Own field Forest Community Forests Others

Indian Council of Forestry Research and Education 39
Drivers of Deforestation and Forest Degradation in Mizoram Annexure
22 Leaf Litter/Understory collection for manuring and bedding:
Season of Collection Winter Summer
Quantity of Collection (kg/day)
Own field (kg/day)
Forest (kg/day)
Community Forest (kg/day)
Any Other (kg/day)
Major Plant species
Time spent (hr/day)
Distance Travelled (km/day)
Collector of bedding materials No of Male No of Female No of Children
23 Timber Logging:
a. Source of timber: Forest Community Forest Own Land Forest Right b Amount of timber logged annually:
c Use of Timber Extracted, if any.............................................................................................................................
24. Plants from forest used for food or food stuff
Common Name Useful Plant Part Source Remark
25. Plants from forest used for medicinal purposes
Common Name Useful Plant Part Source Remark
26. Status of Shifting Cultivation
a) Total Land use for Shifting Agriculture……...................................................................................…………….
b) Maximum Time period for which one place of land is cultivated……….........................................................….
c) Major species grown under this practice…………...........................................................................…………
d) Traditional method for restoration of the land under shifting cultivation…….................................................…..
27. Bamboo consumption and craft industry:
a) Are you involved in bamboo cultivation………….....................................................................................…….
b) If yes, what is the main specie of bamboo used in cultivation………….....................................................……
c) What is the approximate annual income from the bamboo…………....................................................………..
d) What is the major use of the bamboo (i.e. craft industry/ own consumption)….…........................................…..
e) Personal Recommendation for bamboo cultivation and craft industry……………..........................................…
28. Status of Roads and other construction activities:
a) What is the status of the roads and infrastructure (Developed/ Need Development)………….........................…
b) What is the major loss on the forest area caused by the construction activities……….................................…..
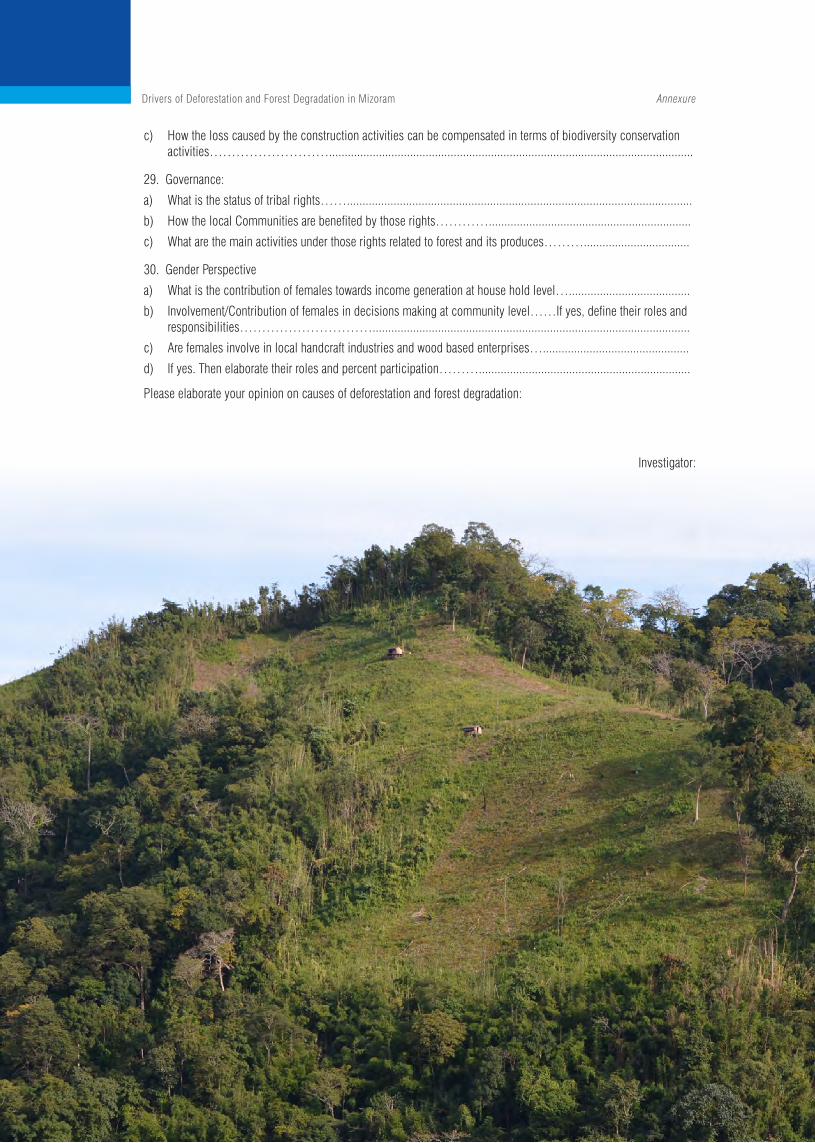
40 Indian Council of Forestry Research and Education
Drivers of Deforestation and Forest Degradation in Mizoram Annexure
c) How the loss caused by the construction activities can be compensated in terms of biodiversity conservation activities……………………….....................................................................................................................
29. Governance:
a) What is the status of tribal rights……...............................................................................................................
b) How the local Communities are benefited by those rights………….................................................................
c) What are the main activities under those rights related to forest and its produces………..................................
30. Gender Perspective
a) What is the contribution of females towards income generation at house hold level….......................................
b) Involvement/Contribution of females in decisions making at community level……If yes, define their roles and responsibilities…………………………......................................................................................................
c) Are females involve in local handcraft industries and wood based enterprises…...............................................
d) If yes. Then elaborate their roles and percent participation………....................................................................
Please elaborate your opinion on causes of deforestation and forest degradation:
Investigator:
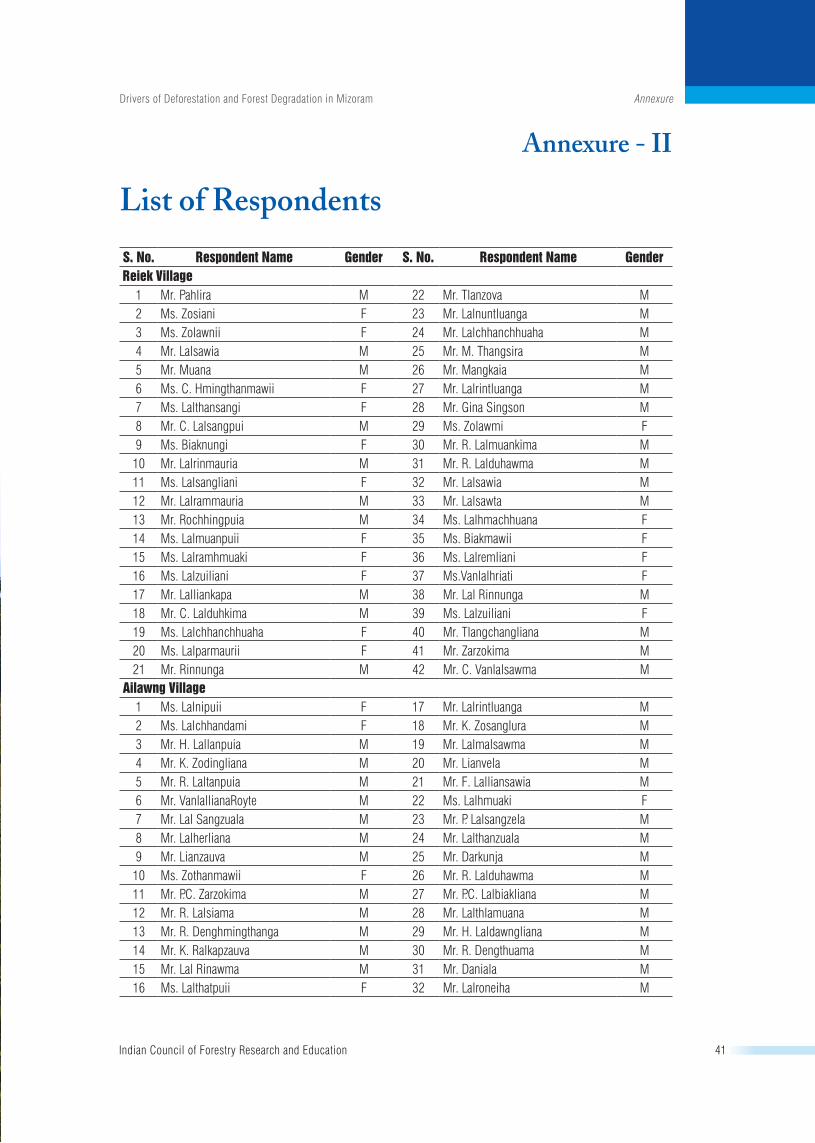
Indian Council of Forestry Research and Education 41
Drivers of Deforestation and Forest Degradation in Mizoram Annexure
List of Respondents
S. No. Respondent Name Gender S. No. Respondent Name GenderReiek Village
1 Mr. Pahlira M 22 Mr. Tlanzova M2 Ms. Zosiani F 23 Mr. Lalnuntluanga M3 Ms. Zolawnii F 24 Mr. Lalchhanchhuaha M4 Mr. Lalsawia M 25 Mr. M. Thangsira M5 Mr. Muana M 26 Mr. Mangkaia M6 Ms. C. Hmingthanmawii F 27 Mr. Lalrintluanga M7 Ms. Lalthansangi F 28 Mr. Gina Singson M8 Mr. C. Lalsangpui M 29 Ms. Zolawmi F9 Ms. Biaknungi F 30 Mr. R. Lalmuankima M10 Mr. Lalrinmauria M 31 Mr. R. Lalduhawma M11 Ms. Lalsangliani F 32 Mr. Lalsawia M12 Mr. Lalrammauria M 33 Mr. Lalsawta M13 Mr. Rochhingpuia M 34 Ms. Lalhmachhuana F14 Ms. Lalmuanpuii F 35 Ms. Biakmawii F15 Ms. Lalramhmuaki F 36 Ms. Lalremliani F16 Ms. Lalzuiliani F 37 Ms.Vanlalhriati F17 Mr. Lalliankapa M 38 Mr. Lal Rinnunga M18 Mr. C. Lalduhkima M 39 Ms. Lalzuiliani F19 Ms. Lalchhanchhuaha F 40 Mr. Tlangchangliana M20 Ms. Lalparmaurii F 41 Mr. Zarzokima M21 Mr. Rinnunga M 42 Mr. C. Vanlalsawma M
Ailawng Village1 Ms. Lalnipuii F 17 Mr. Lalrintluanga M2 Ms. Lalchhandami F 18 Mr. K. Zosanglura M3 Mr. H. Lallanpuia M 19 Mr. Lalmalsawma M4 Mr. K. Zodingliana M 20 Mr. Lianvela M5 Mr. R. Laltanpuia M 21 Mr. F. Lalliansawia M6 Mr. VanlallianaRoyte M 22 Ms. Lalhmuaki F7 Mr. Lal Sangzuala M 23 Mr. P. Lalsangzela M8 Mr. Lalherliana M 24 Mr. Lalthanzuala M9 Mr. Lianzauva M 25 Mr. Darkunja M10 Ms. Zothanmawii F 26 Mr. R. Lalduhawma M11 Mr. P.C. Zarzokima M 27 Mr. P.C. Lalbiakliana M12 Mr. R. Lalsiama M 28 Mr. Lalthlamuana M13 Mr. R. Denghmingthanga M 29 Mr. H. Laldawngliana M14 Mr. K. Ralkapzauva M 30 Mr. R. Dengthuama M15 Mr. Lal Rinawma M 31 Mr. Daniala M16 Ms. Lalthatpuii F 32 Mr. Lalroneiha M
Annexure - II
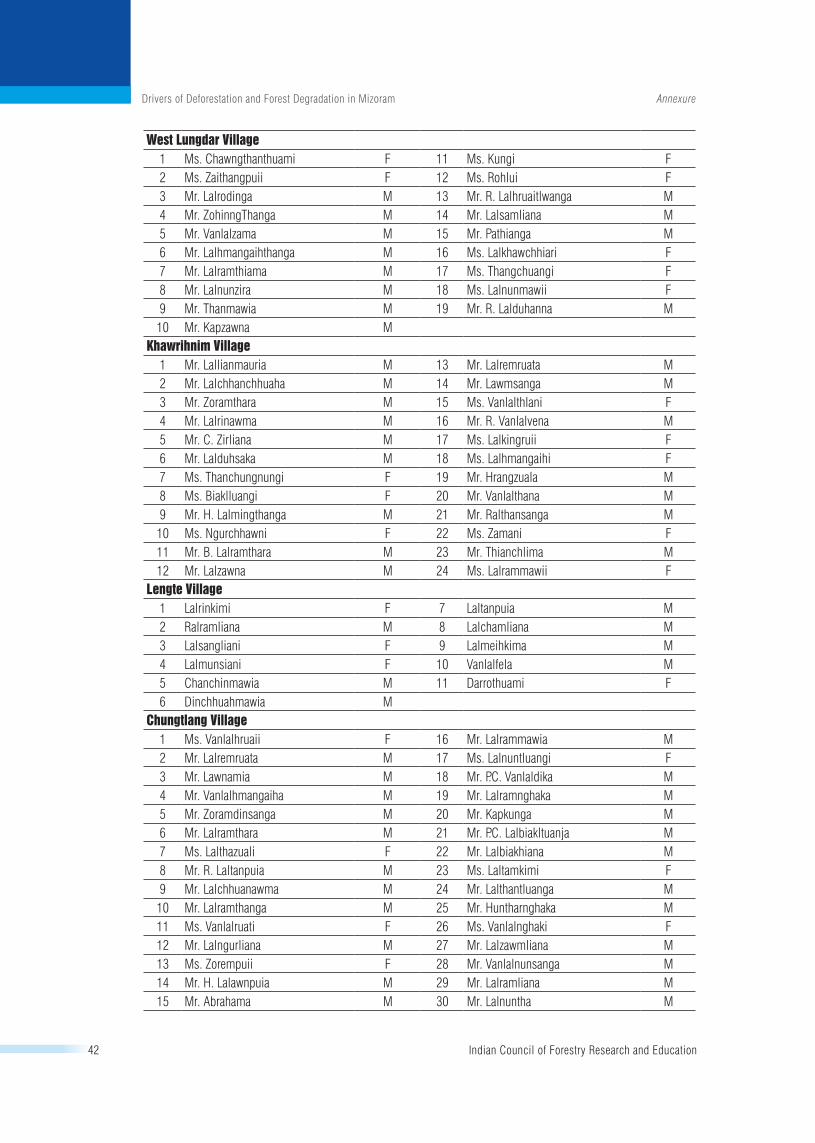
42 Indian Council of Forestry Research and Education
Drivers of Deforestation and Forest Degradation in Mizoram Annexure
WestLungdarVillage1 Ms. Chawngthanthuami F 11 Ms. Kungi F2 Ms. Zaithangpuii F 12 Ms. Rohlui F3 Mr. Lalrodinga M 13 Mr. R. Lalhruaitlwanga M4 Mr. ZohinngThanga M 14 Mr. Lalsamliana M5 Mr. Vanlalzama M 15 Mr. Pathianga M6 Mr. Lalhmangaihthanga M 16 Ms. Lalkhawchhiari F7 Mr. Lalramthiama M 17 Ms. Thangchuangi F8 Mr. Lalnunzira M 18 Ms. Lalnunmawii F9 Mr. Thanmawia M 19 Mr. R. Lalduhanna M10 Mr. Kapzawna M
Khawrihnim Village1 Mr. Lallianmauria M 13 Mr. Lalremruata M2 Mr. Lalchhanchhuaha M 14 Mr. Lawmsanga M3 Mr. Zoramthara M 15 Ms. Vanlalthlani F4 Mr. Lalrinawma M 16 Mr. R. Vanlalvena M5 Mr. C. Zirliana M 17 Ms. Lalkingruii F6 Mr. Lalduhsaka M 18 Ms. Lalhmangaihi F7 Ms. Thanchungnungi F 19 Mr. Hrangzuala M8 Ms. Biaklluangi F 20 Mr. Vanlalthana M9 Mr. H. Lalmingthanga M 21 Mr. Ralthansanga M10 Ms. Ngurchhawni F 22 Ms. Zamani F11 Mr. B. Lalramthara M 23 Mr. Thianchlima M12 Mr. Lalzawna M 24 Ms. Lalrammawii FLengteVillage
1 Lalrinkimi F 7 Laltanpuia M2 Ralramliana M 8 Lalchamliana M3 Lalsangliani F 9 Lalmeihkima M4 Lalmunsiani F 10 Vanlalfela M5 Chanchinmawia M 11 Darrothuami F6 Dinchhuahmawia M
Chungtlang Village1 Ms. Vanlalhruaii F 16 Mr. Lalrammawia M2 Mr. Lalremruata M 17 Ms. Lalnuntluangi F3 Mr. Lawnamia M 18 Mr. P.C. Vanlaldika M4 Mr. Vanlalhmangaiha M 19 Mr. Lalramnghaka M5 Mr. Zoramdinsanga M 20 Mr. Kapkunga M6 Mr. Lalramthara M 21 Mr. P.C. Lalbiakltuanja M7 Ms. Lalthazuali F 22 Mr. Lalbiakhiana M8 Mr. R. Laltanpuia M 23 Ms. Laltamkimi F9 Mr. Lalchhuanawma M 24 Mr. Lalthantluanga M10 Mr. Lalramthanga M 25 Mr. Huntharnghaka M11 Ms. Vanlalruati F 26 Ms. Vanlalnghaki F12 Mr. Lalngurliana M 27 Mr. Lalzawmliana M13 Ms. Zorempuii F 28 Mr. Vanlalnunsanga M14 Mr. H. Lalawnpuia M 29 Mr. Lalramliana M15 Mr. Abrahama M 30 Mr. Lalnuntha M

Acknowledgement
• InternationalCentreforIntegratedMountainandDevelopment(ICIMOD),KathmanduNepal
• DeutscheGesellschaftfurInternationaleZusammenarbeit(GIZ),Germany
• FederalMinistryfortheEnvironment,NatureConservation,BuildingandNuclearSafety,Germany
• RainForestResearchInstitute(RFRI),Jorhat,Assam
• AdvanceResearchCentreforBambooandRattan(ARCBR),Aizawl,Mizoram
• DepartmentofEnvironmentForestandClimate,Aizwal,Mizoram
Guidance and Support• Dr.SureshGairola,DirectorGeneral,ICFRE
• Dr.NeeluGera,DeputyDirectorGeneral(Research),ICFRE
• Dr.R.S.C.Jayaraj,Director,RFRI
• Dr.BhaskarSinghKarky,ResourceEconomist,ICIMOD
• Mr.KaiWindhorst,ChiefTechnicalAdvisor,GIZ
• Mr.M.Z.Singson,Head,ARCBR
• Mr.SaurabhSharma,DFO,Aizawl
• Mr.KarmaPhuntsho,SeniorNRMSpecialist,ICIMOD
• Mr.MuhammadSohail,REDD+Specialist,ICIMOD
• Mr.BasantPant,ProgrammeAssociate,ICIMOD
• Mr.NabinBhattarai,Consultant,ICIMOD
• Dr.Mohd.Shahid,Consultant,ICFRE
Field Support • Mr.UmangThapa,JuniorConsultant,ICFRE
• Mr.Clement,ARCBR
• AllrespondentsfromvillagesReiek,Ailawang,WestLungdhar,Kwarihnim,Lengte,ChungtlangofDistrictMamit,Mizoram

Indian Council of Forestry Research and EducationNew Forest, Dehradun-248006, India
Drivers of Deforestation and Forest Degradation in Mizoram