Embed Size (px)
Citation preview

Driving Forces of Driving Forces of Exports and Investment Exports and Investment
in Icelandin IcelandDr. Helga Kristjánsdóttir
Ministry for Foreign Affairs and the Trade Council of IcelandSeptember 3rd 2004

Overview
1. Overview of data sources on-line
2. Overview of statistics for Iceland together with economic history and future prospects
3. Specific discussion about forces driving exports going out of Iceland, and investment made in Iceland

Data Sources On-line:
• Icetrade.is• Vur.is• Invest.is• Chamber.is• Iceland.org/icex.is• Hagstofa.is/fjr.is• Worldbank.org/data• Imf.org

Statistics - History - Prospects
• The Icelandic economy experienced growth rates above the industrialized countries' average during the years 1996-2001. This led to a period of overheating that peaked in the year 2000 when the current account deficit exceeded 10% of GDP. These imbalances have now been corrected with only a relatively mild recession and in 2002. GDP growth is now expected to be above 3 ½ % in 2004.

Statistics - History - Prospects
• The economy is entering a period of strong growth led by investment in hydro-power facilities and energy-intensive industries.
• The greatest challenge will be to avoid overheating and an unsustainable appreciation of the Icelandic krona during the period of investment-led growth that is expected to last until the end of this decade.

Statistics - History - Prospects
• While risks of overheating should not be underestimated, the economy is in many respects better equipped than in recent years to take on the challenges associated with these investment projects.
• Investments will contribute to increased export revenues and further diversify the economy.

Statistics - History - Prospects
• Monetary Policy• Assuming an unchanged monetary stance
inflation is now forecast below the target for the whole of this year, but will reach the target in early 2005.
• The most likely outlook is still that interest rates will remain unchanged for the time being, then rise as the peak of aluminium-related investments approaches.

Statistics - History - Prospects
% of GDP 97 98 99 00 01 02 03 04 05 06 07 08
Exports 37.2 36.0 35.0 35.2 41.0 39.8 34.8 33.3 32.6 32.5 33.4 35.4
Net FDI equity
0.7 0.8 -0.5 -2.6 -1.4 -1.0 -0.1 1.1 3.9 4.6 3.7 0.3
Net portfolio investment equity
-2.5 -3.0 -3.8 -8.1 -0.2 -2.9 -2.5 -1.1 -1.1 -0.9 -0.7 -0.7

Third session Kyoto, 1-10 December 1997
KYOTO PROTOCOL TO THE UNITED NATIONS FRAMEWORK CONVENTION ON CLIMATE CHANGE
Quantified emission limitation or reduction commitment (percentage of base year or period)
Australia 108 EC 92 Japan 94 Poland* 94 Switzerland 92
Austria 92 Finland 92 Latvia* 92 Portugal 92 UK 92
Belgium 92 France 92 Liechtenstein 92 Romania* 92 USA 93
Bulgaria* 92 Germany 92 Lithuania* 92 Russian Fed* 100
Canada 94 Greece 92 Luxembourg 92 Slovakia* 92
Croatia* 95 Hungary* 94 Monaco 92 Slovenia* 92
Czech Rep* 92 Iceland 110 Netherlands 92 Spain 92
Denmark 92 Ireland 92 New Zealand 100 Sweden 92
Estonia* 92 Italy 92 Norway 101 Ukraine* 100
* Countries that are undergoing the process of transition to a market economy.
Exports and Investment
• Following World War II, the production capacity of industrialized countries increased substantially
• In 1960s large Japanese car manufacturers had to choose between exporting and investing in United States
Background
• Multinational entity (MNE), or a multinational, is a firm with multinational activities
• Vertical FDI – Production located to gain access to abundant factors (Helpman, 1984)
• Horizontal FDI – Production located to overcome trade costs and gain market access (Markusen, 1984)

Background
• Most FDI among developed countries, i.e., East and West, rather than North and South
• Small open economies particularly dependent on exports and FDI
• Export ratio of Iceland is comparatively small, or 34% of GDP in 1999• Scandinavian countries’ export ratios ranged
from 37-44%• Japan and US had export ratios below 12%
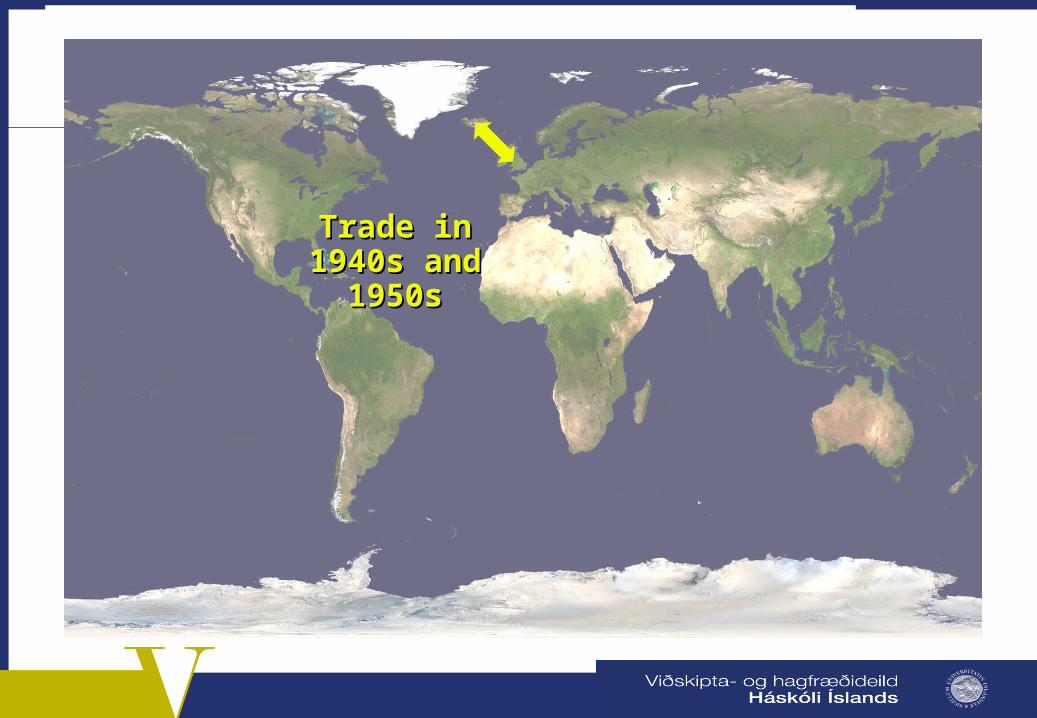
Trade in Trade in 1940s and 1940s and
1950s1950s
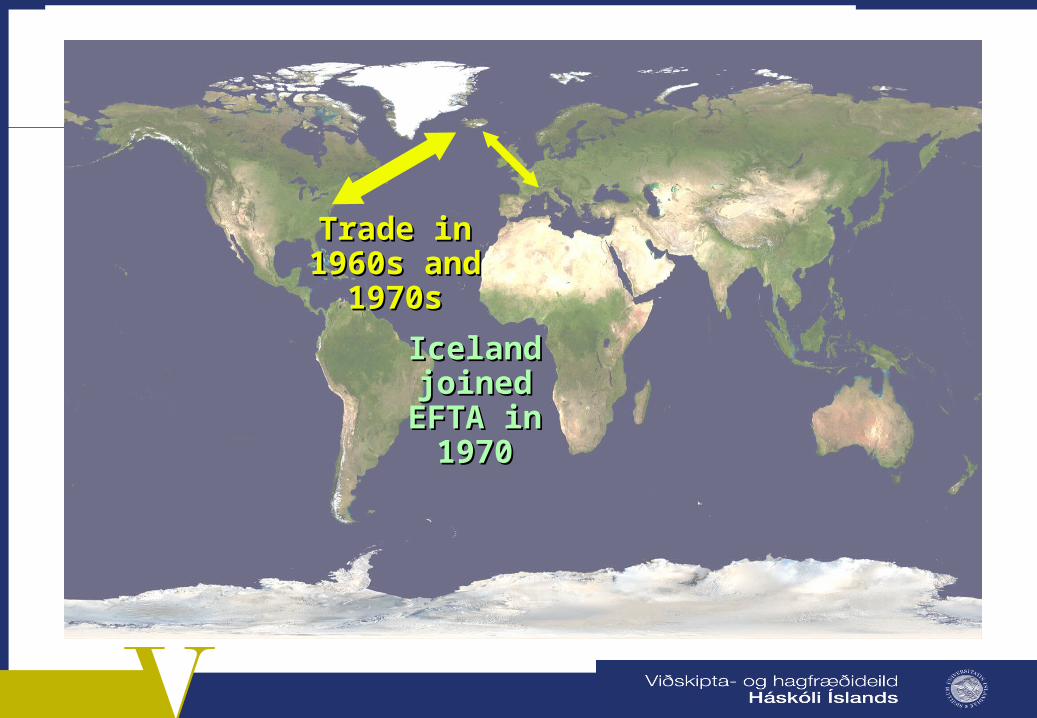
Trade in Trade in 1960s and 1960s and
1970s1970s
Iceland Iceland joined EFTA joined EFTA
in 1970in 1970

Trade in Trade in 1980s and 1980s and
1990s1990s

Overview
Discussion overview:
1. A Gravity Model for Exports From Iceland
2. Determinants of Foreign Direct Investment in Iceland
3. The Knowledge-Capital Model and Small Countries
4. What Drives Sector Allocation of Foreign Direct Investment in Iceland?

Ch. 1: Determinants of Exports
• Export volume explained by market size and geographical location
• Krugman (1991) observes Iceland’s export ratio to be smaller than expected
• Gylfason (1999) finds it to be only 2/3 of its expected value

Ch. 1: Determinants of Exports
• In my research I have tested for the following:
• Sector and trade bloc fixed effects, both individually and simultaneously
• Fishing, Manufacturing, Power, Other • EFTA, EU, NAFTA, NON-bloc
• Correcting for small size of Iceland
• Also test some marine product subsamples
Ch. 1: Determinants of Exports
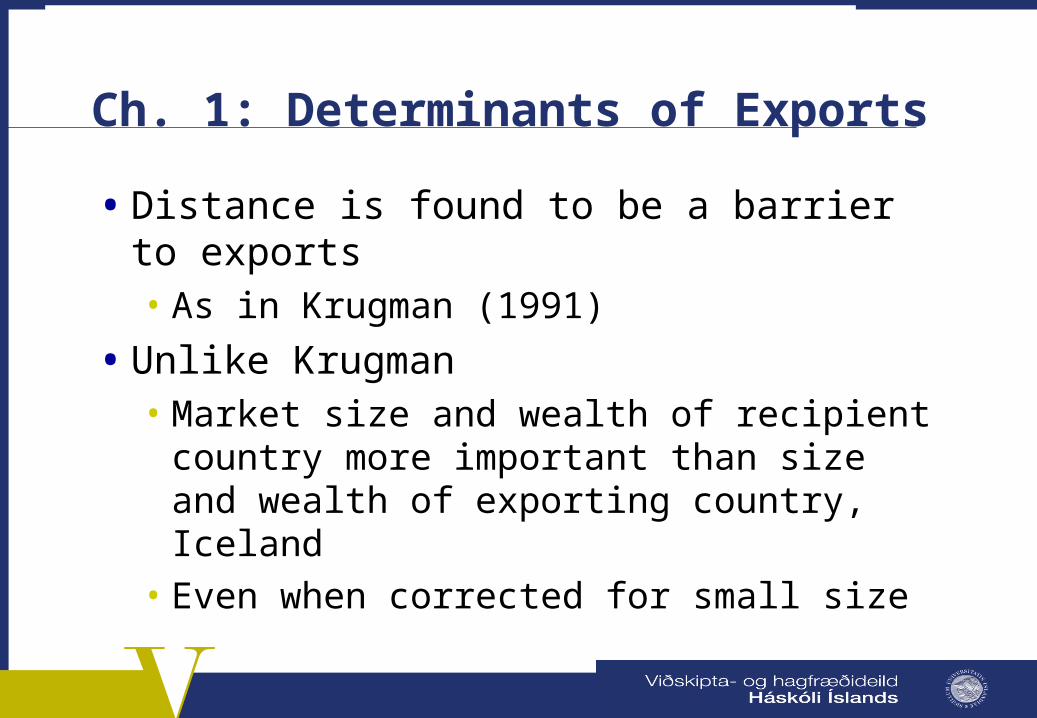
• Distance is found to be a barrier to exports• As in Krugman (1991)
• Unlike Krugman• Market size and wealth of recipient country
more important than size and wealth of exporting country, Iceland
• Even when corrected for small size

Ch. 2: Determinants of FDI
• Trade literature: Foreign direct investment (FDI) viewed as form of trade• Trade in financial capital
• FDI: Foreign ownership of controlling stock in a particular firm (generally 10% or more)
• Inward FDI sectors in Iceland• Power, Com & Fin, Tel & Trans, Other
• Study if FDI in Iceland can be explained by location, market size, and several other factors

Ch. 2.: Determinants of FDI
• Trade literature: Gravity models increasingly popular for estimating FDI • Brainard (1997); Mody, Razin and Sadka
(2003)
• Fixed country and sector effects • Jeon and Stone (1999) and di Mauro (2000)
used countries and sectors• Here also trade bloc effects

Ch. 2.: Determinants of FDI
• Gravity model useful in predicting FDI levels• Consistent with previous literature
• Unlike earlier findings, wealth more important than market size
• Effects of market size variables (GDP, POP) often close to being equal and opposite in sign
• Distance negatively affects FDI, and FDI appears to be driven more by wealth effects than by market size effects
Ch. 3.: Knowledge-Capital Model
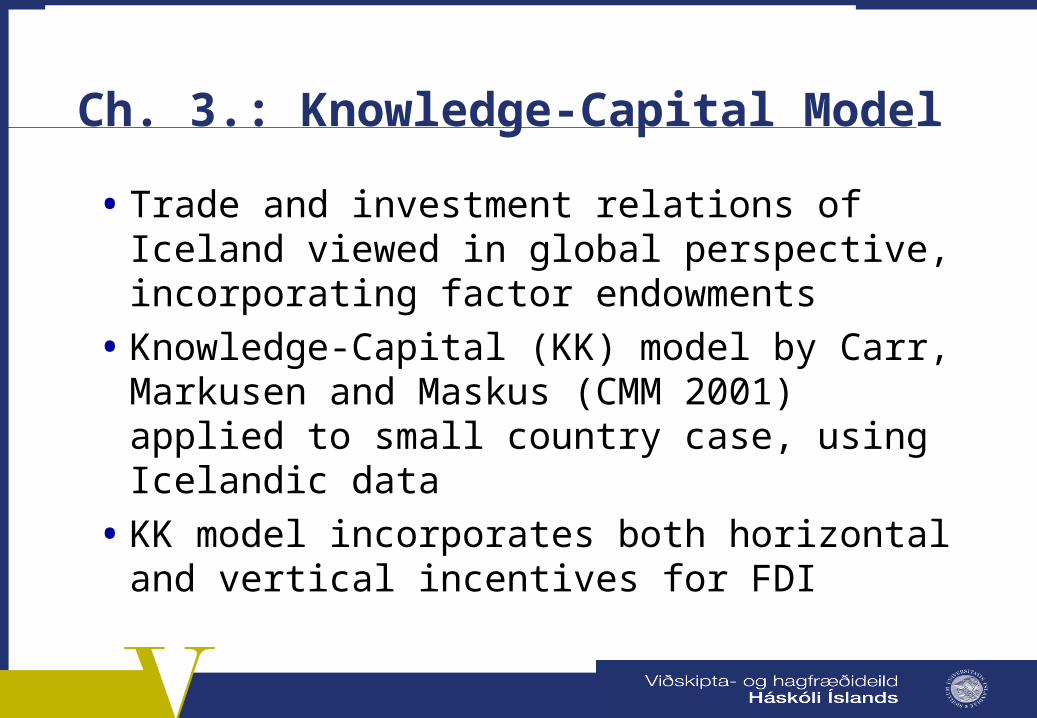
• Trade and investment relations of Iceland viewed in global perspective, incorporating factor endowments
• Knowledge-Capital (KK) model by Carr, Markusen and Maskus (CMM 2001) applied to small country case, using Icelandic data
• KK model incorporates both horizontal and vertical incentives for FDI

Edgeworth Box
Os = Origin for Source Country
Unskilled Labor
Origin for Host Country = Oh
Unskilled host countryskill(i)-skill(j)>0
Skilled hostcountryskill(i)-skill(j)<0
Small host countryY(i)-Y(j)>0
Locationof Iceland
RELATIVEENDOWMENTS
RELATIVESIZE
Sdiff=0
Large host countryY(i)-Y(j)<0
Ydiff=0
Skilled Labor

Ch. 3.: Knowledge-Capital Model
• Basic KK specification and modification
• Thoroughly analyze knowledge effects• Specification restrictions, enlarged sample,
outlier omission, (occupation)• Blonigen, Davies, and Head (2003)• Davies (2003)• Also proxy by education and per capita wealth• Squared and cubed skill level and subsamples

Ch. 3.: Knowledge-Capital Model
• Driving forces for FDI in Iceland appear to be different from those in large countries
• Potential data difficulties when there are large differences in GDPs or population
• Alternatively, omission of important factor endowments such as energy or fish stock

Ch. 4.: Sector Allocation of FDI
• Skilled and unskilled labor may not be right endowment approach for Iceland
• Inward FDI• Sector decomposition, resource endowments
• Power, Com & Fin., Tel & Transport, Other • Waldkirch (2003)
• Also natural resources, infrastructure, pollution quotas and government stability

Ch. 4.: Sector Allocation of FDI
• FDI sector shares and levels• FDI shares reflect relative size of each sector
within a particular year of investment
• Brainard (1997)• Inward and outward FDI share proxies separately
as share of affiliate sales in total exp
• Slaughter (2000)• FDI proxied by investment share (measured as
majority-owned affiliates) in overall MNE investment
Threshold Cost and FDI
FDI
Market Size
Ch. 4.: Sector Allocation of FDI
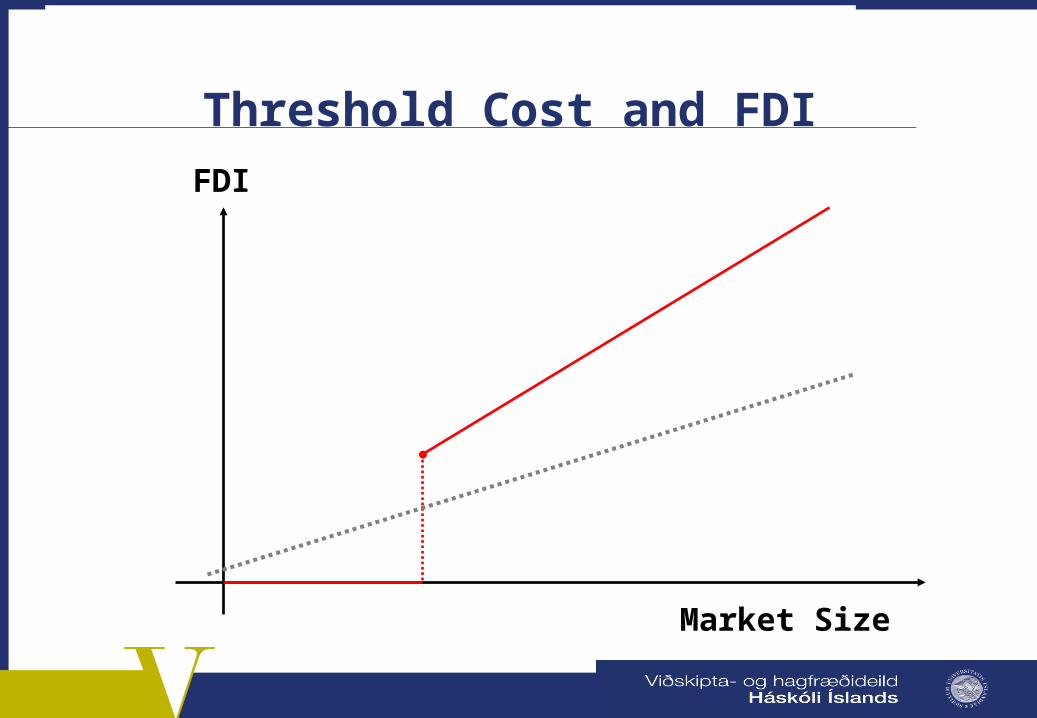
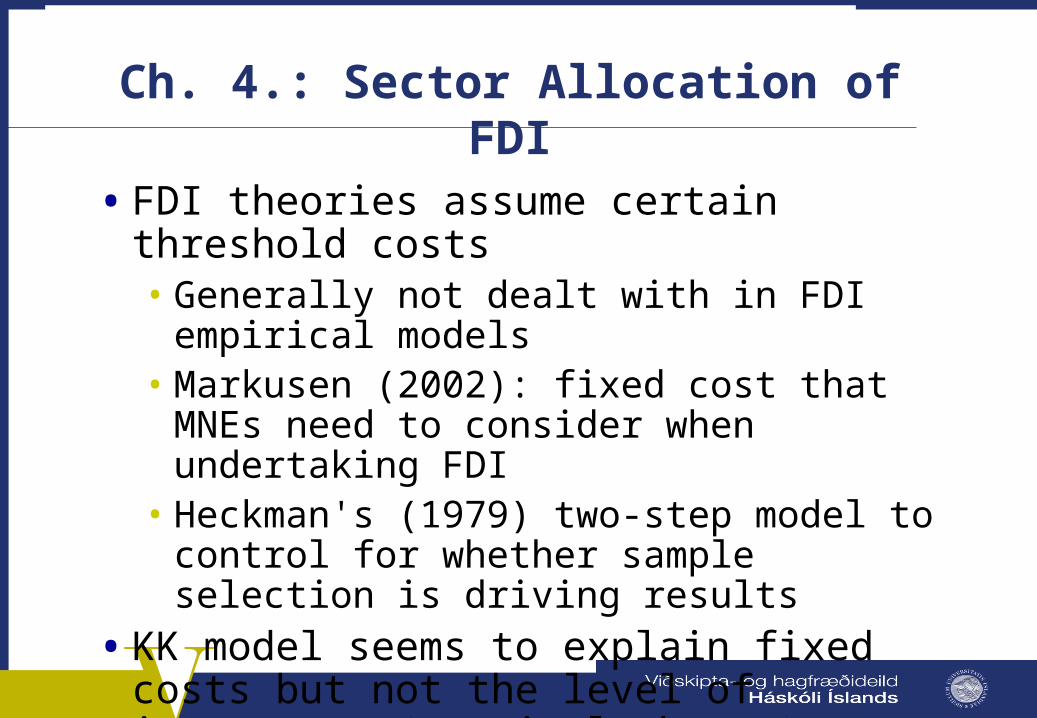
• FDI theories assume certain threshold costs• Generally not dealt with in FDI empirical models• Markusen (2002): fixed cost that MNEs need to
consider when undertaking FDI• Heckman's (1979) two-step model to control for
whether sample selection is driving results
• KK model seems to explain fixed costs but not the level of investment (marginal change)
• However, gravity model provides information on both

Ch. 4.: Sector Allocation of FDI
• Results different from what was anticipated since KK model still does not perform very well for Iceland
• Heckman procedure application to gravity rather than KK model, since this gives better indication of how host-country characteristics affect FDI
• However, endowment inclusion in gravity model can be credited to KK literature

Conclusions I
• Geographic approach to trade theory applied to small open economies like Iceland• With incorporation of gravity models
• Gravity forces appear to describe Iceland's exports• Distance hampers trade whereas size of trade
partners encourages trade
• Distance effect apparent not only for export• Also important for FDI in Iceland

Conclusions II
• Reasons to prefer gravity model for FDI• Also find support for the intuition behind KK
model, i.e., that endowments matter• Use more endowment proxies than merely the
knowledge-endowment proxies • Employ proxies for endowments that are
crucial to Icelandic economy• Useful both for explaining levels of investment
and fixed costs typical of FDI models