Embed Size (px)
Citation preview
Driving High Performance
through Differentiation
Investor & Analyst Conference October 11, 2012
Copyright © 2012 Accenture All rights reserved. 2
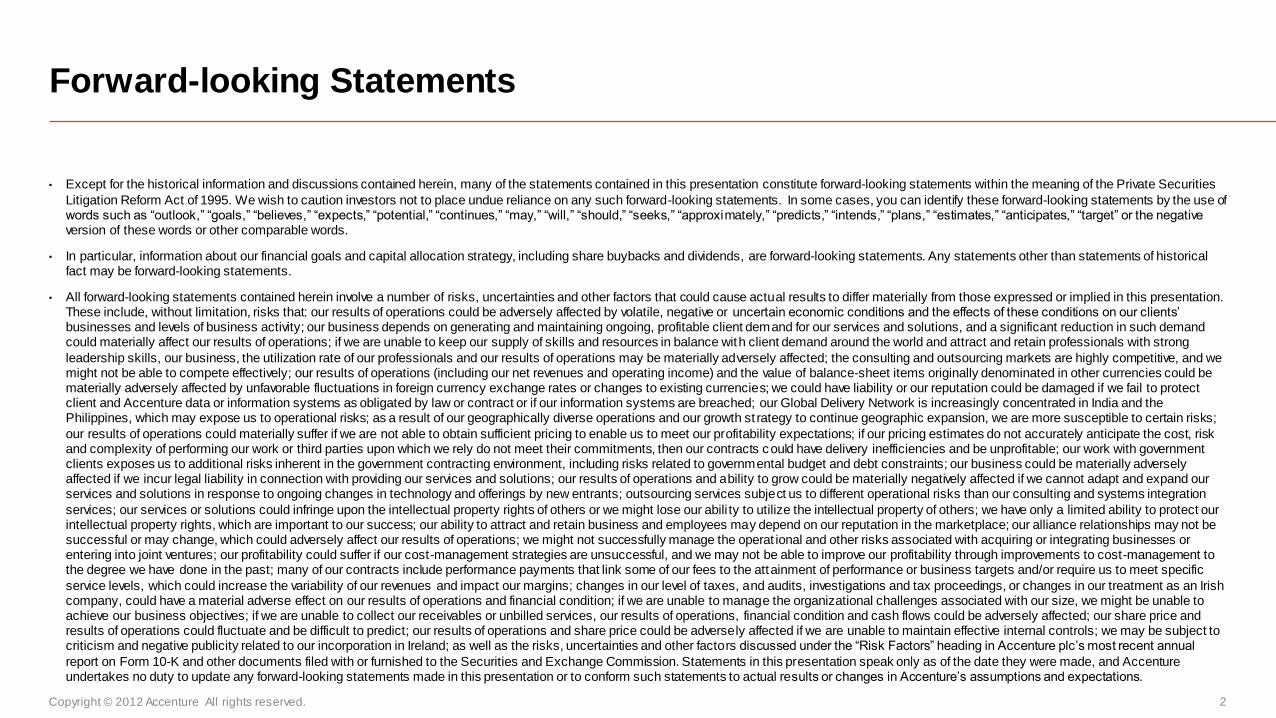
• Except for the historical information and discussions contained herein, many of the statements contained in this presentation constitute forward-looking statements within the meaning of the Private Securities
Litigation Reform Act of 1995. We wish to caution investors not to place undue reliance on any such forward-looking statements. In some cases, you can identify these forward-looking statements by the use of words such as “outlook,” “goals,” “believes,” “expects,” “potential,” “continues,” “may,” “will,” “should,” “seeks,” “approximately,” “predicts,” “intends,” “plans,” “estimates,” “anticipates,” “target” or the negative version of these words or other comparable words.
• In particular, information about our financial goals and capital allocation strategy, including share buybacks and dividends, are forward-looking statements. Any statements other than statements of historical fact may be forward-looking statements.
• All forward-looking statements contained herein involve a number of risks, uncertainties and other factors that could cause actual results to differ materially from those expressed or implied in this presentation. These include, without limitation, risks that: our results of operations could be adversely affected by volatile, negative or uncertain economic conditions and the effects of these conditions on our clients’ businesses and levels of business activity; our business depends on generating and maintaining ongoing, profitable client demand for our services and solutions, and a significant reduction in such demand could materially affect our results of operations; if we are unable to keep our supply of skills and resources in balance with client demand around the world and attract and retain professionals with strong
leadership skills, our business, the utilization rate of our professionals and our results of operations may be materially adversely affected; the consulting and outsourcing markets are highly competitive, and we might not be able to compete effectively; our results of operations (including our net revenues and operating income) and the value of balance-sheet items originally denominated in other currencies could be materially adversely affected by unfavorable fluctuations in foreign currency exchange rates or changes to existing currencies; we could have liability or our reputation could be damaged if we fail to protect client and Accenture data or information systems as obligated by law or contract or if our information systems are breached; our Global Delivery Network is increasingly concentrated in India and the Philippines, which may expose us to operational risks; as a result of our geographically diverse operations and our growth st rategy to continue geographic expansion, we are more susceptible to certain risks;
our results of operations could materially suffer if we are not able to obtain sufficient pricing to enable us to meet our profitability expectations; if our pricing estimates do not accurately anticipate the cost, risk and complexity of performing our work or third parties upon which we rely do not meet their commitments, then our contracts could have delivery inefficiencies and be unprofitable; our work with government clients exposes us to additional risks inherent in the government contracting environment, including risks related to governmental budget and debt constraints; our business could be materially adversely affected if we incur legal liability in connection with providing our services and solutions; our results of operations and ability to grow could be materially negatively affected if we cannot adapt and expand our services and solutions in response to ongoing changes in technology and offerings by new entrants; outsourcing services subject us to different operational risks than our consulting and systems integration
services; our services or solutions could infringe upon the intellectual property rights of others or we might lose our abili ty to utilize the intellectual property of others; we have only a limited ability to protect our intellectual property rights, which are important to our success; our ability to attract and retain business and employees may depend on our reputation in the marketplace; our alliance relationships may not be successful or may change, which could adversely affect our results of operations; we might not successfully manage the operat ional and other risks associated with acquiring or integrating businesses or entering into joint ventures; our profitability could suffer if our cost-management strategies are unsuccessful, and we may not be able to improve our profitability through improvements to cost-management to the degree we have done in the past; many of our contracts include performance payments that link some of our fees to the attainment of performance or business targets and/or require us to meet specific
service levels, which could increase the variability of our revenues and impact our margins; changes in our level of taxes, and audits, investigations and tax proceedings, or changes in our treatment as an Irish company, could have a material adverse effect on our results of operations and financial condition; if we are unable to manage the organizational challenges associated with our size, we might be unable to achieve our business objectives; if we are unable to collect our receivables or unbilled services, our results of operations, financial condition and cash flows could be adversely affected; our share price and results of operations could fluctuate and be difficult to predict; our results of operations and share price could be adversely affected if we are unable to maintain effective internal controls; we may be subject to criticism and negative publicity related to our incorporation in Ireland; as well as the risks, uncertainties and other factors discussed under the “Risk Factors” heading in Accenture plc’s most recent annual
report on Form 10-K and other documents filed with or furnished to the Securities and Exchange Commission. Statements in this presentation speak only as of the date they were made, and Accenture undertakes no duty to update any forward-looking statements made in this presentation or to conform such statements to actual results or changes in Accenture’s assumptions and expectations.
Forward-looking Statements

Pamela Craig Chief Financial Officer
Copyright © 2012 Accenture All rights reserved. 4
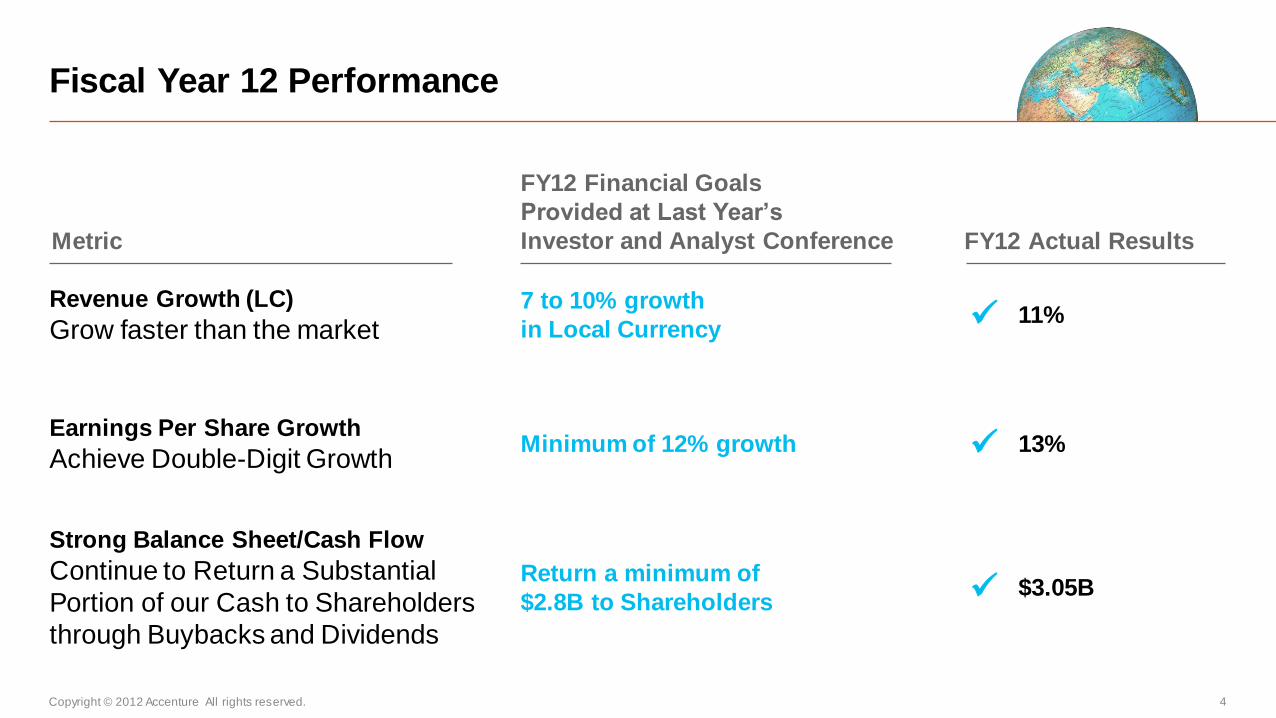
Fiscal Year 12 Performance
Revenue Growth (LC)
Grow faster than the market 7 to 10% growth
in Local Currency
Strong Balance Sheet/Cash Flow
Continue to Return a Substantial
Portion of our Cash to Shareholders
through Buybacks and Dividends
Return a minimum of
$2.8B to Shareholders
FY12 Financial Goals
Provided at Last Year’s
Investor and Analyst Conference FY12 Actual Results Metric
Minimum of 12% growth Earnings Per Share Growth
Achieve Double-Digit Growth
13%
11%
$3.05B
Copyright © 2012 Accenture All rights reserved. 5
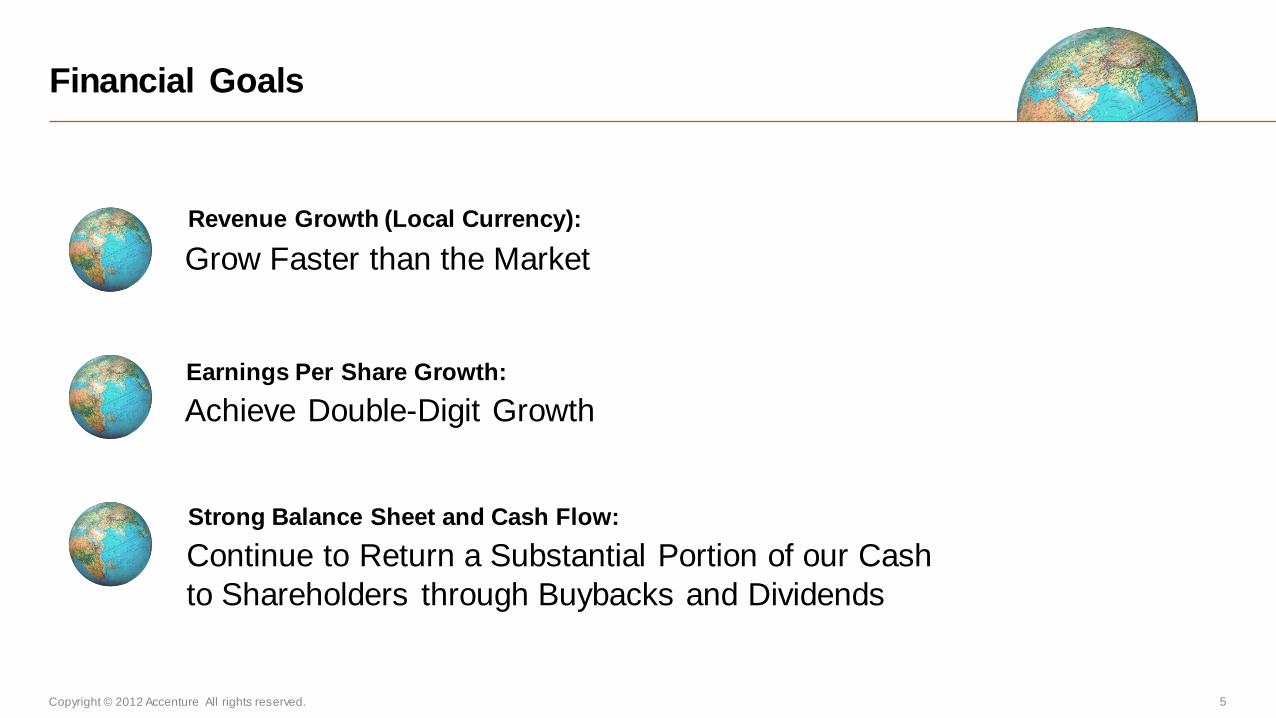
Financial Goals
Revenue Growth (Local Currency):
Earnings Per Share Growth:
Strong Balance Sheet and Cash Flow:
Grow Faster than the Market
Achieve Double-Digit Growth
Continue to Return a Substantial Portion of our Cash
to Shareholders through Buybacks and Dividends
Copyright © 2012 Accenture All rights reserved. 6
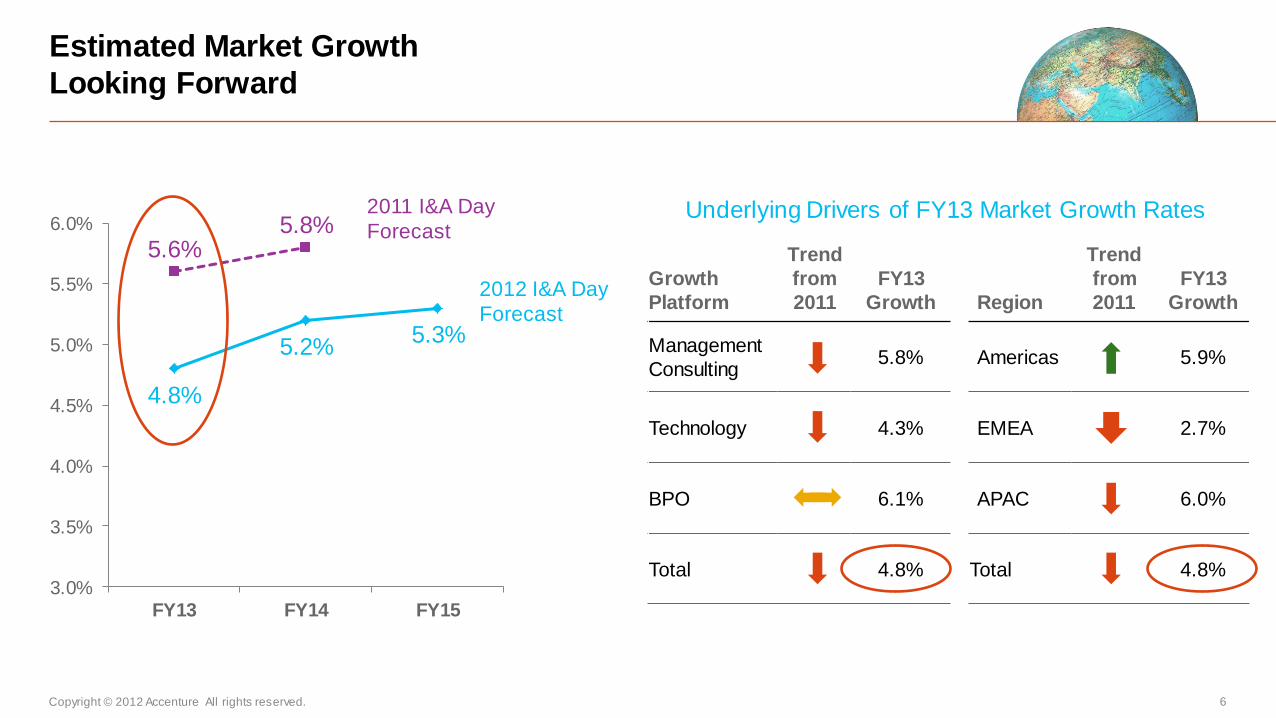
Estimated Market Growth
Looking Forward
Growth
Platform
Trend
from
2011
FY13
Growth Region
Trend
from
2011
FY13
Growth
Management
Consulting 5.8% Americas 5.9%
Technology 4.3% EMEA 2.7%
BPO 6.1% APAC 6.0%
Total 4.8% Total 4.8%
Underlying Drivers of FY13 Market Growth Rates
4.8%
5.2% 5.3%
5.6% 5.8%
3.0%
3.5%
4.0%
4.5%
5.0%
5.5%
6.0%
FY13 FY14 FY15
2012 I&A Day
Forecast
2011 I&A Day
Forecast
Copyright © 2012 Accenture All rights reserved. 7
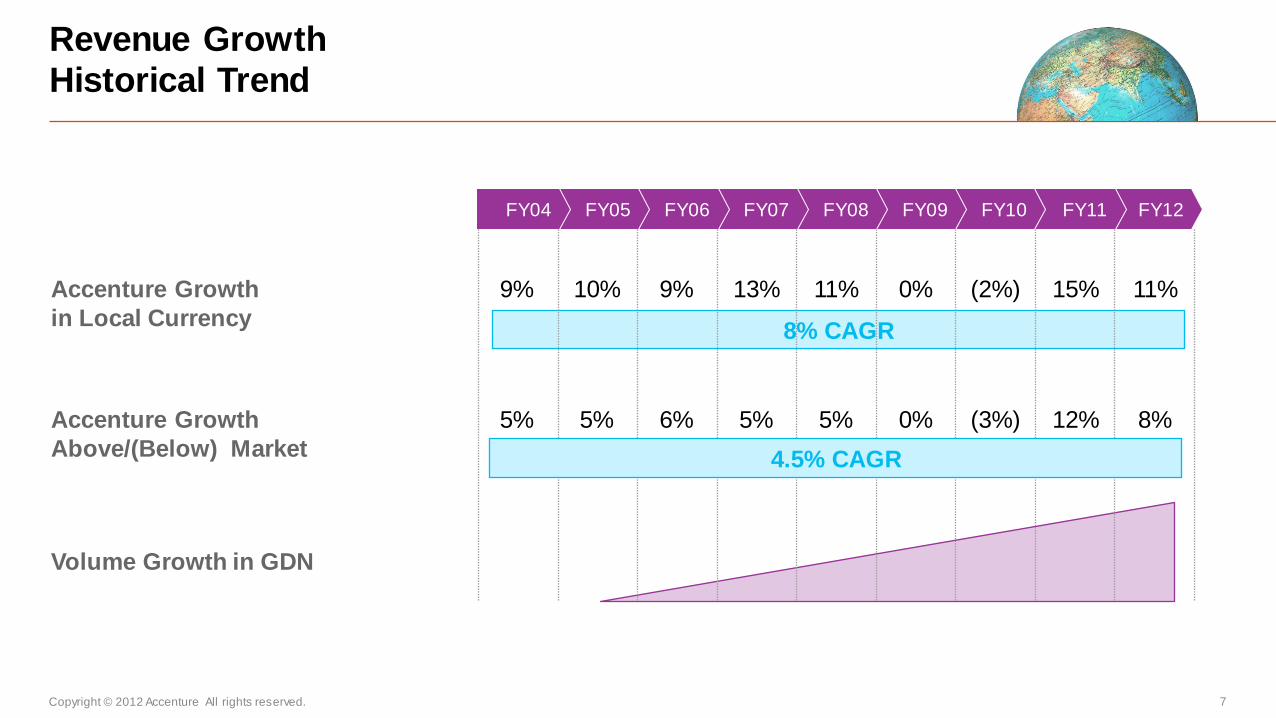
FY12 FY11 FY10 FY09 FY08 FY07 FY06 FY05 FY04
Accenture Growth
in Local Currency
(2%) 0% 11% 13% 9% 10% 9% 15% 11%
8% CAGR
Revenue Growth Historical Trend
Accenture Growth
Above/(Below) Market
(3%) 0% 5% 5% 6% 5% 5% 12% 8%
Volume Growth in GDN
4.5% CAGR

Copyright © 2012 Accenture All rights reserved. 8
Macro Environment Continued Uncertainty
Copyright © 2012 Accenture All rights reserved. 9
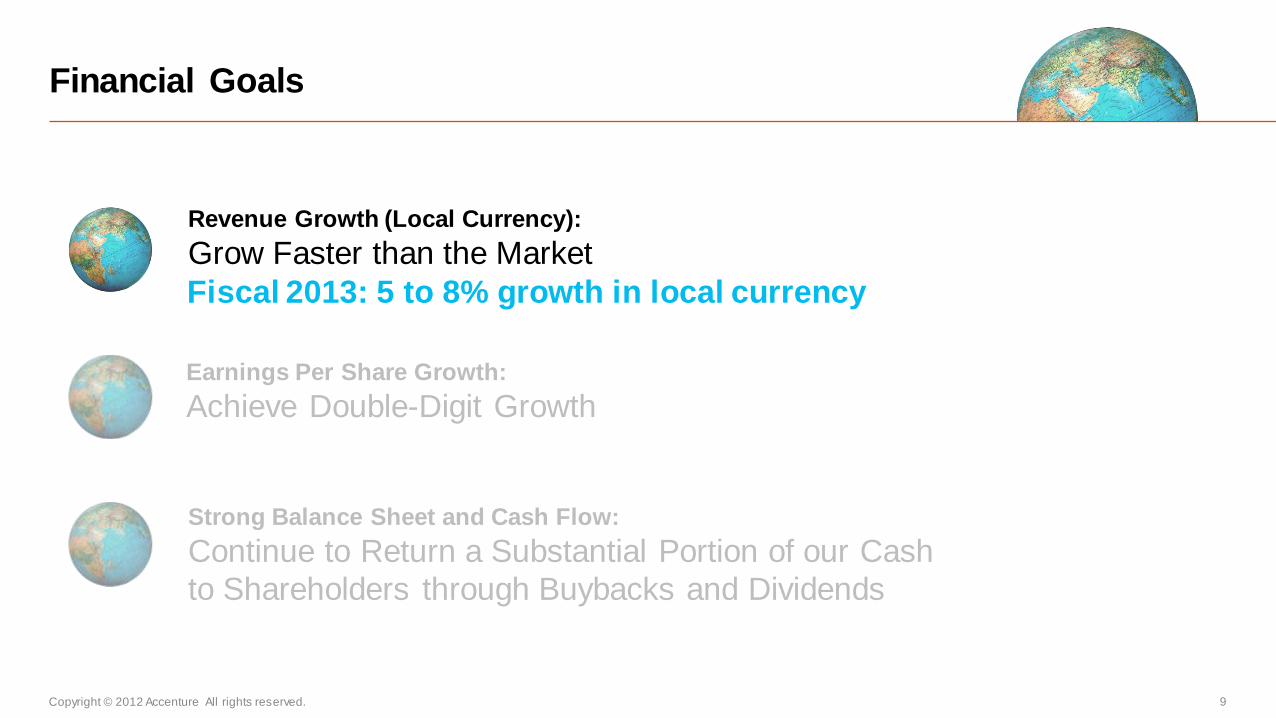
Financial Goals
Fiscal 2013: 5 to 8% growth in local currency
Revenue Growth (Local Currency):
Grow Faster than the Market
Earnings Per Share Growth:
Achieve Double-Digit Growth
Strong Balance Sheet and Cash Flow:
Continue to Return a Substantial Portion of our Cash
to Shareholders through Buybacks and Dividends
Copyright © 2012 Accenture All rights reserved. 10
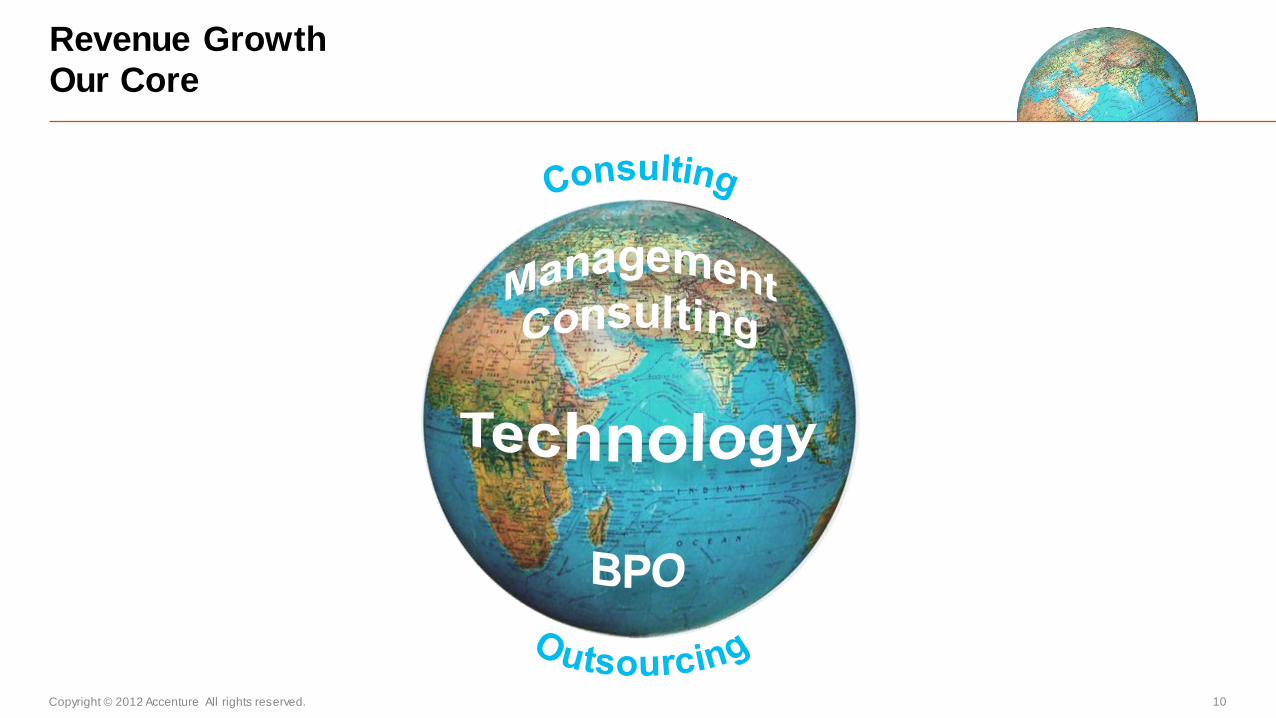
Revenue Growth Our Core
Copyright © 2012 Accenture All rights reserved. 11
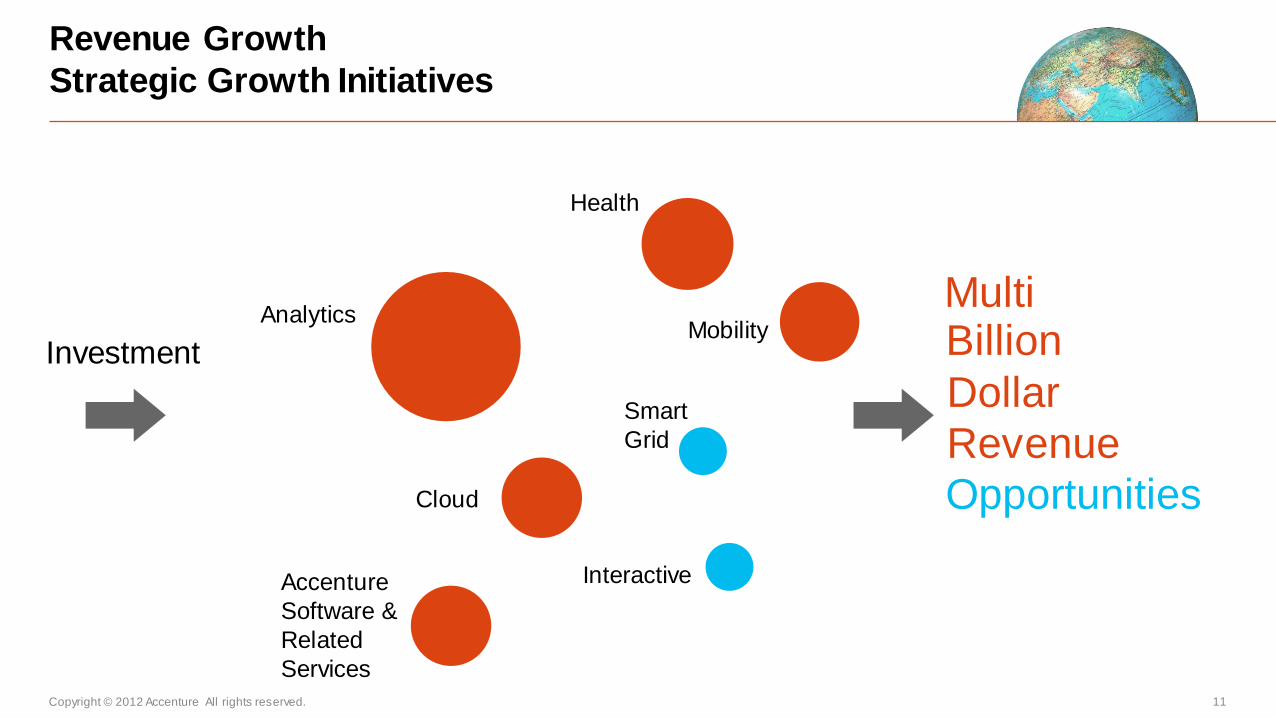
Revenue Growth
Strategic Growth Initiatives
Billion
Dollar
Revenue
Investment Mobility
Smart
Grid
Cloud
Interactive Accenture
Software &
Related
Services
Analytics
Health
Multi
Opportunities
Copyright © 2012 Accenture All rights reserved. 12
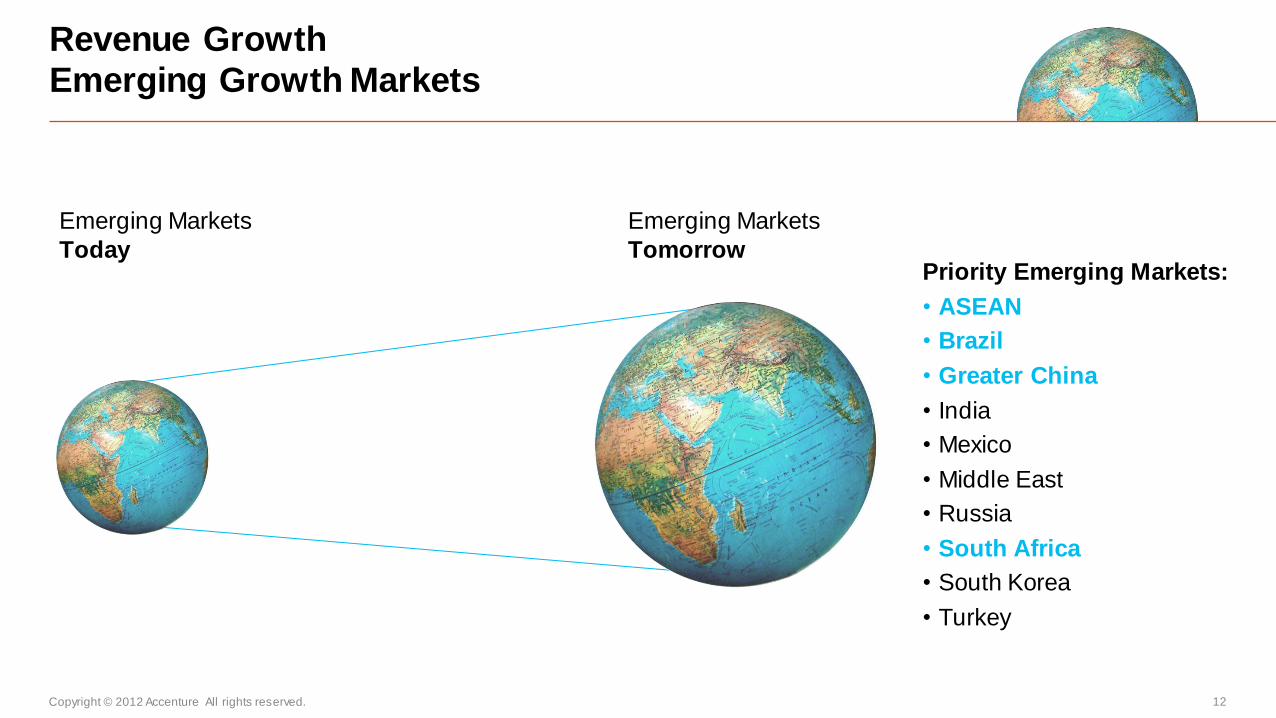
Revenue Growth Emerging Growth Markets
Emerging Markets
Today
Emerging Markets
Tomorrow Priority Emerging Markets:
• ASEAN
• Brazil
• Greater China
• India
• Mexico
• Middle East
• Russia
• South Africa
• South Korea
• Turkey

Copyright © 2012 Accenture All rights reserved. 13
Financial Goals
Fiscal 2013: 10 to 12% growth
Revenue Growth (Local Currency):
Grow Faster than the Market
Earnings Per Share Growth:
Achieve Double-Digit Growth
Strong Balance Sheet and Cash Flow:
Continue to Return a Substantial Portion of our Cash
to Shareholders through Buybacks and Dividends
Copyright © 2012 Accenture All rights reserved. 14
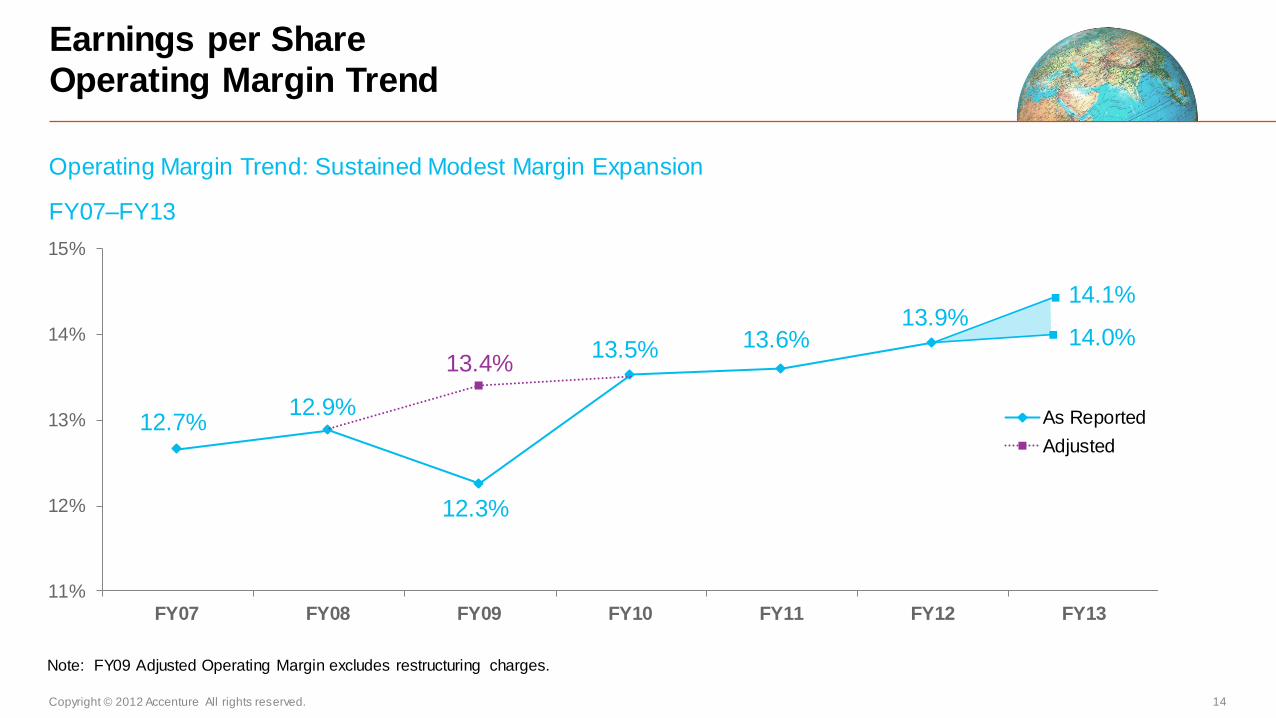
Earnings per Share Operating Margin Trend
Operating Margin Trend: Sustained Modest Margin Expansion
FY07–FY13
14.1%
14.0%
Note: FY09 Adjusted Operating Margin excludes restructuring charges.
12.7% 12.9%
12.3%
13.5% 13.6% 13.9%
13.4%
11%
12%
13%
14%
15%
FY07 FY08 FY09 FY10 FY11 FY12 FY13
As Reported
Adjusted
Copyright © 2012 Accenture All rights reserved. 15
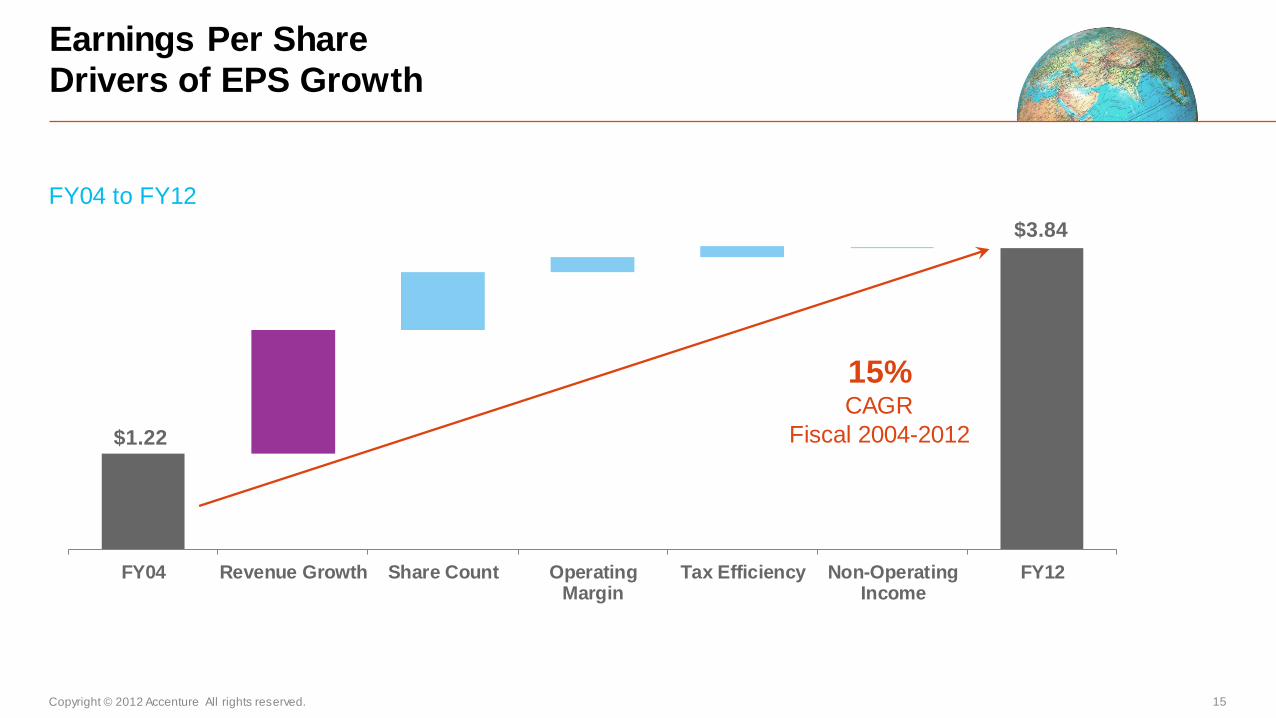
$1.22
$3.84
FY04 Revenue Growth Share Count OperatingMargin
Tax Efficiency Non-OperatingIncome
FY12
Earnings Per Share Drivers of EPS Growth
FY04 to FY12
15% CAGR
Fiscal 2004-2012
Copyright © 2012 Accenture All rights reserved. 16
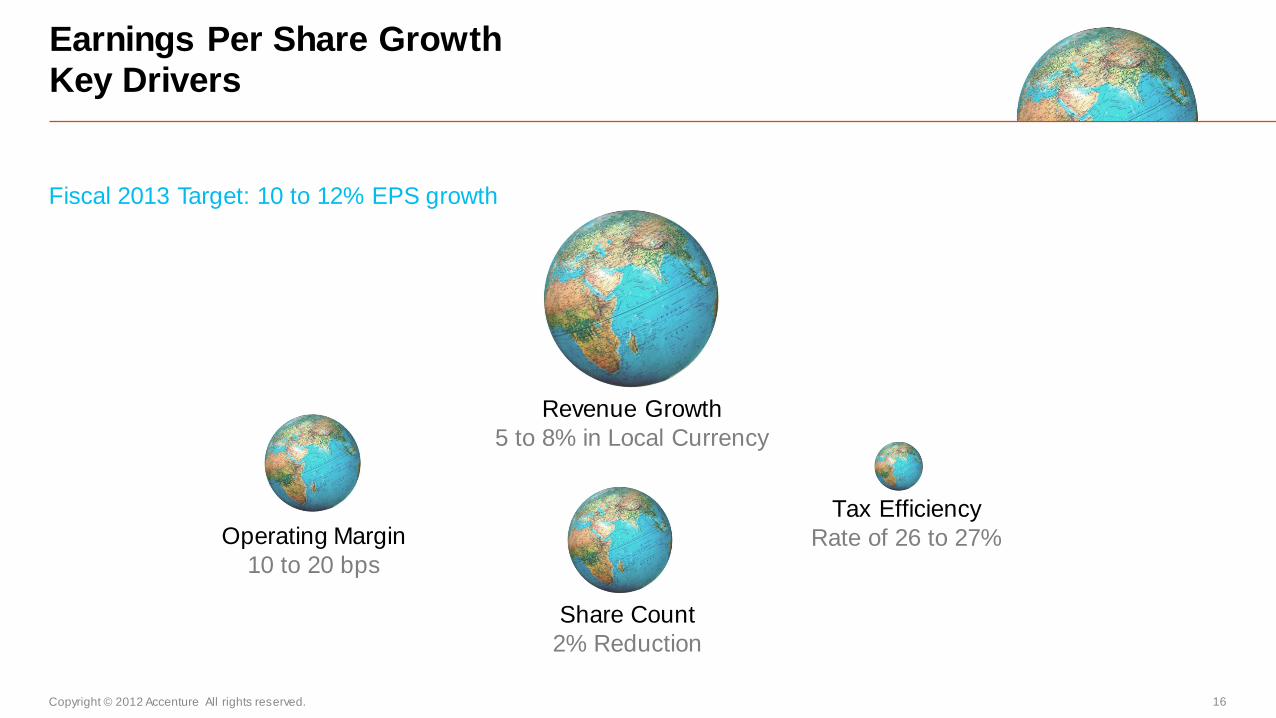
Earnings Per Share Growth Key Drivers
Fiscal 2013 Target: 10 to 12% EPS growth
Revenue Growth
5 to 8% in Local Currency
Operating Margin
10 to 20 bps
Share Count
2% Reduction
Tax Efficiency
Rate of 26 to 27%

Copyright © 2012 Accenture All rights reserved. 17
Financial Goals
Fiscal 2013: Return a Minimum of $3.3B to
Shareholders through Repurchases and Dividends
Revenue Growth (Local Currency):
Grow Faster than the Market
Earnings Per Share Growth:
Achieve Double-Digit Growth
Strong Balance Sheet and Cash Flow:
Continue to Return a Substantial Portion of our Cash
to Shareholders through Buybacks and Dividends
Copyright © 2012 Accenture All rights reserved. 18
0.0%
0.5%
1.0%
1.5%
2.0%
2.5%
3.0%
$0.00
$0.20
$0.40
$0.60
$0.80
$1.00
$1.20
$1.40
$1.60
$1.80
FY06 FY07 FY08 FY09 FY10 FY11 FY12 FY13
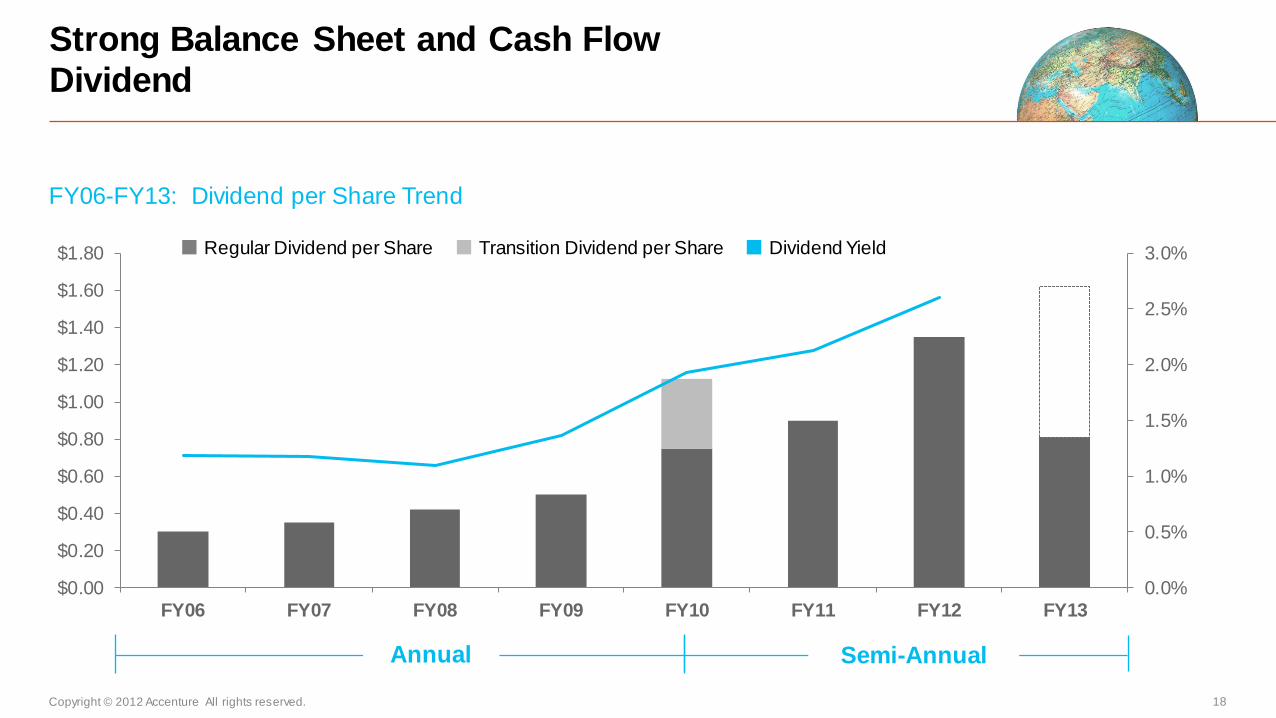
Strong Balance Sheet and Cash Flow Dividend
FY06-FY13: Dividend per Share Trend
Annual Semi-Annual
Regular Dividend per Share Dividend Yield Transition Dividend per Share
Copyright © 2012 Accenture All rights reserved. 19
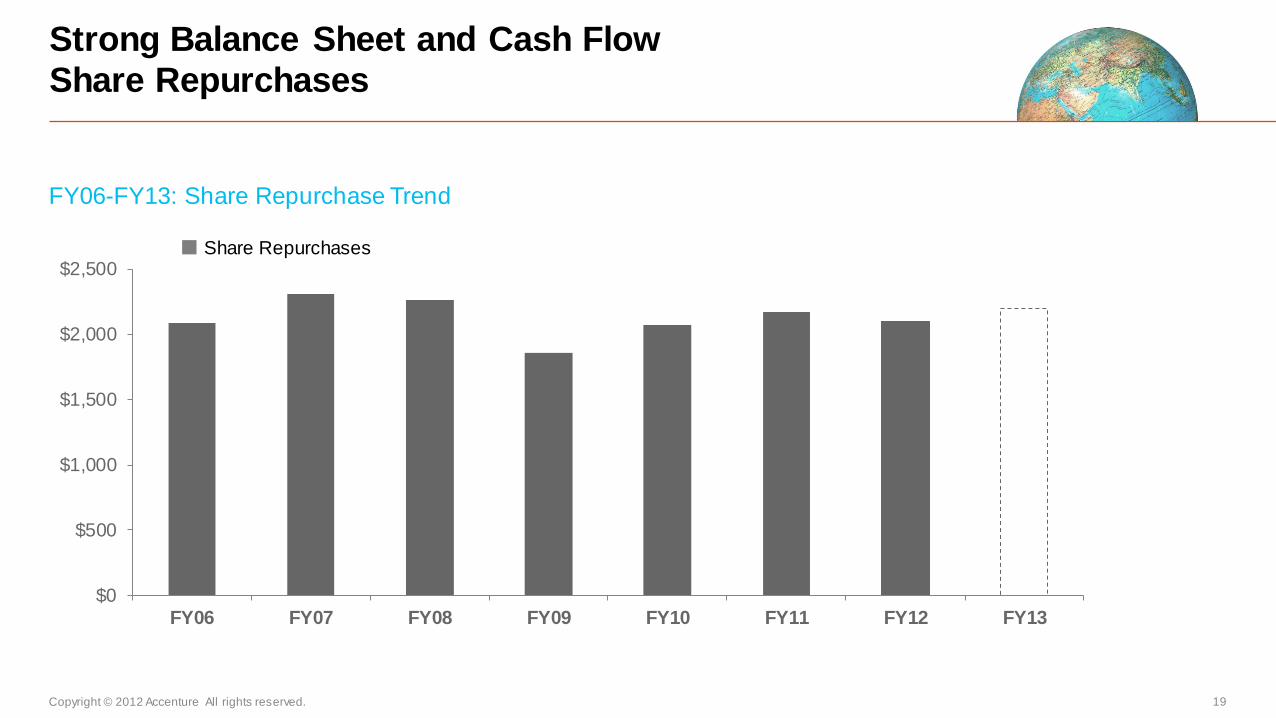
Strong Balance Sheet and Cash Flow Share Repurchases
FY06-FY13: Share Repurchase Trend
$0
$500
$1,000
$1,500
$2,000
$2,500
FY06 FY07 FY08 FY09 FY10 FY11 FY12 FY13
Share Repurchases
Copyright © 2012 Accenture All rights reserved. 20
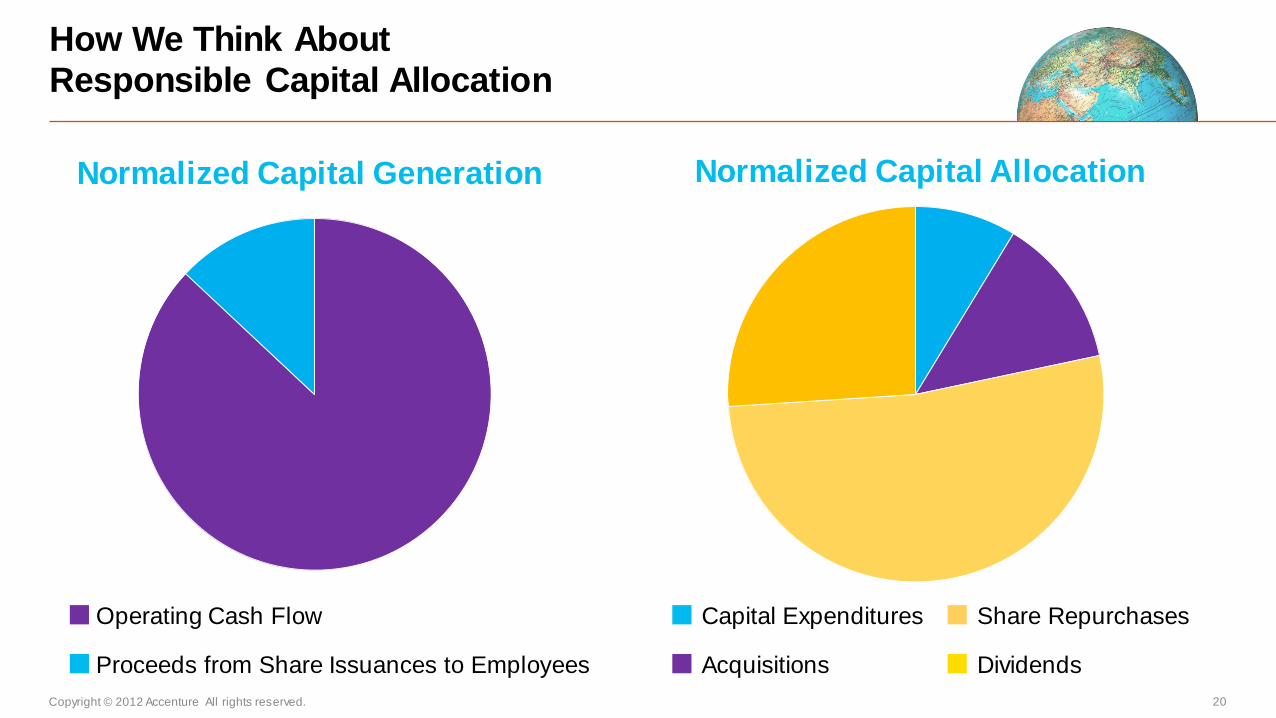
How We Think About Responsible Capital Allocation
Normalized Capital Generation Normalized Capital Allocation
Operating Cash Flow
Proceeds from Share Issuances to Employees
Capital Expenditures
Acquisitions
Share Repurchases
Dividends
Copyright © 2012 Accenture All rights reserved. 21
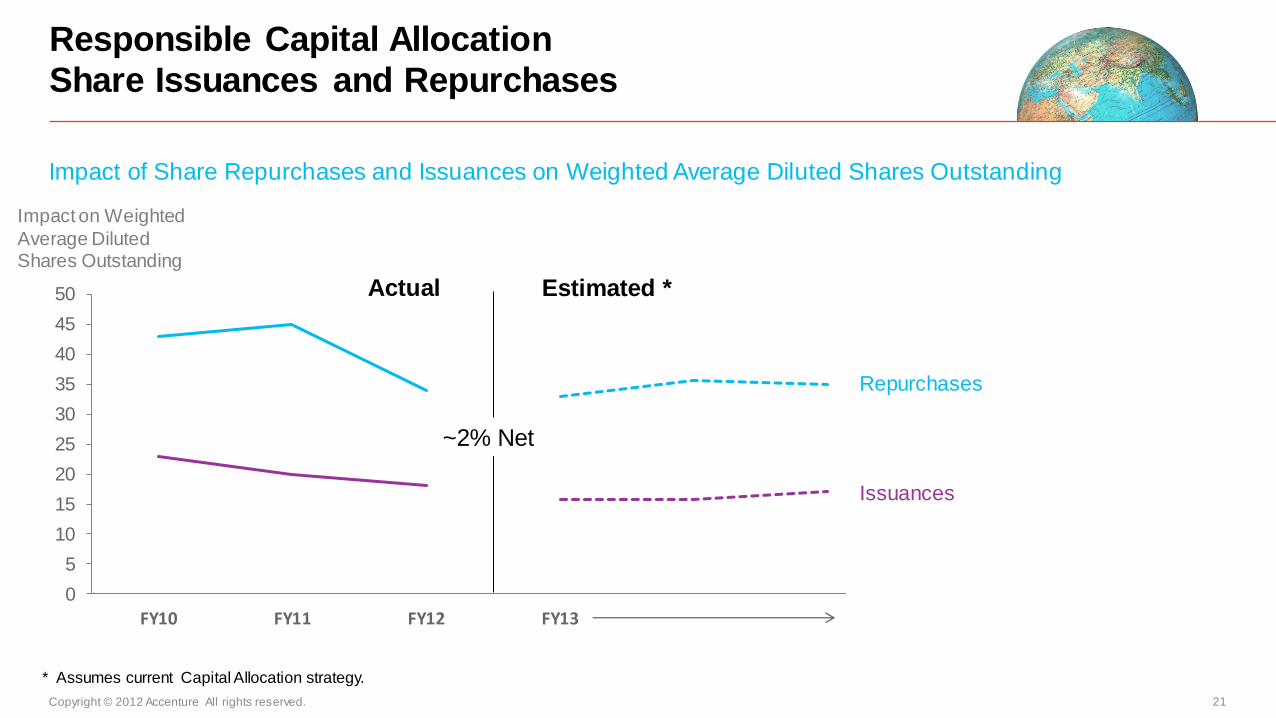
Responsible Capital Allocation Share Issuances and Repurchases
Impact of Share Repurchases and Issuances on Weighted Average Diluted Shares Outstanding
Repurchases
Issuances
0
5
10
15
20
25
30
35
40
45
50
FY10 FY11 FY12 FY13
Actual Estimated *
Impact on Weighted
Average Diluted Shares Outstanding
* Assumes current Capital Allocation strategy.
~2% Net
Copyright © 2012 Accenture All rights reserved. 22
Responsible Capital Allocation Equity Programs
• Employee Purchase Programs Capped
• Directed to Senior Executives
• Awards are Discretionary Based on Achieving Financial Goals
• Awards are U.S. Dollar Denominated
• Proactive Management to Avoid Dilution
Copyright © 2012 Accenture All rights reserved. 23
Fiscal 2013: 5 to 8% growth in local currency
Fiscal 2013: Return a Minimum of $3.3B to
Shareholders through Repurchases and Dividends
Fiscal 2013: 10 to 12% growth
Revenue Growth (Local Currency):
Grow Faster than the Market
Earnings Per Share Growth:
Achieve Double-Digit Growth
Strong Balance Sheet and Cash Flow:
Continue to Return a Substantial Portion of our Cash
to Shareholders through Buybacks and Dividends
Financial Goals