Embed Size (px)
Citation preview

1
DRIVING SNACK CATEGORY SALES & PROFITS
Driving Snack Category Sales & Profits
Presented By:
Kit Dietz - OwnerDietz Consulting LLC
Russ Quick – VP Sales & MarketingFasMart/Shore Stop Convenience Stores
Las Vegas, Convention CenterOctober 11, 2006

2
DRIVING SNACK CATEGORY SALES & PROFITS
Snack Category Balance Is Important!
• Traffic Driver• Average Margins of
28% to 33%
• Profit Driver• Average Margins of
40% to 50% or more.
Properly Defining The Role Of DSD & WD Snacks Will DriveSignificant Increases In Total Category Sales - At Higher Margins

3
DRIVING SNACK CATEGORY SALES & PROFITS
Multi-Vendor WD Solutions• Great brands in optimal
impulse locations• Multi vendor end cap
solutions for snacks, confections and new items.
• An approach for evaluating snack category performance of each of the snacking segments.
• Great variety of warehouse snacks across major segments: cookies, crackers, chips, meat snacks, snack nuts, snack mixed, confections, gum & sweet snacks.
• Major brands participating: Oreo, Cheez It, Pringles, Jack Links, Slim Jims, Combo's, Chex Mix, Planter’s, etc.
• MVE planogram updated regularly for new items.
• Various services available for the retailer.
• Average margin per product is 40-50+% on the Snacks MVE.

4
DRIVING SNACK CATEGORY SALES & PROFITS
WD Snacks MVE Industry Solution
GREATGREATBRANDSBRANDS
CONSUMERSCONSUMERSLOVELOVE
ONE SHAREDONE SHAREDENDEND--CAPCAP
PRIME FRONTPRIME FRONTOF STOREOF STOREIMPULSE IMPULSE
LOCATIONLOCATION
INCREASEDINCREASEDHIGH MARGINHIGH MARGIN
SNACK SNACK SALESSALES
• The WDSC has developed a solution and approach that drives sales at higher margins and each distributor develops a unique program.

5
DRIVING SNACK CATEGORY SALES & PROFITS
WD Snack MVE – Early Validation
63%
114%
0%
20%
40%
60%
80%
100%
120%
Total WDSnacks
MVEItems
• Study Group 1 consisted of 7 C- store Chains with a total of 186 stores.
• Comparative sales for WD salty, sweet, alternative snacks and MVE products.
Source: AWMA/WDSC/7 Chain Study/Willard Bishop Consulting Ltd., 2003
SNACK MVE ITEMS RANGE FROM SNACK MVE ITEMS RANGE FROM 40% TO 50% PLUS GROSS MARGIN40% TO 50% PLUS GROSS MARGIN
63%
114%

6
DRIVING SNACK CATEGORY SALES & PROFITS
WD Snack MVE Retail Placements• Over 22,000 Snacks MVE have been
placed in C-Stores by 70 distributors……………. and the numbers keep growing.
RETAILERS TESTING OR EXPANDINGRETAILERS TESTING OR EXPANDINGWD SNACKS MVE PLACEMENTSWD SNACKS MVE PLACEMENTS
7
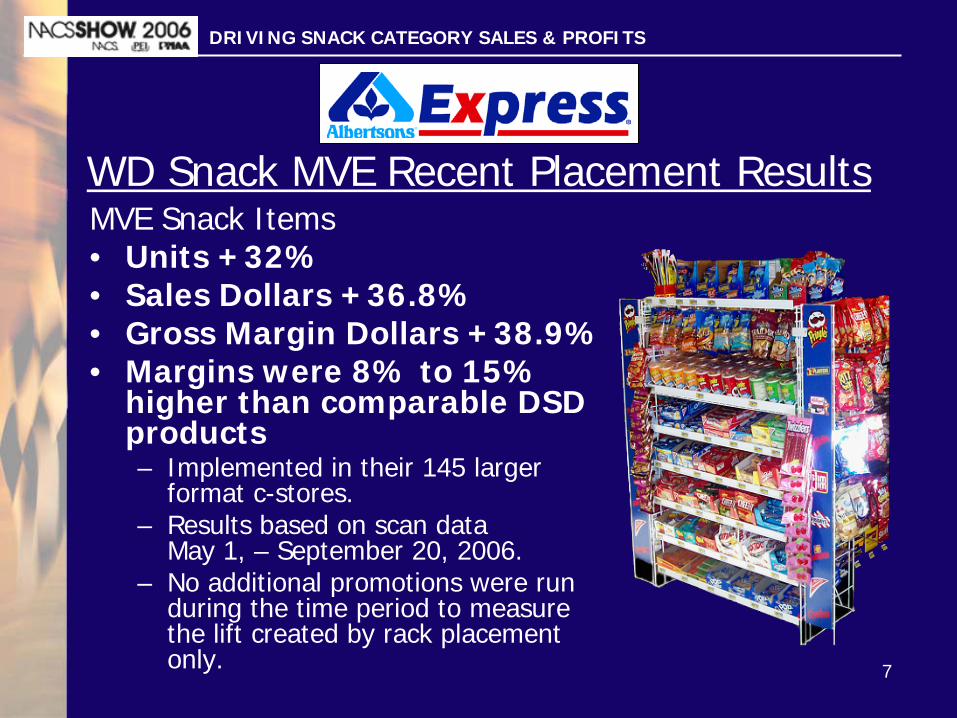
DRIVING SNACK CATEGORY SALES & PROFITS
WD Snack MVE Recent Placement ResultsMVE Snack Items• Units +32%• Sales Dollars +36.8%• Gross Margin Dollars +38.9%• Margins were 8% to 15%
higher than comparable DSD products– Implemented in their 145 larger
format c-stores.– Results based on scan data
May 1, – September 20, 2006.– No additional promotions were run
during the time period to measure the lift created by rack placement only.

8
DRIVING SNACK CATEGORY SALES & PROFITS
3 Years of Explosive Snack Category Growth• Why we were an early adopter of the WD Snacks
MVE?• Our “Year 1, 2004” Snack MVE placement results.• Incremental volume within the major snack segments
of salty, alternative and packaged sweet snacks.• Snack category assessment and planning.• How we redefined the role of WD and DSD snacks
according to the consumer’s preference for brands within the snack segments, sales and gross margin opportunities.
• Executing new category plans.• The results of our category overhaul and emphasis
on WD Snacks in years 2 and 3.• Achieving results and key takeaways.

9
DRIVING SNACK CATEGORY SALES & PROFITS
Why We Were An Early Adopter Of The WD Snack MVE?
• We identified an opportunity to improve warehouse snack merchandising, but lacked programs/support.
• The WD Snack MVE was the solution we were looking for that enabled us to:– Capitalize on consumer snacking trends.– Address store size and available space issues on an
integrated multi-vendor single merchandising vehicle.– Leverage the brand strengths in each category segment.– Create incremental impulse sales.– Obtain higher gross margins.

10
DRIVING SNACK CATEGORY SALES & PROFITS
2004 Snack MVE Placement
• The initial study involved 58 stores.
• Measured item and snack category sales & margin for WD & DSD Snacks.
• Comparative sales of salty, sweet and alternative snacks.
• Due to contractual obligations for space in the front of the store, the WD Snacks MVE was sub-optimized, placed in the rear of the store near the cold vault.
2004 POG

11
DRIVING SNACK CATEGORY SALES & PROFITS
2004 WD Snack MVE Results
68%
0%
10%
20%
30%
40%
50%
60%
70%
MVE Items
Snack MVE Items
• 100% of the sales and gross margin improvement came from WD Snacks.
• DSD snack sales & margin were stable.• WD and MVE sales were all incremental.
SOURCE: AWMA/WDSC/FAS MART/JUN-JUL 2003 VS 2004/DIETZ CONSULTING LLC
19%
22%
0%
5%
10%
15%
20%
25%
Sales GrossMargin
Total Snack Category
22%19%
68%

12
DRIVING SNACK CATEGORY SALES & PROFITS
2004 WD Snack Segment Improvement
71.9%
42.4%
27.2%
49.9%
0.0%
10.0%
20.0%
30.0%
40.0%
50.0%
60.0%
70.0%
80.0%
Altern
ativ
e
Salty
Swee
t
Tota
l WDS
SOURCE: AWMA/WDSC/FAS MART/JUN-JUL 2003 VS 2004/DIETZ CONSULTING LLC
71.9%
42.4%
27.2%
49.9%

13
DRIVING SNACK CATEGORY SALES & PROFITS
2004 Snack Category Conclusions
• Total snack category results were driven by WD Snacks at significantly higher margins than DSD snacks.
• Sales & margin gains were incremental with no cannibalization of DSD products.
• We leveraged this learning to further drive performance in the category and redefined roles in the category.
SOURCE: AWMA/WDSC/FAS MART/JUN-JUL 2003 VS 2004/DIETZ CONSULTING LLC

14
DRIVING SNACK CATEGORY SALES & PROFITS
Redefining The Role Of WD & DSD Snacks• How can we improve sales and capitalize on the
significantly higher margins of WDS? By:• Conducting detailed sales & margin reviews of all
items and segments in the snack category.• Evaluated unit movement turns per sku.• Focusing on the consumer and determining what
brands have the best consumer recognition.• Emphasizing power brands in each category
segment.• Determining which brands in each segment deserve
high impulse locations in our stores.
SOURCE: AWMA/WDSC/FAS MART/JUN-JUL 2003 VS 2004/DIETZ CONSULTING LLC

15
DRIVING SNACK CATEGORY SALES & PROFITS
2005 – 2006 Planning ProcessDRIVING CATEGORYDRIVING CATEGORY
SALES & PROFIT GROWTHSALES & PROFIT GROWTH
OPTIMIZEOPTIMIZEPRIME SELLINGPRIME SELLING
LOCATIONSLOCATIONS
REVIEW & REVIEW & ENHANCEENHANCE
CATEGORYCATEGORYPLANSPLANS
FOCUS ONFOCUS ONHIGH MARGINHIGH MARGIN
POWER BRANDSPOWER BRANDS
REVIEW REVIEW DUPLICATE DUPLICATE
LOW MARGINLOW MARGINSKUSSKUS
PROMOTE PROMOTE MVE ITEMSMVE ITEMSONON--GOINGGOING
ASSURE ASSURE ININ--STOCKSTOCKPOSITIONPOSITION
11
22
33
44
55
66
INTEGRATE WITH CATEGORYMANAGEMENT PROCESS
DETERMINECATEGORY &
SEGMENT ROLES
SELECT CATEGORYPARTNERS
ANALYZEPERFORMANCE
DEVELOP PLAN(STRATEGIES
& TACTICS)
REVIEW PERFORMANCE
& EVALUATE
IMPLEMENTPLAN
1
2
3
4
5
6
16
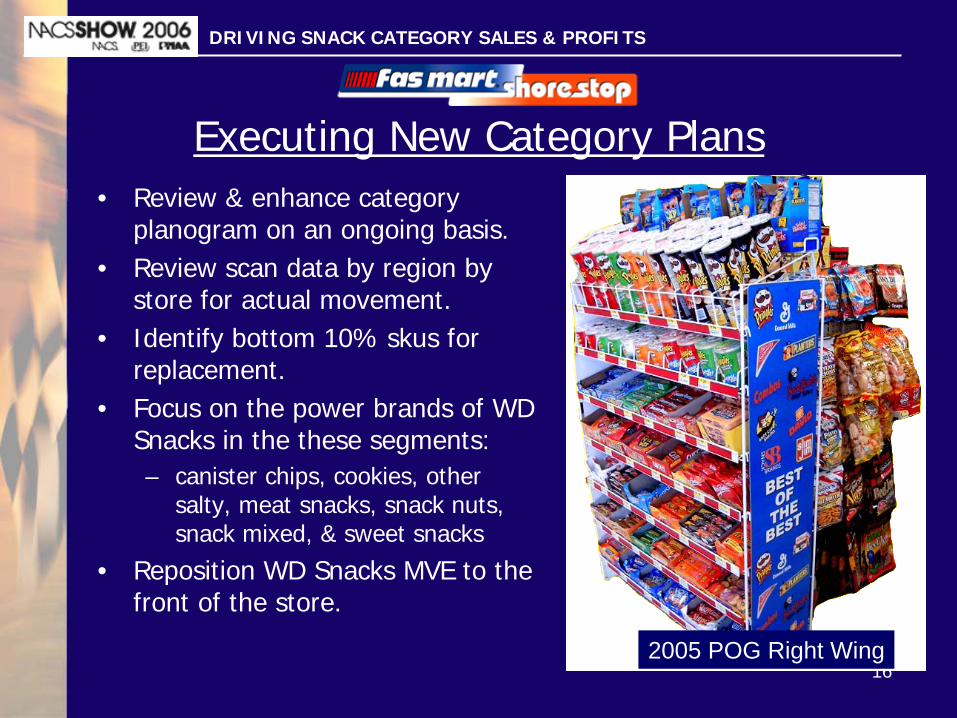
DRIVING SNACK CATEGORY SALES & PROFITS
Executing New Category Plans• Review & enhance category
planogram on an ongoing basis.• Review scan data by region by
store for actual movement.• Identify bottom 10% skus for
replacement.• Focus on the power brands of WD
Snacks in the these segments:– canister chips, cookies, other
salty, meat snacks, snack nuts, snack mixed, & sweet snacks
• Reposition WD Snacks MVE to the front of the store.
2005 POG Right Wing

17
DRIVING SNACK CATEGORY SALES & PROFITS
Executing New Category Plans• Quantify item sales based on
shelf placement of MVE.
• Eliminate duplications of lower margin DSD Snacks.
• Operational focus to assure in- stock position. (service program in some locations)– Fixtures properly tagged
– Promotional signage
– Vendor audits
• Promote Snack MVE items monthly.
2005 POG Left Wing

18
DRIVING SNACK CATEGORY SALES & PROFITS
37.7%
8.7%
42.3%33.0%
29.0%
16.0%
15.6%
17.2%
0.0%
10.0%
20.0%
30.0%
40.0%
50.0%
60.0%
70.0%
80.0%
Alternative Sweet Salty Total
2005 2006
Total Snack Category Sales Gain Year Over Year YTD September
SOURCE: AWMA/WDSC/FAS MART 2006/DIETZ CONSULTING LLC
66.7%
24.7%
57.9%50.2%
2 Year Total

19
DRIVING SNACK CATEGORY SALES & PROFITS
2004-2006 Total Snack Category Growth
SOURCE: AWMA/WDSC/FAS MART 2006/DIETZ CONSULTING LLC
18.5% 22.3%
33.0%38.2%
17.2%
19.1%
0.0%
10.0%
20.0%
30.0%
40.0%
50.0%
60.0%
70.0%
80.0%
90.0%
Sales Gross Margin
2004 2005 2006
68.7%79.6%
3 Year Total

20
DRIVING SNACK CATEGORY SALES & PROFITS
2006 Snack Category PerformanceSnack Category Adjusted Gross Margin
INCLUDES ALL REBATE, ALLOWANCE & PLACEMENT MONIES
31.7%
44.9%
32.8%29.7%
43.5%
20.9%
32.3%
51.4%
0.0%
5.0%
10.0%
15.0%
20.0%
25.0%
30.0%
35.0%
40.0%
45.0%
50.0%
55.0%
McLane Frito Lay KrispyKreme
Utz Tastykake InterstateBrands
Lance SchmidtBaking
Gross Margin %
-19.1%
-30.5%
-7.9%
-21.7% -18.6%
-6.5%
-19.7%
Gross Margin DSD Margin Gap Versus WD
SOURCE: AWMA/WDSC/FAS MART 2006/DIETZ CONSULTING LLC

21
DRIVING SNACK CATEGORY SALES & PROFITS
2006 Snack Category PerformanceSnack Category Sales & Gross Margin Contribution
INCLUDES ALL REBATE, ALLOWANCE & PLACEMENT MONIES
0.5%6.7%6.9%9.8%
12.5%14.5%15.2%
33.9%
0.4%7.7%
5.8%7.4%
13.9%
7.7%
12.6%
44.5%
0.0%
5.0%
10.0%
15.0%
20.0%
25.0%
30.0%
35.0%
40.0%
45.0%
50.0%
McLane Frito Lay KrispyKreme
Utz Tastykake InterstateBrands
Lance SchmidtBaking
Sales Contribution Gross Margin Contribution
WarehouseWarehouse--Delivered SnacksDelivered SnacksContributed 320% MoreContributed 320% More
Gross Margin Dollars ThanGross Margin Dollars ThanThe Top Contributing DSDThe Top Contributing DSD
SupplierSupplier
SOURCE: AWMA/WDSC/FAS MART 2006/DIETZ CONSULTING LLC

22
DRIVING SNACK CATEGORY SALES & PROFITS
Achieving These Results Requires• Retailer commitment to
warehouse-delivered and MVE programs.
• The WD Snacks MVE will deliver more profit dollars for the retailer.
• Retailer must structure DSD contracts to support MVE placement.
• Working with your WD supplier to maximize sku assortment for your region.

23
DRIVING SNACK CATEGORY SALES & PROFITS
Key Takeaways• Multi-vendor strategies can generate
explosive sales and margin lift.• Commitment to WD Snack Program.• Partnership with manufacturers
and wholesaler.• Don’t negate the impact
or need for DSD.• Balance the programs.• Analyze results.• Keep it fresh.• Promote.

24
DRIVING SNACK CATEGORY SALES & PROFITS
Why Are WD Snacks So Much More Profitable?
• Retailers And Manufacturers Benefit From The Significant Economies Of Scale, Efficiency And Synergy Created By Warehouse-Delivered Suppliers.
Snack Category Adjusted Gross MarginINCLUDES ALL REBATE, ALLOWANCE & PLACEMENT MONIES
31.7%
44.9%
32.8%29.7%
43.5%
20.9%
32.3%
51.4%
0.0%
5.0%
10.0%
15.0%
20.0%
25.0%
30.0%
35.0%
40.0%
45.0%
50.0%
55.0%
McLane Frito Lay KrispyKreme
Utz Tastykake InterstateBrands
Lance SchmidtBaking
Gross Margin %

25
DRIVING SNACK CATEGORY SALES & PROFITS
Why Are WD Snacks So Much More Profitable?
• The Value of Thousands of Brands/ProductsThousands of Brands/Products, from Hundreds of ManufacturersHundreds of Manufacturers, , Across Many Across Many CategoriesCategories in the store; Drives Cost DownDrives Cost Down and Retailers Enjoy Higher MarginsRetailers Enjoy Higher Margins.
Place Order
Receive Product Putaway Replenish
Take Order
Select Order
Verify Outbound
Load
Load Truck
Handle Returns
Take Inventory
Process Invoices
Warehouse Space Costs
Inventory Carrying
Costs
Equipment & Service
CostsSG&A
SHARED COSTS OF THE SUPPLY CHAIN TRANSLATES TO LOWER COST FOR RESHARED COSTS OF THE SUPPLY CHAIN TRANSLATES TO LOWER COST FOR RETAILERSTAILERS

26
DRIVING SNACK CATEGORY SALES & PROFITS
WD Products Are Efficient For The Retailer
• The Value Of One Delivery; Where Are Your Customers Parking?
DSDDSD DSDDSD
DSD
DSD
DSD
WDSnack Category Sales & Gross Margin Contribution
INCLUDES ALL REBATE, ALLOWANCE & PLACEMENT MONIES
0.5%6.7%6.9%9.8%
12.5%14.5%15.2%
33.9%
0.4%7.7%
5.8%7.4%
13.9%
7.7%
12.6%
44.5%
0.0%
5.0%
10.0%
15.0%
20.0%
25.0%
30.0%
35.0%
40.0%
45.0%
50.0%
McLane Frito Lay KrispyKreme
Utz Tastykake InterstateBrands
Lance SchmidtBaking
Sales Contribution Gross Margin Contribution

27
DRIVING SNACK CATEGORY SALES & PROFITS
Key Takeaways
• Sales & margin can improve significantly by:– Balancing WD & DSD Snacks.– Focusing on category segments and the brands
that consumers want; delivering higher margins.– Placing a WD Snack MVE in a prime impulse
location.– Leveraging the scale, efficiency, effectiveness and
the brand strength of WD.– Consider WD multi-vendor strategies in many
categories.

28
DRIVING SNACK CATEGORY SALES & PROFITS
Driving Snack Category Sales & Profits
Presented By:
Kit Dietz - OwnerDietz Consulting LLC
Russ Quick – VP Sales & MarketingFasMart/Shore Stop Convenience Stores
Las Vegas, Convention CenterOctober 11, 2006