Embed Size (px)
Citation preview

Driving While Hungry
The Effect of Fasting on Traffic Accidents
Ahmet Gulek∗
Abstract
I study the impact of hunger on traffic accidents by exploiting the
fasting that is religiously mandated during the month of Ramadan.
Identification comes from working hours not being adjusted during Ra-
madan in Turkey. I find that driving while fasting at rush hour is
associated with a significant increase in road traffic accidents. Using
existing survey evidence on fasting rates in Turkey, I conclude that
hunger induced by fasting increases the probability of an accident by
25%, which is smaller than the effect of driving while intoxicated, but
larger than the effect of mild sleep deprivation.
JEL Classification: I18, R41, Z12.
Keywords: Hunger; traffic accidents; fasting; Ramadan; religion
∗Gulek: PhD student in Economics, Massachusetts Institute of Technology, 77 Mas-
sachusetts Avenue, Cambridge, MA 02139, USA (e-mail: [email protected]). I am grateful
to Oguzhan Celebi, Cem Cakmaklı, Edward Davenport, Cem Demiroglu, Amy Finkelstein,
Jon Gruber, Umit Gurun, Adam Solomon, Uluc Sengil, Advik Shreekumar, Insan Tunali,
Sevcan Yesiltas, Kamil Yilmaz, Mehmet Yorukoglu, participants in the MIT Public Finance
lunch, and seminar participants at Koc University for helpful comments.

1 Introduction
Traffic accidents are the leading cause of death among those between five
and twenty nine years old globally (World Health Organization, 2018). The
last half-century has witnessed an abundance of research on the dangers of
driving impaired, leading to numerous policy changes. A famous example is
the literature on alcohol-related accidents that caused changes in the minimum
legal drinking age and blood alcohol concentration (BAC) limits. Despite this
significant progress, both the magnitude and persistence of traffic accidents
keep the research on impaired driving active and policy-relevant.
One understudied factor of impaired driving is hunger, which can reduce
cognitive and physical performance (Gailliot et al., 2007; Benton, 1990; Pollitt
et al., 1998). There are many reasons why people drive while hungry, includ-
ing food insecurity, religious practice, and lifestyle choices. These causes are
widespread. According to the UN, more than 700 million people were “exposed
to severe levels of food insecurity” in 2018 (FAO et al., 2019). A substantial
amount of hungry driving occurs by choice through fasting in various reli-
gions.1 Intermittent fasting was the most popular diet in 2018 in a survey
by the International Food Information Council (Food Insight, 2018). Driv-
ing while hungry is prevalent, yet to the best of my knowledge, no paper has
determined a causal link between driving ability and hunger. The primary con-
tribution of this paper is to provide the first causal evidence that prolonged
hunger increases a driver’s probability of having an accident conditional on
driving.
To isolate an exogenous variation in hunger, I study the impact of Ramadan
fasting on traffic accidents in Turkey.2 The primary challenge in determining
fasting’s effect on driving ability is that fasting affects traffic accidents in two
1Examples include Ramadan in Islam; Lent in Christianity; Yom Kippur, Tisha B’av,Fast of Esther, Tzom Gedalia, the Seventeenth of Tamuz, and the Tenth of Tevet in Judaism.
2Ramadan fasting is arguably the most prevalent voluntary case of hungry driving inthe world. A vast majority of the 1.6 billion Muslims fast during the Ramadan month byabstaining from food and drinks from sunrise until sunset. According to a survey by thePew Research Center, 93% of adult Muslims state that they fast during Ramadan (Pewresearch Center, 2012).
1

opposing ways. On the one hand, malnutrition caused by fasting may lower the
attention span, reflexes, physical and cognitive abilities of the drivers (which I
denote as lowering driving ability), increasing the number of crashes. On the
other hand, fatigue induced by fasting can make people less likely to drive,
which can lower traffic density and the number of accidents. Inference on
hunger’s causal effect on driving ability from observational data on accidents
requires closing this second channel.
To surmount this challenge, I leverage the institutional feature that, in
Turkey, working hours are not adjusted during Ramadan. This is key for
identification as it turns rush hour into a quasi-experiment. People leaving
work constitute the majority of the traffic during rush hour. The same people
leave work at the same time during and outside of Ramadan, with the only
change being that some are fasting. Consequently, any effect of fasting on the
driving decision should not apply during the rush hour of working days. In
fact, I use administrative data on traffic density in Istanbul from 2012–2018
to show that Ramadan lowers traffic density throughout the day but does not
affect it during the rush hour (3–6 pm) on working days. I thus focus on
accidents between 3–6 pm on working days.
Once the empirical setting is such that fasting can affect traffic accidents
by changing only driving ability and not driving frequency, what remains is
fundamentally an IV problem. The Ramadan month is the instrument that ini-
tiates the fasting treatment. Turkey uses the Gregorian calendar in all matters
except for religious events, including the Ramadan month, which are deter-
mined according to the Lunar calendar. The Gregorian and Lunar calendar
differences cause the dates of Ramadan to shift by 11 days in the Gregorian
calendar every year, which identifies the reduced form effect of Ramadan. I
document that the traffic accidents during the rush hour increase on average
by 21% during the day of Qadr, a religiously important day that arguably fea-
tures the most fasting in the Turkish population.3 Traffic accidents increase
3In Islamic belief Laylat al-Qadr, the Night of Decree, is the night when the Quran wasfirst revealed to the prophet Muhammad. The worship done in this one night is worth morethan the worship done in one thousand months in Islam. The exact date of Qadr is unclear,but Sunni Muslims in Turkey celebrate Qadr on the 27th night of Ramadan (Yusuf, 2009).
2

significantly during the other Ramadan days as well, albeit at lower rates as
fewer people fast. Using existing survey evidence to approximate the ratio
of fasting drivers, I obtain a Wald estimate of 25% for fasting’s effect on the
accident probability conditional on driving.
I provide several additional analyses that support the conclusion that
hunger induced by fasting causes the increase in accidents I document. First, I
show that the additional increase in accidents during Qadr occurs only during
working days (which isolate the impact of fasting) and not during vacations.
This shows that potential Qadr-confounders (such as extra mosque attendance
or social gatherings due to heightened religious atmosphere), which would be
common to both vacations and working days, cannot explain the increase in
accidents.
Second, I proxy for religiosity in each of the 81 provinces of Turkey using
four different measures: the vote-share of the religious party AKP in the 2011
general elections, the vote share of the main secular opposition party CHP,
the number of mosques per capita, and the percentage of alcohol-related ac-
cidents.4,5 All specifications point to the same conclusion: in more religious
provinces where more people are likely fasting, there is an amplified reduced
form effect of Ramadan.6
Third, I show that a longer fast period amplifies the increase in accidents
by exploiting an exogenous increase in the fasting period due to daylight saving
time. Between 2000 and 2015, Turkey used two time zones: one for the summer
and one for the winter. Clocks turned backward (forward) by one hour during
the fall (spring) transition. In my sample, Ramadan overlapped with the fall
transition twice, in 2004 and 2005, and never with the spring transition. As
4Turkey has a multi-party parliamentary system, where AKP and CHP are the twoparties with the highest vote shares: 50% and 26% respectively.
5Alcohol consumption is prohibited in Islam, but not under Turkish law (Michalak andTrocki, 2006). Whereas religious Muslims in Turkey choose to abstain from alcoholic bev-erages, alcohol consumption is relatively common in Turkey (World Health Organization,2019).
6The reason why I am using four different proxies is that none of them is an ideal predictorof fasting behavior. Each is a function of a number of variables, including religiosity. Iexplain these proxies in more detail in Section 6.1
3

fasting periods are determined by the daylight and not by time zones, the fall
transition causes an exogenous increase in the fasting period. For instance, on
October 30, 2004, in Igdir (the easternmost province where the sun sets the
earliest), Turkish citizens fasted from 4:59 am until 5:04 pm. On October 31,
they fasted from 4:00 am until 4:02 pm. The total length of abstinence does
not change, but the fasting time until the rush hour increases by one hour.
Using days until/from the fall transition as the running variable, I employ
a regression discontinuity design to show that the fall transition significantly
increases the number of accidents between 2004 and 2005, when it coincides
with Ramadan. Consistent with this increase being caused by the additional
hour of abstinence from food and drinks, the fall transition has no impact
on accidents between 2000–2003 and 2006–2015, when it does not coincide
with Ramadan. Since the regression discontinuity design compares Ramadan
observations before and after the time zone change, the observed discontinuity
is independent of any potential Ramadan fixed effect that might otherwise
cause bias. The only difference is attributable to an additional hour of fasting.
Therefore, it provides strong evidence that fasting increases the probability of
causing accidents.
Lastly, Ramadan fasting causes both hunger and dehydration. The gener-
alizability of my results to other settings of hungry driving depends largely on
how much dehydration affects driving ability. To test this channel, I use data
on daily temperatures at the province level and show that the effect of Ra-
madan does not depend on the temperature. In other words, warmer weather,
which arguably causes more dehydration during Ramadan, does not lead to
more accidents. This evidence is also consistent with the medical literature,
which shows that the levels of dehydration observed during Ramadan fast-
ing are not associated with major changes in physical and cognitive functions
(Maughan and Shirreffs, 2012). Therefore, I conclude that hunger is the main
factor behind fasting’s causal effect on driving ability.
To determine the policy implications of my findings, I compare the 25%
increase in crash probability due to fasting with other determinants of acci-
dents that are regulated differently for commercial and noncommercial drivers,
4
mainly blood alcohol concentration and sleep deprivation. BAC is regulated
for all drivers in almost all countries, but sleep is regulated only for commercial
drivers in some countries (including the US). Voas et al. (2012) estimate that
a BAC between 0.05 and 0.07 (which is legal in the US for noncommercial
drivers, illegal in many European countries) increases the crash probability by
a factor of 3 to 5 (similar estimates can be found in Levitt and Porter (2001)).
Evidence for the causal effect of sleep deprivation on crash probability comes
from the changing sleep duration due to daylight saving time. Using the Amer-
ican Time Use Survey, Barnes and Wagner (2009) find that Americans sleep
40 minutes less on average on the night of the spring transition to the day-
light saving time. Smith (2016) finds a 5.6% increase in fatal crashes following
the spring transition and employs tests to conclude that the sleep loss solely
causes the increase. In comparison to the estimates in the literature, my find-
ings suggest that fasting increases accident probability by far less than mild
amounts of alcohol but more than mild sleep deprivation. Since the effect of
sleep is seen to be significant enough to be regulated for commercial drivers,
there seems to be some ground for regulation on the food intake of commercial
drivers. However, whether this justifies public policy targeting is a normative
question, which is beyond the scope of this paper.
This paper contributes to an extensive literature that investigates the de-
terminants of traffic accidents. An important strand of this literature focuses
on the effect of alcohol and alcohol-related policies on RTA (Moskowitz et al.,
2000; Zador, 1991; Zador et al., 2000; Levitt and Porter, 2001; Voas et al.,
2012). The 0.08 BAC limit in the United States has been shown to reduce
traffic fatalities (Dee, 2001; Eisenberg, 2003). Another strand of the literature
analyzes the impact of public policies on fatal traffic accidents. Examples of
these policies include seatbelt laws (Cohen and Einav, 2003; Carpenter and
Stehr, 2008), Graduated Licencing regulations (Dee et al., 2005), minimum
legal drinking age (Dee, 1999; Dee and Evans, 2001; Lovenheim and Slemrod,
2010), zero-tolerance laws (Eisenberg, 2003; Carpenter, 2004), social host laws
(Dills, 2010), and daylight saving time (Smith, 2016; Sood and Ghosh, 2007).
I contribute to this literature by showing that hunger caused by fasting is a
5

significant determinant of traffic accidents. This is important for two reasons.
First, fasting (and fasting drivers in particular) is already a topic of political
discussion that lacked causal evidence (O’Grady, 2018). I answer both whether
and by how much fasting impacts driving ability. My estimates can be used to
guide policy discussions regarding fasting drivers. Second, Ramadan fasting
is only a portion of aggregate hungry driving in the world. I provide empiri-
cal evidence that hunger is the main reason behind the increase in accidents
I document. A testable out-of-sample prediction of my paper is that hunger
induced by other religious/dietary fasting or food insecurity will increase the
probability of causing accidents by similar amounts.
Most closely related to my work, several papers in the medical literature
have analyzed how the frequency of traffic accidents change during Ramadan
(Bener et al., 1992; Langford et al., 1994; Shanks et al., 1994; Khammash
and Al-Shouha, 2006; Tahir et al., 2013; Mehmood et al., 2015; Kalafat et al.,
2016). However, data and methodological limitations result in their estimates
to remain observational, not causal. My main contribution to this literature is
disentangling fasting’s impact on driving ability (which is of general interest)
from its effect on driving propensity (which depends on local norms and laws
regarding working hours). For example, I document an aggregate decline in
accidents during Ramadan but show that hunger induced by fasting actually
increases the probability of causing accidents by 25% conditional on driving.
The latter is the key parameter that can generalize to other instances of driving
while hungry. Examples include commercial drivers for whom driving propen-
sity is constant and many commuters driving to/from work for whom public
transport is not a close substitute.
I also contribute to a growing literature on the relationship between religion
and economic outcomes (see Iyer (2016) for a review). In particular, the effects
of Ramadan fasting have received special attention in the last decade. Cam-
pante and Yanagizawa-Drott (2015) document that more prolonged Ramadan
fasting has a negative effect on output growth. Their findings are consistent
with the recent micro evidence that fasting reduces labor productivity (Hu and
6

Wang, 2019; Demiroglu et al., 2021).7 Several studies investigate how fasting
during early pregnancy affects the fetus’ prenatal development, educational
outcomes, and economic success (Almond and Mazumder, 2011; Van Ewijk,
2011; Majid, 2015; Almond et al., 2015). They find that individuals whose
mothers fasted while pregnant have shorter lives, worse health, less cognitive
skills, lower grades at school, and weaker labor market performance.
The rest of this paper is organized as follows: Section 2 provides back-
ground on Ramadan fasting, Section 3 describes the data, Section 4 explains
the identification strategy, Section 5 presents the main results, Section 6 shows
supporting evidence, Section 7 discusses the policy implications of the findings,
Section 8 comments on limitations, and Section 9 concludes.
2 Background
Ramadan is the ninth month of the Islamic lunar calendar, during which Mus-
lims fast by abstaining from food and drinks (including water) from dawn to
sunset for 29 or 30 days, depending on the length of the lunar month. Pre-
pubescent children, pregnant women, menstruating women, women who are
post-childbirth or breastfeeding, travelers on long journeys, and people with
physical or mental illnesses are exempt from Ramadan fasting. The daily rou-
tine of Ramadan involves a pre-dawn breakfast (suhoor) and a meal at sunset
(iftar).
There are no official statistics about the percentage of drivers who fast in
Turkey, and the estimates regarding the fasting rate of the adult population
vary across surveys. According to a survey conducted by the Pew Research
Center in 2012, 84% of the Muslims in Turkey fast during Ramadan. The
Religious Life Survey conducted in 2014 by the Turkish Statistical Institute
7Hu and Wang (2019) use high-frequency administrative data from a large retail chain inIndonesia to show that nutrition deficiency due to fasting lowers the productivity of sales-persons by 30%. Demiroglu et al. (2021) demonstrate that small business loans originatedduring Ramadan have higher default rates conditional on the risk type. Consistent withfasting-induced judgement errors committed by individual loan officers, they do not findsimilar effects on personal loans, which are mostly automated, and large business loanswhere credit committees make the final decision.
7

(TUIK) on behalf of the Presidency of Religious Affairs found that 83.4% of
the 37,624 households interviewed performed fasting. In 2018, the Lifestyle
Survey of Konda, a local survey company, found that 65% of the surveyed
population performed fasting. However, it is not clear whether households who
stated that they fast during Ramadan fast for the entirety of the Ramadan
month. There is anecdotal evidence that substantially more fasting occurs on
special occasions like the the day of Qadr. I exploit this aspect as part of my
identification strategy.
Avoiding traffic accidents often requires quick decision-making in complex
environments and reflexes to perform those decisions instantly. Therefore, a
driver’s cognitive, physical, and visuomotor skills are important determinants
of crash probability. There are three ways by which Ramadan fasting can
impair these attributes: malnutrition due to not eating, dehydration due to not
drinking, and sleep deprivation due to changing mealtime. All three channels
have been separately analyzed in the medical literature. Here, I summarize
some of these findings.
Muslims abstain from food from sunrise to sunset during Ramadan. Conse-
quently, Ramadan-fasting is associated with a decline in caloric intake (Husain
et al., 1987; Mafauzy et al., 1990; Schofield, 2014). A meta-analysis documents
that fasting during Ramadan results in significant weight loss in most Muslim
countries (Sadeghirad et al., 2014). Besides the aggregate decline in caloric
intake, abstinence during the day is also detrimental to physical performance
(Waterhouse, 2010). Consistent with reduced caloric intake, Kul et al. (2014)
document a decline in blood glucose levels during Ramadan. Blood glucose
serves as a primary determinant of cognitive function (Alberts et al., 2014), so
lessened blood glucose levels can impair cognitive performance (Gailliot et al.,
2007; Benton, 1990; Pollitt et al., 1998).
Ramadan-fasting also requires abstinence from all drinks, including water,
from sunrise until sunset. Several studies show that a loss of 2% or more of
bodyweight due to water restriction, heat, and/or physical exertion can harm
physical, visuomotor, psychomotor, and cognitive performance (see Grandjean
and Grandjean (2007); Adan (2012) for reviews). However, in a review article
8

Leiper and Molla (2003) argue that “No detrimental effects on health have
as yet been directly attributed to intermittent negative water balance at the
levels that may be produced during Ramadan”. Therefore, it is unlikely that
dehydration due to fasting (unless significant physical activity is undertaken)
can impact the physical and cognitive functions of drivers.8
Ramadan also alters sleeping patterns due to changing eating habits (Roky
et al., 2000, 2001), but there is not much evidence on how it affects the to-
tal amount slept. The limited evidence we have shows that people partially
adapt by sleeping more during the day and less at night (Margolis and Reed,
2004; Bahammam, 2006). Moreover, changes in sleep patterns may depend on
whether working hours are adjusted. To the best of my knowledge, there is
not an extensive study of sleep patterns during Ramadan in a country where
working hours are not adjusted.9
Overall, the evidence from the medical literature suggests that the extent of
dehydration and sleep loss associated with Ramadan fasting is highly unlikely
to lead to major changes in driving ability. Consequently, the impact of fasting
on driving ability can be interpreted as the causal effect of prolonged hunger.
3 Data
The main data for this study are provided by the Traffic Training and Research
Department in Turkey. They provide daily records of traffic accidents that
resulted in injury or death at the province level (81 provinces in total) for
the period 2000–2018. During this period, there were 1,949,204 accidents that
resulted in 3,279,067 injuries and 53,472 deaths. Table A.3 in the Appendix
provides detailed summary statistics of the data.
I supplement this data with the records of Ramadan days in the Gregorian
calendar; the timing of sunrise and sunset for each province-day observation
8I also provide empirical evidence that more dehydration does not lead to more accidentsin Section 6.3.
9Although I do not know the average amount of sleep lost during Ramadan in Turkey, theestimated effect of fasting on crash probability is significantly higher than existing estimatesof the effects of sleep deprivation. I provide a more detailed explanation in section 7.
9

in my dataset; and the maximum . To measure traffic patterns, I use density
data for major roads in Istanbul. Istanbul Metropolitan Municipality started
collecting this data in 2012, and provided me with an index that captures the
overall traffic density at the beginning of each hour. This allows me to see
how the traffic density changes throughout the day during Ramadan.
I supplement this data with the records of Ramadan days in the Gregorian
calendar. I also include the timing of sunrise and sunset for each province-
day observation in my dataset. To measure traffic patterns, I use density
data for major roads in Istanbul. Istanbul Metropolitan Municipality started
collecting this data in 2012, and provided me with an index that captures
the overall traffic density at the beginning of each hour. This allows me to
see how the traffic density changes throughout the day during Ramadan.10 I
also acquired the daily maximum temperature in city centers from the Turkish
State Meteorological Service (TSMS).
Exploiting Turkey’s constant working hours during Ramadan is a key part
of my identification strategy, which requires determining the regular working
days in a calendar year. A challenge in this regard is that the Ramadan
month is followed by a nationwide “Ramadan holiday” that lasts for three and
a half days. Sometimes the last few days of Ramadan stands in between a
nine-day vacation. For instance, in 2015 the Ramadan vacation was set to
occur from Tuesday afternoon until Friday. In such instances, sometimes the
government declares the remaining one and half days a national holiday. Even
if the government does not act, private companies often extend the holiday
for their employees, or workers use their eligible vacation time. Consequently,
the last two days of Ramadan may look like working days on paper, and be de
facto a part of vacation during which more accidents occur because people are
traveling to see their families. Not accounting for these instances would cause
me to overestimate fasting’s effect. To avoid this bias, I define an “effective
religious vacation” indicator that covers (1) the original dates of the religious
vacations, (2) the dates when government extended the holidays, and (3) the
10To the best of my knowledge, Istanbul is the only province that keeps records of trafficdensity data covering multiple years before 2018.
10

dates when similar conditions existed but the government did not extend the
holidays. I then define a regular working day if it satisfies all of the following
three criteria:
1. is a trading day according to the Central Bank of Turkey
2. is not a half-day working day
3. is not an effective religious vacation day
I provide more details in the Appendix section A.1.
4 Identification
An ideal experiment to investigate the effect of fasting on driving ability would
be to select n people, randomly divide them into two groups, make one group
fast, and make both the treatment and control groups drive similar distances
in similar settings. The last part is the key since we want to focus solely on
the effect on driving ability. For instance, if fasting causes people to change
their driving frequency, then this would be a part of the fasting treatment that
does not apply to commercial drivers for whom the amount of driving is not
a choice variable, including bus and truck drivers.
My empirical setting is different from this experiment in two major ways.
First, hunger induced by fasting can cause fatigue, which can discourage people
from going out. If fewer trips occur during Ramadan, then there would be
fewer accidents absent any affect on driving ability. The setting in Turkey
allows me to overcome this obstacle, which is one of the main contributions
of this paper. Second, traffic density may change during Ramadan for reasons
other than fasting. For example, it is commonplace among Turks to dine
together after sunset during Ramadan, even for people who do not fast. Since
the dinner lasts longer to compensate for the lack of calories throughout the
day, people spend a considerably longer time dining. Consequently, people
who would have been driving absent Ramadan are dining instead. This can
lower the traffic density, and the number of accidents, after sunset. Figure
11

1 shows the three mechanisms (including the effect on driving ability) that
link Ramadan to traffic accidents. The reduced-form effect of Ramadan is a
weighted average of these three channels, but I am only interested in the effect
on driving ability. To isolate this channel, I employ empirical strategies to
ensure that Ramadan does not affect the traffic density.
Figure 1: Mechanisms by which Ramadan affects RTAs
Ramadan Fasting
Driving ability
Traffic Density
RTA
(1)
(3)
(2)
(1) Malnutrition caused by fasting can lower driving ability.(2) Fatigue induced by fasting can discourage people from going out.(3) During Ramadan, traffic density declines substantially around sunset becauseof iftar (meal that opens fast after sunset).
Note:
The key to my identification strategy is the fact that Turkey is one of the
few “Muslim” countries that do not adjust working hours during Ramadan.
Because fasting workers still need to commute to and from their jobs, fatigue
induced by fasting is less likely to affect traffic density in Turkey than in other
Muslim countries.11 During rush hour, the same people are in traffic at the
same time, regardless of Ramadan. To show that traffic density does not
change during Ramadan, I use traffic density data from Istanbul.12 The local
11In other words, fasting’s effect on crash probability can be identified in any countrythat does not change the working hours during Ramadan (e.g., all countries in the Americasand Europe). However, the noise in traffic accidents necessitates a strong first-stage forstatistical power. Turkey provides an important balance as enough people fast to havesufficient power, and the effect of fasting on crash probability is identified since workinghours are not adjusted.
12Istanbul hosts 19% of Turkey’s population. To the best of my knowledge, Istanbul wasthe only province in Turkey that kept traffic density data going back more than one year.
12

government of Istanbul measures traffic density on major roads and creates an
index that captures the average traffic density at the beginning of each hour.
I run 24 separate regressions, one for each hour of the day, where I regress
traffic density during hour h on an indicator of Ramadan and day of the week,
month, year fixed effects. I run separate regressions for vacations and working
days.13
Figure 2 plots the 24 Ramadan coefficients that show the effect of Ramadan
on traffic density throughout the day, during vacations and working days.
Each blue error bar is the 95% confidence interval of the coefficient estimate
of the Ramadan indicator. The rush hour between 3–6 pm is highlighted in
green. The gray shaded area is the range of the timing of sunset in Istanbul
during Ramadan since 2012. A few observations are striking. First, traffic
density declines substantially during Ramadan, both during vacations and
working days. This implies that some trips that would take place absent
Ramadan disappear. Second, and most important for identification, Ramadan
does not affect traffic density during the rush hours of working days. The
observation that Ramadan significantly lowers traffic density between 3–6 pm
during vacations but not during working-days is consistent with Turkey not
changing the working hours during Ramadan. Since people are leaving work
at similar times both during and outside of Ramadan, traffic density does
not change between 3–6 pm.14 By focusing on the traffic accidents that occur
between 3–6 pm I close the second channel: fasting no longer affects the driving
frequency.
13Vacations are the days that are not regular working days according to the criteria Iintroduced in the data section. Vacations include weekends, national holidays, effectivereligious holidays, and half-day working days. This is an important adjustment to ensurethat Ramadan does not affect traffic density during working days. I provide more detailsthe Appendix Section A.
14Interestingly, traffic density declines during the morning rush hour, even though workstarts at the same time. I do not have a good explanation for this result. One potentialreason is that people change their morning habits as they do not have breakfast. This canchange the time people leave for work, or cause them to change their routes if they originallywent to restaurants for a quick breakfast. Whatever the true reason for this phenomenonmay be, it does not affect my estimates in the paper. Traffic density not changing duringthe afternoon rush hour is sufficient to isolate fasting’s effect on driving ability throughRamadan observance.
13

Figure 2: Effect of Ramadan on traffic density in Istanbul between 2012-2018
(a) Working Days (b) Vacations
Note: The error bars are the 95% confidence intervals of the 24 βh1 estimates of equation:
TIhd = βh0 +βh
1Ramadand+βh2DayoftheWeekd+βh
3Monthd+βh4Y eard+δhReligiousDayd+
εhd , where h is each hour-interval of the day, TIhd denotes the traffic index on day d and athour h, and ReligiousDay is an indicator for religious days outside of Ramadan. Data arefrom Istanbul since 2012. The left panel uses observations from working days only, andthe right panel uses data from vacations only (vacations include all days that are not fullworking days). The rush hour between 3–6 pm are highlighted in green. The gray shadedarea is the range of the timing of sunset in Istanbul during Ramadan since 2012. Trafficindex ranges from 0 and 100. The decline in traffic around 8 pm occurs because of iftar(the meal at sunset that opens fasting), which takes place around 8 pm in Istanbul duringsummer time. This figure shows that during rush hour of working days, Ramadan does notimpact the traffic density.
The last important observation from figure 2 is that traffic density declines
substantially around sunset. This is the 3rd channel I introduced in figure
1. Even non-fasting people often alter their dining habits during Ramadan as
dining at iftar is a cultural phenomenon. Since 2012, Ramadan has occurred
mostly in the summer months when sunset is late. However, in the 2000s,
Ramadan occurred during the Fall and Winter seasons when sunset happened
as early as 3:45 pm. Figure 3 shows the range of sunset times during Ramadan
across Turkey. Since 2009, sunset has always occurred after 6 pm. However,
between 2000–2008 the timing of sunset can impact traffic accidents even dur-
ing the rush hour. To avoid this bias, I restrict the sample to observations
after 2009, during which sunset during Ramadan occurred always after 6 pm.
In the Appendix section C, I show results using more conservative samples.
14

The results are very similar.
Figure 3: Range of sunset times during Ramadan across Turkey in differentyears
Note: Turkey has 81 provinces, and iftar (the meal at sunset that opens fasting) time iscalculated in each province separately based on sunset. Each error bar shows the range ofsunset timing (from earliest to latest) across Turkish provinces during the 30-day Ramadanperiod of that year.
Once I have isolated the causal link between Ramadan and traffic accidents
where the only treatment is the hunger caused by fasting, the remaining prob-
lem is in spirit an IV problem: fasting is the treatment, and Ramadan is the
instrument that initiates the treatment. Dividing the reduced form effect of
Ramadan with an estimate of the first-stage, the ratio of fasting drivers, iden-
tifies the LATE of fasting on crash probability. The reduced form is identified
by the differences between the Gregorian and Lunar calendars, which cause
the dates of the Ramadan month to change by 11 days in the Gregorian cal-
endar each year. Hence, an estimate of the fasting rate of drivers is sufficient
for identification.
Despite the cultural importance of Ramadan in Turkey, we do not know
much about the fasting practices of Turkish citizens, let alone commuters.
There are surveys asking a representative sample of the population whether
they fast during Ramadan, but they do not provide reliable data for two main
15

reasons. First, I am interested in the percentage of commuters who fast,
who are a selected sample.15 Second, and more crucially, anecdotal evidence
suggests that among people who perform fasting during Ramadan, many do
not fast for the entire 30-day period. When asked an extensive-margin question
about whether they fast during Ramadan, they are likely to say yes. This
results in severe bias in the effective ratio of people who perform fasting on
average. For example, if 100% of Turkish citizens fasted on average for 10
out of 30 days during Ramadan, the actual first-stage estimate would be 33%,
whereas surveys would suggest a 100% fasting rate.16
The intensive-margin adjustment to fasting, together with commuters be-
ing an unrepresentative sample of the population, makes it difficult to infer
the ratio of fasting drivers on a regular Ramadan day from the existing survey
evidence.17 To make progress on the first-stage, I make assumptions that, if
anything, overestimate the actual fasting rate and therefore underestimate the
effect of fasting.18 These assumptions are:
1. Anyone who fasts for at least one day during Ramadan would answer
“yes” to an extensive margin question about fasting.
2. Anyone who fasts for at least one day during Ramadan fasts during the
day of Qadr.
3. The fasting rate in the commuter population is the same as in the general
public.
15Car ownership is less common in Turkey than in the rest of the OECD countries. Forinstance, there were 14 cars per 100 people in Turkey in 2016, whereas the EU average was51 (euronews, 2019).
16This problem could be avoided if the empirical setting was a country where almosteveryone fasted. However, these countries often adjust working hours during Ramadan,which prevents identification. Examples of these countries include United Arab Emirates,Saudi Arabia, Kuwait, Bahrain, Oman, Qatar, Indonesia, and Egypt (PwC, 2019; EgyptToday, 2011; Emerhub, 2019).
17Even if such a survey on the commuters was conducted, people could over-report theiractual fasting rates due to social desirability bias.
18Since fasting’s effect on driving may have important political consequences as I arguedin the introduction, I take extra caution not to provide a false positive result, or overstatethe actual risk associated with fasting.
16
Assumption 1 allows me to interpret the 84% fasting rate found in the surveys
as the percentage of people fasting for at least one day during the 30-day
Ramadan period. Considering the social desirability bias of fasting in Turkey,
this may overstate the fasting rate. Assumption 2 relies on the observation
that people choose the days they fast according to cultural and religious beliefs.
Anecdotal evidence suggests that the day of Qadr initiates the most fasting
in the Turkish population, which is why I employ this assumption. This is a
conservative assumption that likely overestimates the first-stage. For example,
a person who regularly fasts but happens to not fast during Qadr because of
any reason (e.g., work, travel, sickness, etc.) is assumed to be fasting during
Qadr. The third assumption is necessary to obtain a first-stage estimate in the
commuter population. Given these assumptions, I deduce that 84% of drivers
fast during Qadr and divide the reduced form effect by 0.84 to calculate the
LATE.
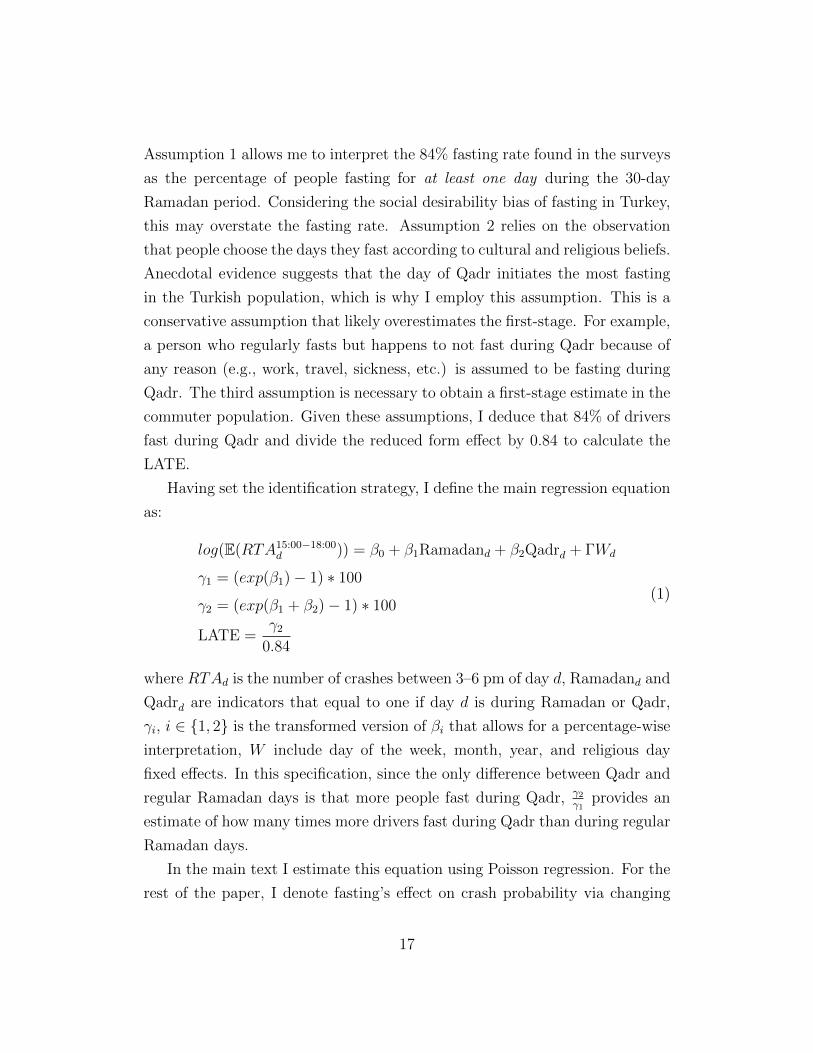
Having set the identification strategy, I define the main regression equation
as:
log(E(RTA15:00−18:00d )) = β0 + β1Ramadand + β2Qadrd + ΓWd
γ1 = (exp(β1)− 1) ∗ 100
γ2 = (exp(β1 + β2)− 1) ∗ 100
LATE =γ2
0.84
(1)
where RTAd is the number of crashes between 3–6 pm of day d, Ramadand and
Qadrd are indicators that equal to one if day d is during Ramadan or Qadr,
γi, i ∈ {1, 2} is the transformed version of βi that allows for a percentage-wise
interpretation, W include day of the week, month, year, and religious day
fixed effects. In this specification, since the only difference between Qadr and
regular Ramadan days is that more people fast during Qadr, γ2γ1
provides an
estimate of how many times more drivers fast during Qadr than during regular
Ramadan days.
In the main text I estimate this equation using Poisson regression. For the
rest of the paper, I denote fasting’s effect on crash probability via changing
17

driving ability simply as fasting’s effect. When I refer to fasting’s effect on
driving frequency, I write it explicitly.
5 Main Results
I estimate equation 1 using the number of accidents in Turkey between 3–6 pm,
with the sample restricted to working days between 2009–2018, both with and
without an indicator for Qadr. The results are shown in Figure 4. In the first
column, I plot the increase during Ramadan without an indicator for Qadr.
The number of accidents increases by around 4% during Ramadan in Turkey,
and the effect is statistically significant. I then introduce an indicator for the
day of Qadr and plot the estimates of γ1 and γ2 (the increase in accidents
during Ramadan and Qadr) in the second and third columns of Figure 4.
The results are striking. The number of accidents increases by around 3%
during a regular Ramadan day, which is not much different from the average
Ramadan effect. However, the number of crashes increases by 21% during the
day of Qadr. Monte-Carlo estimates suggest that around 6 times more people
fast during Qadr compared to a regular Ramadan-day (the 95% confidence
interval cannot rule out around 2.4 times as many people fasting during Qadr).
Assuming that the 84% of the driver population fasts during Qadr, which is
almost surely an overestimate as I elaborated in the identification section, I
conclude that fasting increases the crash probability by 25% conditional on
driving.
I perform several robustness checks to ensure that the increase in accidents
during Qadr is caused by more people fasting and not by other confounders.
First, I showed Ramadan’s null effect on traffic density only in Istanbul, but
used the reduced form evidence from Turkey. This is to improve the external
validity of my results, as evidence from one province may not generalize as
easily as evidence from a country. Nonetheless, I provide the results using
accidents from Istanbul in Figure C.2 in the Appendix. In Istanbul, RTAs
increase by 10% during a regular Ramadan day, and by more than 40% during
Qadr. The estimates from Istanbul have larger confidence intervals than the
18
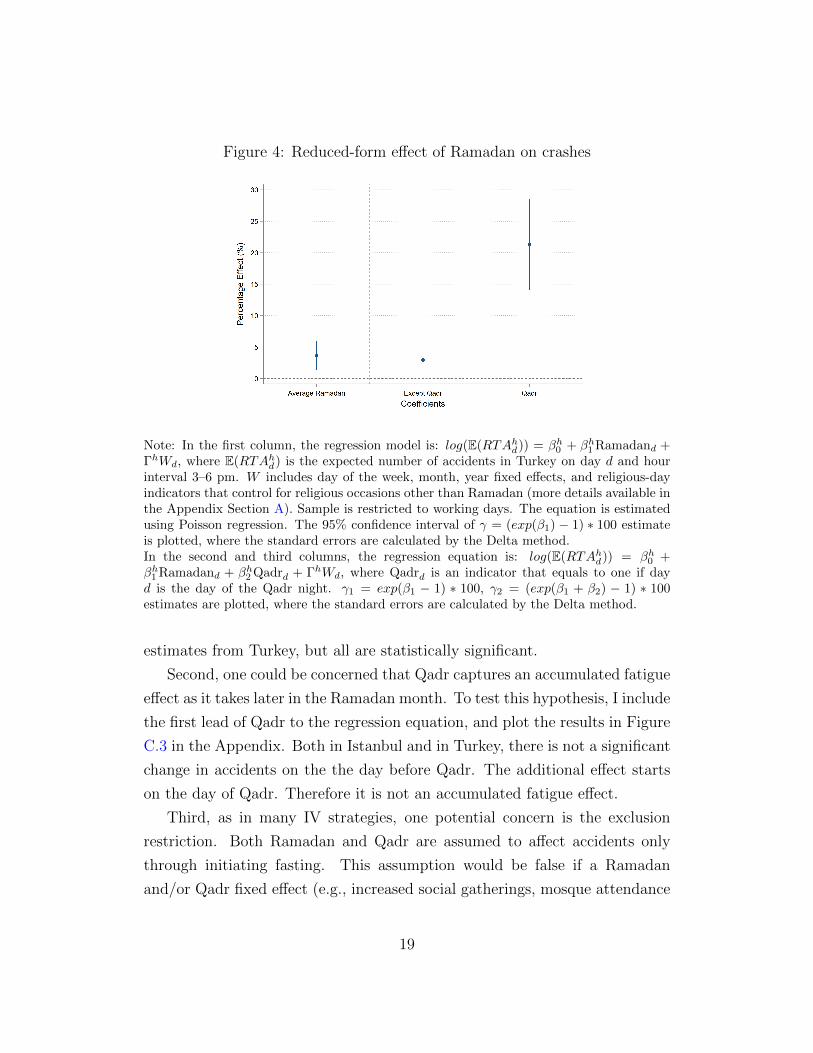
Figure 4: Reduced-form effect of Ramadan on crashes
Note: In the first column, the regression model is: log(E(RTAhd)) = βh
0 + βh1 Ramadand +
ΓhWd, where E(RTAhd) is the expected number of accidents in Turkey on day d and hour
interval 3–6 pm. W includes day of the week, month, year fixed effects, and religious-dayindicators that control for religious occasions other than Ramadan (more details available inthe Appendix Section A). Sample is restricted to working days. The equation is estimatedusing Poisson regression. The 95% confidence interval of γ = (exp(β1) − 1) ∗ 100 estimateis plotted, where the standard errors are calculated by the Delta method.In the second and third columns, the regression equation is: log(E(RTAh
d)) = βh0 +
βh1 Ramadand + βh
2 Qadrd + ΓhWd, where Qadrd is an indicator that equals to one if dayd is the day of the Qadr night. γ1 = exp(β1 − 1) ∗ 100, γ2 = (exp(β1 + β2) − 1) ∗ 100estimates are plotted, where the standard errors are calculated by the Delta method.
estimates from Turkey, but all are statistically significant.
Second, one could be concerned that Qadr captures an accumulated fatigue
effect as it takes later in the Ramadan month. To test this hypothesis, I include
the first lead of Qadr to the regression equation, and plot the results in Figure
C.3 in the Appendix. Both in Istanbul and in Turkey, there is not a significant
change in accidents on the the day before Qadr. The additional effect starts
on the day of Qadr. Therefore it is not an accumulated fatigue effect.
Third, as in many IV strategies, one potential concern is the exclusion
restriction. Both Ramadan and Qadr are assumed to affect accidents only
through initiating fasting. This assumption would be false if a Ramadan
and/or Qadr fixed effect (e.g., increased social gatherings, mosque attendance
19

etc.) could also be a determinant of accidents. However, there are several
empirical facts in the data that strongly suggest that the exclusion restriction
holds. First, if the increase in social gatherings was causing the increase in
accidents, then it would also increase the traffic density. Yet, as I showed in
Figure 2, it does not. Second, the evidence on Qadr actually suggests that a
Ramadan fixed effect cannot explain the results, as the most of the increase
in accidents occurs during Qadr when more fasting occurs.
The only remaining concern is a Qadr fixed effect, that is some change
in people’s behavior (only during Qadr) that causes the observed increase
in accidents. For instance, it can be argued that the heightened spiritual
environment during Qadr also increases social gatherings, which can lead to
more accidents. To test this channel, I repeat the same analysis with sample
restricted to vacations instead of working days. The idea is that, any fasting-
unrelated Qadr fixed effect that creates accidents would also exist in vacations
(e.g., if people go out to celebrate Qadr during working days, they would also
go out to celebrate during vacations). In contrast, if more fasting is the main
reason behind the increase in crashes during Qadr in working days, then this
effect could disappear in vacations as fasting decreases people’s propensity of
driving. In other words, under the null that a Qadr fixed effect is driving the
increase in accidents, we would expect similar increases in accidents during
working days and vacations.
I show the results in table 1. Column 1 shows the same results as Figure
4: when sample is restricted to working days there is a 2.9% increase in acci-
dents during regular Ramadan days, and a 21.3% increase increase in accidents
during Qadr. This additional increase in Qadr disappears when sample is re-
stricted to vacations, as shown in column 2. There is a statistically significant
5% increase in accidents during regular Ramadan days. However, there is no
significant change during Qadr. In fact, the estimated increase during Qadr
is 2.7%, which is both statistically indistinguishable from zero, and much less
than the 21.3% increase I document during working days. This evidence is
also apparent in Istanbul. There is a statistically significant 47% increase in
accidents during Qadr on working days, and an insignificant 0.07% increase
20

during vacations. This evidence clearly shows that cultural changes during
Qadr (such as increased social gatherings) cannot explain the increase in acci-
dents I document. Hence, I conclude that fasting increases the probability of
causing accidents by 25%.
21
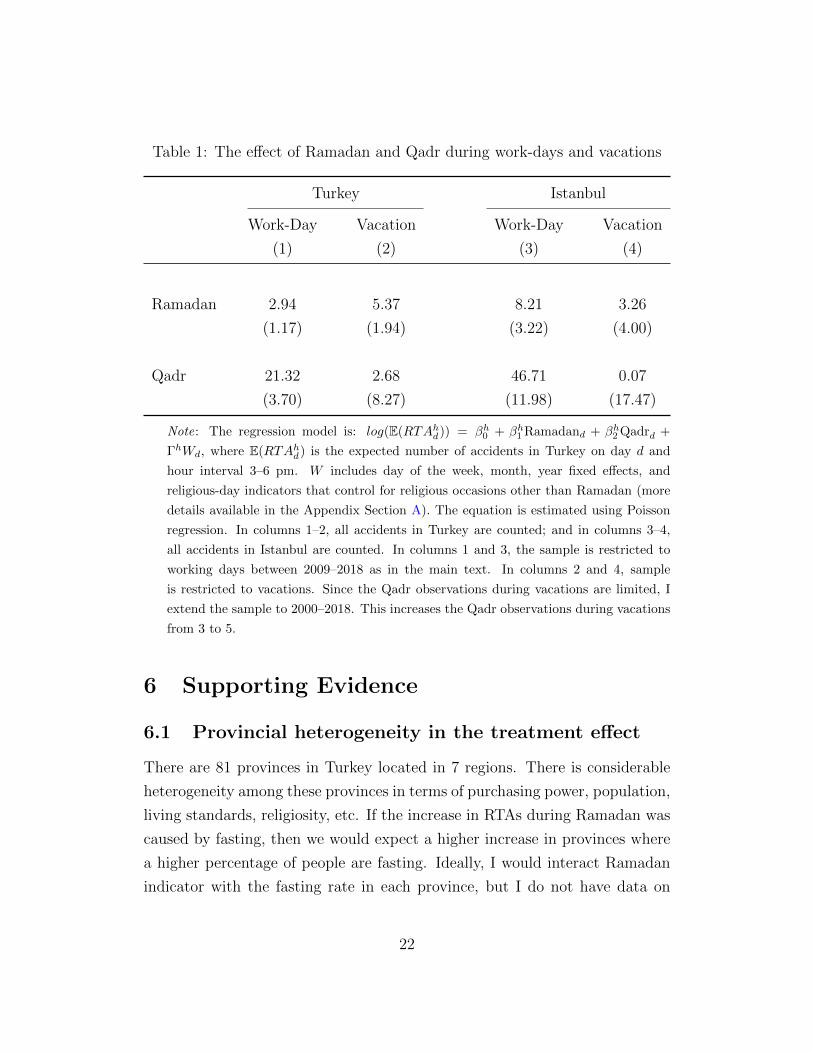
Table 1: The effect of Ramadan and Qadr during work-days and vacations
Turkey Istanbul
Work-Day Vacation Work-Day Vacation
(1) (2) (3) (4)
Ramadan 2.94 5.37 8.21 3.26
(1.17) (1.94) (3.22) (4.00)
Qadr 21.32 2.68 46.71 0.07
(3.70) (8.27) (11.98) (17.47)
Note: The regression model is: log(E(RTAhd)) = βh
0 + βh1 Ramadand + βh
2 Qadrd +
ΓhWd, where E(RTAhd) is the expected number of accidents in Turkey on day d and
hour interval 3–6 pm. W includes day of the week, month, year fixed effects, and
religious-day indicators that control for religious occasions other than Ramadan (more
details available in the Appendix Section A). The equation is estimated using Poisson
regression. In columns 1–2, all accidents in Turkey are counted; and in columns 3–4,
all accidents in Istanbul are counted. In columns 1 and 3, the sample is restricted to
working days between 2009–2018 as in the main text. In columns 2 and 4, sample
is restricted to vacations. Since the Qadr observations during vacations are limited, I
extend the sample to 2000–2018. This increases the Qadr observations during vacations
from 3 to 5.
6 Supporting Evidence
6.1 Provincial heterogeneity in the treatment effect
There are 81 provinces in Turkey located in 7 regions. There is considerable
heterogeneity among these provinces in terms of purchasing power, population,
living standards, religiosity, etc. If the increase in RTAs during Ramadan was
caused by fasting, then we would expect a higher increase in provinces where
a higher percentage of people are fasting. Ideally, I would interact Ramadan
indicator with the fasting rate in each province, but I do not have data on
22

fasting rates at the provincial level. Instead, I rely on proxies. I use two
proxies that are positively correlated with the religiosity of provinces (which
I denote as religiosity proxies), and two proxies that are negatively correlated
with average religiosity (which I denote as secularism proxies). The religiosity
proxies are the number of mosques per capita and the vote-share of the current
ruling party AKP in the 2011 general elections. The secularism proxies are the
vote share of the secular opposition party CHP, and the ratio of alcohol-related
accidents.19 Given these four proxies, I estimate the following equation:
log(E(RTA3−6pmd,p )) = β0 + β1Ramadand + β2Ramadand ∗Proxyp + ΓWd,p (2)
where p denotes the province, and Wd,p additionally includes province fixed
effects. I use the standardized versions of each proxy for comparability across
specifications. I rely on Ramadan observance instead of Qadr for statistical
power. I plot the 95% confidence interval of γi = (exp(βi)−1)∗100, i ∈ {1, 2}estimates using different proxies in Figure 5. Even though the proxies are likely
capturing different aspects of religiosity/secularism, their coefficient estimates
are very similar. The main takeaway is clear: in provinces where more people
are likely fasting, we observe a higher increase in RTAs during Ramadan.
Using my preferred specification (AKP vote share), we see that one standard
deviation increase in the AKP vote share results in an 8% increase in the
number of crashes during Ramadan between 3–6 pm. The effect is statistically
significant at the 5% significance level.
The provincial heterogeneity in fasting rates also allows me to investigate
how the marginal effect of a fasting driver changes with the aggregate fasting
rate. This is especially important for the generalizability of my results. For
19All four proxies are noisy predictors of fasting rates. Political party vote shares dependon various factors, not only on the religious discourse. The number of mosques per capitais also a function of socio-economic status of the locals and geographical factors. Roadconditions and police enforcement likely vary across provinces and are also determinantsof alcohol-related accidents. However noisy, each proxy is directly related to religiosity.The strong Islamic rhetoric of AKP, and the secular origins of CHP make their vote sharescorrelated with religiosity. In more religious provinces the demand for mosques should behigher on average. Fewer alcohol consumption in religious provinces should lead to a lowerratio of alcohol-related accidents.
23

Figure 5: Differential effects of Ramadan
(a) Religiousness Proxies (b) Secularism Proxies
Note: The regression equation is log(E(RTA3−6pmd,p )) = β0 + β1Ramadand + β2Ramadand ∗
Proxyp + ΓWd,p, where log(E(RTA3−6pmd,p )) is the natural logarithm of the expected number
of accidents on day d and province p, and hour-interval 3-6 pm. 4 Proxy variables areused in separate regressions: AKP and CHP vote-shares in the 2011 elections, number ofmosques per capita and the ratio of alcohol-related accidents. All proxies are standardized,so the β2 coefficients are comparable across specifications. The equation is estimated usingfixed effects Poisson regression. Standard errors are clustered at the province level. The95% confidence interval of γi = (exp(βi)− 1) ∗ 100, i ∈ {1, 2} estimates are plotted, wherethe standard errors are calculated by the Delta method. Sample restricted to working daysbetween 2009–2018.
instance, if a certain level of hungry driving has to take place for hunger to
make the the marginal driver more likely to cause accidents, then the estimates
from Turkey where a large number of people fast during Ramadan would not be
applicable to a country like US where hungry driving (due to religious, dietary
and financial reasons) is less common. Definitive answers require more work in
different settings. However, I can provide a framework for some extrapolation
about fasting’s effect on the marginal driver by adding more structure to the
relationship between different types of traffic accidents and fasting.
Intuitively, in accidents involving one vehicle, the only relevant parameter
is a driver’s own probability of causing an accident. Hence, fasting’s effect on
the probability of causing a one-vehicle accident should not depend on whether
other drivers also fast. This creates a linear relationship between the aggregate
effect of Ramadan (on one-vehicle accidents) and the fasting rate. However, in
two-vehicle accidents, the probability that one driver is involved in such a crash
24

depends on the ability of other drivers. If one driver’s mistake is sufficient to
cause a two-vehicle accident (which is an assumption used by Levitt and Porter
(2001)), an additional fasting driver’s aggregate effect would be decreasing in
the driver population’s fasting rate. To see this, let two drivers interact while
driving. The probability of one driver causing an accident matters only in the
state when the other driver does not make a mistake. As the fasting ratio in the
population increases, the probability of other drivers making mistakes increase,
hence the aggregate effect of the marginal driver who decides to fast declines.
This would create a concave relationship between the increase in accidents
during Ramadan and the fasting rate in the population. In Appendix Section
B, I formalize this intuition in a simple model.20
To test this intuition, I count the number of one-vehicle accidents and two-
vehicle accidents between 3–6 pm. Then, I estimate the following equation:
log(E(RTAk,3−6pmd,p )) =βk0 + βk1Ramadand + βk2Ramadand ∗ Proxyp
+ βk3Ramadand ∗ Proxy2p + ΓWd,p
(3)
where k denotes one-vehicle and two-vehicle accidents. In other words, I es-
timate equation 2 for one-vehicle and two-vehicle accidents separately, while
also adding a squared proxy interaction. γi = (exp(βi) − 1) ∗ 100 are plotted
in Figure 6. I use AKP vote share as the preferred proxy. As predicted, Ra-
madan’s effect is linear in the AKP vote-share in one-vehicle accidents. The
coefficient of the squared term is indistinguishable from zero. In contrast,
the coefficient of the squared term in two-vehicle accidents is negative and
statistically significant, implying a concave relationship between Ramadan’s
reduced-form effect and the fasting rate.
This finding serves two purposes. First, it functions as an additional ro-
bustness check. The fact that Ramadan’s coefficient moves in ways consistent
with the modeled effect of fasting supports my identification strategy. Second,
from a policy perspective, it implies that a fasting driver’s marginal effect may
20I put the model in the Appendix because I think the intuition is straight-forward, andhence the marginal contribution of the model does not justify the space in the main textthat I need to introduce the parameters.
25

Figure 6: Ramadan’s effect on one-vehicle and two-vehicle crashes
−10
−5
0
5
10
Pe
rce
nta
ge
Eff
ect
(%)
Ramadan Ramadan*AKP Ramadan*AKP_squared
Target Variable
One−vehicle crash Two−vehicle crash
Note: The regression equation is log(E(RTAk,3−6pmd,p )) = βk
0 +βk1Ramadand+βk
2Ramadand∗Proxyp+βk
3Ramadand∗Proxy2p+ΓWd,p, where log(E(RTAk,3−6pm
d,p )) is the natural logarithmof the expected number of one-vehicle (k=1) or two-vehicle (k=2) accidents on day d andprovince p, during the hour-interval 3–6 pm. The standardized AKP vote shares in the 2011elections are used as a proxy for fasting rates. The equation is estimated using fixed effectsPoisson regression. Standard errors are clustered at the province level. The 95% confidenceinterval of γi = (exp(βi) − 1) ∗ 100, i ∈ {1, 2, 3} estimates are plotted, where the standarderrors are calculated by the Delta method. Sample is restricted to working days between2009–2018.
be higher in countries with lower fasting rates.
6.2 Longer fast period causes more accidents
If hunger is causing a decline in driving ability due to fasting, then we would
expect to see a larger increase in RTAs when the fasting period is longer.
In this section, I exploit an exogenous increase in the fasting period caused
by the change in time zones due to daylight saving time to investigate this
effect. Between 2000–2015, Turkey used Eastern European Time during win-
ter (UTC+02:00) and Easter European Summer Time (UTC+03:00) during
summer.21 Clocks are turned backward (forward) by one hour during the
21Turkey ended this practice in September 2016. It now uses only one time zone:UTC+03:00
26

fall (spring) transition. Between 2000–2018, Ramadan overlapped with the
fall transition twice (in 2004 and 2005), and never with the spring transition.
Since fasting periods are determined by the location of the Sun and not by
time zones, the fall transition causes an exogenous increase in the fasting pe-
riod. On October 30, 2004, in Igdir (the easternmost province where the sun
sets earliest), people fasted from 4:59 am until 5:04 pm. On October 31, they
fasted from 4:00 am until 4:02 pm. The total length of abstinence does not
change, but fasting time until the rush hour increases.22 This is shown in
Figure 7. In 2004, sunset occurred as early as 3:45 pm after the transition. To
avoid bias from the effect of sunset, I focus on the time interval 14:30–15:30.
Figure 7: Time zone change and fasting period in Igdir, 2004
Note: The blue and red lines show the beginning and the end of the fasting period duringRamadan in 2004 in Igdir, the easternmost province of Turkey, where the fast ends theearliest. The fall transition from summer time zone into winter time zone on October 31stresults in an increase in the length of fast until the rush hour begins. Since sunset occurs asearly as 3:45 pm, I use the accidents between 14:30-15:30, which is shaded in green in thefigure, as the dependent variable instead of the usual 3–6 pm definition I used throughoutthe paper.
To the best of my knowledge, the fall transition is not associated with
22It is worth emphasizing that this additional hour of abstinence lasts more than one day,unlike potential changes in sleep schedule.
27

an increase in the number of crashes in other studies (Smith, 2016). However,
even if the fall transition had a separate effect on accidents, the effect of an ad-
ditional hour of fasting is still identified by the difference of the discontinuities
between the fall transitions during 2004–2005, and during other times (e.g.
2000–2003, or 2006–2015). To investigate this effect, I utilize the following
regression discontinuity design:
˜lnRTAs
d,h = βs0 + βs1FallTrand + f s(DaysToFallT rand)
+ f s(DaysToFallT ran ∗ FallTrand) + εsd,h(4)
where I first demean RTAs with day of the week, month and year fixed effects
to eliminate persistent seasonalities and time trends. DaysToFallT rand is
the running variable; FallTrand is an indicator equal to one if day d falls
after the fall transition. I estimate equation 4 using local-linear regressions
and a triangular kernel, with 3 different time spans: 2000–2003, 2004–2005,
and 2006–2015. Since the fall transition occurred during Ramadan only in
2004 and 2005, we would expect to find no effect between 2000-2003 and
2006-2015. I display my results in Figure 8. The fall transition has no effect
on traffic accidents between 2000–2003 and 2006–2015, when the transition
did not occur during Ramadan. In contrast, between 2004–2005 there is a
substantial increase in RTAs due to the fall transition. The effect is significant
at the conventional levels.23 The fact that the fall transition has a significant
effect only when it coincides with Ramadan provides strong evidence that
it is the extra hour of abstinence from food and drinks that is causing the
increase in RTAs between 2004–2005. Since the RD design compares Ramadan
observations before and after the time zone change, the observed effect is
independent of any unknown confounders that may have driven the results in
23It is worth emphasizing that the test is under-powered as there are only two years whereDST coincided with Ramadan, which is why the confidence interval is very large. Giventhis uncertainty, I would advise against taking the coefficient estimate of 0.3 at face value.Instead, I focus on the way RD estimates are practically zero both before (2000–2003) andafter (2006-2015) the treated two-year period. It is only during the years 2004–2005 whereDST affects RTAs, and this is exactly when it coincided with Ramadan and increased thelength of abstinence.
28

the previous sections.
Figure 8: Effect of an additional hour of abstinence
Note: The regression equation is ˜lnRTAs
d,h = βs0 +βs
1FallTrand+fs(DaysToFallT rand)+fs(DaysToFallTran ∗FallTrand) + εsd,h, where I first demean RTAs with day of the week,month and year fixed effects. DaysToFallT rand is the running variable of the RD design,FallTrand is an indicator that equals to one if day d falls after the fall transition. I estimatethis equation using local-linear regressions and a triangular kernel, with three different timespans: 2000–2003, 2004–2005 (when the fall transition occurred during Ramadan), and2006–2015. The 95% confidence interval of γ = (exp(β1) − 1) ∗ 100 estimates using eachsample period are plotted. The figure shows that the fall transition increases traffic accidentsonly when it coincides with Ramadan, during which it causes an increase in the fastingperiod.
6.3 Hunger is the main factor
Ramadan fasting involves abstinence from food and drinks. Since hunger and
dehydration are joint treatments, the results thus far do not signal which
treatment is the main factor of Ramadan fasting’s impact. This is impor-
tant because various forms of hungry driving (e.g., voluntary fasting for other
religious or dietary reasons) do not include abstinence from water. Hence,
the generalizability of my results depends largely on how much dehydration
impacts the causal effect of Ramadan fasting on driving ability.
In the background section, I explained that the medical literature points
29

to hunger as the most likely culprit. For instance, it is shown that decline in
caloric intake and blood glucose from deprivation from food while fasting can
impair cognitive function (Waterhouse, 2010; Iraki et al., 1997). In contrast,
levels of dehydration found in Ramadan fasting are “unlikely to have a major
adverse effect on any aspect of physical or cognitive performance” (Maughan
and Shirreffs, 2012). Therefore, one can conclude that hunger induced by
fasting is causing the increase in accidents I document.
This hypothesis is also empirically testable in my data. Levels of dehy-
dration depend on the weather temperature. In warmer weathers, we would
expect people to lose more water that they cannot replenish while fasting.
Hence, if dehydration caused the increase in accidents, then we would expect
to see an amplified Ramadan effect when the weather is warmer.
To test this hypothesis, I interact the Ramadan treatment with the maxi-
mum temperature observed in each province-day observation. The regression
equation is:
log(1 +RTA3−6pmd,p ) =β0 + β1(Ramadand ∗ Temperaturep,d)
+ β2Temperaturep,d + θ(Ramadand ∗ Provincep)
+ ΓWd,p + εd,p
(5)
where Temperaturep,d is the maximum temperature on day d and in province p.
(Ramadand∗Provincep) captures the average Ramadan effect in each province.
This variable is added because fasting rates and temperature may be corre-
lated across provinces. β1 is the target parameter, which captures the impact
of temperature on the reduced-form effect of Ramadan. The estimate of β1 can
be found in column 1 of Table 2. The coefficient estimate is -0.0011 (standard
error 0.0009), which implies that a 1°C increase in the temperature decreases
Ramadan’s impact by 0.1%. This effect is also statistically insignificant. No-
tice that the standard errors are small, so the null impact does not come from
lack of power. I repeat the same analysis using data from Istanbul as a ro-
bustness check. The results (from log-linear OLS and Poisson specifications)
can be found in columns 2–3. The coefficient estimates remain negative and
30

insignificant, although the confidence intervals become larger as the sample
size decreases.
The data strongly suggest that heat does not play a sizable role in Ra-
madan’s effect. Therefore, I conclude that dehydration is not a major deter-
minant of fasting’s impact on driving ability. In other words, hunger induced
by fasting is causing the increase in accidents during Ramadan.
Table 2: Effect of temperature on Ramadan’s reduced-form impact
Sample Turkey Istanbul Istanbul
Dependent variable log(1+RTA) log(1+RTA) RTA
Estimation Method OLS OLS Poisson
Ramadan*temperature -0.0011 -0.0070 -0.0089
(0.0009) (0.0092) (0.0096)
N 200369 2484 2484
Note: In the first column, the regression equation is: log(1 + RTA3−6pmd,p ) = β0 +
β1(Ramadand ∗ Temperaturep,d) + β2Temperaturep,d + θ(Ramadand ∗ Provincep) +
ΓWd,p + εd,p, where RTA3−6pmd,p is the number of accidents between 3–6 pm in province
p and on day d, Temperaturep,d is the maximum temperature (in Celsius) on day d and
in province p, (Ramadand ∗ Provincep) captures the Ramadan effect in each province.
This variable is added because fasting rates and temperature may be correlated across
provinces. W includes day of the week, month, year, province fixed effects, and religious-
day indicators that control for religious occasions other than Ramadan (more details
available in the Appendix Section A). The dependent variable is in log(1+y) format
(unlike the Poisson regression used in the main text) because of convergence issues with
many covariates. Standard errors are clustered at the province level.
In the second and third columns, sample is restricted to Istanbul. In the second column,
the regression equation is: log(1 +RTA3−6pmd ) = β0 +β1(Ramadand ∗Temperatured) +
β2Temperatured + θRamadand + ΓWd + εd, where W includes the usual controls. The
dependent variable is in log(1+y) format, and the regression equation is estimated using
OLS. Robust standard errors are in parenthesis. In the third column, the dependent
variable is the count of accidents, and the equation is estimated using Poisson regression.
31

7 Public Policy Implications
This section lays the groundwork for future policy discussions by comparing
the results of this paper with other determinants of traffic accidents that are
subject to regulation. In particular, I contrast the effect of fasting with the
effects of alcohol and sleep deprivation. These are good starting points because
(1) they are known causes of accidents and (2) they are regulated differently.
Drunk driving is a major cause of accidents and is regulated in almost all
countries via blood alcohol concentration (BAC) limits. In contrast, there are
no official sleep requirements for non-commercial drivers. However, there are
regulations for commercial drivers to ensure that drivers get enough time to
sleep and rest. For instance, truck drivers in the United States are allowed a
period of 14 consecutive hours of driving up to 11 hours after being off duty for
10 or more consecutive hours (Federal Motor Carrier Safety Administration,
2011). There are specific rules about how long, in total and consecutively,
drivers can work for in a week; and when and how much they should rest.24
Where does hunger stand compared to alcohol and sleep deprivation? There
is plenty of evidence about alcohol’s effect on crash probability. Levitt and
Porter (2001) estimate that drivers with nonzero BAC are 7 times more likely
than sober drivers to cause an RTA, and legally drunk drivers 13 times more
likely. Similar estimates can be found in Voas et al. (2012), where the authors
find that having a BAC between 0.05–0.07 (legal BAC limit is 0.05 in most
western European countries, 0.08 in the US) increases the crash probability by
3 to 5 times. Evidence for the effect of sleep deprivation on crash probability
comes from Smith (2016) who finds a 5.6% increase in fatal crashes following
the spring transition to daylight saving time. Smith (2016) employs further
tests to conclude that the sleep loss solely causes the increase. Using Barnes
and Wagner (2009)’s estimate that Americans sleep 40 minutes less on the
night of the spring transition, a back of the envelope calculation shows that a
one-hour decline in sleep is associated with an 8.4% increase in the likelihood
24Interested readers can visit the website of the Federal Motor CarrierSafety Administration, https://www.fmcsa.dot.gov/regulations/hours-service/summary-hours-service-regulations
32

of causing accidents. In contrast, I estimate that hunger induced by fasting
increases the crash probability by 25%.
My estimates, combined with other results found in the literature, suggest
that driving while hungry from fasting is far less dangerous than driving with
moderate amounts of alcohol, around three times as dangerous as driving with
one hour of less sleep, and probably as dangerous as driving with a substantial
lack of sleep. Given these comparisons, there seems to be (1) no ground for
universal regulation, and (2) some ground for regulation on commercial drivers.
As the source of impaired driving is the decline in blood glucose induced by not
eating, an optimal policy should target the food intake of drivers. However,
the optimal form of this regulation depends on the social planner’s objective
function, which is beyond the scope of this paper.
The length of deprivation from food during fasting (around 16 hours in
my sample) is not necessarily longer than the length of deprivation from food
poorer populations face in their daily lives. This paper adds little to the dan-
gers of hunger in much of the developing world: worsened driving ability is not
a first-order issue for the very poor. However, deprivation from food occurs
also in the developed countries where feasible policies can make a difference.
In the US it is well documented that SNAP households experience depriva-
tion at the end of their benefit cycles (Carlson et al., 2019).25 For instance,
Hamrick and Andrews (2016) document that SNAP participants become in-
creasingly more likely to report a day with no eating over the benefit cycle.
Taken at face value, my results indicate that such periods of deprivation can
make these households significantly more likely to cause accidents.26 A policy
recommendation from this paper would be to increase the frequency by which
aid is provided, which could reduce the time spent in deprivation.
Lastly, from a religious perspective, Ramadan fasting is not mandatory for
people who can be hurt by fasting, including the pregnant, the ill, and travelers.
Taking into account the new evidence that fasting can cause significant injuries
and deaths via traffic accidents, future research in religious studies may also
25I am thankful to an anonymous referee for pointing this fact.26I leave this as a testable prediction for future research.
33

investigate the grounds for exemption for drivers. Commenting on the religious
status of fasting drivers is beyond the scope of this paper.
8 Limitations
I estimate the effect of fasting on crash probability from essentially two steps:
(1) focusing on the rush hour of working days to keep traffic density constant,
and (2) relying on Qadr for a more reliable first-stage. Both steps rely on
assumptions, which results in certain limitations. In this section, I discuss
some of these limitations.
In the data, there is low take-up on non-Qadr Ramadan days that surveys
cannot capture. This results in an upward-biased first-stage estimate from
surveys, and hence in an underestimate of LATE. To circumvent this problem,
I rely on the day of Qadr that generates the most fasting in the Turkish
population. There is only one Qadr day a year, and hence the confidence
interval of my estimates is larger. Moreover, reliance on a particular day
generates concerns about unobserved confounders, i.e., channels other than
fasting by which Qadr causes accidents. Whereas I provide falsification tests to
show that such confounders are unlikely (e.g., Qadr has no effect on accidents
during holidays), it still adds uncertainty that should be mentioned.
Working hours not changing during Ramadan is the core institutional detail
behind my analysis. However, this rule primarily impacts the formal sector.
Working hours may be adjusted in the informal sector, which can cause traffic
density to decline in some regions in Turkey. This would lead to fewer accidents
during Ramadan, and hence cause me to underestimate fasting’s effect. For
instance, this can be why I find a higher increase (around 60% during Qadr)
in Istanbul, where informal employment is lower, than in Turkey (around 22%
during Qadr) where informal employment is higher.
Considering the possible biases, it is worth noting that, if anything, I am
underestimating fasting’s effect, which is already larger than some factors that
are regulated for commercial drivers, such as sleep deprivation.
One may be concerned about the specificity of the Turkish road structure
34

and how much it matters for the impact of fasting on accidents. Traffic ac-
cidents are complex, and modeling how road structure interacts with driving
ability is beyond the scope of this paper. However, to address this issue, I
provided some figures in Appendix Section D that show how Turkey compares
to other OECD countries in terms of road density, traffic, and the number of
road fatalities per vehicle, vehicle-km, and inhabitant. Turkey is similar to
other OECD countries, with slightly more fatalities than the average. This
shows that the specificity of road structure in Turkey should not be a concern
for external validity.
9 Conclusion
Many people drive while hungry, but not much is known about its effects. This
paper provides causal evidence, for the first time, that hunger induced by Ra-
madan fasting increases the probability of causing traffic accidents. Inference
on fasting’s effect on driving ability is complicated because (1) fasting affects
traffic accidents also through changing driving frequency, and (2) the Ramadan
month, which initiates fasting, impacts traffic accidents also through changing
traffic density. This creates three separate channels that link Ramadan obser-
vance to traffic accidents, and only the channel via changing driving ability is
relevant for inference on hungry driving.
I propose several identification strategies to isolate the variation in RTAs
that comes solely from fasting’s effect on driving ability. Key to the identifica-
tion is the fact that Turkey does not adjust working hours during Ramadan.
This turns the rush hour into a quasi-experiment because the same people
leave work at the same time during and outside of Ramadan, with the only
difference being that some are fasting. I estimate that fasting increases the
crash probability by 25% conditional on driving. The effect is robust to various
specifications. Ramadan has a stronger reduced-form effect (1) in provinces
where more people are likely fasting and (2) when there is an exogenously
longer fasting period due to daylight saving time. I also show that Ramadan’s
effect does not depend on the outside temperature, which suggests that de-
35

hydration is not an important factor behind fasting’s causal effect on driving
ability. This implies that hunger induced by fasting causes accidents.
To understand my findings’ policy implications, I compare fasting with
drunk driving, which is regulated for all drivers, and with sleep deprivation,
which is regulated only for commercial drivers. I find that driving while hun-
gry is substantially less dangerous than drunk driving but more dangerous
than driving with mild sleep deprivation. Consequently, it can be argued that
commercial drivers’ blood glucose levels should be regulated.
Lastly, it is worth noting that there are already policies that target the
month of Ramadan in many Muslim countries. Working hours are reduced
during Ramadan in countries including United Arab Emirates, Saudi Arabia,
Kuwait, Bahrain, Oman, Qatar, Indonesia, and Egypt (PwC, 2019; Egypt
Today, 2011; Emerhub, 2019). Assuming that these policies are designed to
address problems caused by the hunger induced by fasting, it is natural to ask
what can or should be done about the problems caused by fasting (for religious
or dietary reasons) in other countries where significant numbers of people fast.
36

References
Adan, A. (2012). Cognitive performance and dehydration. Journal of the
American College of Nutrition 31 (2), 71–78.
Alberts, B., A. Johnson, J. Lewis, M. Raff, K. Roberts, P. Walter, D. Bray,
and J. Watson (2014). Molecular Biology of the Cell Sixth Edition. Garland
Science.
Almond, D. and B. Mazumder (2011). Health capital and the prenatal en-
vironment: the effect of ramadan observance during pregnancy. American
Economic Journal: Applied Economics 3 (4), 56–85.
Almond, D., B. Mazumder, and R. Van Ewijk (2015). In utero ramadan expo-
sure and children’s academic performance. The Economic Journal 125 (589),
1501–1533.
Bahammam, A. (2006). Does ramadan fasting affect sleep? International
journal of clinical practice 60 (12), 1631–1637.
Barnes, C. M. and D. T. Wagner (2009). Changing to daylight saving time
cuts into sleep and increases workplace injuries. Journal of applied psychol-
ogy 94 (5), 1305.
Bener, A., G. Absood, N. Achan, and M. Sankaran-Kutty (1992). Road traffic
injuries in al-ain city, united arab emirates. Journal of the Royal Society of
Health 112 (6), 273–276.
Benton, D. (1990). The impact of increasing blood glucose on psychological
functioning. Biological Psychology 30 (1), 13–19.
Campante, F. and D. Yanagizawa-Drott (2015). Does religion affect economic
growth and happiness? evidence from ramadan. The Quarterly Journal of
Economics 130 (2), 615–658.
37

Carlson, S., J. Llobrera, and B. Keith-Jennings (2019). More adequate snap
benefits would help millions of participants better afford food. Report, Cen-
ter on Budget and Policy Priorities.
Carpenter, C. (2004). How do zero tolerance drunk driving laws work? Journal
of Health Economics 23 (1), 61–83.
Carpenter, C. S. and M. Stehr (2008). The effects of mandatory seatbelt laws
on seatbelt use, motor vehicle fatalities, and crash-related injuries among
youths. Journal of Health Economics 27 (3), 642–662.
Cohen, A. and L. Einav (2003). The effects of mandatory seat belt laws on driv-
ing behavior and traffic fatalities. Review of Economics and Statistics 85 (4),
828–843.
Dee, T. S. (1999). State alcohol policies, teen drinking and traffic fatalities.
Journal of public Economics 72 (2), 289–315.
Dee, T. S. (2001). Does setting limits save lives? the case of 0.08 bac laws.
Journal of Policy Analysis and Management: The Journal of the Association
for Public Policy Analysis and Management 20 (1), 111–128.
Dee, T. S. and W. N. Evans (2001). Behavior policies and teen traffic safety.
American Economic Review 91 (2), 91–96.
Dee, T. S., D. C. Grabowski, and M. A. Morrisey (2005). Graduated driver
licensing and teen traffic fatalities. Journal of health economics 24 (3), 571–
589.
Demiroglu, C., O. Ozbas, R. Silva, and M. F. Ulu (2021). Do physiological and
spiritual factors affect economic decisions? Journal of Finance, forthcoming.
Dills, A. K. (2010). Social host liability for minors and underage drunk-driving
accidents. Journal of health economics 29 (2), 241–249.
38

Egypt Today (2011, July). Non-muslim employees entitled to work
six hours during ramadan. https://www.egypt-today.com/en/90/non-
muslim-employees-entitled-to-work-six-hours-during-ramadan. Last Ac-
cessed: February 8th 2021.
Eisenberg, D. (2003). Evaluating the effectiveness of policies related to drunk
driving. Journal of policy Analysis and management 22 (2), 249–274.
Emerhub (2019, May). Doing business in indonesia during ramadan: Essen-
tial tips. https://emerhub.com/indonesia/doing-business-indonesia-during-
ramadan-tips/. Last Accessed: February 8th 2021.
euronews (2019). Turkiye’de 100 kisiye dusen otomobil sayısı 14, ab’de ise
51. https://tr.euronews.com/2019/12/30/turkiye-de-100-kisiye-dusen-arac-
say-s-28-ab-de-ise-51. Last Accessed: February 8th 2021.
FAO, IFAD, UNICEF, WFP, and WHO (2019). The state of food security and
nutrition in the world 2019: safeguarding against economic slowdowns and
downturns, Volume 2019. Food & Agriculture Org.
Federal Motor Carrier Safety Administration (2011). Interstate truck driver’s
guide to hours of service. https://www.fmcsa.dot.gov/regulations/hours-
service/summary-hours-service-regulations.
Food Insight (2018). 2018 food & health survey. Technical report, International
Food Information Council.
Gailliot, M. T., R. F. Baumeister, C. N. DeWall, J. K. Maner, E. A. Plant,
D. M. Tice, L. E. Brewer, and B. J. Schmeichel (2007). Self-control relies
on glucose as a limited energy source: willpower is more than a metaphor.
Journal of personality and social psychology 92 (2), 325.
Grandjean, A. C. and N. R. Grandjean (2007). Dehydration and cognitive
performance. Journal of the American College of Nutrition 26 (sup5), 549S–
554S.
39

Hamrick, K. S. and M. Andrews (2016). Snap participants’ eating patterns
over the benefit month: a time use perspective. PloS one 11 (7), e0158422.
Hu, Z. and Z. Wang (2019). Nutrition, labor supply, and productivity: Evi-
dence from ramadan in indonesia.
Husain, R., M. Duncan, S. Cheah, and S. Ch’Ng (1987). Effects of fasting
in ramadan on tropical asiatic moslems. British journal of nutrition 58 (1),
41–48.
Iraki, L., A. Bogdan, F. Hakkou, N. Amrani, A. Abkari, and Y. Touitou (1997).
Ramadan diet restrictions modify the circadian time structure in humans.
a study on plasma gastrin, insulin, glucose, and calcium and on gastric ph.
The Journal of Clinical Endocrinology & Metabolism 82 (4), 1261–1273.
Iyer, S. (2016). The new economics of religion. Journal of Economic Litera-
ture 54 (2), 395–441.
Kalafat, U. M., H. Topacoglu, O. Dikme, O. Dikme, S. Sadillioglu, and M. O.
Erdede (2016). Evaluation of the impact of the month of ramadan on traffic
accidents. International Journal of Medical Science and Public Health 5 (3),
543–546.
Khammash, M. R. and T. F. Al-Shouha (2006). Do road traffic accidents
increase during the fasting month of ramadan. Neurosciences 11 (1), 21–23.
Kul, S., E. Savas, Z. A. Ozturk, and G. Karadag (2014). Does ramadan fasting
alter body weight and blood lipids and fasting blood glucose in a healthy
population? a meta-analysis. Journal of religion and health 53 (3), 929–942.
Langford, E., M. Ishaque, J. Fothergill, and R. Touquet (1994). The effect of
the fast of ramadan on accident and emergency attendances. Journal of the
Royal Society of Medicine 87 (9), 517.
Leiper, J. B. and A. Molla (2003). Effects on health of fluid restriction during
fasting in ramadan. European journal of clinical Nutrition 57 (S2), S30.
40

Levitt, S. D. and J. Porter (2001). How dangerous are drinking drivers? Jour-
nal of political Economy 109 (6), 1198–1237.
Lovenheim, M. F. and J. Slemrod (2010). The fatal toll of driving to drink:
The effect of minimum legal drinking age evasion on traffic fatalities. Journal
of health economics 29 (1), 62–77.
Mafauzy, M., W. Mohammed, M. Anum, A. Zulkifli, and A. Ruhani (1990).
A study of the fasting diabetic patients during the month of ramadan. Med
J Malaysia 45 (1), 14–7.
Majid, M. F. (2015). The persistent effects of in utero nutrition shocks over
the life cycle: Evidence from ramadan fasting. Journal of Development
Economics 117, 48–57.
Margolis, S. A. and R. L. Reed (2004). Effect of religious practices of ramadan
on sleep and perceived sleepiness of medical students. Teaching and learning
in medicine 16 (2), 145–149.
Maughan, R. and S. Shirreffs (2012). Hydration and performance during ra-
madan. Journal of sports sciences 30 (sup1), S33–S41.
Mehmood, A., A. Moin, I. Q. Khan, M. U. Mir, and R. Jooma (2015). Vul-
nerable road users are at greater risk during ramadan–results from road
traffic surveillance data. JPMA: Journal of the Pakistan Medical Associa-
tion 65 (3), 287.
Michalak, L. and K. Trocki (2006). Alcohol and islam: an overview. Contem-
porary Drug Problems 33 (4), 523–562.
Moskowitz, H., M. Burns, D. Fiorentino, A. Smiley, P. Zador, et al. (2000).
Driver characteristics and impairment at various bacs. Technical report,
United States. National Highway Traffic Safety Administration.
O’Grady, S. (2018, May). Danish minis-
ter: Muslims fasting is ‘dangerous for us all’.
41

https://www.washingtonpost.com/news/worldviews/wp/2018/05/22/danish-
minister-muslims-fasting-is-dangerous-for-us-all/.
Pew research Center (2012). The world’s muslims: Unity and diversity. Tech-
nical report, Pew research Center.
Pollitt, E., S. Cueto, and E. R. Jacoby (1998). Fasting and cognition in well-
and undernourished schoolchildren: a review of three experimental studies.
The American journal of clinical nutrition 67 (4), 779S–784S.
PwC (2019, May). Ramadan in the gcc: What employers need to know.
Roky, R., F. Chapotot, F. Hakkou, M. T. Benchekroun, and A. Buguet (2001).
Sleep during ramadan intermittent fasting. Journal of sleep research 10 (4),
319–327.
Roky, R., L. Iraki, R. HajKhlifa, N. L. Ghazal, and F. Hakkou (2000). Daytime
alertness, mood, psychomotor performances, and oral temperature during
ramadan intermittent fasting. Annals of Nutrition and Metabolism 44 (3),
101–107.
Sadeghirad, B., S. Motaghipisheh, F. Kolahdooz, M. J. Zahedi, and A. A.
Haghdoost (2014). Islamic fasting and weight loss: a systematic review and
meta-analysis. Public health nutrition 17 (2), 396–406.
Schofield, H. (2014). The economic costs of low caloric intake: Evidence from
india. Working Paper.
Shanks, N., M. Ansari, and D. Ai-Kalai (1994). Road traffic accidents in saudi
arabia. Public health 108 (1), 27–34.
Smith, A. C. (2016). Spring forward at your own risk: Daylight saving time and
fatal vehicle crashes. American Economic Journal: Applied Economics 8 (2),
65–91.
Sood, N. and A. Ghosh (2007). The short and long run effects of daylight saving
time on fatal automobile crashes. The BE Journal of Economic Analysis &
Policy 7 (1).
42

Tahir, M., G. Macassa, A. Akbar, R. Naseer, A. Zia, and S. Khan (2013). Road
traffic crashes in ramadan: an observational study. EMHJ 19, s147–51.
Van Ewijk, R. (2011). Long-term health effects on the next generation of
ramadan fasting during pregnancy. Journal of health economics 30 (6), 1246–
1260.
Voas, R. B., P. Torres, E. Romano, and J. H. Lacey (2012). Alcohol-related
risk of driver fatalities: an update using 2007 data. Journal of studies on
alcohol and drugs 73 (3), 341–350.
Waterhouse, J. (2010). Effects of ramadan on physical performance: chrono-
biological considerations. British journal of sports medicine 44 (7), 509–515.
World Health Organization (2018). Global status report on road safety 2018.
https://www.who.int/publications/i/item/9789241565684. Last Accessed:
February 8th 2021.
World Health Organization (2019). Global status report on alcohol and health
2018. World Health Organization.
Yusuf, I. (2009). Laylat al-qadr. http://www.oxfordislamicstudies.com/article/opr/t236/e1058.
Last Accessed: February 8th 2021.
Zador, P. L. (1991). Alcohol-related relative risk of fatal driver injuries in
relation to driver age and sex. Journal of studies on alcohol 52 (4), 302–310.
Zador, P. L., S. A. Krawchuk, and R. B. Voas (2000). Alcohol-related relative
risk of driver fatalities and driver involvement in fatal crashes in relation to
driver age and gender: an update using 1996 data. Journal of studies on
alcohol 61 (3), 387–395.
43

A Data Appendix
A.1 Effective Religious Holidays
Ramadan month is followed by a nationwide Ramadan holiday that lasts for 3
days in general, with the last day of Ramadan month, arefe, being a half-day
working day. Sometimes, this 3.5 day vacation occurs during the middle of
the week (e.g. in 2015 the Ramadan vacation was set to occur from Tuesday
afternoon to Friday). Since only a few working days remain in the way of
a nine-day vacation, government sometimes declares the rest of the week an
official holiday. This happened for the Ramadan holiday in 2008, and 2016.
In 2003, similar conditions were present, but the vacation was not officially
extended. However, it is possible that people take voluntary leave from their
work to go on vacations, which would violate the assumption that the time
people leave work does not change during Ramadan. To eliminate the bias
that comes from people extending their holidays, I use an extended definition
of religious vacations. The official dates of the Ramadan vacations, and my
definition of the first and last effective days of these vacations, are given in Ta-
ble A.1. The yellow color indicates the vacations that are officially extended by
the government. The blue color indicates the extra extensions that I defined in
my analysis to shield away from potential bias coming from people extending
their holidays. It is worth noting that, absent this adjustment, I would over-
estimate fasting’s effect on crash probability because traffic accidents increase
substantially during these long vacations.
I also make this adjustment for the Kurban holiday, as can be seen in
Table A.2. The reason is that, the dates of Ramadan and Kurban holidays
are determined according to the lunar calendar. Consequently, there is a de-
terministic relationship between the Ramadan dates and the Kurban holiday,
during which there are substantially more accidents because more people are
driving across the country to visit their families. By dropping the effective
vacations due to the Kurban holiday, I eliminate this correlation and ensure
that Ramadan dates are as if randomly assigned in the sample.
Figure A.5 shows how the control variables are selected, and their respective
A1

effects on the relationship between Ramadan and traffic density. Dropping
vacations is the first step for identification since the rush hour of working
days provides the relevant quasi-experimental setting. The day of the week,
month and year fixed effects control for the seasonality in the traffic accidents
data. The reason why it substantially changes the estimates is that Ramadan
occurred mostly during the summer months since 2009. On average, during
the rush hour of summer months, the traffic density in Istanbul was lower.
The indicators for the day before the religious vacation starts, and for the two
days after the religious vacation ends control for potential irregularities caused
by the national vacations (e.g., increased traffic due to vacation preparations).
To show the empirical importance of restricting the analysis to the rush
hour, I estimate the reduced-form effect of Ramadan using different models,
and plot the estimates in Figure A.6. Counting all accidents during a day
and using the relevant control variables, we see that the number of accidents
declines by 10% during Ramadan. This is because the amount of driving
declines substantially during Ramadan. Only by focusing on the rush hour of
working days can we see the increase in accidents during Ramadan, which is
the result of fasting’s impact on driving ability.
A2

Tab
leA
.1:
Ram
adan
Vac
atio
ns
Are
fefi
rst
offici
alla
stoffi
cial
effec
tive
firs
teff
ecti
ve
last
Fri
day
,Jan
uar
y7,
2000
Sat
urd
ay,
Jan
uar
y8,
2000
Mon
day
,Jan
uar
y10
,20
00
Fri
day
,Janu
ary
7,200
0M
onday
,Janu
ary
10,
2000
Tu
esd
ay,
Dec
emb
er26
,20
00W
edn
esd
ay,
Dec
emb
er27
,20
00F
rid
ay,
Dec
emb
er29,
2000
Satu
rday
,D
ecem
ber
23,
2000
Monday
,January
1,
2001
Sat
urd
ay,
Dec
emb
er15
,20
01S
un
day
,D
ecem
ber
16,
2001
Tu
esd
ay,
Dec
emb
er18,
2001
Sat
urd
ay,
Dec
emb
er15
,20
01
Tues
day
,D
ecem
ber
18,
2001
Wed
nes
day
,D
ecem
ber
4,20
02T
hu
rsd
ay,
Dec
emb
er5,
2002
Sat
urd
ay,
Dec
emb
er7,
200
2W
edn
esday
,D
ecem
ber
4,20
02
Sunday
,D
ecem
ber
8,
2002
Mon
day
,N
ovem
ber
24,
2003
Tu
esd
ay,
Nov
emb
er25
,20
03T
hu
rsd
ay,
Nov
emb
er27,
200
3S
atu
rday
,N
ovem
ber
22,
200
3Sund
ay,
Nov
emb
er30,
2003
Sat
urd
ay,
Nov
emb
er13
,20
04S
un
day
,N
ovem
ber
14,
2004
Tu
esd
ay,
Nov
emb
er16
,20
04S
atu
rday
,N
ovem
ber
13,
2004
Tu
esd
ay,
Nov
emb
er16,
2004
Wed
nes
day
,N
ovem
ber
2,20
05T
hu
rsd
ay,
Nov
emb
er3,
2005
Sat
urd
ay,
Nov
emb
er5,
2005
Satu
rday
,O
ctob
er29,
2005
Su
nday
,N
ovem
ber
6,
2005
Su
nd
ay,
Oct
ober
22,
2006
Mon
day
,O
ctob
er23
,20
06W
edn
esd
ay,
Oct
ober
25,
2006
Sat
urd
ay,
Oct
ober
21,
2006
Wed
nes
day
,O
ctob
er25,
2006
Thu
rsd
ay,
Oct
ober
11,
2007
Fri
day
,O
ctob
er12
,20
07S
un
day
,O
ctob
er14
,200
7T
hurs
day
,O
ctob
er11,
2007
Sunday
,O
ctob
er14,
2007
Mon
day
,S
epte
mb
er29
,20
08T
ues
day
,S
epte
mb
er30
,20
08T
hu
rsd
ay,
Oct
ober
2,20
08Sat
urd
ay,
Sep
tem
ber
27,
200
8Sunday
,O
ctob
er5,
2008
Sat
urd
ay,
Sep
tem
ber
19,
2009
Su
nd
ay,
Sep
tem
ber
20,
2009
Tu
esd
ay,
Sep
tem
ber
22,
200
9S
atu
rday
,S
epte
mb
er19
,20
09T
ues
day
,Sep
tem
ber
22,
2009
Wed
nes
day
,S
epte
mb
er8,
2010
Thu
rsd
ay,
Sep
tem
ber
9,20
10S
atu
rday
,S
epte
mb
er11
,20
10
Wed
nes
day
,S
epte
mb
er8,
201
0S
unday
,S
epte
mb
er12,
2010
Mon
day
,A
ugu
st29
,20
11T
ues
day
,A
ugu
st30
,20
11T
hu
rsd
ay,
Sep
tem
ber
1,201
1Satu
rday
,A
ugu
st27
,20
11Su
nday
,Sep
tem
ber
4,
2011
Sat
urd
ay,
Au
gust
18,
2012
Su
nd
ay,
Au
gust
19,
2012
Tu
esd
ay,
Au
gust
21,
2012
Sat
urd
ay,
Au
gust
18,
2012
Tues
day
,A
ugust
21,
2012
Wed
nes
day
,A
ugu
st7,
2013
Thu
rsd
ay,
Au
gust
8,20
13S
atu
rday
,A
ugu
st10
,20
13W
ednes
day
,A
ugu
st7,
2013
Sunday
,A
ugust
11,
2013
Su
nd
ay,
Ju
ly27
,20
14M
ond
ay,
Ju
ly28
,20
14W
edn
esd
ay,
Ju
ly30
,20
14Satu
rday
,Ju
ly26
,201
4W
edn
esday
,July
30,
2014
Thu
rsd
ay,
Ju
ly16
,20
15F
rid
ay,
July
17,
2015
Su
nd
ay,
Ju
ly19
,20
15
Thu
rsd
ay,
July
16,
2015
Sund
ay,
July
19,
2015
Mon
day
,Ju
ly4,
2016
Tu
esd
ay,
Ju
ly5,
2016
Thu
rsd
ay,
Ju
ly7,
201
6S
atu
rday
,Ju
ly2,
201
6Sunday
,July
10,
2016
Sat
urd
ay,
Ju
ne
24,
2017
Su
nd
ay,
Ju
ne
25,
2017
Tu
esd
ay,
Ju
ne
27,
2017
Satu
rday
,Ju
ne
24,
2017
Tu
esd
ay,
June
27,
2017
Thu
rsd
ay,
Ju
ne
14,
2018
Fri
day
,Ju
ne
15,
2018
Su
nd
ay,
Ju
ne
17,
2018
Thu
rsday
,Ju
ne
14,
201
8Sun
day
,Jun
e17,
2018
Note
1:
”Are
fe”
isth
eday
bef
ore
the
religi
ous
vaca
tion
start
sand
isusu
ally
ahal
fw
orkin
gday
.Sin
cehal
f-w
orkin
gday
svio
late
the
iden
tify
ing
assu
mpti
on(n
ore
ason
for
traffi
cden
sity
tore
main
const
ant
bet
wee
n3–6
pm
),I
consi
der
them
asva
cati
ons.
”Fir
stoffi
cial
”an
d”L
ast
offi
cial
”den
ote
sth
efirs
tan
dla
stday
sof
the
Ram
adan
hol
iday
.R
amad
anhol
iday
last
sfo
r3.
5day
sin
gener
al,
but
isex
tended
toco
ver
the
enti
rew
eek
by
the
gove
rnm
ent
ince
rtain
year
s.Such
exte
nsi
ons
occ
urr
edin
200
8an
d20
16.
Ifsi
milar
condit
ions
exis
ted
inoth
erye
ars
but
the
gove
rnm
ent
did
not
exte
nd
the
hol
iday
,I
still
counte
dth
ose
dat
esas
vaca
tion
sas
wor
kers
like
lyuse
thei
rva
cati
onti
me.
Such
exte
nsi
ons
occ
urr
edin
2000
,20
03,
2005,
and
2011.
”Eff
ecti
vefirs
t”and
”Eff
ecti
vela
st”
are
the
firs
tan
dla
stday
sof
the
religi
ous
vaca
tion
sunder
my
defi
nit
ion.
Inth
em
ain
text,
Idro
pal
lob
serv
atio
ns
that
are
bet
wee
nth
ese
two
dat
es.
Note
2:
Itis
wor
thnot
ing
that
the
addit
ional
dat
esI
count
asva
cati
onhav
ehig
her
acci
den
tco
unts
bec
ause
peo
ple
are
mos
tlike
lytr
avel
ing
mor
edue
tob
eing
onva
cati
on.
Not
dro
ppin
gsu
chdate
sw
ould
cause
me
toov
eres
tim
ate
fast
ing’
seff
ect
oncr
ash
pro
babilit
y.
A3

Tab
leA
.2:
Kurb
anV
acat
ions
Are
fefi
rst
last
firs
t-eff
last
-eff
Wed
nes
day
,M
arch
15,
2000
Thu
rsd
ay,
Mar
ch16
,20
00S
un
day
,M
arch
19,
2000
Wed
nes
day
,M
arch
15,
200
0S
un
day
,M
arc
h19,
2000
Su
nd
ay,
Mar
ch4,
2001
Mon
day
,M
arch
5,20
01T
hu
rsd
ay,
Mar
ch8,
2001
Sat
urd
ay,
Mar
ch3,
200
1S
un
day
,M
arc
h11,
2001
Thu
rsd
ay,
Feb
ruar
y21
,20
02F
rid
ay,
Feb
ruar
y22
,20
02M
ond
ay,
Feb
ruar
y25
,20
02T
hu
rsd
ay,
Feb
ruar
y21
,20
02M
on
day
,F
ebru
ary
25,
2002
Mon
day
,F
ebru
ary
10,
2003
Tu
esd
ay,
Feb
ruar
y11
,20
03F
rid
ay,
Feb
ruar
y14
,20
03S
aturd
ay,
Feb
ruar
y8,
2003
Su
nd
ay,
Feb
ruary
16,
2003
Sat
urd
ay,
Jan
uar
y31
,20
04S
un
day
,F
ebru
ary
1,20
04W
edn
esd
ay,
Feb
ruar
y4,
2004
Sat
urd
ay,
Jan
uar
y31,
200
4W
edn
esd
ay,
Feb
ruary
4,
2004
Wed
nes
day
,Jan
uar
y19
,20
05T
hu
rsd
ay,
Jan
uar
y20
,20
05S
un
day
,Jan
uar
y23
,20
05W
edn
esd
ay,
Jan
uar
y19
,200
5S
un
day
,Janu
ary
23,
2005
Mon
day
,Jan
uar
y9,
2006
Tu
esd
ay,
Jan
uar
y10
,20
06F
rid
ay,
Jan
uar
y13
,20
06Sat
urd
ay,
Jan
uar
y7,
200
6S
un
day
,Janu
ary
15,
2006
Sat
urd
ay,
Dec
emb
er30
,20
06S
un
day
,D
ecem
ber
31,
2006
Wed
nes
day
,Jan
uar
y3,
2007
Sat
urd
ay,
Dec
emb
er30
,20
06W
edn
esday
,Janu
ary
3,
2007
Wed
nes
day
,D
ecem
ber
19,
2007
Thu
rsd
ay,
Dec
emb
er20
,20
07S
un
day
,D
ecem
ber
23,
2007
Wed
nes
day
,D
ecem
ber
19,
200
7S
un
day
,D
ecem
ber
23,
2007
Su
nd
ay,
Dec
emb
er7,
2008
Mon
day
,D
ecem
ber
8,20
08T
hu
rsd
ay,
Dec
emb
er11
,20
08S
atu
rday
,D
ecem
ber
6,
2008
Su
nd
ay,
Dec
emb
er14,
2008
Thu
rsd
ay,
Nov
emb
er26
,20
09F
rid
ay,
Nov
emb
er27
,20
09M
ond
ay,
Nov
emb
er30
,20
09T
hurs
day
,N
ovem
ber
26,
200
9M
on
day
,N
ovem
ber
30,
2009
Mon
day
,N
ovem
ber
15,
2010
Tu
esd
ay,
Nov
emb
er16
,20
10F
rid
ay,
Nov
emb
er19
,20
10S
atu
rday
,N
ovem
ber
13,
2010
Su
nd
ay,
Nov
emb
er21,
2010
Sat
urd
ay,
Nov
emb
er5,
2011
Su
nd
ay,
Nov
emb
er6,
2011
Wed
nes
day
,N
ovem
ber
9,20
11S
atu
rday
,N
ovem
ber
5,
201
1W
edn
esd
ay,
Nov
emb
er9,
2011
Wed
nes
day
,O
ctob
er24
,20
12T
hu
rsd
ay,
Oct
ober
25,
2012
Su
nd
ay,
Oct
ober
28,
2012
Wed
nes
day
,O
ctob
er24
,201
2S
un
day
,O
ctob
er28,
2012
Mon
day
,O
ctob
er14
,20
13T
ues
day
,O
ctob
er15
,20
13F
rid
ay,
Oct
ober
18,
2013
Sat
urd
ay,
Oct
ober
12,
2013
Su
nd
ay,
Oct
ob
er20,
2013
Fri
day
,O
ctob
er3,
2014
Sat
urd
ay,
Oct
ober
4,20
14T
ues
day
,O
ctob
er7,
2014
Fri
day
,O
ctob
er3,
201
4T
ues
day
,O
ctob
er7,
2014
Tu
esd
ay,
Sep
tem
ber
22,
2015
Wed
nes
day
,S
epte
mb
er23
,20
15S
atu
rday
,S
epte
mb
er26
,20
15S
atu
rday
,S
epte
mb
er19,
201
5S
un
day
,S
epte
mb
er27,
2015
Su
nd
ay,
Sep
tem
ber
11,
2016
Mon
day
,S
epte
mb
er12
,20
16T
hu
rsd
ay,
Sep
tem
ber
15,
2016
Sat
urd
ay,
Sep
tem
ber
10,
2016
Su
nd
ay,
Sep
tem
ber
18,
2016
Thu
rsd
ay,
Au
gust
31,
2017
Fri
day
,S
epte
mb
er1,
2017
Mon
day
,S
epte
mb
er4,
2017
Sat
urd
ay,
Au
gust
26,
201
7M
on
day
,S
epte
mb
er4,
2017
Mon
day
,A
ugu
st20
,20
18T
ues
day
,A
ugu
st21
,20
18F
rid
ay,
Augu
st24
,20
18S
atu
rday
,A
ugu
st18,
201
8S
und
ay,
Au
gu
st26,
2018
Note
1:
”Are
fe”
isth
ed
ayb
efor
eth
ere
ligi
ous
vaca
tion
start
san
dis
usu
ally
ah
alf
work
ing
day
.S
ince
half
-work
ing
day
svio
late
the
iden
tify
ing
assu
mp
tion
(no
reaso
nfo
rtr
affi
cd
ensi
tyto
rem
ain
con
stan
tb
etw
een
3–6
pm
),I
con
sid
erth
emas
vaca
tion
s.”F
irst
offi
cial
”an
d”L
ast
offi
cial”
den
ote
sth
efi
rst
and
last
day
sof
the
Ku
rban
hol
iday
.K
urb
an
hol
iday
last
s4.5
day
sin
gen
eral,
bu
tis
som
etim
esex
ten
ded
toco
ver
the
enti
rew
eek
by
the
gov
ern
men
t.T
hes
eex
ten
sion
socc
urr
edin
2008,
2015
,201
6,
and
2017
.If
sim
ilar
con
dit
ion
sex
iste
din
oth
erye
ars
bu
tth
ego
vern
men
td
idn
ot
exte
nd
the
hol
iday
,I
stil
lco
unte
dth
ose
date
sas
vaca
tion
sas
work
ers
like
lyu
seth
eir
vaca
tion
tim
e.T
his
exte
nsi
on
occ
urr
edin
200
1.
”E
ffec
tive
firs
t”an
d”E
ffec
tive
last
”are
the
firs
tan
dla
std
ays
of
the
reli
gio
us
vaca
tion
su
nd
erm
yd
efin
itio
n.
Inth
em
ain
text,
Id
rop
all
obse
rvati
on
sth
atare
bet
wee
nth
ese
two
date
s.
A4

Tab
leA
.3:
Sum
mar
ySta
tist
ics
Pan
elA
:20
00-2
008
Pan
elB
:20
09-2
018
Vac
atio
nW
ork-D
ayV
acat
ion
Wor
k-D
ay
aver
age
no
ofcr
ash
non
-Ram
adan
Ram
adan
Qad
rnon
-Ram
adan
Ram
adan
Qad
rnon
-Ram
adan
Ram
adan
Qad
rnon
-Ram
adan
Ram
adan
Qad
r
15:0
0-16
:00
12.0
415
.61
611
.66
15.6
616
.25
24.0
827
.69
30.3
323
.72
28.1
139
.57
16:0
0-17
:00
12.1
416
.18
9.5
11.7
216
.84
17.8
824
.69
29.1
632
24.5
729
.68
32.5
7
17:0
0-18
:00
12.8
612
.77
912
.24
13.6
714
25.2
930
.48
29.6
724
.59
30.7
133
.86
15:0
0-18
:00
37.0
344
.56
24.5
35.6
346
.16
48.1
374
.07
87.3
392
72.8
888
.51
106
n95
387
220
6417
48
1064
893
2293
196
7
Note
:T
he
vaca
tion
sin
clude
wee
kends,
nat
ional
and
religio
us
holiday
s,half
work
ing
day
s,an
dce
rtai
nday
sb
etw
een
the
wee
kend
bef
ore
are
ligi
ous
hol
iday
star
tsd
uri
ng
whic
hp
eople
are
like
lyto
use
vaca
tion
sto
exte
nd
the
hol
iday
s.Such
dat
esare
spec
ified
infigu
res
A.1
and
A.2
A5

Figure A.1: AKP vote percentage in 2011 elections (Standardized)
Figure A.2: CHP vote percentage in 2011 elections (Standardized)
A6

Figure A.3: Percentage of Alcohol-related Accidents (standardized)
Figure A.4: Number of Mosques per capita (standardized)
A7

Figure A.5: Effect of Ramadan on Traffic density with different controls
Note: The error bars are the 95% confidence intervals of the coefficient estimate of Ramadan.This figure shows how the model selection (sample selection and control variable selection)impacts the reduced-form effect of Ramadan on traffic density. Given the right set of controlsand sample, Ramadan does not impact traffic density.
A8

Figure A.6: Ramadan’s effect with different models
Note: The error bars are the 95% confidence intervals of the coefficient estimate of Ramadan.Sample is restricted to accidents between 2009 and 2018. the first three columns plotRamadan’s effect in this equation: RTAd = β0+β1Ramadand+θW+εd, where RTAd is thenumber of all accident on day d. In the first column simple OLS is run without any controls.In the second column indicators for the day of the week, month, year, religious vacationsare added. The reason why coefficient changes sign is that since 2009, Ramadan occurredmostly during the summer months that have relatively more accidents due to seasonality.Controlling for seasonality via month fixed effects eliminates this bias, therefore the estimatein the second column can be read as the aggregate reduced-form effect of Ramadan. In thethird column all vacations are dropped: i.e., sample is restricted to the working days. Inthe fourth column, RTAd (the number of accidents on day d) is replaced by RTA15:00−18:00
d ,the number of accidents on day d between 3-6 pm. Consequently, the estimate in the fourthcolumn is the first column of Figure 4 in the main text.
A9

B Model
In this section, I introduce a simple model of traffic accidents and show that
the marginal impact of a fasting driver can be stronger in places with lower
fasting rates. At the heart of the model is a distinction between accidents
involving only one vehicle and those involving two vehicles. Assuming that
one driver’s fault is sufficient for a two-vehicle accident, the joint probability
of both drivers making a mistake creates a nonlinearity between the number
of accidents and the ratio of fasting drivers.
Denote by θ1 the probability of causing a one-vehicle accident, and by θ2 the
probability of causing a two-vehicle accident without fasting. For simplicity,
I abstract away from driving distance, fasting’s effect on the propensity to
drive, and the fact that a driver cannot cause both a one-car accident and
a two-vehicle accident. Moreover, I assume that fasting has the same effect
on both probabilities in percentage terms, which I denote by γ. Thus, the
probability of a driver i causing a one-vehicle or two-vehicle accident is given
by: θki = θk(1 + 1{Ri = 1}γ), k ∈ {1, 2}, where Ri = 1 if driver i fasts.
First, consider one-vehicle accidents. Assume there are N drivers, and x
ratio of drivers are fasting, x ∈ [0, 1]. The number of one-vehicle accidents is
the sum of 2 binomial distributions with parametersN(1−x), θ1 andNx, θ1(1+
γ). The expected number of one-vehicle accidents is given by
N(1− x)θ1 +Nxθ1(1 + γ) = Nθ1(1 + xγ)
which is linear in x, the ratio of fasting drivers.
The two-vehicle accidents are slightly more complex as the mistake of ei-
ther driver is assumed to be sufficient for an accident. Denote an interaction
between two vehicles by I. Here, interaction can be interpreted as an oppor-
tunity for a two-vehicle accident. Given an interaction between drivers i, j,
A10

the probability of an accident occurring is given by:
Pr(A = 1|I, i, j) = θ2i + θ2j − θ2iθ2j= 2θ2 + θ2γ(1{Ri = 1}+ 1{Rj = 1})
+ θ22(1 + γ(1{Ri = 1}+ 1{Rj = 1}) + γ21{Ri = 1}1{Rj = 1}
)
Assuming that x ratio of drivers are fasting, and that fasting drivers and non-
fasting drivers are equally mixed (i.e., they have the same relative likelihood of
interacting with each other), the expected probability of an accident is given
by:
E(Pr(A = 1|I, i, j)) = θ2(2− θ2) + 2θ2γ(1− θ2)x− θ22γ2x2
which is concave in x. As two drivers interact, the probability of the former
driver causing an accident matters only in the state when the other driver does
not make a mistake. As the fasting ratio increases, the probability of other
drivers making mistakes increases; hence the overall impact of the marginal
driver who decides to fast declines.
A11

C Additional Robustness Checks
A12
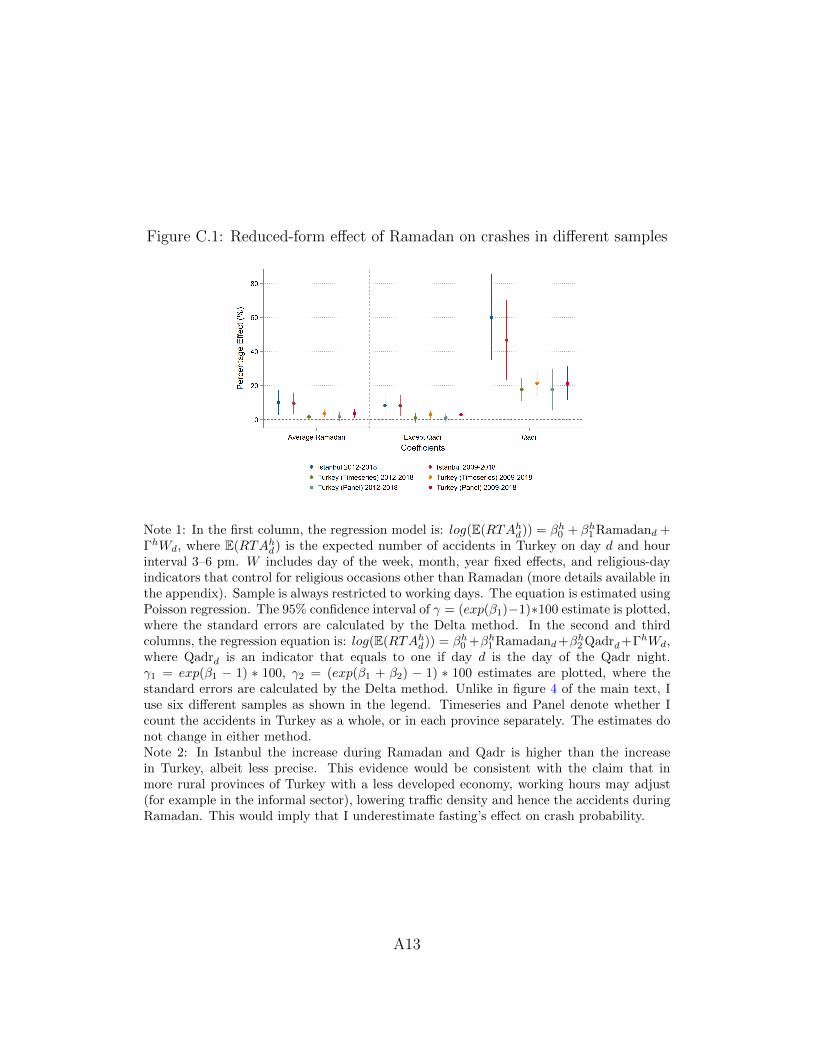
Figure C.1: Reduced-form effect of Ramadan on crashes in different samples
Note 1: In the first column, the regression model is: log(E(RTAhd)) = βh
0 + βh1 Ramadand +
ΓhWd, where E(RTAhd) is the expected number of accidents in Turkey on day d and hour
interval 3–6 pm. W includes day of the week, month, year fixed effects, and religious-dayindicators that control for religious occasions other than Ramadan (more details available inthe appendix). Sample is always restricted to working days. The equation is estimated usingPoisson regression. The 95% confidence interval of γ = (exp(β1)−1)∗100 estimate is plotted,where the standard errors are calculated by the Delta method. In the second and thirdcolumns, the regression equation is: log(E(RTAh
d)) = βh0 +βh
1 Ramadand+βh2 Qadrd+ΓhWd,
where Qadrd is an indicator that equals to one if day d is the day of the Qadr night.γ1 = exp(β1 − 1) ∗ 100, γ2 = (exp(β1 + β2) − 1) ∗ 100 estimates are plotted, where thestandard errors are calculated by the Delta method. Unlike in figure 4 of the main text, Iuse six different samples as shown in the legend. Timeseries and Panel denote whether Icount the accidents in Turkey as a whole, or in each province separately. The estimates donot change in either method.Note 2: In Istanbul the increase during Ramadan and Qadr is higher than the increasein Turkey, albeit less precise. This evidence would be consistent with the claim that inmore rural provinces of Turkey with a less developed economy, working hours may adjust(for example in the informal sector), lowering traffic density and hence the accidents duringRamadan. This would imply that I underestimate fasting’s effect on crash probability.
A13

Figure C.2: Reduced-form effect of Ramadan on crashes in Istanbul
Note: In the first column, the regression model is: log(E(RTAhd)) = βh
0 + βh1 Ramadand +
ΓhWd, where E(RTAhd) is the expected number of accidents in Turkey on day d and hour
interval 3–6 pm. W includes day of the week, month, year fixed effects, and religious-dayindicators that control for religious occasions other than Ramadan (more details available inthe Appendix Section A). Sample is restricted to working days. The equation is estimatedusing Poisson regression. The 95% confidence interval of γ = (exp(β1) − 1) ∗ 100 estimateis plotted, where the standard errors are calculated by the Delta method.In the second and third columns, the regression equation is: log(E(RTAh
d)) = βh0 +
βh1 Ramadand + βh
2 Qadrd + ΓhWd, where Qadrd is an indicator that equals to one if dayd is the day of the Qadr night. γ1 = exp(β1 − 1) ∗ 100, γ2 = (exp(β1 + β2) − 1) ∗ 100estimates are plotted, where the standard errors are calculated by the Delta method.
A14

Figure C.3: Effects of regular Ramadan, the day before and of Qadr
(a) Turkey (b) Istanbul
Note: The regression model is: log(E(RTAhd)) = βh
0 +βh1 Ramadand+βh
2 L.Qadrd+βh3 Qadrd+
ΓhWd, where E(RTAhd) is the expected number of accidents in Turkey on day d and hour
interval 3–6 pm. L. is the lead operator (L.Qadr is the day before Qadr). W includes dayof the week, month, year fixed effects, and religious-day indicators that control for religiousoccasions other than Ramadan (more details available in the Appendix Section A). Sampleis restricted to working days. The equation is estimated using Poisson regression. The 95%confidence interval of γ1 = exp(β1 − 1) ∗ 100, γi = (exp(β1 + βi) − 1) ∗ 100, i ∈ {2, 3}estimates are plotted, where the standard errors are calculated by the Delta method.
A15

D Road Structure of Turkey
Figure D.1: Density of road
Note: Density of road, km per one hundred sq. km, 2017 values. Malta is left out of thegraph as an outlier. If 2017 values were not present, the value from the most recent yearwas used. Source: OECD Stats/Transport/Performance Indicators/Indicators/Transportinfrastructure/ Density of road
Figure D.2: Road traffic per road motor vehicle
vehicle
Source: OECD Stats/Transport/Performance Indicators/Indicators/Traffic/Road traffic inthousand vehicle-km per road motor
A16

Figure D.3: Road fatalities per one million vehicle-km
Source: OECD Stats/Transport/Performance Indicators/Indicators/Safety/Road fatalitiesper one million vehicle-km
Figure D.4: Road fatalities per one million vehicles
Source: OECD Stats/Transport/Performance Indicators/Indicators/Safety/Road fatalitiesper one million vehicles
Figure D.5: Road fatalities per one million inhabitants
Source: OECD Stats/Transport/Performance Indicators/Indicators/Safety/Road fatalitiesper one million inhabitants
A17