Embed Size (px)
Citation preview
1
Rapamycin increases mitochondrial efficiency by mtDNA-dependent reprogramming of 1
mitochondrial metabolism in Drosophila. 2
3
Eugenia [Villa-Cuesta]1,*, Marissa A2. [Holmbeck] and David M. [Rand]2 4
5
1 Department of Biology, Adelphi University, P.O. Box 701, Garden City, NY 11530-6
0701.2 Department of Ecology and Evolutionary Biology, Brown University, Box G-W, 7
Providence, RI 02912, USA. 8
* Corresponding author: 9
Eugenia Villa-Cuesta 10
Department of Biology, 11
Adelphi University, 12
P.O. Box 701, 13
Garden City, NY 11530-0701 14
Phone: (401) 865-0698 15
17
David M. Rand 18
Running title: TOR and mitochondrial metabolism 20
21
Jour
nal o
f Cel
l Sci
ence
Acc
epte
d m
anus
crip
t
JCS Advance Online Article. Posted on 7 March 2014
2
Summary 22
Down-regulation of the mTOR pathway by its inhibitor rapamycin is emerging as a 23
potential pharmacological intervention that mimics the beneficial effects of dietary 24
restriction. Modulation of mTOR has diverse effects on mitochondrial metabolism and 25
biogenesis, but the role of mitochondrial genotype in mediating these effects remains 26
unknown. Here we use novel mitochondrial genome replacement strains in Drosophila to 27
test the hypothesis that genes encoded in mtDNA influence the mTOR pathway. We 28
show that rapamycin increases mitochondrial respiration and succinate dehydrogenase 29
activity, decreases H2O2 production and generates distinct shifts in the metabolite profiles 30
of isolated mitochondria versus whole Drosophila. These effects are disabled when 31
divergent mitochondrial genomes from D. simulans are placed into a common nuclear 32
background, demonstrating that the benefits of rapamycin to mitochondrial metabolism 33
depend on genes encoded in the mtDNA. Rapamycin is able to enhance mitochondrial 34
respiration when succinate dehydrogenase activity is blocked, suggesting that the 35
beneficial effects of rapamycin on these two processes are independent. Overall, this 36
study provides the first evidence for a link between mitochondrial genotype and the 37
effects of rapamycin on mitochondrial metabolic pathways. 38
Keywords: Rapamycin, metabolism, mitochondrial genotype 39
40
Jour
nal o
f Cel
l Sci
ence
Acc
epte
d m
anus
crip
t
3
Introduction 41
Mitochondria are specialized organelles that convert metabolic substrates into adenosine 42
triphosphate (ATP), the energy currency of cells, via the process of oxidative 43
phosphorylation (OXPHOS). During OXPHOS, NADH and FADH2, which are derived 44
from the mitochondrial tricarboxylic acid (TCA) cycle and fatty-acid oxidation, pass 45
electrons to complex I (NADH dehydrogenase) and complex II (succinate 46
dehydrogenase) of the electron transport chain (ETC) respectively. Electrons are then 47
transferred through complex III (cytochrome bc1) to complex IV (cytochrome c oxidase), 48
where they are passed to oxygen and produce water (Scheffler, 2007).This process 49
generates a proton gradient and establishes a membrane potential (∆ψm) across the inner-50
mitochondrial membrane. Ultimately, the proton gradient is dissipated either at complex 51
V, producing ATP, or through uncoupling proteins producing heat (Scheffler, 2007). 52
Reactive oxygen species (ROS) are generated during electron transport as a by-product of 53
OXPHOS. Levels of ROS are tightly regulated as ROS serve as a secondary messenger to 54
mediate signal transduction and metabolism (Cheng and Ristow, 2013), while excess 55
ROS can damage DNA, lipids and proteins (Balaban et al., 2005; Murphy et al., 2011) . 56
In addition to ATP production, mitochondria play critical roles in amino acid metabolism, 57
carbohydrates metabolism and fatty acid oxidation. 58
59
Although mitochondria contain their own genome and function as distinct organelles 60
separated by lipid membranes, mitochondrial processes are critically dependent on 61
nuclear-encoded gene products and environmental signals in order to accommodate 62
metabolic cellular requirements (Finley and Haigis, 2009; Liu and Butow, 63
Jour
nal o
f Cel
l Sci
ence
Acc
epte
d m
anus
crip
t
4
2006;Woodson and Chory, 2008). These interactions require continuous communication 64
between mitochondria and the cytosol (Woodson and Chory, 2008). A critical link 65
between cytosolic and mitochondrial metabolism is the enzyme succinate dehydrogenase 66
(complex II of the ETC). Succinate dehydrogenase is the only enzyme shared by the TCA 67
cycle and ETC and lies at the intersection of pathways that connect cell metabolism with 68
mitochondrial respiration (Scheffler, 2007). In the ETC, succinate dehydrogenase acts as 69
an entry point for electrons from FADH2 via fatty-acid oxidation; in the TCA cycle it 70
oxidizes succinate to fumarate. Notably it is the only complex of the ETC with no 71
mtDNA-encoded subunits. 72
73
A pathway that has been identified as a potential mediator of cross-talk between 74
mitochondria and the cytosol is the mammalian target of rapamycin (mTOR) (Finley and 75
Haigis, 2009; Schieke and Finkel, 2006). The mTOR pathway is highly conserved and 76
regulates diverse functions related to nutritional cues and cellular stress (Baltzer et al., 77
2010; Finley and Haigis, 2009). In yeast, reduced TOR signaling enhances mitochondrial 78
respiration and modulates ROS production to extend chronological life span (Bonawitz et 79
al., 2007; Pan et al., 2012). In mammals, the role of the mTOR pathway in mitochondrial 80
function has tissue-specific effects (Bentzinger et al., 2008;Ramanathan and Schreiber, 81
2009;Cunningham et al., 2007;Paglin et al., 2005;Polak et al., 2008;Schieke et al., 82
2006;Düvel et al., 2010). The best characterized function of mTOR is the regulation of 83
translation initiation by mTOR Complex 1 (mTORC1). This involves mTORC1-mediated 84
phosphorylation of the eukaryotic initiation factor 4E-binding protein 1 (eIF4E-BP1) and 85
ribosomal protein S6 kinase 1 (S6K1) in order to up-regulate 5’-cap-dependent protein 86
Jour
nal o
f Cel
l Sci
ence
Acc
epte
d m
anus
crip
t
5
translation (Richter and Sonenberg, 2005). In addition to modulation of protein 87
translation, the mTOR pathway has also been implicated in cell growth, autophagy, 88
longevity and metabolism (Finley and Haigis, 2009; Laplante and Sabatini, 2012; 89
Soliman, 2011;Mathew and White, 2012), all key biological processes in health and 90
homeostasis. Indeed, dysregulation of mTOR signaling is a common condition in human 91
diseases (Dazert and Hall, 2011). 92
93
There is increasing interest in identifying the genetic and cellular mechanisms underlying 94
the connection between mTOR signaling and mitochondrial function. The majority of 95
genes that function in mitochondria are encoded by the nuclear genome, but a small and 96
critical fraction of genes have been retained in the mitochondrial genome since the 97
endosymbiotic origin of the eukaryotic cell roughly two billion years ago (Lane, 2005). 98
The majority of studies seeking to understand the role of the mTOR pathway in 99
mitochondrial function have focused on these nuclear-encoded proteins that are translated 100
on cytosolic ribosomes and imported in to the mitochondrion. The genes encoded in the 101
mitochondrial genome have received little attention in experimental work related to the 102
mechanisms of action in the mTOR pathway. 103
104
Here we test the hypothesis that the relationship between the mTOR pathway and 105
mitochondrial physiology is modified by genes encoded in alternative mitochondrial 106
genomes. To accomplish this we used strains of Drosophila in which different mtDNAs 107
from both D. melanogaster and D. simulans were placed on a single D. melanogaster 108
nuclear background (Montooth et al., 2010). We posit that this genetic manipulation will 109
Jour
nal o
f Cel
l Sci
ence
Acc
epte
d m
anus
crip
t
6
compromise the co-evolved nature of mito-nuclear cross talk and provide a novel 110
hypomorphic context for analyses of how rapamycin influences mTOR functions. We 111
show that treatment with rapamycin, a specific mTORC1 inhibitor, increases 112
mitochondrial oxidative capacity and respiration rate, as well as decreases the production 113
of mitochondrial H2O2, one of the ROS produced in the mitochondria. This effect was 114
pronounced in D. melanogaster genotypes carrying the native D. melanogaster mtDNAs, 115
but these beneficial effects of rapamycin were significantly reduced in the strains 116
carrying the ‘foreign’ D. simulans mitochondrial genotypes on the D. melanogaster 117
nuclear background. Using comparative metabolomics analyses we show that whole fly 118
homogenates have a strong signature of response to rapamycin with only subtle effects of 119
mtDNA genotypes. In contrast, metabolite profiles of isolated mitochondria show strong 120
mtDNA-genotype-dependent responses to rapamycin. The coevolved genotypes carrying 121
the D. melanogaster mtDNAs show clear reprogramming of their carbohydrate and 122
amino acid profiles under rapamycin treatment, but the foreign D. simulans mtDNAs 123
shift these metabolite levels such that rapamycin has little additional effect. We further 124
show that rapamycin treatment specifically affects the ETC at the level of complex II 125
activity, and does so only for the D. melanogaster mtDNA genotypes. Overall, our 126
experiments confirm that rapamycin has multiple beneficial effects on mitochondrial 127
function, and show for the first time that the full effects of these benefits are dependent 128
on the metabolic plasticity mediated by genes encoded in the mtDNA. 129
130
Results 131
132
Jour
nal o
f Cel
l Sci
ence
Acc
epte
d m
anus
crip
t

7
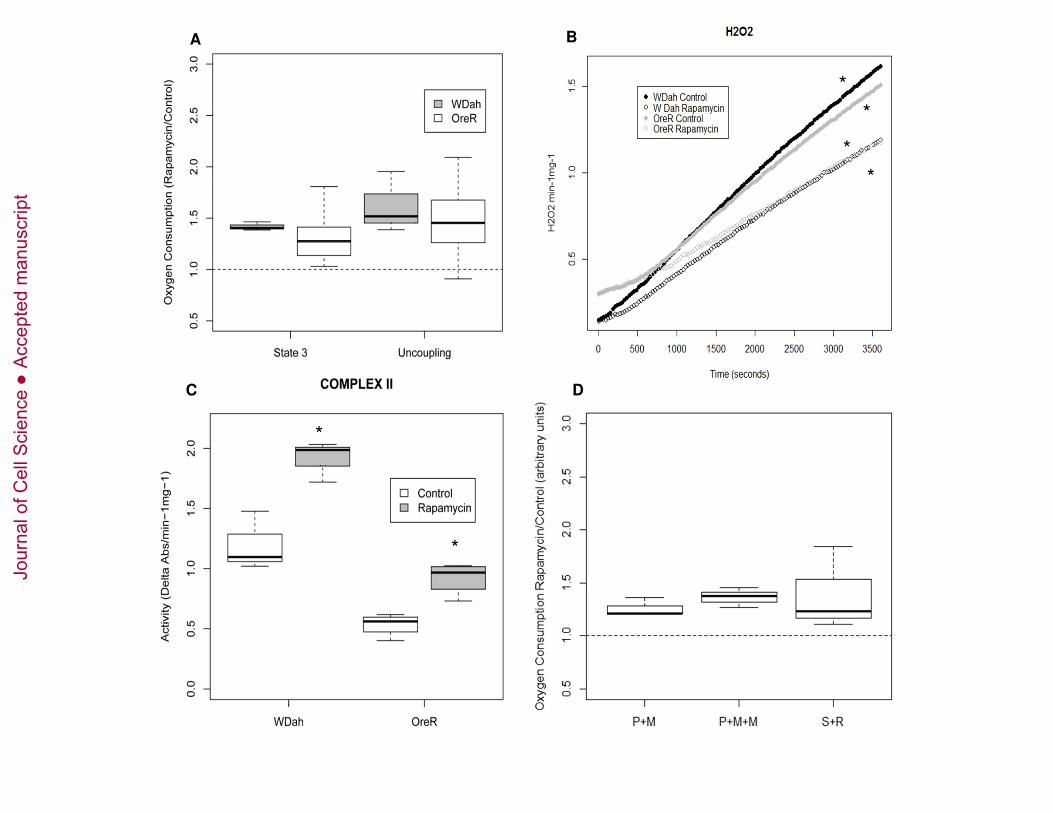
Rapamycin increases mitochondrial respiration and decreases H2O2production 133
To determine the effect of rapamycin on mitochondrial function, we measured OXPHOS 134
capacity of mitochondria isolated from two standard laboratory D. melanogaster 135
strains:(i) white Dahomey (wDah), and (ii) Oregon R (OreR). Flies were fed food 136
containing 200uM rapamycin, a concentration shown to inhibit the phosphorylation of 137
TOR target S6K at T-398, and to affect protein translation (Figure S1, (Bjedov et al., 138
2010)). We observed that after ADP stimulation (state 3 respiration), mitochondria from 139
flies treated with rapamycin have a higher rate of oxygen consumption than from vehicle-140
treated flies (Figure 1A), suggesting that rapamycin increases mitochondrial oxidative 141
capacity. Uncoupled mitochondrial respiration rates were measured after the addition of 142
the chemical uncoupler, FCCP. Flies treated with rapamycin display increased 143
uncoupling, indicative of a higher maximum oxidative capacity (Figure 1A). We 144
observed that the absolute values for oxygen consumption could vary significantly from 145
one day to the next, but the relative values of rapa-treated vs. control showed consistent 146
differences in oxygen consumption rates, hence we report ratios to show the rapamycin 147
effect. 148
As mitochondrial respiration is the main source of ROS in cells, we measured H2O2 in 149
rapamycin treated flies. In both strains, rapamycin decreases the production of H2O2 150
(Figure 1B). 151
152
Effects of rapamycin on ETC complexes and mitochondrial membrane potential 153
The protein complexes I, III, IV and V of the ETC are jointly encoded by nuclear and 154
mitochondrial genes and work together in the process of OXPHOS. In order to test if the 155
Jour
nal o
f Cel
l Sci
ence
Acc
epte
d m
anus
crip
t
8
effect of rapamycin on mitochondrial oxygen consumption is due to an effect in one or 156
more of the ETC complexes, we studied the in vitro activity of the respiratory chain 157
enzyme complexes (complex I, complex II, complex III, and complex IV) (Figure 1C and 158
Figure S2A-C) and the enzymatic activity of citrate synthase as a marker of 159
mitochondrial content and integrity (Figure S2D). Rapamycin-fed flies show increased 160
complex II enzymatic activity (Figure 1C). No effect was observed in any of the other 161
enzyme complexes (Figure S2A-C). Interestingly, complex II is the only complex of the 162
ETC that is solely encoded by nuclear genes, and is an integrator of nutrient catabolism 163
between glycolytic and respiratory pathways that contribute different reducing 164
equivalents (NADH vs. FADH)(Scheffler, 2007). As an indicator of hydrogen ion 165
pumping across the inner membrane during the process of electron transport and 166
oxidative phosphorylation, we measured changes in membrane potential, ∆ψm. 167
Rapamycin has no significant effect on mitochondrial ∆ψm (Figure S2E). 168
Rapamycin effects on respiration are independent of increased Complex II 169
activity 170
We then tested the hypothesis that the effect of rapamycin on mitochondrial respiration is 171
mediated by the increased activity of complex II. We measured mitochondrial complex I 172
- and complex II-dependent oxygen consumption in flies treated with rapamycin. Oxygen 173
consumption was quantified with substrates and inhibitors that permit complex I 174
respiration but block complex II: with pyruvate and malate alone vs. pyruvate and malate 175
plus malonate (a competitive inhibitor of complex II activity). The reciprocal experiment 176
was also performed in which oxygen consumption was studied with the complex II 177
substrate succinate, plus rotenone as an inhibitor of complex I. Rapamycin increases 178
Jour
nal o
f Cel
l Sci
ence
Acc
epte
d m
anus
crip
t
9
oxygen consumption of both complex I- and complex II-mediated respiration in the 179
presence of inhibitors of either complex (Figure 1D). 180
181
Divergent mitochondrial genotypes on a common nuclear background respond 182
differently to rapamycin treatment. 183
To test the hypothesis that the effects of rapamycin are dependent on genes encoded in 184
the mtDNA, four distinct mtDNAs from different strains of D. melanogaster (OreR and 185
Zim53) and D. simulans (sm21 and si1) were introgressed onto a single D. melanogaster 186
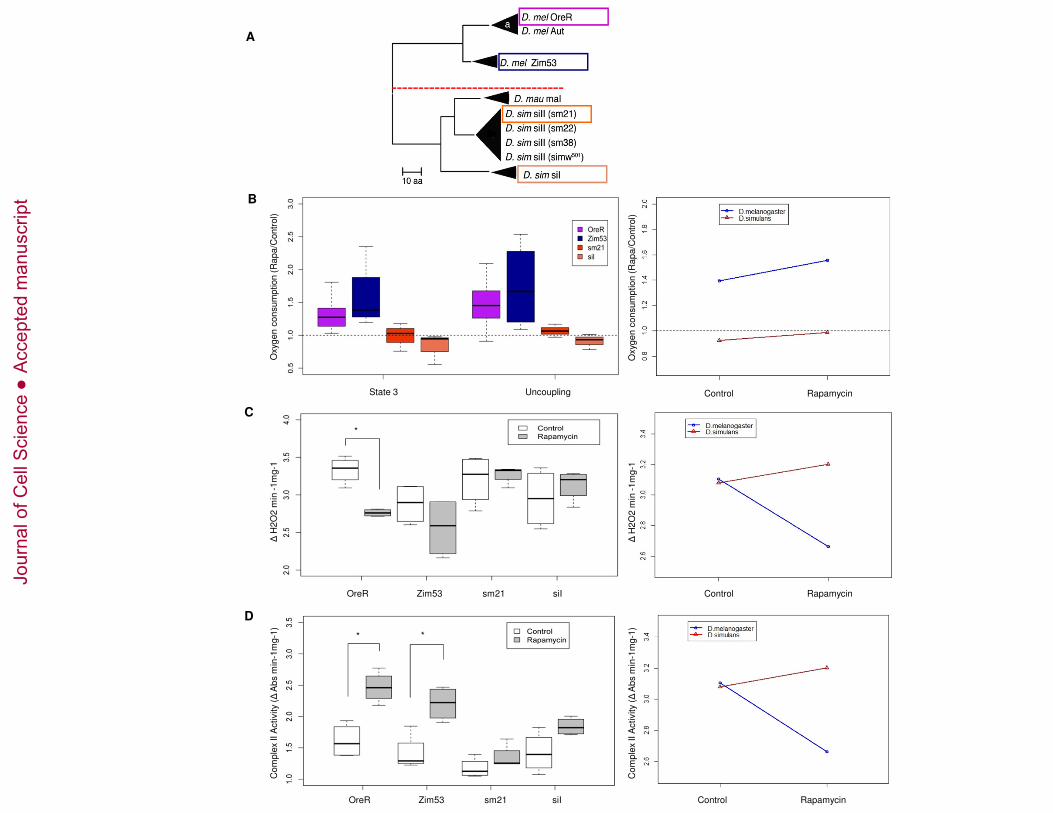
nuclear background, Oregon R (OreR) (Figure 2A). 187
Offspring from crosses between D. simulans and D. melanogaster are sterile. However, a 188
rescue of this sterility can be obtained when females from the D. simulans C167.4 strain 189
are crossed to D. melanogaster males (Davis et al. 1996). To transfer mtDNA from D. 190
simulans to D. melanogaster, sm21 and si1 females were backcross for several 191
generations to D. simulans C167.4 males. Subsequently, females from these 192
backcrosses were crossed to D. melanogaster males to obtain the mtDNA replacement 193
strains (Montooth et al., 2010). A series of backcrosses using balancer chromosome 194
stocks and the OreR strain of D. melanogaster replaced all D. simulans nuclear alleles 195
with OreR nuclear alleles in each of the desired cytoplasmic (mtDNA) backgrounds 196
(Montooth et al., 2010). 197
Since all mtDNAs were placed on the same OreR nuclear background, differences among 198
the introgressed genotypes could only result from main effects of the distinct mtDNAs or 199
specific interactions of the OreR nuclear background with the different mtDNAs. We 200
observed that rapamycin significantly affects mitochondrial respiration (Figure 2B), H2O2 201
Jour
nal o
f Cel
l Sci
ence
Acc
epte
d m
anus
crip
t
10
production (Figure 2C), and complex II activity (Figure 2D) in flies harboring mtDNA 202
from D. melanogaster (OreR and Zim53) but this rapamycin effect was significantly 203
reduced in flies carrying D. simulans mtDNA (sm21 and si1). 204
205
Rapamycin and mitochondrial genotype alter metabolite profiles of whole flies 206
and isolated mitochondria. 207
We performed comparative metabolomics analyses of rapamycin on a subset of our 208
strains, the “responding” (OreR) and “non-responding” (sm21) mitochondrial genotypes 209
both on the common OreR nuclear background after treatment with rapamycin. 210
Metabolites from whole fly extracts and from mitochondrial extracts were obtained by 211
using gas chromatography mass spectrometry (GC/MS) and liquid chromatography-212
tandem mass spectrometry (LC/MS/MS). We detected 210 metabolites in the whole fly 213
extracts and 230 metabolites in the mitochondrial extracts. These metabolites were 214
separated into 4 categories, those involved in amino-acid metabolism, carbohydrate 215
metabolism, lipid metabolism and those involved in energy homeostasis (cofactors, 216
vitamins and Krebs cycle intermediates) (Figure 3-5, and Table S1). The data were 217
subjected to a principle components analysis (PCA) to visualize the clustering of 218
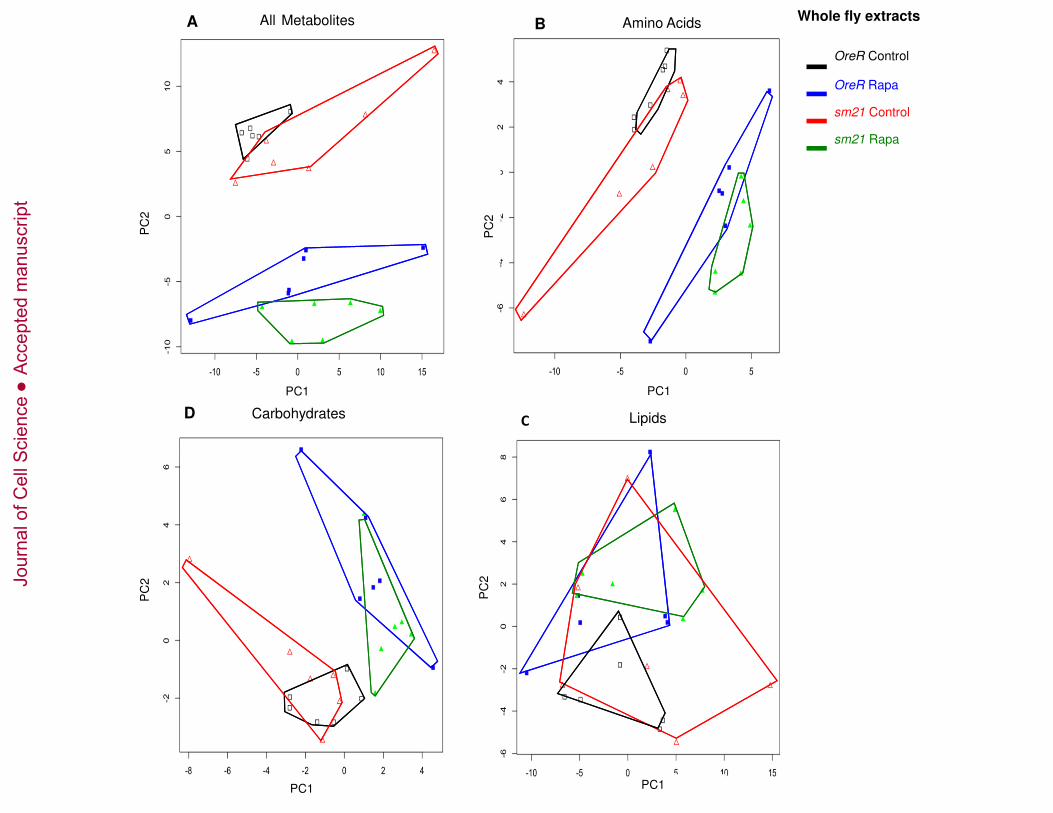
treatments in metabolite space. For the whole fly extracts, mtDNA genotype has subtle 219
effects on the metabolite profile as revealed by the proximity of the OreR control treated 220
and the sm21 control treated samples in PCA space (Figures 3A and 5A, open symbols). 221
However rapamycin treatment has a significant impact of the metabolite profiles as is 222
evident from the displacement of the rapamycin treated samples to lower values of PC2 223
(Figures 3A and 5A, solid symbols). Bivariate normal ellipses defining a 95% 224
Jour
nal o
f Cel
l Sci
ence
Acc
epte
d m
anus
crip
t
11
confidence area for the rapamycin-treated samples for each genotype do not overlap, but 225
the ellipses from the two mtDNA genotype samples in either the control or the rapamycin 226
treatment are broadly overlapping (Figure S3A). The predominance of the rapamycin 227
effect, and weak genotype effect, is evident in the similar relative positions of the sample 228
envelopes for genotypes in amino acid and the carbohydrate PCA plots, which mirror the 229
patterns seen for all metabolites (Figure 3B-C, Figure S3C). The Lipid analysis shows 230
little differentiation of the samples (Figure 3C) and the 95% ellipses are broadly 231
overlapping for lipid metabolites indicating no significant differentiation (data not 232
shown). 233
234
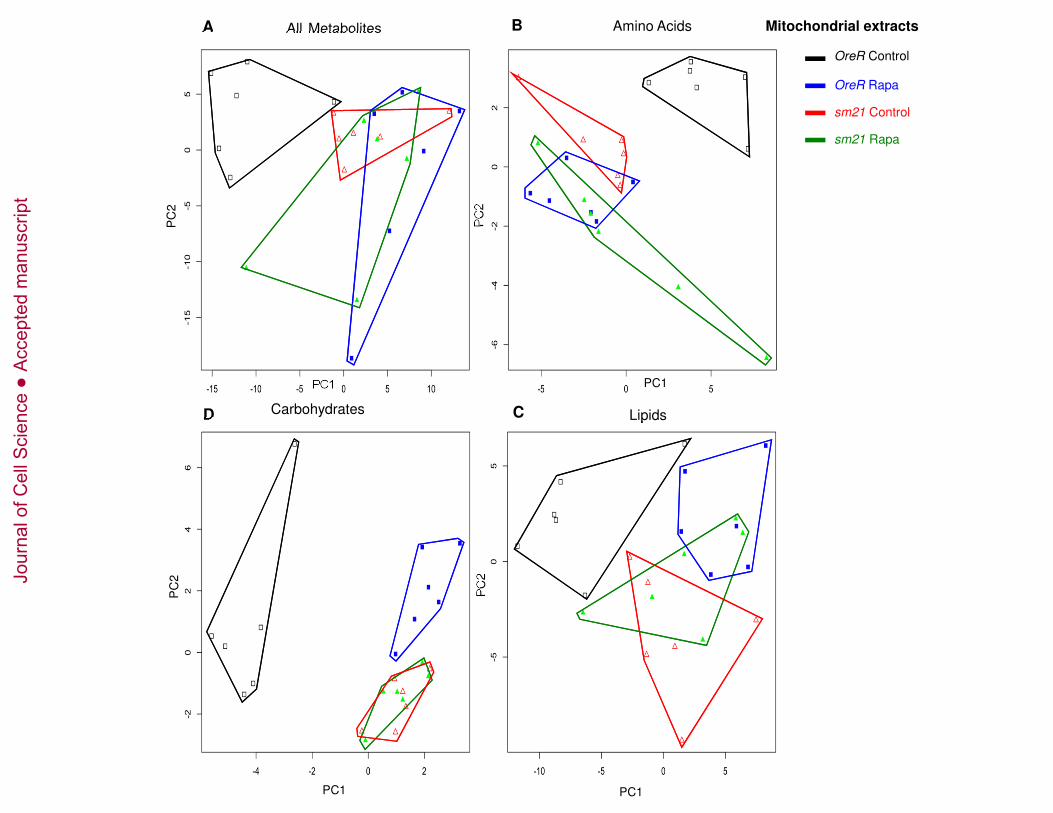
The metabolite profiles from mitochondrial isolates analyses are distinct from those of 235
whole fly extracts and identify a genotype-by-rapamycin interaction effect (Figures 4 and 236
5B). Rapamycin has a strong effect on the metabolite profiles of the responsive mtDNA 237
genotypes (OreR). The OreR rapamycin treated samples are displaced along the PC1 238
axis (Figures 4A and 5B). Bivariate normal ellipses defining a 95% confidence area 239
surrounding the OreR control treated samples do not overlap with other treatment classes 240
(Figure S3B). For the ‘”non-responding” sm21 mtDNA genotype, rapamycin has 241
noticeably less of an effect on the shift of the metabolite landscapes (Figures 4A and 5B). 242
The 95% confidence ellipses for control and rapamycin treated samples are broadly 243
overlapping for this genotype (Figure S3B). This pattern is most evident in the PCA plots 244
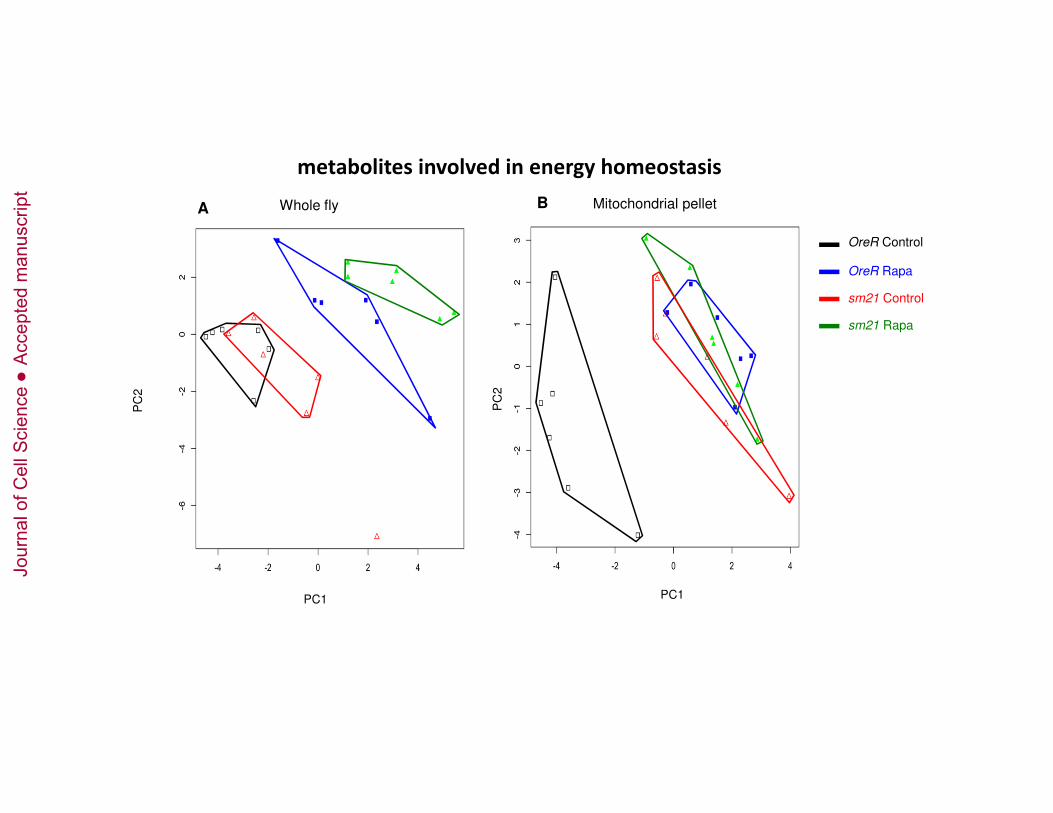
based on amino acids (Figure 4B), carbohydrates (Figure 4C, Figure S3D) and 245
metabolites involved in energy homeostasis (cofactors, vitamins and krebs cycle 246
intermediates) (Figure 5B) where rapamycin induces a substantial shift in OreR, but has 247
Jour
nal o
f Cel
l Sci
ence
Acc
epte
d m
anus
crip
t
12
virtually no impact on the sm21 genotypes. This pattern is similar but not as pronounced 248
in the lipid analysis (Figure 4D). 249
250
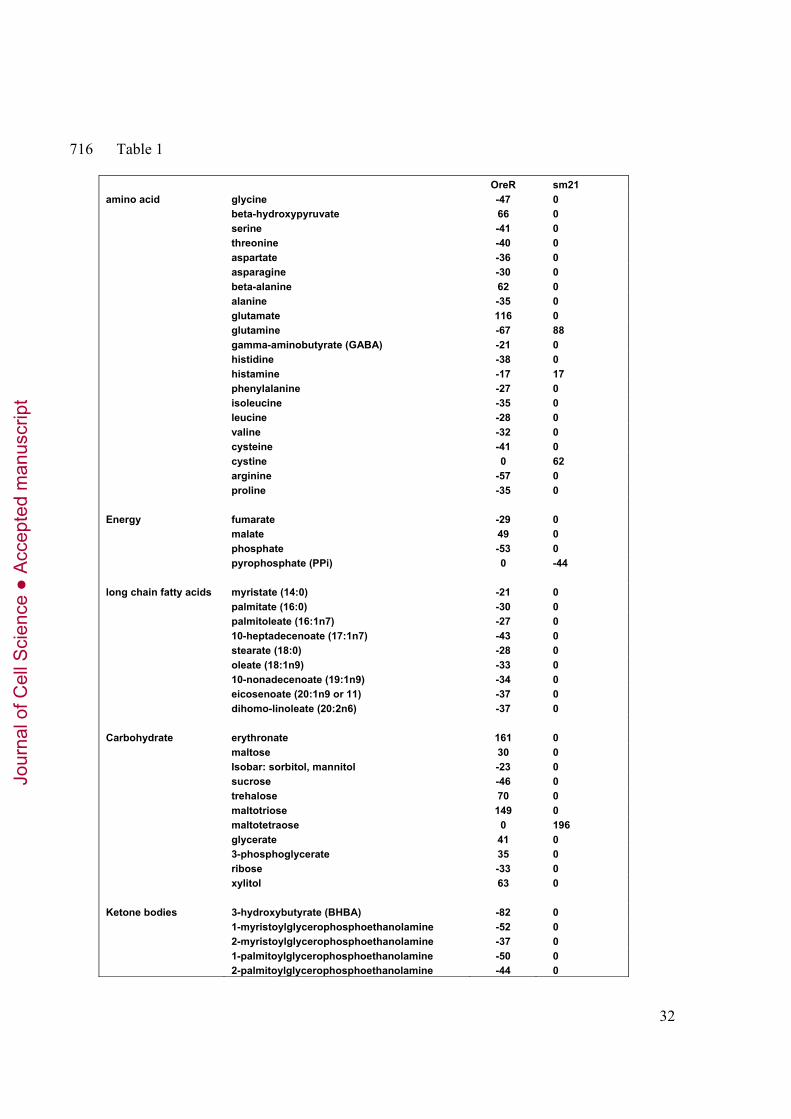
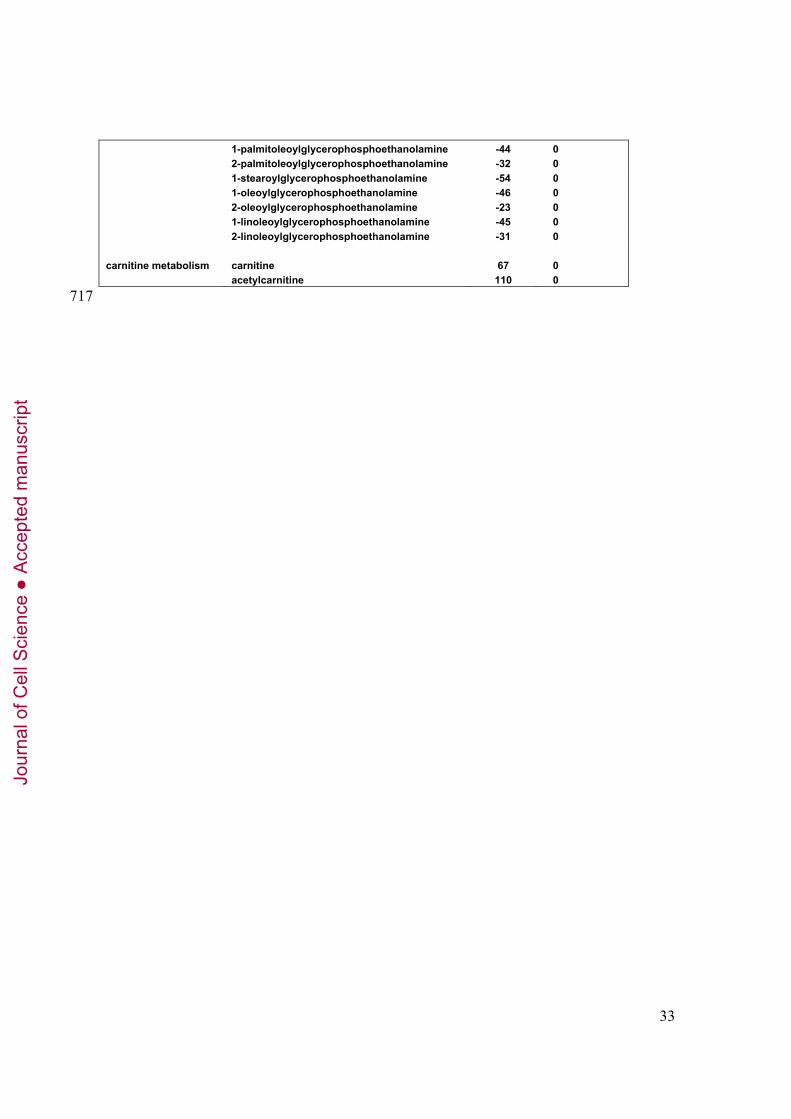
Analysis of individual metabolites that are differentially affected in OreR and 251
sm21 flies after rapamycin treatment reflects an imbalance of several mitochondrial 252
pathways. The TCA metabolite fumarate is decreased while malate is increased in OreR 253
flies after rapamycin treatment (Table 1). Rapamycin-treated OreR mitochondria showed 254
significantly lower levels of fatty acids, reduced hydroxybutyrate (BHBA) and other 255
ketone bodies, and increased carnitine levels. Because the oxidation of exogenous fatty 256
acids is enhanced by rapamycin treatment (Brown et al., 2007), we hypothesized that this 257
imbalance in lipid metabolism may partially result from a decline in β-oxidation as a 258
consequence of the depletion of available endogenous lipids by this time point under 259
rapamycin treatment. Notably, basal levels of BHBA and other ketone bodies 260
significantly differed between OreR and sm21 flies, suggesting differences in basal lipid 261
oxidation between haplotypes (not shown). 262
Within the amino acids, beta-hydroxypyruvate, beta-alanine and glutamate levels 263
increased after rapamycin treatment in OreR but not sm21. The rest of amino acids that 264
changed, including glutamine which has been recently shown to be regulated by mTOR 265
(Csibi et al., 2013), were down regulated in OreR mitochondria. In sm21 mitochondria, 266
rapamycin increased the levels of glutamine, histamine and cystine. (Table 1). 267
268
Discussion 269
Jour
nal o
f Cel
l Sci
ence
Acc
epte
d m
anus
crip
t

13
Mito-nuclear interactions are the resutl of a two billion year old symbiosis between two 270
genomes with a history of gene transfer from the ancestral mitochondrial genome into the 271
emerging nuclear genome, and a system to import proteins back into the mitochondrial 272
organelle (Rand et al., 2004; Ballard and Rand, 2005; Pesole et al., 2012). As an outcome 273
of this coadaptation the mitochondria and cytosol have established circuits of signaling 274
that ensure homeostasis via cellular plasticity in response to altered environmental 275
conditions. Cytosolic pathways signal to modulate mitochondrial activity (anterograde 276
signaling) and mitochondria signal to the cytosol to alert of changes in mitochondrial 277
metabolism (retrograde signaling) (Liu and Butow, 2006; Woodson and Chory, 2008). 278
Therefore, It is not surprising, that mitochondrial dysfunction is associated with the onset 279
of many diseases (Ristow, 2006; Wiederkehr and Wollheim, 2006; Fukui and Moraes, 280
2008;Tatsuta and Langer, 2008) and may have an important role in the aging process 281
(Masoro et al., 1982; Tatsuta and Langer, 2008; Finley and Haigis, 2009; Raffaello and 282
Rizzuto, 2011; Vendelbo and Nair, 2011). However, there is controversy over the 283
mechanisms by which mitochondrial activity may modulate longevity. Traditionally 284
ROS production in the mitochondria has been postulated as a cause of aging (Harman, 285
1956) and manipulations that either increase ROS scavenging or decrease ROS 286
production have extended longevity. Yet, recent studies have challenged the role of ROS 287
as only detrimental in aging, given evidence that ROS is also an important factor 288
promoting longevity via signaling and homeostasis (Ristow and Schmeisser, 2011). 289
290
291
Jour
nal o
f Cel
l Sci
ence
Acc
epte
d m
anus
crip
t
14
In this study we identify complex II as the only member of the ETC that displays altered 292
activity upon rapamycin treatment. The significant effect on complex II and lack of 293
effects on other complexes points to the interaction of mitochondrial and metabolic 294
energy transduction as an important aspect of mTOR signaling. Participating in both the 295
TCA and ETC, complex II is uniquely situated to coordinate both pathways. 296
Furthermore, complex II is stimulated by FADH2, which is mainly derived from fatty-297
acid oxidation. mTOR metabolism has been previously described to be connected to lipid 298
metabolism regulation (Laplante and Sabatini, 2012; Soliman, 2011). Moreover, levels of 299
ketone bodies, carnitine metabolism and free fatty acids significantly differed between 300
OreR and sm21 rapamycin treated flies suggesting lipid oxidation as an important 301
metabolic pathway mediating rapamycin beneficial effects on mitochondrial physiology. 302
Dysfunction of complex II, as well as up-regulation of the mTOR pathway, is associated 303
with precocious aging and cancer (Brière et al., 2005; King et al., 2006; Ishii et al., 2007; 304
Zoncu et al., 2012). Thus, our data suggest that some of the anti-carcinogenic and anti-305
aging effects of rapamycin treatment (Sharp and Richardson, 2011) might be explained 306
by its effect on succinate dehydrogenase activity. 307
308
The relationship between complex II stimulation and mitochondrial respiration warrants 309
further study. Our results show that rapamycin treatment increases the oxygen 310
consumption of complex I and complex II mediated respiration, even though in vitro 311
complex I activity is not affected under treatment with rapamycin (Figure 1D). This 312
implies that the effects of rapamycin are mediated through the actions of other 313
mitochondrial encoded proteins, which agrees with the data obtained by the metabolomic 314
Jour
nal o
f Cel
l Sci
ence
Acc
epte
d m
anus
crip
t

15
profiling. Considering this, we hypothesize that metabolic shifts that lead to changes in 315
the pool of reducing equivalents NADH and FADH2 may underlie the effect of 316
rapamycin on the in vitro activity of complex II. To test this hypothesis, we measured the 317
NAD+/NADH ratio on mitochondrial isolates from the D.melanogaster (OreR) and D. 318
simulans (sm21) mtDNA haplotypes. Rapamycin decreases NAD+/NADH ratio only in 319
OreR mitochondria (Figure S2F). Since NADH is a free cofactor to complex I and is 320
added at non-limiting concentrations to the in vitro reaction, rapamycin would not affect 321
the in vitro activity of complex I. Unlike NADH, FADH2 is attached to complex II 322
through a covalent flavin linkage (Cecchini, 2003), and changes in FADH2 abundance 323
will affect both in vivo and in vitro complex II activity. 324
325
The beneficial effect of rapamycin is diminished in flies carrying D. simulans 326
mitochondrial genomes with ~100 amino acid substitutions among the 13 protein coding 327
subunits of OXPHOS complexes. The PCA analysis of metabolites extracted from 328
mitochondrial isolates of sm21 (D. simulans) mitochondrial genotypes showed that “non-329
responsive” mitochondria shifted the metabolite profile in a manner that did not permit 330
additional shifts from rapamycin treatment. However, the analysis of metabolites 331
extracted from whole flies showed a main effect of rapamycin treatment and parallel 332
metabolic shift of both the “responsive” and “non-responsive” genotypes. Overall our 333
data show that mitochondrial encoded genes are important for rapamycin benefits. These 334
genes are mediating the ability of the drug to reprogram mitochondrial metabolism and 335
increase mitochondrial efficiency. In this study, the enzyme activity and respiration 336
analyses were performed on mitochondria isolated from whole flies. It is possible that 337
Jour
nal o
f Cel
l Sci
ence
Acc
epte
d m
anus
crip
t
16
different tissues have distinct mitochondrial responses to rapamycin, but it is unlikely that 338
the effects we report here are due to artifacts of tissue-specific activities. For example, if 339
different tissues have opposing effects of rapamycin, this would reduce our ability to 340
uncover the effects we see using whole-fly mitochondrial isolation. If some tissues are 341
responsive and others are unresponsive, again, the signal from whole-fly extractions 342
would be reduced compared to mitochondrial assays from a single tissue. At a minimum, 343
the mtDNA-dependent abrogation of the rapamycin effects we have described must be 344
operating in the majority of cells in the fly since our assays capture the activity of 345
mitochondria in proportion to the biomass of cell types in a whole fly. Future studies 346
addressing the specific effects of rapamycin on different tissues will allow us to better 347
understand the benefits of this drug and identify key tissues that mediate haplotype 348
differential responses. 349
350
The results presented here have uncovered an effect of rapamycin treatment on the 351
homeostatic nature of metabolic networks with a systems-level response. We described 352
novel roles for mtDNA-encoded genes in the effects of rapamycin, and offer a new set of 353
genetic reagents to examine the complex interactions governing TOR and mitochondrial 354
signaling. We have uncovered a novel association between complex II stimulation, 355
mitochondrial respiration, and rapamycin treatment that is modified by genes encoded in 356
the mitochondrial genome. Our experiments established that the stimulation of 357
respiration by rapamycin is not functionally dependent on the enhanced complex II 358
activity, implying that rapamycin may act on these two processes independently or 359
indirectly through shifts in metabolic state. These alternatives remain important 360
Jour
nal o
f Cel
l Sci
ence
Acc
epte
d m
anus
crip
t
17
questions for future studies in this system. It would be fruitful to explore the variety of 361
epistatic interactions between pairs of nuclear and mtDNA genotypes that encode the 362
proteins mediating the mTOR and OXPHOS pathways. 363
364
Experimental Procedures 365
Fly stocks, husbandry The white Dahomey (wDah) strain is described in (Bjedov et al., 366
2010). Mitochondria-nuclear substitutions strains are described in (Montooth et al., 367
2010). All stocks were maintained and conducted under standard conditions (25 °C, 12 h 368
light:12 h dark) on normal media (11% sugar, 2% autolyzed yeast, 5.2% cornmeal, agar 369
0.79% w/v in water and 0.2% tegosept -methyl 4-hydroxybenzoate, from Sigma- St. 370
Louis, MO, USA). All stocks were density controlled in replicate vials using 48-hour 371
egg lays by 5 pairs of parents for two generations prior to collection of flies for 372
experimental assays. 373
Rapamycin treatment 374
Rapamycin was purchased from LC Laboratories (Woburn, MA, USA.). Rapamycin was 375
dissolved in ethanol and added to food at the final concentration of 200 µM, as described 376
in Bjedov et al., 2010. Newly eclosed adult flies were collected within 48 hours and 377
maintained in rapamycin treated or ethanol vehicle control food for 10 days. 378
Western immunoblotting 379
20 female flies per treatment were homogenized in homogenization buffer (1% Triton X-380
100, 10mM Tris Base, pH 7.6, 5mM EDTA, 50mM NaCl, 30mM Na pyrophosphate, 381
50mM Na Fluoride, 100uM orthovanadate, complete protease inhibitor cocktail -Roche, 382
Jour
nal o
f Cel
l Sci
ence
Acc
epte
d m
anus
crip
t
18
Basel, Switzerland). Following homogenization, samples were incubated on ice for 30 383
minutes and centrifuged at 16,000 g for 20 minutes. The supernatant was quantified for 384
protein abundance using the BCA Protein Assay Kit from Thermo Scientific (Rockford, 385
IL, USA.). 30 µg of total protein was loaded per lane. Proteins were separated on SDS–386
polyacrylamide gels, transferred to polyvinylidene difluoride membranes, and subjected 387
to immunoblotting. Antibodies to dS6K1 were a gift from Thomas Neufeld, phospho-388
S6K1 was purchased from Cell Signaling Technology (Danvers, MA, USA.). 389
Mitochondrial /cytosolic isolation and DNA quantification 390
30 female flies were gently homogenized in 1mL chilled isolation buffer (225 mM 391
mannitol, 75 mM sucrose, 10 mM MOPS, 1 mM EGTA, 0.5% fatty acid free BSA, pH 392
7.2) using a glass-teflon dounce homogenizer. The extracts were centrifuged at 300g for 393
5 minutes at 4°C. The obtained supernatant was then centrifuged at 6,000g for 10 minutes 394
at 4°C to enrich for mitochondria. The pellet was resuspended in 100 µL of respiration 395
buffer (225 mM mannitol, 75 mM sucrose, 10 mM KCl, 10 mM Tris-HCl, 5mM 396
KH2PO4, pH 7.2). The supernatant was the cytosolic fraction. Freshly prepared 397
mitochondrial isolates were used for respiration and ROS assays, or aliquoted and frozen 398
at -80°C for later enzymatic activity assays. Quantification of mitochondrial protein 399
obtained from the isolation was determined by Bradford Reagent (Sigma-Aldrich, St. 400
Louis, MO, USA) following the manufacture’s protocol. For DNA quantification, RNA 401
from the mitochondrial and cytosolic fractions was removed by RNase A treatment from 402
Quiagen (Valencia CA, USA), and the amount of DNA was determined 403
spectrophotometrically (NanoDrop ND-1000). 404
Jour
nal o
f Cel
l Sci
ence
Acc
epte
d m
anus
crip
t

19
35S-Methionine protein incorporations 405
Protein synthesis was measured as the incorporation of 35S-Methionine into protein. 20 406
female flies were treated with rapamycin for 10 days and maintained in 100uCi/ml 35S-407
Methionine plus rapamycin or vehicle control food. After 48 hours of incubation, flies 408
were sorted to separate mitochondrial and cytosolic fraction as described above. To 409
quantify proteins in mitochondria and cytosol isolates using the same method (BCA in 410
this case) a different isolation buffer that lacks BSA (210mM mannitol, 70mM sucrose, 411
5mM Hepes, 1mM EDTA, pH 7.35) was used to homogenized flies. Proteins were 412
precipitated in 10% trichloracetic acid (TCA) and the quantity of radiolabeled methionine 413
incorporated into protein was measured in both fractions using a Beckam LS 6500 multi 414
porpoise scintillation counter. 415
Mitochondrial respiration and H2O2measurement 416
Respiration rates were determined by oxygen consumption using a Clark-type electrode 417
and metabolic chamber (Hansatech Instruments, Norfolk, UK). 5µM of pyruvate plus 418
5µM malate, or 10µM succinate plus 0.5µM rotenone was added to an isolated 419
mitochondrial suspension in 1mL or respiration buffer held in the respiration chamber at 420
30°C. 125 nmol of ADP was added to generate state 3 respiration rates. Uncoupled 421
respiration rates, indicative of maximal rate of O2 consumption, were generated by the 422
addition of 0.5 nM of FCCP (Carbonyl cyanide 4-(trifluoro-methoxy) phenylhydrazone), 423
a chemical uncoupler. 424
Jour
nal o
f Cel
l Sci
ence
Acc
epte
d m
anus
crip
t
20
H2O2 production was measured using an Amplex Red/horseradish peroxidase assay from 425
Invitrogen, (Carlsbad, CA, USA.) following the manufacture’s protocol. 20 µM of 426
glycerol 3-phosphate or 5µM of pyruvate plus 5µM malate were used as substrate. 427
Qualitatively identical results were obtained with both substrates. 428
Enzymatic assay and membrane potential measurement and NAD+/NADH measurement 429
Enzymatic assays were modified from ((Barrientos, 2002) and are described in 430
(Meiklejohn et al., 2013). The specific activity of complex I was determined as the 431
rotenone sensitive rate following the oxidation of NADH at 340 nm with the coenxyme Q 432
analog Decylubiquinone as the electron acceptor (Reaction mixture containing 35 mM 433
NaH2PO4, 5 mM MgCl2, 2.5 mg/mL BSA, 2 mM KCN, 2 µg/mL Antimycin A, 100 µM 434
NADH, 100 µM Decylubiquione, [2 mM Rotenone to inhibit reaction]). The catalytic 435
activity of complex II was monitored by the reduction of DCPIP at 600 nm (Reaction 436
mixture containing 30 mM NaH2PO4, 100 µM EDTA, 2 mM KCN, 2 µg/mL Antimycin 437
A, 2 µg/mL Rotenone, 750 µM BSA, 10 mM Succinate, 100 µM DCPIP, 100 µM 438
Decylubiquinone [400mM Malonate to inhibit reaction]) . Complex III activity was 439
measured by monitoring the reduction of Cytochrome c at 550 nm (Reaction mixture 440
containing 35 mM NaH2PO4, 2.5 mg/mL BSA, 5 mM MgCl2, 2 mM KCN, 2 µg/mL 441
Rotenone, 50 µM Cytochrome c, 25 µM Decylubiquinol, [5 µg/mL Antimycin A to 442
inhibit reaction]). Potassium borohydride was used to reduce decylubiquione. Complex 443
IV activity was measured by determining the rate of oxidation of reduced cytochrome c at 444
550 nm (Reaction mixture containing 5 mM MgCl2, 2 µg/mL Rotenone, 2 µg/mL 445
Antimycin A, 1 mM DDM, 45 µM Cytochrome c [4 mM KCN to inhibit reaction]). 446
Jour
nal o
f Cel
l Sci
ence
Acc
epte
d m
anus
crip
t
21
Sodium dithionite was used to reduce cytochrome c. To measure citrate synthase activity, 447
the rate limiting reaction of citrate synthase was coupled to a chemical reaction in which 448
DTNB reacts with CoA-SH and the absorbance of the product is measured at 412 nm 449
(Reaction mixture containing 100 µM DTNB, 300 µM AcetylCoA, 100 mM TrisHCl, 450
300 µM Oxaloacetic Acid). 451
JC-1 indicator dye from AnaSpec (Fremont, CA, USA.) was used to measure membrane 452
potential in isolated mitochondria. 30 female flies were gently homogenized and the 453
mitochondria were extracted as described above. The mitochondrial pellet obtained was 454
resuspended in 300µL of respiration buffer. 3uL of a 1µg/uL solution of JC-1 dissolved 455
in DMSO was added to the suspension. Mitochondrial samples were incubated for 15 456
minutes at 37 degrees protected from light. Samples were centrifuged for an additional 2 457
minutes at 6000g and resuspended in 600uL of fresh respiration buffer. Fluorescence was 458
measured for red (excitation 550 nm, emission 600 nm) and green (excitation 485 nm, 459
535 nm) corresponding to the monomeric and aggregate forms of JC-1. 460
NAD+/NADH and NADH were measured Amplite TM Flourimetric NAD/NADH Ratio 461
assay kit (#15263) from AAT Bioquest (Sunnyvale, CA, USA). Mitochondria from 20 462
females were extracted as described above. Reaction was performed following the 463
manufacture’s protocol. 464
465
Metabolomic profiling 466
Metabolomic profiles of rapamycin treated flies were performed by a Metabolon 467
(Durham, NC) using Metabolon’s standard solvent extraction methods (proprietary 468
information). The extracted samples were split into equal parts for analysis on the 469
Jour
nal o
f Cel
l Sci
ence
Acc
epte
d m
anus
crip
t
22
GC/MS and LC/MS/MS platforms. A total of 6 replicates per sample were performed. 470
Technical replicate samples were created from a homogeneous pool containing a small 471
amount of all study samples. Values for each sample were corrected by Bradford protein 472
quantification. Each compound was then normalized by median value for each run-day 473
block (block normalization). Missing values were imputed with the observed minimum 474
for that particular compound. 475
Statistical Analysis 476
Comparisons between two treatments were performed using the unpaired t-test and linear 477
regression as noted in the figure legends. Analysis of variance was used in cases of 478
multiple comparisons. Differences were considered significant at p<0.05, p<0,025, 479
p<0.0125 as noted in the figure legends. Statistical analyses were performed using the R 480
statistical package unless otherwise specified. 481
482
Acknowledgments 483
We thank Thomas Neufeld for the total dS6K antibody, Jim Mossman and other members 484
of the Rand laboratory for advice and discussion. This work is supported by National 485
Institutes of Aging grant 5R01AG027849 and NIH-NIGMS grant R01GM067862 (to 486
D.M.R.) EVC conceived and designed experiments, performed the experiments, analyzed 487
the data and wrote the paper. MAH performed the experiments. DMR conceived 488
experiments, analyzed the data and wrote the paper. The authors declare no conflict of 489
Interest. 490
491
References 492
Jour
nal o
f Cel
l Sci
ence
Acc
epte
d m
anus
crip
t
23
Balaban, R. S., Nemoto, S. and Finkel, T. (2005). Mitochondria, oxidants, and aging. 493 Cell 120, 483–95. 494
Ballard, J. W. O. and Rand, D. M. (2005). the Population Biology of Mitochondrial 495 Dna and Its Phylogenetic Implications. Annu. Rev. Ecol. Evol. Syst. 36, 621–642. 496
Baltzer, C., Tiefenböck, S. K. and Frei, C. (2010). Mitochondria in response to 497 nutrients and nutrient-sensitive pathways. Mitochondrion 10, 589–97. 498
Barrientos, A. (2002). In vivo and in organello assessment of OXPHOS activities. 499 Methods 26, 307–16. 500
Bentzinger, C. F., Romanino, K., Cloëtta, D., Lin, S., Mascarenhas, J. B., Oliveri, F., 501 Xia, J., Casanova, E., Costa, C. F., Brink, M., et al. (2008). Skeletal muscle-502 specific ablation of raptor, but not of rictor, causes metabolic changes and results in 503 muscle dystrophy. Cell Metab. 8, 411–24. 504
Bjedov, I., Toivonen, J. M., Kerr, F., Slack, C., Jacobson, J., Foley, A. and 505 Partridge, L. (2010). Mechanisms of life span extension by rapamycin in the fruit 506 fly Drosophila melanogaster. Cell Metab. 11, 35–46. 507
Bonawitz, N. D., Chatenay-Lapointe, M., Pan, Y. and Shadel, G. S. (2007). Reduced 508 TOR signaling extends chronological life span via increased respiration and 509 upregulation of mitochondrial gene expression. Cell Metab. 5, 265–77. 510
Brière, J.-J., Favier, J., El Ghouzzi, V., Djouadi, F., Bénit, P., Gimenez, a-P. and 511 Rustin, P. (2005). Succinate dehydrogenase deficiency in human. Cell. Mol. Life 512 Sci. 62, 2317–24. 513
Brown, N. F., Stefanovic-Racic, M., Sipula, I. J. and Perdomo, G. (2007). The 514 mammalian target of rapamycin regulates lipid metabolism in primary cultures of rat 515 hepatocytes. Metabolism. 56, 1500–7. 516
Cecchini, G. (2003). Function and structure of complex II of the respiratory chain. Annu. 517 Rev. Biochem. 72, 77–109. 518
Cheng, Z. and Ristow, M. (2013). Mitochondria and metabolic homeostasis. Antioxid. 519 Redox Signal. 19, 240–2. 520
Csibi, A., Fendt, S.-M., Li, C., Poulogiannis, G., Choo, A. Y., Chapski, D. J., Jeong, 521 S. M., Dempsey, J. M., Parkhitko, A., Morrison, T., et al. (2013). The mTORC1 522 Pathway Stimulates Glutamine Metabolism and Cell Proliferation by Repressing 523 SIRT4. Cell 153, 840–54. 524
Jour
nal o
f Cel
l Sci
ence
Acc
epte
d m
anus
crip
t
24
Cunningham, J. T., Rodgers, J. T., Arlow, D. H., Vazquez, F., Mootha, V. K. and 525 Puigserver, P. (2007). mTOR controls mitochondrial oxidative function through a 526 YY1-PGC-1alpha transcriptional complex. Nature 450, 736–40. 527
Dazert, E. and Hall, M. N. (2011). mTOR signaling in disease. Curr. Opin. Cell Biol. 528 23, 744–55. 529
Düvel, K., Yecies, J. L., Menon, S., Raman, P., Lipovsky, A. I., Souza, A. L., 530 Triantafellow, E., Ma, Q., Gorski, R., Cleaver, S., et al. (2010). Activation of a 531 metabolic gene regulatory network downstream of mTOR complex 1. Mol. Cell 39, 532 171–83. 533
Finley, L. W. S. and Haigis, M. C. (2009). The coordination of nuclear and 534 mitochondrial communication during aging and calorie restriction. Ageing Res. Rev. 535 8, 173–88. 536
Fukui, H. and Moraes, C. T. (2008). The mitochondrial impairment, oxidative stress 537 and neurodegeneration connection: reality or just an attractive hypothesis? Trends 538 Neurosci. 31, 251–6. 539
Harman, D. (1956). Aging: a theory based on free radical and radiation chemistry. J. 540 Gerontol. 11, 298–300. 541
Ishii, N., Ishii, T. and Hartman, P. S. (2007). The role of the electron transport SDHC 542 gene on lifespan and cancer. Mitochondrion 7, 24–8. 543
King, a, Selak, M. a and Gottlieb, E. (2006). Succinate dehydrogenase and fumarate 544 hydratase: linking mitochondrial dysfunction and cancer. Oncogene 25, 4675–82. 545
Lane, N. (2005). Power, Sex, Suicide: Mitochondria and the Meaning of Life. Oxford 546 University Press, USA. 547
Laplante, M. and Sabatini, D. M. (2012). mTOR signaling in growth control and 548 disease. Cell 149, 274–93. 549
Liu, Z. and Butow, R. a (2006). Mitochondrial retrograde signaling. Annu. Rev. Genet. 550 40, 159–85. 551
Masoro, E. J., Yu, B. P. and Bertrand, H. a (1982). Action of food restriction in 552 delaying the aging process. Proc. Natl. Acad. Sci. U. S. A. 79, 4239–41. 553
Mathew, R. and White, E. (2012). Autophagy in Tumorigenesis and Energy 554 Metabolism: Friend by Day, Foe by Night. 21, 113–119. 555
Meiklejohn, C. D., Holmbeck, M. a, Siddiq, M. a, Abt, D. N., Rand, D. M. and 556 Montooth, K. L. (2013). An Incompatibility between a mitochondrial tRNA and its 557
Jour
nal o
f Cel
l Sci
ence
Acc
epte
d m
anus
crip
t

25
nuclear-encoded tRNA synthetase compromises development and fitness in 558 Drosophila. PLoS Genet. 9, e1003238. 559
Montooth, K. L., Meiklejohn, C. D., Abt, D. N. and Rand, D. M. (2010). 560 Mitochondrial-nuclear epistasis affects fitness within species but does not contribute 561 to fixed incompatibilities between species of Drosophila. Evolution 64, 3364–79. 562
Murphy, M. P., Holmgren, A., Larsson, N.-G., Halliwell, B., Chang, C. J., 563 Kalyanaraman, B., Rhee, S. G., Thornalley, P. J., Partridge, L., Gems, D., et al. 564 (2011). Unraveling the biological roles of reactive oxygen species. Cell Metab. 13, 565 361–6. 566
Paglin, S., Lee, N.-Y., Nakar, C., Fitzgerald, M., Plotkin, J., Deuel, B., Hackett, N., 567 McMahill, M., Sphicas, E., Lampen, N., et al. (2005). Rapamycin-sensitive 568 pathway regulates mitochondrial membrane potential, autophagy, and survival in 569 irradiated MCF-7 cells. Cancer Res. 65, 11061–70. 570
Pan, Y., Nishida, Y., Wang, M. and Verdin, E. (2012). Metabolic Regulation, 571 Mitochondria and the Life-Prolonging Effect of Rapamycin: A Mini-Review. 572 Gerontology 58, 524–530. 573
Pesole, G., Allen, J. F., Lane, N., Martin, W., Rand, D. M., Schatz, G. and Saccone, 574 C. (2012). The neglected genome. EMBO Rep. 13, 473–4. 575
Polak, P., Cybulski, N., Feige, J. N., Auwerx, J., Rüegg, M. a and Hall, M. N. (2008). 576 Adipose-specific knockout of raptor results in lean mice with enhanced 577 mitochondrial respiration. Cell Metab. 8, 399–410. 578
Raffaello, A. and Rizzuto, R. (2011). Mitochondrial longevity pathways. Biochim. 579 Biophys. Acta 1813, 260–8. 580
Ramanathan, A. and Schreiber, S. L. (2009). Direct control of mitochondrial function 581 by mTOR. Proc. Natl. Acad. Sci. U. S. A. 106, 22229–32. 582
Rand, D. M., Haney, R. a and Fry, A. J. (2004). Cytonuclear coevolution: the genomics 583 of cooperation. Trends Ecol. Evol. 19, 645–53. 584
Richter, J. D. and Sonenberg, N. (2005). Regulation of cap-dependent translation by 585 eIF4E inhibitory proteins. Nature 433, 477–80. 586
Ristow, M. (2006). Oxidative metabolism in cancer growth. Curr. Opin. Clin. Nutr. 587 Metab. Care 9, 339–45. 588
Ristow, M. and Schmeisser, S. (2011). Extending life span by increasing oxidative 589 stress. Free Radic. Biol. Med. 51, 327–36. 590
Jour
nal o
f Cel
l Sci
ence
Acc
epte
d m
anus
crip
t

26
Scheffler, I. E. (2007). Mitochondria (Scheffler, Mitochondria). Wiley-Liss. 591
Schieke, S. M. and Finkel, T. (2006). Mitochondrial signaling, TOR, and life span. Biol. 592 Chem. 387, 1357–61. 593
Schieke, S. M., Phillips, D., McCoy, J. P., Aponte, A. M., Shen, R.-F., Balaban, R. S. 594 and Finkel, T. (2006). The mammalian target of rapamycin (mTOR) pathway 595 regulates mitochondrial oxygen consumption and oxidative capacity. J. Biol. Chem. 596 281, 27643–52. 597
Sharp, Z. D. and Richardson, A. (2011). Aging and cancer: can mTOR inhibitors kill 598 two birds with one drug? Target. Oncol. 6, 41–51. 599
Soliman, G. a. (2011). The integral role of mTOR in lipid metabolism. Cell Cycle 10, 600 861–862. 601
Tatsuta, T. and Langer, T. (2008). Quality control of mitochondria: protection against 602 neurodegeneration and ageing. EMBO J. 27, 306–14. 603
Vendelbo, M. H. and Nair, K. S. (2011). Mitochondrial longevity pathways. Biochim. 604 Biophys. Acta 1813, 634–44. 605
Wiederkehr, A. and Wollheim, C. B. (2006). Minireview: implication of mitochondria 606 in insulin secretion and action. Endocrinology 147, 2643–9. 607
Woodson, J. D. and Chory, J. (2008). Coordination of gene expression between 608 organellar and nuclear genomes. Nat. Rev. Genet. 9, 383–95. 609
Zoncu, R., Efeyan, A. and Sabatini, D. M. (2012). mTOR: from growth signal 610 integration to cancer, diabetes and ageing. Nat. Rev. Mol. Cell Biol. 12, 21–35. 611
612
Figure legends 613
614
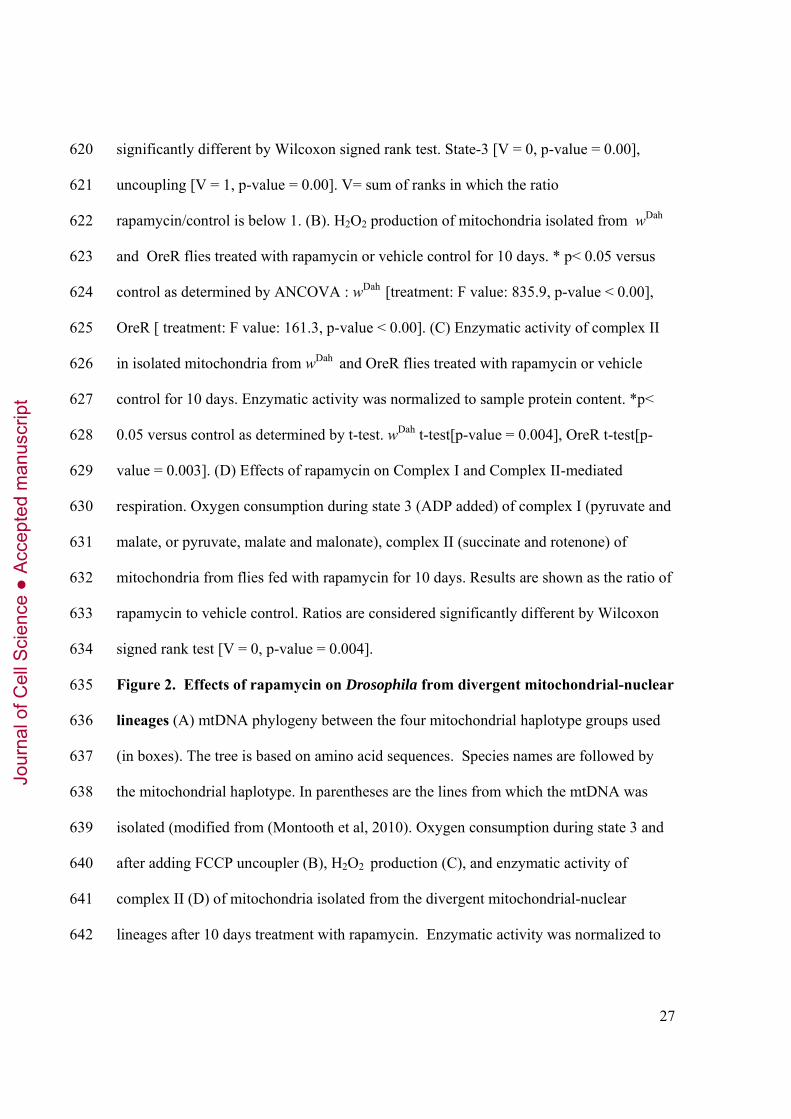
615
Figure 1. Effects of rapamycin on mitochondrial functions. (A) Oxygen consumption 616
during state 3 (ADP added) and after addition of FCCP uncoupler (uncoupling) in two D. 617
melanogaster laboratory strains (wDah and OreR) fed with rapamycin for 10 days. Results 618
are shown as the ratio of rapamycin to vehicle control treatment. Ratios are considered 619
Jour
nal o
f Cel
l Sci
ence
Acc
epte
d m
anus
crip
t
27
significantly different by Wilcoxon signed rank test. State-3 [V = 0, p-value = 0.00], 620
uncoupling [V = 1, p-value = 0.00]. V= sum of ranks in which the ratio 621
rapamycin/control is below 1. (B). H2O2 production of mitochondria isolated from wDah 622
and OreR flies treated with rapamycin or vehicle control for 10 days. * p< 0.05 versus 623
control as determined by ANCOVA : wDah [treatment: F value: 835.9, p-value < 0.00], 624
OreR [ treatment: F value: 161.3, p-value < 0.00]. (C) Enzymatic activity of complex II 625
in isolated mitochondria from wDah and OreR flies treated with rapamycin or vehicle 626
control for 10 days. Enzymatic activity was normalized to sample protein content. *p< 627
0.05 versus control as determined by t-test. wDah t-test[p-value = 0.004], OreR t-test[p-628
value = 0.003]. (D) Effects of rapamycin on Complex I and Complex II-mediated 629
respiration. Oxygen consumption during state 3 (ADP added) of complex I (pyruvate and 630
malate, or pyruvate, malate and malonate), complex II (succinate and rotenone) of 631
mitochondria from flies fed with rapamycin for 10 days. Results are shown as the ratio of 632
rapamycin to vehicle control. Ratios are considered significantly different by Wilcoxon 633
signed rank test [V = 0, p-value = 0.004]. 634
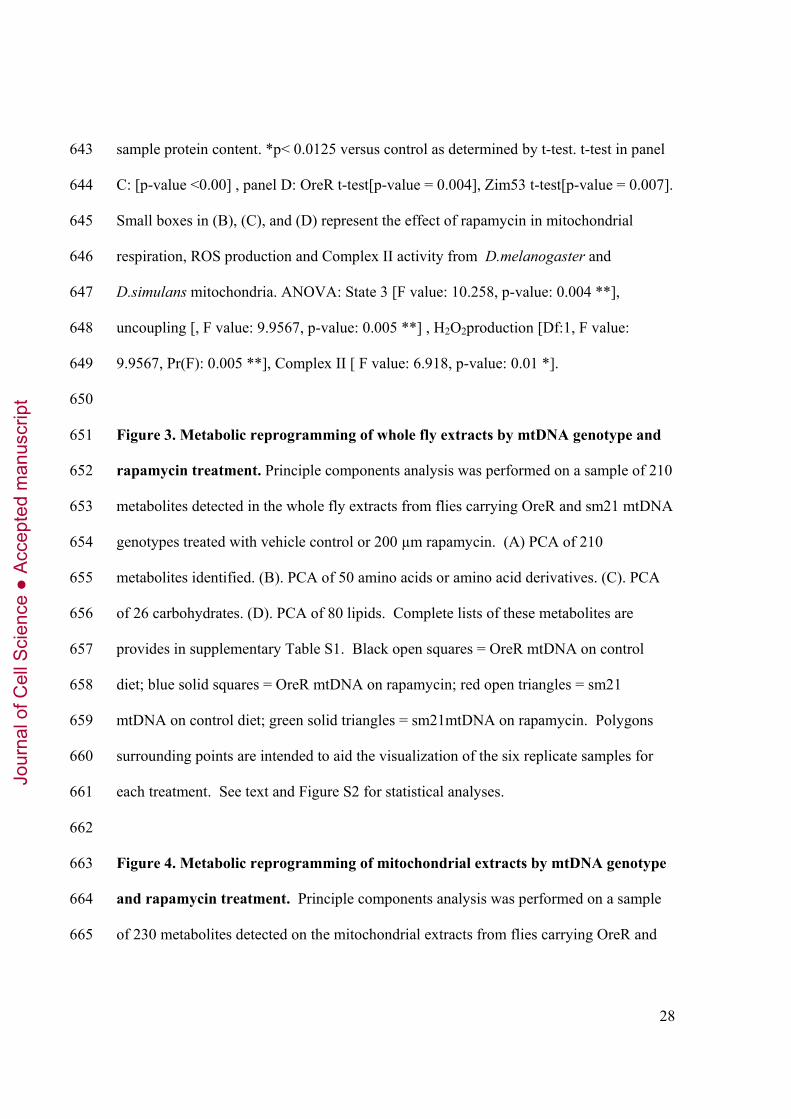
Figure 2. Effects of rapamycin on Drosophila from divergent mitochondrial-nuclear 635
lineages (A) mtDNA phylogeny between the four mitochondrial haplotype groups used 636
(in boxes). The tree is based on amino acid sequences. Species names are followed by 637
the mitochondrial haplotype. In parentheses are the lines from which the mtDNA was 638
isolated (modified from (Montooth et al, 2010). Oxygen consumption during state 3 and 639
after adding FCCP uncoupler (B), H2O2 production (C), and enzymatic activity of 640
complex II (D) of mitochondria isolated from the divergent mitochondrial-nuclear 641
lineages after 10 days treatment with rapamycin. Enzymatic activity was normalized to 642
Jour
nal o
f Cel
l Sci
ence
Acc
epte
d m
anus
crip
t
28
sample protein content. *p< 0.0125 versus control as determined by t-test. t-test in panel 643
C: [p-value <0.00] , panel D: OreR t-test[p-value = 0.004], Zim53 t-test[p-value = 0.007]. 644
Small boxes in (B), (C), and (D) represent the effect of rapamycin in mitochondrial 645
respiration, ROS production and Complex II activity from D.melanogaster and 646
D.simulans mitochondria. ANOVA: State 3 [F value: 10.258, p-value: 0.004 **], 647
uncoupling [, F value: 9.9567, p-value: 0.005 **] , H2O2production [Df:1, F value: 648
9.9567, Pr(F): 0.005 **], Complex II [ F value: 6.918, p-value: 0.01 *]. 649
650
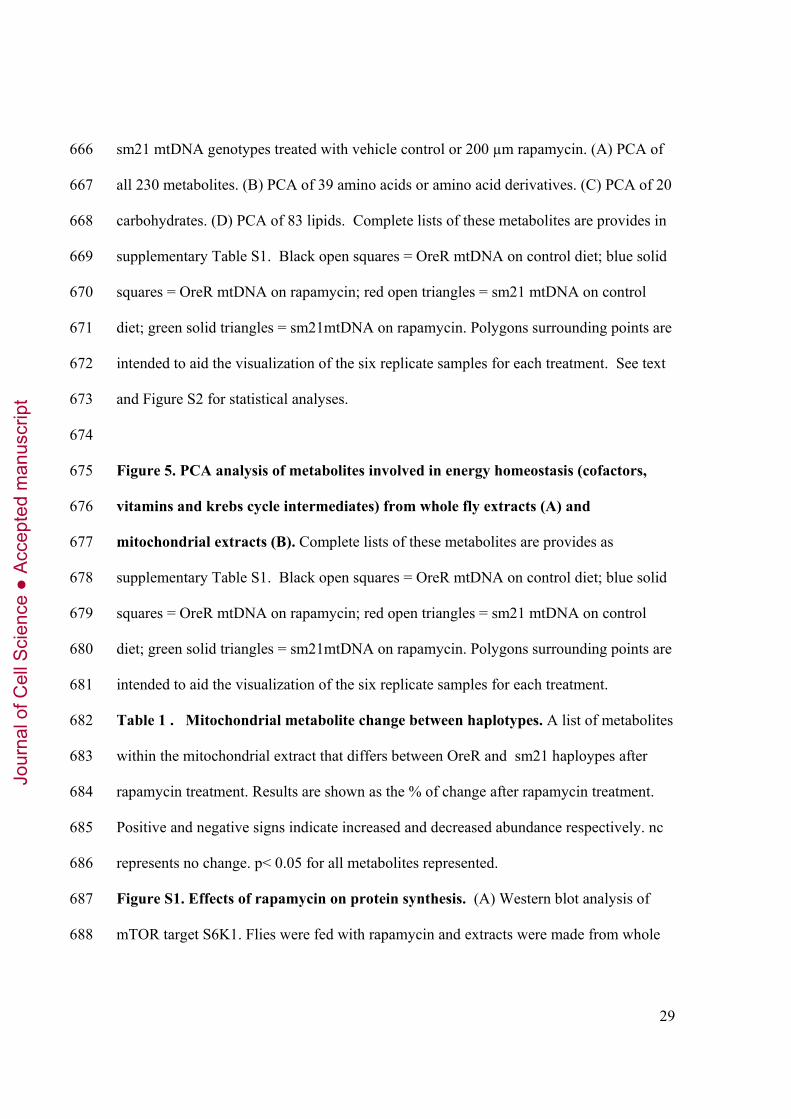
Figure 3. Metabolic reprogramming of whole fly extracts by mtDNA genotype and 651
rapamycin treatment. Principle components analysis was performed on a sample of 210 652
metabolites detected in the whole fly extracts from flies carrying OreR and sm21 mtDNA 653
genotypes treated with vehicle control or 200 µm rapamycin. (A) PCA of 210 654
metabolites identified. (B). PCA of 50 amino acids or amino acid derivatives. (C). PCA 655
of 26 carbohydrates. (D). PCA of 80 lipids. Complete lists of these metabolites are 656
provides in supplementary Table S1. Black open squares = OreR mtDNA on control 657
diet; blue solid squares = OreR mtDNA on rapamycin; red open triangles = sm21 658
mtDNA on control diet; green solid triangles = sm21mtDNA on rapamycin. Polygons 659
surrounding points are intended to aid the visualization of the six replicate samples for 660
each treatment. See text and Figure S2 for statistical analyses. 661
662
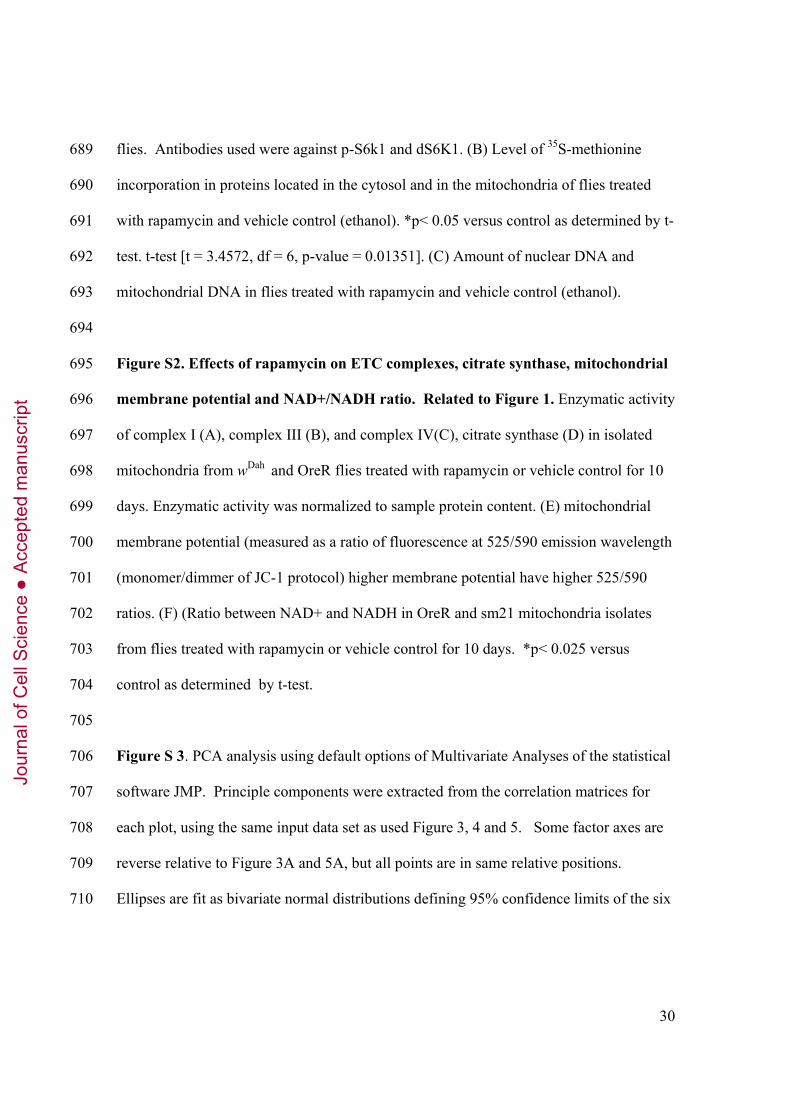
Figure 4. Metabolic reprogramming of mitochondrial extracts by mtDNA genotype 663
and rapamycin treatment. Principle components analysis was performed on a sample 664
of 230 metabolites detected on the mitochondrial extracts from flies carrying OreR and 665
Jour
nal o
f Cel
l Sci
ence
Acc
epte
d m
anus
crip
t
29
sm21 mtDNA genotypes treated with vehicle control or 200 µm rapamycin. (A) PCA of 666
all 230 metabolites. (B) PCA of 39 amino acids or amino acid derivatives. (C) PCA of 20 667
carbohydrates. (D) PCA of 83 lipids. Complete lists of these metabolites are provides in 668
supplementary Table S1. Black open squares = OreR mtDNA on control diet; blue solid 669
squares = OreR mtDNA on rapamycin; red open triangles = sm21 mtDNA on control 670
diet; green solid triangles = sm21mtDNA on rapamycin. Polygons surrounding points are 671
intended to aid the visualization of the six replicate samples for each treatment. See text 672
and Figure S2 for statistical analyses. 673
674
Figure 5. PCA analysis of metabolites involved in energy homeostasis (cofactors, 675
vitamins and krebs cycle intermediates) from whole fly extracts (A) and 676
mitochondrial extracts (B). Complete lists of these metabolites are provides as 677
supplementary Table S1. Black open squares = OreR mtDNA on control diet; blue solid 678
squares = OreR mtDNA on rapamycin; red open triangles = sm21 mtDNA on control 679
diet; green solid triangles = sm21mtDNA on rapamycin. Polygons surrounding points are 680
intended to aid the visualization of the six replicate samples for each treatment. 681
Table 1 . Mitochondrial metabolite change between haplotypes. A list of metabolites 682
within the mitochondrial extract that differs between OreR and sm21 haploypes after 683
rapamycin treatment. Results are shown as the % of change after rapamycin treatment. 684
Positive and negative signs indicate increased and decreased abundance respectively. nc 685
represents no change. p< 0.05 for all metabolites represented. 686
Figure S1. Effects of rapamycin on protein synthesis. (A) Western blot analysis of 687
mTOR target S6K1. Flies were fed with rapamycin and extracts were made from whole 688
Jour
nal o
f Cel
l Sci
ence
Acc
epte
d m
anus
crip
t
30
flies. Antibodies used were against p-S6k1 and dS6K1. (B) Level of 35S-methionine 689
incorporation in proteins located in the cytosol and in the mitochondria of flies treated 690
with rapamycin and vehicle control (ethanol). *p< 0.05 versus control as determined by t-691
test. t-test [t = 3.4572, df = 6, p-value = 0.01351]. (C) Amount of nuclear DNA and 692
mitochondrial DNA in flies treated with rapamycin and vehicle control (ethanol). 693
694
Figure S2. Effects of rapamycin on ETC complexes, citrate synthase, mitochondrial 695
membrane potential and NAD+/NADH ratio. Related to Figure 1. Enzymatic activity 696
of complex I (A), complex III (B), and complex IV(C), citrate synthase (D) in isolated 697
mitochondria from wDah and OreR flies treated with rapamycin or vehicle control for 10 698
days. Enzymatic activity was normalized to sample protein content. (E) mitochondrial 699
membrane potential (measured as a ratio of fluorescence at 525/590 emission wavelength 700
(monomer/dimmer of JC-1 protocol) higher membrane potential have higher 525/590 701
ratios. (F) (Ratio between NAD+ and NADH in OreR and sm21 mitochondria isolates 702
from flies treated with rapamycin or vehicle control for 10 days. *p< 0.025 versus 703
control as determined by t-test. 704
705
Figure S 3. PCA analysis using default options of Multivariate Analyses of the statistical 706
software JMP. Principle components were extracted from the correlation matrices for 707
each plot, using the same input data set as used Figure 3, 4 and 5. Some factor axes are 708
reverse relative to Figure 3A and 5A, but all points are in same relative positions. 709
Ellipses are fit as bivariate normal distributions defining 95% confidence limits of the six 710
Jour
nal o
f Cel
l Sci
ence
Acc
epte
d m
anus
crip
t
31
replicate samples for each genotype-rapamycin treatment. Non-overlapping ellipses can 711
be taken as significantly different samples in metabolite space. 712
Table S1. List of metabolites described on Figure 3, 4 and 5 713
Table S2. List of PCA summaries from figure 3, 4 and 5 714
715
Jour
nal o
f Cel
l Sci
ence
Acc
epte
d m
anus
crip
t
32
Table 1 716
OreR sm21
amino acid glycine -47 0
beta-hydroxypyruvate 66 0
serine -41 0
threonine -40 0
aspartate -36 0
asparagine -30 0
beta-alanine 62 0
alanine -35 0
glutamate 116 0
glutamine -67 88
gamma-aminobutyrate (GABA) -21 0
histidine -38 0
histamine -17 17
phenylalanine -27 0
isoleucine -35 0
leucine -28 0
valine -32 0
cysteine -41 0
cystine 0 62
arginine -57 0
proline -35 0
Energy fumarate -29 0
malate 49 0
phosphate -53 0
pyrophosphate (PPi) 0 -44
long chain fatty acids myristate (14:0) -21 0
palmitate (16:0) -30 0
palmitoleate (16:1n7) -27 0
10-heptadecenoate (17:1n7) -43 0
stearate (18:0) -28 0
oleate (18:1n9) -33 0
10-nonadecenoate (19:1n9) -34 0
eicosenoate (20:1n9 or 11) -37 0
dihomo-linoleate (20:2n6) -37 0
Carbohydrate erythronate 161 0
maltose 30 0
Isobar: sorbitol, mannitol -23 0
sucrose -46 0
trehalose 70 0
maltotriose 149 0
maltotetraose 0 196
glycerate 41 0
3-phosphoglycerate 35 0
ribose -33 0
xylitol 63 0
Ketone bodies 3-hydroxybutyrate (BHBA) -82 0
1-myristoylglycerophosphoethanolamine -52 0
2-myristoylglycerophosphoethanolamine -37 0
1-palmitoylglycerophosphoethanolamine -50 0
2-palmitoylglycerophosphoethanolamine -44 0
Jour
nal o
f Cel
l Sci
ence
Acc
epte
d m
anus
crip
t
33
1-palmitoleoylglycerophosphoethanolamine -44 0
2-palmitoleoylglycerophosphoethanolamine -32 0
1-stearoylglycerophosphoethanolamine -54 0
1-oleoylglycerophosphoethanolamine -46 0
2-oleoylglycerophosphoethanolamine -23 0
1-linoleoylglycerophosphoethanolamine -45 0
2-linoleoylglycerophosphoethanolamine -31 0
carnitine metabolism carnitine 67 0
acetylcarnitine 110 0
717
Jour
nal o
f Cel
l Sci
ence
Acc
epte
d m
anus
crip
t
*
*
A B
C D
*
*
*
*
Jour
nal o
f Cel
l Sci
ence
Acc
epte
d m
anus
crip
t
A
B
C
D
* *
*
Oxyg
en
co
nsum
ption
(R
ap
a/C
ontr
ol)
∆H
2O
2 m
in -
1m
g-1
Co
mp
lex II A
ctivity (∆
Ab
s m
in-1
mg-1
)
∆H
2O
2 m
in -
1m
g-1
Oxyg
en
co
nsum
ption
(R
ap
a/C
ontr
ol)
Co
mp
lex II A
ctivity (∆
Ab
s m
in-1
mg-1
)
OreR Zim53 sm21 siI
OreR Zim53 sm21 siI
State 3 Uncoupling Control Rapamycin
Control Rapamycin
Control Rapamycin
Jour
nal o
f Cel
l Sci
ence
Acc
epte
d m
anus
crip
t
PC1
PC
2
OreR Control
sm21 Rapa
OreR Rapa
sm21 Control
All MetabolitesA
PC1
Amino Acids
PC
2
B
Lipids
PC1
PC
2
CCarbohydrates
PC1
PC
2
D
Whole fly extractsJo
urna
l of C
ell S
cien
ceA
ccep
ted
man
uscr
ipt
PC1
Lipids
PC1
PC
2
Carbohydrates
PC1
PC
2
PC1
PC
2
All MetabolitesA Amino Acids
PC
2
B
CD
OreR Control
sm21 Rapa
OreR Rapa
sm21 Control
Mitochondrial extracts
PC1
Jour
nal o
f Cel
l Sci
ence
Acc
epte
d m
anus
crip
t
Mitochondrial pelletB
PC1
Whole flyA
PC
2
PC1
PC
2
OreR Control
sm21 Rapa
OreR Rapa
sm21 Control
metabolites involved in energy homeostasis
Jour
nal o
f Cel
l Sci
ence
Acc
epte
d m
anus
crip
t