Embed Size (px)
Citation preview

Drought Historyfor the Trans Pecos of Texas
Prepared by the South Central Climate Science Center in Norman, Oklahoma
May 28, 2013
http://southcentralclimate.org/ [email protected]

(This page left blank)

Why be prepared for drought?Since 2000, the National Oceanic and Atmospheric Administration has identi7ied nine droughts nationwide as billion-‐dollar weather disasters based on both damages and costs, such as from crop loss. The 2012 drought, which at its height affected over 80% of the contiguous U.S., resulted in estimated damages and costs of over $50 billion from both direct and indirect impacts. Drought can result in crop, pasture, and forest damage; increased livestock and wildlife mortality; increased 7ire hazard; threats to aquatic and wildlife habitats; increased water demand; and reduced water supplies.
Proper management of water resources is necessary to protect supplies for drinking water, sanitation, and 7ire protection as well as to maintain economic activity and environmental sustainability. Because disasters affect families, neighbors, and businesses locally, community-‐level planning is necessary to reduce the vulnerability to drought in the Trans Pecos of Texas.
How to be prepared for drought?Local of7icials and other key stakeholders in the Trans Pecos of Texas will be better prepared for drought when they complete the following: (1) have assessed their vulnerability to drought, (2) understand past droughts and the local climate, (3) monitor drought, (4) prepare a thorough set of actions to be taken before, during, and after a drought, and (5) educate citizens on this plan.
Having a plan in place will enable these individuals to understand key factors to monitor so they may respond proactively to drought conditions early. Following this plan helps reduce the risk such that, when drought conditions occur, water resources do not run out. This report will help government of7icials and resource managers by overviewing the climate and drought history in the Trans Pecos of Texas since record-‐keeping began in the late 19th century.
What is drought?Drought is dif7icult to de7ine. This is problematic because the impacts associated with drought are often far-‐reaching and devastating. A meteorological drought is a prolonged period when precipitation is below “normal” for the location (Heim 2002). An agricultural drought occurs when soils are too dry to grow healthy vegetation, particularly crops or forests. As water becomes scarce in rivers, lakes, and other water bodies, a hydrological drought develops. If, at any time, the water demands of society (e.g., water for drinking, maintaining lawns and gardens, washing clothes) exceed the availability of good-‐quality water, then a socioeconomic drought has occurred. A socioeconomic drought may arise even during times of normal precipitation because of increased water demand from a growing population, increased temperatures and wind speeds, new businesses, or other societal changes.
Drought History for the Trans Pecos of Texas Page 1

Has the Trans Pecos of Texas experienced drought?Drought is a recurring condition in the Trans Pecos of Texas, and is part of our climate. Our climate history can provide us insight into what we may see in the future. Being “drought ready” means, in part, that we recognize how our climate has changed over time. Let’s examine our past.
The Climate of the Trans Pecos of TexasTemperature and precipitation are the two main elements of our climate. Because the Trans Pecos of Texas is located in the middle latitudes, and northwest of the Gulf of Mexico, its citizens experience a wide range of weather conditions. Hence, our climate is highly variable, from year to year, season to season, and month to month.
Figure 1. Map of the climate divisions of Texas. For this report, we will focus on Climate Division 5 in the Trans Pecos of Texas.
Figure 2 shows the annual temperature (top) and annual precipitation (bottom) in the Trans Pecos of Texas since 1895.1 The annual temperature for the Trans Pecos of Texas averages 63.8 degrees Fahrenheit, while precipitation averages 12.42 inches. Warmer-‐than-‐average periods have spanned the 1900s, and the mid-‐1990s through the early 2010s. Signi7icant periods of drier-‐than-‐average conditions include the early 1910s, the mid-‐1920s to the mid-‐1930s, the mid-‐1940s through the late 1960s, the mid-‐1990s through the mid-‐2000s, and the early 2010s.
Drought History for the Trans Pecos of Texas Page 2
1 Data from the National Climatic Data Center and obtained from the Oklahoma Climatological Survey (http://climate.ok.gov).

Figure 2. The average annual temperature (top graph) and total annual precipitation (bottom graph) in the Trans Pecos of Texas from 1895 to 2012. To highlight warmer, cooler, wetter, or drier periods, 5-year moving averages are shaded. On the top graph, red shading (above the horizontal line) indicates warmer periods and blue shading (below the line) notes cooler periods than average. Similarly, on the bottom graph, green shading (above the horizontal line) highlights wetter periods and brown shading (below the line) highlights drier periods than average. Extended periods of relatively warm temperatures or low precipitation are outlined in red boxes.
Drought History for the Trans Pecos of Texas Page 3

To understand when there is the greatest stress on water availability for the Trans Pecos of Texas, the average monthly temperature and precipitation, as well as their average highest and lowest monthly values, are shown in Figure 3. Warmer temperatures result in greater water loss by evaporation and transpiration. The warmest temperatures typically occur during June, July, and August (top of Figure 3).
30405060708090
Jan Feb Mar Apr May Jun Jul Aug Sep Oct Nov Dec
Average Temperature by Month for the Trans Pecos of Texas
Tem
pera
ture
(in
Fahr
enhe
it)
HighestAverageLowest
02468
10121416
Jan Feb Mar Apr May Jun Jul Aug Sep Oct Nov Dec
Total Precipitation by Month for the Trans Pecos of Texas
Prec
ipita
tion
(in in
ches
) HighestAverageLowest
Figure 3. Top graph: The monthly average temperature (in degrees Fahrenheit) across the Trans Pecos of Texas using data from 1895 to 2012. The red (middle) line is the average of all climate-division average temperatures for that time period. The blue (top) line is the highest monthly average and the green (bottom) line is the lowest. Bottom graph: The average total precipitation (in inches) by month across the Trans Pecos of Texas using data from 1895 to 2012. The blue (leftmost of each monthly cluster) bar is the highest monthly precipitation; the green (middle of the cluster) is the average precipitation total recorded for that month; the gold (rightmost) is the lowest precipitation total recorded for that month. [Note that zero precipitation has occurred at least once during January, February, March, April, November, and December.] The peak precipitation in September is clearly visible.
Drought History for the Trans Pecos of Texas Page 4
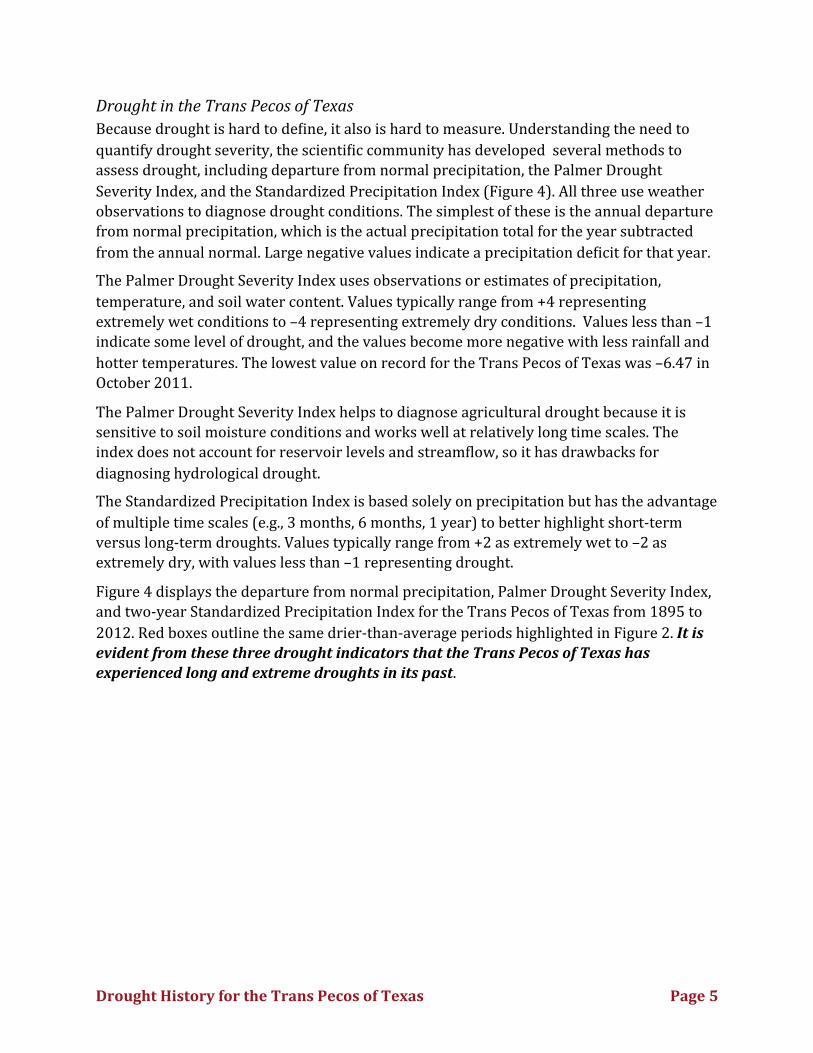
Drought in the Trans Pecos of TexasBecause drought is hard to de7ine, it also is hard to measure. Understanding the need to quantify drought severity, the scienti7ic community has developed several methods to assess drought, including departure from normal precipitation, the Palmer Drought Severity Index, and the Standardized Precipitation Index (Figure 4). All three use weather observations to diagnose drought conditions. The simplest of these is the annual departure from normal precipitation, which is the actual precipitation total for the year subtracted from the annual normal. Large negative values indicate a precipitation de7icit for that year.
The Palmer Drought Severity Index uses observations or estimates of precipitation, temperature, and soil water content. Values typically range from +4 representing extremely wet conditions to –4 representing extremely dry conditions. Values less than –1 indicate some level of drought, and the values become more negative with less rainfall and hotter temperatures. The lowest value on record for the Trans Pecos of Texas was –6.47 in October 2011.
The Palmer Drought Severity Index helps to diagnose agricultural drought because it is sensitive to soil moisture conditions and works well at relatively long time scales. The index does not account for reservoir levels and stream7low, so it has drawbacks for diagnosing hydrological drought.
The Standardized Precipitation Index is based solely on precipitation but has the advantage of multiple time scales (e.g., 3 months, 6 months, 1 year) to better highlight short-‐term versus long-‐term droughts. Values typically range from +2 as extremely wet to –2 as extremely dry, with values less than –1 representing drought.
Figure 4 displays the departure from normal precipitation, Palmer Drought Severity Index, and two-‐year Standardized Precipitation Index for the Trans Pecos of Texas from 1895 to 2012. Red boxes outline the same drier-‐than-‐average periods highlighted in Figure 2. It is evident from these three drought indicators that the Trans Pecos of Texas has experienced long and extreme droughts in its past.
Drought History for the Trans Pecos of Texas Page 5

-10
-5
0
5
1018
9519
0019
0519
1019
1519
2019
2519
3019
3519
4019
4519
5019
5519
6019
6519
7019
7519
8019
8519
9019
9520
0020
0520
10
Annual Departure from Normal Precipitation for the Trans Pecos of TexasPr
ecip
itatio
n D
epar
ture
(in
inch
es)
Figure 4a. Annual departure from normal precipitation (actual precipitation total for the year subtracted from the annual normal) for the Trans Pecos of Texas from 1895 to 2012.
-5-4-3-2-1012345
1895
1900
1905
1910
1915
1920
1925
1930
1935
1940
1945
1950
1955
1960
1965
1970
1975
1980
1985
1990
1995
2000
2005
2010
Palmer Drought Severity Index for the Trans Pecos of Texas
Figure 4b. Palmer Drought Severity Index for the Trans Pecos of Texas from 1895 to 2012.
Drought History for the Trans Pecos of Texas Page 6

-3
-2
-1
0
1
2
318
9519
0019
0519
1019
1519
2019
2519
3019
3519
4019
4519
5019
5519
6019
6519
7019
7519
8019
8519
9019
9520
0020
0520
10
2-Year Standardized Precipitation Index for the Trans Pecos of Texas
Figure 4c. The 2-year Standardized Precipitation Index for the Trans Pecos of Texas from 1895 to 2012. Red boxes outline the same drier-than-average periods highlighted in Figure 2.
A more recent method to measure drought intensity is the U.S. Drought Monitor (Figure 5). This product depicts weekly drought conditions for the United States on a drought intensity scale of D0 to D4, with D0 representing areas that are abnormally dry and D4 representing areas of exceptional drought. Although the levels are subjectively determined, they are established through expert review of weather and water data, including local observations, as well as reports of drought impacts from local, tribal, state, and federal of7icials as well as the public and media. Figure 6 displays the weekly percentage of area in the Trans Pecos of Texas affected by D0 through D4 drought since 20002. Short-‐term severe droughts in 2001, 2003, and 2011 to present (data through March 2013) are evident for the region.
Drought History for the Trans Pecos of Texas Page 7
2 Data provided by the National Drought Mitigation Center.

Figure 5. Example map of the U.S. Drought Monitor from the drought assessment issued for the week preceding September 27, 2011. The color scale (yellow to dark red) displays the level of drought from D0 (abnormally dry) to D4 (exceptional drought). Significant regional impacts on agriculture are designated with an “S” and regional impacts on water supply are designated with an “L”. The maps are released each Thursday at 8:30 a.m. Eastern Time. Courtesy of the National Drought Mitigation Center.
Drought History for the Trans Pecos of Texas Page 8

0
25
50
75
100
2000
2001
2002
2003
2004
2005
2006
2007
2008
2009
2010
201
1
2012
2013
Percent of the Tran Pecos of Texas Covered by a Drought DesignationPe
rcen
t Cov
erag
e
Figure 6. Drought history for the Trans Pecos of Texas as designated by the U.S. Drought Monitor. The color scale is identical to that in Figure 5. Note that the Trans Pecos of Texas was experiencing extreme (bright red) to exceptional drought (dark red) across most of the climate division during much of 2001, 2003, and 2011 to present (data through March 2013). Data courtesy of the National Drought Mitigation Center.
The “Droughts-‐of-‐Record” for the Trans Pecos of TexasFor purpose of planning, we consider the “drought-‐of-‐record” to be the drought with the worst environmental conditions rather than the drought with the worst recorded impacts on the Trans Pecos of Texas. Hence, a shorter and less severe drought with high monetary losses in our recent past (e.g., during 2011) will not outweigh a long and severe drought in our early history, when fewer people lived in the region. We choose to prepare for the worst.
Options for the drought-‐of-‐record include the droughts in the 1920s to the 1930s, the 1940s to the 1960s, and the 1990s to the early 2000s. The longest period of dry conditions undoubtably was during the 1940s through the 1960s. Table 1 compares Palmer Drought Severity Indices for these droughts, as well as the most recent (hence, memorable) drought of 2011 to present (data through December 2012). Using these indices, the drought of the 1940s through the 1960s well exceeds the duration and intensity of all other droughts; hence, the period from February 1943 to November 1967 is the drought-‐of-‐record for the Trans Pecos of Texas.
Because of its intense heat combined with non-‐stop dry conditions, October 1992 through December 2003 comes in second for the drought-‐of-‐record for the Trans Pecos of Texas.
Drought History for the Trans Pecos of Texas Page 9

Table 1: Comparison of Palmer Drought Severity Indices (PDSI) for Several Droughts Affecting the Trans Pecos of Texas
Time Period Months with PDSI less than –1
Months with PDSI less than –4
Lowest PDSI Value
March 1907 – August 1913 40 (of 78 months) 3 consecutive plus 1
other –4.49
February 1921 – August 1936 102 (of 187 months) 9 consecutive –5.38
February 1943 – November 1967 185 (of 298 months) 10 consecutive plus 6
consecutive -‐5.10
October 1992 – December 2003 108 (of 135 months) 7 -‐5.12
October 2010 -‐ December 2012* 27 (of 27 months) 12 consecutive -‐6.47
*Note: Data only available through December 2012; drought conditions may have continued past this date.
So what can the Trans Pecos of Texas do to prepare?Key stakeholders (e.g., water managers), business leaders, and residents can contribute to ensuring that the Trans Pecos of Texas is prepared for the next drought. Water management of7icials of the region must monitor and report drought conditions by Tuesday afternoons to be considered for the Thursday updates to the U.S. Drought Monitor.
Monitoring and reporting drought conditionsThere are several ways to monitor drought. For example, water managers can monitor drought by checking the water level of their main sources of water, such as lakes and streams. Larger-‐than-‐average decreases in the water level for a given month may indicate (1) more evaporation than normal, (2) reduced releases of water upstream, or (3) a greater water demand.
Another excellent monitoring tool is the U.S. Drought Monitor, hosted by the National Drought Mitigation Center at the University of Nebraska. Dozens of federal, state, and local agencies contribute to the Drought Monitor through local reports of drought conditions (such as reports from water managers and residents) as well as observations from weather and water instrumentation. As noted previously, drought categories range from D0 as abnormally dry to D4 as exceptional drought. Many federal drought assistance programs activate at D2 drought.
Drought History for the Trans Pecos of Texas Page 10

The Southern Climate Impacts Planning Program provides a drought monitoring web site at http://www.southernclimate.org/data.php. The products on this site depict changes in precipitation and temperature across the Southern United States (including Texas). Tables summarize the current precipitation totals to past years across a variety of time scales (e.g., last 30 days, last 90 days), as shown in Figure 7.
Figure 7. Example of a drought monitoring product from the Southern Climate Impacts Planning Program (http://www.southernclimate.org/). This example provides an assessment of the past 30 days ending on May 26, 2013 and includes the following information: total rainfall for the period, departure (difference) from normal rainfall for the period, the percentage of normal precipitation for the period, how wet or dry the period has been compared to previous years, the precipitation amount for the driest similar period on record (and its year), and the precipitation amount for the wettest similar period on record (and its year).
Table 2 summarizes several excellent sources of information for drought monitoring and reporting, ranging from national to local.
Drought History for the Trans Pecos of Texas Page 11

Table 2: Sources of Drought Information & ToolsSource Web Address Uses
Major Sources of InformationMajor Sources of InformationMajor Sources of Information
National Integrated Drought Information System
www.drought.gov
Consolidated source of drought information, monitoring & reporting tools, including many of the other sources listed below
National Drought Mitigation Center drought.unl.edu
Consolidated source of drought information, including drought planning, monitoring reporting, risks, and impacts
State Climate Of7ice -‐ Texas climatexas.tamu.edu Consolidated source of Texas climate
information
West Texas Mesonet www.mesonet.ttu.edu/ Regional weather observing network speci7ic to west Texas
SpeciLic Drought-‐Related ToolsSpeciLic Drought-‐Related ToolsSpeciLic Drought-‐Related Tools
U.S. Drought Monitor: National Drought Mitigation Center
droughtmonitor.unl.edu/Current and past diagnoses of drought conditions, both nearby and across the United States
Texas Drought Monitoring Website: OfAice of the State Climatologist
climatexas.tamu.edu/index.php/drought
Current drought conditions and research on previous drought impacts within Texas
U.S. Seasonal Drought & Precipitation Outlooks: Climate Prediction Center
www.cpc.noaa.gov
Large-‐scale trends in drought across the U.S. for the next few months; Expert assessments (not forecasts) of possible changes in precipitation conditions over a range of times (6-‐10 days, 8-‐14 days, 1 month, & 3 months)
AcknowledgmentsWeekly U.S. Drought Monitor data were provided by Brian Fuchs of the National Drought Mitigation Center, and climate division data were supplied by Monica Deming of the Oklahoma Climatological Survey. Texas drought photos courtesy of the San Angelo, TX National Weather Service Weather Forecast Of7ice (http://www.srh.noaa.gov/sjt/?n=drought).
BibliographyHeim, R. R., 2002: A Review of Twentieth-‐Century Drought Indices Used in the United States.
Bulletin of the American Meteorological Society, 83, 1149-‐1165.
Drought History for the Trans Pecos of Texas Page 12