Embed Size (px)
Citation preview
WORKING PAPER 93
I n t e r n a t i o n a lWater ManagementI n s t i t u t e
State Level Analysis ofDrought Policies andImpacts in Rajasthan, India
M. S. Rathore
Drought Series. Paper 6
i
Working Paper 93
Drought Series Paper No. 6
STATE LEVEL ANALYSIS OF DROUGHT POLICIES ANDIMPACTS IN RAJASTHAN, INDIA
M. S. Rathore
International Water Management Institute
ii
The authors: Dr Manohar Singh Rathore is a Senior Fellow at the Institute of Development Studies,Jaipur, Rajasthan, India
This paper is part of the research project “Drought Assessment and Mitigation Potential in SouthWest Asia,” implemented by IWMI and partner organizations, and sponsored by the US StateDepartment Regional Environment Office for South Asia through agreement with the USAID. Thispaper is based on a report submitted by IDS to IWMI. The report was modified from its originalversion and edited by Dr. Vladimir Smakhtin, IWMI, Colombo, Sri Lanka. The paper has beenreviewed by Dr Hugh Tural, IWMI, Colombo, Sri Lanka.
The views expressed in the paper remain the responsibility of the author only.
Rathore, M. S. 2005. State level analysis of drought policies and impacts in Rajasthan, India.Colombo, Sri Lanka: IWMI. 40p. (Working paper 93 : Drought Series Paper No. 6)
drought / analysis / crop production / livestock / agricultural production / social impact / financing /policy / institutions / India
ISBN 92-9090-593-X
Copyright 2004, by IWMI. All rights reserved.
Please direct inquiries and comments to: [email protected]
IWMI receives its principal funding from 58 governments, private foundations andinternational and regional organizations known as the Consultative Group onInternational Agricultural Research (CGIAR). Support is also given by the Governmentsof Ghana, Pakistan, South Africa, Sri Lanka and Thailand.
iii
Contents
Introduction ................................................................................................................................. 1
Droughts in Rajasthan ..................................................................................................................... 2
Declaring a drought ......................................................................................................................... 7
Impacts of drought .......................................................................................................................... 9
Policy of financing drought relief expenditure.............................................................................. 15
Analysis of State budget and drought relief expenditure .............................................................. 18
Institutions for drought management ............................................................................................. 20
State response to drought .............................................................................................................. 23
Conclusions ............................................................................................................................... 26
References ............................................................................................................................... 29
iv
Abbreviations and Terms
ARWSP Accelerated Rural Water Supply ProgrammeBPL Below Poverty LineCOD Committee of DirectionCRF Calamity Relief FundCWWG Crop Weather Watch GroupDDP Desert Development ProgrammeDMC Disaster Management CentreDPAP Drought Prone Area ProgrammeEGP Employment Generation ProgrammeFC Famine CodeFC Finance CommissionGOR Government of RajasthanGSDP Gross Domestic ProductHLC High Level CommitteeIMD Indian Meteorological DepartmentIMG Inter–Ministerial GroupIRDP Integrated Rural Development ProgrammeIWDP Integrated Watershed Development ProgrammeMHA Ministry of Home AffairsMOS Memorandum of ScarcityNCCF National Calamity Contingency FundNGO Non Governmental OrganisationNSDP Net State Domestic ProductNWDPRA National Watershed Development Programme for Rainfed AreasOBC Other Backward CastesPHED Public Health Engineering DepartmentSC Scheduled CasteSDO Sub Divisional OfficerSFDA Small Farmer Development AgencyST Scheduled TribeTADP Tribal Area Development Programme)WWG Weather Watch Group
1 Crore – 10 Million1 Lakh – 0.1 MillionPanchayat – Village Council to manage all development work in villagesTehsil – Administrative unit within a districtRabi – Winter crop seasonKharif – Summer crop season
1
Introduction
The conventional attitude to a drought as a phenomenon of arid and semi-arid areas is changingbecause even areas with high average rainfall often face acute water scarcity. Cheerapunji, the world’shighest rainfall area, is facing severe drinking water shortages. Drought in the state of Orissa, withan average rainfall of 1100 mm, surprised many. A water scarcity condition in the Himalayan re-gion is also not uncommon. This shows that drought is just not the scarcity or absence of rainfall,but is more related to water resource management (or mismanagement).
In the case of Rajasthan, there have been 48 drought years of varied intensity since 1901. (last102 years). A more detailed analysis reveals that only in 9 out of 102 years were none of the districtsin the State affected by droughts. At the village level, the number of drought-free years will beeven less. Therefore, every year some part(s) of Rajasthan is affected by drought. Despite this, theState considers drought as a transient phenomenon where shortterm relief measures are consideredto be a solution.
This paper examines the range of drought management issues in the State, intends to identifyexisting gaps and suggest appropriate measures to reduce the impact of droughts in the future.
The study is carried out as part of the regional project on drought assessment and mitigation insouthwest Asia, which focuses on Afghanistan, southern Pakistan and west India. In this largerproject, Rajasthan is selected as a primary target area in India. More specifically, the objectives ofthis particular study are:
• Examine the impact of drought on production, employment, wages and farms income
• Analyze drought relief expenditure and its’ impact on the State Budget
• Examine existing drought management policies and institutions in the State
• Examine issues associated with drought declaration
The study is based on secondary data published by various line departments of State and CentralGovernment, review of published research papers and books on the subject and personal interactionsof the author with people in rural and urban areas.
The paper is organized in eight chapters, including this Introduction. The second chapter analysesthe rainfall pattern and occurrence of drought in different regions of Rajasthan. Problems arisingfrom the definition of a drought, perceptions and response to drought, are also discussed. The nextchapter explores the issues of vulnerability to drought and attempts to highlight the need for properidentification of target areas and population for efficient planning of drought relief measures in thestate. Present interventions are based more on conventional perceptions, e.g., that Below PovertyLine (BPL) population and population within certain castes are the only vulnerable groups andthat the Western region of the State is the most vulnerable. Drought declaration in the State isdiscussed in the next chapter. The following chapters deal with various impacts of droughts,management of finances and impact of drought on the state budget and State responses andmanagement of droughts. The last chapter summarizes the study findings.
2
Droughts in Rajasthan
Physiography
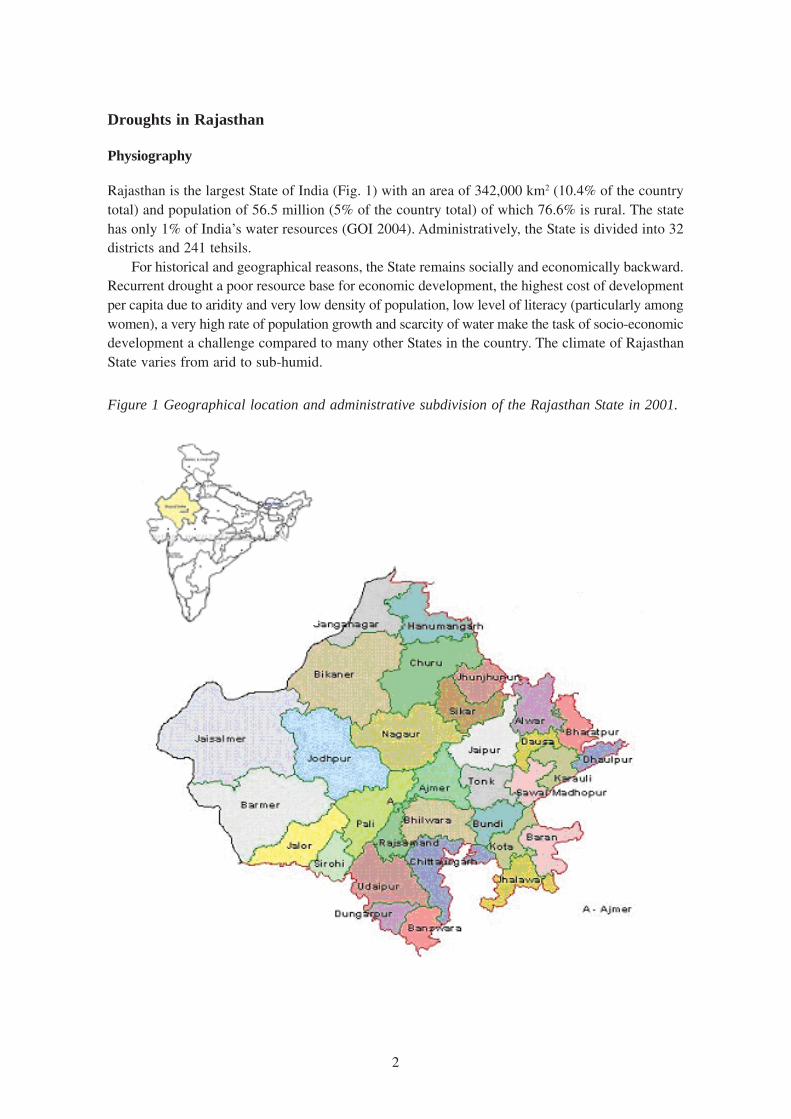
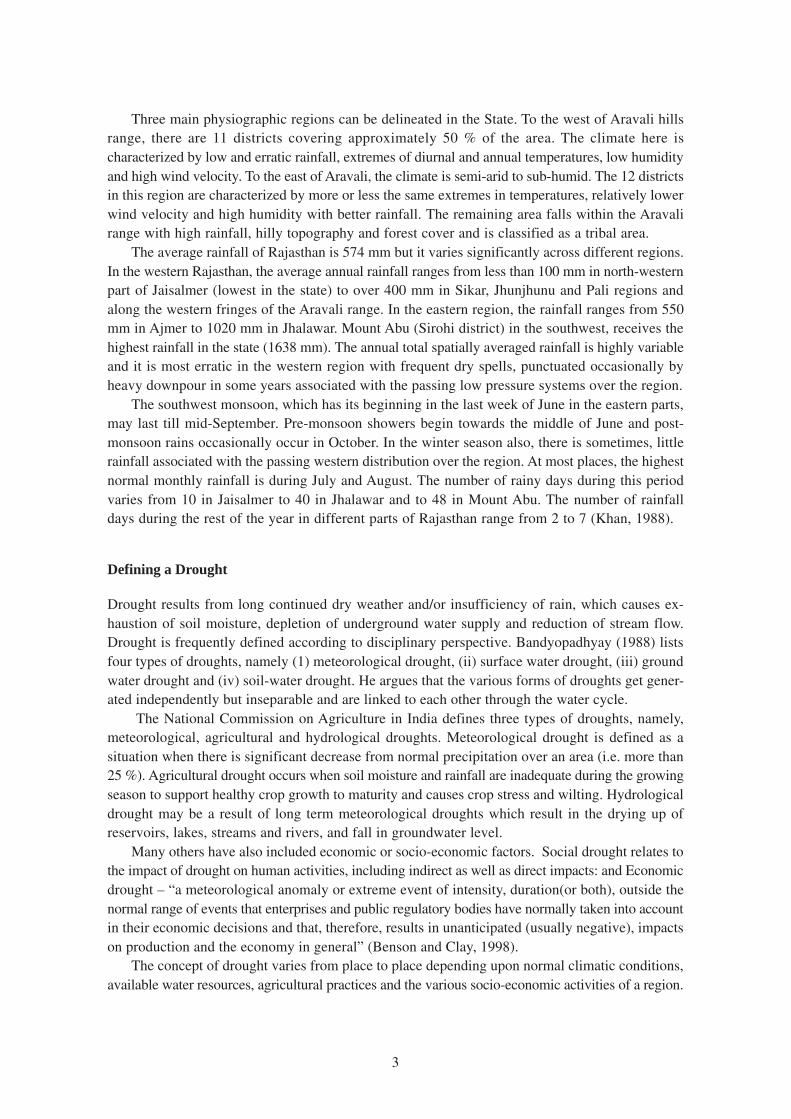
Rajasthan is the largest State of India (Fig. 1) with an area of 342,000 km2 (10.4% of the countrytotal) and population of 56.5 million (5% of the country total) of which 76.6% is rural. The statehas only 1% of India’s water resources (GOI 2004). Administratively, the State is divided into 32districts and 241 tehsils.
For historical and geographical reasons, the State remains socially and economically backward.Recurrent drought a poor resource base for economic development, the highest cost of developmentper capita due to aridity and very low density of population, low level of literacy (particularly amongwomen), a very high rate of population growth and scarcity of water make the task of socio-economicdevelopment a challenge compared to many other States in the country. The climate of RajasthanState varies from arid to sub-humid.
Figure 1 Geographical location and administrative subdivision of the Rajasthan State in 2001.
3
Three main physiographic regions can be delineated in the State. To the west of Aravali hillsrange, there are 11 districts covering approximately 50 % of the area. The climate here ischaracterized by low and erratic rainfall, extremes of diurnal and annual temperatures, low humidityand high wind velocity. To the east of Aravali, the climate is semi-arid to sub-humid. The 12 districtsin this region are characterized by more or less the same extremes in temperatures, relatively lowerwind velocity and high humidity with better rainfall. The remaining area falls within the Aravalirange with high rainfall, hilly topography and forest cover and is classified as a tribal area.
The average rainfall of Rajasthan is 574 mm but it varies significantly across different regions.In the western Rajasthan, the average annual rainfall ranges from less than 100 mm in north-westernpart of Jaisalmer (lowest in the state) to over 400 mm in Sikar, Jhunjhunu and Pali regions andalong the western fringes of the Aravali range. In the eastern region, the rainfall ranges from 550mm in Ajmer to 1020 mm in Jhalawar. Mount Abu (Sirohi district) in the southwest, receives thehighest rainfall in the state (1638 mm). The annual total spatially averaged rainfall is highly variableand it is most erratic in the western region with frequent dry spells, punctuated occasionally byheavy downpour in some years associated with the passing low pressure systems over the region.
The southwest monsoon, which has its beginning in the last week of June in the eastern parts,may last till mid-September. Pre-monsoon showers begin towards the middle of June and post-monsoon rains occasionally occur in October. In the winter season also, there is sometimes, littlerainfall associated with the passing western distribution over the region. At most places, the highestnormal monthly rainfall is during July and August. The number of rainy days during this periodvaries from 10 in Jaisalmer to 40 in Jhalawar and to 48 in Mount Abu. The number of rainfalldays during the rest of the year in different parts of Rajasthan range from 2 to 7 (Khan, 1988).
Defining a Drought
Drought results from long continued dry weather and/or insufficiency of rain, which causes ex-haustion of soil moisture, depletion of underground water supply and reduction of stream flow.Drought is frequently defined according to disciplinary perspective. Bandyopadhyay (1988) listsfour types of droughts, namely (1) meteorological drought, (ii) surface water drought, (iii) groundwater drought and (iv) soil-water drought. He argues that the various forms of droughts get gener-ated independently but inseparable and are linked to each other through the water cycle.
The National Commission on Agriculture in India defines three types of droughts, namely,meteorological, agricultural and hydrological droughts. Meteorological drought is defined as asituation when there is significant decrease from normal precipitation over an area (i.e. more than25 %). Agricultural drought occurs when soil moisture and rainfall are inadequate during the growingseason to support healthy crop growth to maturity and causes crop stress and wilting. Hydrologicaldrought may be a result of long term meteorological droughts which result in the drying up ofreservoirs, lakes, streams and rivers, and fall in groundwater level.
Many others have also included economic or socio-economic factors. Social drought relates tothe impact of drought on human activities, including indirect as well as direct impacts: and Economicdrought – “a meteorological anomaly or extreme event of intensity, duration(or both), outside thenormal range of events that enterprises and public regulatory bodies have normally taken into accountin their economic decisions and that, therefore, results in unanticipated (usually negative), impactson production and the economy in general” (Benson and Clay, 1998).
The concept of drought varies from place to place depending upon normal climatic conditions,available water resources, agricultural practices and the various socio-economic activities of a region.
4
The various approaches taken by scientists and non-scientists to define drought demonstrate itscomplex and interdisciplinary nature. At the same time, although most definitions emphasize thephysical aspects of drought, the social aspects are closely related.
Drought frequency and intensity
The dominant impression/perception of droughts and drought prone areas in Rajasthan is quitedifferent than what can be supported by the available facts. It is generally believed that the westernarid part has high rainfall variability and is severely affected drought prone region compared to therest of the Rajasthan, as east and southern parts experience higher rainfall and less variability. Onthe contrary, the analysis of 102 years of meteorological data shows that standard deviations (SD)of annual rainfall in southern and eastern regions (182 and 207 mm respectively (averaged over alldistricts of each region) are higher than that of the western region (118 mm).
Various drought indices have been designed to date to allow drought extremity to be examined.Drought Index (DI), used in this study is calculated as follows;
DI = (P-X) / SD (1)
where P- annual precipitation, X- long term mean and SD- standard deviation. The DI values(and corresponding drought intensity) may be classified into four categories: very severe, severe,moderate and light (DI =< -0.1 light drought, DI = < - 0.2 moderate drought, DI = < - 0.5 severedrought, DI = < - 0.8 very severe drought). All drought years in each district have been categorizedas above. The results, summarized in Table 1, show that there is not much difference in the totalnumber of drought years between regions. A number of severe and very severe drought years acrossregions also do not differ much. Over the entire Rajasthan, 48 out of 102 years were drought years,which means that the chance of occurrence of a meteorological drought in the state is 47%(Table 1). The number of severe and very severe drought years is larger in the Western and Southerndistricts of Rajasthan. This differs from the common perception that southern region with highaverage rainfall has fewer droughts. The balance of the last column of Table 1 may be attributedto the occurrence of normal and wet years.
Rural people in Rajasthan depend on rainfed agriculture. Coping with low rainfall, with a highcoefficient of variation across time and space, is the major challenge. Low fertility of soils, limitedrainfall and groundwater availability due to hardrock formations have shaped the farming systemsin the regions and determine the levels of adaptability. At the same time, the various components ofdrought management strategies as well as development strategies were not sensitive to the specificsof the resource base in the State.
Vulnerability to drought
Vulnerability is another important concept to consider in drought impact assessment. It is closelyrelated to food insecurity and can be defined as the probability of an acute decline in food excessor consumption levels below minimum survival needs. In drought years, food insecurity increasesdue to severe decline in food production / availability, both from individual farms and in the marketand because of increased uncertainty of income related to lack of employment opportunities andlivelihood. Vulnerability may be assessed in terms of multiple factors/ indicators, which exposepeople to food insecurity through reduced food availability, access and utilization.
5
Table 1 Frequency and intensity of droughts in Districts of Rajasthan during 1901-2002
District Number of years with droughts of different intensity % of allVery Severe Severe Moderate Light drought years
in the period
Western Region 12 12 11 11 45.0
Barmer 4 15 17 11 46.0
Jaisalmer 6 12 13 17 48.0
Bikaner 8 12 16 10 46.0
Sri Ganganagar 9 9 12 18 47.5
Churu 8 11 8 17 43.1
Nagaur 2 17 15 15 48.5
Jodhpur 5 16 16 18 53.9
Pali 7 12 19 14 52.0
Jalore 7 13 13 20 48.1
NE Region 12 8 11 16 46.0
Sikar 5 20 11 14 49.5
Jhunjhunu 9 15 12 12 47.0
Alwar 7 16 10 15 47.0
Jaipur 10 11 16 9 45.5
Ajmer 6 16 21 13 45.5
Tonk 9 11 10 15 45.9
Swai Madhopur 8 8 14 21 50.0
Bharatpur 9 13 11 12 44.5
Southern Region 10 12 9 12 42.1
Bhilwara 3 9 10 14 40.0
Chittorgarh 10 12 9 13 44.0
Udaipur 10 14 14 6 43.5
Sirohi 5 17 10 21 53.0
Banswara 11 14 13 9 44.7
Dungarpur 9 16 10 5 49.5
Bundi 7 16 13 11 44.7
Kota 8 16 11 11 45.5
Jhalawar 8 13 14 8 43.8
All Rajasthan 10 10 15 13 47.0
Note: Based on district wise annual rainfall data
Vulnerability indicators are mostly relative and qualitative, and therefore, difficult to quantify.However, some broad indicators can be listed, including forced migration, borrowings, skippingmeals or food shortage, change of occupation, forced unemployment, falling health conditions etc.Vulnerability assessment may be done for different socio-economic groups based on caste, landownership, primary occupation, income group and gender. They can be assessed at a state, district,village or household level.
Rathore (2004) conducted a vulnerability assessment in Rajasthan and documented vulnerablepopulation in four climatic regions of the State by caste, income and farm size categories. It wasshown that both low-income and middle-income households are vulnerable to droughts. In a contextof farm sizes, it is marginal and small farmers that are normally most vulnerable, whereas in desert
6
region, even the large land holders are vulnerable due to the inferior quality of land with no irrigationfacilities and direct dependency on erratic rainfall. Landless households are better off as they areless dependent on agriculture and livestock for their livelihood and more mobile.
Identification of vulnerable population, villages and districts are important for policy makers,particularly the Drought Relief Department, for identification of target population. It also helps instream lining and planning in advance the activists of Relief Department.
Drought perceptions and their implications for responses
In the context of Rajasthan State, the absence of a clear understanding of and agreement on whatdrought, gives scope for political manipulation. The lack of a precise (and objective) definition ofdrought in a specific situation is an obstacle to its’ understanding, which leads to indecision and/orinaction on the part of policy makers, and others. On the other hand, people do not view drought ina unified way. Their perception of drought is complex and responses often unpredictable. The ex-pected impact of drought and responses are significantly related to both the age and experience ofa farmer (Taylor 1987). In order to understand the diversity of coping strategies, it is necessary toexplore the social, political and institutional factors that provide contexts for these individual per-ceptions. Perceptions, however, are not static and may shift over time or are expressed differentlyunder altering circumstances. Thus, perceptions of drought and the associated risks are crucial toformulate appropriate relief and mitigation policies.
Perceptions also shape the responses to drought and the confusion on what drought is maycause difficulties in dealing with the hazard. Some of the difficulties are as follows:
(i) Drought is perceived as a creeping phenomenon because its’ onset and end are often difficultto identify. Clear distinction between non-drought and drought is absent;
(ii) Drought is generally viewed as a transient phenomenon. As a result, it is usually not takenseriously once the rains have returned; it is considered as a calamity and managed as an event;
(iii) The direct impacts of drought direct impacts like withering crops, dry watering points,reduced forage for livestock etc., are obvious. Second and third order effects, such as pricerise, increased food imports, surges in rural-urban migration rates, are not recognised. Asa result, much of the impacts attributable to drought are difficult to identify.
The problem is further compounded by the fact that government perceives drought as a ‘crisissituation’ and a short term problem and manages it as an isolated event. At the household level,individuals perceive drought as a natural hazard, beyond human control. Both lead to different kindsof approaches and solutions. They also lead to many undesirable consequences. In the long run, definingdrought only as a crisis situation or natural phenomenon beyond human control undermines theconfidence and capabilities of the people to respond to drought using available resources in a productivemanner. They become more and more dependent on the government and expect relief on a larger scaleand for a longer time. Social resilience is undermined leading to beliefs that nothing else is possible,that there is really no remedy that will promote self-dependence. In turn, the government becomescomplacent and believes that its’ actions are in the best interest of the people and that it is doingeverything that is expected of a welfare state. Scientists, administrators and politicians also perceivedroughts differently but they are not given recognition in State responses to droughts.
7
Declaring a Drought
The directives provided in the Famine Code (FC) should, in principle, be the basis for declarationof a drought in Rajasthan. Designated government officials from village level to Tehsil, District,Region, and State level, undertake certain monitoring and reporting activities on a regular basis.At a village level, the Patwari (village revenue record keeper) is responsible for documenting dayto day changes in rainfall and crop conditions, fodder and availability of drinking water for humanand livestock. He is supposed to provide a detailed record on crop loss at the end of the croppingseason. Failure of rains by the end of September is recorded and consolidated at Tehsil level andsubsequently sent to Collector and Relief Commissioner. These reports become the basis for droughtdeclaration. There is a list of eq. stepwise actions, an authority responsible for taking action andschedule of responses (GoR, 1988). It is also implicit in the guidelines that a village should be theunit of declaration of a drought. This is particularly important in the conditions of Rajasthan, wherespatial and temporal variability of in rainfall is high.
In practice, the FC’s guidelines are often violated for various political and administrative reasonsand it is the prerogative of the ruling party to decide the time of drought declaration and whichvillage(s) or districts will be declared as drought affected. The financial rules and regulations andavailability of funds with the state government also influence the decision. In the past, when mainlya State was responsible for incurring drought relief expenditure, it used to delay the declaration ofdrought. Under-reporting of drought affected areas and limited relief work were common. This wasdue to no provision of drought relief expenditure in the annual budget of the state and a fixedproportion of central assistance for drought relief.
After 1995, with the provision of Calamity Relief Fund (established on recommendation ofFinance Commission), expenses are shared between state and central government and funds arereadily available for undertaking relief work at any point of time. This flexibility has influencedState government decisions in two ways: drought declaration is done much earlier and relief maybe applied at a bigger scale (i.e., now a district as a whole is declared as drought affected, as opposedto a village). State and Central Government shares of relief expenditure are 25% and 75%respectively. An early declaration and start of relief work in 2002-2003 was the latest example,very much welcomed by the drought affected population. However, this defies the norms set underthe FC and calls for making them more transparent and more in line with the pace of technology,the decision making process and the changing socio-political structure of the society.
Analyzing the government of Rajasthan statement of 2003 that “…this is the 5th year insuccession of severe drought conditions due to failure of monsoon”, Sagar (2003) found thatagricultural production, in general, and the foodgrain production, in the preceding year (2001-02)were among the highest ever achieved. Relating the data on agricultural production to the populationdeclared drought affected by the Government of Rajasthan, he observed serious overestimation indrought affected population and the intensity of drought in other years as well. In 2002-03, Banswaradistrict was declared as severely affected. As per the state norms, the district was entitled to initiaterelief work at a large scale and relief works begun. Our visit to the area at the time, however, showedthat crops in most of the fields were in good condition as people were using groundwater and canalwater from Mahi-Bajaj Sagar Dam. Table 2 shows that the intensity of drought reflected in theofficial figures on districts, and population affected is not always reflected in the correspondingfoodgrain outputs.
While preparing a Memorandum of Scarcity (MoS) for claiming funds from the CentralGovernment, there is a tendency to inflate the impact of drought to make a case for larger grantsfrom the Centre. For example, the figures of affected human and livestock population are inflated
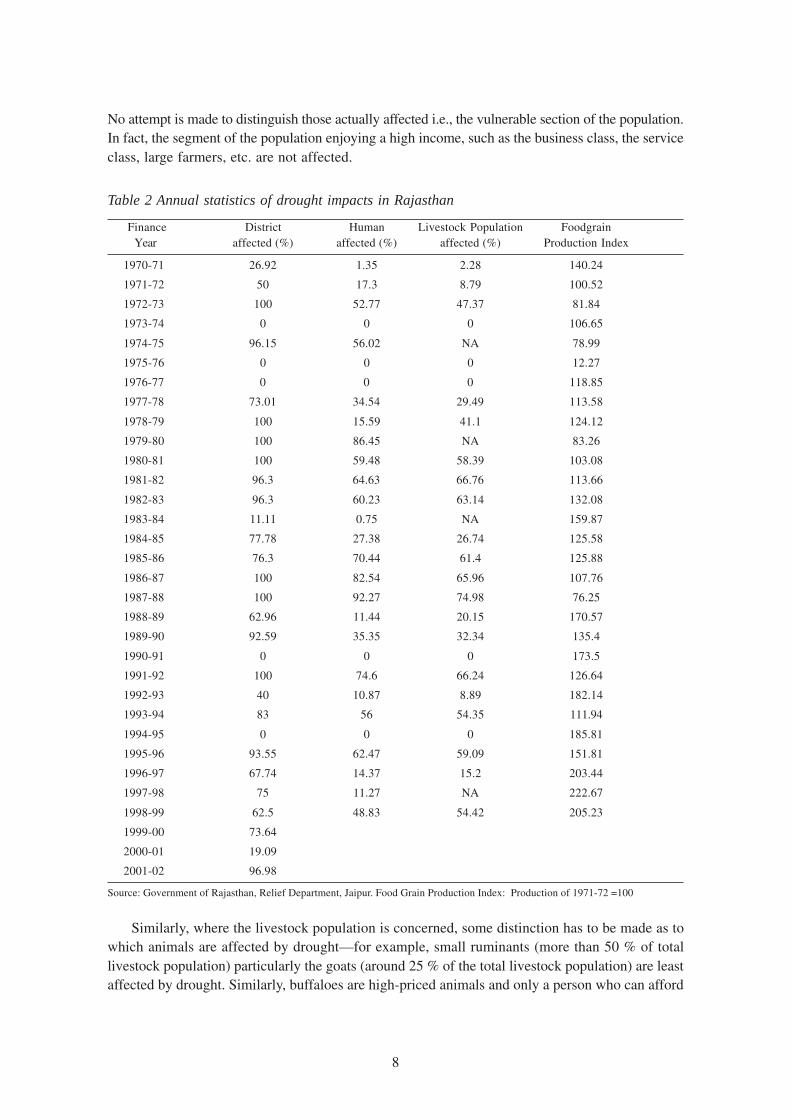
8
No attempt is made to distinguish those actually affected i.e., the vulnerable section of the population.In fact, the segment of the population enjoying a high income, such as the business class, the serviceclass, large farmers, etc. are not affected.
Table 2 Annual statistics of drought impacts in Rajasthan
Finance District Human Livestock Population FoodgrainYear affected (%) affected (%) affected (%) Production Index
1970-71 26.92 1.35 2.28 140.24
1971-72 50 17.3 8.79 100.52
1972-73 100 52.77 47.37 81.84
1973-74 0 0 0 106.65
1974-75 96.15 56.02 NA 78.99
1975-76 0 0 0 12.27
1976-77 0 0 0 118.85
1977-78 73.01 34.54 29.49 113.58
1978-79 100 15.59 41.1 124.12
1979-80 100 86.45 NA 83.26
1980-81 100 59.48 58.39 103.08
1981-82 96.3 64.63 66.76 113.66
1982-83 96.3 60.23 63.14 132.08
1983-84 11.11 0.75 NA 159.87
1984-85 77.78 27.38 26.74 125.58
1985-86 76.3 70.44 61.4 125.88
1986-87 100 82.54 65.96 107.76
1987-88 100 92.27 74.98 76.25
1988-89 62.96 11.44 20.15 170.57
1989-90 92.59 35.35 32.34 135.4
1990-91 0 0 0 173.5
1991-92 100 74.6 66.24 126.64
1992-93 40 10.87 8.89 182.14
1993-94 83 56 54.35 111.94
1994-95 0 0 0 185.81
1995-96 93.55 62.47 59.09 151.81
1996-97 67.74 14.37 15.2 203.44
1997-98 75 11.27 NA 222.67
1998-99 62.5 48.83 54.42 205.23
1999-00 73.64
2000-01 19.09
2001-02 96.98
Source: Government of Rajasthan, Relief Department, Jaipur. Food Grain Production Index: Production of 1971-72 =100
Similarly, where the livestock population is concerned, some distinction has to be made as towhich animals are affected by drought—for example, small ruminants (more than 50 % of totallivestock population) particularly the goats (around 25 % of the total livestock population) are leastaffected by drought. Similarly, buffaloes are high-priced animals and only a person who can afford
9
a steady fodder supply, will keep them. They are, therefore, are unlikely to be affected by drought.On the other hand, cows and sheep are the most affected animals.
The politics of drought declaration are multiplied when the village level allocation of worksand budget is decided. Party affiliation becomes the basis for access to relief fund. Manipulationsand misinterpretations of rainfall data can make a district non-eligible (or eligible) for drought reliefwork. All this suggests that the process of drought declaration has effectively become a routineheavily politicized, exercise of bureaucracy, based on “other” considerations. Drought is of course,too complex a situation to be described by a few figures in a table. However, state perception isinfluenced by these inflated figures with serious consequences for its’ drought mitigation and reliefpolicies. The bureaucracy loses objectivity in keeping the balance between long- term droughtmitigation measures and shortterm relief responses. The State is more inclined to undertakecontinuous ad hoc relief measures than plan and undertake long-term mitigation measures to alleviatefuture droughts, starting with location- and region-specific economic development programmes. Toarrest this trend, it is useful to consider much more indepth analysis of rainfall and other climatevariables throughout the State, involve remote sensing technology in assessing the condition of cropsand make all drought-related information public, allowing time for people to react before declaration.
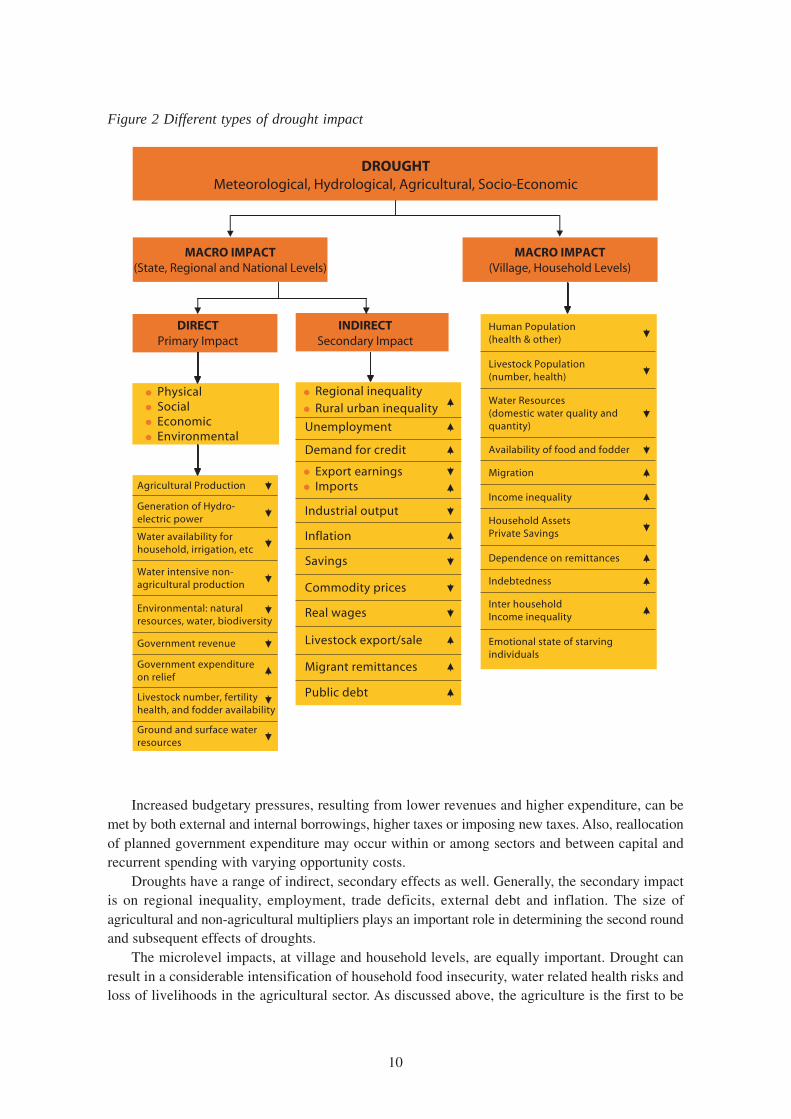
Impacts of Drought
The impact of a drought on the overall economy of the country is evident at macro (State and nationallevel) and micro–levels (village and household levels). The impacts could be direct or indirect andvary in nature and intensity (Fig.2). The extent and intensity of drought impacts is determined byprevailing economic conditions, the structure of the agricultural sector, management of waterresources, cereal reserves, internal and external conflicts, etc. (Benson and Clay, 1998). Micro-level impact is largely on the entitlement to produce and procure food. The impact varies dependingupon the social structure (class, caste) and village and household resource endowments.
The direct impacts of drought can be classified under four broad categories, viz. physical, social,economic and environmental. The initial direct physical effects of drought on the production sectorsare similar regardless of the type of economy, although the relative and absolute magnitudes ofeach impact will depend on specific country characteristics. Drought entails a loss of assets in theform of crop, livestock and productive capital damage as a direct consequence of water shortageor related power cuts. In the industrial sector, agro-based industries are the ones directly affected,as the lower domestic production of agro-processing inputs reduces non-agricultural production.Domestic availability of water is also restricted. This latter aspect has implications for health andhousehold activities, including the time required for collecting water. As water becomes scarce,competition among and within sectors may increase.
Droughts have potentially important implications for government policies, first and foremost,via their impact on the budgetary balance. A drought is likely to reduce tax revenue via a decline inincome, employment and exports. On the expenditure side, increased expenditure on relief, socialwelfare, health and water supplies, consumption-related subsidies on food distribution, and thelogistical costs of drought-related imports may confront government. Law and order services couldalso be put under greater pressure by a rise in crime, in turn associated with temporaryunemployment, migration and increased destitution. In addition, these are likely to be pressures forthe increased provisions of subsidies and credit to affected productive sectors, including publicutilities. Government policies can exacerbate the impacts of drought.
10
Increased budgetary pressures, resulting from lower revenues and higher expenditure, can bemet by both external and internal borrowings, higher taxes or imposing new taxes. Also, reallocationof planned government expenditure may occur within or among sectors and between capital andrecurrent spending with varying opportunity costs.
Droughts have a range of indirect, secondary effects as well. Generally, the secondary impactis on regional inequality, employment, trade deficits, external debt and inflation. The size ofagricultural and non-agricultural multipliers plays an important role in determining the second roundand subsequent effects of droughts.
The microlevel impacts, at village and household levels, are equally important. Drought canresult in a considerable intensification of household food insecurity, water related health risks andloss of livelihoods in the agricultural sector. As discussed above, the agriculture is the first to be
Figure 2 Different types of drought impact
11
affected by drought. Within the agricultural sector, marginal and small farmers are more vulnerableto drought because of their predominant dependence on rainfed agriculture and related activities.As a consequence, they face much greater relative loss of assets, thus widening disparities betweensmall and large size of producers. Also, as the purchasing power declines, unemployment increases,reducing availability and higher cost of credit Consequently, the vulnerable group is either forcedto migrate, work at lower wages or live in near hunger conditions. The drought impact is also felton village level institutions. A breakdown in the kinship and ties, patron-client relationships iscommon. Drought can have different impacts for various social groups and the intensity variesaccording to their economic strength, that is the ability of households to cope with drought.
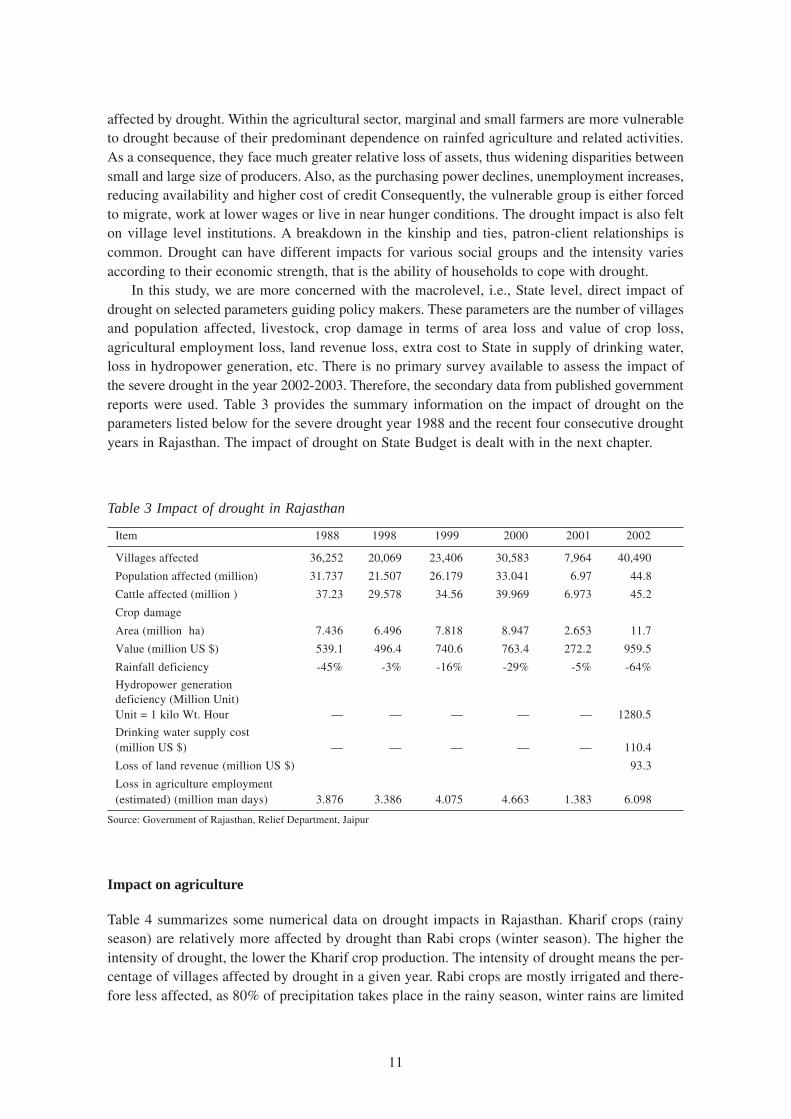
In this study, we are more concerned with the macrolevel, i.e., State level, direct impact ofdrought on selected parameters guiding policy makers. These parameters are the number of villagesand population affected, livestock, crop damage in terms of area loss and value of crop loss,agricultural employment loss, land revenue loss, extra cost to State in supply of drinking water,loss in hydropower generation, etc. There is no primary survey available to assess the impact ofthe severe drought in the year 2002-2003. Therefore, the secondary data from published governmentreports were used. Table 3 provides the summary information on the impact of drought on theparameters listed below for the severe drought year 1988 and the recent four consecutive droughtyears in Rajasthan. The impact of drought on State Budget is dealt with in the next chapter.
Table 3 Impact of drought in Rajasthan
Item 1988 1998 1999 2000 2001 2002
Villages affected 36,252 20,069 23,406 30,583 7,964 40,490
Population affected (million) 31.737 21.507 26.179 33.041 6.97 44.8
Cattle affected (million ) 37.23 29.578 34.56 39.969 6.973 45.2
Crop damage
Area (million ha) 7.436 6.496 7.818 8.947 2.653 11.7
Value (million US $) 539.1 496.4 740.6 763.4 272.2 959.5
Rainfall deficiency -45% -3% -16% -29% -5% -64%
Hydropower generationdeficiency (Million Unit)Unit = 1 kilo Wt. Hour — — — — — 1280.5
Drinking water supply cost(million US $) — — — — — 110.4
Loss of land revenue (million US $) 93.3
Loss in agriculture employment(estimated) (million man days) 3.876 3.386 4.075 4.663 1.383 6.098
Source: Government of Rajasthan, Relief Department, Jaipur
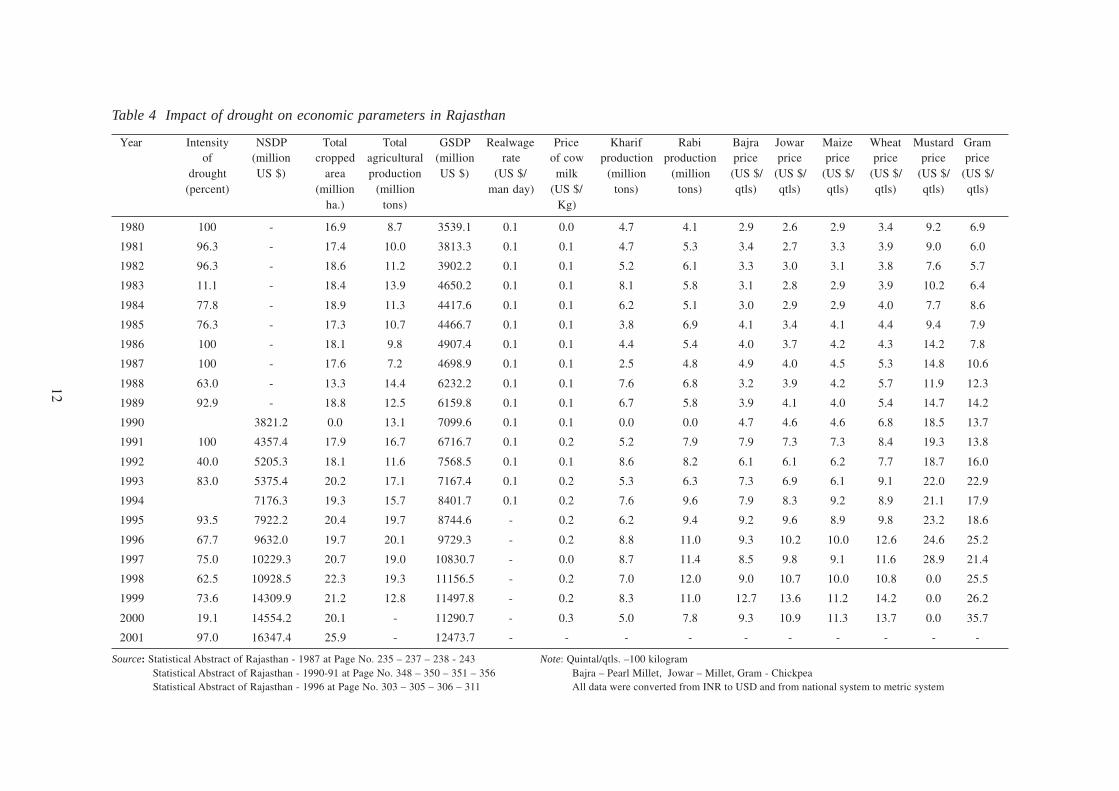
Impact on agriculture
Table 4 summarizes some numerical data on drought impacts in Rajasthan. Kharif crops (rainyseason) are relatively more affected by drought than Rabi crops (winter season). The higher theintensity of drought, the lower the Kharif crop production. The intensity of drought means the per-centage of villages affected by drought in a given year. Rabi crops are mostly irrigated and there-fore less affected, as 80% of precipitation takes place in the rainy season, winter rains are limited
12
Table 4 Impact of drought on economic parameters in Rajasthan
Year Intensity NSDP Total Total GSDP Realwage Price Kharif Rabi Bajra Jowar Maize Wheat Mustard Gramof (million cropped agricultural (million rate of cow production production price price price price price price
drought US $) area production US $) (US $/ milk (million (million (US $/ (US $/ (US $/ (US $/ (US $/ (US $/(percent) (million (million man day) (US $/ tons) tons) qtls) qtls) qtls) qtls) qtls) qtls)
ha.) tons) Kg)
1980 100 - 16.9 8.7 3539.1 0.1 0.0 4.7 4.1 2.9 2.6 2.9 3.4 9.2 6.9
1981 96.3 - 17.4 10.0 3813.3 0.1 0.1 4.7 5.3 3.4 2.7 3.3 3.9 9.0 6.0
1982 96.3 - 18.6 11.2 3902.2 0.1 0.1 5.2 6.1 3.3 3.0 3.1 3.8 7.6 5.7
1983 11.1 - 18.4 13.9 4650.2 0.1 0.1 8.1 5.8 3.1 2.8 2.9 3.9 10.2 6.4
1984 77.8 - 18.9 11.3 4417.6 0.1 0.1 6.2 5.1 3.0 2.9 2.9 4.0 7.7 8.6
1985 76.3 - 17.3 10.7 4466.7 0.1 0.1 3.8 6.9 4.1 3.4 4.1 4.4 9.4 7.9
1986 100 - 18.1 9.8 4907.4 0.1 0.1 4.4 5.4 4.0 3.7 4.2 4.3 14.2 7.8
1987 100 - 17.6 7.2 4698.9 0.1 0.1 2.5 4.8 4.9 4.0 4.5 5.3 14.8 10.6
1988 63.0 - 13.3 14.4 6232.2 0.1 0.1 7.6 6.8 3.2 3.9 4.2 5.7 11.9 12.3
1989 92.9 - 18.8 12.5 6159.8 0.1 0.1 6.7 5.8 3.9 4.1 4.0 5.4 14.7 14.2
1990 3821.2 0.0 13.1 7099.6 0.1 0.1 0.0 0.0 4.7 4.6 4.6 6.8 18.5 13.7
1991 100 4357.4 17.9 16.7 6716.7 0.1 0.2 5.2 7.9 7.9 7.3 7.3 8.4 19.3 13.8
1992 40.0 5205.3 18.1 11.6 7568.5 0.1 0.1 8.6 8.2 6.1 6.1 6.2 7.7 18.7 16.0
1993 83.0 5375.4 20.2 17.1 7167.4 0.1 0.2 5.3 6.3 7.3 6.9 6.1 9.1 22.0 22.9
1994 7176.3 19.3 15.7 8401.7 0.1 0.2 7.6 9.6 7.9 8.3 9.2 8.9 21.1 17.9
1995 93.5 7922.2 20.4 19.7 8744.6 - 0.2 6.2 9.4 9.2 9.6 8.9 9.8 23.2 18.6
1996 67.7 9632.0 19.7 20.1 9729.3 - 0.2 8.8 11.0 9.3 10.2 10.0 12.6 24.6 25.2
1997 75.0 10229.3 20.7 19.0 10830.7 - 0.0 8.7 11.4 8.5 9.8 9.1 11.6 28.9 21.4
1998 62.5 10928.5 22.3 19.3 11156.5 - 0.2 7.0 12.0 9.0 10.7 10.0 10.8 0.0 25.5
1999 73.6 14309.9 21.2 12.8 11497.8 - 0.2 8.3 11.0 12.7 13.6 11.2 14.2 0.0 26.2
2000 19.1 14554.2 20.1 - 11290.7 - 0.3 5.0 7.8 9.3 10.9 11.3 13.7 0.0 35.7
2001 97.0 16347.4 25.9 - 12473.7 - - - - - - - - - -
Source: Statistical Abstract of Rajasthan - 1987 at Page No. 235 – 237 – 238 - 243 Note: Quintal/qtls. –100 kilogram Statistical Abstract of Rajasthan - 1990-91 at Page No. 348 – 350 – 351 – 356 Bajra – Pearl Millet, Jowar – Millet, Gram - Chickpea Statistical Abstract of Rajasthan - 1996 at Page No. 303 – 305 – 306 – 311 All data were converted from INR to USD and from national system to metric system
13
and that is mostly in eastern and southern part of Rajasthan. To cope with the rainfall variability,people have adopted mix-farming system. Drought affects Kharif production in varied proportions.Many times, the distribution of rainfall is such that the grain output is severely affected but a lotof fodder is produced to sustain livestock. Therefore, it is difficult to capture these complexitiesand quantify the impact of drought on crops without systematic micro level detailed study.
Severe droughts are rare but annual dry periods may lead to crop failure as well. It variesaccording to the time of the first rains, number of rainy days and location. Despite frequent droughtsaffecting agricultural output, there is an increasing trend in the foodgrain index, primarily due tothe increasing area under cultivation.
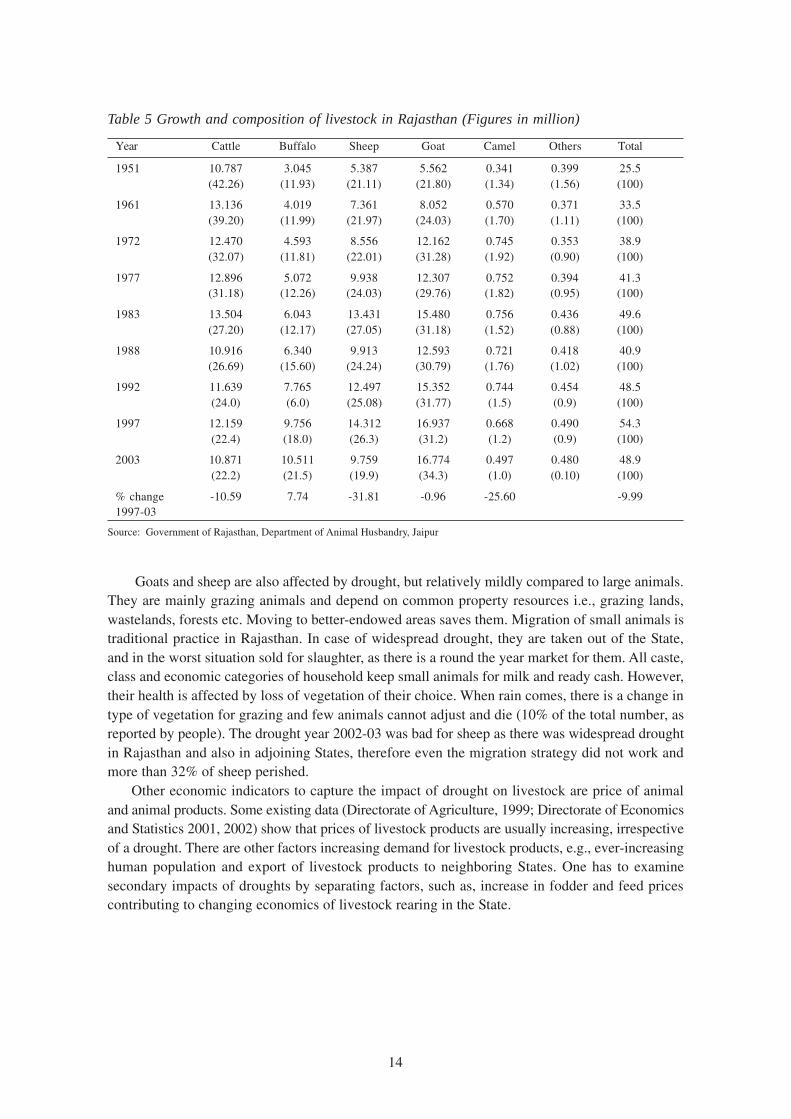
Impact on Livestock
The Impact of drought on livestock is manifested in four ways; (i) mortality, (ii) loss in productiv-ity, (iii) health of animal, and (iv) loss in fertility. There are two sources of information to verifythe impact of drought on livestock. First, the secondary data published by the State Animal Hus-bandry Department based on the quinquennial livestock census conducted in the state since 1951,and the second, primary survey conducted at IDS after the drought year 2002-03 in the 18 districtson sample households. As the census is conducted every four years irrespective of whether it is adrought or a normal year, it does not capture the true picture of drought impacts on animals. Thesedata may provide some idea about large animals, as they cannot recover fast after drought. But theinformation is misleading in the case of small ruminants, which multiply fast in between the censusyears to recover from the impact of drought.
Table 5 provides information on changes in composition of livestock in Rajasthan since 1951.2003 was, coinccidentally, a drought year and the census captures the impact of the severe drought.The last row of the table shows that sheep and camels, followed by cows, were the most vulnerableanimals. They perished in large numbers ranging between 10 to 32 % of the population. Our primarysurveys have shown (Rathore, 2004) that losses of cows were much higher, compared to state levelcensus data, as large numbers i.e., 25 to 50 % of cows were abandoned due to starvation or put incharity centers, because of acute shortage of fodder and finances. The remaining cows became dryand weak. There was nobody to buy cows even for slaughter, as there is a ban on cow slaughter inRajasthan. The severity of drought can be judged by the fact that even high price animals likebuffaloes suffered and a few perished.
14
Table 5 Growth and composition of livestock in Rajasthan (Figures in million)
Year Cattle Buffalo Sheep Goat Camel Others Total
1951 10.787 3.045 5.387 5.562 0.341 0.399 25.5(42.26) (11.93) (21.11) (21.80) (1.34) (1.56) (100)
1961 13.136 4.019 7.361 8.052 0.570 0.371 33.5(39.20) (11.99) (21.97) (24.03) (1.70) (1.11) (100)
1972 12.470 4.593 8.556 12.162 0.745 0.353 38.9(32.07) (11.81) (22.01) (31.28) (1.92) (0.90) (100)
1977 12.896 5.072 9.938 12.307 0.752 0.394 41.3(31.18) (12.26) (24.03) (29.76) (1.82) (0.95) (100)
1983 13.504 6.043 13.431 15.480 0.756 0.436 49.6(27.20) (12.17) (27.05) (31.18) (1.52) (0.88) (100)
1988 10.916 6.340 9.913 12.593 0.721 0.418 40.9(26.69) (15.60) (24.24) (30.79) (1.76) (1.02) (100)
1992 11.639 7.765 12.497 15.352 0.744 0.454 48.5(24.0) (6.0) (25.08) (31.77) (1.5) (0.9) (100)
1997 12.159 9.756 14.312 16.937 0.668 0.490 54.3(22.4) (18.0) (26.3) (31.2) (1.2) (0.9) (100)
2003 10.871 10.511 9.759 16.774 0.497 0.480 48.9(22.2) (21.5) (19.9) (34.3) (1.0) (0.10) (100)
% change -10.59 7.74 -31.81 -0.96 -25.60 -9.991997-03
Source: Government of Rajasthan, Department of Animal Husbandry, Jaipur
Goats and sheep are also affected by drought, but relatively mildly compared to large animals.They are mainly grazing animals and depend on common property resources i.e., grazing lands,wastelands, forests etc. Moving to better-endowed areas saves them. Migration of small animals istraditional practice in Rajasthan. In case of widespread drought, they are taken out of the State,and in the worst situation sold for slaughter, as there is a round the year market for them. All caste,class and economic categories of household keep small animals for milk and ready cash. However,their health is affected by loss of vegetation of their choice. When rain comes, there is a change intype of vegetation for grazing and few animals cannot adjust and die (10% of the total number, asreported by people). The drought year 2002-03 was bad for sheep as there was widespread droughtin Rajasthan and also in adjoining States, therefore even the migration strategy did not work andmore than 32% of sheep perished.
Other economic indicators to capture the impact of drought on livestock are price of animaland animal products. Some existing data (Directorate of Agriculture, 1999; Directorate of Economicsand Statistics 2001, 2002) show that prices of livestock products are usually increasing, irrespectiveof a drought. There are other factors increasing demand for livestock products, e.g., ever-increasinghuman population and export of livestock products to neighboring States. One has to examinesecondary impacts of droughts by separating factors, such as, increase in fodder and feed pricescontributing to changing economics of livestock rearing in the State.
15
Impact on livelihood
At micro level, it is ultimately the livelihood of people that is affected by drought in many ways.Firstly, food availability decreases as agriculture fails and livestock perish. Secondly, incomedecreases because of loss of agricultural employment and forced change of occupation. Thirdly,depending upon the severity of drought, people are forced to migrate in search of jobs within oroutside the State. Fourthly, people are forced to sell assets or borrow money. Health impacts mustalso be mentioned. Fortunately, the drought of 2002-03 was best managed by the State in terms offood for work. A large part of the affected population received food and cash from relief programmesand consequently, no impact on health was reported. Rathore (2004) reports change in occupationand migration due to drought. Drought in 2002-03 had a significant impact on the occupations ofpeople, as 80% of farmers were forced to join the labour force, both at relief sites and outsidevillages. People also migrated from villages to nearby towns or agriculturally better endowed areasor outside the State. It is acknowledged that relief work by the State government in the entire droughtaffected districts largely contained the human out-migration from the State.
The change in real wages since 1980 is reported in Table 4. There seems to be no relationbetween wages and drought, perhaps because the State has enforced a Minimum Wage Act.Because of a loss in agricultural employment, people were forced to migrate in search of jobswithin and outside the State and consequently, wages did not fall officially. In practice, peopledo work on lower wages in distress, mostly in urban areas and this fact does not appear in thestatistics. Single persons and even whole families become bonded or contract labour for shortperiods of 3 to 6 months until the next monsoon season. This hardship faced by poor people isthe direct impact of drought. Presently the problem is addressed by the State through startingrelief work.
Loss in agricultural employment varies according to the intensity of drought. Employmentloss was calculated by estimating the decline / deviation in area under cultivation from normalyear figures and multiplying it by the average labour hours required for raising crops inRajasthan. The cost of Production Scheme in Rajasthan provides data on human labour useper crop. This information was used to calculate the annual loss in agricultural employment and isreported in Table 3. It shows that loss varies according to the intensity of drought represented interms of rainfall deficiency. Year 2002-03 experienced severe drought with rainfall deficiency of64% and the employment loss estimated is almost 61 crore human days.
Policy of Financing Relief Expenditure
The History of Finance Commissions
The post Independence history of financing relief expenditure is the history of awards of the FinanceCommissions, appointed under Article 280 of the Constitution of India every five years. FinanceCommissions have a mandate, amongst the others, to assess the financial needs (mainly non-developmental) of the States, and to determine various grants payable to the States. The ToR ofFinance Commission require it, inter-alia, to make recommendations of how the Central Governmentmight assist States in financing relief expenditure. In the earlier phases, the role of the Commissionwas restricted to suggesting the pattern of financial assistance by the Centre. Subsequently, therecommendations extended to cover the “scheme of financing relief expenditure”. There was arecognition that although the responsibility of dealing with natural calamities rested primarily with
16
the States, providing financial support for this responsibility substantially depends on the Centre. TheFirst Finance Commission (1952) provided for Central assistance equivalent to 50% of requirementsfor relief employment works. This was provided in the form of loans and a grant (not exceeding Rs.2 crores per State per annum) for gratuitous relief to the destitute. Room for further assistance waskept open by having a system of advances to States which needed to tackle severe natural calamities.
The Fourth Finance Commission introduced a system of Central Team visits to States in caseswhere Relief Expenditure on a particular calamity was likely to exceed Rs. 1 crore. Emphasis wasplaced on meeting relief expenditure, as far as possible, within the Plan allocations. In any case, theCentral Government was expected to meet only half of the expenditure assessed by the Central Teams.
Most States in India are under severe fiscal strain. Hence, a need was felt to make available toStates some recurring funds to meet the immediate requirements of relief in “less severe” calamities.This became known as a “margin money” concept. Each State was sanctioned a certain amountbased on its past average expenditure on relief. Amounts in excess of margin money (in the eventof severe calamity) were to be determined by Central Teams. All efforts were to be made to meetthe additional expenditure, in the first instance, from Plan allocations of the State concerned.Additional Central assistance was envisaged only where the relief requirements of a severe calamitycould not be thus made.
The “margin money” concept was extended by the Ninth Finance Commission (1991) throughthe Calamity Relief Fund (CRF). The CRF envisaged contributions of Central and State Governmentsin the ratio of 3:1. The Fund was to be kept outside the Government Account so that cash flowdifficulties did not come in the way of initiating relief operations. The contributions of the Centraland State Governments are to be credited twice a year in May and November. The power to operatethe fund resides with a committee headed by the Chief Secretary of the State.
The CRF concept was not fundamentally different from the margin money approach, but itprescribed a larger contribution by the Central Government. The fundamental shift was theintroduction (along with the CRF) of the ‘normative approach’ to relief expenditure. This approachenvisaged expenditure from CRF on predetermined items (norms) at predetermined scales. Thissystem is still inforce despite some procedural changes laid down by subsequent FinanceCommissions. For calamities of a severe nature, where relief expenditure can not be accommodatedwithin the balances available in the CRF, a National Calamity Contingency Fund (NCCF) wasconstituted by Eleventh Finance Commission. The NCCF was created in 2001.
Procedures for sanctioning central assistance
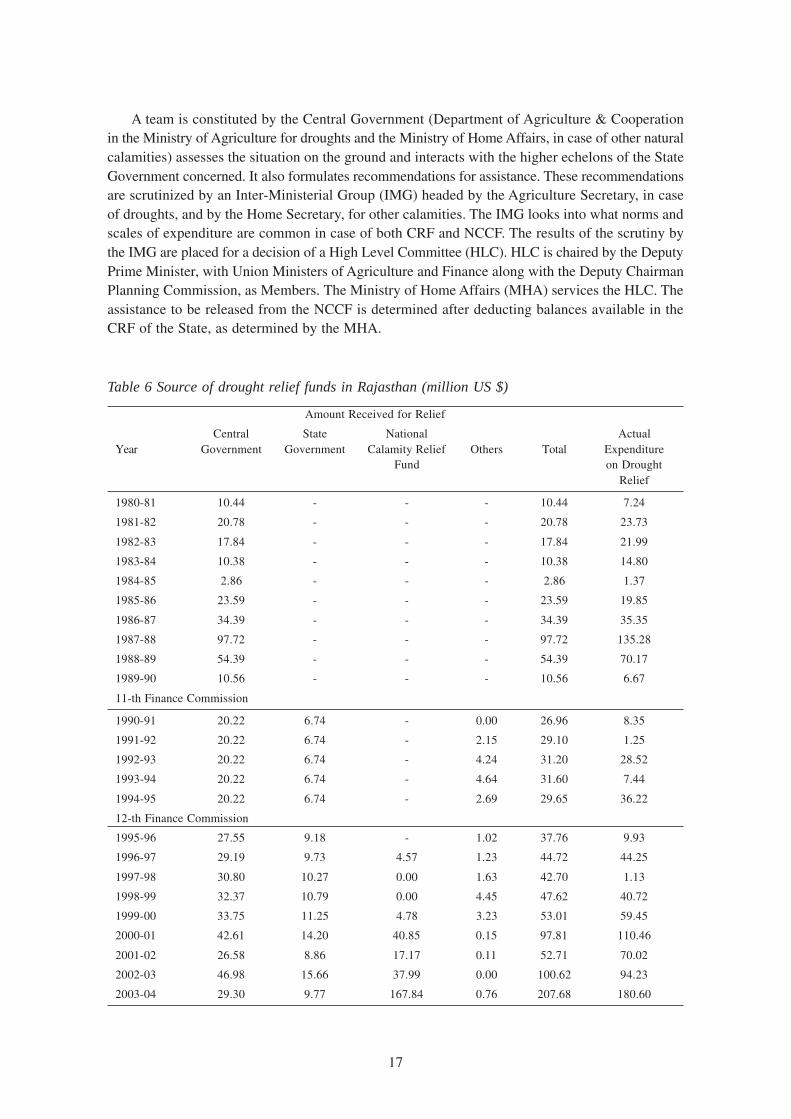
There are three steps involved in sanctioning Central assistance. The first step is a declaration ofdrought by the State Government. Second is the preparation of Memorandum of Scarcity. Third isthe constitution of the committee by the Central Government—to verify the occurrence and inten-sity of drought. The first and second steps are implemented by the drought affected State, while thethird step is undertaken by the Central Government. The contribution of the State and Central Gov-ernments to the drought relief fund is reported in Table 6. What is noteworthy from the Table is thedominance of the Central Government in the whole process of decision making as they part withmajor share. Hence, alliances between the political party in power at the Centre and their Statecounterparts play a major role in the declaration of drought and sanction / approval from NationalGovernment. It becomes more complicated when a State also demands foodgrain as part of wagesto be paid for relief work as, again, the stocks of foodgrain are owned by National Government.Quantum and timely release of foodgrain becomes a big political issue.
17
A team is constituted by the Central Government (Department of Agriculture & Cooperationin the Ministry of Agriculture for droughts and the Ministry of Home Affairs, in case of other naturalcalamities) assesses the situation on the ground and interacts with the higher echelons of the StateGovernment concerned. It also formulates recommendations for assistance. These recommendationsare scrutinized by an Inter-Ministerial Group (IMG) headed by the Agriculture Secretary, in caseof droughts, and by the Home Secretary, for other calamities. The IMG looks into what norms andscales of expenditure are common in case of both CRF and NCCF. The results of the scrutiny bythe IMG are placed for a decision of a High Level Committee (HLC). HLC is chaired by the DeputyPrime Minister, with Union Ministers of Agriculture and Finance along with the Deputy ChairmanPlanning Commission, as Members. The Ministry of Home Affairs (MHA) services the HLC. Theassistance to be released from the NCCF is determined after deducting balances available in theCRF of the State, as determined by the MHA.
Table 6 Source of drought relief funds in Rajasthan (million US $)
Amount Received for Relief
Central State National ActualYear Government Government Calamity Relief Others Total Expenditure
Fund on DroughtRelief
1980-81 10.44 - - - 10.44 7.24
1981-82 20.78 - - - 20.78 23.73
1982-83 17.84 - - - 17.84 21.99
1983-84 10.38 - - - 10.38 14.80
1984-85 2.86 - - - 2.86 1.37
1985-86 23.59 - - - 23.59 19.85
1986-87 34.39 - - - 34.39 35.35
1987-88 97.72 - - - 97.72 135.28
1988-89 54.39 - - - 54.39 70.17
1989-90 10.56 - - - 10.56 6.67
11-th Finance Commission
1990-91 20.22 6.74 - 0.00 26.96 8.35
1991-92 20.22 6.74 - 2.15 29.10 1.25
1992-93 20.22 6.74 - 4.24 31.20 28.52
1993-94 20.22 6.74 - 4.64 31.60 7.44
1994-95 20.22 6.74 - 2.69 29.65 36.22
12-th Finance Commission
1995-96 27.55 9.18 - 1.02 37.76 9.93
1996-97 29.19 9.73 4.57 1.23 44.72 44.25
1997-98 30.80 10.27 0.00 1.63 42.70 1.13
1998-99 32.37 10.79 0.00 4.45 47.62 40.72
1999-00 33.75 11.25 4.78 3.23 53.01 59.45
2000-01 42.61 14.20 40.85 0.15 97.81 110.46
2001-02 26.58 8.86 17.17 0.11 52.71 70.02
2002-03 46.98 15.66 37.99 0.00 100.62 94.23
2003-04 29.30 9.77 167.84 0.76 207.68 180.60
18
Analysis of State budget and drought relief expenditure
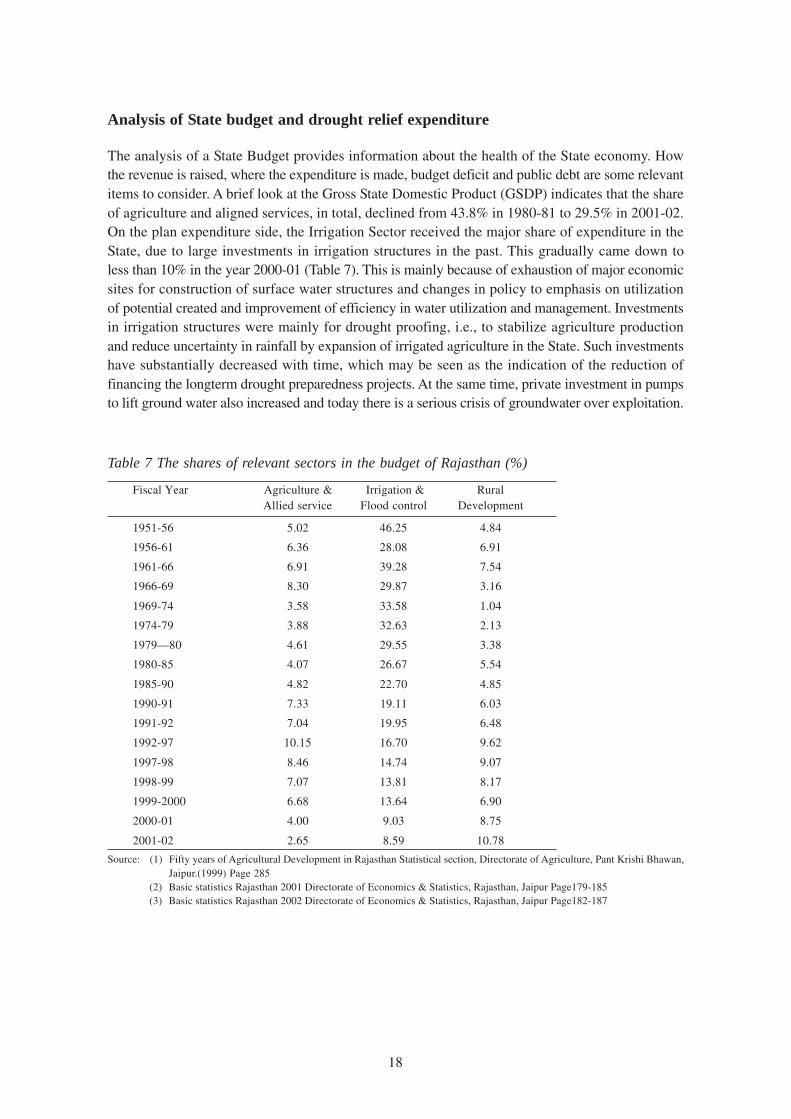
The analysis of a State Budget provides information about the health of the State economy. Howthe revenue is raised, where the expenditure is made, budget deficit and public debt are some relevantitems to consider. A brief look at the Gross State Domestic Product (GSDP) indicates that the shareof agriculture and aligned services, in total, declined from 43.8% in 1980-81 to 29.5% in 2001-02.On the plan expenditure side, the Irrigation Sector received the major share of expenditure in theState, due to large investments in irrigation structures in the past. This gradually came down toless than 10% in the year 2000-01 (Table 7). This is mainly because of exhaustion of major economicsites for construction of surface water structures and changes in policy to emphasis on utilizationof potential created and improvement of efficiency in water utilization and management. Investmentsin irrigation structures were mainly for drought proofing, i.e., to stabilize agriculture productionand reduce uncertainty in rainfall by expansion of irrigated agriculture in the State. Such investmentshave substantially decreased with time, which may be seen as the indication of the reduction offinancing the longterm drought preparedness projects. At the same time, private investment in pumpsto lift ground water also increased and today there is a serious crisis of groundwater over exploitation.
Table 7 The shares of relevant sectors in the budget of Rajasthan (%)
Fiscal Year Agriculture & Irrigation & RuralAllied service Flood control Development
1951-56 5.02 46.25 4.84
1956-61 6.36 28.08 6.91
1961-66 6.91 39.28 7.54
1966-69 8.30 29.87 3.16
1969-74 3.58 33.58 1.04
1974-79 3.88 32.63 2.13
1979—80 4.61 29.55 3.38
1980-85 4.07 26.67 5.54
1985-90 4.82 22.70 4.85
1990-91 7.33 19.11 6.03
1991-92 7.04 19.95 6.48
1992-97 10.15 16.70 9.62
1997-98 8.46 14.74 9.07
1998-99 7.07 13.81 8.17
1999-2000 6.68 13.64 6.90
2000-01 4.00 9.03 8.75
2001-02 2.65 8.59 10.78
Source: (1) Fifty years of Agricultural Development in Rajasthan Statistical section, Directorate of Agriculture, Pant Krishi Bhawan,Jaipur.(1999) Page 285
(2) Basic statistics Rajasthan 2001 Directorate of Economics & Statistics, Rajasthan, Jaipur Page179-185(3) Basic statistics Rajasthan 2002 Directorate of Economics & Statistics, Rajasthan, Jaipur Page182-187
19
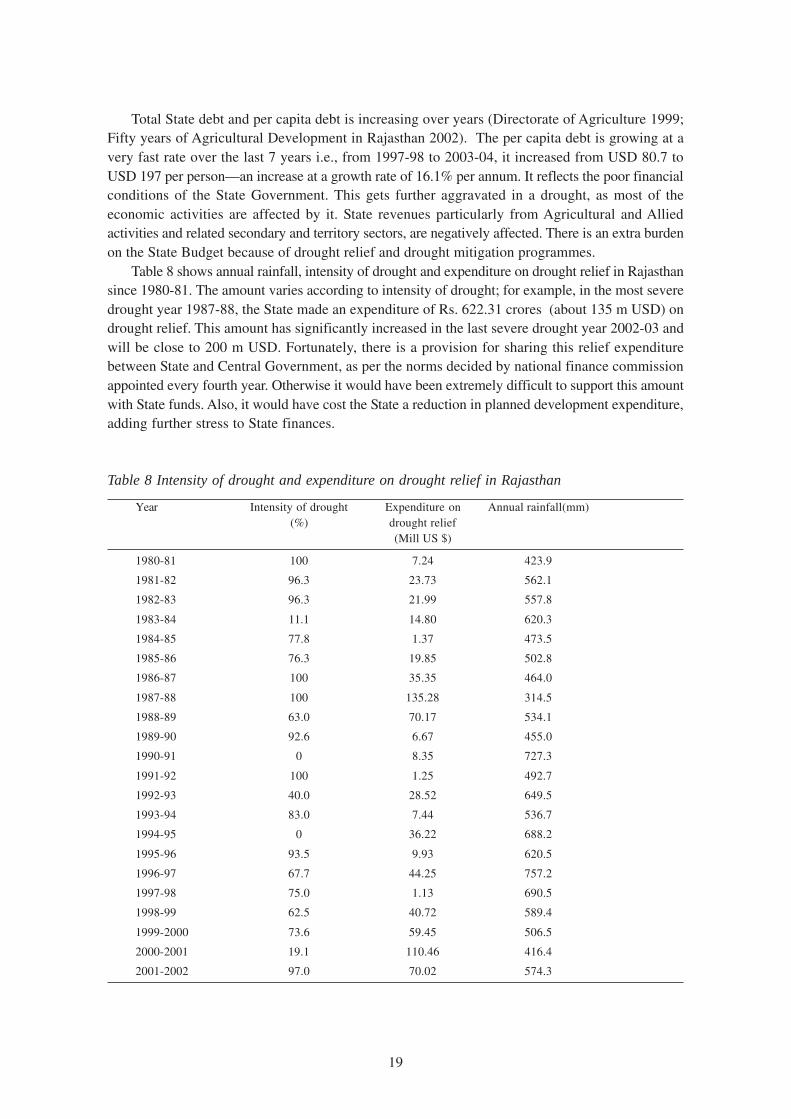
Total State debt and per capita debt is increasing over years (Directorate of Agriculture 1999;Fifty years of Agricultural Development in Rajasthan 2002). The per capita debt is growing at avery fast rate over the last 7 years i.e., from 1997-98 to 2003-04, it increased from USD 80.7 toUSD 197 per person—an increase at a growth rate of 16.1% per annum. It reflects the poor financialconditions of the State Government. This gets further aggravated in a drought, as most of theeconomic activities are affected by it. State revenues particularly from Agricultural and Alliedactivities and related secondary and territory sectors, are negatively affected. There is an extra burdenon the State Budget because of drought relief and drought mitigation programmes.
Table 8 shows annual rainfall, intensity of drought and expenditure on drought relief in Rajasthansince 1980-81. The amount varies according to intensity of drought; for example, in the most severedrought year 1987-88, the State made an expenditure of Rs. 622.31 crores (about 135 m USD) ondrought relief. This amount has significantly increased in the last severe drought year 2002-03 andwill be close to 200 m USD. Fortunately, there is a provision for sharing this relief expenditurebetween State and Central Government, as per the norms decided by national finance commissionappointed every fourth year. Otherwise it would have been extremely difficult to support this amountwith State funds. Also, it would have cost the State a reduction in planned development expenditure,adding further stress to State finances.
Table 8 Intensity of drought and expenditure on drought relief in Rajasthan
Year Intensity of drought Expenditure on Annual rainfall(mm)(%) drought relief
(Mill US $)
1980-81 100 7.24 423.9
1981-82 96.3 23.73 562.1
1982-83 96.3 21.99 557.8
1983-84 11.1 14.80 620.3
1984-85 77.8 1.37 473.5
1985-86 76.3 19.85 502.8
1986-87 100 35.35 464.0
1987-88 100 135.28 314.5
1988-89 63.0 70.17 534.1
1989-90 92.6 6.67 455.0
1990-91 0 8.35 727.3
1991-92 100 1.25 492.7
1992-93 40.0 28.52 649.5
1993-94 83.0 7.44 536.7
1994-95 0 36.22 688.2
1995-96 93.5 9.93 620.5
1996-97 67.7 44.25 757.2
1997-98 75.0 1.13 690.5
1998-99 62.5 40.72 589.4
1999-2000 73.6 59.45 506.5
2000-2001 19.1 110.46 416.4
2001-2002 97.0 70.02 574.3
20
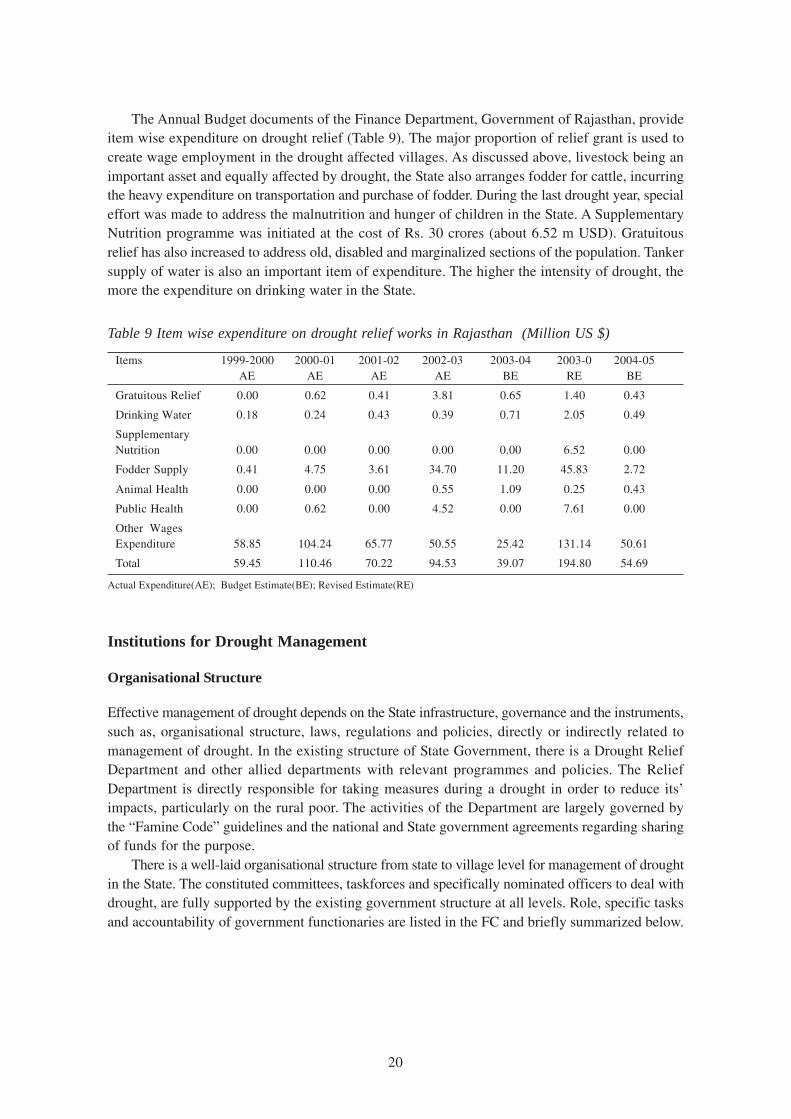
The Annual Budget documents of the Finance Department, Government of Rajasthan, provideitem wise expenditure on drought relief (Table 9). The major proportion of relief grant is used tocreate wage employment in the drought affected villages. As discussed above, livestock being animportant asset and equally affected by drought, the State also arranges fodder for cattle, incurringthe heavy expenditure on transportation and purchase of fodder. During the last drought year, specialeffort was made to address the malnutrition and hunger of children in the State. A SupplementaryNutrition programme was initiated at the cost of Rs. 30 crores (about 6.52 m USD). Gratuitousrelief has also increased to address old, disabled and marginalized sections of the population. Tankersupply of water is also an important item of expenditure. The higher the intensity of drought, themore the expenditure on drinking water in the State.
Table 9 Item wise expenditure on drought relief works in Rajasthan (Million US $)
Items 1999-2000 2000-01 2001-02 2002-03 2003-04 2003-0 2004-05AE AE AE AE BE RE BE
Gratuitous Relief 0.00 0.62 0.41 3.81 0.65 1.40 0.43
Drinking Water 0.18 0.24 0.43 0.39 0.71 2.05 0.49
SupplementaryNutrition 0.00 0.00 0.00 0.00 0.00 6.52 0.00
Fodder Supply 0.41 4.75 3.61 34.70 11.20 45.83 2.72
Animal Health 0.00 0.00 0.00 0.55 1.09 0.25 0.43
Public Health 0.00 0.62 0.00 4.52 0.00 7.61 0.00
Other WagesExpenditure 58.85 104.24 65.77 50.55 25.42 131.14 50.61
Total 59.45 110.46 70.22 94.53 39.07 194.80 54.69
Actual Expenditure(AE); Budget Estimate(BE); Revised Estimate(RE)
Institutions for Drought Management
Organisational Structure
Effective management of drought depends on the State infrastructure, governance and the instruments,such as, organisational structure, laws, regulations and policies, directly or indirectly related tomanagement of drought. In the existing structure of State Government, there is a Drought ReliefDepartment and other allied departments with relevant programmes and policies. The ReliefDepartment is directly responsible for taking measures during a drought in order to reduce its’impacts, particularly on the rural poor. The activities of the Department are largely governed bythe “Famine Code” guidelines and the national and State government agreements regarding sharingof funds for the purpose.
There is a well-laid organisational structure from state to village level for management of droughtin the State. The constituted committees, taskforces and specifically nominated officers to deal withdrought, are fully supported by the existing government structure at all levels. Role, specific tasksand accountability of government functionaries are listed in the FC and briefly summarized below.
21
Committee of Directions
At the apex level, there is a Committee of Directions—the highest decision making body for droughtrelated measures comprising the Chief Minister, 9 Cabinet Ministers, Chief Secretary and the Re-lief Secretary. On average the Committee meets twice a month during a drought period.
Task Forces
Five Task Forces were set up to closely monitor the various drought relief activities:
• On Relief works, headed by the Chief Secretary
• On Drinking Water, headed by the Chief Secretary
• On Nutrition and Health, headed by Additional Chief Secretary and DevelopmentCommissioner
• On Energy, headed by the CMD, Rajasthan Vidyut Vitaran Nigam Ltd
These Task Forces met regularly on a fortnightly basis during the drought period.
District and Sub Divisional Relief Committees
At the district level, there is a District Relief Committee, headed by the Minister in Charge of thedistrict and co-chaired by the Collector of the district. The Committee comprises of both officialsand non-officials, including local Members of Parliament, Legislative Assembly and representa-tives of Panchayati Raj Institutions. Representatives of NGOs and social workers are also co-optedas members on this committee. This committee sanctions relief measures and closely monitors theimplementation.
At the Block level, there is a committee comprising of both officials and non-officials, headedby the sub-Divisional Officer. This is followed by a Committee at the village Panchayat Level,headed by the Sarpanch of the Panchayat.
Functional Hierarchy
At the functional / operational level, the hierarchy extends from the Relief Commissioner, Divi-sional Commissioner, Collector of the district, Sub Divisional Officer, to the Tehsildar and otherRevenue staff, with other departments contributing on needs basis.
At the district level, the Collector plays a pivotal role in the implementation and co-ordinationof relief activities with the support of district level officers of other departments and the RevenueOfficers. By a special order, the State Government empowered the Collectors to take disciplinaryaction against officers of other departments for dereliction of duty regarding relief operations. Thus,the entire district machinery is placed under the effective control of the Collector during the reliefoperations. For each district, a Minister-in-charge is appointed to direct, supervise the review reliefactivities and assist the district administration in problem solving. The Minister-in-charge is alsorequired to submit a report as per the prescribed checklist to the Chief Minister.
22
The State Government also made one Secretary to the State Government incharge of a drought/disaster affected district, who is expected to visit the district under his charge once a fortnight andsubmit a report in the prescribed format covering all aspects of drought. For each village, a VillageLevel functionary is in charge of drought relief activities and has to report to the block controlroom, if there is any deficiency or difficulty in relief measures.
Control Rooms
Control rooms managed by senior officials are set up at State, District and Block levels, whichcontinuously function during the drought period. Control Rooms are responsible for collatingperiodical information on various relief activities from the field. The approach is to detect earlysignals of any emerging distress and initiate timely action to avert any crisis.
Drought monitoring and early warning
The India Meteorological Department (IMD), with the help of the Ministerial Crop Weather WatchGroup (CWWG), carries out a drought forecasting function at the national level. At the State level,Rajasthan has set up a Weather Watch Group (WWG) under the Chairmanship of the Relief Sec-retary having Director Agriculture, Director IMD, Hydrologist Irrigation Department and repre-sentative of PHED and Ground Water Department as members. This Group meets every Mondayduring the Monsoon season to monitor agro climatic parameters and help to provide early warningof drought onset. The data may, however, not be available for public use for months. The param-eters that are systematically monitored by the Group include:
• Rainfall Data: Tehsilwise rainfall data is received on a daily basis in the Relief Departmentfrom the District Collector, as well as the Hydrologist of the Irrigation Department. EachTehsil Headquarters is provided with a raingauge and the system of rainfall recording andreporting is laid down in the Land Revenue (Land Records) Rules 1957. The data is analyseddaily and the Tehsils having deficient/scanty rainfall compared to the normal, are identifiedand conveyed to Director Agriculture to take crop contingency measures. This data isdiscussed in detail in the Weather Watch Group every week and responses of variousdepartments are also decided. The IMD and Irrigation Department of the State also issuefortnightly rainfall reports.
• Water Levels in Reservoirs: The Irrigation Department monitors the water levels in allmedium and major reservoirs on a daily basis. The total quantity of water available in eachreservoir and water inflow during last 24 hours are also monitored.
• Crop Prospectus: The Land Revenue (Land Records) Rules of 1957 prescribe a detailedsystem of rainfall measurement, weekly assessment of crop condition, assessment at villagelevel and transmission of data to the Revenue Board and the Relief Department. TheDirectorate of Agriculture also has a system to monitor the sowing of crops, crop types,progress of agricultural operations and condition of crops. This information is discussedat the meeting of the WWG to assess the developing situation.
23
In addition to the above, there is an institution setup on the initiative of the Central Governmentin each State called Disaster Management Centre (DMC). The Centre is supposed to guide respectiveState governments in formulation of policies, disaster management plans State and district level),organize training programmes, etc. In Rajasthan, the DMC claims that they have prepared districtwise and state level disaster management plans. However, on review of those, it was found thatthey are just a standardized set of recommendations and do not reveal a specific understanding ofthe local problems and their mitigation.
State Response to Drought
Rural Development Programmes
Since Independence, a large number of Rural Development Programmes (RDP), such asinfrastructure development (roads, communication, electrification), market network, new croptechnology based on seed-fertilizer-irrigation inputs, and watershed development, were initiated withdifferent objectives of poverty reduction, drought mitigation and relief. These have significantlyhelped the population in drought prone areas. RDPs include:
• National Watershed Development Programme for Rainfed Areas (NWDPRA) and IntegratedWatershed Development Programme (IWDP)
• Drought Prone Area Development Programme (DPAP)
• Desert Development Programme (DDP)
• Employment Generation Programme (EGP)
• Rural Poverty Alleviation Programmes, including Individual Beneficiary Programmes, RuralInfrastructure Development, Tribal Area Development, Drinking Water Supply programs etc
Most initiatives, while undoubtedly useful, could have been more efficient if they recognizethe resource specifics in drought prone areas and relate them to the age-old adaptations and copingstrategies of the people. Similarly, generalized institutional programmes—like land reforms,community development, projects, panchayat systems etc.—were extended to these areas, withoutassessing their potential impacts on sub-marginal lands, common property resources and climaticuncertainty. Public relief strategies to help drought-affected people were designed and pushed tosuch a level that they have more or less displaced the people’s own adjustment mechanism andgenerated strong dependence on public relief. Irrigation facilities were developed in a few pockets,but used on crops requiring a lot of high water and in the areas well endowed with water. Marketintegration took place, but it had serious adverse impacts on the strategic self-provisioning systemand fragile resource base. Some initiatives (like the Drought Prone Area Program) followed adevelopment process suitable for better endowed areas. All this indicates the need for understandingand explicit consideration of specifics of drought prone areas in both development strategies anddrought management.
24
Undoubtedly, the State has made steady progress in poverty reduction. From 1987 onwards,there is a change in the structure of the economy, i.e., the share of the primary sector in net StateDomestic Product has gradually declined from 34.5% in 1987-88 to 32.8% in 2001-2002. The majorimpact of these efforts has been that during periods of serious droughts, large scale migration ofhuman and cattle population does not take place, the capacity of the system to respond to the needsof the population has increased, and a certain amount of resilience has also been developed to facethe challenge. Nevertheless, during periods of severe droughts, the population living below the povertyline (BPL), landless agricultural laborers, small and marginal farmers still require governmentsupport for provision of employment, fodder, drinking water etc.
Public Distribution System
The Public Distribution system (PDS) in India, which started as an ad-hoc war-time measure to mobilizefood supplies to prevent undue rise in price with a network of 47,400 outlets—the Fair Price Shops(FPS)—is now one of the largest systems in the world. The concept of PDS has evolved in the wakeof critical national level food shortages in the 1960s, as a major policy instrument to provide essentialcommodities to the people, particularly the weaker section of the society, on an assured and regularbasis at reasonable prices. It also works as an effective anti-inflationary measure and makes a significantcontribution in raising the nutritional standard of the poor. In the earlier period, PDS was consideredto be urban biased, but gradually the rural areas were well served by it. Radhakrishnan and Subbarao(1997) argues that the PDS has played a limited role in providing food grains access to the poor,despite having been in operation for four decades. The Impact of PDS on poverty and nutritionalstatus was assessed as minimal and at an exorbitant cost. On the contrary, Sagar (2003) argues thatPDS has proved to be the cornerstone of food security in Rajasthan, because FPS in rural Rajasthanaccount for over 76 % of the total 18,943 outlets in the State.
From a drought mitigation and management point of view, the PDS networks have played asignificant role in distribution of 17.45 million tones of foodgrain through its’ outlets all over India(Jharwal, 1999). The network is available for drought relief work and is effective in distribution ofessential commodities to drought affected population.
Food Assistance Programmes
Both Central and State Governments have initiated many meaningful programmes to increase accessto food. The most popular ones include: provision of 25 kg of wheat or rice at low prices to familiesbelow poverty line (BPL), allocation of 3 kg of foodgrains per child per month for school children inclasses between I and V, provision of two bags of wheat kept with village Sarpanch for free distribu-tion to a person or household in the village not having access to food and starving , etc.
The main shortcoming of these programmes is that they only target the poorest in the population.Apart from the BPL population, where chronic food shortages prevail, even households not normallydeprived of food are rendered vulnerable in the regions prone to droughts. In terms of social categorybased on caste and class distinctions, the general understanding is that scheduled tribes, agriculturallaborers, marginal and small farmers are the most vulnerable section. Not only actual food distress,but also even the threat of future food shortages can become a powerful instrument in shaping thebehavioral patterns of those affected by it. Children are the first affected by this distress, as theyare forced to join the labour force (Mathur and Jayal, 2003). Future policy and programmes shouldtake cognizance of these issues.

25
The other shortcoming of the State response is that it is relatively less sensitive to livestockissues. The State is neither supportive of people’s traditional strategy of animal migration nor ofbuilding buffer stocks of fodder. To build a fodder bank in the State, special steps should be takenduring a good agriculture year within Rajasthan, and by neighboring States together to providefodder at lower cost and stock it in areas where it is most needed.
The present policy of supplying water during drought needs drastic change, as it is neithereconomically feasible nor sustainable. The root of the problem lies in the depletion of groundwater,meeting more than 90 % of rural drinking water needs. It requires serious review of the Water Policyof the State (Rathore, 2003a).
26
Conclusions
Every year some parts of Rajasthan are affected by drought. But the State has failed so far to di-agnose the drought phenomenon and to come up with a longterm solution. Presently, relief is con-sidered to be the panacea for droughts. The main issues emerging for policy formulation and ac-tion are: (i) understanding the nature of drought, (ii) modifying perception and response to drought,and (iii) changing the approach from relief to mitigation of drought.
The other significant issue in drought mitigation and relief policy is identification of vulnerableareas and population. The present policies and programs bypass some of the most deserving andvulnerable areas and people. There is a need for transparent and non-political criterion foridentification of vulnerable areas and population. This will help target development programmesand drought relief to most deserving population and areas.
Declaration of drought is a sensitive issue. In the study, the politics of drought declaration wasdiscussed. The nature of drought is such that it does not occur in the same intensity across thestate and also has differential impacts. Unless this complexity is understood drought declarationwill always be a controversial and not transparent. The issues involved are: changing the criteriaand process of drought declaration, area to be declared as drought affected, and period for which itis declared. The issue is further complicated by the source and amount of funding required afterdrought declaration. As a large population and area is affected by drought, a large amount is neededfor drought relief work, which the State alone cannot support. Also, in the present political system,both State and Central governments are responsible for dealing with natural calamities. In addition,there have been different political parties ruling at State and Centre level with conflicting politicalagendas. Competition for votes in their respective constituencies affects drought mitigation and reliefpolicies. At the State level, drought declaration is guided by the age-old Famine Code and politicalconsiderations. At Central government level, financing of relief work has undergone several positivechanges, guided by the Finance Commission, but some element of politics always remains in releasingthe allotted funds. Current policy should ensure sufficient funds are always available with a Stateto deal with drought of any intensity. What is required is efficiency at State level by formulatingappropriate policies programmes and processes for addressing drought, keeping in mind the existingcoping strategies of rural population and status of the State’s natural resources.
The impact of drought is both direct and indirect on most of the economic and social parameters.Direct impacts are easy to identify and quantify, provided there is a system to address the issueseriously. Present data generation agencies and institutions are not sensitive to recurring drought inthe State. There is a need for consistent collection of data on livestock mortality, human migration,coping strategies, depletion of groundwater table, etc. These data are generally collected but noattempts are made to single out the drought impacts from other effects. The first attempt has beenmade in this study to measure, albeit in a preliminary manner, the impact of drought on agricultureproduction, livestock, employment, wages, water, etc. What is evident from the study is that impactvaries according to the intensity of drought, status of natural resources and economic strength ofthe people, built by past State development interventions.
Drought impact on food production in the State is negative. The number of vulnerable householdsis increasing and more people migrate. To stop them, more expenditure on relief work is incurred.Prices of foodgrain and wages are least affected by drought mainly because of the State and Centralgovernment economic policies of supporting prices.
The impact of drought on livestock is significant, but the State is less sensitive to this sourceof livelihood. Pastoralism is marginalized because the State does not consider it as a copingmechanism with the given natural resources and climatic risk. The present policy is to settle nomadie
27
pastoralists. Further, the State’s environmental framework considers this age-old activity to bedamaging to the environment. What has changed today is the balance between human, land, forest,water and animals. There is a need to deeply internalize this change before making any NRM policies.
Water is the key to all kinds of vegetative growth. To cope with drought, people have over-exploited groundwater mainly for food production and the situation is aggravating further, as rainfallacross the State is insufficient to recharge the falling groundwater levels. Strategies to deal withnatural drought may be known, but there is little experience in dealing with “human-made” drought—overexploitation of water resources. The State has a serious role to play in rectifying theseconditions.
The impact of drought is ultimately on the livelihoods of people in terms of reduced foodavailability, forced migration, depletion of fixed and movable assets, health and nutrition and socialmarginalization. Vulnerability will depend on the economic status of the household. Poverty studiescan contribute to quantifying the extent of vulnerable population in the State. As the poor will bethe most affected, there is a controversy in poverty statistics because of changes in definition andmethods of estimation. We have deliberately avoided using poverty estimates in this study, but it ishardly disputable that recurring droughts are, to a great extent, responsible for keeping the State inthe list of Poor States in the country.
The present policy of financing relief expenditure, guided by the recommendations of the FinanceCommission, seems to be a pragmatic and efficient in dealing with any kind of natural calamity.What is needed is minimizing the political element and also curb the tendency of State governmentto always look to the centre, rather than take long term measures to mitigate drought.
The impact of drought on the State budget is discussed in two parts; first the State’s overalleconomic condition in terms of sector-wise growth in State Domestic Product and relation withintensity of drought, and second, expenditure on drought relief and items / sectors. It is evidentthat the contribution of the agriculture sector has declined over the years and the share of industry,mining, etc., i.e. non-farm sectors, is increasing. The farm sector is more affected by drought andas the economy’s dependence on non-farm sector is increasing, the overall impact of drought isless felt. However, still more than 80% of the population is dependent on agriculture, thereforemost people are affected by droughts. There is a need to reduce people’s dependence on agricultureby diversification of occupation by creating more non-farm employment opportunities commensuratewith the capabilities of the people.
Budget deficit and public debt in the State are increasing. Most of the development programmesare externally funded. Relief expenditure analysis shows that it has increased many times mainlybecause of increased coverage of affected area and population. The itemwise details on reliefexpenditure show that expenditure on wage employment (relief work in affected villages), is themajor share and it varies each year based depending on intensity of drought. Fodder supply, tankerbased water supply and gratuitous relief expenditure are the other main items. Meeting drinkingwater needs of rural and urban population is going to be the major issue in the coming years, asthe present practices are likely to be unsustainable.
Finally, efficient management of drought will depend on the organisational structure and policiesof the State. There is a well-structured organisational structure to deal with drought, with involvementof politicians and bureaucrats, but no place for civil society and people in policy making or planningof drought mitigation. In the past few years, civil society has taken up a more proactive role andthe results were encouraging in terms of reduction in corruption in relief work and extending theperiod of relief work. The present policy of the State to deal with drought is of a ‘reactive’ (post-facto) action, rather than ‘pro-active’, by framing a long term drought mitigation policy, perhapswithin a system of larger-scope, arid land management policies. There is need for continuity in the
28
thinking about drought and drought policy, so that even a non-drought year can be used forundertaking mitigation measures.
Drought monitoring and management require more use of technology in advance prediction,monthly status of crop condition, health of water bodies, etc. The information so generated shouldalso be made public for people’s education, and accordingly devising coping strategies.
Initiation of rural development and poverty reduction programmes as a strategy to mitigatedrought or reduce the impact of drought did work partially, but needs to be revised in the contextof depleting natural resources. Poverty is multidimensional, therefore poverty reduction efforts haveto be multi-targeted. Creating long term employment opportunities for the rural poor in such adrought prone State as Rajasthan, should be the future strategy.
29
References
Bandyopadhyay, J. 1988. Water Scarcity: By Choice. Seminar. 346: 24-27.
Benson, C.; and Clay, E. 1998. The Impact of Drought on Sub-Saharan African Economies: A Preliminary Examina-tion. Technical paper No.401. Washington, D.C.: World Bank.
Directorate of Agriculture. 1999. Fifty years of Agricultural Development in Rajasthan Statistical section. Jaipur: PantKrishi Bhawan.
Directorate of Economics and Statistics. 2001. Basic statistics—Rajasthan. Jaipur.
Directorate of Economics and Statistics. 2002. Basic statistics—Rajasthan. Jaipur.
Food and Agricultural Organisation. 1988. Sustainable Development in Famine—Drought-Prone Areas: Approachesand Issues. Rome: FAO.
Government of India. 1995. Evaluation report on Revamped Public Distribution System—1993-94, Programme Evalu-ation Organisation. New Delhi: GOI.
Government of India. 2004. Drought–2002. New Delhi: Department of Agriculture and Cooperation, Ministry ofAgriculture.
Government of India. 1989. The drought of 1987: Responses and Management. Vol. I & II. New Delhi: Ministry ofAgriculture.
Government of India. 1985. A Model Manual for Drought Management Ministry of Agriculture. New Delhi:GOI.
Government of India. Planning Commission. 1980. Evaluation of Food for Work Programme. August-October, 1979.
Government of Rajasthan. Relief Department. 1988. Memorandum on Scarcity and Additional Requirement to July1988.
Government of Rajasthan. Drought Prone Area Programme: Draft Annual Plan 1983-84 and 1984-85 Rajasthan.pp. 48.
Jharwal, S.M. 1999. Public Distribution System in India. New Delhi: Manak Publication Pvt. Ltd.
Khan, Y. 1988. Climate and Dryland Ecology. Rawat Publications. Jaipur and New Delhi: 1988.
Mathur, K.; and Jayal N.G. 1993. Drought, Policy and Politics in India—The need for a long-term perspective. NewDelhi: Sage Publications.
Planning Commission India. 1994. Report of the Technical Committee on Drought Prone Areas Programme and DesertDevelopment Programme. Indian Journal of Agricultural Economics. 69(4):624.
Rathore, M.S. 2003a. Pro-Poor and Gender Sensitive State Water Policy—NGO’s Perception on Water ResourceManagement in Rajasthan submitted to UNDP, New Delhi.
Rathore, M.S. 2003b. Community Based Management of Ground Water Resources: A Case Study of Arwari RiverBasin. British Geological Survey. Wallingford. U.K.
Rathore, M.S. 2004. Adaptive Strategies to Droughts in Rajasthan. Jaipur: Institute of Development Studies.
Radhakrishna, R.; and K. Subbarao. 1997. India Public Distribution System—A National and InternationalPerspective. World Bank Discussion Paper No. 380. Washington, D.C.: The world Bank.
Sagar, V. 2003. Food Security Issues in a State of Large Agricultural Instability: Rajasthan. IDSJ Working Paper No.128. Jaipur: Institute of Development Studies.
Taylor, J.G. 1987. Perception of Drought in the Ogallala Aquifer Region of the Western U.S. Great Plains in WilhiteDA et al.(eds). Planning for Drought–Toward a Reduction of Societal Vulnerability. UNEP. PP. 409-421.
ISBN: 92-9090-593-X
SM
IWMI is a Future Harvest Centersupported by the CGIAR
Postal Address:P O Box 2075ColomboSri Lanka
Location:127, Sunil MawathaPelawattaBattaramullaSri Lanka
Tel:+94-11 2787404
Fax:+94-11 2786854
E-mail:[email protected]
Website:http://www.iwmi.org
I n t e r n a t i o n a lWater ManagementI n s t i t u t e