Embed Size (px)
Citation preview

1
Drug delivery systems to include
liposomes and microparticles in order to
aid treatment of glioma
By
Neha Parkar
A thesis submitted in partial fulfilment for the requirements for the degree of MPhil at
the University of Central Lancashire
November 2010

2
DECLARATION
I declare that while registered as a candidate for this degree I have not been registered as
a candidate for any other award from an academic institution. The work present in this
thesis, except where otherwise stated, is based on my own research and has not been
submitted previously for any other award in this or any other University.
Signed
Neha Parkar

3
ABSTRACT
Targeted drug delivery is achieved by enhancing drug availability at the response site
while minimising its availability at other sites, especially those that manifest toxicity.
The effects of liposomes and polymeric nanoparticles in cancer chemotherapy have
been investigated in recent years and there have been some interesting outcomes
resulting in improved survival rates of the patients. Thus, the present study was carried
out to investigate the effect of encapsulating TMZ and Patrin-2 into liposomes and
microparticles separately in order to enhance the delivery.
A validated HPLC system was used for the analysis of both TMZ and Patrin-2. First
phase of our study involved the preparation of a delivery system of TMZ and Patrin-2
through liposomes in order to enhance the treatment of glioma. It involved the
application of freeze-thaw and dehydration-rehydration methods to encapsulate the
TMZ into liposomes. However, the desired encapsulation efficiency (EE %) of TMZ
was not achieved using these methods, the maximum entrapment achieved with
freeze-thaw method was 11.54 ± 0.70 % while for dehydration-rehydration method was
26.69 ± 0.34 %. Therefore the second phase focussed on preparing polymeric
microparticles for continuous delivery of intact TMZ and Patrin-2 using the spray dry
method. The maximum entrapment achieved using this method for TMZ was 64.32 ±
2.58 % while the maximum entrapment achieved for Patrin-2 was 68.47 ± 1.47 %, thus,
this technique was found to be successful for the preparation of both TMZ and Patrin-2
loaded PLGA microparticles. Furthermore the release study of both TMZ and Patrin-2
was investigated using dispersion and dialysis methods. TMZ and Patrin-2 showed an
initial burst release, however TMZ later showed decrease in concentration over the
period of time while Patrin-2 showed a slow release with an increase in concentration.

4
This novel study aids in comparing various methods used for investigating the
preparation of TMZ loaded liposomes, and TMZ and Patrin-2 loaded microparticles. In
preparation of liposomes based on this research dehydration-rehydration was found to
be a more efficient method than the freeze-thaw method for encapsulating TMZ, while
the spray dry method was found to be more effective than the emulsifying solvent
evaporation method in obtaining the maximum EE % for TMZ and Patrin-2 for
preparation of microparticles. The release profiles of TMZ and Patrin-2 from the
microparticles was studied using the dispersion method and the dialysis bag diffusion
technique however due to tome being the limited factor the technique could not be
explored completely.

5
CONTENTS
Declaration .................................................................. ..................................................2
Abstract ....................................................................................................................... 3
Contents....................................................................................................................... 5
List of Figures .............................................................................................................. 9
List of Tables ............................................................................................................. 11
Acknowledgements .................................................................................................... 14
Abbreviations ............................................................................................................ 16
CHAPTER 1 Introduction ....................................................................................... 19
1.1 Glioma ............................................................................................................. 20
1.2 Temozolomide ................................................................................................ 21
1.3 Patrin-2 ............................................................................................................ 25
1.4 Liposomes ........................................................................................................ 28
1.4.1 Applications of Liposomes ......................................................................... 30
1.4.2 Drug interaction with liposome .................................................................. 31
1.4.3 Phospholipids ............................................................................................ 33
1.4.3.1 Lα-phosphatidylcholine ........................................................................ 36
1.4.3.2 1,2-distearoyl-sn-glycerol-3-phosphocholine (DSPC) and
1,2-dimyristoyl-sn-glycerol-3-phohsphocholine (DMPC) ........................... 37
1.4.3.3 Lecithin derived from Soyabean ........................................................... 38
1.4.3.4 Phospholipon ® 90 H. .......................................................................... 39
1.4.3.5 Cholesterol and Stearic acid.................................................................. 40
1.4.4 Techniques used in the current study for formation of liposomes ............... 41
1.5 Microparticles.....................................................................................................42
1.5.1 Applications of microparticles ................................................................... 44
1.5.2 Poly (d,l-lactide-co-glycolide) (PLGA)........................................................45
1.5.3 Techniques used in the current study for formation.....................................47
1.5.4 Dissolution techniques used for determination of drug release from the
PLGA microparticles...............................................................................................48
1.5.5 Particle size analysis....................................................................................49
1.6 High Performance Liquid Chromatography (HPLC)..........................................51

6
1.7 The main research questions and aims .............................................................. 54
1.7.1 Main aim ................................................................................................... 54
1.7.2 Specific aims of the research ...................................................................... 55
CHAPTER 2 Materials and Methods ..................................................................... 56
2.1 Materials .......................................................................................................... 57
2.2 Equipments ...................................................................................................... 59
2.3 HPLC methods ................................................................................................. 60
2.3.1 HPLC instrumentation ................................................................................ 60
2.3.1 HPLC column............................................................................................. 61
2.3.3 Validation of HPLC system ........................................................................ 61
2.3.3.1 Selection of Mobile phase ..................................................................... 61
2.3.3.2 Stock solution ....................................................................................... 62
2.3.3.3 Calibration curve (linearity testing of the HPLC system)....................... 62
2.3.3.4 Repeatability (Intraday analysis).. ......................................................... 62
2.3.3.5 Reproducibility ..................................................................................... 63
2.3.3.6 Limit of detection (LOD) and Limit of quantification (LOQ) ................ 63
2.4 Stability test of TMZ and Patrin-2 .................................................................... 63
2.4.1 Standard solution ....................................................................................... 63
2.4.2 Compatibility test of the two drugs TMZ and Patrin-2 ............................... 64
2.5 To develop liposomal preparation of TMZ ....................................................... 64
2.5.1 Freeze-thaw method .................................................................................. 64
2.5.2 Dehydration-rehydration method ............................................................... 65
2.5.3 Determination of EE % .............................................................................. 65
2.6 Methods used for preparation of PLGA microparticles ..................................... 66
2.6.1 Emulsifying-solvent evaporation method ................................................... 66
2.6.2 Determination of EE % of the TMZ loaded PLGA microparticles .............. 67
2.6.3 Spray drying method ................................................................................. 68
2.6.3.1 The preparation of TMZ loaded PLGA microparticles and Patrin-2 loaded
PLGA microparticles.......................................................................................... 68
2.6.3.2 Determination of EE % of TMZ and Patrin-2 loaded PLGA
microparticles..................................................................................................... 69
2.7 Particle size analysis of liposome and microparticles ........................................ 70

7
2.7.1 Particle size analysis of liposome using the mastersizer ............................. 70
2.7.2 Particle size analysis of microparicles using the scanning electron
microscopy (SEM).................................................................................................71
2.8 Dissolution techniques ..................................................................................... 72
2.8.1 Dispersion method used for determination of release of TMZ and Patrin-2
from the PLGA microparticles ........................................................................... 72
2.8.2 Dialysis bag method used for determination of release of TMZ and Patrin-2
from the PLGA microparticles ........................................................................... 73
2.9 Statistical analysis ............................................................................................ 74
CHAPTER 3 Results ................................................................................................ 75
3.1 HPLC methods for TMZ and Patrin-2 analysis ................................................. 76
3.1.1 Linearity testing.............................................................................................77
3.1.2 Repeatability .............................................................................................. 79
3.1.3 Reproducibility...............................................................................................80
3.1.4 Limit of detection ....................................................................................... 81
3.1.5 Limit of quantification ................................................................................ 82
3.2 Stability test for TMZ and Patrin-2 ................................................................... 84
3.2.1 Compatibility test of TMZ and Patrin-2 carried out in mixture of PBS and
ethanol................................................................................................. ......................84
3.2.2 Dry sample reaction carried out for the determination of compatibility of
TMZ and Patrin-2..................................................................................................89
3.3 Results of attempted preparations of various liposome formulations using TMZ
as the active compound .......................................................................................... 90
3.3.1 Freeze-Thaw method ................................................................................. 90
3.3.2 Dehydration-rehydration method ............................................................... 93
3.3.3 A comparison between freeze-thaw and dehydration-rehydration methods
used for the preparation of TMZ loaded liposomes ............................................. 96
3.4 Preparation of PLGA microparticles using two procedures ............................... 97
3.4.1 Emulsifying solvent evaporation method ................................................... 97
3.4.2 Spray dry method ...................................................................................... 98
3.5 Particle size analysis of liposome and microparticles ...................................... 100
3.5.1 Particle size analysis of liposome using the mastersizer ........................... 100
8
3.5.2 Particle size analysis of liposome using the Scanning Electron microscopy
(SEM).......................................................................................................................101
3.6 Dissolution techniques ................................................................................. ...103
3.6.1.1 Dispersion Method used for determining the release of TMZ from the
PLGA microparticles................................................................................................103
3.6.1.2 Dispersion Method used for determining the release of Patrin-2 from
PLGA microparticles......................................................................................106
3.6.2 Dialysis Bag Method used for determining the release of TMZ and Patrin-2
from PLGA microparticles...............................................................................109
CHAPTER 4 Discussion ........................................................................................ 110
4.1 Validation of HPLC system ............................................................................ 111
4.2 Stability test of TMZ and Patrin-2 .................................................................. 111
4.3 Attempted preparation of various liposome formulation of TMZ using Freeze-
Thaw and Dehydration and Rehydration method. ................................................. 112
4.4 Preparation of PLGA microparticles using two different methods................... 115
4.5 Particle size analysis of liposomes and microparticles .................................... 117
4.6 Dissolution techniques ................................................................................... 118
4.6.1 Dispersion method used for determination of release of TMZ and Patrin-2
from the PLGA microparticles..............................................................................118
4.6.2 Dialysis Bag Method used for determination of release of TMZ and Patrin-2
from the PLGA microparticles..............................................................................121
Conclusion..................................................................................................................123
Future Prospects........................................................................................................125
References .............................................................................................................. 127
Appendix ................................................................................................................ 143

9
LIST OF FIGURES
Figure 1.1 Chemical structure of Temozolomide with a single highly reactive site .... 21
Figure 1.2 Mechanism of action of TMZ above pH 7 ................................................ 22
Figure 1.3 DNA methylation sites ............................................................................. 23
Figure 1.4 Use of Liposome and microparticles as drug carriers improves the effect of
molecular active substances ....................................................................................... 25
Figure 1.5 Chemical structure of Patrin-2 ................................................................. 26
Figure 1.6 Action of TMZ and Patrin-2 causing MGMT and other DNA repair
mechanisms to deal with DNA damage caused due to methylation of the TMZ, in
human cells ................................................................................................................ 27
Figure 1.7 Representation of the structure of liposome encapsulating a drug ............. 30
Figure 1.8 Types of the drugs and site of their incorporation into liposomal vesicles . 32
Figure 1.9 Chemical structure of Phospholipid .......................................................... 33
Figure 1.10 The structure of Lα-phosphatidylcholine along with its fatty acid
composition ............................................................................................................... 36
Figure 1.11 The structure of DSPC and DMPC ......................................................... 37
Figure 1.12 The structure of Lecithin along with its fatty acid composition ............... 38
Figure 1.13 The structure of Phospholipon ® 90 H along with its fatty acid
composition ............................................................................................................... 39
Figure 1.14 The structures of (a) cholesterol and (b) stearic acid ............................... 40
Figure 1.15 An illustration of particle size analyser ................................................... 42
Figure 1.16 Representation of the structure of PLGA nanoparticle encapsulating
a drug......................................................................................................................... 44
Figure 1.17 Representation of the structure of PLGA ................................................ 46
Figure 1.18 Functional principle of the drying air ...................................................... 47
Figure 1.19 Schematic diagram of scanning electron microscopy .............................. 50
Figure 1.20 Schematic diagram of HPLC .................................................................. 53
Figure 2.1 High Performance Liquid Chromatography coupled with UV detector used
for sample analysis..................................................................................................... 60
Figure 2.2 Mini Spray Dryer used for preparation of microparticles .......................... 69
Figure 2.3 Mastersizer 2000 used for particle size analysis... ..................................... 71
Figure 2.4 Scanning electron microscopy (SEM) used for particle size analysis..........72
10
Figure 2.5 Preparation of the dialysis chamber to set the reaction................................74
Figure 3.1 Calibration curve for TMZ and Patrin-2 ................................................ ...78
Figure 3.2 HPLC chromatogram for the compatibility of TMZ and Patrin-2 at a concentration
of 0.05 mg/ml (a) TMZ Standard solution in mobile phase (n = 3), (b) Patrin-2 standard
solution in acetonitrile (n = 3) and (c) TMZ and Patrin-2 mixture in PBS and ethanol (ratio
8:2) solution stored for 288 hr at 37°C (n = 3)..........................................................................89
Figure 3.3 Comparison between Freeze-Thaw and Dehydration-Rehydration
method ....................................................................................................................... 96
Figure 3.4 Spray dry method. .................................................................................... 99
Figure 3.5 Particle size distribution. ........................................................................ 100
Figure 3.6 Particle size analysis...................................................................................102
Figure 3.7 Release pattern of TMZ from PLGA microparticles..................................105
Figure 3.8 Release pattern of Patrin-2 from PLGA microparticles ......................... .108

11
LIST OF TABLES
Table 2.1 Materials used in this study ........................................................................ 57
Table 2.2 Equipment used in this study................................................................. .....59
Table 3.1 Linearity testing of TMZ and Patrin-2. Data values are the average of
n = 3...............................................................................................................................77
Table 3.2 The repeatability results for TMZ and Patrin-2 at a concentration of 0.02
mg/ml. The mean of the 6 samples was calculated from which the SD and RSD values
are obtained...................................................................................................................79
Table 3.3 The reproducibility results for TMZ and Patrin-2 at a concentration of 0.02
mg/ml. The mean of the 6 samples was calculated from which the SD and RSD values
are obtained.Data are the average of n = 3....................................................................80
Table 3.4 Limit of detection for TMZ and Patrin-2. Data values are the average of
n=3................................................................................................................................81
Table 3.5 Limit of quantification of TMZ and Patrin-2 at a concentration of 7.81 µg/ml
was injected 6 times. The mean of the 6 injections was calculated from which the SD
and RSD values are obtained ...................................................................................... 82
Table 3.6 A summary of the parameters used to validate the analytical HPLC method
for TMZ and Patrin-2 ................................................................................................. 83
Table 3.7 The results for the stability of TMZ at a concentration of 0.05 mg/ml in PBS
and ethanol (ratio 8:2) solution stored for (a) 72 hr (B) 288 hr at three different
temperatures. The analysis of these samples was carried out using HPLC with mobile
phase (35% acetonitrile consisting of 10 mM TBAA, 10 mM SDS and 25 mM citric
acid). Data values are the average of n=3 ....................................................................85
Table 3.8 The results for the stability of Patrin-2 at a concentration of 0.05 mg/ml in
PBS and ethanol (ratio 8:2) solution stored for (a) 72 hr (B) 288 hr at three different
temperatures.. The analysis of these samples was carried out using HPLC with mobile
phase (35% acetonitrile consisting of 10 mM TBAA, 10 mM SDS and 25 mM citric
acid). Data values are the average of n=3....................................................................86

12
Table 3.9 The results for the compatibility of TMZ and Patrin-2 at a concentration of
0.05 mg/ml in PBS and ethanol (ratio 8:2) solution stored for (a) 72 hr (B) 288 hr at
three different temperatures. The analysis of these samples was carried out using HPLC
with mobile phase (35% acetonitrile consisting of 10 mM TBAA, 10 mM SDS and 25
mM citric acid). Data values are the average of n=3 ................................................... 87
Table 3.10 The results testing the compatibility of TMZ and Patrin-2 at a concentration
of 0.05 mg/ml in PBS and ethanol solution. The analysis of this sample was carried out
using HPLC with mobile phase (35% acetonitrile consisting of 10 mM TBAA, 10 mM
SDS and 25 mM citric acid). Data values are the average of n=3 ............................... .90
Table 3.11 Entrapment efficiency of TMZ loaded liposomes using different
phospholipids using the Freeze-Thaw method. Data values + standard deviation,
n=3. ........................................................................................................................... 91
Table 3.12 Entrapment efficiency of TMZ loaded liposome with a combination of
phospholipon 90 H and cholesterol and a combination of Lα-phosphatidylcholine and
cholesterol using the freeze-thaw method. Data values + standard deviation, n=3...... .92
Table 3.13 Entrapment efficiency achieved from TMZ loaded liposome with
phospholipids in combination with cholestrol using the Dehyration-Rehydration
method. Data values + standard deviation, n=3 .......................................................... 93
Table 3.14 Entrapment efficiency achieved from TMZ loaded liposome with
phospholipids in combination with cholestrol using the Dehyration-Rehydration
method. Data values +standard deviation, n=3. .......................................................... 94
Table 3.15 Entrapment efficiency achieved from TMZ loaded liposome with
phospholipids mentioned in the table below in combination with stearic acid using the
Dehyration-Rehydration method. Data values + standard deviation, n=3 .................... 95
Table 3.16 The entrapment efficiencies achieved when TMZ was used to prepare
PLGA microparticles using the emulsifying solvent evaporation method and varying the
MW of PLGA. The PLGA with a MW of 1.7 × 10⁴ Da showed the maximum
entrapment with TMZ. Data values +standard deviation, n=3 ............................ .........97
Table 3.17 The entrapment efficiency obtained from TMZ loaded PLGA microparticles
and Patrin-2 loaded PLGA microparticles by varying the MW of PLGA using the Spray
Dry method with PLGA of MW 1.7 × 10⁴ Da showed the maximum entrapment with
TMZ. Data values +standard deviation, n=3 ............................................................... 98

13
Table 3.18 From HPLC analysis TMZ release from PLGA microparticles was detected
and from the peak area obtained the cumulative mass and cumulative % release was
calculated. Data values are the average of n=2 ......................................................... 104
Table 3.19 Patrin-2 released from PLGA microparticles was detected and from the peak
area obtained the cumulative mass and cumulative % release was calculated. Data
values are the average of n=2 .................................................................................. .107

14
ACKNOWLEDGEMENTS
In the name of the almighty “ALLAH”
It would not have been possible to write this M.Phil thesis without the help and support
of the kind people around me, to only some of whom it is possible to give particular
mention here.
This thesis is dedicated to my father Gulam Dastagir Parkar, who taught me that the best
kind of knowledge to have is that which is learned for its own sake. It is also dedicated
to my mother Shahida Parkar, who taught me that even the largest task can be
accomplished if it is done one step at a time. Without their encouragement and
understanding it would have been impossible for me to finish this work. My special
gratitude is due to my brother, my sisters and their families for their loving support. My
loving thanks are due to my 3 nieces Iffah, Adina and Sana.
In the first instance I would like to express my deep and sincere gratitude to my
supervisor, Dr. Leroy Shervington for his enthusiasm, his inspiration, and his great
efforts to explain things clearly and simply. He has helped to make this research fun for
me. It was only due to his valuable guidance, support, great understanding and ever-
friendly nature that I was able to complete my research work in a respectable manner. It
has been a distinct privilege for me to work under his supervision.
I wish to express my warm and sincere thanks to Dr. Amal Shervington for her valuable
support and advice on both academic and a personal level, for which I am extremely
grateful.
My sincere thanks are due to Prof. Jai Paul Singh and Dr. Abdelbary Elhissi for their
help and support for this study.
15
I would also like to express my gratitude to my colleagues in Room MB212; Seema
Jaiswal, Mayur Gawde, Shweta Kamble and Pooja Babar for the many discussions we
had, be they research-related or not, were often the occasion for new discoveries and
always truly agreeable moments. They have always maintained a great working
atmosphere with no end of fun, advice, as well as good moral support.
During this work I have collaborated with many colleagues for whom I have great
regard, and I wish to extend my warmest thanks to all those who have helped me with
my work in the Department of Pharmacy and Biomedical Sciences. I would especially
like to thank James Donnelly for giving valuable knowledge about HPLC. I would like
to acknowledge the financial, academic and technical support of the University Central
Lancashire. The library facilities of the University have been indispensable.
This thesis would never have taken shape without the inspired problem solving of
Mayur Gawde and the detailed review, constructive criticism and excellent advice by
Shantaram Muthaye, Paresh Patel and Nirav Nagda during the preparation of this thesis.
Without friends, life as an international student would not be the same. As I got to know
few of the closest people I have been with in these years, I would like to thank Shweta
Naik, Zarine Khan (for the delicious food), Sukhmander Kaur and Chinmay Munje for
helping me get through the difficult times, and for all the emotional support,
entertainment, and caring they provided.
"If A equals success, then the formula is: A = X + Y + Z, X is work. Y is play. Z is keep
your mouth shut." Albert Einstein

16
LIST OF ABBREVIATIONS
4BTG
O6-(4-bromothenyl) guanine
(Patrin-2)
AIC 5-aminoimidazole-4-carboxamide
AP
Apurinic/Apyrimidinic
ATase
Alkyltransferase
BCNU
Carmustine
BER
Base Excision Repair
CCNU
Lomustine
Da Dalton
DMPC 1,2-distearoyl-sn-glycerol-3-phosphocholine
DNA
Deoxyribonucleic acid
DSPC 1,2-dimyristoyl-sn-glycerol-3-phosphocholine
EE % Encapsulation Efficiency
GA Glycolide
GUVs Giant Unilamellar Vesicles
HPLC High Performance Liquid Chromatography
hr Hour
LOD Limit of Detection
LOQ Limit of Quantification
LUVs Large Unilamellar Vesicles
MGMT
O6-methylguanine-DNA methylltransferase
min Minute
MLVs Multilamellar Vesicles
MMR Mismatch Repair
17
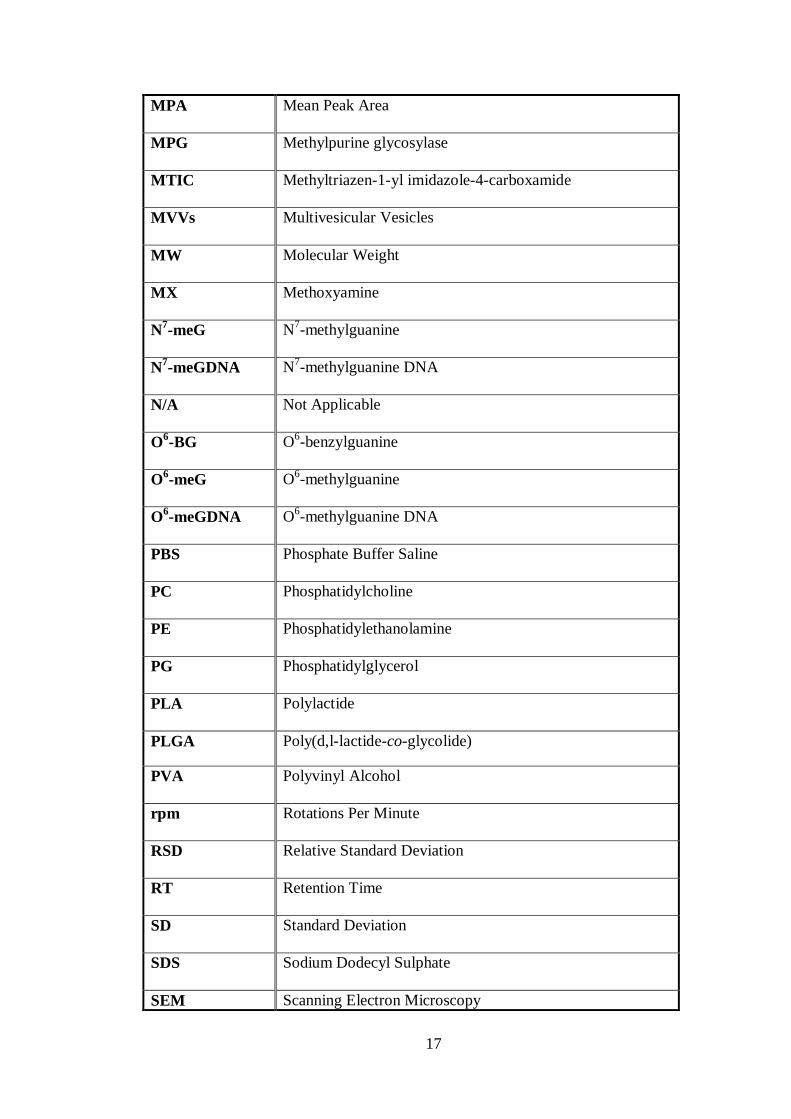
MPA Mean Peak Area
MPG
Methylpurine glycosylase
MTIC
Methyltriazen-1-yl imidazole-4-carboxamide
MVVs Multivesicular Vesicles
MW Molecular Weight
MX Methoxyamine
N7-meG
N7-methylguanine
N7-meGDNA
N7-methylguanine DNA
N/A Not Applicable
O6-BG
O6-benzylguanine
O6-meG
O6-methylguanine
O6-meGDNA
O6-methylguanine DNA
PBS Phosphate Buffer Saline
PC Phosphatidylcholine
PE Phosphatidylethanolamine
PG Phosphatidylglycerol
PLA Polylactide
PLGA Poly(d,l-lactide-co-glycolide)
PVA Polyvinyl Alcohol
rpm Rotations Per Minute
RSD Relative Standard Deviation
RT Retention Time
SD Standard Deviation
SDS Sodium Dodecyl Sulphate
SEM Scanning Electron Microscopy

18
SUVs Small Unilamellar Vesicles
TBAA Tetrabutylammonium Acetate
TMZ
Temozolomide
UDP Unidentified Product
ULVs Unilamellar Vesicles
USP United States Pharmacopoeia
WHO
World Health Organization

19
CHAPTER 1
INTRODUCTION
20
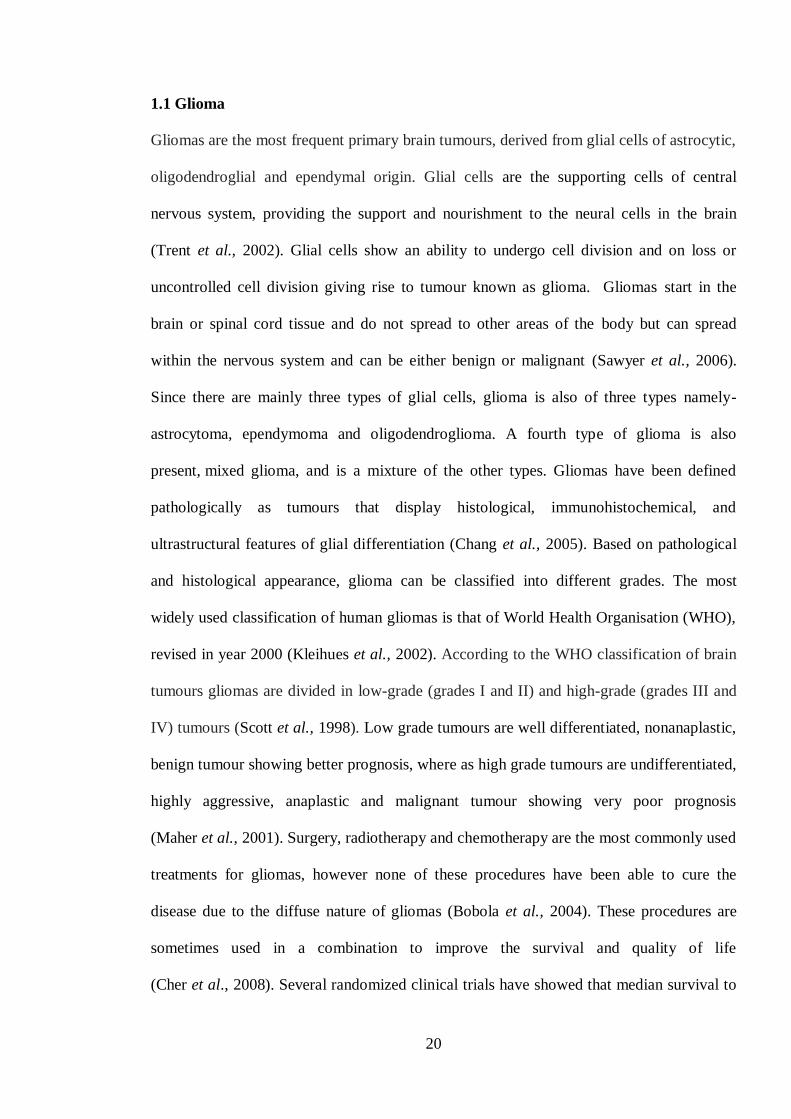
1.1 Glioma
Gliomas are the most frequent primary brain tumours, derived from glial cells of astrocytic,
oligodendroglial and ependymal origin. Glial cells are the supporting cells of central
nervous system, providing the support and nourishment to the neural cells in the brain
(Trent et al., 2002). Glial cells show an ability to undergo cell division and on loss or
uncontrolled cell division giving rise to tumour known as glioma. Gliomas start in the
brain or spinal cord tissue and do not spread to other areas of the body but can spread
within the nervous system and can be either benign or malignant (Sawyer et al., 2006).
Since there are mainly three types of glial cells, glioma is also of three types namely-
astrocytoma, ependymoma and oligodendroglioma. A fourth type of glioma is also
present, mixed glioma, and is a mixture of the other types. Gliomas have been defined
pathologically as tumours that display histological, immunohistochemical, and
ultrastructural features of glial differentiation (Chang et al., 2005). Based on pathological
and histological appearance, glioma can be classified into different grades. The most
widely used classification of human gliomas is that of World Health Organisation (WHO),
revised in year 2000 (Kleihues et al., 2002). According to the WHO classification of brain
tumours gliomas are divided in low-grade (grades I and II) and high-grade (grades III and
IV) tumours (Scott et al., 1998). Low grade tumours are well differentiated, nonanaplastic,
benign tumour showing better prognosis, where as high grade tumours are undifferentiated,
highly aggressive, anaplastic and malignant tumour showing very poor prognosis
(Maher et al., 2001). Surgery, radiotherapy and chemotherapy are the most commonly used
treatments for gliomas, however none of these procedures have been able to cure the
disease due to the diffuse nature of gliomas (Bobola et al., 2004). These procedures are
sometimes used in a combination to improve the survival and quality of life
(Cher et al., 2008). Several randomized clinical trials have showed that median survival to

21
be longer with radiation and chemotherapy (Sandberg-Wollheim et al., 1991). The most
commonly used drugs in chemotherapy include Temozolomide (TMZ), Carmustine
(BCNU), and a three drug combination of Procarbazine, Lomustine (CCNU) and
Vincristine, together abbreviated as (PCV) (Westphal et al., 2003; Stupp et al., 2005).
1.2 Temozolomide
TMZ is an oral alkylating agent which has a single highly reactive site (Fig. 1.1). It can
readily cross the blood brain barrier (Newlands et al., 1992; Darkes et al., 2002), and
has proved to be active against variety of tumour type in vitro as well as in vivo. Due to
its acid-stability and lipophilic character, TMZ taken orally has a bioavailability of
≈100% (Darkes et al., 2002).
N
N
N
N
N
H3C
NH2
O
O
2
3
4
5
6
1
Figure 1.1 Chemical structure of Temozolomide with a single highly reactive site (The
chemical structure was drawn using the chemdraw ultra 12.0 software).
TMZ is a modified form of imidazotetrazinones and is also chemically associated to
dacarbazine and is the 3-methyl derivative of an anticancer drug mitozolomide
(Newlands et al., 1997). TMZ is found to be unstable above pH 7 and is instantaneously
hydrolysed to methyltriazen-1-yl imidazole-4-carboxamide (MTIC) (Lowe et al., 1992).
Assimilation in the intestine results in the electropositive carbonyl at C4 position
located in the tetrazinone ring in TMZ being disposed to nucleophilic attack by water

22
(Denny et al., 1994). The resulting ring cleavage with the loss of carbon dioxide leads to
the development of methyltriazen-1-yl imidazole-4-carboxamide (MTIC) which then
undergoes further break down to an inactive carboxylic acid derivative,
5-aminoimidazole-4-carboxamide (AIC), and a highly reactive methyldiazonium ion
(Fig. 1.2) (Clark et al., 1995). The methyldiazonium ion methylates guanine residues in
guanine-rich regions (Friedman et al., 1998). Methylation at the O6
position of guanine
in genomic DNA is an important step as damage caused by methylation at guanine O6
are usually repaired by the enzyme O6-methylguanine-DNA methyltransferase (MGMT)
(Fig. 1.3). Each time a DNA lesion is repaired one molecule of the MGMT enzyme goes
into a non-functional state (Margison et al., 2005). If TMZ is taken on a regular basis
the repair protein is eradicated each time and more damaging DNA lesions will be
amassed (Friedman et al., 1998).
N
NN
NN
CH3
H2N
O
O
N
NH
O
NH
N
N
HN
N
NHO
H2N
H2N
AIC
+ CH3N+2
Temozolomide
Chemical conversion at Phsiological pH
MTIC
Figure 1.2 Mechanism of action of TMZ above pH 7 (The chemical structure was drawn using the chemdraw ultra 12.0 software).

23
Many brain cancer types do not express the MGMT enzyme (Friedman et al., 1998).
However, certain types of cell lines and xenografts express high concentrations of the
MGMT enzyme and show resistance to TMZ exposure (Brada, 2002). Damage occurs
due to mutation and those that cannot be repaired by MGMT are identified by mismatch
repair (MMR) enzymes, which recover the mismatch caused in the daughter strand by
removing the thymine base from O6-methylguanine (O
6meg): thymine base pairs.
However, MMR enzymes are not always successful in performing their task and
eventually cause breaks and nicks in the daughter strands (Hirose et al., 2001). This
event leads cell arrest at the G2/M phase prior to apoptosis. TMZ, similar to other
alkylating agents have an effective antitumour activity for the replicating cells
(D’Atri et al., 1998; Darkes et al., 2002).
N
N
O
H2N O
HN
NH2
N
N
N
dR
GuaninedRCytosine
N
N
O
O NH2
N
N
N
N
dR
dR
H3C
AdenineThymine
(and 2 phosphodiester stereoisomers)
DNA methylation sites
Figure 1.3: DNA methylation sites (The chemical structure was drawn using the chemdraw
ultra 12.0 software).
24
The three main DNA repair mechanisms responsible for TMZ resistance are: elevated
intracellular levels of MGMT; a deficient mismatch repair process (MMR); and base
excision repair pathway (BER) with activation of the poly (ADP)-ribose polymerase
protein (Tentori et al., 1997). Primary resistance to TMZ is directly correlated to high
MGMT levels but in MGMT-deficient cells, low or deficient MMR protein levels
become important in conferring resistance (Darkes et al., 2002). One of the ways of
enhancement of TMZ activity is by direct inactivation of ATase. From previous studies,
ATase inactivator O6-(4-bromothenyl) guanine (4BTG, also known as Patrin-2) used in
in vivo studies as a pre-treatment to the mouse melanoma model has shown to improve
the antitumor effect of TMZ without any additional toxicity (Brock et al., 1998).
TMZ, despite its advantages also shows limitations in its use as an anticancer reagent.
TMZ is found to develop unusual cardiomyopathy, acute toxicity which leads to
myelosuppression and oral ulcerations when it binds to the site other than the target site
(Huang et al., 2008). In order to prevent these consequences and to obtain better
efficacy, it is important to develop a treatment that enables the drug to reach directly to
the site of action (Yang et al., 1999). Studies have shown that the use of colloidal
substances such as microemulsions, liposomes, niosomes and polymeric nanoparticles
as drug carriers have significantly helped to overcome these drawbacks such as acute
and chronic toxicity or low stability by decreasing the number of dosage of the drug
(Muller et al., 2000; Huang et al., 2008). Furthermore, liposome and microparticles also
help to attain controlled release of TMZ (Allen and Cullis, 2004). Thus one of the main
aims of this study is to prepare a delivery system of TMZ in order to decrease its
toxicity and side effects (Fig. 1.4) (Menei et al., 1996; Menei et al., 1997). TMZ is
usually required in high doses to attain the therapeutic brain levels because of its short
half life that is 1.8 hr in plasma (Reni et al., 2004; Zhang and Gao, 2007). Thus,

25
resulting insufficient doses reaching the target site. These problems could be overcome
to some degree by use of liposomes or microparticles for the drug delivery as their use
reduces the high amount of temozolomide intake in the body which is the reason of side
effects (Ostro, 1983; Moghimi and Davis, 1994).
Figure 1.4 Use of liposome and microparticles as drug carriers improves the effect of molecular
active substances (Modified from http://ubm.opus.hbz-nrw.de/volltexte/2009/1880/pdf/diss. pdf).
1.3 Patrin-2
In order to further enhance the TMZ activity there is a need to use a drug/substrate
which would support its mechanism of action and increase the sensitivity of
chemotherapy. Patrin-2 is a compound that has recently been introduced into clinical
studies (Turriziani et al., 2006). Patrin-2 is a non-hazardous pseudo substrate with
low-molecular weight and has the ability of inactivating MGMT (Fig. 1.5)
(Khan et al., 2008). Patrin-2 has also proved to be better tolerated than
O6-benzylguanine (O
6-BG) derivative (Bobola et al., 2005; Woolford et al., 2006).

26
S
O
N
NNH
N
Br
H2N
Figure 1.5 Chemical structures of Patrin-2 (The chemical structure was drawn using the
chemdraw ultra 12.0 software).
It has mainly been used in combination with triazene compounds to enhance their
anti-tumour efficacy against different types of tumour cells endowed with elevated
MGMT activity (Barvaux et al., 2004 a and b; Clemons et al., 2005). When a
combination of Patrin-2 and TMZ was used, Patrin-2 showed sensitisation of human
tumour xenografts of the methylating compounds (Middleton et al., 2002).
The DNA damage caused by TMZ or other methylating therapeutic drug in human cells
is usually repaired by MGMT and other DNA repair mechanisms (Papouli et al., 2004).
Such methylating therapeutic drugs cause possible DNA lesions such as
O6-meG and N
7-methylguanine (N
7-meG) which are cytotoxic in nature (Fig. 1.6).
MGMT by means of covalent transfer of the alkyl group to cysteine the conserved
active site, removes the O6-alkylguanine DNA adduct and thus restoring the guanine to
normal. In this process MGMT is inactivated by receiving the methyl group from
O6-meG and is subjected to ubiquitin-mediated degradation. Similarly when MGMT
transfers and accepts an alkyl group from Patrin-2 or O6-BG it becomes inactivated and
is degraded thus, MGMT is also called as suicidal enzyme (Pearson et al., 2005). When

27
an O6-meG DNA adducts escape from MGMT repair, during DNA replication
O6-meG DNA forms a base pair with thymine. This base pairing is recognised by the
MMR pathway causing futile cycles of repair which leads to cell death. N7-meG DNA
adducts formed by TMZ (>70% of total DNA adducts) are successfully repaired by the
BER pathway. The BER pathway contribution to the cytotoxicity of TMZ is only
minimum. In this pathway, methylpurine glycosylase (MPG) binds methoxyamine
(MX) to AP (apurinic/apyrimidinic), sites which are refractory to AP endonuclease
cleavage, causing blockage of the BER pathway (Fig. 1.6). This causes disrupted
replication, strand breakage and increased cytotoxicity of TMZ (Bobola et al., 2004;
Liu and Gerson, 2006).
Figure 1.6 Action of TMZ and Patrin-2 causing MGMT and other DNA repair mechanisms to
deal with DNA damage caused due to methylation of the TMZ, in human cells
(Liu and Gerson, 2006).
Thus, the anti-tumour activity of methyl-triazene compounds such as TMZ mainly
depends on the production of methyl adducts to O6 or N
3 or N
7 of purine bases of DNA

28
(Philip et al., 1996; Tentori & Graiziani et al., 2002; Bodell et al., 2003). The two DNA
repair enzyme systems, MGMT and MMR, play crucial roles in circumstancing the
cytotoxic effects of methyl-triazene compounds (Pegg et al., 1983; Dolan et al., 1990;
Pegg, 2000; Gerson, 2004; Trivedi et al., 2005; Morimoto et al., 2005;
Turriziani et al., 2006). Resistance to triazenes is attributed to the high levels of MGMT
related with target cells, while MMR aids the cytotoxic effect of these agents
(Esteller et al., 2000; Fedier and fink, 2004). Resistance to the triazenes such as TMZ
caused by MGMT can markedly be decreased in vitro and in vivo by use of the pseudo
substrate Patrin-2 (Middleton et al., 2000; Kaina and Christmann, 2002). Based on these
studies, the present study was carried out to investigate the effect of encapsulating TMZ
and Patrin-2 into liposomes and microparticles separately and in combination in order to
enhance the cytotoxicity of TMZ. Some work has been carried out to investigate the
effects of liposome and polymeric nanoparticles on cancer chemotherapy and there have
been some interesting outcomes regarding reduced side effects and can result in
improved survival rates of the patients (Kitamura et al., 1996; Ranson et al., 2007).
1.4 Liposomes
Liposomes were discovered by A. Bangham and his team about 45 years ago and ever
since then they developed into versatile tools in biology, medicine and biochemistry.
Liposomes are the smallest artificial vesicles of spherical shape that can be produced
from natural untoxic phospholipids and cholesterol (Bangham et al., 1965). Liposomes
can be defined as a particular kind of vesicles or any structure formed by lipid bilayers
which are capable to enclose a volume of the substance (Ostro, 1983; Connor & Huang,
1986). These amphipathic molecules constitute one or more hydrophobic chains, one
hydrophilic region where hydrophilic region forms the head group while the
hydrophobic region form the tail. When suspended in an aqueous medium they

29
instinctively form bilayer vesicles (Gomez-hens and Fernandez-Romero, 2006). The
basic structure of liposomes comprises of hydrocarbon chains which lean towards each
other while the polar head groups are in contact with encapsulated and surrounding
aqueous medium (Fig. 1.7) (Storm and Crommelin, 1998; Gomez-hens and Fernandez-
Romero, 2005). The structure of the liposomes can be determined by the number of
bilayers present. Single bilayers (lamella) liposomes are called unilamellar vesicles
(ULVs), while liposomes containing more than one bilayer are multilamellar vesicles
(MLVs). Other liposomes consisting of small vesicles incorporating large vesicle are
known a multivesicular vesicles (MVVs) (Gomez-hens and Fernandez-Romero, 2005).
The entrapment of active compounds also depends on the different sizes of liposomes
ranging from nanometre (nm) to micrometre (µm), such as small unilamellar vesicles
(SUVs, 25-50 nm), large unilamellar vesicles (LUVs, 100 nm-1 µm), giant unilamellar
vesicles (GUVs, 1.0-200 µm), multilamellar vesicles (MLVs, 0.1-15 µm), and multi-
vesicular vesicles (MVVs, 1.6-10.5 µm) (Silva et al., 2010). Liposomes can usually be
stored in a buffer at pH 7.4 and at temperature approximately 4 °C for 5-7 days.
However, storage time depends on a number of factors which include temperature, pH
and medium (Oberholzer et al., 1999).

30
Figure 1.7: Representation of the structure of liposome encapsulating a drug (Modified from http://en.wikipedia.org/wiki/File:Liposome.jpg).
1.4.1 Applications of liposomes
Liposomes are mainly used as delivery systems for many substances which can easily
be entrapped or act as anchor to various substituents (Gregoriadis, 1974). Liposomal
delivery systems are well-known procedures used for encapsulation of anticancer and
antimicrobial drugs, enzymes and antigens (Felnerova et al., 2004). The application of
liposomes in the delivery systems aid in processes such as transport, distribution,
controlled release, protection and localization of encapsulated drugs (Gregoriadis, 1974;
Egger et al., 2001). In order to improve the performance of the enclosed drug, it is
useful to consider the basic reasons for applying liposome as drug carriers
(Storm and Crommelin, 1998).
Some of the features of liposomes:
Targeting- Liposomes when modified can enhance the therapeutic efficacy (drug
targeting, site-specific delivery) of the drug by directing it to the target site in the body.
Similarly, liposomes may also prevent the drug to target other body sites that are

31
particularly sensitive to the toxic action of the drug (site-avoidance delivery) (Cagnoni,
2002).
Duration- The material encapsulated in liposomes is slowly liberated. Such prolong
processes help to maintain the therapeutic drug levels in the bloodstream and decreases
the frequency of administration (Storm and Crommelin, 1998; Grant et al., 2001;
Yowell & Blackwell, 2002).
Protection- Liposomes protect the encapsulated compounds against other unfavourable
aspects such as degradative enzymes existing in the host. Also the liposomes protect the
body from toxic effects of the drugs (Hattori et al., 2004).
Internalisation- One of the most beneficial aspects is the interaction of liposomes with
target cells enhancing the delivery of the drug intracellularly which is critical for the
non-encapsulated drugs due to the incompatible physiochemical characteristics
(e.g. DNA molecules) (Vail et al., 2004).
The cavity of the liposomes can be filled with drugs or other therapeutic agents. One of
the functions of liposomes is the efficient delivery of biologically active compounds
into the cells (Esposito et al., 2003). Endocytosis appears to be the principal pathway by
which liposomes enter cells to release the encapsulated drug and it is interesting to note
that the pH of endocytotic vesicles is slightly acidic (Xu & Szoka, 1996).
1.4.2 Drug interaction with liposome
Liposomes, because of their biphasic character, can act as carriers for both lipophilic
and hydrophilic drugs. Depending upon their solubility and partitioning characteristics,
the drug molecules are located differently in the liposomal environment and exhibit
different entrapment and release properties (Fig. 1.7). Based on the solubility, the drugs
can be divided into four classes (1) highly hydrophilic, (2) highly lipophilic,
(3) amphiphilic drugs that exhibit good biphasic solubility, and (4) drugs that exhibit

32
biphasic insolubility (Gulati et al., 1998). Thus, different drugs depend on different
types of methods in order to be encapsulated as shown in Fig.1.8. The main feature of
the method is the medium in which the compound is to be dissolved (Gomez-hens and
Fernandez-Romero, 2006). Highly lipophilic drugs can be encapsulated almost entirely
in the lipid bilayer of the liposomes (Vadiei et al., 1989). Since they are very weakly
soluble in water, problems such as leakage of entrapped drug on storage are negligible.
The most problematic compounds for liposomal entrapment are drug molecules that
possess poor biphasic solubility. Being insoluble in both aqueous or lipid phases results
in insufficient inadequate uptake by the liposomes (Goyal et al., 2005). The
encapsulation efficiency of hydrophilic or other drugs that show weak encapsulation can
be enhanced by making them lipophilic through the addition of hydrophobic side chains
or by the addition of external compounds such as lactose or sodium chloride
(Gulati et al., 1998).
Figure 1.8 Types of the drugs and site of their incorporation into liposomal vesicles (Gulati et
al., 1998).

33
1.4.3 Phospholipids
The phospholipid composition and the capability of binding to other chemical species is
one of the main features of their use in liposome formation (Rachev et al., 2001;
Gomez-hens and Fernandez-Romero, 2005). Phospholipids are part of all cell
membranes and play an important role in the signal transduction mechanism. The
phospholipid structure consists of phosphoric residue, hydrophilic head and
hydrophobic tail (Fig. 1.9). The hydrophilic head consists of the phosphate group,
glycerol back bone, choline, ethanolamine and inositol, with different chemical
properties. When exposed to an aqueous environment, phospholipids tend to form
unique assemblies called "bilayers". The hydrophilic heads of the phospholipids turn
towards the water molecules while the hydrophobic tails hide from water molecules.
Figure 1.9 Chemical structure of Phospholipid (Adapted from http://kvhs.nbed.nb.ca/gallant/
biology/phospholipid_structure.jpg).

34
There are two basic sources of phospholipids: synthetic and natural. Natural lipids are
generally either egg-derived or bovine-derived. Regardless of the regulatory issues,
animal-derived products do not offer any advantages to synthetic lipids. They are
inherently less stable due to the polyunsaturated fatty acids, and in most cases the
synthetic counterpart costs the same or less than the tissue-derived product
(Lasic, 1992). Synthetic lipids from different sources are not necessarily equal either.
Synthetic lipids can be prepared from glycerol or glycero-3-phosphocholine (GPC)
derived from a plant or animal source (Perrie and Gregoriadis, 2000). The latter is
sometimes referred to as semi-synthetic lipid because a portion of the molecule is
derived from a natural source (Harrington et al., 2002). Lipids derived from glycerol
require the chiral centre be synthetically prepared which may lead to stereochemical
impurities present in the final product (Gregoriadis, 1974). The typical plant source for
GPC is soybean lecithin. This type of compound is synthesized by converting a natural
PC into an acyl group through a chemical reaction. A highly pure, high-quality
hydrogenated soy phospholipids that can assist you in developing new products is
generally obtained from carefully selected, non-genetically modified soybeans as a
source of raw materials (Lasic, 1992).
Phospholipids derived from natural sources are mostly used as the parental liposome
formation. Such phospholipids include phosphatidylcholine (PC), phosphatidylglycerol
(PG) and phosphatidylethanolamine (PE) (Harrington et al., 2002). These phospholipids
contain certain acyl chains which differ with source of origin, for example acyl chain
found in egg PC is different to acyl chain in soy bean PC. Phospholipids also possess
lyso-phospholipids where the acyl chain is located at C1-position of
glycerophosphocholine and the other is eliminated by hydrolysis (Sessa and
Weissmann, 1968). In addition, peroxidation can occur if unsaturated bonds are present

35
in the acyl chains. In the early 1980s the quality of lipids of several suppliers differed
both qualitatively as well as quantitatively (Zuidam, 1993; Zuidam, 1996). However,
the supplies nowadays are more consistent with high quality products. An interesting
feature of liposomes is that their mechanical properties can be changed by incorporating
a wide range of substances into their structure such as cholesterol and stearic acid
(Rachev et al., 2001). The phospholipids used in this study are lα-phosphatidylcholine,
1,2-distearoyl-sn-glycerol-3-phosphocholine (DSPC), 1,2-dimyristoyl-sn-glycerol-3-
phosphocholine (DMPC), lecithin and phospholipon 90H. These phospholipids can also
be classified as natural and synthetic phospholipids where lα-phosphatidylcholine and
lecithin are obtained naturally while DSPC, DMPC and phospholipon 90H are derived
synthetically.

36
1.4.3.1 Lα-phosphatidylcholine
Lα-phosphatidylcholine has an important function in the maintenance of integrity of the
cell-membrane. It has also been recognized as an important signalling molecule
(Exton, 1994). Lα-phosphatidylcholine comprises of phosphatidylcholine as its major
component, it is a pure form of soyabean phospholipids. Its structure comprises of
saturated as well as unsaturated fatty acids. Its phase transition temperature was
reported to be unstable ranging between 55-65 °C and fatty acid composition was
provided by the supplier Sigma Aldrich, UK. It comprises of 13 % palmitic acid, 4-6 %
stearic acid, 10 % oleic acid, 64 % linoleic acid and 6-8 % linolenic acid.
R2 O O
O
OO
R1
P
O
O
O-
N+
CH3
CH3
CH3
R1 and R2 = fatty acid residues
O
HO
Palmitic acidO
HO
Steric acid
O
OHOleic acid
O
OHLinoleic acid
O
OHLinolenic acid
Figure 1.10 The structure of Lα-phosphatidylcholine along with its fatty acid composition (The
chemical structure was drawn using the chemdraw ultra 12.0 software).
37
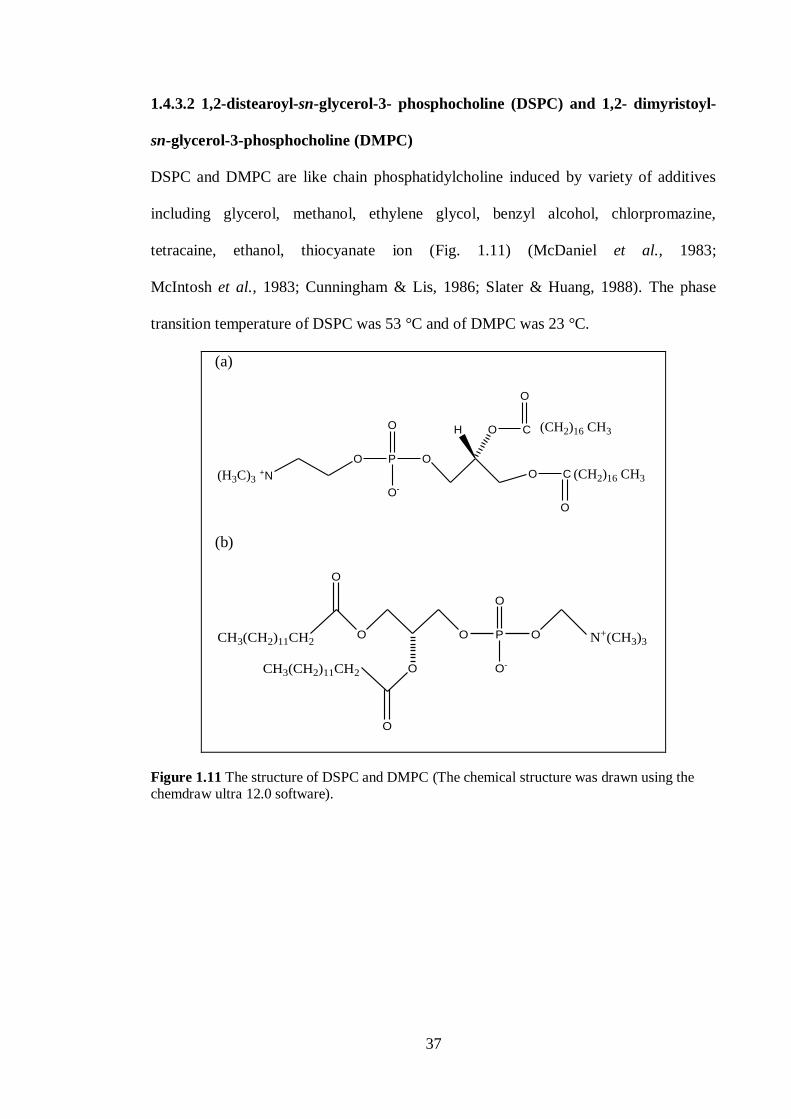
1.4.3.2 1,2-distearoyl-sn-glycerol-3- phosphocholine (DSPC) and 1,2- dimyristoyl-
sn-glycerol-3-phosphocholine (DMPC)
DSPC and DMPC are like chain phosphatidylcholine induced by variety of additives
including glycerol, methanol, ethylene glycol, benzyl alcohol, chlorpromazine,
tetracaine, ethanol, thiocyanate ion (Fig. 1.11) (McDaniel et al., 1983;
McIntosh et al., 1983; Cunningham & Lis, 1986; Slater & Huang, 1988). The phase
transition temperature of DSPC was 53 °C and of DMPC was 23 °C.
(a)
+N
O
(H3C)3
P O
O-
O
O
H O C
O
C
O
(CH2)16 CH3
(CH2)16 CH3
(b)
O O P
O-
O
O
O
O
O
CH3(CH2)11CH2
CH3(CH2)11CH2
N+(CH3)3
Figure 1.11 The structure of DSPC and DMPC (The chemical structure was drawn using the chemdraw ultra 12.0 software).

38
1.4.3.3 Lecithin derived from Soybean
Lecithin is composed of a mixture of phospholipids: phosphatidylcholine,
phosphatidylethanolamine, lysophosphatidylcholine, n-acyl-phosphatidylethanol- amine
and phosphatidylinositol. Its fatty acid composition comprises of 12-17 % palmitic acid,
2-5 % stearic acid, 11-15 % oleic acid, 59-70 % linoleic acid and 3-7 % linolenic acid
(Fig. 1.12). Its phase transition temperature was reported to be 65 °C and fatty acid
composition was provided by the supplier Sigma Aldrich, UK.
+N
O
O
palmitic acid
Linoleic acid
Lecithin
C
C
OO P O
O
O
O
O
HO
Steric acid
O
OHOleic acid
O
OHLinolenic acid
Figure 1.12 The structure of Lecithin with palmitic and linoleic acid chain attached to it along
with its fatty acid composition (The chemical structure was drawn using the chemdraw ultra
12.0 software).

39
1.4.3.4 Phospholipon®
90 H
Phospholipon®
90H is hydrogenated form of lecithin product derived from soybean.
Phospholipon®90H comprises of phospholipids such as hydrogenated
phosphatidylcholine and hydrogenated lysophosphatidylcholine. Its fatty acid
composition comprises of 15 % palmitic acid and 85 % stearic acid (Fig. 1.13). Due to
its composition phospholipon 90H is found to be more stable than phosphatidylcholine
and is also been previously used as for application of liposomes (Glavas-Dodov et al.,
2005; Parmar et al., 2010). Its phase transition temperature was reported to be 54 °C
and fatty acid composition was provided by the supplier Phospholipid GmbH, Germany.
R2 CH
O
CH2CR1
O
H2C N+
R1 COO R2 COO : C12 -C20 fatty acids
O P
O
O-
O
O
HO
Palmitic acid O
HO
Steric acid
Figure 1.13 The structure of Phospholipon® 90H along with its fatty acid composition (The
chemical structure was drawn using the chemdraw ultra 12.0 software).

40
1.4.3.5 Cholesterol and Stearic acid
Cholesterol, is an alternative habitual component of the liposome structure and a natural
constituent of the biological membranes, whereas stearic acid is a saturated form of fatty
acid, cholesterol and stearic acid play an important role in controlling the fluidity and
the permeability of the artificial vesicle i.e. it makes the membranes more rigid thus
avoiding leakage of the encapsulated compound (Fig. 1.14) (Gomez-hens and
Fernandez-Romero, 2005; Perrie and Gregoriadis, 2000). In order to improve the
rigidity of the liposome, cholesterol and stearic acid were combined with other
phospholipids to form liposome formulations.
(a)
HO
H
H
H
Cholesterol
CH3
CH3
CH3
CH3
(b)
O
HO
Steric acid
Figure 1.14 The structures of (a) cholesterol and (b) stearic acid (The chemical structure was drawn using the chemdraw ultra 12.0 software).

41
1.4.4 Techniques used in the current study for formation of Liposomes
Methods such as freeze-thaw and dehydration-rehydration form liposomes that are
multilamellar vesicle (MLVs). These MLVs possess greater encapsulating capacity, in
addition to variation in vesicle size, size dispersion and lamellarity (Gabriels, 2003;
Moscho, 1996). These factors are based on the type of the lipids used and their
distribution efficiency. Repetition of these mechanical cycles such as freeze-thaw cycles
or dehydration-rehydration cycles converts the initial MLV dispersion into other
liposomes of different sizes (Gomez-hens and Fernandez-Romero, 2005). The freezing
process aids in the encapsulation of TMZ inside the liposomal vesicle while the thawing
breaks the multilamellar vesicles and promotes mixing of the encapsulated content on
release (Shazly et al., 2008). Similarly dehydration causes fusion of the vesicle,
liposomes are concentrated by the drying process and fuse to form multilamellar planes
forming a sandwich of the drug between the resulting lamellae. To further disperse the
vesicles, the addition of PBS and vortexing is carried out (Ostro, 1983). The TMZ
loaded liposomes were then analysed for encapsulation by the application of HPLC.
Particle size analysis
The performance of laser diffraction depends on the particles passing through a laser
beam scattering light at an angle that is inversely proportional to their size (large
particles scatter light at low angles, whereas, small particles scatter light at high angles).
Thus, to calculate particle size distribution, the intensity of light scattered from a sample
is measured as a function of the angle (Fig. 1.15) (Ingebrigtsen and Brandl, 2002). The
laser diffraction analyser was used in this study to measure the size of the TMZ loaded
liposomes formed.

42
Fundamental principle
Laser diffraction is based on the principle that particles scatter light in all directions
with an intensity pattern depending on the particle size. A light scattering instrument
was used consisting of a light beam (usually a laser), a detector to measure the
scattering pattern, a small volume dispersion unit and a computer for both control of the
instrument and calculation/computation of the particle size distribution (Chu, 1991).
Advantages in using this method are that it is easy to use and less time consuming. It is
reproducible and an extremely wide size range is covered straddling almost five orders
of magnitude ranging from nanometres to millimetres (Ruf et al., 1989).
Figure 1.15 An illustration of particle size analyser (Adapted from http://www.malvern.com/
LabEng/products/Mastersizer/MS2000/mastersizer2000.htm).
1.5 Microparticles
The most widely used clinical drugs are often found to be of low molecular weight
exhibiting a short half-life in the blood stream and an overall high clearance rate
(Haag and Kratz, 2006). Such small molecules diffuse into the healthy tissues in a rapid
manner and are distributed throughout the body. Based on their size such molecules are
known as either microparticles or nanoparticles. The advantage of nanoparticles over
microparticles is different as their size opens the potential for crossing the various
biological barriers within the body. From a positive viewpoint, especially the potential

43
to cross the blood brain barrier may open new ways for drug delivery into the brain. In
addition, the nanosize also allows for access into the cell and various cellular
compartments including the nucleus (De Jong and Borm, 2008). Microparticles on other
hand also carry these advantages but at certain aspects require surface modification to
pass through various cellular compartments.
In order to optimize the biodistribution of drugs to target sites a number of
nanoparticulate delivery systems for disease targeting and site-selective drug release
have been developed as described by Dr. Paul Ehrlich over a century ago who described
the concept of drug delivery at a disease site without harming the healthy tissue as the
“magic bullet” (Witkop, 1999). Drug delivery systems are classified as either polymer-
drug conjugates (polymer therapeutics) or as nanoparticle therapeutics both approaches
aim at increasing the therapeutic index maximum quantity of the drug molecules
available at the target site with reduction of systemic drug exposure. (Davis et al., 2008;
Caliceti and Veronese, 2003).
In developing a drug delivery system certain aspects are taken in to consideration as the
system should positively impact on the rate of metabolism, distribution absorption and
excretion of the drug or other related chemical substances in the body. The structure of
the polymeric nanoparticles enables the drug to bind to its target receptor and influence
receptor’s signalling and activity (Fig. 1.16). The substance used for the development of
the microparticles should be degradable into fragments after completion of their role
and be either metabolised or excreted (Niidome et al., 2006; De Jong and Borm, 2008).
Thus, for effective and safe drug delivery systems, biodegradable nanoparticle
formulations are favoured for the purpose transportation and release of the drug in order
to be effective (Gupta and Gupta, 2005). The use of nanotechnology in drug delivery

44
systems and in medicine is spreading rapidly. Pharmaceutical sciences have been using
this technology to reduce toxicity and side effects of the drugs. Numerous substances
have been considered to use for drug delivery systems and more specifically in cancer
therapy (Ferrari, 2005).
Figure 1.16 Representation of the structure of PLGA nanaoparticle encapsulating a drug
(Modified from Mamo et al., 2010).
1.5.1 Applications of microparticles
Drug delivery and other pharmaceutical developments related to nanomedicine pose a
special function related to treatment, prevention and diagnosis of the disease. In order
for appropriate selection of carriers to be used in drug delivery systems certain
parameters needs to be considered such as drug incorporation and release,
biocompatibility and biodistribution, stability and shelf life related to formulation and
site targeting (De Jong and Borm, 2008). A major issue of limiting intracranial
therapeutic levels for chemotherapeutic agents’ administration is the blood brain barrier.
TMZ is one of the most effective anticancer agents to cross the blood brain barrier,
however, in high systemic doses it is unable to achieve the therapeutic brain levels due
to its short half-life and also causes certain side effects (Rongy et al., 2005). Thus,

45
according to the literature reports it is proved that implantation of polymeric devices
have extended the release period of the drug (Zhang and Gao, 2007).
Drug delivery can be localized or systemic. Parenteral drug delivery is typically
achieved using liposomal or polymeric carriers (Langer, 1998). There is no universal
platform, as each system has its advantages and disadvantages. While liposomes have a
high drug-carrying capacity, their release profiles are more difficult to regulate. In
contrast, polymeric drug-delivery systems can be synthesized to generate specific
molecular weights and compositions, but their drug-carrying capacity is relatively low
(Duncan, 2003). While an ideal general drug-delivery platform may never be realized,
hybrid drug-delivery systems that incorporate the benefits of various approaches will be
tailored to address the needs of specific applications. In addition to the standard
advantages of polymeric and liposomal drug-delivery systems, including sustained and
controlled release, as well as the potential for targeted delivery, nano-scale dimensions
confer improved bioavailability by increasing the payload’s solubility and stability.
Smaller particle sizes facilitate deeper penetration into capillaries and through
fenestrations and, ultimately, enhanced cellular uptake. Indeed, 100 nm size particles
exhibit in situ uptake efficiencies 15–250-fold of those of small microparticles (1 and 10
μm) (Desai et al., 1996). Nanoparticles have even been shown to cross the blood–brain
barrier.
1.5.2 Poly(d,l-lactide-co-glycolide) (PLGA)
In order to meet the requirements of a sustained release system a biodegradable polymer
such as polylactide (PLA) and its copolymers (PLGA) with glycolide (GA) are
commonly used. PLGA has proved to be a much more effective polymer than PLA
because of its polymer properties i.e. manipulation of the co-monomer ratio, molar mass
and polymer crystallinity (Fig. 1.17). In addition, drug release rates can be controlled

46
through alteration in the ratio, use of different molecular weight PLGA and also in the
physical characteristics of the resulting microparticles. Degradation of the PLGA plays
a crucial role in the drug release mechanism (Porjazoska et al., 2004). Furthermore,
previous studies have reported the biocompatibility and biodegradability of blank PLGA
(i.e. without any active ingredient encapsulated in it) in brain cells when implanted in
brain tissue (Emerich et al., 1999; Menei et al., 1993). The blood brain barrier consists
of tight junctions of blood vessels of brain endothelial cells, thus the application of
prodrugs and drug carriers have been used to overcome this limitation. The surface
modified carriers have drawn the attention due to their ability for site specific delivery
of the drug (Zhang and Gao, 2007). Because of their small size and modified surface
these polymeric nanoparticles can also be targeted to specific cells and locations in the
body. The factors such as drug encapsulation and release profile depend on the type of
polymer used and its physiochemical characteristics such as particle size and
morphology (Torchilin, 2006a). The melting point of PLGA is found to be amorphous
and the glass transition temperature is reported to be 45-50 °C.
HO
O
O
H
CH3
X Y
X - Number of units of Lactic AcidY - Number of units of Glycolic Acid
O
O
Figure 1.17 Representation of the structure of PLGA (The chemical structure was drawn using
the chemdraw ultra 12.0 software).

47
1.5.3 Techniques used in the current study for formation of Microparticles
The preparation of the PLGA microparticles involved both emulsifying-solvent
evaporation and spray dry techniques. The emulsifying-solvent evaporation consists of
dissolving the polymer with the drug in a solvent and mixing it with aqueous medium
containing surfactant. The mixture stirred overnight during which time diffusion takes
place between the water-soluble solvent and the water-insoluble phase, resulting in an
interfacial turbulence which results in the formation of microparticles (Torchilin,
2006b). Spray dry technique is performed by using a Mini Spray Dryer. Polymer
together with the drug was dissolved in a solvent which is subjected to spray drying
where the matrix material and the active ingredients are heated above the melting point
(Wang and Wang, 2003). The microparticles are formed based on the principle of a
co-current air and product stream, i.e. the sprayed product and hot air have the same
flow direction (Fig. 1.18). Compressed air is used for the dispersion of the liquid body
into fine droplets which are subsequently dried in the cylinder. These droplets are
solidified into particles and can thus be separated.
Figure 1.18 Functional principle of the spray dry method. (Adapted from http://www.mybuchi. com/Mini_Spray_Dryer_B-290.179.0.html).

48
The spray drying technique converts the drug–polymer suspension into fine particles by
spraying through an atomization nozzle into hot air. The solvent present within the
atomized droplets evaporates quickly and solid microparticles are formed. This
technique has been used previously to encapsulate anticancer drugs such as paclitaxel
and etanidazole respectively into PLGA microparticles (Mu and Feng, 2001;
Wang and Wang, 2003).
1.5.4 Dissolution techniques used for determination of drug release from the
microparticles.
Two dissolution techniques used to monitor the release of drugs from liposomes and
microparticles are dispersion and dialysis bag diffusion methods. The release process of
drugs from microparticles is based on the physiochemical characteristics of the drug
molecules and the matrix of the polymer (Hutchison and Furr, 1990). Certain aspects in
which the release of the drug depends include the mode of drug attachment or
encapsulation involving factors such as surface adsorption, covalent conjugation and
dispersion homogeneity of the drug molecules in the polymer matrix, in addition to this
the factors determining the degradation and the control of matrix hydration are also
involved (Allemann et al., 1993; Niwa et al., 1993; Soppimath et al., 2001).
The release of the drug from the polymer can be described in different phases, rapid
release of the drug occurs due to desorption this can be due to the drug being bonded
weakly to the polymer surface and can be expressed as the initial burst release phase
which can sometimes takes place as result of bulk degradation of the polymer
(Allemann et al., 1993; Polakovic et al., 1999; Panyam et al., 2004; Liu et al., 2005;
Tamber et al., 2005). If the bulk degradation of the polymer is made to exhibit surface
degradation or layer-by-layer degradation, the polymer could present a promising
control release of the drug. These phenomena is termed as sustained release (Conte et

49
al., 1993; Abdul and Poddar, 2004; Chen et al., 2005; Loo et al., 2005;
Frank et al., 2005; Loo et al., 2010). If the drug is distributed uniformly in the matrix of
the polymer, the release takes place by diffusion (i.e. if the drug is in a crystalline form
it is first dissolved locally and then diffusion takes place). Sometimes the release takes
place by the erosion of the matrix or a combination of both mechanisms causes the
release (Torchilin, 2006a). The stage where no drug release is observed is termed as the
lag phase, where the drug is not diffusing out of the polymer, one of the mode by which
this could be overcome by treating the sample by radiation (e-beam) which modifies the
physical properties of the polymer and thereby reduces the lag phase (Miao et al., 2009;
Loo et al., 2010). Some of the parameters that should be taken into consideration for
monitoring the release mechanism include polymer molecular weight distribution,
melting and glass transition temperature, crystallinity and hydrophobicity or
hydrophilicity. It is also observed from previous studies that degradation time of the
polymer is shorter for low molecular weight polymers and greater for amorphous,
hydrophilic and polymers with high glycolide content (Gallia et al., 2005; Torchilin,
2006a).
1.5.5 Particle size analysis
The scanning electron microscope (SEM) was used for analysing the particle size and
morphology of the TMZ and Patrin-2 loaded PLGA microparticles. In order to generate
a range of signals at the surface of the microparticles SEM uses a focussed beam of high
energy electrons (Fig. 1.19). The signals generated is attributed to electron and sample
interactions and provides details on the sample related to its external morphology, size,
chemical composition and orientation of materials used in making of the sample
(Painbeni et al., 1998). Data is collected from the selected surface area of the sample

50
and a two dimensional image is produced displaying the spatial differences in these
properties.
Figure 1.19 Schematic diagram of scanning electron microscopy. (Adapted from http://cms.
daegu.ac.kr/sgpark/microbiology/SEM.jpg).
Fundamental principle
The signals generated by electron-sample interactions include secondary electron (that
are responsible for producing the SEM image), backscattered electrons, diffracted
backscattered electrons (used in determination of the crystalline structure of the
sample), photons, visible light and heat. The essential components of SEM includes the
electron source, electron lenses, sample stage (where the sample is placed for analysis),
detectors for analysing all possible signals, and the display or data output device
(Bodmeier et al., 1989).
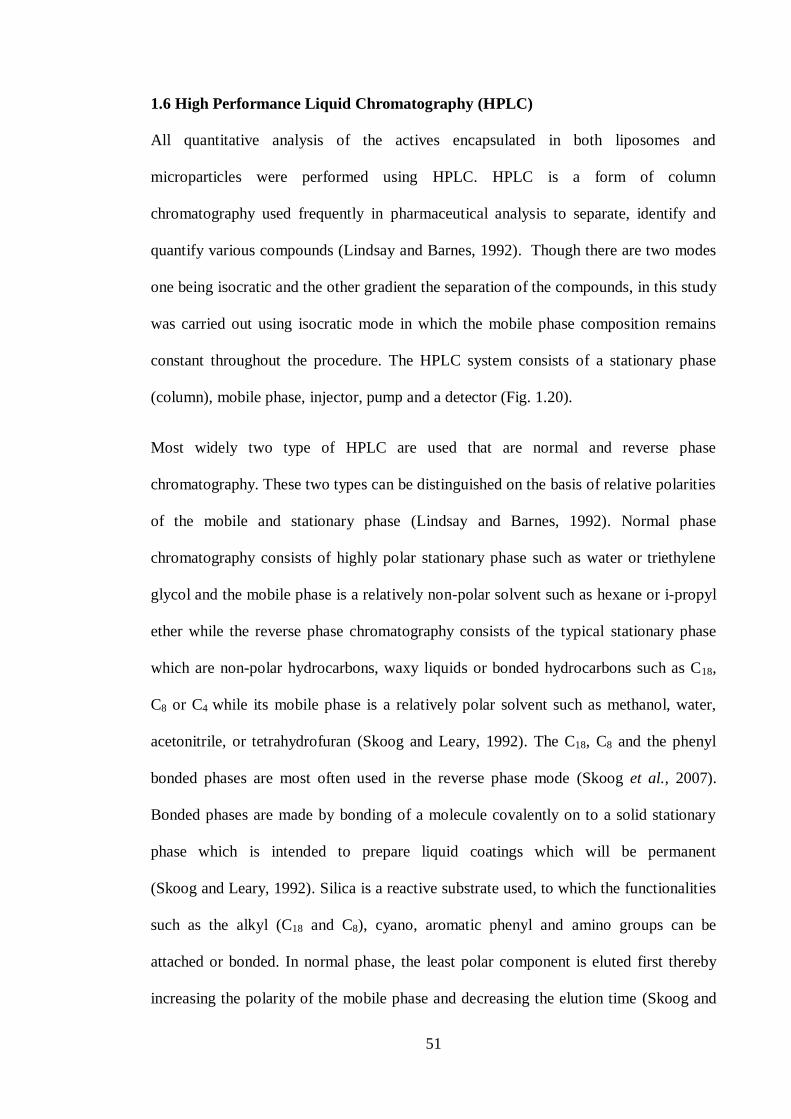
51
1.6 High Performance Liquid Chromatography (HPLC)
All quantitative analysis of the actives encapsulated in both liposomes and
microparticles were performed using HPLC. HPLC is a form of column
chromatography used frequently in pharmaceutical analysis to separate, identify and
quantify various compounds (Lindsay and Barnes, 1992). Though there are two modes
one being isocratic and the other gradient the separation of the compounds, in this study
was carried out using isocratic mode in which the mobile phase composition remains
constant throughout the procedure. The HPLC system consists of a stationary phase
(column), mobile phase, injector, pump and a detector (Fig. 1.20).
Most widely two type of HPLC are used that are normal and reverse phase
chromatography. These two types can be distinguished on the basis of relative polarities
of the mobile and stationary phase (Lindsay and Barnes, 1992). Normal phase
chromatography consists of highly polar stationary phase such as water or triethylene
glycol and the mobile phase is a relatively non-polar solvent such as hexane or i-propyl
ether while the reverse phase chromatography consists of the typical stationary phase
which are non-polar hydrocarbons, waxy liquids or bonded hydrocarbons such as C18,
C8 or C4 while its mobile phase is a relatively polar solvent such as methanol, water,
acetonitrile, or tetrahydrofuran (Skoog and Leary, 1992). The C18, C8 and the phenyl
bonded phases are most often used in the reverse phase mode (Skoog et al., 2007).
Bonded phases are made by bonding of a molecule covalently on to a solid stationary
phase which is intended to prepare liquid coatings which will be permanent
(Skoog and Leary, 1992). Silica is a reactive substrate used, to which the functionalities
such as the alkyl (C18 and C8), cyano, aromatic phenyl and amino groups can be
attached or bonded. In normal phase, the least polar component is eluted first thereby
increasing the polarity of the mobile phase and decreasing the elution time (Skoog and

52
Leary, 1992). However, in reverse phase chromatography the most polar component is
eluted first, increasing the polarity of the mobile phase and increasing the elution time
(Lindsay and Barnes, 1992). One of the many advantages of reverse phase
chromatography is the ability to use water as the mobile phase which is an inexpensive
and UV-transparent solvent compatible with biological solutes, also it is found that
mass transfer as well as solvent equilibration is rapid with non-polar stationary phase
(Skoog et al., 2007). The R group of the siloxane used in these coatings is a C18 chain
(n-octyldecyl) or C8 chain (n-octyl). The effect of the alkyl groups on performance
depends on the chain length (Skoog and Leary, 1992). Longer chains produce packings
that are more retentive and allow use of larger samples, the maximum sample size of
column type C18 is roughly twice of that of C4 under similar conditions (Skoog et al.,
2007).
The technique involves separation of the components in a mixture pushed through the
column usually at a constant flow rate is carried out using a liquid mobile phase. The
solvent (mobile phase) is run through the high pressure pump which generates and
measures the flow rate of the mobile phase in millilitres per minute. The sample to be
analysed is introduced in the injector from where it is introduced in the mobile phase
flowing through the column consisting of chromatographic packing material (C18) also
termed as the stationary phase. From the column the flow is directed to the detector. The
components are then analyzed by the detector from where the chromatographic image is
produced in the computer. The detector normally used is a UV lamp. The chromatogram
produced displays the retention time and the peak area of the expected compound. The
retention time is a characteristic of the sample for a particular set of conditions and
helps in identification of the compound. The peak area of the compound indicates the
concentration of the compound used in the analysis (Lindsay and Barnes, 1992).

53
Figure 1.20 Schematic diagram of HPLC (Adapted from http://www.waters.com/waters/
nav.htm?cid=10049055&locale=en_GB).
54
1.7 The main research questions & aims
Questions to be addressed concerning the investigation
Can the preparations of liposomes and microparticles be effectively used for
encapsulation of TMZ and Patrin-2?
Can their release from the formed liposomes and microparticles be efficiently monitored
using the dissolution techniques in order to enhance the treatment of glioma?
Hypothesis
TMZ & Patrin-2 could be encapsulated separately into liposomes and microparticles
using established or improvised methods.
1.7.1 Main aim
The main aim of our investigation was to prepare TMZ loaded liposomes (by using
different ratios of phospholipid), TMZ loaded PLGA microparticles and Patrin-2 loaded
PLGA microparticles.
TMZ has proved to be effective in patients that lack MGMT activity since MGMT
counteracts the effect of TMZ by removing the methyl group (originally added by
TMZ) (Rimel et al., 2009). Patrin-2 is used to counteract the effect of MGMT and
enhances the effective activity of TMZ. Because TMZ and Patrin-2 are not compatible
due to their differences in stability at different pH’s they cannot be encapsulated
together in the same vehicle, thus the microparticles formulations prepared for both
drugs were prepared separately.

55
1.7.2 Specific aims of the research:
1. To establish a method for the preparation of TMZ loaded liposomes with
maximum encapsulation efficiency monitored by HPLC and to determine
particle size.
2. To establish a method for preparing TMZ loaded microparticles resulting in
maximum encapsulation monitored by HPLC.
3. To use different molecular weights of PLGA for the preparation of TMZ and
Patrin-2 loaded microparticles.
4. To measure the particle size and morphology of the TMZ and Patrin-2 loaded
microparticles using scanning electron microscopy.

56
CHAPTER 2
MATERIALS AND METHODS

57
2.1 Materials
Materials used in this study are detailed in Table 2.1. All chemical reagents used were
of analytical grade. All materials used were handled and stored according to the
instructions given by the suppliers.
Table 2.1 Materials used in this study.
Chemicals Molecular weight
(Da)
Supplier
TMZ
194.15 Sigma Aldrich (UK) and
Paterson institute (UK)
Patrin-2 (Lomeguatrib) 326.17 Zhejiang Wonderful Pharma
& Chem Co. (China)
Lα-phosphatidylcholine 760.09 Sigma Aldrich (UK)
1,2-distearoyl-sn-glycerol-3-
phosphocholine
677.93 Sigma Aldrich (UK)
1,2-dimyristoyl-sn-glycerol-3-
phosphocholine
734.10 Sigma Aldrich (UK)
Lipoid S-100 Lecithin from soy 790.00 Lipoid GmbH (Germany)
Stearic acid 284.48 Sigma Aldrich (UK)
Cholesterol 386.67 Sigma Aldrich (UK)
Phospholipon® 90H 784.00 Phospholipid GmbH
(Cologne)
Poly (DL-lactide-co-glycolide)
(75: 25)
1.7x10⁴ Purac biomaterials
(Netherlands)
Poly (DL-lactide-co-glycolide)
(75: 25)
6.6x10⁴ - 1x10
4 Sigma Aldrich (UK)

58
Poly (DL-lactide-co-glycolide)
(50: 50)
4x10⁴ – 7.5x10
4 Sigma Aldrich (UK)
Poly (DL-lactide-co-glycolide)
(50: 50)
1.5 x10⁴- 4 x10
4 Sigma Aldrich (UK)
Dialysis tubing, benzolated MW cut off 1200-
2000
Sigma Aldrich (UK)
Polyvinyl alcohol 20000 - 30000 Fisher Scientific (UK)
Sodium Dodecyl Sulphate (SDS) 288.38 Sigma Aldrich (UK)
Citric acid 192.12 Sigma Aldrich (UK)
Tetrabutylammonium acetate
(TBAA)
301.51 Sigma Aldrich (UK)
Phosphate buffered saline (PBS
1x)
N/A Autogen Bioclear (UK)
HPLC grade chloroform N/A Fisher Scientific (UK)
HPLC grade dichloromethane N/A Fisher Scientific (UK)
HPLC grade acetonitrile N/A Fisher Scientific (UK)
HPLC grade acetone N/A Fisher Scientific (UK)
HPLC grade ethanol N/A Fisher Scientific (UK)
HPLC grade methanol N/A Fisher Scientific (UK)
HPLC grade water N/A Fisher Scientific (UK)
Acetic Acid N/A Fisher Scientific (UK)
Triton X-100 N/A VWR International (UK)

59
2.2. Equipments
All the instruments used to carry out the experiments are detailed in table 2.2.
Table 2.2 Equipment used in this study
Equipment Type Supplier
HPLC pump Jasco PU-1580 Jasco (UK)
HPLC detector Jasco UV-970M
(4-λ intelligent)
Jasco (UK)
HPLC Column Shandon C18 Thermo scientific (UK)
Mini spray dryer Buchi mini spray dryer B-290 Buchi (UK)
Particle size analyser Mastersizer 2000 Malvern instruments ltd.
(UK)
Scanning electron
microscopy (SEM)
Scanning electron microscopy Edax-ametex (UK)
Water bath Nuve water bath nb 5 Biotech lab (Bulgaria)
Centrifuge Centrikon T-324 Kontrons instruments
(UK)
Rotary evaporator Buchi RE111 and Buchi 461
water bath
Buchi (UK)
Gold coater Sputter coater Emitech ltd. (UK)
Shaker and incubator Shaker and incubator Gallenkamp (UK)
Microcentrifuge Microcentrifuge MSE Sanyo (UK)
Tube rotator Blood tube rotator SBI Jencons scientific (UK)
Magnetic stirrer RCT basic IKA RCT basic
(Germany)

60
Sonicator Ultra sonicator- ULT065 Ultra wave (UK)
Analytical Balance Balance P/PI-114 Denver instruments
(UK)
Micropipettes Gilson Thermo Scientific (UK)
Vortex Whirl mixer Fisons scientific
equipment (UK)
2.3 HPLC methods
2.3.1 HPLC instrumentation
HPLC system used in the study consisted of Jasco PU-1580 pump attached to a Jasco
UV-970M (4-λ intelligent) and a Viglen Pentium-4 contender with an AZUR version
5.0.10.0 software package for analysis of TMZ and Patrin-2 (Fig. 2.1).
Figure 2.1 High Performance Liquid Chromatography coupled with UV detector used for
sample analysis.
61
2.3.2 HPLC column
The chromatography was performed using a Shandon C18 (150 × 4.60 mm) column
consisting of particle sizes equivalent to 5 µm. Manual injections were carried out using
a Rheodyne model 7725i injector with a 20 µl loop. The mobile phase used for TMZ
was 0.5 % acetic acid:methanol in the ratio of 9:1 (pH 2.8) (Moffat et al., 2004) and the
mobile phase used for Patrin-2 was 35 % acetonitrile consisting of 10 mM
tetrabutylammonium acetate (TBAA), 10 mM sodium dodecyl sulphate (SDS) and
25 mM citric acid (pH 3.4) (Shervington et al., 2005). Analysis was performed only
after the column had reached equilibrium (approximately 30-60 min at a flow rate of
1 ml/min). The mobile phase was always filtered and degassed before use. The final
flow rate was set to 1 ml/min and the detector was set to monitor at wavelengths 330 nm
and 287 nm. All the analyses were carried out at ambient temperature (25 oC).
2.3.3 Validation of HPLC system
The validation of HPLC system for TMZ and Patrin-2 was carried out following
standard procedures described in United States Pharmacopoeia (USP). This included
linearity, repeatability and reproducibility, limit of detection and limit of quantification.
2.3.3.1 Selection of Mobile phase:
Based on the literature review the following two mobile phases were used for TMZ and
Patrin-2.
1) For the analysis of TMZ: 0.5% acetic acid:methanol in the ratio of 9:1(v/v).
This mobile phase was prepared by mixing 100 ml of methanol to 900 ml of 0.5 %
acetic acid. It was then sonicated and filtered before running it on the HPLC system.
The pH of the mobile phase was found to be 2.8 (Moffat et al., 2004).

62
2) For the analysis Patrin-2: 35 % acetonitrile consisting of 10 mM TBAA, 10 mM SDS
and 25 mM citric acid was used.
This mobile phase was prepared by mixing 175 ml of HPLC grade acetonitrile with 325
ml of HPLC grade water to which 1.5076 g of TBAA, 1.4419 g of SDS and 2.4015 g of
citric acid was added and dissolved. It was then sonicated and filtered before running it
on the HPLC system. The mobile phase pH was measured to be 3.4
(Shervington et al., 2005).
2.3.3.2 Stock solution:
Stock solution for TMZ was prepared by adding 10 mg of the TMZ to a 100 ml
volumetric flask dissolving it with mobile phase and then making up to the mark with
the mobile phase, thus giving a final concentration of 0.1 mg/ml. Similarly, 10 mg of
Patrin-2 was added to a 100 ml volumetric flask dissolving it with acetonitrile and
making up to the mark with acetonitrile to give a final concentration of 0.1 mg/ml. The
stock solutions were stored in a refrigerator at 4 °C.
2.3.3.3 Calibration curve (linearity testing of the HPLC system):
For linearity testing of TMZ and Patrin-2, aliquots of concentration 0.08, 0.06, 0.04,
0.02 and 0.01 mg/ml were prepared from stock solutions and the corresponding peak
areas were determined and the calibration curves were plotted.
2.3.3.4 Repeatability (Intraday analysis):
Intraday analysis was carried out for TMZ and Patrin-2 by analysing the sample at a
concentration of 0.02 mg/ml six times on the same day and the SD and RSD were
determined.
63
2.3.3.5 Reproducibility:
Reproducibility for TMZ and Patrin-2 were carried out by analysing six samples of both
TMZ and Patrin-2 at a concentration of 0.02 mg/ml individually on the same day. Each
sample was analysed twice and the SD and RSD were determined.
2.3.3.6 Limit of detection (LOD) and Limit of quantification (LOQ):
The limit of detection (LOD) is the minimum concentration at which an analyte can be
detected. LOD for TMZ and Patrin-2 was carried out by diluting the samples from an
initial concentration of 0.01 mg/ml and gradually decreasing the concentration down to
a point where the detector was just able to distinguish between the signals to noise ratio.
Based on the limit of detection of TMZ and Patrin-2, the limit of quantification was
carried out by determining the lowest quantifiable concentration that could be achieved
in a repeated manner with an acceptable RSD.
2.4 Stability test of TMZ and Patrin-2:
In order to determine whether TMZ and Patrin-2 were compatible in PBS at a pH of 7.4
following tests were carried out.
2.4.1 Standard solution:
Standard solution for TMZ was prepared by dissolving 5 mg of the TMZ into a 100 ml
volumetric flask and then making up to the mark with the mobile phase, thus giving a
final concentration of 0.05 mg/ml. Similarly, two different solutions were prepared one
consisting of 5 mg of Patrin-2 and other consisting of a combination of 5 mg of each
TMZ and 5 mg of Patrin-2 dissolved in acetonitrile in a 100 ml volumetric flask, thus
providing a final concentration of 0.05 mg/ml for each. All the stock solutions were
stored in a refrigerator at 4 °C.

64
2.4.2 Compatibility test of the two drugs TMZ and Patrin-2:
TMZ, Patrin-2 and a combination of TMZ and Patrin-2 stock solutions were prepared at
a concentration of 0.05 mg/ml in mixture of PBS and ethanol (ratio of 8:2). The three
solutions were stored at: 25, 37 and 50 °C. The samples were analysed after every
3 days. In addition to these samples a dry sample reaction was carried out, a vial
consisting of 10 mg of TMZ and 10 mg of Patrin-2 were mixed and subjected to stress
condition at 50 °C for 1 week. Both the compounds were then solubilised in a mixture
of PBS and ethanol (ratio of 8:2) at concentrations of 0.05 mg/ml because Patrin-2 is not
soluble in PBS alone ethanol was introduced to dissolve Patrin-2 in the solution
maintaining the pH at 7.4.
2.5 To develop liposomal preparation of TMZ:
2.5.1 Freeze–Thaw method:
Liposomal formulation of TMZ was carried out by combining 10 mg of TMZ with
phospholipids in ratios 1:1, 1:2 and 1:3 (calculated in moles) and the phospholipid
providing the better entrapment was further combined with cholesterol in ratios 1:1:1,
1:2:1, 1:2:2, 1:3:1 and 1:3:2 (calculated in moles). To this mixture 2 ml of phosphate
buffered saline (PBS) of pH 7.01 was added and then placed on the rotor set at 34 rpm
for 30 min. The dispersion was vortexed intermittently for 30 min, this step was
performed in six cycles i.e. 2 min vortexing, 3 min interval in a water bath kept at 65
°C. After vortexing the dispersion, the mixture was immersed in liquid nitrogen for 3
min and then immediately transferred to a water bath kept at 65 °C for 6 min (the
freeze–thaw cycle was repeated six times) (Shazly et al., 2008). The entrapment of the
drug was aided by the freezing process, while the thawing process was used to rupture
multilamellar vesicles in order to help the incorporation of the enclosed contents with
the release medium. After completion of the freeze-thaw cycles, the liposomal

65
dispersion was allowed to stand for 1 hr to maximise further encapsulation of the drug
(Mohammed et al., 2004). The determination of the encapsulation efficiency (EE %)
was carried out as described in section 2.5.3.
[Phospholipid: lα-phosphatidylcholine, DMPC, DSPC, phospholipon 90H and lecithin]
2.5.2 Dehydration-Rehydration method:
Similar to thin film method: Liposomal formulation of TMZ was carried out by
combining 10 mg of TMZ with phospholipids in ratios 1:1, 1:2 and 1:3 (calculated in
moles) and the phospholipids providing the best entrapment was further combined with
cholesterol/stearic acid in ratios 1:1:1, 1:2:1, 1:2:2, 1:3:1 and 1:3:2 (calculated in
moles). To this mixture 2 ml of methanol and 10 ml of chloroform was added and then
transferred to a 50 ml round bottom flask. The flask containing the mixture was placed
on a rotary evaporator set at 65 °C for 4 hr to produce a thin film of the mixture. The
thin film was flashed with nitrogen gas for 15 min at approx. 4 psi in order to help
eliminate traces of the solvent in the film. The thin film was rehydrated with 2 ml of
PBS and the suspension was vortexed for 4 min (along with hand shaking the flask and
keeping it in the water bath at 40 °C) to form liposome (Glavas-Dodov et al., 2005).
After vortexing of the suspension, it was allowed to stand at room temperature for 1 hr
for further encapsulation of the drug to form liposome.
[Phospholipid: lα-phosphatidylcholine, DMPC, DSPC, phospholipon 90H and lecithin]
2.5.3 Determination of EE %:
The EE is the actual weight of the drug entrapped in the liposome compared to the
initial amount of drug weighed out. The determination of EE % of TMZ for
freeze-thaw and dehydration-rehydration method was carried out as described below.

66
Before sample (ADb): After 1 hr of incubation of the liposomal dispersion at 25 °C,
100 µl was taken and mixed with 2 ml of triton X-100 (10 %) and 7.90 ml HPLC grade
water to make it up to a final volume of 10 ml. The solution was maintained in a water
bath for 5 min at 65 °C and vortexed for 2 min and then analysed by HPLC
(Maestrelli et al., 2006).
After sample (ADa): The remaining liposome suspension was washed twice with PBS
(10 ml) and centrifuged for 30 min at 10000 g at a temperature of 4 °C. The pellet
obtained from the centrifugation was mixed with 2 ml of PBS. From the liposome
suspension 100 µl was removed and mixed with 2 ml of triton X-100 (10 %) and
7.90 ml HPLC grade water to produce a final volume of 10 ml. The solution was
maintained in a water bath at 65 °C for 5 min and vortexed for 2 min and then analysed
by HPLC (Kawano et al., 2003).
The EE % was determined by the following equation (Shazly et al., 2008):
EE %=ADa x 100
ADb
Where ADb and ADa are peak area obtained for TMZ in liposome before and after
washing with PBS, respectively.
2.6. Methods used for preparation of PLGA microparticles were emulsifying-
solvent evaporation method and spray dry method:
2.6.1. Emulsifying-solvent evaporation method:
Solution A: 200 mg of PLGA was dissolved in 10 ml of HPLC grade dichloromethane
to which 5 mg of TMZ was added and sonicated for 10 min.

67
Solution B: Polyvinyl alcohol (PVA) (2 %) solution was prepared by dissolving 2 g of
PVA in 100 ml of HPLC grade water continuously stirring the solution at 50 °C for
about 45 min.
80 ml of a volume of PVA (2 %) was kept at room temperature continuously stirred at
600 rpm using magnetic stirrer to which solution A was added. The emulsion was kept
continuously stirring at 600 rpm overnight in order to evaporate dichloromethane from
the solution. Once the organic solvent was completely removed, the suspension was
washed with HPLC grade water and the recovered microparticles were filtered using
0.7 µm glass fibre filter paper fitted in to a grade 3 glass sinter. The microparticles were
stored overnight in a desiccator in order to remove any residue of water from the
collected powder (Zhang and Gao, 2007). The microparticles were solubilised in 10 ml
of dichloromethane using a sonicator and 30 ml of methanol was added to the solution
in order to precipitate PLGA. The suspension was centrifuged for 30 min at 10000 g and
the supernatant was analysed by HPLC.
2.6.2 Determination of EE % of the TMZ loaded PLGA microparticles:
The EE is the actual weight of the drug entrapped in the polymeric carrier compared to
the initial amount of drug weighed out. The drug content in the supernatant was then
checked using HPLC.
The EE was determined from the following equation (Seong et al., 2003):
EE %= Dm × 100
Dt
Where Dt is the peak area obtained from the standard solution of TMZ and Dm is the
peak area obtained for TMZ in the microparticles.

68
Each preparation also involved the preparation of a standard solution (Dt) along with the
reaction mixture in order to measure the amount of drug encapsulated. The standard
solution was prepared by adding 5 mg of TMZ to a 40 ml volumetric flask dissolving it
with mobile phase (0.5 % acetic acid and methanol in the ratio 9:1) and making up to
the mark with the mobile phase. Analysis of the solution was carried out using HPLC.
Alternative method of calculation which can be used:
The EE was determined from the following equation (Seong et al., 2003):
EE %= Dm × 100
Dt
Where Dt is the amount of TMZ theoretically present in the microparticles collected (in
weight) and Dm is the peak area obtained for TMZ in the microparticles.
2.6.3 Spray dry method:
2.6.3.1 The preparation of TMZ loaded PLGA microparticles and Patrin-2 loaded
PLGA microparticles:
A sample of 100 mg of PLGA and 5 mg of TMZ were dissolved in 30 ml of acetone.
The solution was then spray dried using a mini spray dryer (Fig. 2.2). The aspirator was
set at 100 % and inlet temperature was set at 60 °C (10 °C higher than the boiling point
of acetone). The nitrogen q-flow was set at 30 mbar and the pump speed was adjusted to
20 %. The microparticles formed through spray drying were collected from the
collection vessel and the cyclone by washing with acetone. The acetone was evaporated
and the microparticle weighed out was approximately 32 mg. The microparticles were
again washed with 30 ml of water in order to remove any unencapsulated drug. The
suspension was centrifuged for 30 min at 20000 g with the temperature set at 4 °C and
the supernatant was analysed using HPLC. The pellet obtained was treated with 4 ml of

69
acetone to dissolve the microparticles followed by 25 ml of methanol to precipitate
PLGA. The suspension was centrifuged for 30 min at 10000 g with the temperature set
at 4 °C and supernatant was analysed using HPLC (Seong et al., 2003).
Figure 2.2 Mini Spray Dryer used for preparing the microparticles.
Patrin-2 loaded PLGA microparticles was prepared using the same protocol as
described in section 2.5.3.1 except the amount of microparticle collected and weighed
out was approximately 36 mg and that ethanol was used instead of water for washing
the microparticles.
2.6.3.2 Determination of EE % of TMZ and Patrin-2 loaded PLGA microparticles:
The EE % of TMZ and Patrin-2 was determined from the following equation
(Seong et al., 2003):

70
EE %= Dm × 100
Dt
Where Dt is the peak area obtained from the standard solution of TMZ and Dm is the
peak area obtained for TMZ in the microparticles.
Each preparation also involved the preparation of a standard solution (Dt) along with the
reaction mixture in order to measure the amount of drug encapsulated. The standard
solution was prepared by adding 5 mg of TMZ to a 30 ml volumetric flask dissolving it
with mobile phase (0.5 % acetic acid and methanol in the ratio 9:1) and making up to
the mark with the mobile phase. Similarly, standard solution for Patrin-2 was prepared
by adding 5 mg of Patrin-2 to a 30 ml of volumetric flask dissolving it with acetonitrile
and making up to the mark with acetonitrile. Analysis of the solutions was carried out
using HPLC.
Alternative method of calculation which can be used:
The EE was determined from the following equation (Seong et al., 2003):
EE %= Dm × 100
Dt
Where Dt is the amount of TMZ theoretically present in the microparticles collected (in
weight) and Dm is the peak area obtained for TMZ in the microparticles.
2.7 Particle size analysis of liposome and microparticles:
2.7.1 Particle size analysis of liposome using the mastersizer.
Liposome prepared by using freeze-thaw and dehydration-rehydration method were
analysed using the mastersizer (Fig. 2.3). Particle size distribution was plotted using a
computer program Mastersizer 2000 software version 5.20 which was supplied by the
manufacturer. The system was first cleaned with distilled water; the small volume
dispersion unit was filled with 100 ml of distilled water to which 200 µl of the sample

71
was added to reach the laser obscuration up to 12-13 % in order to obtain the particle
size.
Figure 2.3 Mastersizer 2000 used for particle size analysis.
2.7.2 Particle size analysis of microparticles using the scanning electron
microscopy (SEM).
The particle size and morphology was carried using a technique called scanning electron
microscopy (Fig. 2.4). The technique was applied for measuring microparticles prepared
by emulsifying-solvent evaporation and the spray drying method. Approximately 2 mg
of the microparticles was spread evenly on an aluminium stub which was plated with
gold at 50 milliamps and then placed in the chamber of the SEM for analysis. Images of
the particles were obtained using a computer program Quanta-XTM 200 version 2.01
supplied by the FEI Company, UK.

72
Figure 2.4 Scanning electron microscopy (SEM) used for Particle size analysis.
2.8. Dissolution techniques:
2.8.1. Dispersion method used for determination of release of TMZ and Patrin-2
from the microparticles:
In a screw-capped glass vial (30 ml) containing 25 ml of PBS at pH 7.4, 25 mg of
microparticles were dispersed by shaking at 200 rpm in an incubator maintained at
37 ± 0.5 °C (Shazly et al., 2008). At predetermined time intervals (0.5, 1, 2, 4, 6, 12, 24,
48,72, 96, 120, 144, 168, 192, 216, 240, 264, 288, 312 and 336 hr) an aliquot of 1 ml of
the dispersion was withdrawn and replaced with 1 ml of PBS. The aliquot was
centrifuged for 30 min at 13,000 g, and the supernatant was analysed using HPLC
(Burgess et al., 2002). The calculations were carried out using the amount of released
compound obtained by HPLC analysis and by using the regression equation obtained
from the calibration curve of both the compounds.
73
2.8.2. Dialysis bag method used for determination of release of TMZ and Patrin-2
from the microparticles:
During the preparation of the dialysis chamber, a 5 ml plastic tube was used with its
centre of the cap removed with a heated pasteur pipette (wide end). The reaction
mixture consisted of 25 mg of the microparticles to be dialyzed in a tube with 2.5 ml
PBS at pH 7.4. A piece of dialysis membrane was placed loosely over top of tube. The
cap of the tube was gently positioned on the tube and the tube was inverted (Fig. 2.4).
The sample was placed down onto the dialysis membrane and the tube was attached to a
50 ml beaker containing 25 ml PBS. The procedure ensured that no bubbles were
trapped under the membrane (Craig, 1967). The beaker was placed onto a magnetic
stirrer set at 37 ± 0.5 °C and a magnetic flea was set to rotate at 200 rpm in order to
encourage agitation. A control was set up along with the reaction mixture in order to
make a comparison the release of the compound. At predetermined time intervals (0.5,
1, 2, 4, 6, 12, 24, 48,72, 96, 120, 144, 168, 192, 216, 240, 264, 288, 312 and 336 hr) an
aliquot of 1 ml of the dispersion was withdrawn and replaced with 1 ml of PBS. The
samples were analysed by HPLC (Burgess et al., 2002). The calculations were carried
out using the amount of released compound obtained by HPLC analysis and by using
the regression equation obtained from the calibration curve of both the compounds.
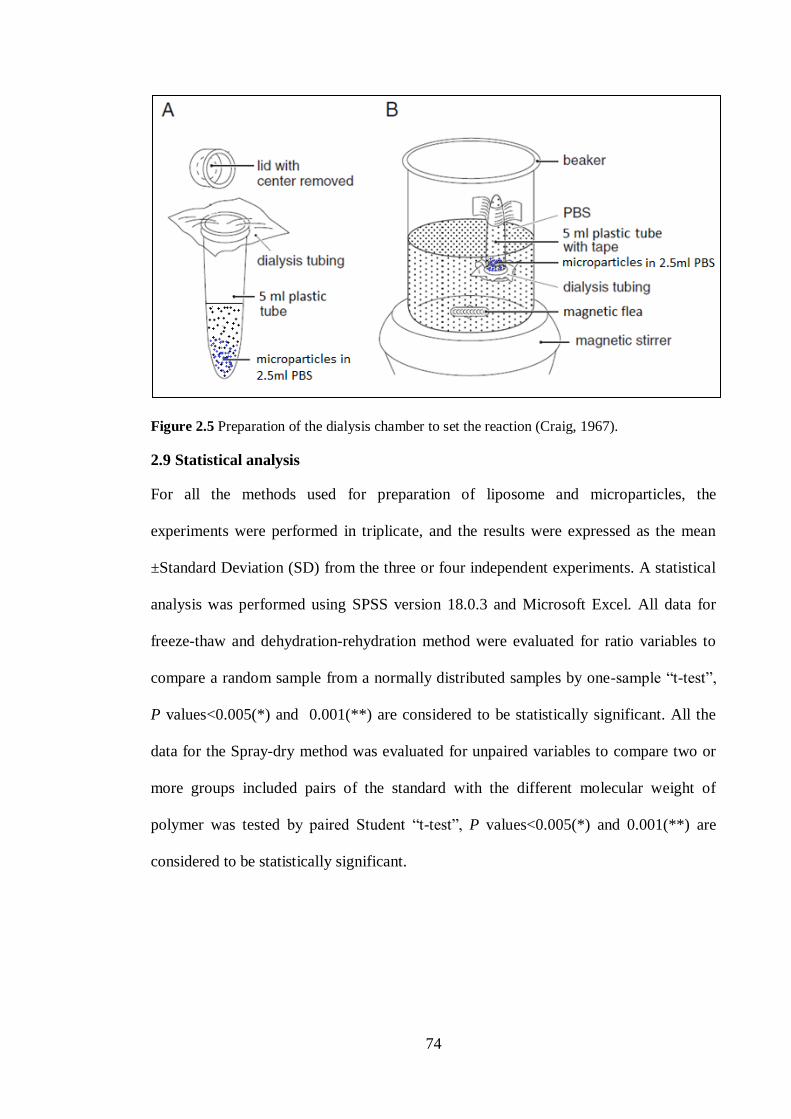
74
Figure 2.5 Preparation of the dialysis chamber to set the reaction (Craig, 1967).
2.9 Statistical analysis
For all the methods used for preparation of liposome and microparticles, the
experiments were performed in triplicate, and the results were expressed as the mean
±Standard Deviation (SD) from the three or four independent experiments. A statistical
analysis was performed using SPSS version 18.0.3 and Microsoft Excel. All data for
freeze-thaw and dehydration-rehydration method were evaluated for ratio variables to
compare a random sample from a normally distributed samples by one-sample “t-test”,
P values<0.005(*) and 0.001(**) are considered to be statistically significant. All the
data for the Spray-dry method was evaluated for unpaired variables to compare two or
more groups included pairs of the standard with the different molecular weight of
polymer was tested by paired Student “t-test”, P values<0.005(*) and 0.001(**) are
considered to be statistically significant.

75
CHAPTER 3
RESULTS
76
3.1 HPLC methods for TMZ and Patrin-2 analysis.
Good peak symmetry for TMZ and Patrin-2 were achieved using the mobile phase
consisting of 0.5 % acetic acid:methanol in the ratio of 9:1(v/v), (pH 2.8) and 35 %
acetonitrile consisting of 10 mM TBAA, 10 mM SDS and 25 mM citric acid, (pH 3.4),
respectively. TMZ was analysed at 330 nm while Patrin-2 was analysed at 287 nm. The
retention time (RT) for TMZ was found to be 3.7 while for Patrin-2 was found to be 5.6
min, respectively.
Validation of the HPLC method
The parameters used for the validation included linearity, repeatability, reproducibility,
limit of detection (LOD) and limit of quantification (LOQ) for the analysis of both TMZ
and Patrin-2 are summarised (Table 3.6).

77
3.1.1 Linearity testing
Linearity for TMZ and Patrin-2 were carried out in the range of 0.01-0.1 mg/ml (Table
3.1). The calibration curve for TMZ and Patrin-2 were both linear with regression
coefficients, R2 values equal to 0.999 and 0.989, respectively (Fig. 3.1).
Table 3.1 Linearity testing of TMZ and Patrin-2. Data values are the average of n = 3.
MPA- Mean Peak Area.
Concentration
(mg/ml)
TMZ
MPA
Patrin-2
MPA
0.1
5906.59
3122.22
0.08
4697.39
2745.64
0.06
3549.57
1750.64
0.04
2369.00
1109.55
0.02
1201.12
531.87
0.01
627.07
253.42

78
The mean peak areas obtained from the solution of concentration ranging from
0.01-0.1 mg/ml for the linearity test were used to plot the calibration curve from which
the regression coefficient was acquired (Fig. 3.1).
(a)
(b)
Figure 3.1 Calibration curve for TMZ and Patrin-2. (a) Calibration Curve for TMZ at
concentration ranging from 0.01-0.1 mg/ml. (b) Calibration Curve for Patrin-2 at concentration ranging from 0.01-0.1 mg/ml. Y denotes dependent variable and x is the independent variable
while R2 is the regression coefficient.

79
3.1.2 Repeatability
Repeatability of the analytical method was carried out for TMZ and Patrin-2 using a
concentration of 0.02 mg/ml (Table 3.2). The standard deviation (SD) for both TMZ and
Patrin-2 were found to be 4.46 and 7.02, respectively, and the related standard deviation
(RSD) for both TMZ and Patrin-2 was found to be 0.37 and 1.28, respectively. As the
RSD values for both the compounds were low the repeatability was acceptable.
Table 3.2 The repeatability results for TMZ and Patrin-2 at concentration of 0.02
mg/ml. The mean of the 6 injections was calculated from which the SD and RSD values
are obtained.
SD-Standard deviation
RSD-Relative standard deviation
No. of injections
of the sample
TMZ (0.02 mg/ml)
Peak Area
Patrin-2 (0.02
mg/ml )
Peak Area
1 1208.46 548.26
2 1214.39 540.00
3 1201.89 556.08
4 1206.48 544.25
5 1210.73 549.99
6 1212.17 558.62
Mean
1209.02
549.507
SD 4.456 7.01
RSD 0.37 1.28

80
3.1.3 Reproducibility
The results obtained from the reproducibility determination of TMZ and Patrin-2 was
carried out using six samples at a concentration of 0.02 mg/ml (Table 3.3). The SD for
both TMZ and Patrin-2 were found to be 5.34 and 4.04, respectively, and RSD for both
TMZ and Patrin-2 were found to be 0.44 and 0.73 respectively. The results obtained can
be considered as reproducible as a low RSD value was obtained for both the
compounds.
Table 3.3 The reproducibility results for TMZ and Patrin-2 at a concentration of 0.02
mg/ml. The mean of the 6 samples was calculated from which the SD and RSD values
are obtained. Data values are the average of n= 3.
Sample No.
TMZ (0.02 mg/ml)
Peak area
Patrin-2 (0.02
mg/ml)
Peak area
1 1206.17 554.19
2 1210.62 558.18
3 1213.87 548.26
4 1201.23 549.13
5 1214.47 556.66
6 1204.54 555.26
Mean 1208.48 553.61
SD 5.34 4.04
RSD 0.44 0.73
SD-standard deviation
RSD- Relative standard deviation

81
3.1.4 Limit of detection
LOD for both TMZ and Patrin-2 were found to be 3.90 µg/ml. As the injection was not
repeatable at the concentration of 3.90 µg/ml, however, a small peak could be detected
for qualitative purposes but cannot be quantified.
Table 3.4 Limit of detection for TMZ and Patrin-2. Data values are the average of
n = 3.
Concentration (µg/ml) TMZ
MPA
Patrin-2
MPA
500 300.81 117.45
250 151.23 55.73
125 60.40 25.14
62.5 29.30 12.24
31.25 14.03 5.85
15.62 7.08 3.88
7.81 3.46 1.69
3.91 1.63 0.845
MPA- Mean Peak Area.

82
3.1.5 Limit of quantification
The LOQ for both TMZ and Patrin-2 were 7.81 µg/ml and therefore the SD for both
TMZ and Patrin-2 were found to be 0.05 and RSD for both TMZ and Patrin-2 were
found to be 1.43 and 3.17, respectively.
Table 3.5 Limit of quantification of TMZ and Patrin-2 at a concentration of 7.81 µg/ml
was injected 6 times. The mean of the 6 injections was calculated from which the SD
and RSD values are obtained.
SD-standard deviation
RSD- Relative standard deviation
No. of
injections
TMZ
Peak Area
Patrin-2
Peak Area
1 3.58 1.64
2 3.49 1.58
3 3.61 1.55
4 3.52 1.67
5 3.62 1.57
6 3.55 1.66
Mean 3.56 1.61
SD 0.05 0.05
RSD 1.43 3.17

83
The results obtained from the HPLC analysis for validation of the system are
summarised (Table 3.6). Thus from these results the HPLC method was considered to
be reliable for the analysis of TMZ and Patrin-2 and further experiments were carried
out using both the compounds.
Table 3.6: A summary of the parameters used to validate the analytical HPLC method
for TMZ and Patrin-2.
Parameters TMZ Patrin-2
Analytical wavelength
(nm)
330 287
Stock solution (mg/ml) 0.1 0.1
Retention time (min) 3.5 5.6
Linearity range
(mg/ml)
0.01- 0.1 0.01- 0.1
Regression equation Y=585.79x + 31.872 Y=333.60x - 138.06
Correlation coefficient
(R2)
0.999 0.994
Repeatability (RSD) 0.37 1.28
Reproducibility (RSD) 0.44 0.73
Limit of detection
(µg/ml)
3.90 3.90
Limit of quantification
(µg/ml)
7.81 7.81
Limit of quantification
(RSD)
1.43 3.17
84
3.2 Stability test for TMZ and Patrin-2:
3.2.1 Compatibility test of TMZ and Patrin-2 carried out in mixture of PBS and
ethanol.
In order to determine whether TMZ and Patrin-2 were compatible in PBS at a pH of 7.4
the following tests were carried out. TMZ, Patrin-2 and a combination of TMZ and
Patrin-2 stock solutions were prepared at a concentration of 0.05 mg/ml in a mixture of
PBS and ethanol (ratio of 8:2). The three solutions were stored at 25, 37 and 50 °C.
Rapid degradation of TMZ was observed at 37 and 50 °C, whereas, Patrin-2 showed a
rapid degradation at 50 °C (Table 3.7 and 3.8). A combination of both TMZ and Patrin-
2 on HPLC analysis indicated rapid degradation products at 25, 37 and 50 °C (Table
3.9). Reaction between TMZ and patrin-2 has also been previously reported by Ranson
and his team (Ranson et al., 2007).

85
Degradation products of TMZ were observed at 37 and 50 °C from 72 to 288 hr while at
25 °C there was small amount of reduction in the peak area but no degradation product
was detected.
Table 3.7 The results for the stability of TMZ at a concentration of 0.05 mg/ml in PBS
and ethanol (ratio 8:2) solution stored for (a) 72 hr (b) 288 hr at three different
temperatures. The analysis of these samples were carried out using the HPLC with
mobile phase (0.5 % acetic acid:methanol in the ratio of 9:1). Data values are the
average of n = 3.
Temperature
(°C)
Time
(hr)
Retention time
(min)
MPA
Compound
25 72 2.08 2504.09 TMZ
288 7.43 1160.87 UDP
37 72 2.05
2.22
594.87
268.32
TMZ
UDP
288 2.15
6.13
17.50
12.79
21.90
1139.25
TMZ
UDP
UDP
50 72 2.02
2.17
137.66
72.46
TMZ
UDP
288 2.17
6.35
17.50
19.33
18.39
1115.70
TMZ
UDP
UDP
MPA- Mean Peak Area.
UDP- Unidentified Degradation Product.
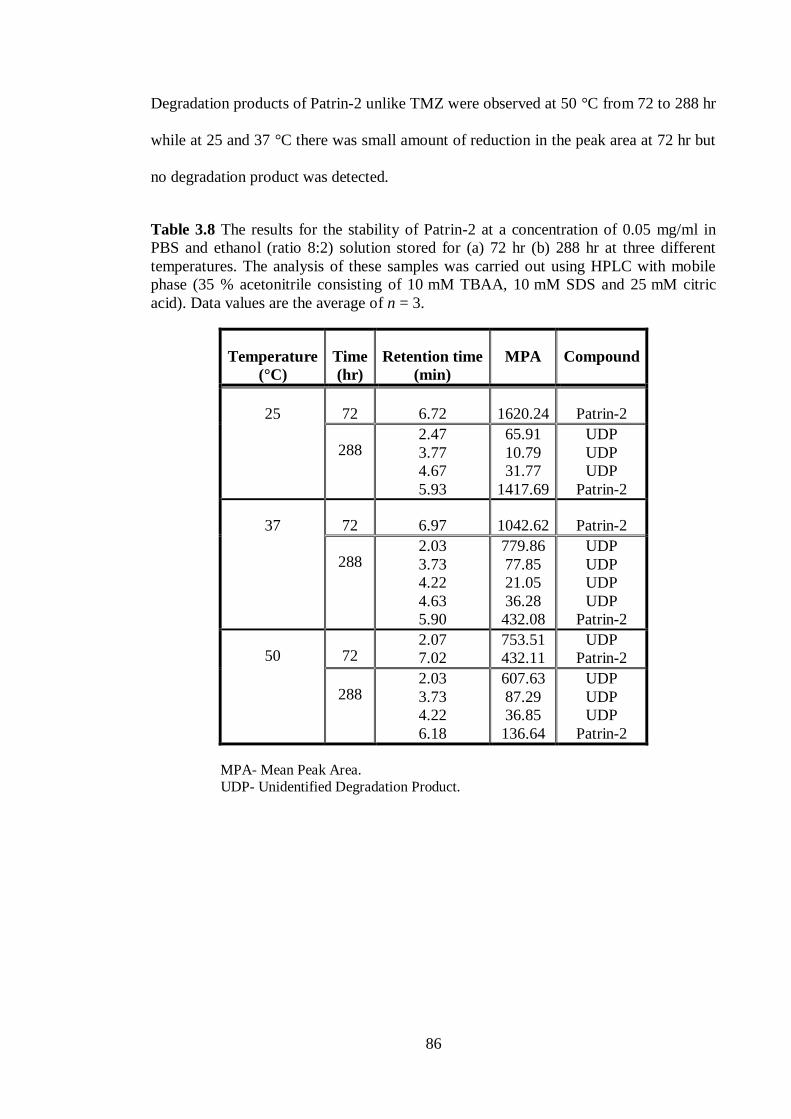
86
Degradation products of Patrin-2 unlike TMZ were observed at 50 °C from 72 to 288 hr
while at 25 and 37 °C there was small amount of reduction in the peak area at 72 hr but
no degradation product was detected.
Table 3.8 The results for the stability of Patrin-2 at a concentration of 0.05 mg/ml in
PBS and ethanol (ratio 8:2) solution stored for (a) 72 hr (b) 288 hr at three different
temperatures. The analysis of these samples was carried out using HPLC with mobile
phase (35 % acetonitrile consisting of 10 mM TBAA, 10 mM SDS and 25 mM citric
acid). Data values are the average of n = 3.
Temperature
(°C)
Time
(hr)
Retention time
(min)
MPA Compound
25 72 6.72 1620.24 Patrin-2
288 2.47
3.77
4.67
5.93
65.91
10.79
31.77
1417.69
UDP
UDP
UDP
Patrin-2
37 72 6.97 1042.62 Patrin-2
288 2.03
3.73
4.22
4.63
5.90
779.86
77.85
21.05
36.28
432.08
UDP
UDP
UDP
UDP
Patrin-2
50 72 2.07
7.02
753.51
432.11
UDP
Patrin-2
288 2.03
3.73
4.22
6.18
607.63
87.29
36.85
136.64
UDP
UDP
UDP
Patrin-2
MPA- Mean Peak Area.
UDP- Unidentified Degradation Product.

87
Rapid degradation products of TMZ and Patrin-2 on their combination were observed
from 72 hr at all three temperatures 25, 37 and 50 °C with large amount of reduction in
the peak areas of TMZ and Patrin-2. Thus the HPLC analysis of TMZ, Patrin-2 and
combination of both indicated that TMZ and Patrin-2 are not stable together.
Table 3.9 The results for the compatibility of TMZ and Patrin-2 at a concentration of
0.05 mg/ml in PBS and ethanol (ratio 8:2) solution stored for (a) 72 hr (b) 288 hr at
three different temperatures. The analysis of these samples were carried out using
HPLC with mobile phase (35 % acetonitrile consisting of 10 mM TBAA, 10 mM SDS
and 25 mM citric acid). Data values are the average of n = 3.
Temperature
(°C)
Time
(hr)
Retention time
(min)
MPA
Compound
25 72 2.03
6.57
7.65
1459.65
1253.87
319.64
TMZ
Patrin-2
UDP
288 2.18
4.12
4.58
10.10
231.41
320.23
163.23
533.06
TMZ
UDP
UDP
UDP
37 72 2.57
2.93
6.62
499.12
342.71
1208.92
TMZ
UDP
Patrin-2
288 2.37
2.82
4.35
6.18
3128.12
762.41
484.07
458.80
TMZ
UDP
UDP
Patrin-2
50 72 2.60
2.98
7.00
443.66
356.38
697.83
TMZ
UDP
Patrin-2
288 2.02
2.43
2.77
3.73
4.20
6.13
738.84
494.62
416.74
120.69
48.11
195.94
TMZ
UDP
UDP
UDP
UDP
Patrin-2
MPA- Mean Peak Area.
UDP- Unidentified Degradation Product.
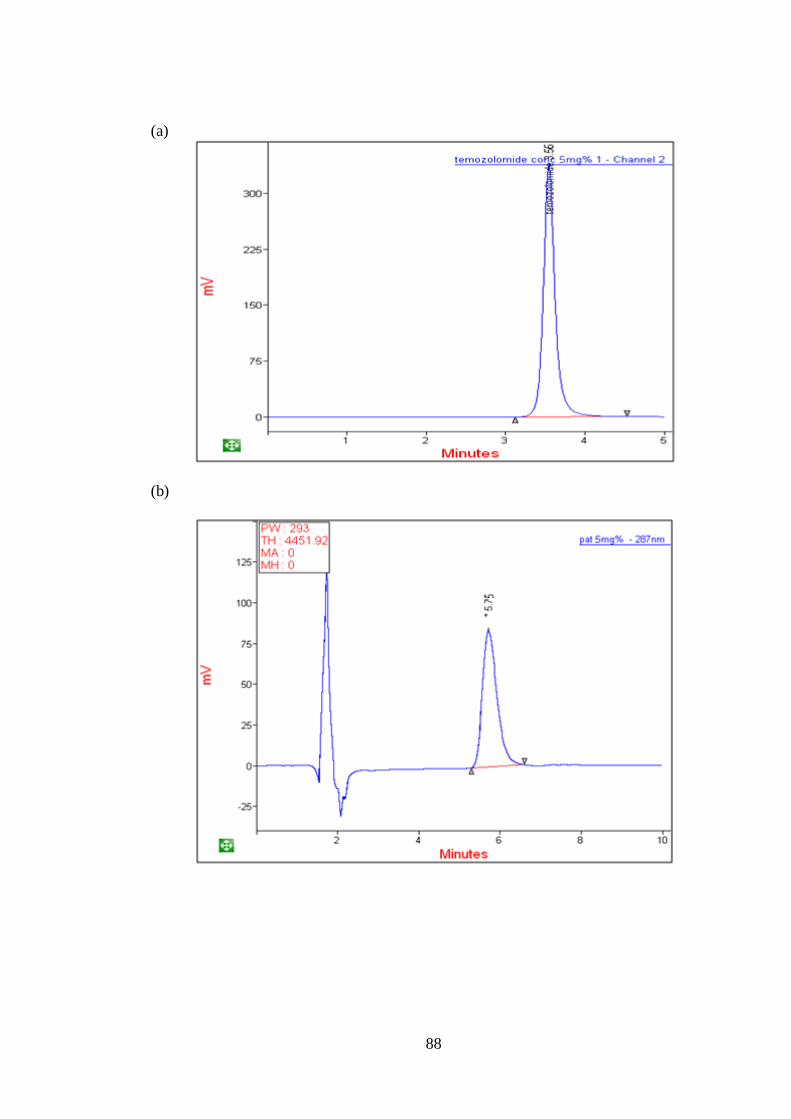
88
(a)
(b)

89
(c)
Figure 3.2 HPLC chromatogram for the compatibility of TMZ and Patrin-2 at a concentration
of 0.05 mg/ml (a) TMZ Standard solution in mobile phase (n = 3), (b) Patrin-2 standard
solution in acetonitrile (n = 3) and (c) TMZ and Patrin-2 mixture in PBS and ethanol (ratio
8:2) solution stored for 288 hr at 37°C (n = 3).
3.2.2 Dry sample reaction carried out for the determination of compatibility of
TMZ and Patrin-2 at 50 °C.
When 10 mg of TMZ and 10 mg of Patrin-2 were mixed and subjected to stress
conditions at 50 °C for a period of 1 week, both compounds were solubilised in a
mixture of PBS and ethanol (ratio of 8:2) and a concentration made up to 0.05 mg/ml.
HPLC analysis clearly indicated that degradation had occurred and thus provided
further evidence that proved TMZ and Patrin-2 to be incompatible.

90
Table 3.10 The results testing the compatibility of TMZ and Patrin-2 at a concentration
of 0.05 mg/ml in PBS and ethanol solution. The analysis of this sample was carried out
using HPLC with mobile phase (35 % acetonitrile consisting of 10 mM TBAA, 10 mM
SDS and 25 mM citric acid). Data values are the average of n = 3.
Concentration
(mg/ml)
Retention time
(min)
MPA
Compound
0.05 2.50
2.87
4.02
4.98
6.43
310.06
329.33
4.39
5.86
972.39
TMZ
UDP
UDP
UDP
Patrin-2
MPA- Mean Peak Area.
UDP- Unidentified Degradation Product.
3.3 Results of attempted preparations of various liposome formulations using TMZ
as the active compound.
3.3.1 Freeze-Thaw method.
The liposomal formulation of TMZ was carried out by combining 10 mg of TMZ with
phospholipids in different ratios and also using the combination of phospholipids and
cholesterol to maximise the entrapment of TMZ. The lowest EE % obtained using the
freeze-thaw method was with the use of DMPC and TMZ, use of other phospholipids
such as lα-phosphatidylcholine, lecithin, phospholipon 90H and DSPC also did not
proved to be suitable to give a better EE % (Table 3.11).
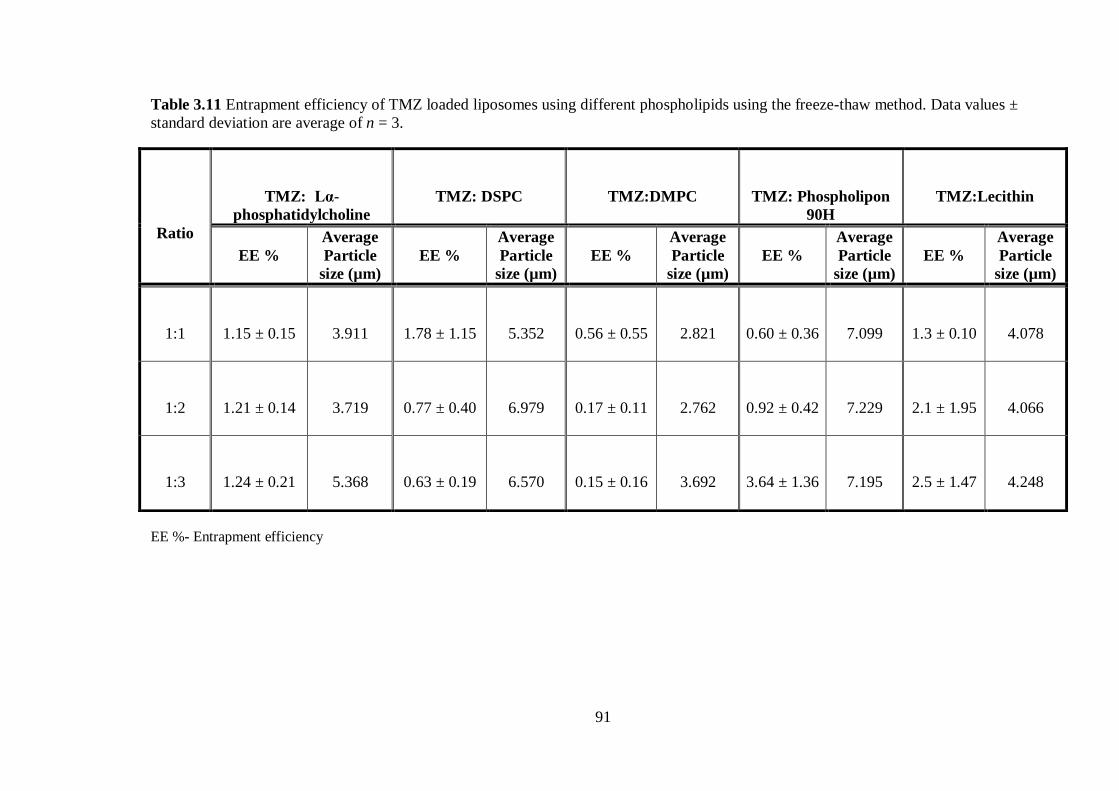
91
Table 3.11 Entrapment efficiency of TMZ loaded liposomes using different phospholipids using the freeze-thaw method. Data values ±
standard deviation are average of n = 3.
EE %- Entrapment efficiency
Ratio
TMZ: Lα-
phosphatidylcholine
TMZ: DSPC
TMZ:DMPC
TMZ: Phospholipon
90H
TMZ:Lecithin
EE %
Average
Particle
size (µm)
EE %
Average
Particle
size (µm)
EE %
Average
Particle
size (µm)
EE %
Average
Particle
size (µm)
EE %
Average
Particle
size (µm)
1:1
1.15 ± 0.15
3.911
1.78 ± 1.15
5.352
0.56 ± 0.55
2.821
0.60 ± 0.36
7.099
1.3 ± 0.10
4.078
1:2
1.21 ± 0.14
3.719
0.77 ± 0.40
6.979
0.17 ± 0.11
2.762
0.92 ± 0.42
7.229
2.1 ± 1.95
4.066
1:3
1.24 ± 0.21
5.368
0.63 ± 0.19
6.570
0.15 ± 0.16
3.692
3.64 ± 1.36
7.195
2.5 ± 1.47
4.248

92
The combination of phospholipids and cholesterol was experimented to improve the
EE % of TMZ (Table 3.12). The combination of phospholipon 90H and cholesterol was
analysed to give the maximum entrapment of 11.54 ± 0.67 % from the freeze-thaw
method while the combination of lα-phosphatidylcholine and cholesterol did not
indicate any difference in the EE % of TMZ when compared to the EE % of TMZ with
lα-phosphatidylcholine (Table 3.11 and 3.12).
Table 3.12 Entrapment efficiency of TMZ loaded liposomes with a combination of
phospholipon 90H and cholesterol and a combination of lα-phosphatidylcholine and
cholesterol using the freeze-thaw method. Data values ± standard deviation are average
of n = 3.
EE %: Entrapment efficiency.
Ratio
TMZ: Phospholipon 90H:
Cholesterol
TMZ: Lα-phosphatidylcholine
:
Cholesterol
EE %
Average
Particle size
(µm)
EE %
Average
Particle size
(µm)
1:1:1
7.56 ± 1.06
7.752
0.98 ± 0.61
6.821
1:2:1
6.32 ± 3.73
6.078
1.13 ± 0.16
6.799
1:2:2
11.54 ± 0.67
10.654
0.74 ± 0.37
6.910
1:3:1
11.02 ± 0.60
9.086
0.84 ± 0.44
5.912
1:3:2
10.38 ± 0.54
9.002
0.91 ± 0.75
6.871

93
3.3.2 Dehydration-Rehydration method.
The liposomal formulation of TMZ was carried out by combining 10 mg of TMZ with
phospholipids in different ratios and also using a combination of phospholipids and
cholesterol/stearic acid in order to optimise the entrapment of TMZ. Use of
phospholipids alone with TMZ did not proved to be suitable to give a better EE % of
TMZ (Table 3.13).
Table 3.13 Entrapment efficiency achieved from TMZ loaded liposomes with the
phospholipids using the dehydration-rehydration method. Data values ± standard
deviation are average of n = 3.
EE %: Entrapment efficiency
Ratio
TMZ: Phospholipon 90H
TMZ: Lecithin
EE %
Average
Particle
size (µm)
EE %
Average
Particle
size (µm)
1:1
0.27 ± 0.16
7.116
0.57 ± 0.31
6.019
1:2
0.25 ± 0.11
7.119
0.45 ± 0.33
7.062
1:3
0.24 ± 0.20
7.231
0.53 ± 0.09
7.023

94
The combination of phospholipids and cholesterol was optimised to improve the EE %
of TMZ (Table 3.14). A combination of phospholipon 90H and cholesterol was found to
provide a maximum entrapment of 26.69 ± 0.34 % from the dehydration-rehydration
method.
Table 3.14 Entrapment efficiency achieved from TMZ loaded liposome with the
phospholipids in combination with cholesterol using the dehydration-rehydration
method. Data values ± standard deviation are average of n = 3.
EE %: Entrapment efficiency
Ratio
TMZ:Phospholipon 90H:
Cholesterol
TMZ:Lecithin:
Cholesterol
EE %
Particle size
(µm)
EE %
Particle size
(µm)
1:1:1
2.43 ± 1.40
7.341
0.50 ± 0.54
7.189
1:2:1
2.25 ± 1.35
7.412
0.51 ± 0.60
7.061
1:2:2
26.69 ± 0.34
12.306
1.16 ± 0.11
7.621
1:3:1
13.61 ± 1.16
7.089
0.23 ± 0.08
7.168
1:3:2
19.36 ± 2.13
7.921
0.67 ± 0.46
7.211

95
The combination of phospholipids and stearic acid was experimented to for similar
reasons as for cholesterol. The combination of phospholipon 90H and stearic acid did
not indicate any difference in the EE % of TMZ when compared to the EE % of TMZ
with phospholipon 90H while the combination of lecithin and stearic acid showed
increase in the EE % as compared to the EE % of TMZ with lecithin (Table 3.13 and
3.15).
Table 3.15 Entrapment efficiency achieved from TMZ loaded liposome with
phospholipids mentioned in the table below in combination with stearic acid using the
dehydration-rehydration method. Data values ± standard deviation are average of n = 3.
EE %: Entrapment efficiency
Ratio
TMZ: Phospholipon 90H: Stearic
acid
TMZ: Lecithin: Stearic
acid
EE %
Average
Particle
size(µm)
EE %
Average
Particle
size(µm)
1:1:1
1.01 ± 0.35
6.834
1.98 ± 0.24
6.985
1:2:1
0.95 ± 0.33
5.126
4.94 ± 0.41
6.519
1:2:2
1.09 ± 0.24
5.981
2.73 ± 0.27
7.106
1:3:1
1.11 ± 0.19
6.286
5.09 ± 0.67
7.135
1:3:2
0.98 ± 0.30
6.121
6.65 ± 1.86
7.083

96
3.3.3 A comparison between Freeze-thaw and Dehydration-Rehydration methods
used for the preparation TMZ loaded liposomes.
Different ratios of phospholipon 90H and combinations of phospholipon 90H with
cholesterol were used in order to prepare TMZ loaded liposomes. In the experiment
involving the freeze-thaw method there was a significant increase (*, P<0.005) in the
EE % when a combination of phospholipon 90H and cholesterol was used at ratios of
1:2:2, 1:3:1 and 1:3:3 compared to the other ratios. In the dehydration-rehydration
method, similar to freeze-thaw method a combination of phospholipon 90H and
cholesterol showed the maximum EE %. As shown in the Fig. 3.2 there is a significant
increase (**, P<0.001) in the EE % at a ratio 1:2:2, while the ratios 1:3:1 and 1:3:2
showed an increase in the EE % compared to the other ratios, however, there was a
significant decrease (*, P<0.005) in the EE % compared with the ratio 1:2:2
(**, P<0.001). On comparing the freeze-thaw and dehydration-rehydration methods
using a 1:2:2 ratio, the dehydration-rehydration method showed a significant increase
(**, P<0.001) in the EE % as opposed to a *, P<0.005 value for the freeze-thaw
method.
Figure 3.3 Comparison between Freeze-Thaw and Dehydration-Rehydration method. The
effect of different ratios of phospholipon 90H and on combining it with cholesterol in order to
encapsulate TMZ comparing two methods freeze-thaw and dehydration-rehydration using a 1:2:2 ratio, the dehydration-rehydration method showed a significant increase (**, P<0.001) in
the EE % as opposed to a P<0.005 value for the freeze-thaw method. Data obtained are
expressed as mean ± S.D of EE %, where n = 3.

97
3.4 Preparation of PLGA microparticles using two procedures.
Microparticles were prepared using PLGA of different molecular weights (MW). Two
procedures were used for the preparation of the microparticles. However, in both
procedures PLGA with an average molecular weight (MW) of 1.7x10⁴ Da showed
maximum entrapment of TMZ.
3.4.1 Emulsifying-Solvent Evaporation method.
In order to prepare TMZ loaded PLGA microparticles the emulsifying solvent
evaporation method was used. The maximum entrapment achieved using this method
was not more than 2.76 ± 0.36 %, however modification in this technique and as from
the literature it is possible to obtain the preparation of TMZ loaded PLGA
microparticles with better EE% (Zhang and Gao, 2007).
Table 3.16 The entrapment efficiencies achieved when TMZ was used to prepare
PLGA microparticles using the emulsifying solvent evaporation method and varying the
MW of PLGA. The PLGA with a MW of 1.7 x 10⁴ Da showed the maximum
entrapment of TMZ. Data values ± standard deviation are average of n = 3.
PLGA
MW (Da)
EE %
1.7x10⁴
2.76 ± 0.36
1.5x10⁴- 4x10
4
2.56 ± 0.10
4x10⁴- 7.5x10
4
2.01 ± 0.36
6.6x10⁴- 1x10
5
1.62 ± 0.39
PLGA- Poly (DL-lactide-co-glycolide)
MW- Molecular weight
Da- Dalton
EE %- Entrapment efficiency
From the HPLC analysis the mean peak area of the standard solution used to calculate
the EE % was 6456.41.

98
3.4.2 Spray dry method
Spray dry method used for obtaining TMZ loaded PLGA microparticles and
Patrin-2 loaded PLGA microparticles.
The spray dry method was used to prepare microparticles of both TMZ and Patrin-2
using PLGA as the vehicle. Maximum entrapment using this method was achieved
when TMZ was used affording a 64.32 ± 2.58 % encapsulation efficiency while for
Patrin-2 a 68.47 ± 1.47 % encapsulation efficiency was achieved. Thus this technique
was found to be successful for the preparation of both TMZ and Patrin-2 loaded PLGA
microparticles. However the analytical method used for calculation needs improvement
in order to obtain higher encapsulation.
Table 3.17 The entrapment efficiency obtained from TMZ loaded PLGA microparticles
and Patrin-2 loaded PLGA microparticles by varying the MW of PLGA using the Spray
Dry method with PLGA of MW 1.7 x 10⁴ Da showed the maximum entrapment with
TMZ. Data values ± standard deviation are average of n = 3.
PLGA
MW (Da)
TMZ
EE %
Patrin-2
EE %
1.7x10⁴
64.32 ± 2.58
68.47 ± 1.47
1.5x10⁴- 4x10
4
18.77 ± 0.67
24.76 ± 1.46
4x10⁴- 7.5x10
4
19.35 ± 1.92
6.65 ± 0.90
6.6x10⁴- 1x10
5
12.15 ± 2.14
3.20 ± 0.17
PLGA- Poly (DL-lactide-co-glycolide)
MW- Molecular weight
Da-Dalton EE %- Entrapment efficiency
From the HPLC analysis, the mean peak area of the standard solution for TMZ and
Patrin-2 used to calculate the EE % was 3832.56 and 8023.08, respectively.

99
(a)
(b)
Figure 3.4 Spray dry method. The effect of varying MW of PLGA used for encapsulation of (a) TMZ and (b) Patrin-2 using Spray Dry method. Both TMZ and Patrin-2 gave maximum
entrapment with the PLGA of MW of 1.7x10⁴ Da. Data obtained are expressed as mean ± S.D
of EE %, where n = 3.

100
3.5 Particle size analysis of liposome and microparticles:
3.5.1 Particle size analysis of liposome using the mastersizer.
Liposomes prepared by the freeze-thaw and dehydration-rehydration method were
analysed using the mastersizer. The maximum entrapment of TMZ in liposomes was
achieved by using a combination of phospholipon 90H and cholesterol in both the
methods. (Fig. 3.4).
(a)
(b)
Figure 3.5 Particle size distributions. (a) Particle size of the TMZ loaded liposome consisting
of phospholipon 90H and cholesterol using the freeze-thaw method is 10.654 µm. (b) Particle
size of the TMZ loaded liposome consisting of phospholipon 90H and cholesterol using the
dehydration-rehydration method is 12.306 µm.
3.5.2 Particle size analysis of microparticles using the Scanning Electron
Microscopy (SEM).
The technique was applied for measuring microparticles prepared by the emulsifying-
solvent evaporation and the spray dry method. Maximum entrapment of TMZ loaded
PLGA microparticles and Patrin-2 loaded PLGA microparticles were achieved using the

101
spray dry method with the PLGA of MW of 1.7x10⁴ Da. The microparticles were found
to be spherical in shape (Fig. 3.5).
(a) (b)

102
(c) (d)
(e) (f)
Figure 3.6 Particle size analyses. The particle size and morphology of the TMZ loaded PLGA microparticles are shown in Fig. (a), (b) and (c) while for Patrin-2 loaded PLGA microparticles
is shown in Fig. (d), (e) and (f). The particles appear to be amorphous, smooth and spherical in
shape. However, TMZ microparticles shown in (b) indicates small amount of pore formation on the surface of the microparticles.
3.6 Dissolution techniques

103
The dispersion and dialysis method were used to monitor the release of TMZ and
Patrin-2 from the PLGA microparticles.
3.6.1.1 Dispersion Method used for determining the release of TMZ from the
microparticles.
The release profile of TMZ from PLGA microparticles was monitored in PBS, pH 7.4 at
37 ± 0.5 °C. A plot of the percentage cumulative amount released of TMZ against time
(Fig. 3.6) was obtained. From the release profiles, it was found that an initial burst of
TMZ release was during the first 30 min of analysis followed by a gradual decrease in
the concentration of TMZ. The cumulative mass of TMZ was calculated at 0.5 hr which
is 407.06 µg in concentration as shown in Table 3.18, however, the total amount of
TMZ theoretically present in TMZ loaded PLGA particles at the beginning of the in
vitro release was 1200 µg. As degradation of the drug takes place are when kept at
37 °C could be the reason for not obtaining the expected amount.
Table 3.18 From HPLC analysis TMZ release from PLGA microparticles was detected
and from the peak area obtained the cumulative mass release was calculated. Data value
are the average of n = 2.

104
Time
(hr)
MPA
Cumulative mass
release (µg)
0.5 985.52 407.06
1 914.95 393.22
2 603.32 275.28
4 248.99 133.79
6 116.22 80.83
12 30.4 45.64
24 6.56 35.44
48 4.29 34.03
72 3.14 33.07
96 3.09 32.56
120 3.04 32.05
144 2.95 31.52
168 2.82 30.97
192 2.29 30.25
216 Not detected Not detected
MPA-Mean Peak Area
The percentage of cumulative release of TMZ against time (Fig. 3.6) was plotted
indicating the release pattern of TMZ. During the first 30 minutes of analysis TMZ

105
showed an initial burst followed by a gradual decrease in the concentration of TMZ
which could be due to degradation of the drug at 37 °C.
Figure 3.7 Release pattern of TMZ from PLGA microparticles. TMZ released from PLGA microparticles in PBS at pH 7.4 and at 37 ± 0.5 °C using the dispersion method.
3.6.1.2 Dispersion Method used for determining the release of Patrin-2 from
microparticles.
0
20
40
60
80
100
120
0 50 100 150 200 250
Cu
mu
lati
ve re
leas
e(%
)
Time (hr)
Temozolomide

106
The release profile of Patrin-2 from PLGA microparticles in PBS at pH 7.4 and at
37 ± 0.5 °C. A plot of the percentage cumulative release of Patrin-2 against time
(Fig. 3.7) was obtained. From the release profile, it was found that the release rate of
Patrin-2 was slow with an initial burst of Patrin-2 released followed by an increase in
peak area i.e. increase in concentration of Patrin-2. The cumulative mass of Patrin-2 was
calculated the highest amount was equivalent to 196.16 µg as shown in Table 3.19,
however the total amount of Patrin-2 theoretically present in TMZ loaded PLGA
particles at the beginning of the in vitro release was 1500 µg. As degradation of the drug
takes place are when kept at 37 °C could be the reason for not obtaining the expected
amount.
Table 3.19 Patrin-2 released from PLGA microparticles was detected and from the peak
area obtained the cumulative mass was calculated. Data value are the average of n = 2.

107
Time
(hr)
MPA
Cumulative mass
release (µg)
0.5 22.87 120.56
1 23.89 126.14
2 33.35 138.08
4 45.75 152.51
6 44.42 157.03
12 48.95 165.89
24 65.26 183.71
48 69.4 192.91
72 58.91 191.27
96 51.18 191.38
120 50 196.16
144 40.51 194.69
168 12.69 179.19
192 19.44 188.77
216 24.69 189.40
240 25.19 189.90
264 29.43 190.52
288 31.01 191.07
312 Not detected Not detected
MPA-Mean Peak Area.
The percentage of cumulative release of Patrin-2 against time (Fig. 3.7) was plotted
indicating the release pattern of Patrin-2. During the first 30 min of analysis Patrin-2
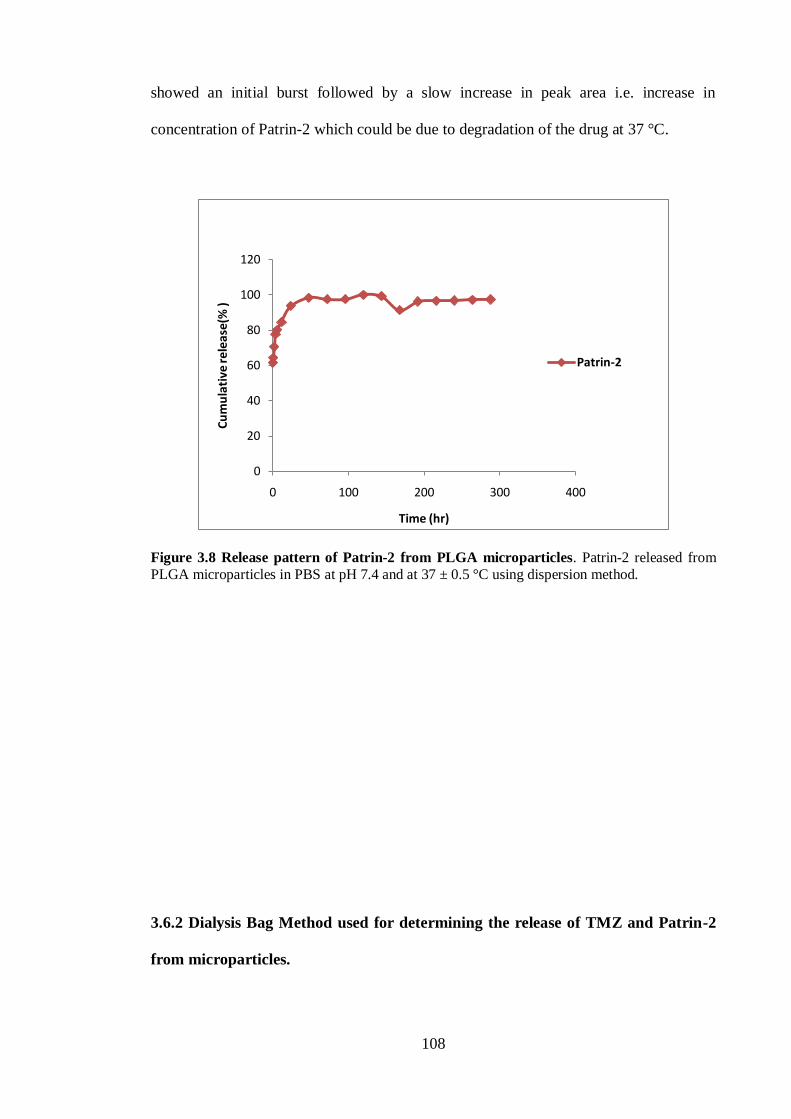
108
showed an initial burst followed by a slow increase in peak area i.e. increase in
concentration of Patrin-2 which could be due to degradation of the drug at 37 °C.
Figure 3.8 Release pattern of Patrin-2 from PLGA microparticles. Patrin-2 released from
PLGA microparticles in PBS at pH 7.4 and at 37 ± 0.5 °C using dispersion method.
3.6.2 Dialysis Bag Method used for determining the release of TMZ and Patrin-2
from microparticles.
0
20
40
60
80
100
120
0 100 200 300 400
Cu
mu
lati
ve re
leas
e(%
)
Time (hr)
Patrin-2
109
The release profiles of TMZ and Patrin-2 from PLGA microparticles in PBS at a pH 7.4
and at a temperature of 37 ± 0.5 °C. The results were analysed using HPLC. The peak
area obtained for both TMZ and Patrin-2 was too low to carry out the cumulative
amount released. The peak area of the control as well for both TMZ and Patrin-2 was
found to be low.

110
CHAPTER 4
DISCUSSION, CONCLUSION
AND FUTURE PROSPECTS
4.1 Validation of HPLC system

111
A validation of the HPLC method was carried out following standard procedures using
validation of compendial methods of USP. The mobile phase selection for TMZ was
carried out by referring to a previously established method, i.e. 0.5 % acetic
acid:methanol in the ratio of 9:1 (pH 2.8) while 35 % acetonitrile consisting of 10 mM
TBAA, 10 mM SDS and 25 mM citric acid (pH 3.4) was found to be suitable selection
of mobile phase for analysis of Patrin-2 (Moffat et al., 2004; Shervington et al., 2005).
The retention time of TMZ was found to be 3.7 min while Patrin-2 the retention time
was found to be 5.6 min. A calibration curve measuring the peak area against six
concentrations for TMZ and Patrin-2 were found to be linear in the range investigated.
The regression coefficient, R2
values for TMZ and Patrin-2 were found to be 0.999 and
0.994, respectively. The SD and RSD indicated acceptable precision of the methods and
the limit of detection (LOD) and limit of quantification (LOQ) were determined (Table
3.6). The LOD and LOQ concentration of TMZ and Patrin-2 was found to be the same
which is possible as both the compounds are chromophores responsible for DNA
cleavage (Shen et al., 1995). Based on the data obtained from the validation procedures,
the methods were found suitable for carrying out the experiments involving the
preparations of liposome and microparticles.
4.2 Stability test of TMZ and Patrin-2:
An initial compatibility test was carried out to investigate whether TMZ and Patrin-2
could be formulated together. Thus, to ensure the stability of TMZ and Patrin-2, both
the compounds were stored individually and as a mixture in PBS and ethanol (ratio of
8:2) at pH 7.4 at temperature 25, 37 and 50 °C. Rapid degradation of TMZ was
observed at both 37 and 50 °C when stored for 72 hr, whereas Patrin-2 showed
excessive degradation after storage at 50 °C for 72 hr. When in combination both TMZ
and Patrin-2 showed early and rapid degradation at all three incubating temperatures at
112
a period of 72 hr. Powdered samples of TMZ and Patrin-2 were also stored at 50 °C for
1 week and then analysed after solubilising in PBS/ ethanol (8:2) at pH 7.4. Although
there was a considerable quantity of both TMZ and Patrin-2 intact, there were several
peaks observed that corresponded to degradation products (Table 3.10). Based on these
observations, a personal communication and a previous report by Ranson and his team it
was decided not to combine TMZ and Patrin-2 for preparing of either liposomes or
PLGA microparticles (Ranson et al., 2007). Ranson et al also reported that TMZ and
Patrin-2 when given in combination to the patient results in increased incidence of
haematological adverse events like thrombocytopenia and neutropenia
(Ranson et al., 2007).
4.3 Attempted preparation of various liposome formulation of TMZ using freeze-
thaw and dehydration-rehydration method.
Different ratios of phospholipid individually as well as in combination with cholesterol
were used to prepare TMZ loaded liposomes. It was observed that the EE % varied from
one phospholipid to another, Ostro, 1983 also reported similar observations. The highest
value of EE % calculated for this method was found when phospholipon 90H and
cholesterol were used, while the lowest EE % was estabilished when liposomes were
prepared with DMPC. The differences may be due to the variation in the phase
transition temperatures and in the acyl chain length (Anderson and Omri, 2004). As
shown in Fig. 1.13 phospholipon 90H has longer acyl chain and higher phase transition
temperature (54 °C) compared to DMPC (Fig. 1.11b). Phospholipon 90H was
comparatively better than DMPC, however, when phospholipon 90H was used alone
there was no improvement in the EE %, and hence was combined with cholesterol
(shown in Fig. 3.2). The maximum EE % achieved using this method was still rather
low, with a maximum value of 11.54 ± 0.67 %. This may have been attributed to the

113
low affinity and solubility of TMZ with the lipid which constitutes the liposomal
membrane increasing the chances of TMZ being entrapped in the aqueous compartment,
thus, less amount of medium entrapped gives lower EE % (Vadiei et al., 1989; Gulati et
al., 1998). Hence, the use of cholesterol increases the EE % as it makes the membrane
more rigid and reduces the drug from escaping (Liu et al., 2002).
Similar to the freeze-thaw method different ratios of phospholipid were used in addition
to combinations with cholesterol/stearic acid to prepare TMZ loaded liposomes using
dehydration-rehydration method. The highest of EE % obtained was when TMZ:
phospholipion 90H: cholesterol in a ratio 1:2:2 was used achieving 26.69 ± 0.34 %.
When TMZ and phospholipon 90H was used, the EE % was very low. Cholesterol was
included in the formulation in order to increase the strength of the membrane. With the
inclusion of stearic acid there was no significant improvement in the EE %
(Gomez-hens and Fernandez- Romero, 2005). Thus showing cholesterol to be more
suitable for preparing TMZ loaded liposomes. Although the EE % achieved with
phospholipon 90H and cholesterol was not high, this may have been attributed to the
low affinity and solubility of TMZ with the lipid (Vadiei et al., 1989; Gulati et al.,
1998).
On comparing the EE % between freeze-thaw and dehydration-rehydration methods
using the same concentration of phospholipids and TMZ, the EE % achieved by the
dehydration-rehydration method was up to twice that of the freeze-thaw method (Refer
to result section: 3.3.3). This could have been attributed to the dehydration-rehydration
method involving the simultaneous trapping of most of the components. The membrane
boundaries of the vesicles are reported to protect the encapsulated material under
extreme conditions (Monnard et al., 1997). Important features of the two methods in
addition to significant entrapment of the active compound is the broad range of
114
biologically active agents that can be used and liposomes prepared present stable solute
retention characteristics. These two methods are relatively simple and do not require use
of organic solvents or detergents (Ostro, 1983l; Mayer et al., 1986). In this study
different ratios of phospholipid were used individually as well as in combination with
cholesterol/stearic acid were used in both the methods. However, a combination of
phospholipon 90H together with cholesterol showed maximum entrapment in both
methods. In the freeze-thaw method there was a significant increase (*, P<0.005) in the
EE % when a combination of TMZ, phospholipon 90H and cholesterol were used at
ratios of 1:2:2, 1:3:1 and 1:3:3 (Refer to result section: 3.3.3). When only TMZ and
phospholipon 90H were used at ratios of 1:1, 1:2 and 1:3 low entrapment of TMZ was
achieved as shown in Fig 3.2 which reinforced the importance of the use of cholesterol.
In dehydration-rehydration method using similar combinations to the freeze-thaw
method the combination of phospholipon 90H and cholesterol showed maximum EE %.
As shown in the Fig. 3.2 there is a significant increase (**, P<0.001) in the EE % at
1:2:2 ratio, while the 1:3:1 and 1:3:2 ratios showed less significant increase
(*, P< 0.005) in the EE % when compared to other ratios such as 1:1:1 and 1:2:1 as
well as with ratios of phospholipon 90H alone with TMZ i.e. 1:1, 1:2 and 1:3. In
comparing the EE % shown in table 3.13 and 3.14, a combination of the ratios of
phospholipon 90H alone with TMZ is considerably low compared to the combination of
phospholipon90H and cholesterol with TMZ (Ostro, 1983; Gomez-hens and
Fernandez- Romero, 2005). Similar to the freeze-thaw method, it justifies that the use of
cholesterol supports the increase of EE % of TMZ and also according to the results
obtained as mentioned in table 3.14 and 3.15, cholesterol is useful in increasing the
rigidity of the membrane (Bangham et al., 1965; Ostro, 1983). It was found that the
dehydration-rehydration method was found to be more suitable for encapsulating TMZ
when compared to freeze-thaw method. From the results obtained it was found that the

115
phospholipids and the methods used were not useful for the encapsulation of TMZ into
liposomes which might be due to TMZ’s high solubility in aqueous medium and low
affinity with the lipids. Therefore, the investigation was carried out using polymer
PLGA for preparation of microparticles which are also reported previously to carry
more advantages over liposomes (Kreuter, 1991). The body distribution of the carriers
can be altered by modification of their surface properties, especially the surface
properties of the microparticles are easily changed by simple coating of the particles
with certain biocompatible surfactants (Bertling et al., 1991).
4.4 Preparation of PLGA microparticles using emulsifying-solvent evaporation
and spray dry methods.
Two methods were used for preparing TMZ loaded PLGA microparticles, one i.e.
emulsifying solvent evaporation method, while the other, the spray dry method. The
main aim of this study was to find a suitable method to encapsulate TMZ into
microparticles and then to combine TMZ with Patrin-2. Because of the mode of action
of a pseudo substrate i.e. Patrin-2 combining with TMZ would be suitable way of
enhancing the effect of TMZ, however due to the incompatibility of these two
compounds described in section 4.2 the strategy was abandoned, microparticles of TMZ
and Patrin-2 were prepared separately using the spray dry method which gave higher EE
% than the emulsifying solvent evaporation method. The spray dry method, compared
with the emulsifying solvent evaporation method, produced more regular shape
microparticles with a relatively small size distribution, similar observations were also
reported by Pavanetto et al., 1992.
TMZ loaded PLGA microparticles were prepared using different MW of PLGA which
included 1.7x10⁴, 1.5x10
4 - 4x10⁴, 4x10
4 - 7.5x10⁴
and 6.6x10⁴ - 1x10
5 using
emulsifying solvent evaporation method. Though the EE % obtained was very low to be

116
considered, PLGA with MW of 1.7x10⁴ showed EE % of only 2.76 ± 0.36 % which was
found to be comparatively higher than other PLGA of different MW as shown in table
3.16. As reported in previous studies, preparation variables can be responsible for
giving poor EE % such as the selection of the organic solvents or stirring rate of the
emulsion or sometimes the organic phase acts as a barrier between the internal aqueous
phase and the continuous aqueous phase (McGinity and O’Donnell, 1997). Due to high
solubility of some drug in the aqueous medium prevents the preparation of the saturated
solution in the organic solvents (Herrmann and Bodmeier, 1995). As TMZ is highly
soluble in aqueous medium these might be the reason responsible for obtaining the low
entrapment efficiency.
TMZ loaded PLGA microparticles and Patrin-2 loaded PLGA microparticles were
prepared by varying the MW of PLGA using the spray dry method, to determine their
effect on EE % of TMZ. Different molecular weights of PLGA used in the study
included 1.7x10⁴, 1.5x10
4 - 4x10⁴, 4x10
4 - 7.5x10⁴
and 6.6x10⁴ - 1x10
5. The maximum
entrapment achieved using this method for TMZ was 64.32 ± 2.58 % while for Patrin-2
the EE % was 68.47 ± 1.47 % thus, this procedure was found to be suitable for the
preparation of both TMZ loaded PLGA microparticles and Patrin-2 loaded PLGA
microparticles. On increasing the MW of PLGA i.e. MW in range of 1.5x10⁴
- 4x10⁴,
4x10⁴
- 7.5x10⁴
and 6.6x10⁴
- 1x10⁵, a significant decrease (*, P< 0.001) in the EE % of
both TMZ and Patrin-2 is obtained. Previous studies have found that a decrease in the
EE % could be attributed either to thermal degradation of the compound or the
accumulation of the active compound on the surface of PLGA microparticles (Sacchetti
and Van-Oort, 1996; Seong et al., 2003). The main purpose of using the spray dry
method was to achieve a molecular dispersion of the compound in the final product
(Takashima et al., 2007; Lee et al., 2008). This method was found to be more effective

117
in producing microspheres with high EE % (Sacchetti and Van-Oort, 1996). As reported
by previous studies high entrapment efficiency is typical using the spray dry method
because the drug cannot partition into an external phase as compared to the emulsifying-
solvent evaporation method (O’Hara and Hickey, 2000).
4.5 Particle size analysis of liposomes and microparticles.
Phospholipids when dispersed in an aqueous medium instantaneously form spherical
structures called as vesicles or liposomes, having sizes ranging from that of bacterial
cells first established by Bangham and co-workers (Bangham et al., 1965). The average
particle size obtained in this study varied depending on the type of lipids, the
concentration of the lipids and the EE % or the type of liposome formed. Depending
upon the liposome formed, as the EE % increases the average particle size increases
(Table 3.12 and 3.14 and Chou et al., 2003). In the freeze-thaw and dehydration-
rehydration the particle sizes tends to increase slightly on addition of cholesterol.
The SEM technique was applied for measuring microparticles prepared by emulsifying-
solvent evaporation and the spray dry method. The maximum entrapment of TMZ
loaded PLGA microparticles and Patrin-2 loaded PLGA microparticles were achieved
using the spray dry method with PLGA of MW equal to 1.7x10⁴. The morphology of
the microparticles from the spray dry method was found to be spherical and smooth,
however small pores were observed on the surface of TMZ loaded microparticles as
shown in Fig. 3.5 (b). The microparticles prepared with PLGA of higher MW were
aggregated and lost the spherical shape, which is in agreement with the literature that
states that microparticle produced with high molecular weight PLGA tend to lose the
spherical shape and form fibrous particles (Seong et al., 2003; Lee et al., 2008). No
morphological difference was observed between the microparticles of TMZ and Patrin-
2. There were a few large particles, which lost their spherical shape. It may have been

118
that as indicated in a recent study that during spraying of the solution some droplets
may have slightly different sizes and the particles formed from such droplets could
shrink due to evaporation of the solvent during the drying process (Pamujula et al.,
2004). However, the particle size distribution of the microparticles of both compounds
was reproducible (Wang and Wang, 2003).
4.6 Dissolution techniques
The dispersion and dialysis methods were used to monitor the release of TMZ and
Patrin-2 from the PLGA microparticles and to compare the in vitro release of TMZ and
Patrin-2 (Shazly et al., 2008). An in vitro release profile can reveal basic information on
the structural properties of the formulation as well as on possible interactions between
drug and polymer and their effectiveness on the rate and mechanism of drug release
(Washington, 1990). Such information is important in facilitating a scientific approach
to the design and development of sustained drug delivery systems with specific
properties (D’Souza and DeLuca, 2006).
4.6.1. Dispersion Method used for determination of release of TMZ and Patrin-2
from the PLGA microparticles.
The release profiles of both TMZ and Patrin-2 from PLGA microparticles were
monitored in to PBS, pH 7.4 at 37 ± 0.5 °C was carried out. From the release profiles it
was observed that for TMZ loaded PLGA microparticles, there was an initial burst
release of TMZ during the first six hours, followed by a decrease in the release of TMZ
(Fig. 3.6). As observed from % cumulative release, 100 % release of TMZ was observed
at 0.5 hr which is 407.06 µg (Refer table 3.18). However, the total amount of TMZ
theoretically present in TMZ loaded PLGA microparticles at the beginning of the
in vitro release was 1200 µg (Refer to EE % in table 3.17). Similarly from the release
profile of Patrin-2 loaded PLGA microparticles, an initial burst release of Patrin-2 was

119
observed followed by a small amount of release of Patrin-2 (Fig. 3.7).The % cumulative
release of Patrin-2 was calculated to be 100 % at 120 hr which is 196.16 µg in
concentration (Table 3.19) however, the total amount of Patrin-2 release theoretically
should have been 1500 µg (Refer to EE % in table 3.17). The initial burst release of
TMZ and Patrin-2 might be due to diffusion of drug particles present on the surface of
microparticles as well as the release of the encapsulated (Bodmeier and Chen, 1988;
Shazly et al., 2008). Also the possible reason for the results obtained could be the
degradation products formed of both the compounds at 37 °C due to which the expected
amount of the drugs was not possible to calculate.
As mentioned in section 1.5.4 the release of the drug from the polymer occurs in
different phases, rapid release of the drug sometimes occurs due to pore formation, if
the drug is bonded weakly to the polymer surface it is released with an initial burst.
Initial burst release phase also occurs sometimes due to bulk degradation of the polymer
(Allemann et al., 1993; Polakovic et al., 1999; Panyam et al., 2004; Liu et al., 2005;
Tamber et al., 2005). If the bulk degradation of the polymer is made to exhibit surface
degradation or layer-by-layer degradation, the polymer could present a promising
control release of the drug also termed as sustained release (Conte et al., 1993;
Abdul and Poddar, 2004; Chen et al., 2005; Loo et al., 2005; Frank et al., 2005;
Loo et al., 2010). The fast release rate of TMZ could be due to its high affinity for
water, using a more hydrophobic polymer PLGA 85:15 might support a much slower
release rate than PLGA 75:25 used in this study (Lee et al., 2008). In previous studies it
has been proved that the use of different monomer ratios of copolymer have helped to
alter the in vitro release of the drug (Zhao et al., 2010). Other factors such as pH of the
medium and porous surface might be responsible for the initial rapid release of TMZ
and Patrin-2. The pH of the dissolution medium affects the drug significantly and may

120
be responsible for the rapid burst effect (O’Hara and Hickey, 2000). The differences in
particle shape can also be a contributing factor to the high initial release of the spray
dried particles (Pavanetto et al., 1992; Lalla and Sapna, 1993). In the previous studies, it
has been demonstrated that particle porosity was found to be a greater determinant of
total surface area than gross morphology (Pavanetto et al., 1992). One of the reasons for
a decrease in concentration i.e. when TMZ was not been detected could be due to the
rapid degradation of TMZ in PBS at pH 7.4. From our stability studies in section 4.2
and data from others, it might be difficult to monitor the total amount of drug being
released when degradation takes place (Wagenaar and Muller, 1994;
Zhang and Gao, 2007). This theory could apply to both TMZ and Patrin-2. However,
sometimes the release pattern of the drug is also dependent not only on the diffusion of
the drug through the matrix of the polymer but also on the degradation rate of the
polymer (Schwendeman et al., 1996). For Patrin-2 an initial burst release with a
continuous slow release was observed, again this could be either due to degradation of
the compound in PBS at pH 7.4 or could be that the compound was in the lag phase and
may be the monitoring should have been conducted for a longer period of time
(Loo et al., 2010). A difference in the release pattern could have occurred due to early
matrix erosion of the polymer, however, human error has not been ruled out
(Spenlehauer et al., 1989; O’Hara and Hickey, 2000). The stage when there is no drug
released is termed the lag phase where the drug is not diffusing out of the polymer and
can be overcome by treating the sample with radiation (e-beam) which modifies the
physical properties of the polymer and thereby reduces the lag phase (Miao et al., 2009;
Loo et al., 2010).

121
4.6.2 Dialysis Bag Method used for determination of release of TMZ and Patrin-2
from the PLGA microparticles.
The release profiles of TMZ and Patrin-2 from PLGA microparticles in to PBS, pH 7.4
at 37 ± 0.5 °C was carried out. At predetermined time intervals (0.5, 1, 2, 4, 6, 12, 24,
48, 72, 96, 120, 144, 168, 192, 216, 240, 264, 288, 312 and 336 hr) an aliquot of 1 ml of
the dispersion was withdrawn and replaced with 1 ml of PBS. The results were analysed
using HPLC, however, the peak area obtained was too low to carry out the cumulative
amount release calculation. The result obtained from the control was also too low. In the
dialysis method the loaded microparticles were separated from the dissolution media by
the dialysis membrane. The passage of the compound occurs through the membrane into
the dissolution media and the sample is withdrawn for analysis (Berthold et al., 1996).
The low concentration of the compound measured could have been due to the type of
dialysis bag used was not suitably matched for the compounds for this reason
sometimes compound takes longer time to diffuse out of the membrane
(Larsen et al., 2000). This draw back could possibly be overcome by using varying MW
exclusion cutoffs dialysis bags in the future studies to determine a suitable MW cut off
range of the dialysis bag (Park et al., 1995). Some studies have reported that low
concentration of drugs released could be attributed to equilibration with the outer
dissolution media being slow because of the small membrane surface area available for
the drug to transport (D’Souza and DeLuca, 2005). Slow equilibration causes
limitations in accurate analysis of initial drug levels being released (Diaz et al., 1999).
These disadvantages could be overcome by using a commercial dialysis setup which has
a large surface area for facilitation of drug transport (D’Souza and DeLuca, 2005).
In vitro analysis revealed that slower rates and incomplete drug release is sometimes
observed when using a membrane system for dissolution tests (Gido et al., 1993).
Previously studies have been undertaken to reduce the time span of the in vitro release

122
experiments, certain factors were taken into consideration for this purpose like addition
of preservatives and impose certain limitations on the method such as compatibility of
the constituents of the release device like membrane and its stability
(Burgess et al., 2002). Thus short term release experiments might be more reliable for
quality analysis purposes. Some alterations in the conditions might help in accelerating
the release of the compound from the membrane such conditions include elevated
temperature, altering pH and use of surfactants (D’Souza and DeLuca, 2006).
In comparison of the dissolution techniques based on the results obtained, the dispersion
method proved to be better than the dialysis method, similarly in previous literature
dispersion method was found to be better than dialysis method, however as both the
methods were not completely explored and due to degradation of the drugs taking place
it is not concluded as which method would have been better (Shazly et al., 2008). The
reasons for obtaining such lower values in the dialysis technique consists of certain
limitations such as the outer media is stirred, however, the media inside the dialysis bag
is not stirred accurately and sometimes it is subjected to accumulation of the polymer or
the drug on the surface of the dialysis bag making the release process slower (Park et
al., 1995). An additional limitation in this procedure of drug release is when the drug
strongly binds to the polymer or membrane, however, this can be all evicted to some
degree by sampling and buffer replacement (Kinget et al., 1979).

123
CONCLUSION
Validated HPLC methods were used for the analysis of both TMZ and Patrin-2. TMZ is
known to be effective in patients that lack MGMT activity since MGMT counteracts the
effect of TMZ by removing the methyl group (originally added by temozolomide).
Patrin-2 is used to counteract the effect of MGMT and thus enhances the activity of
TMZ. Stability tests were carried out to determine whether or not TMZ and Patrin-2
could be combined, however, degradation was observed on analysis of the combined
mixture and therefore the work involved formulating these two actives in drug delivery
systems separately and not in combination.
TMZ loaded liposomes were prepared using different ratios of phospholipid
individually and in combination with cholesterol/stearic acid. A combination of
phospholipon 90H and cholesterol at a ratio of 1:2:2 was found to be more effective in
encapsulating TMZ as compared to other phospholipids such as
lα-phosphatidylcholine, DSPC, DMPC and lecithin using freeze-thaw and
dehydration-rehydration methods. It was found that the EE % varied depending on the
type of lipid used. From the particle size analysis, it was noted that with an increase in
concentration of certain lipids with the addition cholesterol, a slight increase in the
average particle size was observed in both methods. Of the two methods used in the
study involving the encapsulation of TMZ into liposomes the dehydration-rehydration
method was found to be favoured since a significant increase in encapsulated ratio of
1:2:2 occurred when was used with TMZ, phospholipon 90H and cholesterol.
Two methods were used for preparing TMZ loaded PLGA microparticles namely
emulsifying solvent evaporation and spray dry methods. The EE % obtained for the
emulsifying solvent evaporation method was found to be too low to be considered,
however, the spray dry method gave a significantly high EE %. The spray dry method
used for the preparation of Patrin-2 loaded PLGA microparticles also resulted in a

124
significantly high EE %. The SEM of the microparticles showed that the microparticles
were smooth and spherical, however some TMZ loaded microparticles showed pore
formation. From the findings it can be concluded that the lower the MW of PLGA used
the higher the EE % in both methods. From the results one can conclude that, TMZ and
Partin-2 were successfully encapsulated into PLGA microparticles using the spray dry
method.
To study the release profile of TMZ and Patrin-2 from the PLGA microparticles two
methods were carried out namely the dispersion and dialysis bag diffusion method. The
dispersion method was found to be more efficient and reliable, however as both the
methods were not completely explored it is not concluded as which method would have
been better. TMZ and Patrin-2 showed an initial burst release, however TMZ later
showed a decrease in concentration over a period of time while Patrin-2 showed a slow
release with a steady increase in concentration. Both compounds did not show complete
release from the microparticle in expected concentration which could be due to
degradation of the drug taking place at the set temperature and pH, however future work
could focus on improving the release of these compounds by altering the hydrophobic
nature of the PLGA by varying the copolymer monomer ratio.

125
FUTURE PROSPECTS
Based on the results obtained from the current research, the spray dry method was found
to give the highest EE % for TMZ and Partin-2, however in order to achieve a higher
EE % different solvent systems such as dichloromethane or chloroform could be
investigated or the calculations of determining the EE% should be altered which would
give higher encapsulation i.e. the amount of TMZ obtained from the microparticles
using the HPLC should be compared with the amount of TMZ that could be
theoretically present in the same amount of microparticles weighed out. Different
monomer ratios of copolymer of PLGA consisting of greater hydrophobic polymers
such as PLGA 85:15 of different molecular weights as well as PLGA polymers of MW
less than 1.7x10⁴ Da could be investigated. The use of hydrophobic PLGA polymers
may also enhance release profiles of TMZ and Patrin-2. Lower MW PLGA could be
used to accelerate the release pattern of Patrin-2. The pH of the dissolution medium
affects the drug significantly and is responsible for the burst effect. Altering the pH and
the use of surfactants could also be included in a study. For the dialysis bag diffusion
technique, different dialysis bags with varying MW’s could be investigated to find
which would be most suitable in assisting the release of TMZ and Patrin-2. The
microparticles could also be treated with radiation (e-beam) for faster release and
modification in the technique by increasing the surface area of the dialysis bag available
for the drug to diffuse out of the membrane might also enhance the release pattern of the
drug.
The viabilities of treated and untreated glioma cells could be determined using the
standard MTT and ATP assays. To evaluate the cytotoxicity of TMZ loaded liposomes,
TMZ and Patrin-2 loaded microparticles should be tested on glioma cell lines and their
effect should be compared with the cytotoxicity of TMZ and Patrin-2 applied

126
separately. The effect of PLGA microparticles should also be tested on the glioma cell
lines.

127
REFERENCES
128
Abdul S & Poddar SS (2004). A flexible technology for modified release of drugs: multi
layered tablets. J Control Release 97, 393-405.
Allemann E, Leroux JC, Gurny R, & Doelker E (1993). In vitro extended-release
properties of drug-loaded poly(DL-lactic acid) nanoparticles produced by a salting-out
procedure. Pharm Res 10, 1732-1737.
Allen TM & Cullis PR (2004). Drug delivery systems: entering the mainstream. Science
303, 1818-1822.
Anderson M & Omri A (2004). The effect of different lipid components on the in vitro
stability and release kinetics of liposome formulations. Drug Deliv 11, 33-39.
Bangham AD, Standish MM, & Watkins JC (1965). Diffusion of univalent ions across
the lamellae of swollen phospholipids. J Mol Biol 13, 238-252.
Barvaux VA, Lorigan P, Ranson M, Gillum AM, McElhinney RS, McMurry TB, &
Margison GP (2004a). Sensitization of a human ovarian cancer cell line to
temozolomide by simultaneous attenuation of the Bcl-2 antiapoptotic protein and DNA
repair by O6-alkylguanine-DNA alkyltransferase. Mol Cancer Ther 3, 1215-1220.
Barvaux VA, Ranson M, Brown R, McElhinney RS, McMurry TB, & Margison GP
(2004b). Dual repair modulation reverses Temozolomide resistance in vitro. Mol
Cancer Ther 3, 123-127.
Berthold A, Cremer K, & Kreuter J (1996). Preparation and characterization of chitosan
microspheres as drug carrier for prednisolone sodium phosphate as model for anti-
inflammatory drugs. J Control Release 39, 17-25.
Bertling WM, Gareis M, Paspaleeva V, Zimmer A, Kreuter J, Nurnberg E, & Harrer P
(1991). Use of liposomes, viral capsids, and nanoparticles as DNA carriers. Biotechnol
Appl Biochem 13, 390-405.
Bobola MS, Emond MJ, Blank A, Meade EH, Kolstoe DD, Berger MS, Rostomily RC,
Silbergeld DL, Spence AM, & Silber JR (2004). Apurinic endonuclease activity in adult
gliomas and time to tumor progression after alkylating agent-based chemotherapy and
after radiotherapy. Clin Cancer Res 10, 7875-7883.
Bobola MS, Silber JR, Ellenbogen RG, Geyer JR, Blank A, & Goff RD (2005). O6-
methylguanine-DNA methyltransferase, O6-benzylguanine, and resistance to clinical
alkylators in pediatric primary brain tumor cell lines. Clin Cancer Res 11, 2747-2755.

129
Bodell WJ, Gaikwad NW, Miller D, & Berger MS (2003). Formation of DNA adducts
and induction of lacI mutations in Big Blue Rat-2 cells treated with temozolomide:
implications for the treatment of low-grade adult and pediatric brain tumors. Cancer
Epidemiol Biomarkers Prev 12, 545-551.
Bodmeier R & Chen HG (1988). Preparation of biodegradable poly(+/-)lactide
microparticles using a spray-drying technique. J Pharm Pharmacol 40, 754-757.
Bodmeier R, Chen HG, & Paeratakul O (1989). A novel approach to the oral delivery of
micro- or nanoparticles. Pharm Res 6, 413-417.
Brada M (2002). NICE verdict on Temozolomide: where next? Br J Cancer 86, 499-
500.
Brock CS, Newlands ES, Wedge SR, Bower M, Evans H, Colquhoun I, Roddie M,
Glaser M, Brampton MH, & Rustin GJ (1998). Phase I trial of temozolomide using an
extended continuous oral schedule. Cancer Res 58, 4363-4367.
Burgess DJ, Hussain AS, Ingallinera TS, & Chen ML (2002). Assuring quality and
performance of sustained and controlled release parenterals: AAPS workshop report,
co-sponsored by FDA and USP. Pharm Res 19, 1761-1768.
Cagnoni PJ (2002). Liposomal amphotericin B versus conventional amphotericin B in
the empirical treatment of persistently febrile neutropenic patients. J Antimicrob
Chemother 49 Suppl 1, 81-86.
Caliceti P & Veronese FM (2003). Pharmacokinetic and biodistribution properties of
poly(ethylene glycol)-protein conjugates. Adv Drug Deliv Rev 55, 1261-1277.
Chang SM, Parney IF, Huang W, Anderson FA, Jr., Asher AL, Bernstein M, Lillehei
KO, Brem H, Berger MS, & Laws ER (2005). Patterns of care for adults with newly
diagnosed malignant glioma. JAMA 293, 557-564.
Chen MC, Liang HF, Chiu YL, Chang Y, Wei HJ, & Sung HW (2005). A novel drug-
eluting stent spray-coated with multi-layers of collagen and sirolimus. J Control Release
108, 178-189.
Cher L, Rosenthal MA, Drummond KJ, Dally M, Murphy M, Ashley D, Thursfield V,
& Giles GG (2008). The use of chemotherapy in patients with gliomas: patterns of care
in Victoria from 1998-2000. J Clin Neurosci 15, 398-401.
Chou TH, Chen SC, & Chu IM (2003). Effect of composition on the stability of
liposomal irinotecan prepared by a pH gradient method. J Biosci Bioeng 95, 405-408.

130
Chu S (1991). Laser manipulation of atoms and particles. Science 253, 861-866.
Clark AS, Deans B, Stevens MF, Tisdale MJ, Wheelhouse RT, Denny BJ, & Hartley JA
(1995). Antitumor imidazotetrazines. 32. Synthesis of novel imidazotetrazinones and
related bicyclic heterocycles to probe the mode of action of the antitumor drug
temozolomide. J Med Chem 38, 1493-1504.
Clemons M, Kelly J, Watson AJ, Howell A, McElhinney RS, McMurry TB, &
Margison GP (2005). O6-(4-bromothenyl)guanine reverses temozolomide resistance in
human breast tumour MCF-7 cells and xenografts. Br J Cancer 93, 1152-1156.
Connor J & Huang L (1986). pH-sensitive immunoliposomes as an efficient and target-
specific carrier for antitumor drugs. Cancer Res 46, 3431-3435.
Conte U, Maggi L, Colombo P, & Lamanna A, (1993). Multilayered hydrophilic
matrices as constant release devices (GeomatrixTM systems). J Control Release 26, 39–
47.
Craig LC (1967). Techniques for the study of peptides and proteins by dialysis and
diffusion. Methods Enzymol 11, 870-905.
Cunningham BA & Lis LJ (1986). Thiocyanate and bromide ions influence the bilayer
structural parameters of phosphatidylcholine bilayers. Biochim Biophys Acta 861, 237-
242.
Darkes MJ, Plosker GL, & Jarvis B (2002). Temozolomide: A Review of its Use in the
Treatment of Malignant Gliomas, Malignant Melanoma and Other Advanced Cancers.
Am J Cancer 1, 55-80.
D'Atri S, Tentori L, Lacal PM, Graziani G, Pagani E, Benincasa E, Zambruno G,
Bonmassar E, & Jiricny J (1998). Involvement of the mismatch repair system in
temozolomide-induced apoptosis. Mol Pharmacol 54, 334-341.
D'Souza SS & DeLuca PP (2005). Development of a dialysis in vitro release method for
biodegradable microspheres. AAPS PharmSciTech 6, E323-E328.
D'Souza SS & DeLuca PP (2006). Methods to assess in vitro drug release from
injectable polymeric particulate systems. Pharm Res 23, 460-474.
Davis ME, Chen ZG, & Shin DM (2008). Nanoparticle therapeutics: an emerging
treatment modality for cancer. Nat Rev Drug Discov 7, 771-782.
De Jong WH & Borm PJ (2008). Drug delivery and nanoparticles:applications and
hazards. Int J Nanomedicine 3, 133-149.

131
Denny BJ, Wheelhouse RT, Stevens MF, Tsang LL, & Slack JA (1994). NMR and
molecular modeling investigation of the mechanism of activation of the antitumor drug
temozolomide and its interaction with DNA. Biochemistry 33, 9045-9051.
Desai MP, Labhasetwar V, Amidon GL, & Levy RJ (1996). Gastrointestinal uptake of
biodegradable microparticles: effect of particle size. Pharm Res 13, 1838-1845.
Diaz RV, Llabres M, & Evora C (1999). One-month sustained release microspheres of
125I-bovine calcitonin. In vitro-in vivo studies. J Control Release 59, 55-62.
Dolan ME, Moschel RC, & Pegg AE (1990). Depletion of O6-alkyl-guanine-DNA
alkyltransferase activity by O6-benzyl-guanine provides a means to evaluate the role of
this protein in protection against carcinogenic and therapeutic alkylating agents, Proc
Natl Acad Sci 87, 5368–5372.
Duncan R (2003). The dawning era of polymer therapeutics. Nat Rev Drug Discov 2, 347-360.
Egger P, Bellmann R, & Wiedermann CJ (2001). Determination of amphotericin B,
liposomal amphotericin B, and amphotericin B colloidal dispersion in plasma by high-
performance liquid chromatography. J Chromatogr B Biomed Sci Appl 760, 307-313.
Emerich DF, Tracy MA, Ward KL, Figueiredo M, Qian R, Henschel C, & Bartus RT
(1999). Biocompatibility of poly (DL-lactide-co-glycolide) microspheres implanted into
the brain. Cell Transplant 8, 47-58.
Esteller M, Garcia-Foncillas J, Andion E, Goodman SN, Hidalgo OF, Vanaclocha V,
Baylin SB, & Herman JG (2000). Inactivation of the DNA-repair gene MGMT and the
clinical response of gliomas to alkylating agents. N Engl J Med 343, 1350-1354.
Esposito C, Masotti A, Del Grosso N, Malizia D, Bianco A, Bonadies F, Napolitano R,
Ortaggi G, & Giuseppe M (2003). Function/structure correlation in novel pH-dependent
cationic liposomes for glioma cells transfection in vitro. Comptes Rendus Chimie 6,
617-622.
Exton JH (1994). Phosphatidylcholine breakdown and signal transduction. Biochim
Biophys Acta 1212, 26-42.
Fedier A & Fink D (2004). Mutations in DNA mismatch repair genes: implications for
DNA damage signaling and drug sensitivity (review). Int J Oncol 24, 1039-1047.
Felnerova D, Viret JF, Gluck R, & Moser C (2004). Liposomes and virosomes as
delivery systems for antigens, nucleic acids and drugs. Curr Opin Biotechnol 15, 518-
529.

132
Ferrari M (2005). Cancer nanotechnology: opportunities and challenges. Nat Rev
Cancer 5, 161-171.
Frank A, Rath SK, & Venkatraman SS (2005). Controlled release from bioerodible
polymers: effect of drug type and polymer composition. J Control Release 102, 333-
344.
Friedman HS, McLendon RE, Kerby T, Dugan M, Bigner SH, Henry AJ, Ashley DM,
Krischer J, Lovell S, Rasheed K, Marchev F, Seman AJ, Cokgor I, Rich J, Stewart E,
Colvin OM, Provenzale JM, Bigner DD, Haglund MM, Friedman AH, & Modrich PL
(1998). DNA mismatch repair and O6-alkylguanine-DNA alkyltransferase analysis and
response to Temodal in newly diagnosed malignant glioma. J Clin Oncol 16, 3851-
3857.
Gabriels M & Plaizier-Vercammen J (2003). Physical and chemical evaluation of
liposomes, containing artesunate. J Pharm Biomed Anal 31, 655-667.
Gallia GL, Brem S, & Brem H (2005). Local treatment of malignant brain tumors using
implantable chemotherapeutic polymers. J. Natl. Compr. Canc. Netw. 3, 721–728.
Gerson SL (2004). MGMT: its role in cancer aetiology and cancer therapeutics. Nat Rev
Cancer 4, 296-307.
Gido C, Langguth P, Kreuter J, Winter G, Woog H, & Mutschler E (1993).
Conventional versus novel conditions for the in vitro dissolution testing of parenteral
slow release formulations: application to doxepin parenteral dosage forms. Pharmazie
48, 764-769.
Glavas-Dodov M, Fredro-Kumbaradzi E, Goracinova K, Simonoska M, Calis S,
Trajkovic-Jolevska S, & Hincal AA (2005). The effects of lyophilization on the stability
of liposomes containing 5-FU. Int J Pharm 291, 79-86.
Gomez-hens A & Fernandez- Romero JM (2005). The role of liposomes in analytical
processes. Trends Anal. Chem 24, 9-19.
Gomez-hens A & Fernandez- Romero JM (2006). Analytical methods for the control of
liposomal delivery systems. Trends in analytical chemistry 25, 167- 178.
Goyal P, Goyal K, Vijaya Kumar SG, Singh A, Katare OP, & Mishra DN (2005).
Liposomal drug delivery systems--clinical applications. Acta Pharm 55, 1-25.
Grant GJ, Barenholz Y, Piskoun B, Bansinath M, Turndorf H, & Bolotin EM (2001).
DRV liposomal bupivacaine: preparation, characterization, and in vivo evaluation in
mice. Pharm Res 18, 336-343.
133
Gregoriadis G, Wills EJ, Swain CP, & Tavill AS (1974). Drug-carrier potential of
liposomes in cancer chemotherapy. Lancet 1, 1313-1316.
Gupta AK & Gupta M (2005). Synthesis and surface engineering of iron oxide
nanoparticles for biomedical applications. Biomaterials 26, 3995-4021.
Gulati M, Grover M, Singh S, & Singh M (1998). Lipophilic drug derivatives in
liposomes. International Journal of Pharmaceutics 165, 129-168.
Haag R & Kratz F (2006). Polymer therapeutics: concepts and applications. Angew
Chem Int Ed Engl 45, 1198-1215.
Harrington KJ, Syrigos KN, & Vile RG (2002). Liposomally targeted cytotoxic drugs
for the treatment of cancer. J Pharm Pharmacol 54, 1573-1600.
Hattori Y, Kawakami S, Suzuki S, Yamashita F, & Hashida M (2004). Enhancement of
immune responses by DNA vaccination through targeted gene delivery using
mannosylated cationic liposome formulations following intravenous administration in
mice. Biochem Biophys Res Commun 317, 992-999.
Herrmann J & Bodmeier R (1995). Somatostatin containing biodegradable microspheres
prepared by a modified solvent evaporation method based on W/O/W-multiple
emulsions. International Journal of Pharmaceutics 126, 129-138.
Hirose Y, Berger MS, & Pieper RO (2001). Abrogation of the Chk1-mediated G(2)
checkpoint pathway potentiates temozolomide-induced toxicity in a p53-independent
manner in human glioblastoma cells. Cancer Res 61, 5843-5849.
Huang G, Zhang N, Bi X, & Dou M (2008). Solid lipid nanoparticles of temozolomide:
potential reduction of cardial and nephric toxicity. Int J Pharm 355, 314-320.
Ingebrigtsen L & Brandl M (2002). Determination of the size distribution of liposomes
by SEC fractionation, and PCS analysis and enzymatic assay of lipid content. AAPS
PharmSciTech 3, 1-7.
Kaina B & Christmann M (2002). DNA repair in resistance to alkylating anticancer
drugs. Int J Clin Pharmacol Ther 40, 354-367.
Kawano K, Takayama K, Nagai T, & Maitani Y (2003). Preparation and
pharmacokinetics of pirarubicin loaded dehydration-rehydration vesicles. Int J Pharm
252, 73-79.
Khan OA, Ranson M, Michael M, Olver I, Levitt NC, Mortimer P, Watson AJ,
Margison GP, Midgley R, & Middleton MR (2008). A phase II trial of lomeguatrib and
temozolomide in metastatic colorectal cancer. Br J Cancer 98, 1614-1618.

134
Kinget R, Bontinck AM, & Herbots H (1979). Problems of dialysis techniques in the
study of macromolecule binding of drugs. Int. J. Pharm, 3, 65-72.
Kitamura I, Kochi M, Matsumoto Y, Ueoka R, Kuratsu J, & Ushio Y (1996). Intrathecal
chemotherapy with 1,3-bis(2-chloroethyl)-1-nitrosourea encapsulated into hybrid
liposomes for meningeal gliomatosis: an experimental study. Cancer Res 56, 3986-
3992.
Kleihues P, Louis DN, Scheithauer BW, Rorke LB, Reifenberger G, Burger PC, &
Cavenee WK (2002). The WHO classification of tumors of the nervous system. J
Neuropathol Exp Neurol 61, 215-225.
Kreuter J (1991). Liposomes and nanoparticles as vehicles for antibiotics. Infection 19
Suppl 4, S224-S228.
Lalla JK & Sapna K (1993). Biodegradable microspheres of poly(DL-lactic acid)
containing piroxicam as a model drug for controlled release via the parenteral route. J
Microencapsul 10, 449-460.
Langer R (1998). Drug delivery and targeting. Nature 392, 5-10.
Larsen DH, Fredholt K, & Larsen C (2000). Assessment of rate of drug release from oil
vehicle using a rotating dialysis cell. Eur J Pharm Sci 11, 223-229.
Lasic DD (1992). Liposomes: Synthetic lipid microspheres serve as multipurpose
vehicles for the delivery of drugs, genetic material and cosmetics. American Scientist
80, 20-31.
Lee LY, Wang CH, & Smith KA (2008). Supercritical antisolvent production of
biodegradable micro- and nanoparticles for controlled delivery of paclitaxel. J Control
Release 125, 96-106.
Lindsay S & Barnes J (1992). High performance liquid chromatography 2nd
edition.
John wiley & sons,West Sussex, UK 1-5.
Liu H, Finn N, & Yates MZ (2005). Encapsulation and sustained release of a model
drug, indomethacin, using CO(2)-based microencapsulation. Langmuir 21, 379-385.
Liu L & Gerson SL (2006). Targeted modulation of MGMT: clinical implications. Clin
Cancer Res 12, 328-331.
Liu XY, Nakamura C, Yang Q, Kamo N, & Miyake J (2002). Immobilized liposome
chromatography to study drug-membrane interactions. Correlation with drug absorption
in humans. J Chromatogr A 961, 113-118.
135
Loo SC, Ooi CP, Tan ML & Boey YC (2005). Isothermal annealing of PLGA and its
effect on radiation degradation. Polym Int 54, 636–643.
Loo SC, Tan ZY, Chow YJ, & Lin SL (2010). Drug release from irradiated PLGA and
PLLA multi-layered films. J Pharm Sci 99, 3060-3071.
Lowe PR, Sansom CE, Schwalbe CH, Stevens MF, & Clark AS (1992). Antitumor
imidazotetrazines. 25. Crystal structure of 8-carbamoyl-3-methylimidazo[5,1-d]-1,2,3,5-
tetrazin-4(3H)-one (temozolomide) and structural comparisons with the related drugs
mitozolomide and DTIC. J Med Chem 35, 3377-3382.
Maestrelli F, Gonzalez-Rodriguez ML, Rabasco AM, & Mura P (2006). Effect of
preparation technique on the properties of liposomes encapsulating ketoprofen-
cyclodextrin complexes aimed for transdermal delivery. Int J Pharm 312, 53-60.
Maher EA, Furnari FB, Bachoo RM, Rowitch DH, Louis DN, Cavenee WK, & DePinho
RA (2001). Malignant glioma: genetics and biology of a grave matter. Genes Dev 15,
1311-1333.
Mamo T, Moseman EA, Kolishetti N, Salvador-Morales C, Shi J, Kuritzkes DR, Langer
R, von AU, & Farokhzad OC (2010). Emerging nanotechnology approaches for
HIV/AIDS treatment and prevention. Nanomedicine (Lond) 5, 269-285.
Margison GP, Heighway J, Pearson S, McGown G, Thorncroft MR, Watson AJ,
Harrison KL, Lewis SJ, Rohde K, Barber PV, O'Donnell P, Povey AC, & Santibanez-
Koref MF (2005). Quantitative trait locus analysis reveals two intragenic sites that
influence O6-alkylguanine-DNA alkyltransferase activity in peripheral blood
mononuclear cells. Carcinogenesis 26, 1473-1480.
Mayer LD, Bally MB, Hope MJ, & Cullis PR (1986). Techniques for encapsulating
bioactive agents into liposomes. Chem Phys Lipids 40, 333-345.
McDaniel RV, McIntosh TJ, & Simon SA (1983). Non electrolyte substitution for water
in phosphatidylcholine bilayers. Biochem. Biophys.Acta 731, 97-108.
McGinity JW & O'Donnell PB (1997). Preparation of microspheres by the solvent
evaporation technique. Adv Drug Deliv Rev 28, 25-42.
McIntosh TJ, McDaniel RV, & Simon SA (1983). Induction of an integrated gel phase
in fully hydrated phosphatidylcholine bilayers. Biochem. Biophys.Acta 731, 109-114.
Menei P, Boisdron-Celle M, Croue A, Guy G, & Benoit JP (1996). Effect of stereotactic
implantation of biodegradable 5-fluorouracil-loaded microspheres in healthy and C6
glioma-bearing rats. Neurosurgery 39, 117-123.

136
Menei P, Daniel V, Montero-Menei C, Brouillard M, Pouplard-Barthelaix A, & Benoit
JP (1993). Biodegradation and brain tissue reaction to poly(D,L-lactide-co-glycolide)
microspheres. Biomaterials 14, 470-478.
Miao PK, Zhao CN, Xu GL, Fu Q, Tang WR, Zeng K, Wang YP, Zhou HF, & Yang G
(2009). Degradation of Poly(D,L-lactic acid)-bpoly(ethylene glycol)-b-poly(D,L-lactic
acid) Copolymer by Electron Beam Radiation. J Appl Polym Sci 112, 2981–2987.
Middleton MR, Kelly J, Thatcher N, Donnelly DJ, McElhinney RS, McMurry TB,
McCormick JE, & Margison GP (2000). O(6)-(4-bromothenyl)guanine improves the
therapeutic index of temozolomide against A375M melanoma xenografts. Int J Cancer
85, 248-252.
Middleton MR, Thatcher N, McMurry TB, McElhinney RS, Donnelly DJ, & Margison
GP (2002). Effect of O6-(4-bromothenyl)guanine on different temozolomide schedules
in a human melanoma xenograft model. Int J Cancer 100, 615-617.
Moffat AC, Osselton MD, & Widdop B (2004). Clarke’s analysis of drugs and poisons
3rd
edition. Publication division of the Royal Pharmaceutical society of Great Britain,
London, UK, 1604-1630.
Moghimi SM & Davis SS (1994). Innovations in avoiding particle clearance from blood
by Kupffer cells: cause for reflection. Crit Rev Ther Drug Carrier Syst 11, 31-59.
Mohammed AR, Weston N, Coombes AG, Fitzgerald M, & Perrie Y (2004). Liposome
formulation of poorly water soluble drugs: optimisation of drug loading and ESEM
analysis of stability. Int J Pharm 285, 23-34.
Monnard PA, Oberholzer T, & Luisi P (1997). Entrapment of nucleic acids in
liposomes. Biochim Biophys Acta 1329, 39-50.
Morimoto H, Tsukada J, Kominato Y, & Tanaka Y (2005). Reduced expression of
human mismatch repair genes in adult T-cell leukemia. Am J Hematol 78, 100-107.
Moscho A, Orwar O, Chiu DT, Modi BP, & Zare RN (1996). Rapid preparation of giant
unilamellar vesicles. Proc Natl Acad Sci U S A 93, 11443-11447.
Mu L & Feng SS (2001). Fabrication, characterization and in vitro release of paclitaxel
(Taxol) loaded poly (lactic-co-glycolic acid) microspheres prepared by spray drying
technique with lipid/cholesterol emulsifiers. J Control Release 76, 239-254.
Muller RH, Mader K, & Gohla S (2000). Solid lipid nanoparticles (SLN) for controlled
drug delivery - a review of the state of the art. Eur J Pharm Biopharm 50, 161-177.
137
Newlands ES, Blackledge GR, Slack JA, Rustin GJ, Smith DB, Stuart NS, Quarterman
CP, Hoffman R, Stevens MF, Brampton MH, & . (1992). Phase I trial of temozolomide
(CCRG 81045: M&B 39831: NSC 362856). Br J Cancer 65, 287-291.
Newlands ES, Stevens MF, Wedge SR, Wheelhouse RT, & Brock C (1997).
Temozolomide: a review of its discovery, chemical properties, pre-clinical development
and clinical trials. Cancer Treat Rev 23, 35-61.
Niidome T, Yamagata M, Okamoto Y, Akiyama Y, Takahashi H, Kawano T, Katayama
Y, & Niidome Y (2006). PEG-modified gold nanorods with a stealth character for in
vivo applications. J Control Release 114, 343-347.
Niwa T, Takeuchi H, Hino T, Kunou N, & Kawashima Y (1993). Preparations of
biodegradable nanospheres of water-soluble and insoluble drugs with
D,Llactide/glycolide copolymer by a novel spontaneous emulsification solvent diffusion
method and the drug release behavior. Control Rel 25, 89-98.
O'Hara P & Hickey AJ (2000). Respirable PLGA microspheres containing rifampicin
for the treatment of tuberculosis: manufacture and characterization. Pharm Res 17, 955-
961.
Oberholzer T, Meyer E, Amato I, Lustig A, & Monnard PA (1999). Enzymatic reactions
in liposomes using the detergent-induced liposome loading method. Biochim Biophys
Acta 1416, 57-68.
Ostro M (1983). Liposomes. Marcel Dekker, INC: New York, USA, 28-33.
Painbeni T, Venier-Julienne MC, & Benoit JP (1998). Internal morphology of
poly(D,L-lactide-co-glycolide) BCNU-loaded microspheres. Influence on drug stability.
Eur J Pharm Biopharm 45, 31-39.
Pamujula S, Graves RA, Freeman T, Srinivasan V, Bostanian LA, Kishore V, & Mandal
TK (2004). Oral delivery of spray dried PLGA/amifostine nanoparticles. J Pharm
Pharmacol 56, 1119-1125.
Panyam J, Williams D, Dash A, Leslie-Pelecky D, & Labhasetwar V (2004). Solid-state
solubility influences encapsulation and release of hydrophobic drugs from PLGA/PLA
nanoparticles. J Pharm Sci 93, 1804-1814.
Papouli E, Cejka P, & Jiricny J (2004). Dependence of the cytotoxicity of DNA-
damaging agents on the mismatch repair status of human cells. Cancer Res 64, 3391-
3394.
Park TG, Lu W, & Crotts G (1995). Importance of in vitro experimental conditions on
protein release kinetics, stability and polymer degradation in protein encapsulated
poly(D,L-lactic acid-co-glycolic acid) microspheres. J Control Release 33, 211-222.

138
Parmar JJ, Singh DJ, Hegde DD, Lohade AA, Soni PS, Samad A, & Menon MD
(2010).Development and evaluation of inhalational liposomal system of budesonide for
better management of asthma. Indian journal of pharmaceutical sciences 72, 442-448.
Pavanetto F, Conti B, Genta I, & Giunchedi P (1992). Solvent evaporation, solvent
extraction and spray drying for polylactide microsphere preparation. International
Journal of Pharmaceutics 84, 151-159.
Pearson SJ, Ferguson J, Santibanez-Koref M, & Margison GP (2005). Inhibition of O6-
methylguanine-DNA methyltransferase by an alkyltransferase-like protein from
Escherichia coli. Nucleic Acids Res 33, 3837-3844.
Pegg AE (2000). Repair of O(6)-alkylguanine by alkyltransferases. Mutat Res 462, 83-
100.
Pegg AE, Wiest L, Foote RS, Mitra S, & Perry W (1983). Purification and properties of
O6-methylguanine-DNA transmethylase from rat liver. J Biol Chem 258, 2327-2333.
Perrie Y & Gregoriadis G (2000). Liposome-entrapped plasmid DNA: characterisation
studies. Biochim Biophys Acta 1475, 125-132.
Philip PA, Souliotis VL, Harris AL, Salisbury A, Tates AD, Mitchell K, van Delft JH,
Ganesan TS, & Kyrtopoulos SA (1996). Methyl DNA adducts, DNA repair, and
hypoxanthine-guanine phosphoribosyl transferase mutations in peripheral white blood
cells from patients with malignant melanoma treated with dacarbazine and hydroxyurea.
Clin Cancer Res 2, 303-310.
Polakovic M, Gorner T, Gref R, & Dellacherie E (1999). Lidocaine loaded
biodegradable nanospheres. II. Modelling of drug release. J Control Release 60, 169-
177.
Porjazoska A, Goracinova K, Mladenovska K, Glavas M, Simonovska M, Janjevic EI,
& Cvetkovska M (2004). Poly(lactide-co-glycolide) microparticles as systems for
controlled release of proteins -- preparation and characterization. Acta Pharm 54, 215-
229.
Rachev E, Nalbansky B, Kolarov G, & Agrosi M (2001). Efficacy and safety of
phospholipid liposomes in the treatment of neuropsychological disorders associated
with the menopause: a double-blind, randomised, placebo-controlled study. Curr Med
Res Opin 17, 105-110.
Ranson M, Hersey P, Thompson D, Beith J, McArthur GA, Haydon A, Davis ID,
Kefford RF, Mortimer P, Harris PA, Baka S, Seebaran A, Sabharwal A, Watson AJ,
Margison GP, & Middleton MR (2007). Randomized trial of the combination of
lomeguatrib and temozolomide compared with temozolomide alone in chemotherapy
naive patients with metastatic cutaneous melanoma. J Clin Oncol 25, 2540-2545.

139
Reni M, Mason W, Zaja F, Perry J, Franceschi E, Bernardi D, Dell'Oro S, Stelitano C,
Candela M, Abbadessa A, Pace A, Bordonaro R, Latte G, Villa E, & Ferreri AJ (2004).
Salvage chemotherapy with temozolomide in primary CNS lymphomas: preliminary
results of a phase II trial. Eur J Cancer 40, 1682-1688.
Rimel BJ, Huettner P, Powell MA, Mutch DG, & Goodfellow PJ (2009). Absence of
MGMT promoter methylation in endometrial cancer. Gynecol Oncol 112, 224-228.
Rongy L, Lian SN, & Chi-HwaW (2005). In vitro study of anticancer drug doxorubicin
in PLGA-based microparticles. Biomaterials, 26, 4476–4485.
Ruf H, Georgalis Y, & Grell E (1989). Dynamic laser light scattering to determine size
distributions of vesicles. Methods Enzymol 172, 364-390.
Sandberg-Wollheim M, Malmstrom P, Stromblad LG, Anderson H, Borgstrom S, Brun
A, Cronqvist S, Hougaard K, & Salford LG (1991). A randomized study of
chemotherapy with procarbazine, vincristine, and lomustine with and without radiation
therapy for astrocytoma grades 3 and/or 4. Cancer 68, 22-29.
Sacchetti M & Van-Oort MM (1996). Spray drying and supercritical fluid particle
generation technique. Marcel dekker, Inc. New York, USA, 337-384.
Sawyer AJ, Piepmeier JM, & Saltzman WM (2006). New methods for direct delivery of
chemotherapy for treating brain tumors. Yale J Biol Med 79, 141-152.
Schwendeman SP, Cardamone, M & Klibanov A (1996). Microparticulate Systems for
the Delivery of Proteins and Vaccines. Marcel-Dekker, New York, USA, 1-49.
Scott JN, Rewcastle NB, Brasher PM, Fulton D, Hagen NA, MacKinnon JA, Sutherland
G, Cairncross JG, & Forsyth P (1998). Long-term glioblastoma multiforme survivors: a
population-based study. Can J Neurol Sci 25, 197-201.
Seong H, An TK, Khang G, Choi SU, Lee CO, & Lee HB (2003). BCNU-loaded
poly(D, L-lactide-co-glycolide) wafer and antitumor activity against XF-498 human
CNS tumor cells in vitro. Int J Pharm 251, 1-12.
Sessa G & Weissmann G (1968). Phospholipid spherules (liposomes) as a model for
biological membranes. J Lipid Res 9, 310-318.
Shazly G, Nawroth T, & Langguth P (2008). Comparison of Dialysis and Dispersion
Methods for In Vitro Release Determination of Drugs from Multilamellar Liposomes.
Dissolution Technologies, 7-10.

140
Shen F, Decosterd LA, Gander M, Leyvraz S, Biollax J, & Lejeune F (1995).
Determination of temozolomide in human plasma and urine by high-performance liquid
chromatography after solid-phase extraction. J Chromatogr B Biomed Appl 667, 291-
300.
Shervington LA, Abba M, Hussain B, & Donnelly J (2005). The simultaneous
separation and determination of five quinolone antibiotics using isocratic reversed-
phase HPLC: application to stability studies on an ofloxacin tablet formulation. J Pharm
Biomed Anal 39, 769-775.
Silva R, Ferreira H, Little C, & Cavaco-Paulo A (2010). Effect of ultrasound parameters
for unilamellar liposome preparation. Ultrason Sonochem 17, 628-632.
Skoog DA and Leary JJ (1992). Principles of instrumental analysis 4th
edition. Saunder
college publishing, Florida, USA,628-669.
Skoog DA, Holler FJ, & Crouch SR (2007). Principles of instrumental analysis 6th
international edition. Thomson brooks/cole, Belmont, USA, 816-855.
Slater JL & Huang CH (1988). Interdigitated bilayer membranes. Prog Lipid Res 27,
325-359.
Soppimath KS, Aminabhavi TM, Kulkarni AR, & Rudzinski WE (2001). Biodegradable
polymeric nanoparticles as drug delivery devices. J Control Release 70, 1-20.
Spenlehauer G, Vert M, Benoit JP, & Boddaert A (1989). In vitro and in vivo
degradation of poly(D,L lactide/glycolide) type microspheres made by solvent
evaporation method. Biomaterials 10, 557-563.
Storm G, & Crommelin DJA (1998). Liposomes: Quo vadis?. Pharm. Sci. Technol.
Today 1, 19–31.
Stupp R, Mason WP, van den Bent MJ, Weller M, Fisher B, Taphoorn MJ, Belanger K,
Brandes AA, Marosi C, Bogdahn U, Curschmann J, Janzer RC, Ludwin SK, Gorlia T,
Allgeier A, Lacombe D, Cairncross JG, Eisenhauer E, & Mirimanoff RO (2005).
Radiotherapy plus concomitant and adjuvant temozolomide for glioblastoma. N Engl J
Med 352, 987-996.
Takashima Y, Saito R, Nakajima A, Oda M, Kimura A, Kanazawa T, & Okada H
(2007). Spray-drying preparation of microparticles containing cationic PLGA
nanospheres as gene carriers for avoiding aggregation of nanospheres. Int J Pharm 343,
262-269.
Tamber H, Johansen P, Merkle HP, & Gander B (2005). Formulation aspects of
biodegradable polymeric microspheres for antigen delivery. Adv Drug Deliv Rev 57,
357-376.
141
Tentori L & Graziani G (2002). Pharmacological strategies to increase the antitumor
activity of methylating agents. Curr Med Chem 9, 1285-1301.
Tentori L, Orlando L, Lacal PM, Benincasa E, Faraoni I, Bonmassar E, D'Atri S, &
Graziani G (1997). Inhibition of O6-alkylguanine DNA-alkyltransferase or poly(ADP-
ribose) polymerase increases susceptibility of leukemic cells to apoptosis induced by
temozolomide. Mol Pharmacol 52, 249-258.
Torchilin VP (2006a). Nanoparticulates as Drug Carriers. GBR: Imperial College,
London, UK, 29-38.
Torchilin VP (2006b). Multifunctional nanocarriers. Adv drug deliv rev 58, 1532-1555.
Trent S, Kong A, Short SC, Traish D, Ashley S, Dowe A, Hines F, & Brada M (2002).
Temozolomide as second-line chemotherapy for relapsed gliomas. J Neurooncol 57,
247-251.
Trivedi RN, Almeida KH, Fornsaglio JL, Schamus S, & Sobol RW (2005). The role of
base excision repair in the sensitivity and resistance to temozolomide-mediated cell
death. Cancer Res 65, 6394-6400.
Turriziani M, Caporaso P, Bonmassar L, Buccisano F, Amadori S, Venditti A,
Cantonetti M, D'Atri S, & Bonmassar E (2006). O6-(4-bromothenyl)guanine (PaTrin-2),
a novel inhibitor of O6-alkylguanine DNA alkyl-transferase, increases the inhibitory
activity of temozolomide against human acute leukaemia cells in vitro. Pharmacol Res
53, 317-323.
United States Pharmacopiea (Volume 1) (2007). Validation of compendial procedures
1225. US Pharmacopiea, Rockville, USA, 680-683.
Vadiei K, Lopez-Berestein G, Perez-Soler R, & Luke DR (1989). In-vitro evaluation of
liposomal cyclosporine. Int. J. Pharm 57, 133–138.
Vail DM, Amantea MA, Colbern GT, Martin FJ, Hilger RA, & Working PK (2004).
Pegylated liposomal doxorubicin: proof of principle using preclinical animal models
and pharmacokinetic studies. Semin Oncol 31, 16-35.
Wagenaar BW & Muller BW (1994). Piroxicam release from spray-dried biodegradable
microspheres. Biomaterials 15, 49-54.
Wang FJ & Wang CH (2003). Etanidazole-loaded microspheres fabricated by spray-
drying different poly(lactide/glycolide) polymers: effects on microsphere properties. J
Biomater Sci Polym Ed 14, 157-183.

142
Washington C (1990). Drug release from microdisperse systems: a critical review. Int.
J. Pharm. 58, 1-12.
Westphal M, Hilt DC, Bortey E, Delavault P, Olivares R, Warnke PC, Whittle IR,
Jaaskelainen J, & Ram Z (2003). A phase 3 trial of local chemotherapy with
biodegradable carmustine (BCNU) wafers (Gliadel wafers) in patients with primary
malignant glioma. Neuro Oncol 5, 79-88.
Witkop B (1999). Paul Ehrlich and his Magic bullets--revisited. Proc Am Philos Soc
143, 540-557.
Woolford LB, Southgate TD, Margison GP, Milsom MD, & Fairbairn LJ (2006). The
P140K mutant of human O(6)-methylguanine-DNA-methyltransferase (MGMT) confers
resistance in vitro and in vivo to temozolomide in combination with the novel MGMT
inactivator O(6)-(4-bromothenyl)guanine. J Gene Med 8, 29-34.
Xu Y & Szoka FC, Jr. (1996). Mechanism of DNA release from cationic liposome/DNA
complexes used in cell transfection. Biochemistry 35, 5616-5623.
Yang SC, Lu LF, Cai Y, Zhu JB, Liang BW, & Yang CZ (1999). Body distribution in
mice of intravenously injected camptothecin solid lipid nanoparticles and targeting
effect on brain. J Control Release 59, 299-307.
Yowell SL & Blackwell S (2002). Novel effects with polyethylene glycol modified
pharmaceuticals. Cancer Treat Rev 28 Suppl A, 3-6.
Zhang H & Gao S (2007). Temozolomide/PLGA microparticles and antitumor activity
against glioma C6 cancer cells in vitro. Int J Pharm 329, 122-128.
Zhao A, Hunter SK, & Rodgers VG (2010). Theoretical prediction of induction period
from transient pore evolvement in polyester-based microparticles. J Pharm Sci 99,
4477-4487.
Zuidam NJ, Grit M, & Crommelin DJ (1993). Liposome Technology 2nd
edition. CRC
Press, London, UK, 455–486.
Zuidam NJ, Talsma H, & Crommelin DJ (1996). Handbook of Nonmedical Applications
of Liposomes. Microreactors CRC, London, UK, 71–80.

143
APPENDIX

144
Appendix 1
Validation of HPLC system for Temozolomide (TMZ)
Figure 6.1 HPLC chromatogram for TMZ (0.1 mg/ml) (n = 3).
Figure 6.2 HPLC chromatogram for TMZ (0.08 mg/ml) (n = 3).

145
Figure 6.3 HPLC chromatogram for TMZ (0.06 mg/ml) (n = 3).
Figure 6.4 HPLC chromatogram for TMZ (0.04 mg/ml) (n = 3).

146
Figure 6.5 HPLC chromatogram for TMZ (0.02 mg/ml) (n = 3).
Figure 6.6 HPLC chromatogram for TMZ (0.01 mg/ml) (n = 3).
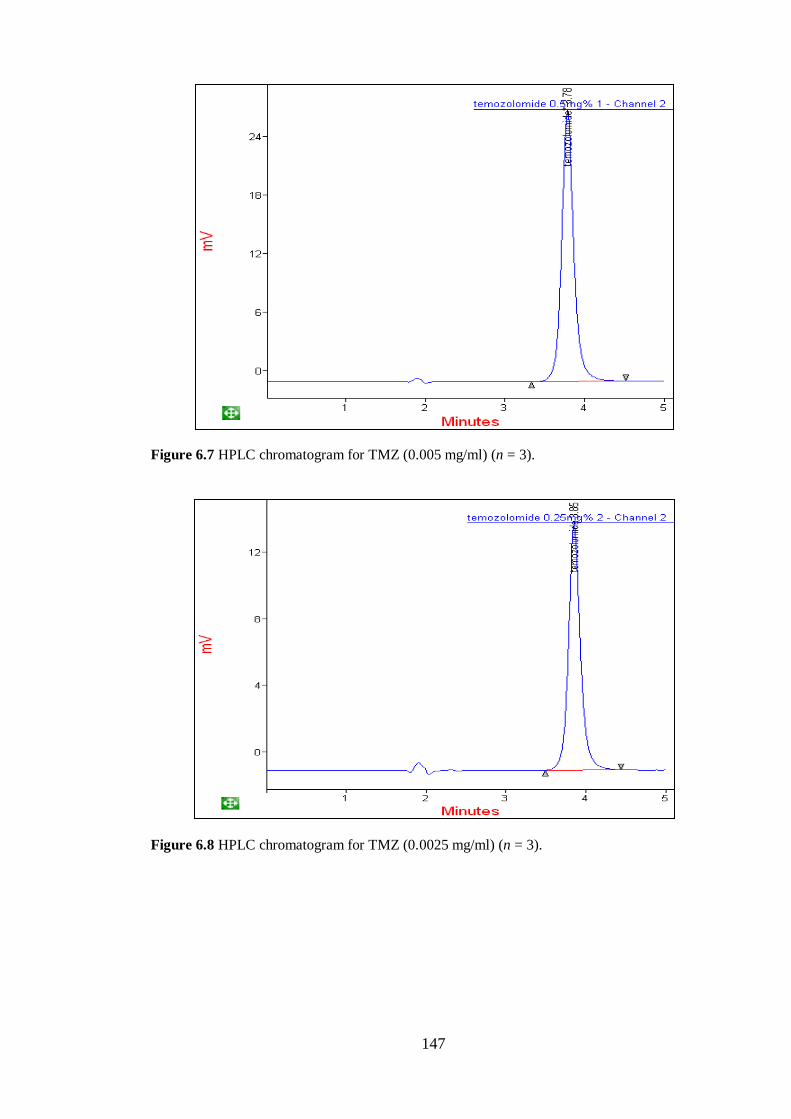
147
Figure 6.7 HPLC chromatogram for TMZ (0.005 mg/ml) (n = 3).
Figure 6.8 HPLC chromatogram for TMZ (0.0025 mg/ml) (n = 3).

148
Figure 6.9 HPLC chromatogram for TMZ (0.00125 mg/ml) (n = 3).
Figure 6.10 HPLC chromatogram for TMZ (0.000625 mg/ml) (n = 3).
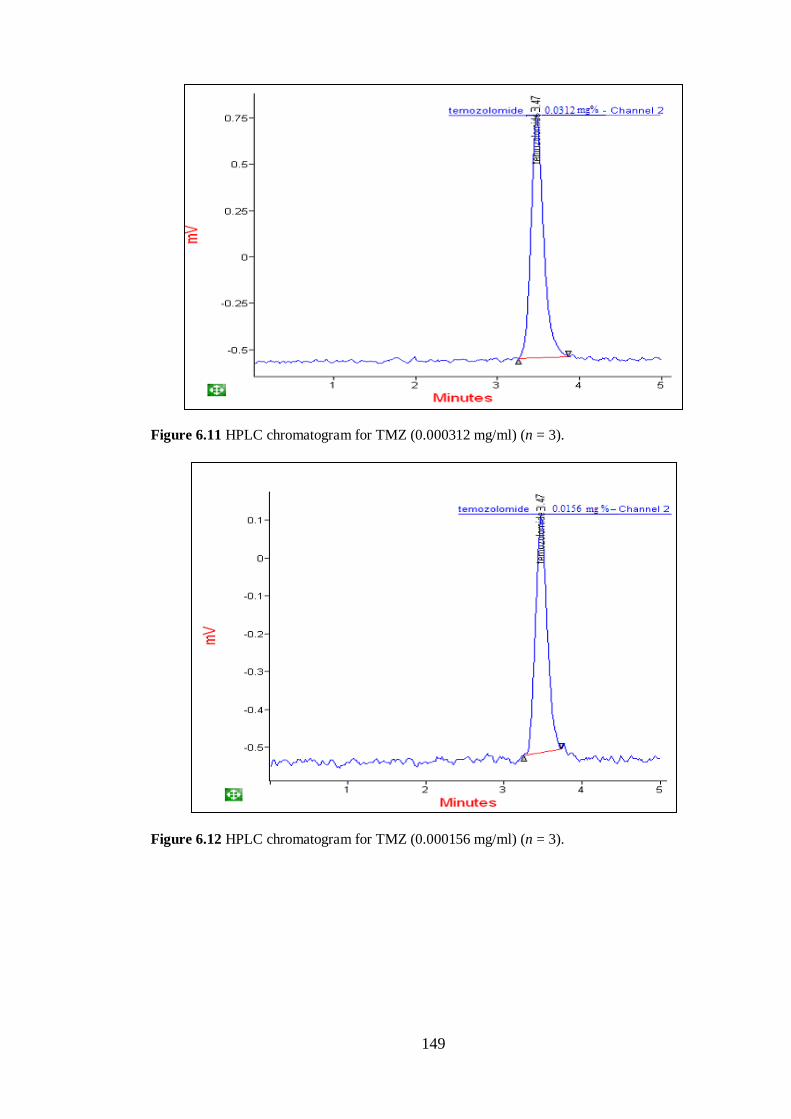
149
Figure 6.11 HPLC chromatogram for TMZ (0.000312 mg/ml) (n = 3).
Figure 6.12 HPLC chromatogram for TMZ (0.000156 mg/ml) (n = 3).
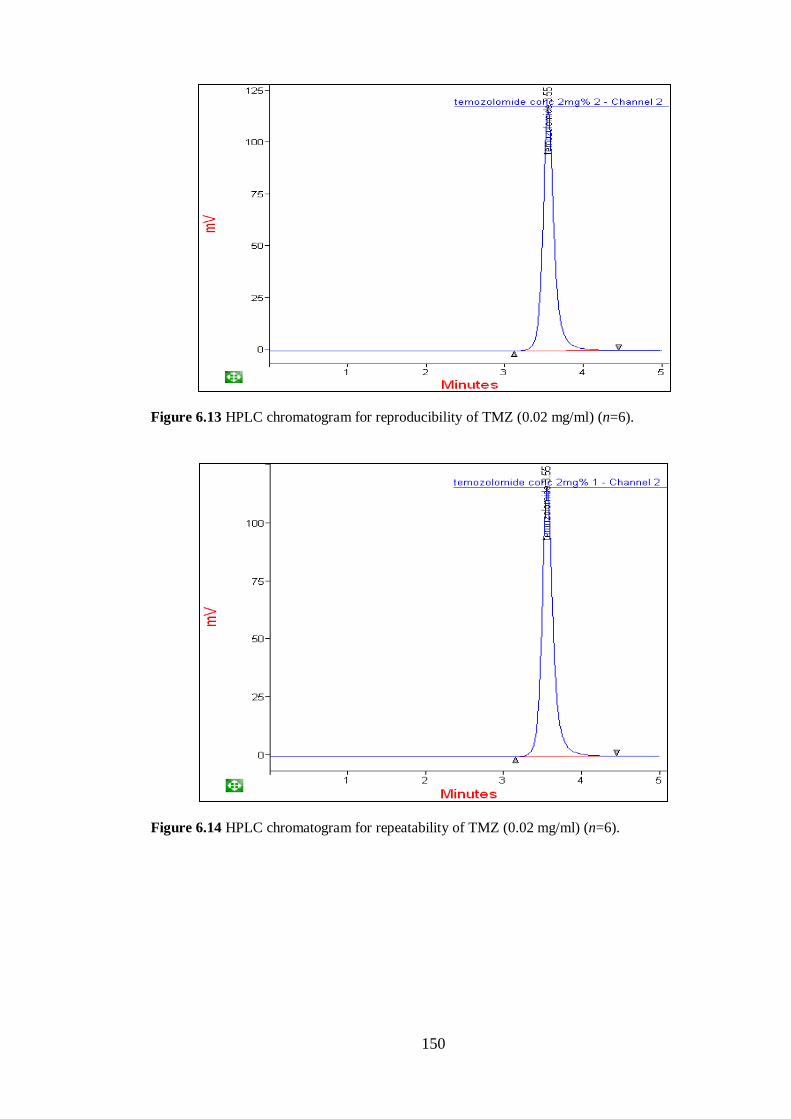
150
Figure 6.13 HPLC chromatogram for reproducibility of TMZ (0.02 mg/ml) (n=6).
Figure 6.14 HPLC chromatogram for repeatability of TMZ (0.02 mg/ml) (n=6).

151
Figure 6.16 HPLC chromatogram showing LOD for TMZ (0.000039 mg/ml) (n = 3).
Figure 6.15 HPLC chromatogram showing LOQ for TMZ (0.0000781 mg/ml) (n=6).

152
Appendix 2
Validation of HPLC system for Patrin-2
Figure 6.17 HPLC chromatogram for Patrin-2 (0.1 mg/ml) (n = 3).
Figure 6.18 HPLC chromatogram for Patrin-2 (0.08 mg/ml) (n = 3).

153
Figure 6.19 HPLC chromatogram for Patrin-2 (0.06 mg/ml) (n = 3).
Figure 6.20 HPLC chromatogram for Patrin-2 (0.04 mg/ml) (n = 3).

154
Figure 6.21 HPLC chromatogram for Patrin-2 (0.02 mg/ml) (n = 3).
Figure 6.22 HPLC chromatogram for Patrin-2 (0.01 mg/ml) (n = 3).

155
Figure 6.22 HPLC chromatogram for Patrin-2 (0.005 mg/ml) (n = 3).
Figure 6.23 HPLC chromatogram for Patrin-2 (0.0025 mg/ml) (n = 3).
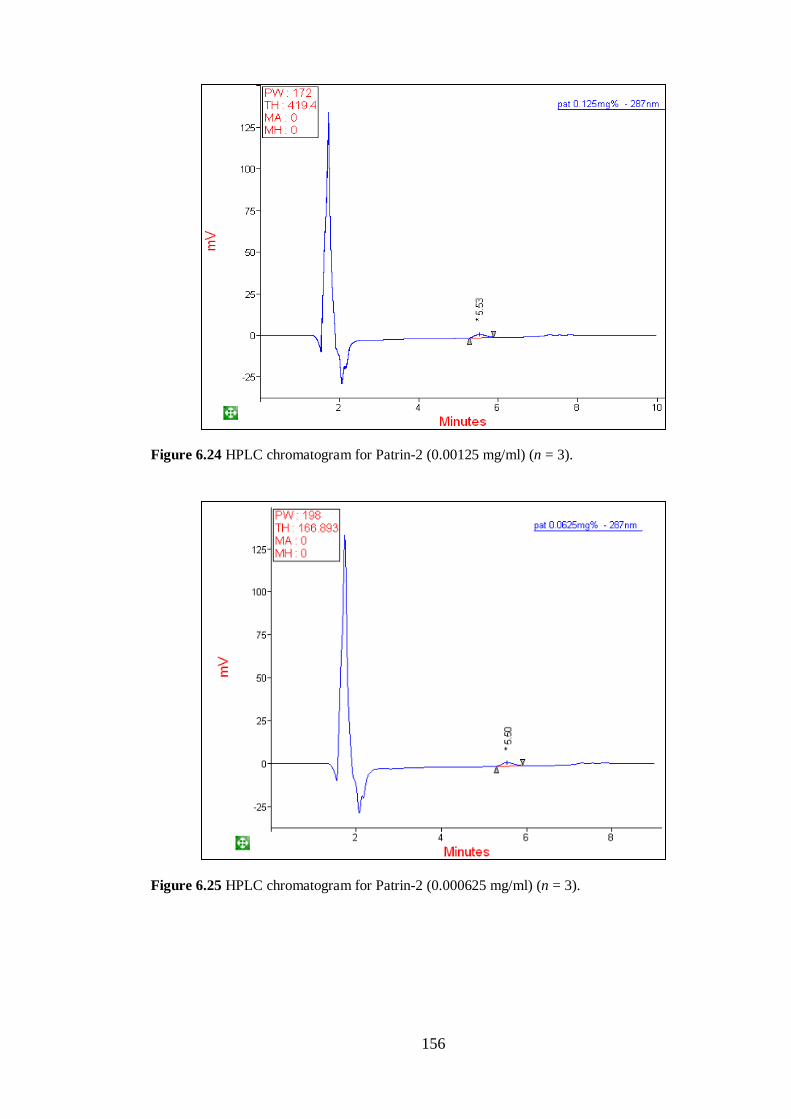
156
Figure 6.24 HPLC chromatogram for Patrin-2 (0.00125 mg/ml) (n = 3).
Figure 6.25 HPLC chromatogram for Patrin-2 (0.000625 mg/ml) (n = 3).

157
Figure 6.26 HPLC chromatogram for Patrin-2 (0.000312 mg/ml) (n = 3).
Figure 6.27 HPLC chromatogram for Patrin-2 (0.000156 mg/ml) (n = 3).
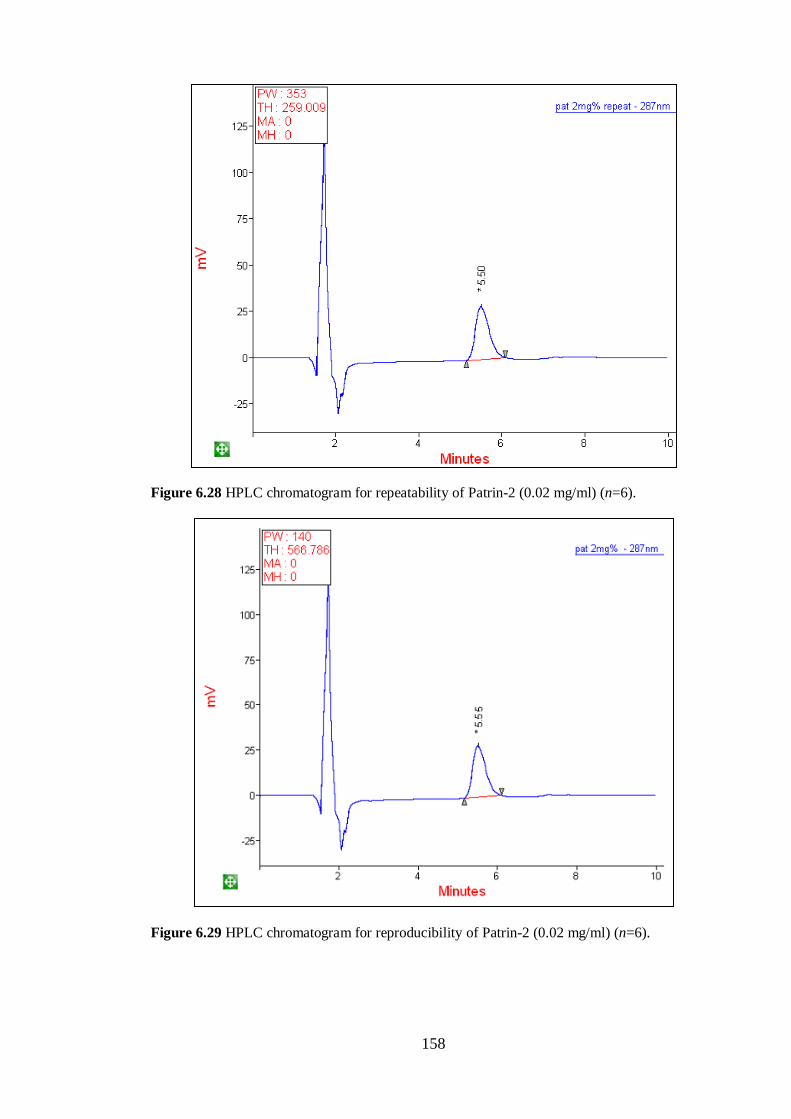
158
Figure 6.28 HPLC chromatogram for repeatability of Patrin-2 (0.02 mg/ml) (n=6).
Figure 6.29 HPLC chromatogram for reproducibility of Patrin-2 (0.02 mg/ml) (n=6).
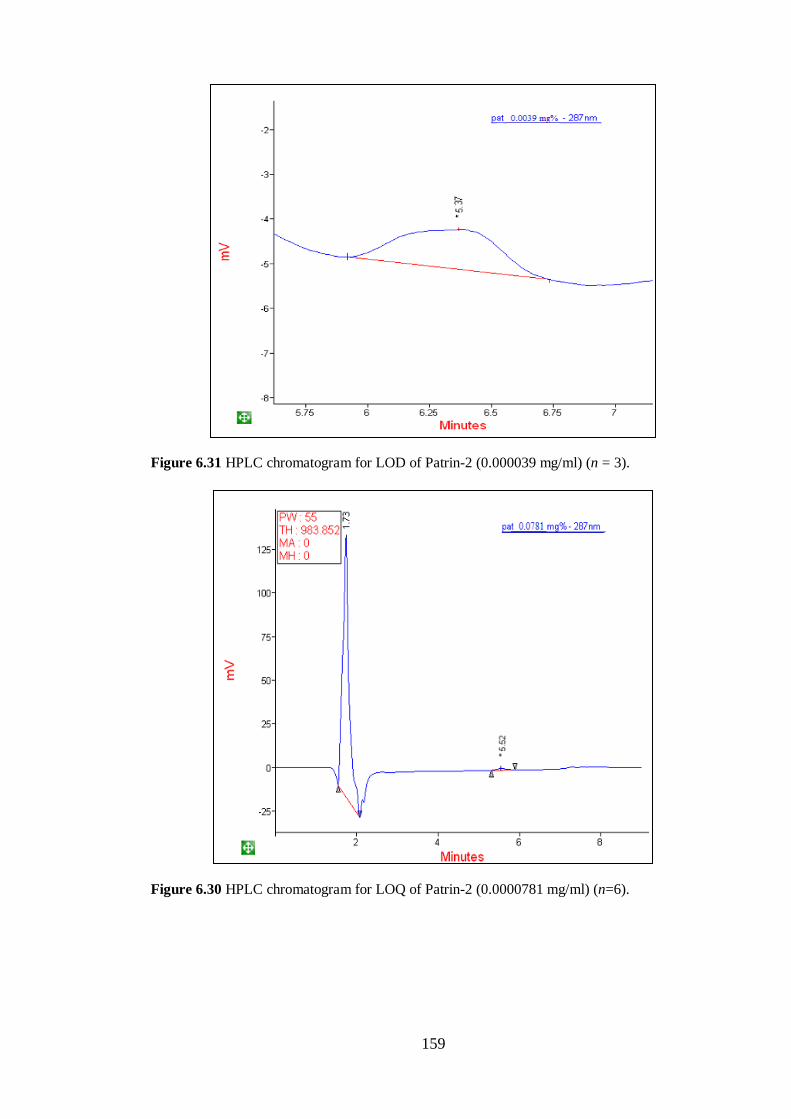
159
Figure 6.31 HPLC chromatogram for LOD of Patrin-2 (0.000039 mg/ml) (n = 3).
Figure 6.30 HPLC chromatogram for LOQ of Patrin-2 (0.0000781 mg/ml) (n=6).

160
Appendix 3
Stability test for TMZ and Patrin-2
Figure 6.32 HPLC chromatogram for the compatibility of TMZ and Patrin-2 at a concentration
of 0.05 mg/ml in PBS and ethanol (ratio 8:2) solution stored for 72 hr at 25°C (n = 3).
Figure 6.33 HPLC chromatogram for the compatibility of TMZ and Patrin-2 at a concentration of 0.05 mg/ml in PBS and ethanol (ratio 8:2) solution stored for 288 hr at 25°C (n = 3).

161
Figure 6.34 HPLC chromatogram for the compatibility of TMZ and Patrin-2 at a concentration
of 0.05 mg/ml in PBS and ethanol (ratio 8:2) solution stored for 72 hr at 37°C (n = 3).
Figure 6.35 HPLC chromatogram for the compatibility of TMZ and Patrin-2 at a concentration
of 0.05 mg/ml in PBS and ethanol (ratio 8:2) solution stored for 72 hr at 50°C (n = 3).

162
Figure 6.36 HPLC chromatogram for the compatibility of TMZ and Patrin-2 at a concentration of 0.05 mg/ml in PBS and ethanol (ratio 8:2) solution stored for 288 hr at 50°C (n = 3).
Figure 6.37 HPLC chromatogram for the dry sample reaction carried out to determine the
compatibility of TMZ and Patrin-2 at a concentration of 0.05 mg/ml in PBS and ethanol (ratio
8:2) (n = 3).
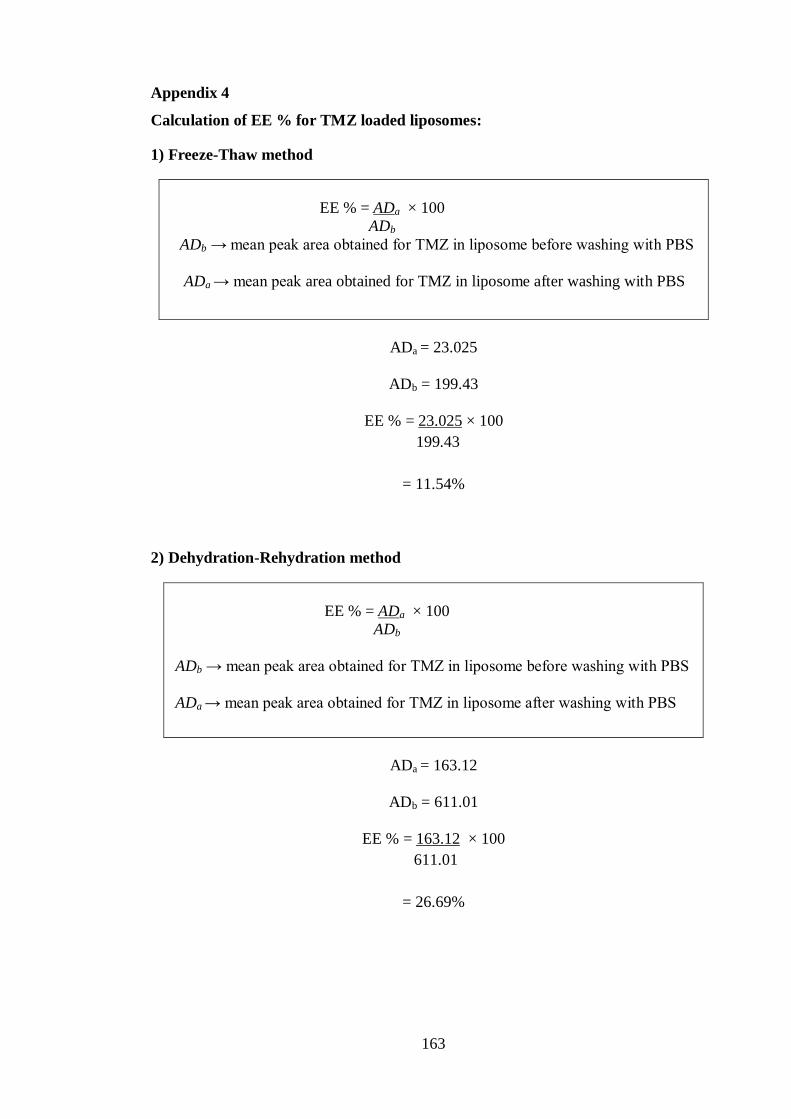
163
Appendix 4
Calculation of EE % for TMZ loaded liposomes:
1) Freeze-Thaw method
EE % = ADa × 100
ADb
ADb → mean peak area obtained for TMZ in liposome before washing with PBS
ADa → mean peak area obtained for TMZ in liposome after washing with PBS
ADa = 23.025
ADb = 199.43
EE % = 23.025 × 100
199.43
= 11.54%
2) Dehydration-Rehydration method
EE % = ADa × 100
ADb
ADb → mean peak area obtained for TMZ in liposome before washing with PBS
ADa → mean peak area obtained for TMZ in liposome after washing with PBS
ADa = 163.12
ADb = 611.01
EE % = 163.12 × 100
611.01
= 26.69%

164
Calculation of EE % for TMZ and Patrin-2 loaded PLGA microparticles:
1) Emulsifying-solvent evaporation method for preparation of TMZ loaded
microparticles.
EE % = Dm × 100
Dt
Dm → mean peak area obtained for TMZ in microparticle
Dt → mean peak area obtained for standard solution of TMZ
Dm = 178.83
Dt = 6456.41
EE % = 178.83 × 100
6456.41
= 2.76 %
2) Spray dry method for preparation of TMZ loaded microparticles.
EE % = Dm × 100
Dt
Dm → mean peak area obtained for TMZ in microparticle
Dt → mean peak area obtained for standard solution of TMZ
Dm = 5161.22
Dt = 8023.08
EE % = 5161.22 × 100
8023.08
= 64.32 %

165
3) Spray dry method for preparation of Patrin-2 loaded microparticles.
EE % = Dm × 100
Dt
Dm → mean peak area obtained for Patrin-2 in microparticle
Dt → mean peak area obtained for standard solution of Patrin-2
Dm = 2619.75
Dt = 3825.92
EE % = 2619.75 × 100
3825.92
= 68.47 %

166
Calculation of cumulative mass release (µg) for TMZ loaded PLGA microparticle:
T1 = T1 conc (µg/ml) * X
T2 = (T2 conc (µg ml) * X) + T1 cumulative mass release-(T1 conc (µg /ml)* Y)
T3 = (T3 conc (µg /ml) * X) + T2 cumulative mass release-(T2 conc (µg /ml)* Y)
T4 = and so on…
T= Sample collection timepoint
X= Tolal volume of release medium (i.e. 25ml in this study)
Y= Tolal volume of release medium-Sampling volume (i.e. 25ml-1ml=24ml)
Calculations:
T1 = 16.28 × 25 = 407.06
T2 = (15.07 × 25) + 407.06 - (16.28 × 24) = 393.22
Similarly the calculations were carried out for the remaining samples.

167
Calculation of cumulative mass release (µg) for Patrin-2 loaded PLGA
microparticle:
T1 = T1 conc (µg /ml) * X
T2 = (T2 conc (µg /ml) * X) + T1 cumulative mass release-(T1 conc (µg /ml)* Y)
T3 = (T3 conc (µg /ml) * X) + T2 cumulative mass release-(T2 conc (µg /ml)* Y)
T4 = and so on…
T= Sample collection timepoint
X= Tolal volume of release medium (i.e. 25ml in this study)
Y= Tolal volume of release medium-Sampling volume (i.e. 25ml-1ml=24ml)
Calculations:
T1 = 4.82 × 25 = 120.56
T2 = (4.85 × 25) + 120.56 - (4.82 × 24) = 126.14
Similarly the calculations were carried out for the remaining samples.