Embed Size (px)
Citation preview
AnnualReport 2015
DS INDUSTRIES LIMITED
Company Information 2
Notice of Annual General Meeting 4
Directors' Report 5
Financial Highlights 8
Statement of Compliance With Code of Corporate Governance 9
Auditors' Review Report on Corporate Governance 11
Auditors' Report to the Members 12
Balance Sheet 14
Profit & Loss Account 16
Cash Flow Statement 17
Statement of Comprehensive Income 18
Statement of Changes in Equity 19
Notes to the Financial Statements 20
Pattern of Shareholding 51
53Form of Proxy
Annual Report June 30, 2015
D.S. INDUSTRIES LIMITED01
CONTENTS
D.S. INDUSTRIES LIMITED02
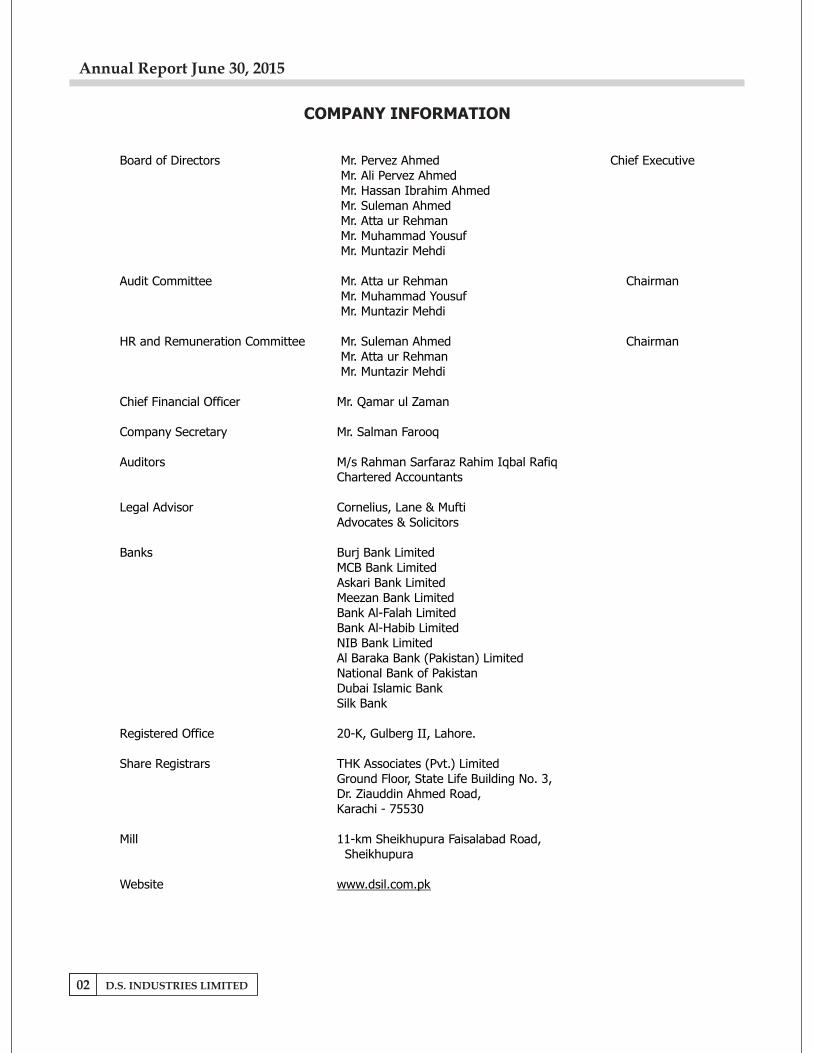
COMPANY INFORMATION
Board of Directors Mr. Pervez Ahmed Chief Executive Mr. Ali Pervez Ahmed Mr. Hassan Ibrahim Ahmed Mr. Suleman Ahmed Mr. Atta ur Rehman Mr. Muhammad Yousuf Mr. Muntazir Mehdi
Audit Committee Mr. Atta ur Rehman Chairman Mr. Muhammad Yousuf Mr. Muntazir Mehdi
HR and Remuneration Committee Mr. Suleman Ahmed Chairman Mr. Atta ur Rehman Mr. Muntazir Mehdi
Chief Financial Officer Mr. Qamar ul Zaman
Company Secretary Mr. Salman Farooq
Auditors M/s Rahman Sarfaraz Rahim Iqbal RafiqChartered Accountants
Legal Advisor Cornelius, Lane & MuftiAdvocates & Solicitors
Banks Burj Bank LimitedMCB Bank LimitedAskari Bank LimitedMeezan Bank LimitedBank Al-Falah LimitedBank Al-Habib LimitedNIB Bank LimitedAl Baraka Bank (Pakistan) LimitedNational Bank of PakistanDubai Islamic BankSilk Bank
Registered Office 20-K, Gulberg II, Lahore.
Share Registrars THK Associates (Pvt.) LimitedGround Floor, State Life Building No. 3,Dr. Ziauddin Ahmed Road,Karachi - 75530
Mill 11-km Sheikhupura Faisalabad Road, Sheikhupura
Website www.dsil.com.pk
Annual Report June 30, 2015
D.S. INDUSTRIES LIMITED03
-
-
-
-
- Be a good corporate citizen
VISION
To be a dynamic, profitable, growth oriented Company and to achieve excellence
through commitment, integrity, honesty and team work
MISSION
To increase consistently the value of the Company to its shareholders by building
up the Company on sound financial footings with better productivity, excellence
in quality and improved efficiency at lower operating costs without compromising
on our principles of ethics, integrity and professional standards
To achieve high returns on investments through continuous process of
improvement for the benefit of shareholders
To be a responsible employer and to develop and reward employees according
to their ability and performance.
Annual Report June 30, 2015
D.S. INDUSTRIES LIMITED04
NOTICE OF ANNUAL GENERAL MEETING
BY ORDER OF THE BOARD
Salman Farooq(Company Secretary)
LahoreOctober 09, 2015
Annual Report June 30, 2015
Notice is hereby given that the Thirty-fifth Annual General Meeting of the shareholders of the Company will be held at the Registered Office of the Company 20 - K Gulberg II, Lahore on Saturday October 31, 2015 at 4:15 p.m. to transact the following business:-
1 To confirm the minutes of Extra-ordinary General Meeting held on January 31, 2015.
2. To receive, consider and adopt the audited accounts of the Company for the year ended June 30, 2015 together with Directors' and Auditors' reports thereon.
3. To appoint Auditors of the Company for the year 2015-16 and to fix their remuneration. The present Auditors M/s Rahman Sarfaraz Rahim Iqbal Rafiq - Chartered Accountants, retire and being eligible offered themselves for the re-appointment.
Notes:-
1 The share transfer books of the Company will remain closed from October 28, 2015 to November 2, 2015 (BOTH DAYS INCLUSIVE)
2 A member entitled to attend and vote at this meeting may appoint another member as his / her proxy to attend the meeting and vote for him / her. Proxies in order to be effective must be deposited at the Registered Office of the Company not less than 48 hours before the meeting.
3 Shareholders are required to immediately notify the Registrar of any change in their postal addresses.
4 Account holders and sub-account holders holding book entry securities in respect of the shares of the Company in Central Depository Company of Pakistan Limited, who wish to attend the General Meeting are requested to bring their original Computerized National Identity Cards for identification purpose.
D.S. INDUSTRIES LIMITED05
DIRECTORS' REPORT
Annual Report June 30, 2015
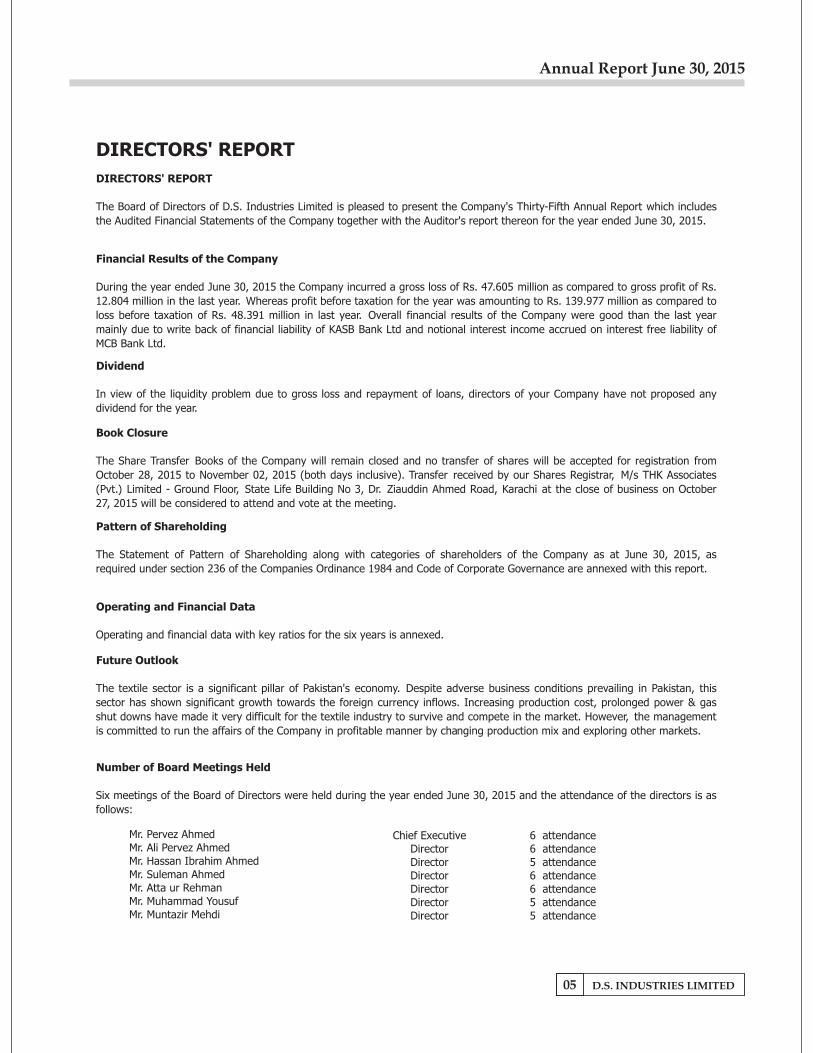
DIRECTORS' REPORT
Financial Results of the Company
Dividend
Book Closure
Pattern of Shareholding
Operating and Financial Data
Future Outlook
Number of Board Meetings Held
Mr. Pervez Ahmed 6 attendance Mr. Ali Pervez Ahmed 6 attendance Mr. Hassan Ibrahim Ahmed 5 attendance Mr. Suleman Ahmed 6 attendance Mr. Atta ur Rehman 6 attendance Mr. Muhammad Yousuf 5 attendance Mr. Muntazir Mehdi 5 attendance
The textile sector is a significant pillar of Pakistan's economy. Despite adverse business conditions prevailing in Pakistan, this
sector has shown significant growth towards the foreign currency inflows. Increasing production cost, prolonged power & gas
shut downs have made it very difficult for the textile industry to survive and compete in the market. However, the management
is committed to run the affairs of the Company in profitable manner by changing production mix and exploring other markets.
Six meetings of the Board of Directors were held during the year ended June 30, 2015 and the attendance of the directors is as
follows:
Chief ExecutiveDirectorDirectorDirectorDirectorDirectorDirector
Operating and financial data with key ratios for the six years is annexed.
The Board of Directors of D.S. Industries Limited is pleased to present the Company's Thirty-Fifth Annual Report which includes
the Audited Financial Statements of the Company together with the Auditor's report thereon for the year ended June 30, 2015.
During the year ended June 30, 2015 the Company incurred a gross loss of Rs. 47.605 million as compared to gross profit of Rs.
12.804 million in the last year. Whereas profit before taxation for the year was amounting to Rs. 139.977 million as compared to
loss before taxation of Rs. 48.391 million in last year. Overall financial results of the Company were good than the last year
mainly due to write back of financial liability of KASB Bank Ltd and notional interest income accrued on interest free liability of
MCB Bank Ltd.
In view of the liquidity problem due to gross loss and repayment of loans, directors of your Company have not proposed any
dividend for the year.
The Share Transfer Books of the Company will remain closed and no transfer of shares will be accepted for registration from
October 28, 2015 to November 02, 2015 (both days inclusive). Transfer received by our Shares Registrar, M/s THK Associates
(Pvt.) Limited - Ground Floor, State Life Building No 3, Dr. Ziauddin Ahmed Road, Karachi at the close of business on October
27, 2015 will be considered to attend and vote at the meeting.
The Statement of Pattern of Shareholding along with categories of shareholders of the Company as at June 30, 2015, as
required under section 236 of the Companies Ordinance 1984 and Code of Corporate Governance are annexed with this report.
D.S. INDUSTRIES LIMITED06
Annual Report June 30, 2015
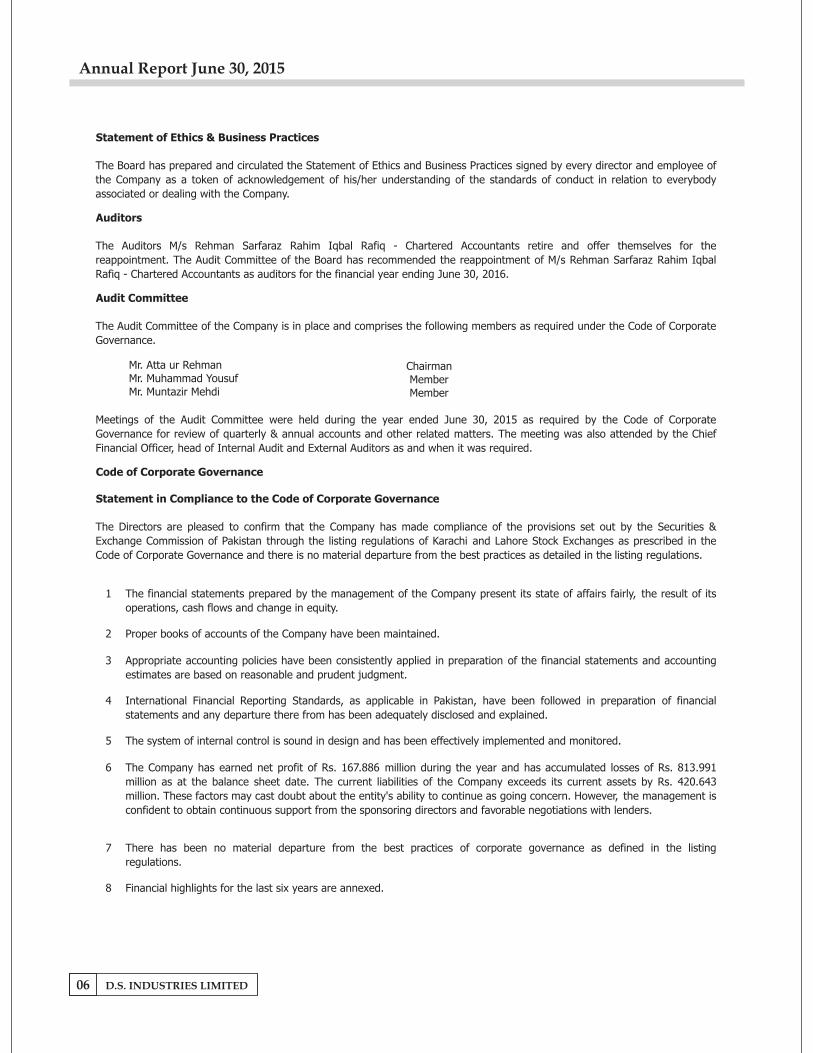
Statement of Ethics & Business Practices
Auditors
Audit Committee
Mr. Atta ur Rehman Mr. Muhammad Yousuf Mr. Muntazir Mehdi
Code of Corporate Governance
Statement in Compliance to the Code of Corporate Governance
1
2
3
4
5
6
7
8 Financial highlights for the last six years are annexed.
There has been no material departure from the best practices of corporate governance as defined in the listing
regulations.
ChairmanMemberMember
Meetings of the Audit Committee were held during the year ended June 30, 2015 as required by the Code of Corporate
Governance for review of quarterly & annual accounts and other related matters. The meeting was also attended by the Chief
Financial Officer, head of Internal Audit and External Auditors as and when it was required.
The Directors are pleased to confirm that the Company has made compliance of the provisions set out by the Securities &
Exchange Commission of Pakistan through the listing regulations of Karachi and Lahore Stock Exchanges as prescribed in the
Code of Corporate Governance and there is no material departure from the best practices as detailed in the listing regulations.
The financial statements prepared by the management of the Company present its state of affairs fairly, the result of its
operations, cash flows and change in equity.
Proper books of accounts of the Company have been maintained.
Appropriate accounting policies have been consistently applied in preparation of the financial statements and accounting
estimates are based on reasonable and prudent judgment.
International Financial Reporting Standards, as applicable in Pakistan, have been followed in preparation of financial
statements and any departure there from has been adequately disclosed and explained.
The system of internal control is sound in design and has been effectively implemented and monitored.
The Company has earned net profit of Rs. 167.886 million during the year and has accumulated losses of Rs. 813.991
million as at the balance sheet date. The current liabilities of the Company exceeds its current assets by Rs. 420.643
million. These factors may cast doubt about the entity's ability to continue as going concern. However, the management is
confident to obtain continuous support from the sponsoring directors and favorable negotiations with lenders.
The Audit Committee of the Company is in place and comprises the following members as required under the Code of Corporate
Governance.
The Board has prepared and circulated the Statement of Ethics and Business Practices signed by every director and employee of
the Company as a token of acknowledgement of his/her understanding of the standards of conduct in relation to everybody
associated or dealing with the Company.
The Auditors M/s Rehman Sarfaraz Rahim Iqbal Rafiq - Chartered Accountants retire and offer themselves for the
reappointment. The Audit Committee of the Board has recommended the reappointment of M/s Rehman Sarfaraz Rahim Iqbal
Rafiq - Chartered Accountants as auditors for the financial year ending June 30, 2016.
D.S. INDUSTRIES LIMITED07
Annual Report June 30, 2015
Acknowledgement
LahoreOctober 9, 2015
The Board of directors would like to place on record their appreciation to the valued shareholders, bankers, the Securities &
Exchange Commission and to the management of Karachi & Lahore Stock Exchanges for their valuable support, assistance and
guidance. The Board also express its appreciation to the staff and workers of the Company for their services, loyalty and efforts
being continuously rendered
For & on behalf of the Board
Pervez AhmedChief Executive
D.S. INDUSTRIES LIMITED08
Annual Report June 30, 2015
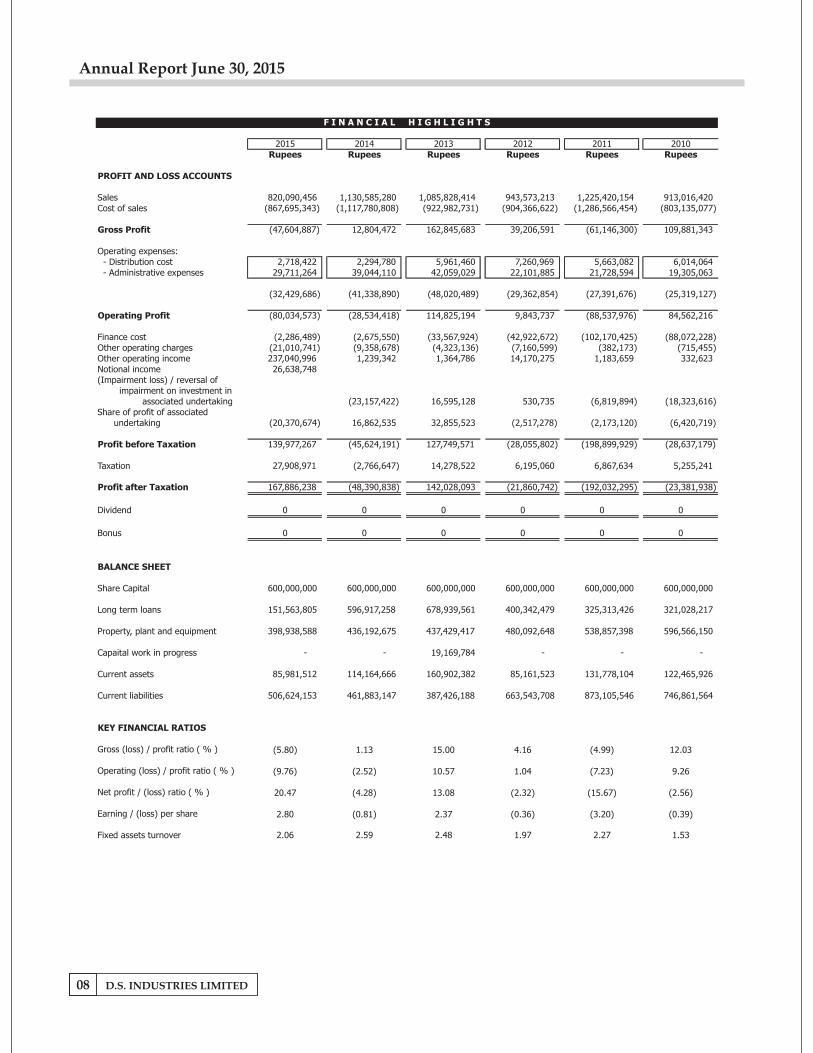
F I N A N C I A L H I G H L I G H T S
2015 2014 2013 2012 2011 2010Rupees Rupees Rupees Rupees Rupees Rupees
PROFIT AND LOSS ACCOUNTS
Sales 820,090,456 1,130,585,280 1,085,828,414 943,573,213 1,225,420,154 913,016,420Cost of sales (867,695,343) (1,117,780,808) (922,982,731) (904,366,622) (1,286,566,454) (803,135,077)
Gross Profit (47,604,887) 12,804,472 162,845,683 39,206,591 (61,146,300) 109,881,343
Operating expenses: - Distribution cost 2,718,422
2,294,780
5,961,460
7,260,969
5,663,082
6,014,064 - Administrative expenses 29,711,264
39,044,110
42,059,029
22,101,885
21,728,594
19,305,063
(32,429,686)
(41,338,890)
(48,020,489)
(29,362,854)
(27,391,676)
(25,319,127)
Operating Profit (80,034,573)
(28,534,418)
114,825,194
9,843,737
(88,537,976)
84,562,216
Finance cost (2,286,489)
(2,675,550)
(33,567,924)
(42,922,672)
(102,170,425)
(88,072,228)Other operating charges (21,010,741)
(9,358,678)
(4,323,136)
(7,160,599)
(382,173)
(715,455)Other operating income 237,040,996
1,239,342
1,364,786
14,170,275
1,183,659
332,623Notional income 26,638,748
(Impairment loss) / reversal of impairment on investment in
associated undertaking (23,157,422)
16,595,128
530,735
(6,819,894)
(18,323,616)Share of profit of associated
undertaking (20,370,674)
16,862,535
32,855,523
(2,517,278)
(2,173,120)
(6,420,719)
Profit before Taxation 139,977,267
(45,624,191)
127,749,571
(28,055,802)
(198,899,929)
(28,637,179)
Taxation 27,908,971
(2,766,647)
14,278,522
6,195,060
6,867,634
5,255,241
Profit after Taxation 167,886,238 (48,390,838) 142,028,093 (21,860,742) (192,032,295) (23,381,938)
Dividend 0 0 0 0 0 0
Bonus 0 0 0 0 0 0
BALANCE SHEET
Share Capital 600,000,000
600,000,000
600,000,000
600,000,000
600,000,000
600,000,000
Long term loans 151,563,805
596,917,258
678,939,561
400,342,479
325,313,426
321,028,217
Property, plant and equipment 398,938,588
436,192,675
437,429,417
480,092,648
538,857,398
596,566,150
Capaital work in progress -
-
19,169,784
-
-
-
Current assets 85,981,512
114,164,666
160,902,382
85,161,523
131,778,104
122,465,926
Current liabilities 506,624,153
461,883,147
387,426,188
663,543,708
873,105,546
746,861,564
KEY FINANCIAL RATIOS
Gross (loss) / profit ratio ( % ) (5.80) 1.13 15.00 4.16 (4.99) 12.03
Operating (loss) / profit ratio ( % ) (9.76) (2.52) 10.57 1.04 (7.23) 9.26
Net profit / (loss) ratio ( % ) 20.47 (4.28) 13.08 (2.32) (15.67) (2.56)
Earning / (loss) per share 2.80 (0.81) 2.37 (0.36) (3.20) (0.39)
Fixed assets turnover 2.06 2.59 2.48 1.97 2.27 1.53
D.S. INDUSTRIES LIMITED09
Annual Report June 30, 2015
Statement of Compliance With BestPractices of Code of Corporate Governance
For The Year Ended June 30, 2015
1.
Name of Director and Category
Mr. Pervez Ahmed - Executice Director Mr. Ali Pervez Ahmed - Executive Director Mr. Hassan Ibrahim Ahmed - Executive Director Mr. Suleman Ahmed - Non Executive Director Mr. Atta ur Rehman - Non Executive Director Mr. Muhammad Yousuf - Non Executive Director Mr. Muntazir Mehdi - Non Executive Director
2.
3.
4. No casual vacancy occurred on the board during the year.
5.
6.
7.
8.
9.
10.
The Company encourages representation of independent non-executive directors and directors
representing minority interest on its board of directors. At present the board includes:
The Directors have confirmed that none of them is serving as a director on more than seven listed
companies, including this Company.
All the directors of the Company are registered as taxpayers and none of them has defaulted in payment
of any loan to a banking company, a DFI or a NBFI or being a member of a stock exchange has been
declared as a defaulter by that stock exchange.
The Company has prepared a "Code of Conduct" and has ensured that appropriate steps have been
taken to disseminate it throughout the Company along with its supporting policies and procedures.
The Board has developed a vision/mission statement, overall corporate strategy and significant policies
of the Company. A complete record of particulars of significant policies along with the dates on which
they were approved or amended has been maintained.
All the powers of the board have been duly exercised and decisions on material transactions, including
appointment and determination of remuneration and terms and conditions of employment of the CEO,
other executive and non executive directors, have been taken by the board.
The meetings of the board were presided over by the Chairman and in his absence, by a director elected
by the board for this purpose and the board met at least once in every quarter. Written notices of the
Board meetings, along with agenda were circulated at least seven days before the meetings. The
minutes of the meetings were appropriately recorded and circulated.
Directors are well conversant with the Listing Regulations and legal requirements and as such are fully
aware of their duties and responsibilities.
The Board is in process of developing a comprehensive mechanism for annual evaluation of its
performance.
The Company has applied the principles contained in the Code of Corporate Governance in the following
manner:
This statement is being presented to comply with the Code of Corporate Governance (CoCG) contained in
Listing Regulations of Karachi and Lahore Stock Exchanges for the purpose of establishing a framework of
good governance, whereby a listed company is managed in compliance with the best practices of Corporate
Governance.
11.
12.
13.
14.
15. The Company has complied with all the corporate and financial reporting requirements of the CoCG.
16.
17.
18.
19. The Board has set-up an effective internal audit function.
20.
21.
22.
23.
24. We confirm that all material principles contained in the CoCG been complied with.
For and on behalf of Board of Directors
Lahore.October 9, 2015
Pervez Ahmed Chief Executive
Material / price sensitive information has been disseminated among all market participants at once
through stock exchanges.
The board has formed an Audit Committee which comprises of three members who are Non-Executive
Directors.
The meetings of the Audit Committee were held at least once every quarter prior to approval of interim
and final results of the Company and as required by the CoCG. The terms of reference of the committee
have been formed and advised to the committee for compliance.
The board has formed Human Resource and Remuneration Committee and is comprises on three Non-
Executive Directors including the chairman of the committee.
The statutory auditors of the Company have confirmed that they have been given a satisfactory rating
under the quality control review programme of the Institute of Chartered Accountants of Pakistan
(ICAP), and that they or any of the partners of the firm, their spouses and minor children do not hold
shares of the Company and that firm and all its partners are in compliance with International Federation
of Accountants (IFAC) guidelines on code of ethics as adopted by the ICAP.
The Statutory Auditors or the persons associated with them have not been appointed to provide other
services except in accordance with the listing regulations and the auditors have confirmed that they have
observed IFAC guidelines in this regard.
The "closed period" prior to the announcement of interim / final results, and business decisions, which
may materially affect the market price of company's securities, was determined and intimated to
directors, employees and stock exchanges.
The Directors, CEO and executives do not hold any interest in the shares of the Company other than
that disclosed in the pattern of shareholding.
There were no new appointments of CFO, Company Secretary or head of internal audit during the year.
The directors' report for this year has been prepared in compliance with the requirements of the CoCG
2012 and fully describes the salient matters required to be disclosed.
The financial statements of the Company were duly endorsed by CEO and CFO before approval by the
Board.
D.S. INDUSTRIES LIMITED10
Annual Report June 30, 2015
D.S. INDUSTRIES LIMITED11
Annual Report June 30, 2015
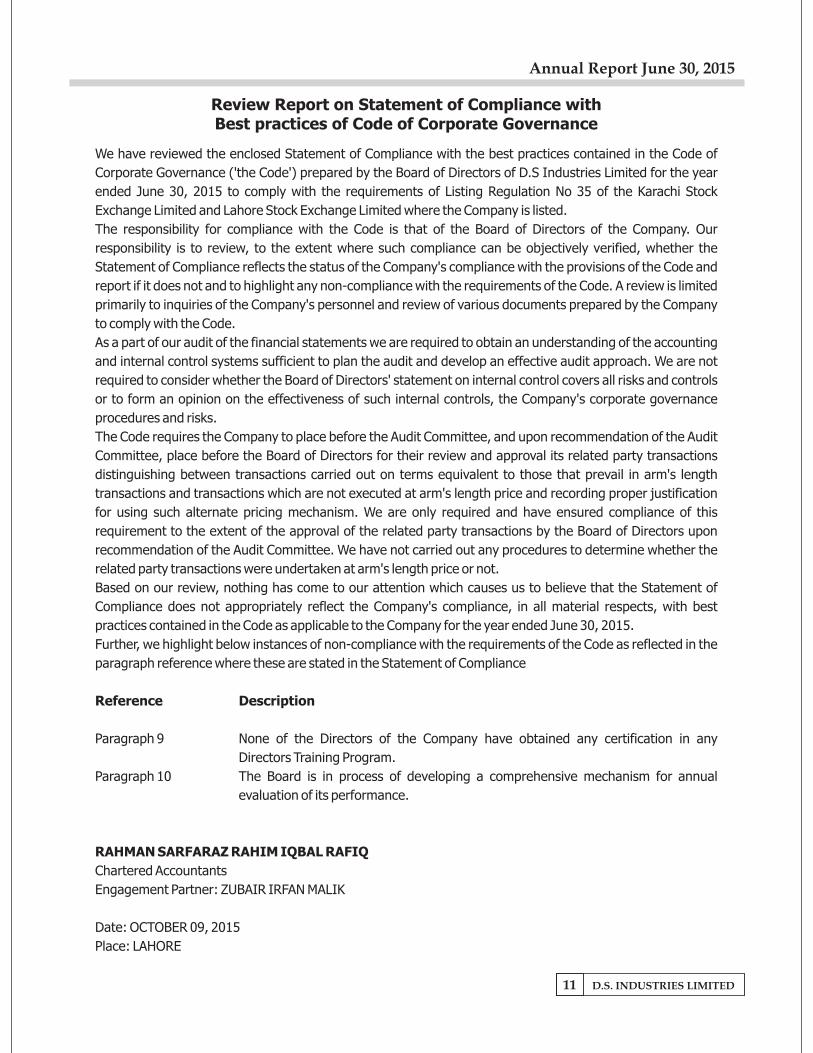
Review Report on Statement of Compliance withBest practices of Code of Corporate Governance
We have reviewed the enclosed Statement of Compliance with the best practices contained in the Code of
Corporate Governance ('the Code') prepared by the Board of Directors of D.S Industries Limited for the year
ended June 30, 2015 to comply with the requirements of Listing Regulation No 35 of the Karachi Stock
Exchange Limited and Lahore Stock Exchange Limited where the Company is listed.
The responsibility for compliance with the Code is that of the Board of Directors of the Company. Our
responsibility is to review, to the extent where such compliance can be objectively verified, whether the
Statement of Compliance reflects the status of the Company's compliance with the provisions of the Code and
report if it does not and to highlight any non-compliance with the requirements of the Code. A review is limited
primarily to inquiries of the Company's personnel and review of various documents prepared by the Company
to comply with the Code.
As a part of our audit of the financial statements we are required to obtain an understanding of the accounting
and internal control systems sufficient to plan the audit and develop an effective audit approach. We are not
required to consider whether the Board of Directors' statement on internal control covers all risks and controls
or to form an opinion on the effectiveness of such internal controls, the Company's corporate governance
procedures and risks.
The Code requires the Company to place before the Audit Committee, and upon recommendation of the Audit
Committee, place before the Board of Directors for their review and approval its related party transactions
distinguishing between transactions carried out on terms equivalent to those that prevail in arm's length
transactions and transactions which are not executed at arm's length price and recording proper justification
for using such alternate pricing mechanism. We are only required and have ensured compliance of this
requirement to the extent of the approval of the related party transactions by the Board of Directors upon
recommendation of the Audit Committee. We have not carried out any procedures to determine whether the
related party transactions were undertaken at arm's length price or not.
Based on our review, nothing has come to our attention which causes us to believe that the Statement of
Compliance does not appropriately reflect the Company's compliance, in all material respects, with best
practices contained in the Code as applicable to the Company for the year ended June 30, 2015.
Further, we highlight below instances of non-compliance with the requirements of the Code as reflected in the
paragraph reference where these are stated in the Statement of Compliance
Reference Description
Paragraph 9 None of the Directors of the Company have obtained any certification in any
Directors Training Program.
Paragraph 10 The Board is in process of developing a comprehensive mechanism for annual
evaluation of its performance.
RAHMAN SARFARAZ RAHIM IQBAL RAFIQ
Chartered Accountants
Engagement Partner: ZUBAIR IRFAN MALIK
Date: OCTOBER 09, 2015
Place: LAHORE
Audit | Tax | Advisory | Consulting | Outsourcing
D.S. INDUSTRIES LIMITED12
Annual Report June 30, 2015
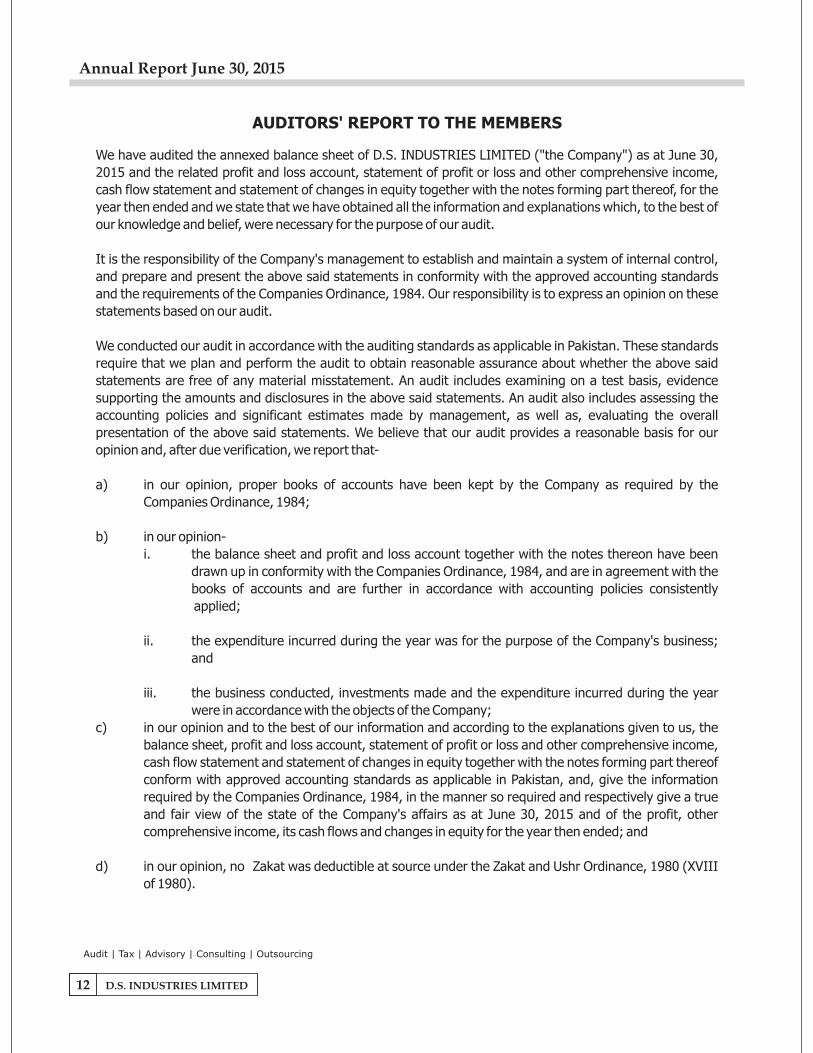
AUDITORS' REPORT TO THE MEMBERS
We have audited the annexed balance sheet of D.S. INDUSTRIES LIMITED ("the Company") as at June 30,
2015 and the related profit and loss account, statement of profit or loss and other comprehensive income,
cash flow statement and statement of changes in equity together with the notes forming part thereof, for the
year then ended and we state that we have obtained all the information and explanations which, to the best of
our knowledge and belief, were necessary for the purpose of our audit.
It is the responsibility of the Company's management to establish and maintain a system of internal control,
and prepare and present the above said statements in conformity with the approved accounting standards
and the requirements of the Companies Ordinance, 1984. Our responsibility is to express an opinion on these
statements based on our audit.
We conducted our audit in accordance with the auditing standards as applicable in Pakistan. These standards
require that we plan and perform the audit to obtain reasonable assurance about whether the above said
statements are free of any material misstatement. An audit includes examining on a test basis, evidence
supporting the amounts and disclosures in the above said statements. An audit also includes assessing the
accounting policies and significant estimates made by management, as well as, evaluating the overall
presentation of the above said statements. We believe that our audit provides a reasonable basis for our
opinion and, after due verification, we report that-
a) in our opinion, proper books of accounts have been kept by the Company as required by the
Companies Ordinance, 1984;
b) in our opinion-
i. the balance sheet and profit and loss account together with the notes thereon have been
drawn up in conformity with the Companies Ordinance, 1984, and are in agreement with the
books of accounts and are further in accordance with accounting policies consistently
applied;
ii. the expenditure incurred during the year was for the purpose of the Company's business;
and
iii. the business conducted, investments made and the expenditure incurred during the year
were in accordance with the objects of the Company;
c) in our opinion and to the best of our information and according to the explanations given to us, the
balance sheet, profit and loss account, statement of profit or loss and other comprehensive income,
cash flow statement and statement of changes in equity together with the notes forming part thereof
conform with approved accounting standards as applicable in Pakistan, and, give the information
required by the Companies Ordinance, 1984, in the manner so required and respectively give a true
and fair view of the state of the Company's affairs as at June 30, 2015 and of the profit, other
comprehensive income, its cash flows and changes in equity for the year then ended; and
d) in our opinion, no Zakat was deductible at source under the Zakat and Ushr Ordinance, 1980 (XVIII
of 1980).
D.S. INDUSTRIES LIMITED13
Annual Report June 30, 2015
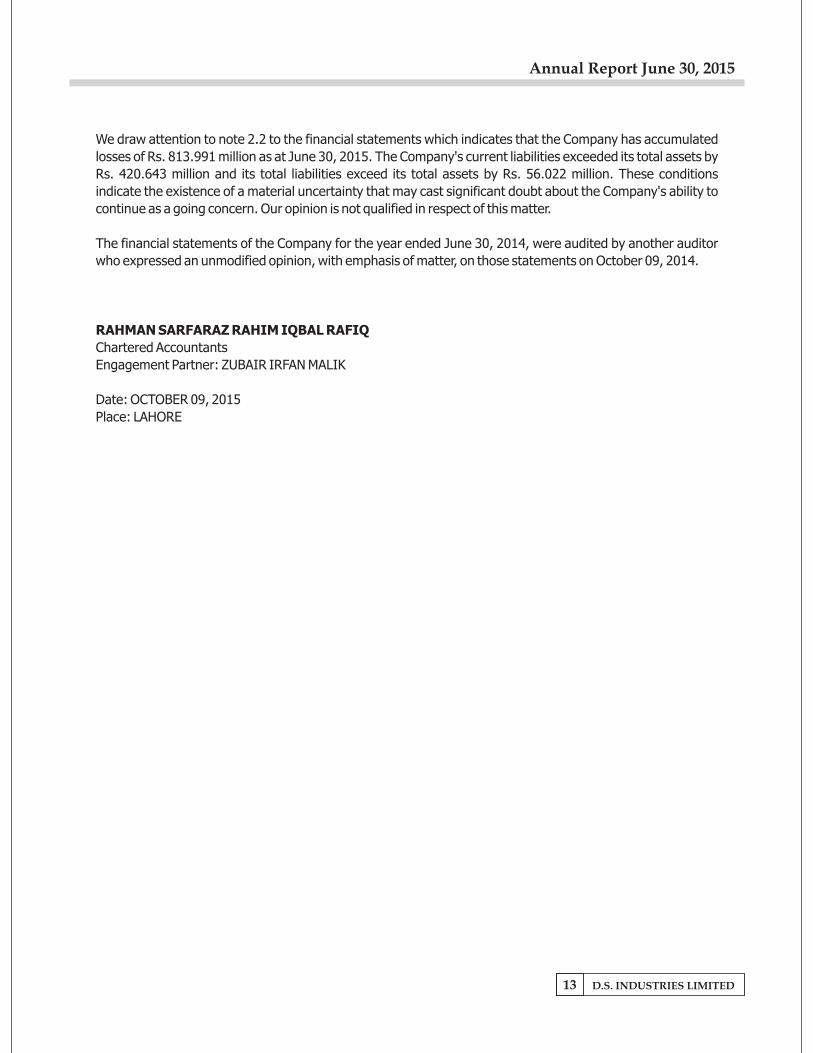
We draw attention to note 2.2 to the financial statements which indicates that the Company has accumulated
losses of Rs. 813.991 million as at June 30, 2015. The Company's current liabilities exceeded its total assets by
Rs. 420.643 million and its total liabilities exceed its total assets by Rs. 56.022 million. These conditions
indicate the existence of a material uncertainty that may cast significant doubt about the Company's ability to
continue as a going concern. Our opinion is not qualified in respect of this matter.
The financial statements of the Company for the year ended June 30, 2014, were audited by another auditor
who expressed an unmodified opinion, with emphasis of matter, on those statements on October 09, 2014.
RAHMAN SARFARAZ RAHIM IQBAL RAFIQ
Chartered Accountants
Engagement Partner: ZUBAIR IRFAN MALIK
Date: OCTOBER 09, 2015
Place: LAHORE
D.S. INDUSTRIES LIMITED14
Annual Report June 30, 2015
CHIEF EXECUTIVE
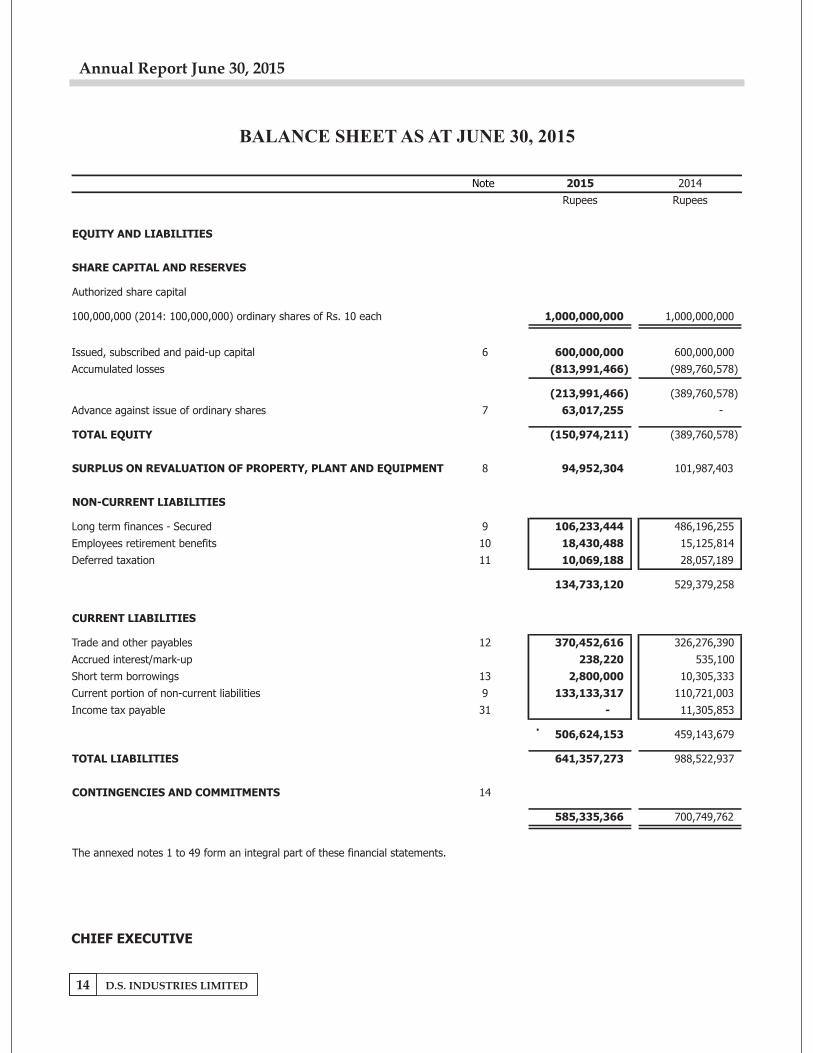
BALANCE SHEET AS AT JUNE 30, 2015
EQUITY AND LIABILITIES
SHARE CAPITAL AND RESERVES
Authorized share capital
100,000,000 (2014: 100,000,000) ordinary shares of Rs. 10 each
Issued, subscribed and paid-up capital
Accumulated losses
Advance against issue of ordinary shares
TOTAL EQUITY
SURPLUS ON REVALUATION OF PROPERTY, PLANT AND EQUIPMENT
NON-CURRENT LIABILITIES
Long term finances - Secured
Employees retirement benefits
Deferred taxation
CURRENT LIABILITIES
Trade and other payables
Accrued interest/mark-up
Short term borrowings
Current portion of non-current liabilities
Income tax payable
TOTAL LIABILITIES
CONTINGENCIES AND COMMITMENTS
The annexed notes 1 to 49 form an integral part of these financial statements.
Note 2015 2014
Rupees Rupees
1,000,000,000
1,000,000,000
6 600,000,000
600,000,000
(813,991,466)
(989,760,578)
(213,991,466)
(389,760,578)
7 63,017,255
-
(150,974,211)
(389,760,578)
8 94,952,304
101,987,403
9 106,233,444 486,196,255
10 18,430,488 15,125,814
11 10,069,188
28,057,189
134,733,120
529,379,258
12 370,452,616
326,276,390
238,220
535,100
13 2,800,000
10,305,333
9 133,133,317
110,721,003
31 -
11,305,853
.506,624,153
459,143,679
641,357,273
988,522,937
14
585,335,366
700,749,762
D.S. INDUSTRIES LIMITED15
Annual Report June 30, 2015
DIRECTOR
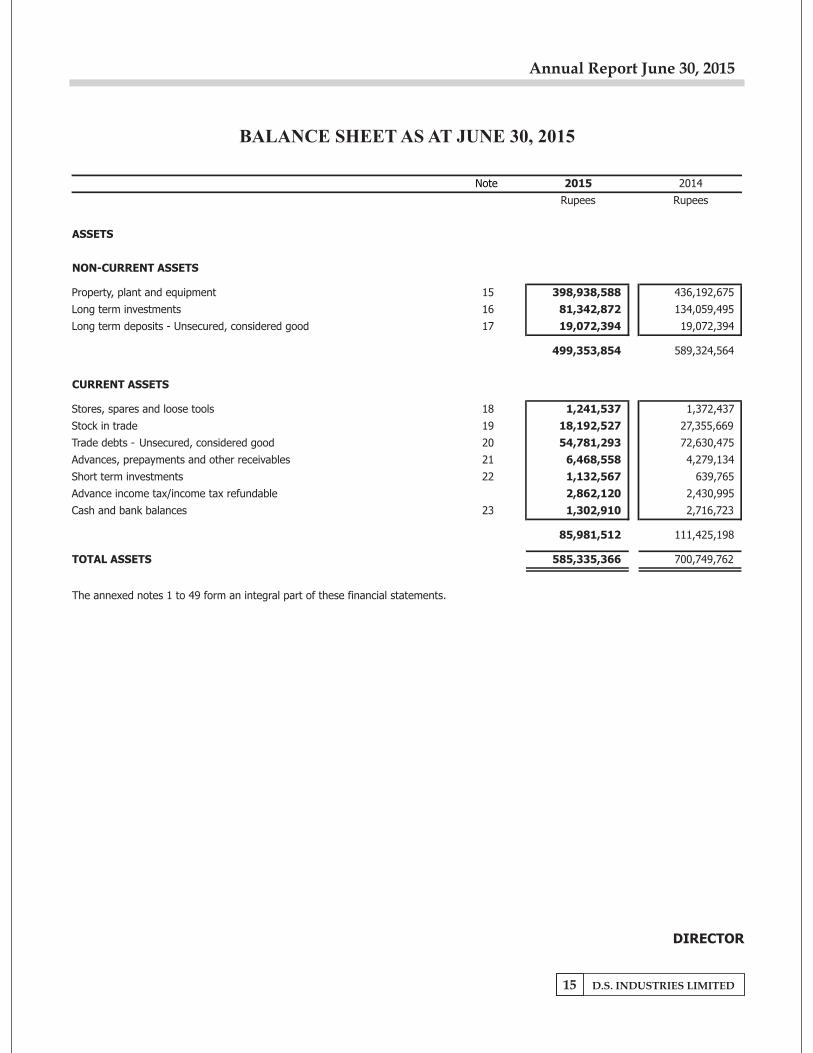
BALANCE SHEET AS AT JUNE 30, 2015
Note
15
16
17
18
19
20
21
22
23
ASSETS
NON-CURRENT ASSETS
Property, plant and equipment
Long term investments
Long term deposits - Unsecured, considered good
CURRENT ASSETS
Stores, spares and loose tools
Stock in trade
Trade debts - Unsecured, considered good
Advances, prepayments and other receivables
Short term investments
Advance income tax/income tax refundable
Cash and bank balances
TOTAL ASSETS
The annexed notes 1 to 49 form an integral part of these financial statements.
2015 2014
Rupees Rupees
398,938,588
436,192,675 81,342,872
134,059,495
19,072,394
19,072,394
499,353,854
589,324,564
1,241,537 1,372,437
18,192,527
27,355,669
54,781,293
72,630,475
6,468,558
4,279,134
1,132,567
639,765
2,862,120
2,430,995
1,302,910
2,716,723
85,981,512
111,425,198
585,335,366
700,749,762
D.S. INDUSTRIES LIMITED16
Annual Report June 30, 2015
CHIEF EXECUTIVE DIRECTOR
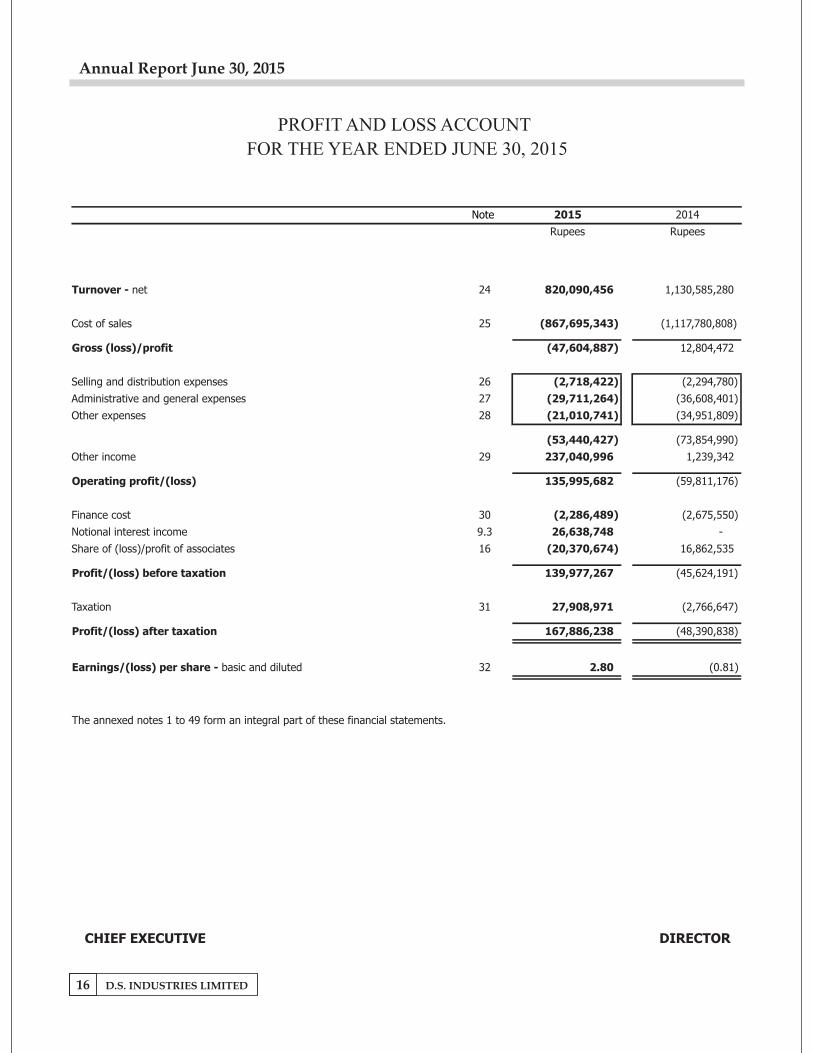
PROFIT AND LOSS ACCOUNT
FOR THE YEAR ENDED JUNE 30, 2015
Note
24
25
26
27
28
29
30
9.3
16
31
32
Turnover - net
Cost of sales
Gross (loss)/profit
Selling and distribution expenses
Administrative and general expenses
Other expenses
Other income
Operating profit/(loss)
Finance cost
Notional interest income
Share of (loss)/profit of associates
Profit/(loss) before taxation
Taxation
Profit/(loss) after taxation
Earnings/(loss) per share - basic and diluted
The annexed notes 1 to 49 form an integral part of these financial statements.
2015 2014
Rupees Rupees
820,090,456
1,130,585,280
(867,695,343)
(1,117,780,808)
(47,604,887)
12,804,472
(2,718,422)
(2,294,780) (29,711,264)
(36,608,401)
(21,010,741)
(34,951,809)
(53,440,427) (73,854,990)
237,040,996 1,239,342
135,995,682 (59,811,176)
(2,286,489)
(2,675,550)
26,638,748
-
(20,370,674)
16,862,535
139,977,267
(45,624,191)
27,908,971
(2,766,647)
167,886,238
(48,390,838)
2.80
(0.81)
D.S. INDUSTRIES LIMITED17
Annual Report June 30, 2015
CHIEF EXECUTIVE DIRECTOR
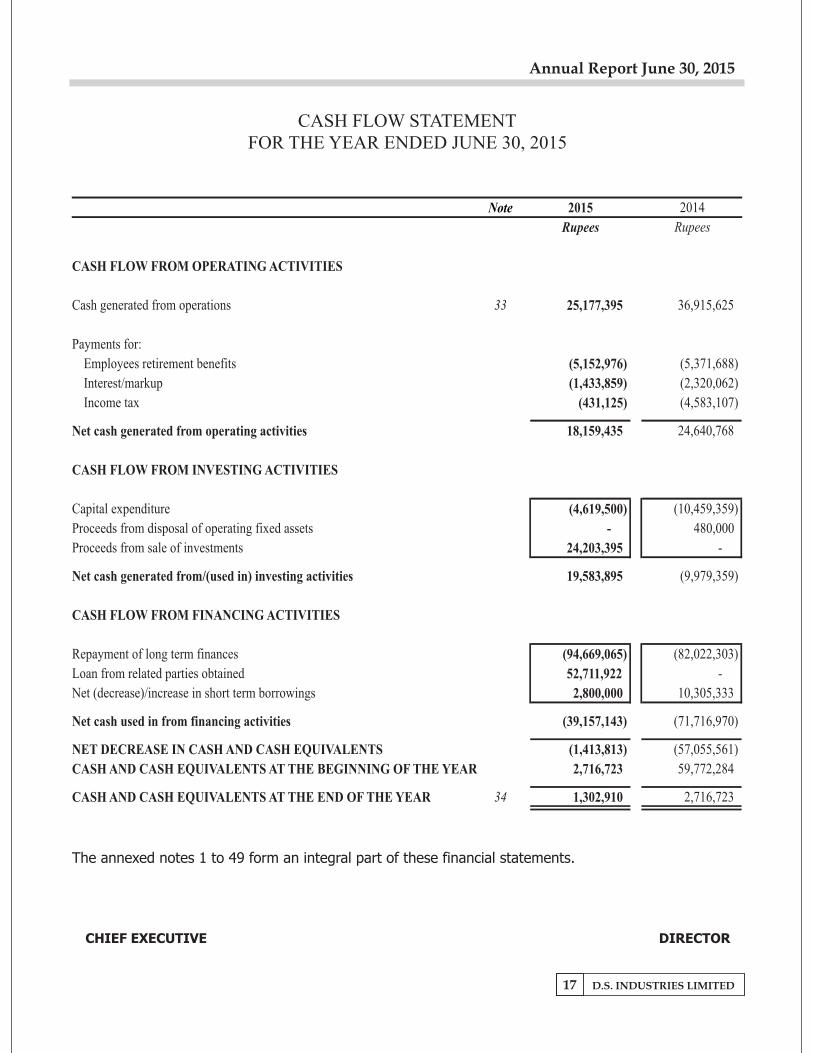
CASH FLOW STATEMENTFOR THE YEAR ENDED JUNE 30, 2015
Note
33
34
CASH FLOW FROM OPERATING ACTIVITIES
Cash generated from operations
Payments for:
Employees retirement benefits
Interest/markup
Income tax
Net cash generated from operating activities
CASH FLOW FROM INVESTING ACTIVITIES
Capital expenditure
Proceeds from disposal of operating fixed assets
Proceeds from sale of investments
Net cash generated from/(used in) investing activities
CASH FLOW FROM FINANCING ACTIVITIES
Repayment of long term finances
Loan from related parties obtained
Net (decrease)/increase in short term borrowings
Net cash used in from financing activities
NET DECREASE IN CASH AND CASH EQUIVALENTS
CASH AND CASH EQUIVALENTS AT THE BEGINNING OF THE YEAR
CASH AND CASH EQUIVALENTS AT THE END OF THE YEAR
The annexed notes 1 to 49 form an integral part of these financial statements.
2015 2014
Rupees Rupees
25,177,395
36,915,625
(5,152,976) (5,371,688)
(1,433,859)
(2,320,062)
(431,125)
(4,583,107)
18,159,435
24,640,768
(4,619,500)
(10,459,359)
-
480,000
24,203,395
-
19,583,895
(9,979,359)
(94,669,065)
(82,022,303)
52,711,922
-
2,800,000
10,305,333
(39,157,143)
(71,716,970)
(1,413,813)
(57,055,561)
2,716,723
59,772,284
1,302,910
2,716,723
D.S. INDUSTRIES LIMITED18
Annual Report June 30, 2015
CHIEF EXECUTIVE DIRECTOR
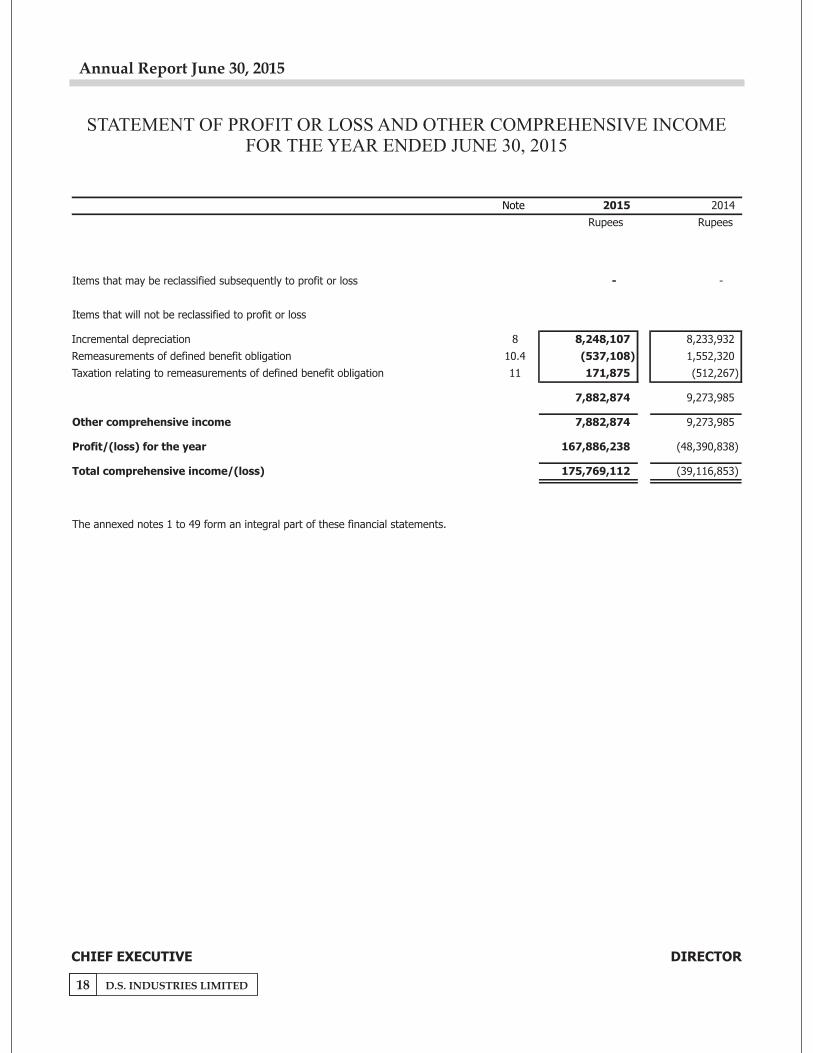
STATEMENT OF PROFIT OR LOSS AND OTHER COMPREHENSIVE INCOMEFOR THE YEAR ENDED JUNE 30, 2015
Note
8
10.4
11
Items that may be reclassified subsequently to profit or loss
Items that will not be reclassified to profit or loss
Incremental depreciation
Remeasurements of defined benefit obligation
Taxation relating to remeasurements of defined benefit obligation
Other comprehensive income
Profit/(loss) for the year
Total comprehensive income/(loss)
The annexed notes 1 to 49 form an integral part of these financial statements.
2015 2014
Rupees Rupees
-
-
8,248,107 8,233,932
(537,108) 1,552,320
171,875 (512,267)
7,882,874 9,273,985
7,882,874
9,273,985
167,886,238
(48,390,838)
175,769,112
(39,116,853)
D.S. INDUSTRIES LIMITED19
Annual Report June 30, 2015
CHIEF EXECUTIVE DIRECTOR
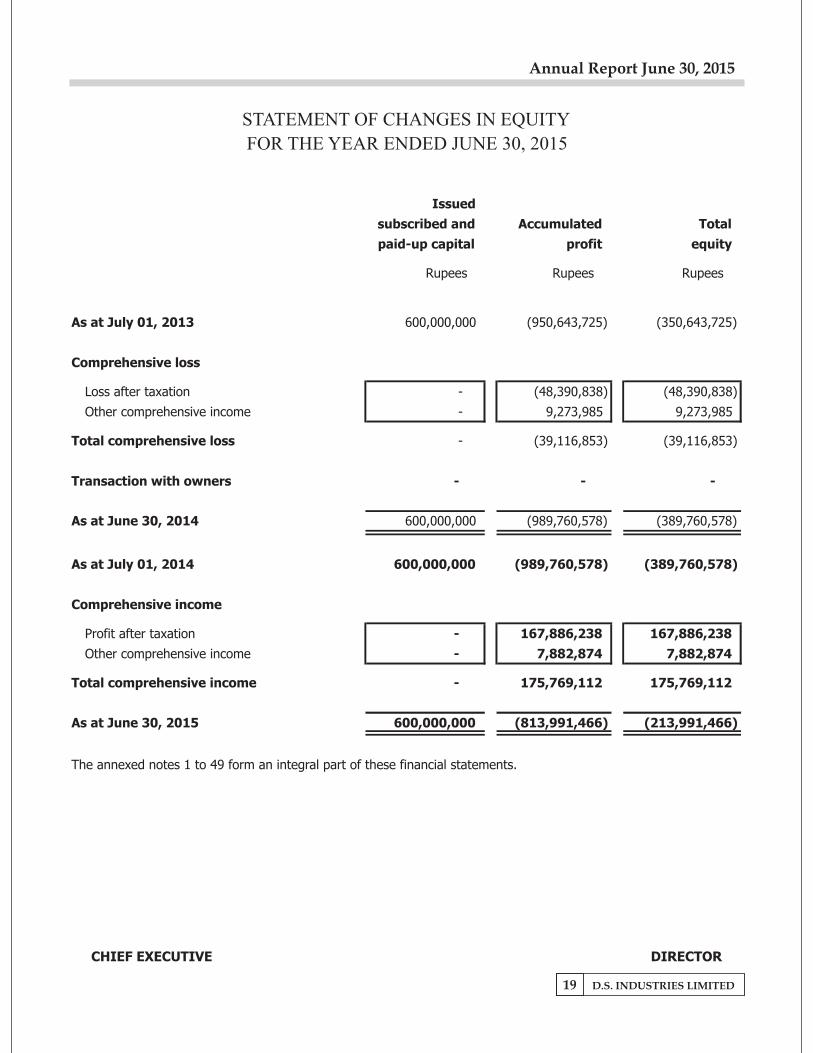
STATEMENT OF CHANGES IN EQUITY
FOR THE YEAR ENDED JUNE 30, 2015
Issued
subscribed and Accumulated Total
paid-up capital profit equity
Rupees Rupees Rupees
As at July 01, 2013 600,000,000
(950,643,725)
(350,643,725)
Comprehensive loss
Loss after taxation -
(48,390,838)
(48,390,838)
Other comprehensive income -
9,273,985
9,273,985
Total comprehensive loss -
(39,116,853)
(39,116,853)
Transaction with owners - - -
As at June 30, 2014 600,000,000
(989,760,578)
(389,760,578)
As at July 01, 2014 600,000,000
(989,760,578)
(389,760,578)
Comprehensive income
Profit after taxation -
167,886,238
167,886,238
Other comprehensive income -
7,882,874
7,882,874
Total comprehensive income -
175,769,112
175,769,112
As at June 30, 2015 600,000,000
(813,991,466)
(213,991,466)
The annexed notes 1 to 49 form an integral part of these financial statements.
D.S. INDUSTRIES LIMITED20
Annual Report June 30, 2015
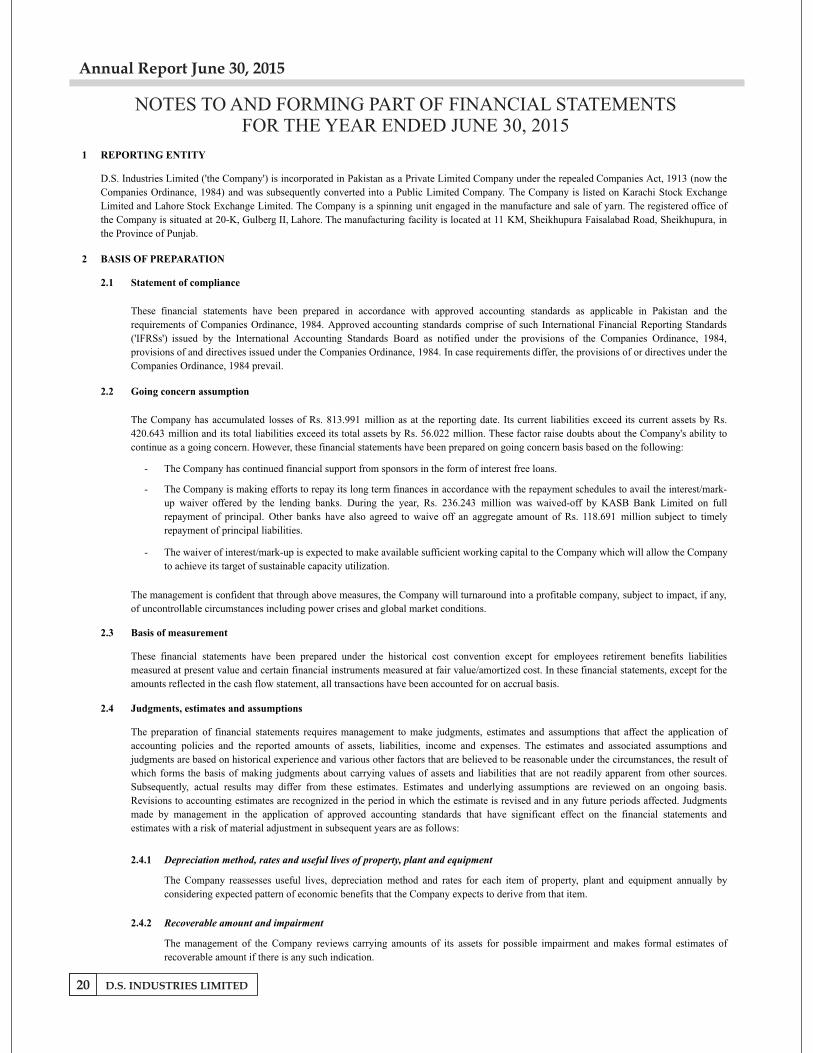
NOTES TO AND FORMING PART OF FINANCIAL STATEMENTSFOR THE YEAR ENDED JUNE 30, 2015
1 REPORTING ENTITY
2 BASIS OF PREPARATION
2.1 Statement of compliance
2.2 Going concern assumption
-
-
-
2.3 Basis of measurement
2.4 Judgments, estimates and assumptions
2.4.1 Depreciation method, rates and useful lives of property, plant and equipment
2.4.2 Recoverable amount and impairment
D.S. Industries Limited ('the Company') is incorporated in Pakistan as a Private Limited Company under the repealed Companies Act, 1913 (now the
Companies Ordinance, 1984) and was subsequently converted into a Public Limited Company. The Company is listed on Karachi Stock Exchange
Limited and Lahore Stock Exchange Limited. The Company is a spinning unit engaged in the manufacture and sale of yarn. The registered office of
the Company is situated at 20-K, Gulberg II, Lahore. The manufacturing facility is located at 11 KM, Sheikhupura Faisalabad Road, Sheikhupura, in
the Province of Punjab.
These financial statements have been prepared in accordance with approved accounting standards as applicable in Pakistan and the
requirements of Companies Ordinance, 1984. Approved accounting standards comprise of such International Financial Reporting Standards
('IFRSs') issued by the International Accounting Standards Board as notified under the provisions of the Companies Ordinance, 1984,
provisions of and directives issued under the Companies Ordinance, 1984. In case requirements differ, the provisions of or directives under the
Companies Ordinance, 1984 prevail.
These financial statements have been prepared under the historical cost convention except for employees retirement benefits liabilities
measured at present value and certain financial instruments measured at fair value/amortized cost. In these financial statements, except for the
amounts reflected in the cash flow statement, all transactions have been accounted for on accrual basis.
The Company has accumulated losses of Rs. 813.991 million as at the reporting date. Its current liabilities exceed its current assets by Rs.
420.643 million and its total liabilities exceed its total assets by Rs. 56.022 million. These factor raise doubts about the Company's ability to
continue as a going concern. However, these financial statements have been prepared on going concern basis based on the following:
The Company has continued financial support from sponsors in the form of interest free loans.
The Company is making efforts to repay its long term finances in accordance with the repayment schedules to avail the interest/mark-
up waiver offered by the lending banks. During the year, Rs. 236.243 million was waived-off by KASB Bank Limited on full
repayment of principal. Other banks have also agreed to waive off an aggregate amount of Rs. 118.691 million subject to timely
repayment of principal liabilities.
The waiver of interest/mark-up is expected to make available sufficient working capital to the Company which will allow the Company
to achieve its target of sustainable capacity utilization.
The management is confident that through above measures, the Company will turnaround into a profitable company, subject to impact, if any,
of uncontrollable circumstances including power crises and global market conditions.
The preparation of financial statements requires management to make judgments, estimates and assumptions that affect the application of
accounting policies and the reported amounts of assets, liabilities, income and expenses. The estimates and associated assumptions and
judgments are based on historical experience and various other factors that are believed to be reasonable under the circumstances, the result of
which forms the basis of making judgments about carrying values of assets and liabilities that are not readily apparent from other sources.
Subsequently, actual results may differ from these estimates. Estimates and underlying assumptions are reviewed on an ongoing basis.
Revisions to accounting estimates are recognized in the period in which the estimate is revised and in any future periods affected. Judgments
made by management in the application of approved accounting standards that have significant effect on the financial statements and
estimates with a risk of material adjustment in subsequent years are as follows:
The Company reassesses useful lives, depreciation method and rates for each item of property, plant and equipment annually by
considering expected pattern of economic benefits that the Company expects to derive from that item.
The management of the Company reviews carrying amounts of its assets for possible impairment and makes formal estimates of
recoverable amount if there is any such indication.
D.S. INDUSTRIES LIMITED21
Annual Report June 30, 2015
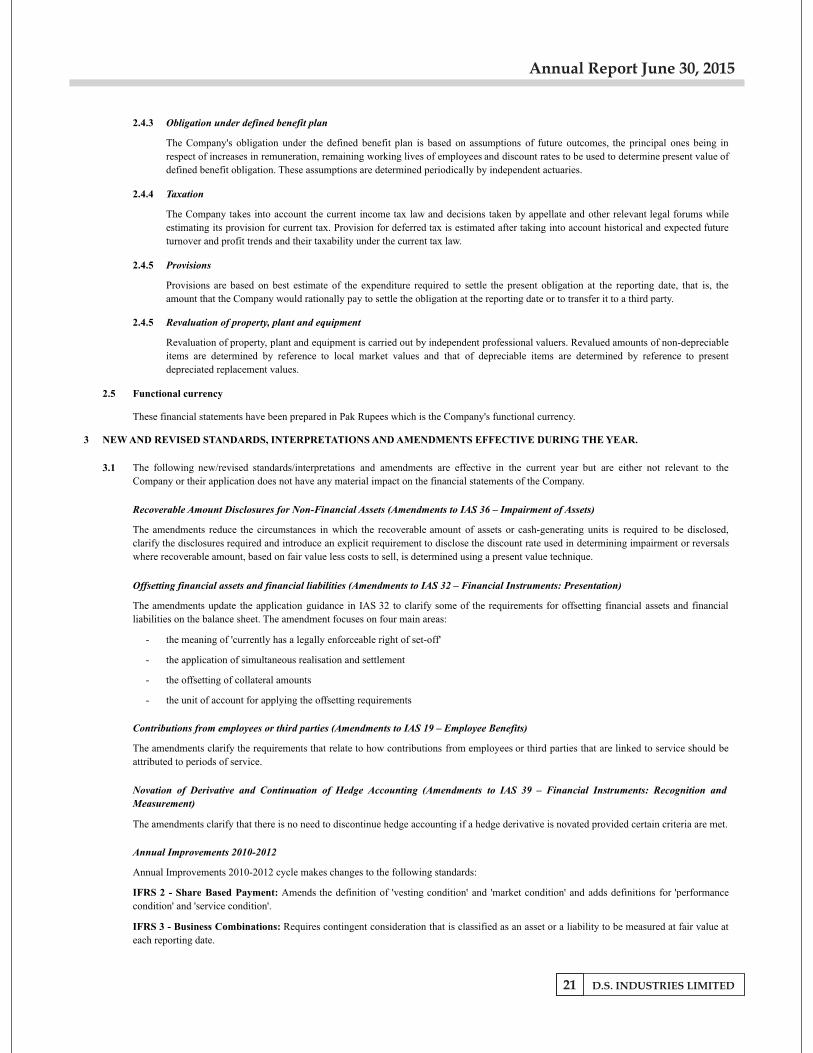
2.4.3 Obligation under defined benefit plan
2.4.4 Taxation
2.4.5 Provisions
2.4.5 Revaluation of property, plant and equipment
2.5 Functional currency
3
3.1
Recoverable Amount Disclosures for Non-Financial Assets (Amendments to IAS 36 – Impairment of Assets)
- the meaning of 'currently has a legally enforceable right of set-off'
- the application of simultaneous realisation and settlement
- the offsetting of collateral amounts
- the unit of account for applying the offsetting requirements
Contributions from employees or third parties (Amendments to IAS 19 – Employee Benefits)
Annual Improvements 2010-2012
Provisions are based on best estimate of the expenditure required to settle the present obligation at the reporting date, that is, the
amount that the Company would rationally pay to settle the obligation at the reporting date or to transfer it to a third party.
The amendments update the application guidance in IAS 32 to clarify some of the requirements for offsetting financial assets and financial
liabilities on the balance sheet. The amendment focuses on four main areas:
The amendments clarify the requirements that relate to how contributions from employees or third parties that are linked to service should be
attributed to periods of service.
Novation of Derivative and Continuation of Hedge Accounting (Amendments to IAS 39 – Financial Instruments: Recognition and
Measurement)
The amendments clarify that there is no need to discontinue hedge accounting if a hedge derivative is novated provided certain criteria are met.
Annual Improvements 2010-2012 cycle makes changes to the following standards:
IFRS 2 - Share Based Payment: Amends the definition of 'vesting condition' and 'market condition' and adds definitions for 'performance
condition' and 'service condition'.
IFRS 3 - Business Combinations: Requires contingent consideration that is classified as an asset or a liability to be measured at fair value at
each reporting date.
The Company's obligation under the defined benefit plan is based on assumptions of future outcomes, the principal ones being in
respect of increases in remuneration, remaining working lives of employees and discount rates to be used to determine present value of
defined benefit obligation. These assumptions are determined periodically by independent actuaries.
The Company takes into account the current income tax law and decisions taken by appellate and other relevant legal forums while
estimating its provision for current tax. Provision for deferred tax is estimated after taking into account historical and expected future
turnover and profit trends and their taxability under the current tax law.
These financial statements have been prepared in Pak Rupees which is the Company's functional currency.
NEW AND REVISED STANDARDS, INTERPRETATIONS AND AMENDMENTS EFFECTIVE DURING THE YEAR.
Revaluation of property, plant and equipment is carried out by independent professional valuers. Revalued amounts of non-depreciable
items are determined by reference to local market values and that of depreciable items are determined by reference to present
depreciated replacement values.
The following new/revised standards/interpretations and amendments are effective in the current year but are either not relevant to the
Company or their application does not have any material impact on the financial statements of the Company.
The amendments reduce the circumstances in which the recoverable amount of assets or cash-generating units is required to be disclosed,
clarify the disclosures required and introduce an explicit requirement to disclose the discount rate used in determining impairment or reversals
where recoverable amount, based on fair value less costs to sell, is determined using a present value technique.
Offsetting financial assets and financial liabilities (Amendments to IAS 32 – Financial Instruments: Presentation)
D.S. INDUSTRIES LIMITED22
Annual Report June 30, 2015
Annual Improvements 2011-2013
IFRIC 21 - Levies (2013)
- The liability is recognized progressively if the obligating event occurs over a period of time.
-
3.2
IFRS 10 - Consolidated Financial Statements (2011)
IFRS 11 - Joint Arrangements (2011)
IFRS 12 - Disclosure of Interests in Other Entities (2011)
IFRS 13 - Fair Value Measurement (2011)
The following new/revised standards/interpretations and amendments are effective in the current year but have been notified for adoption
under section 234 of the Companies Ordinance, 1984 for annual periods beginning on or after January 01, 2015.
The standard replaces those parts of IAS 27 - Consolidated and Separate Financial Statements, that address when and how an investor should
prepare consolidated financial statements and supersedes SIC 12 - Consolidation: Special Purpose Entities.
The standard supersedes IAS 31 - Interest in Joint Ventures and SIC 13 - Jointly Controlled Entities: Non-monetary Contributions by
The standard introduces disclosure requirements relating to interests in subsidiaries, joint arrangements, associates and unconsolidated
structured entities.
The standard establishes a single framework for measuring fair value where that is required by other standards.
Consolidated Financial Statements, Joint Arrangements and Disclosure of Interests in Other Entities: Transition Guidance
(Amendments to IFRS 10 – Consolidated Financial Statements, IFRS 11 – Joint Arrangements and IFRS 12 – Disclosure of Interests in
IFRS 13 - Fair Value Measurement: Clarifies that the ability to measure certain short-term receivables and payables on an undiscounted
basis is still available.
IAS 16 - Property, Plant and Equipment and IAS 38 - Intangible Assets: Clarifies that the gross amount of property, plant and equipment
is adjusted in a manner consistent with a revaluation of the carrying amount.
IFRS 8 - Operating Segments: Requires disclosure of the judgements made by management in applying the aggregation criteria to operating
segments, clarifies that reconciliations of segment assets only required if segment assets reported regularly.
IAS 24 - Related Party Disclosures: Clarifies how payment to entities providing management services are to be disclosed.
Annual Improvements 2011-2013 cycle makes changes to the following standards:
IFRS 1 - First-time Adoption of International Financial Reporting Standards: Clarifies which versions of IFRSs can be used on initial
adoption.
IFRS 3 - Business Combinations: Clarifies that IFRS 3 excludes from its scope the accounting for the formation of a joint arrangement in the
financial statements of the joint arrangement itself.
IFRS 13 - Fair Value Measurement: Clarifies the scope of portfolio exception.
IAS 40 - Investment Property: Clarifies the interrelationship with IFRS 3 - Business Combinations when classifying property as investment
property or owner-occupied property.
The interpretation provides guidance on when to recognize a liability for a levy imposed by a government, both for levies that are accounted
for in accordance with IAS 37 - Provisions, Contingent Liabilities and Contingent Assets and those where the timing and amount of levy is
The interpretation identifies the obligating event for the recognition of a liability as the activity that triggers the payment of the levy in
accordance with the relevant legislation. It provides the following guidance on recognition of a liability to pay levies:
If an obligation is triggered on reaching a minimum threshold, the liability is recognized when that minimum threshold is reached.
The amendments provide transitional relief by limiting the requirement to provide adjusted comparative information to only the preceding
comparative period. Also, amendments to IFRS 11 and IFRS 12 eliminate the requirement to provide comparative information for periods
prior to the immediately preceding period.
Investment Entities (Amendments to IFRS 10 – Consolidated Financial Statements, IFRS 12 – Disclosure of Interests in Other Entities
and IAS 27 Separate Financial Statement)
The amendments provide exemption from consolidation of particular subsidiaries by certain entities defined as "Investment Entities" and
require additional disclosures where such subsidiaries are excluded from consolidation pursuant to exemption.
D.S. INDUSTRIES LIMITED23
Annual Report June 30, 2015
4 NEW AND REVISED STANDARDS/INTERPRETATIONS AND AMENDMENTS NOT YET EFFECTIVE.
Effective date
(annual periods beginning
on or after)
January 01, 2016
January 01, 2016
January 01, 2016
January 01, 2016
January 01, 2016
Bearer Plants (Amendments to IAS 16 – Property, Plant and Equipment and IAS 41 – Agriculture) January 01, 2016
Disclosure initiative (Amendments to IAS 1 - Presentation of Financial Statements) January 01, 2016
Annual Improvements 2012-2014 July 01, 2016
IFRS 14 – Regulatory Deferral Accounts (2014) January 01, 2017
IFRS 15 – Revenue from Contracts with Customers (2014) January 01, 2017
IFRS 9 – Financial Instruments: Classification and Measurement (2014) January 01, 2018
5 SIGNIFICANT ACCOUNTING POLICIES
5.1 Property, plant and equipment
5.1.1 Operating fixed assets
`
5.1.2 Capital work in progress
The following standards, interpretations and amendments are in issue which are not effective as at the reporting date and have not been early adopted
by the Company.
The accounting policies set out below have been applied consistently to all periods presented in these financial statements.
The management anticipates that the adoption of the above standards, amendments and interpretations in future periods, will have no material impact
on the Company's financial statements other than in presentation/disclosures.
Equity method in Separate Financial Statements (Amendments to IAS 27 - Separate Financial Statements)
Accounting for Acquisitions of Interests in Joint Operations (Amendments to IFRS 11 – Joint Arrangements)
Sale or contribution of assets between an Investor and its Associate or Joint Venture (Amendments to IFRS 10 -
Consolidated Financial Statements and IAS 28 - Investments in Associates and Joint Ventures).
Clarification of Acceptable Methods of Depreciation and Amortization (Amendments to IAS 16 – Property, Plant
and Equipment and IAS 38 – Intangible Assets)
Investment Entities: Applying the Consolidation Exception (Amendments to IFRS 10 - Consolidated Financial
Statements, IFRS 12 - Disclosure of Interests in Other Entities, IAS 28 - Accounting for Investments in Associates
and Joint Ventures)
Capital work in progress is stated at cost less identified impairment loss, if any, and includes the cost of material, labour and
appropriate overheads directly relating to the construction, erection or installation of an item of operating fixed assets. These costs are
transferred to operating fixed assets as and when related items become available for intended use.
Operating fixed assets are measured at cost less accumulated depreciation and accumulated impairment losses with the exception of
freehold land, which is stated at revalued amount, and buildings on freehold land, plant and machinery and electric installation, which
are carried at revalued amounts less accumulated depreciation. Cost comprises purchase price, including import duties and non-
refundable purchase taxes, after deducting trade discounts and rebates, and includes other costs directly attributable to the acquisition
or construction, erection and installation.
Major renewals and improvements to operating fixed assets are recognized in the carrying amount of the item if it is probable that the
embodied future economic benefits will flow to the Company and the cost of renewal or improvement can be measured reliably. The
cost of the day-to-day servicing of operating fixed assets are recognized in profit or loss as incurred.
The Company recognizes depreciation in profit or loss by applying reducing balance method over the useful life of each operating
fixed asset using rates specified in note 15.1 to the financial statements. Depreciation on additions to operating fixed assets is charged
from the month in which the item becomes available for use. Depreciation is discontinued from the month in which it is disposed or
classified as held for disposal.
An operating fixed asset is de-recognized when permanently retired from use. Any gain or loss on disposal of operating fixed assets is
recognized in profit or loss.
D.S. INDUSTRIES LIMITED24
Annual Report June 30, 2015
5.2 Surplus / deficit arising on revaluation of property, plant and equipment
5.3 Stores, spares and loose tools
5.4 Stock in trade
Raw materials Weighted average cost
Work in process Average manufacturing cost
Finished goods Average manufacturing cost
Stock in transit Invoice price plus related cost incurred up to the reporting date
5.5 Employee benefits
5.5.1 Short-term employee benefits
5.5.2 Post-employment benefits
5.6 Financial instruments
5.6.1 Recognition
5.6.2 Classification
5.6.2.1 Loans and receivables
These are generally held for internal use and are valued at cost. Cost is determined on the basis of weighted average except for items in transit,
which are valued at invoice price plus related cost incurred up to the reporting date. For items which are considered obsolete, the carrying
amount is written down to nil. Spare parts held exclusively for capitalization are classified as property, plant and equipment.
These are valued at lower of cost and net realizable value, with the exception of stock of waste which is valued at net realizable value. Cost is
determined using the following basis:
Average manufacturing cost in relation to work in process and finished goods consists of direct material, labour and an appropriate proportion
of manufacturing overheads.
Net realizable value signifies the estimated selling price in the ordinary course of business less estimated costs of completion and estimated
costs necessary to make the sale.
The Company recognizes the undiscounted amount of short term employee benefits to be paid in exchange for services rendered by
employees as a liability after deducting amount already paid and as an expense in profit or loss unless it is included in the cost of
inventories or property, plant and equipment as permitted or required by the approved accounting standards. If the amount paid
exceeds the undiscounted amount of benefits, the excess is recognized as an asset to the extent that the prepayment would lead to a
reduction in future payments or cash refund.
The Company operates an unfunded gratuity scheme (defined benefit plan) for all its employees who have completed the minimum
qualifying service period. Liability is adjusted on each reporting date to cover the obligation and the adjustment is charged to profit or
loss with the exception of remeasurements which are recognized in other comprehensive income. The amount recognized on balance
sheet represents the present value of defined benefit obligation. The details of the scheme are referred to in note 11 to the financial
statements.
Surplus arising on revaluation of items of property, plant and equipment is carried on balance sheet after reversing deficit relating to the same
item previously recognized in profit or loss, if any. Deficit arising on revaluation is recognized in profit or loss after reversing the surplus
relating to the same item previously carried on balance sheet, if any. An amount equal to incremental depreciation, being the difference
between the depreciation based on revalued amounts and that based on the original cost, net of deferred tax, if any, is transferred from surplus
on revaluation of property, plant and equipment to accumulated profit every year, through statement of other comprehensive income.
A financial instrument is recognized when the Company becomes a party to the contractual provisions of the instrument.
The Company classifies its financial instruments into following classes depending on the purpose for which the financial assets and
liabilities are acquired or incurred. The Company determines the classification of its financial assets and liabilities at initial
Non-derivative financial assets with fixed or determinable payments that are not quoted in an active market are classified as
loans and receivables. Assets in this category are presented as current assets except for maturities greater than twelve
months from the reporting date, where these are presented as non-current assets.
D.S. INDUSTRIES LIMITED25
Annual Report June 30, 2015
5.6.2.2 Financial assets at fair value through profit or loss
5.6.2.3 Financial liabilities at amortized cost
5.6.3 Measurement
5.6.4 De-recognition
5.6.5 Off-setting
5.6.6 "Regular way" purchases and sales of financial assets
5.7 Ordinary share capital
5.8 Loans and borrowings
5.9 Finance leases
Financial assets are de-recognized if the Company's contractual rights to the cash flows from the financial assets expire or if the
Company transfers the financial asset to another party without retaining control or substantially all risks and rewards of the asset.
Financial liabilities are de-recognized if the Company's obligations specified in the contract expire or are discharged or cancelled. Any
gain or loss on de-recognition of financial assets and financial liabilities is recognized in profit or loss.
A financial asset and a financial liability is offset and the net amount reported in the balance sheet if the Company has legally
enforceable right to set-off the recognized amounts and intends either to settle on a net basis or to realize the asset and settle the
liability simultaneously.
Ordinary share capital is recognized as equity. Transaction costs directly attributable to the issue of ordinary shares are recognized as
deduction from equity.
Loans and borrowings are classified as 'financial liabilities at amortized cost'. On initial recognition, these are measured at cost, being fair
value at the date the liability is incurred, less attributable transaction costs. Subsequent to initial recognition, these are measured at amortized
cost with any difference between cost and value at maturity recognized in the profit or loss over the period of the borrowings on an effective
interest basis.
Leases in terms of which the Company assumes substantially all risks and rewards of ownership are classified as finance leases. Assets subject
to finance lease are classified as 'operating fixed assets'. On initial recognition, these are measured at cost, being an amount equal to the lower
of its fair value and the present value of minimum lease payments. Subsequent to initial recognition, these are measured at cost less
accumulated depreciation and accumulated impairment losses. Depreciation, subsequent expenditure, de-recognition, and gains and losses on
de-recognition are accounted for in accordance with the respective policies for operating fixed assets. Liabilities against assets subject to
finance lease and deposits against finance lease are classified as 'financial liabilities at amortized cost' and 'loans and receivables' respectively,
however, since they fall outside the scope of measurement requirements of IAS 39 'Financial Instruments - Recognition and Measurement',
these are measured in accordance with the requirements of IAS 17 'Leases'. On initial recognition, these are measured at cost, being their fair
value at the date of commencement of lease, less attributable transaction costs. Subsequent to initial recognition, minimum lease payments
made under finance leases are apportioned between the finance charge and the reduction of outstanding liability. The finance charge is
allocated to each period during the lease term so as to produce a constant periodic rate of interest on the remaining balance of the liability.
Deposits against finance leases, subsequent to initial recognition are carried at cost.
Financial assets at fair value through profit or loss are financial assets that are either designated as such on initial
recognition or are classified as held for trading. Financial assets are designated as financial assets at fair value through profit
or loss if the Company manages such assets and evaluates their performance based on their fair value in accordance with the
Company’s risk management and investment strategy. Financial assets are classified as held for trading when these are
acquired principally for the purpose of selling and repurchasing in the near term, or when these are part of a portfolio of
identified financial instruments that are managed together and for which there is a recent actual pattern of profit taking, or
where these are derivatives, excluding derivatives that are financial guarantee contracts or that are designated and effective
hedging instruments. Financial assets in this category are presented as current assets.
Non-derivative financial liabilities that are not financial liabilities at fair value through profit or loss are classified as
financial liabilities at amortized cost. Financial liabilities in this category are presented as current liabilities except for
maturities greater than twelve months from the reporting date where these are presented as non-current liabilities.
The particular measurement methods adopted are disclosed in the individual policy statements associated with each instrument.
All regular way purchases and sales of financial assets are recognized on trade date. Regular way purchases or sales of financial assets
are those contracts which require delivery of assets within the time frame generally established by the regulation or convention in the
market.
D.S. INDUSTRIES LIMITED26
Annual Report June 30, 2015
5.10 Operating leases
5.11 Trade and other payables
5.11.1 Financial liabilities
5.11.2 Non-financial liabilities
5.12 Provisions and contingencies
5.13 Trade and other receivables
5.13.1 Financial assets
5.13.2 Non-financial assets
5.14 Investments in equity securities
5.14.1 Investment in associates
5.14.2 Other investments
5.15 Revenue
Revenue is measured at the fair value of the consideration received or receivable, net of returns allowances, trade discounts and rebates, and
represents amounts received or receivable for goods and services provided and other income earned in the normal course of business. Revenue
is recognized when it is probable that the economic benefits associated with the transaction will flow to the Company, and the amount of
revenue and the associated costs incurred or to be incurred can be measured reliably.
Revenue from sale of goods is recognized when risks and rewards incidental to the ownership of goods are transferred to the buyer.
Leases that do not transfer substantially all risks and rewards of ownership are classified as operating leases. Payments made under operating
leases are recognized in profit or loss on a straight line basis over the lease term.
These are classified as 'financial liabilities at amortized cost'. On initial recognition, these are measured at cost, being their fair value at
the date the liability is incurred, less attributable transaction costs. Subsequent to initial recognition, these are measured at amortized
cost using the effective interest method, with interest recognized in profit or loss.
These, both on initial recognition and subsequently, are measured at cost.
Provisions are recognized when the Company has a legal and constructive obligation as a result of past events and it is probable that outflow of
resources embodying economic benefits will be required to settle the obligation and a reliable estimate can be made of the amount of
obligation. Provision is recognized at an amount that is the best estimate of the expenditure required to settle the present obligation at the
reporting date. Where outflow of resources embodying economic benefits is not probable, or where a reliable estimate of the amount of
obligation cannot be made, a contingent liability is disclosed, unless the possibility of outflow is remote.
These are classified as 'loans and receivables'. On initial recognition, these are measured at cost, being their fair value at the date of
transaction, plus attributable transaction costs. Subsequent to initial recognition, these are measured at amortized cost using the
effective interest method, with interest recognized in profit or loss.
These, both on initial recognition and subsequently, are measured at cost.
An associate is an entity over which the Company has significant influence and that is neither a subsidiary nor an interest in a joint
venture. Significant influence is the power to participate in the financial and operating policy decisions of the investee but is not
control or joint control over those policies.
The results and assets and liabilities of the associates have been incorporated in these financial statements using the equity method of
accounting. Under the equity method, investments in associates are carried at cost as adjusted for post acquisition changes in the
Company's share of net assets of the associates, less any impairment in the investment. Losses of an associates in excess of the
Company's interest in that associate are recognized only to the extent that the Company has incurred legal or constructive obligation or
made payment on behalf of the associate.
Investment in other equity securities, on initial recognition, are measured at cost and classified as "financial assets at fair value through
profit or loss". Subsequent to initial recognition these are measured at fair value. Gains and losses resulting from changes in fair value
are recognized in profit or loss.
D.S. INDUSTRIES LIMITED27
Annual Report June 30, 2015
5.16 Comprehensive income
5.17 Borrowing costs
5.18 Income tax
5.18.1 Current taxation
5.18.2 Deferred taxation
5.19 Earnings per share ('EPS')
5.20 Cash and cash equivalents
5.21 Foreign currency transactions and balances
Comprehensive income is the change in equity resulting from transactions and other events, other than changes resulting from transactions
with shareholders in their capacity as shareholders. Total comprehensive income comprises all components of profit or loss and other
comprehensive income. Other comprehensive income comprises items of income and expense, including reclassification adjustments, that are
not recognized in profit or loss as required or permitted by approved accounting standards, and is presented in 'statement of profit or loss and
other comprehensive income'.
Borrowing costs directly attributable to the acquisition, construction or production of qualifying assets, which are assets that necessarily take a
substantial period of time to get ready for their intended use or sale, are added to the cost of those assets, until such time as the assets are
substantially ready for their intended use or sale. Investment income earned on the temporary investment of specific borrowings pending their
expenditure on qualifying asset is deducted from the borrowing costs eligible for capitalization. All other borrowing costs are recognized in
profit or loss as incurred.
Return on bank deposits is recognized using effective interest method.
Capital gain on sale of investments is recognized when sale of shares is confirmed by the broker.
Cash and cash equivalents for the purpose of cash flow statement comprise cash in hand and cash at banks. These are classified as 'loans and
receivables' and are carried at cost.
Transactions in foreign currency are translated to the functional currency of the Company using exchange rate prevailing at the date of
transaction. Monetary assets and liabilities denominated in foreign currency are translated to the functional currency at exchange rate
prevailing at the reporting date. Non-monetary assets and liabilities denominated in foreign currency that are measured at fair value are
translated to the functional currency at exchange rate prevailing at the date the fair value is determined. Non-monetary assets and liabilities
denominated in foreign currency that are measured at historical cost are translated to functional currency at exchange rate prevailing at the date
of initial recognition. Any gain or loss arising on translation of foreign currency transactions and balances is recognized in profit or loss.
Income tax expense comprises current tax and deferred tax. Income tax expense is recognized in profit or loss except to the extent that it relates
to items recognized directly in other comprehensive income, in which case it is recognized in other comprehensive income.
Current tax is the amount of tax payable on taxable income for the year and any adjustment to the tax payable in respect of previous
years. Provision for current tax is based on current rates of taxation in Pakistan after taking into account tax credits, rebates and
exemptions available, if any. The amount of unpaid income tax in respect of the current or prior periods is recognized as a liability.
Any excess paid over what is due in respect of the current or prior periods is recognized as an asset.
Deferred tax is accounted for using the' balance sheet approach' providing for temporary differences between the carrying amounts of
assets and liabilities for financial reporting purposes and the amounts used for tax purposes. In this regard, the effects on deferred
taxation of the portion of income that is subject to final tax regime is also considered in accordance with the treatment prescribed by
The Institute of Chartered Accountants of Pakistan. Deferred tax is measured at rates that are expected to be applied to the temporary
differences when they reverse, based on laws that have been enacted or substantively enacted by the reporting date. A deferred tax
liability is recognized for all taxable temporary differences. A deferred tax asset is recognized for deductible temporary differences to
the extent that future taxable profits will be available against which temporary differences can be utilized. Deferred tax assets are
reviewed at each reporting date and are reduced to the extent that it is no longer probable that the related tax benefit will be realized.
Basic EPS is calculated by dividing the profit or loss attributable to ordinary shareholders of the Company by the weighted average number of
ordinary shares outstanding during the year.
Diluted EPS is calculated by adjusting basic EPS by the weighted average number of ordinary shares that would be issued on conversion of all
dilutive potential ordinary shares into ordinary shares and post-tax effect of changes in profit or loss attributable to ordinary shareholders of the
Company that would result from conversion of all dilutive potential ordinary shares into ordinary shares.
D.S. INDUSTRIES LIMITED28
Annual Report June 30, 2015
5.22 Impairment
5.31.1 Financial assets
5.31.2 Non-financial assets
5.23 Dividend distribution to ordinary shareholders
Dividend to ordinary shareholders is recognized as a deduction from accumulated profit in statement of changes in equity and as a liability, to
the extent it is unclaimed/unpaid, in the Company’s financial statements in the year in which the dividends are approved by the Company’s
shareholders.
A financial asset is assessed at each reporting date to determine whether there is any objective evidence that it is impaired. Individually
significant financial assets are tested for impairment on an individual basis. The remaining financial assets are assessed collectively in
groups that share similar credit risk characteristics. A financial asset is considered to be impaired if objective evidence indicates that
one or more events have had a negative effect on the estimated future cash flows of the asset.
An impairment loss in respect of a financial asset measured at amortized cost is calculated as the difference between its carrying
amount, and the present value of the estimated future cash flows discounted at the original effective interest rate. Impairment loss in
respect of a financial asset measured at fair value is determined by reference to that fair value. All impairment losses are recognized in
profit or loss. An impairment loss is reversed if the reversal can be related objectively to an event occurring after the impairment loss
was recognized. An impairment loss is reversed only to the extent that the financial asset’s carrying amount after the reversal does not
exceed the carrying amount that would have been determined, net of amortization, if no impairment loss had been recognized.
The carrying amount of the Company’s non-financial assets, other than inventories and deferred tax assets are reviewed at each
reporting date to determine whether there is any indication of impairment. If any such indication exists, then the asset’s recoverable
amount is estimated. The recoverable amount of an asset or cash generating unit is the greater of its value in use and its fair value less
costs to sell. In assessing value in use, the estimated future cash flows are discounted to their present values using a pre-tax discount
rate that reflects current market assessments of the time value of money and the risks specific to the asset or cash generating unit.
An impairment loss is recognized if the carrying amount of the asset or its cash generating unit exceeds its estimated recoverable
amount. Impairment losses are recognized in profit or loss. Impairment losses recognized in respect of cash generating units are
allocated to reduce the carrying amounts of the assets in a unit on a pro rata basis. Impairment losses recognized in prior periods are
assessed at each reporting date for any indications that the loss has decreased or no longer exists. An impairment loss is reversed if
there has been a change in the estimates used in determining the recoverable amount. An impairment loss is reversed only to that
extent that the asset’s carrying amount after the reversal does not exceed the carrying amount that would have been determined, net of
depreciation and amortization, if no impairment loss had been recognized.
D.S. INDUSTRIES LIMITED29
Annual Report June 30, 2015
Note 2015 2014
Rupees Rupees
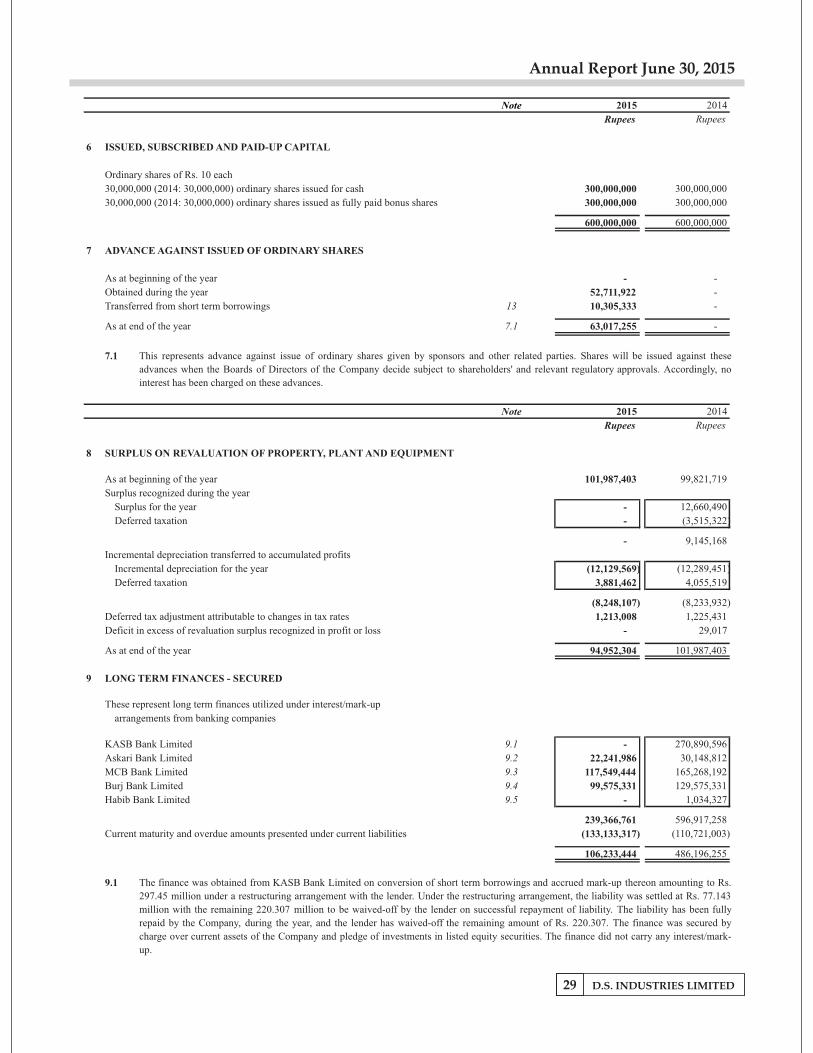
6 ISSUED, SUBSCRIBED AND PAID-UP CAPITAL
Ordinary shares of Rs. 10 each
30,000,000 (2014: 30,000,000) ordinary shares issued for cash 300,000,000
300,000,000
30,000,000 (2014: 30,000,000) ordinary shares issued as fully paid bonus shares 300,000,000
300,000,000
600,000,000
600,000,000
7 ADVANCE AGAINST ISSUED OF ORDINARY SHARES
As at beginning of the year -
-
Obtained during the year 52,711,922
-
Transferred from short term borrowings 13 10,305,333
-
As at end of the year 7.1 63,017,255
-
7.1
Note 2015 2014
Rupees Rupees
8 SURPLUS ON REVALUATION OF PROPERTY, PLANT AND EQUIPMENT
As at beginning of the year 101,987,403 99,821,719
Surplus recognized during the year
Surplus for the year - 12,660,490
Deferred taxation - (3,515,322)
- 9,145,168 Incremental depreciation transferred to accumulated profits
Incremental depreciation for the year (12,129,569) (12,289,451) Deferred taxation 3,881,462 4,055,519
(8,248,107) (8,233,932) Deferred tax adjustment attributable to changes in tax rates 1,213,008 1,225,431 Deficit in excess of revaluation surplus recognized in profit or loss - 29,017
As at end of the year 94,952,304 101,987,403
9 LONG TERM FINANCES - SECURED
These represent long term finances utilized under interest/mark-up
arrangements from banking companies
KASB Bank Limited 9.1 -
270,890,596
Askari Bank Limited 9.2 22,241,986
30,148,812 MCB Bank Limited 9.3 117,549,444
165,268,192
Burj Bank Limited 9.4 99,575,331
129,575,331 Habib Bank Limited 9.5 -
1,034,327
239,366,761
596,917,258
Current maturity and overdue amounts presented under current liabilities (133,133,317)
(110,721,003)
106,233,444
486,196,255
9.1 The finance was obtained from KASB Bank Limited on conversion of short term borrowings and accrued mark-up thereon amounting to Rs.
297.45 million under a restructuring arrangement with the lender. Under the restructuring arrangement, the liability was settled at Rs. 77.143
million with the remaining 220.307 million to be waived-off by the lender on successful repayment of liability. The liability has been fully
repaid by the Company, during the year, and the lender has waived-off the remaining amount of Rs. 220.307. The finance was secured by
charge over current assets of the Company and pledge of investments in listed equity securities. The finance did not carry any interest/mark-
up.
This represents advance against issue of ordinary shares given by sponsors and other related parties. Shares will be issued against these
advances when the Boards of Directors of the Company decide subject to shareholders' and relevant regulatory approvals. Accordingly, no
interest has been charged on these advances.
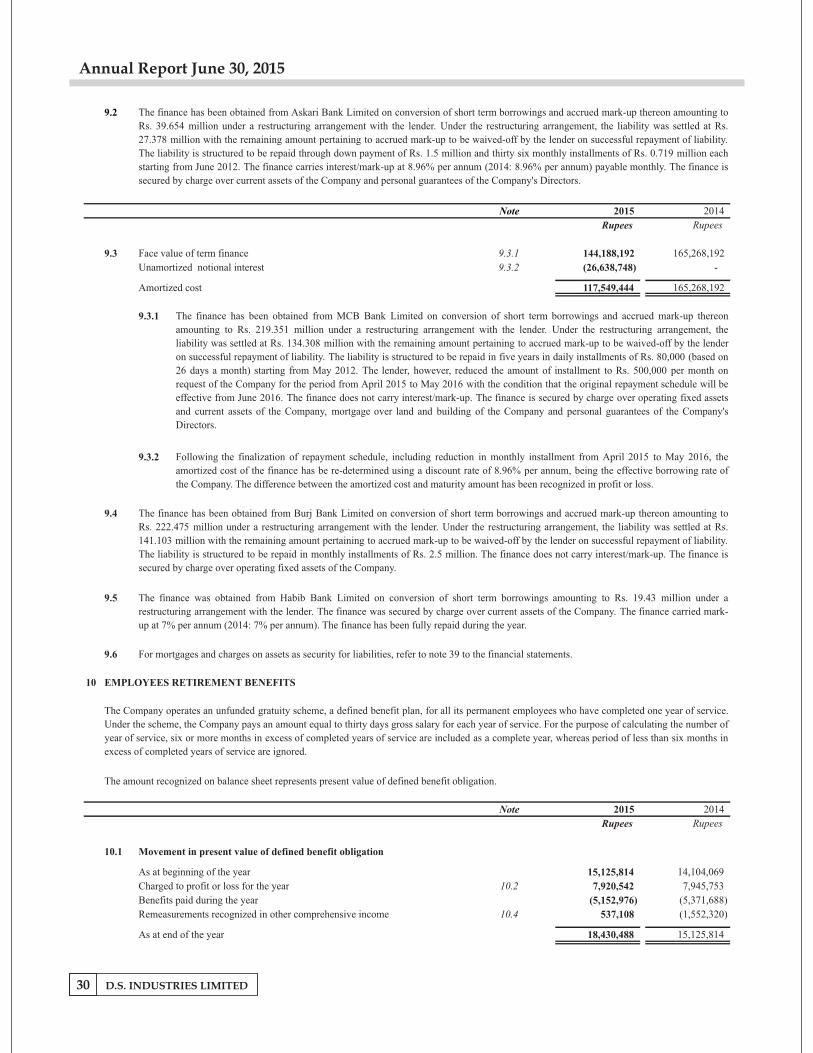
D.S. INDUSTRIES LIMITED30
Annual Report June 30, 2015
9.2
Note 2015 2014
Rupees Rupees
9.3 Face value of term finance 9.3.1 144,188,192 165,268,192
Unamortized notional interest 9.3.2 (26,638,748) -
Amortized cost 117,549,444 165,268,192
9.3.1
9.3.2
9.4
9.5
9.6 For mortgages and charges on assets as security for liabilities, refer to note 39 to the financial statements.
10 EMPLOYEES RETIREMENT BENEFITS
The amount recognized on balance sheet represents present value of defined benefit obligation.
Note 2015 2014
Rupees Rupees
10.1 Movement in present value of defined benefit obligation
As at beginning of the year 15,125,814
14,104,069
Charged to profit or loss for the year 10.2 7,920,542
7,945,753
Benefits paid during the year (5,152,976)
(5,371,688)
Remeasurements recognized in other comprehensive income 10.4 537,108
(1,552,320)
As at end of the year 18,430,488
15,125,814
The finance has been obtained from MCB Bank Limited on conversion of short term borrowings and accrued mark-up thereon
amounting to Rs. 219.351 million under a restructuring arrangement with the lender. Under the restructuring arrangement, the
liability was settled at Rs. 134.308 million with the remaining amount pertaining to accrued mark-up to be waived-off by the lender
on successful repayment of liability. The liability is structured to be repaid in five years in daily installments of Rs. 80,000 (based on
26 days a month) starting from May 2012. The lender, however, reduced the amount of installment to Rs. 500,000 per month on
request of the Company for the period from April 2015 to May 2016 with the condition that the original repayment schedule will be
effective from June 2016. The finance does not carry interest/mark-up. The finance is secured by charge over operating fixed assets
and current assets of the Company, mortgage over land and building of the Company and personal guarantees of the Company's
Directors.
The Company operates an unfunded gratuity scheme, a defined benefit plan, for all its permanent employees who have completed one year of service.
Under the scheme, the Company pays an amount equal to thirty days gross salary for each year of service. For the purpose of calculating the number of
year of service, six or more months in excess of completed years of service are included as a complete year, whereas period of less than six months in
excess of completed years of service are ignored.
The finance has been obtained from Burj Bank Limited on conversion of short term borrowings and accrued mark-up thereon amounting to
Rs. 222.475 million under a restructuring arrangement with the lender. Under the restructuring arrangement, the liability was settled at Rs.
141.103 million with the remaining amount pertaining to accrued mark-up to be waived-off by the lender on successful repayment of liability.
The liability is structured to be repaid in monthly installments of Rs. 2.5 million. The finance does not carry interest/mark-up. The finance is
secured by charge over operating fixed assets of the Company.
The finance was obtained from Habib Bank Limited on conversion of short term borrowings amounting to Rs. 19.43 million under a
restructuring arrangement with the lender. The finance was secured by charge over current assets of the Company. The finance carried mark-
up at 7% per annum (2014: 7% per annum). The finance has been fully repaid during the year.
The finance has been obtained from Askari Bank Limited on conversion of short term borrowings and accrued mark-up thereon amounting to
Rs. 39.654 million under a restructuring arrangement with the lender. Under the restructuring arrangement, the liability was settled at Rs.
27.378 million with the remaining amount pertaining to accrued mark-up to be waived-off by the lender on successful repayment of liability.
The liability is structured to be repaid through down payment of Rs. 1.5 million and thirty six monthly installments of Rs. 0.719 million each
starting from June 2012. The finance carries interest/mark-up at 8.96% per annum (2014: 8.96% per annum) payable monthly. The finance is
secured by charge over current assets of the Company and personal guarantees of the Company's Directors.
Following the finalization of repayment schedule, including reduction in monthly installment from April 2015 to May 2016, the
amortized cost of the finance has be re-determined using a discount rate of 8.96% per annum, being the effective borrowing rate of
the Company. The difference between the amortized cost and maturity amount has been recognized in profit or loss.
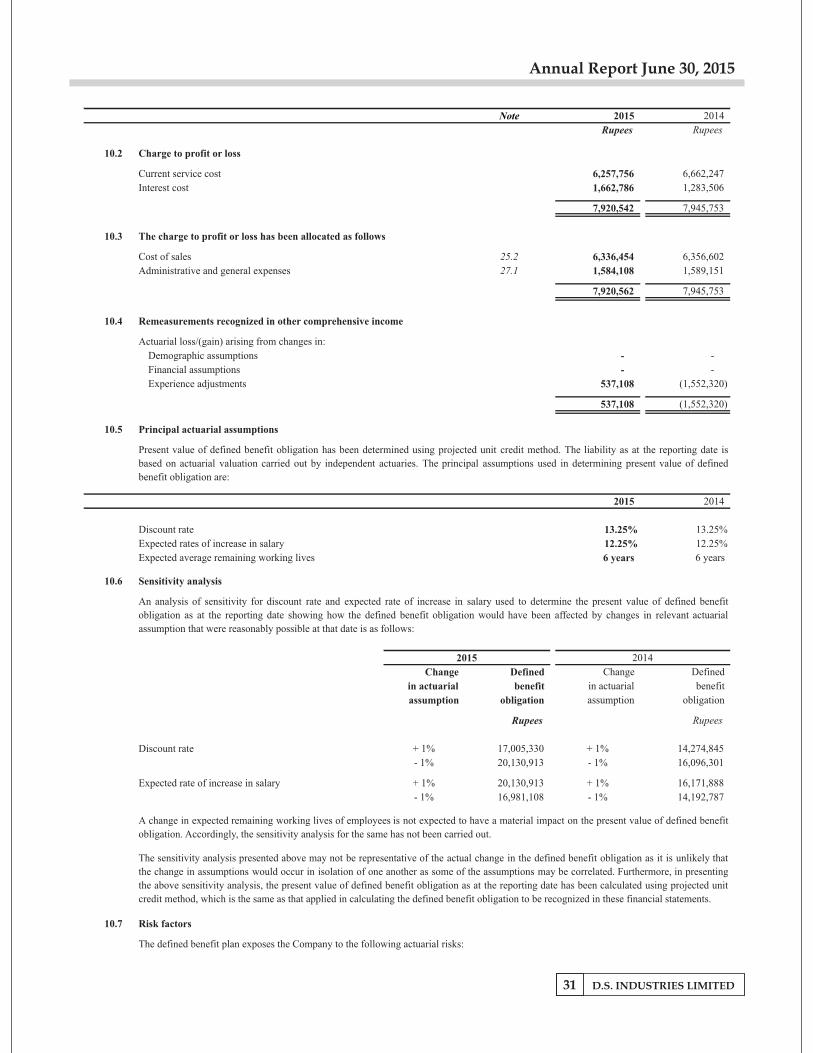
D.S. INDUSTRIES LIMITED31
Annual Report June 30, 2015
Note 2015 2014
Rupees Rupees
10.2 Charge to profit or loss
Current service cost 6,257,756
6,662,247
Interest cost 1,662,786
1,283,506
7,920,542
7,945,753
10.3 The charge to profit or loss has been allocated as follows
Cost of sales 25.2 6,336,454
6,356,602
Administrative and general expenses 27.1 1,584,108
1,589,151
7,920,562
7,945,753
10.4 Remeasurements recognized in other comprehensive income
Actuarial loss/(gain) arising from changes in:
Demographic assumptions -
-
Financial assumptions -
-
Experience adjustments 537,108
(1,552,320)
537,108 (1,552,320)
10.5 Principal actuarial assumptions
2015 2014
Discount rate 13.25% 13.25%
Expected rates of increase in salary 12.25% 12.25%
Expected average remaining working lives 6 years 6 years
10.6 Sensitivity analysis
Change Defined Change Defined
in actuarial benefit in actuarial benefit
assumption obligation assumption obligation
Rupees Rupees
Discount rate + 1% 17,005,330
+ 1% 14,274,845
- 1% 20,130,913
- 1% 16,096,301
Expected rate of increase in salary + 1% 20,130,913
+ 1% 16,171,888 - 1% 16,981,108
- 1% 14,192,787
10.7 Risk factors
An analysis of sensitivity for discount rate and expected rate of increase in salary used to determine the present value of defined benefit
obligation as at the reporting date showing how the defined benefit obligation would have been affected by changes in relevant actuarial
assumption that were reasonably possible at that date is as follows:
A change in expected remaining working lives of employees is not expected to have a material impact on the present value of defined benefit
obligation. Accordingly, the sensitivity analysis for the same has not been carried out.
The sensitivity analysis presented above may not be representative of the actual change in the defined benefit obligation as it is unlikely that
the change in assumptions would occur in isolation of one another as some of the assumptions may be correlated. Furthermore, in presenting
the above sensitivity analysis, the present value of defined benefit obligation as at the reporting date has been calculated using projected unit
credit method, which is the same as that applied in calculating the defined benefit obligation to be recognized in these financial statements.
The defined benefit plan exposes the Company to the following actuarial risks:
2015 2014
Present value of defined benefit obligation has been determined using projected unit credit method. The liability as at the reporting date is
based on actuarial valuation carried out by independent actuaries. The principal assumptions used in determining present value of defined
benefit obligation are:
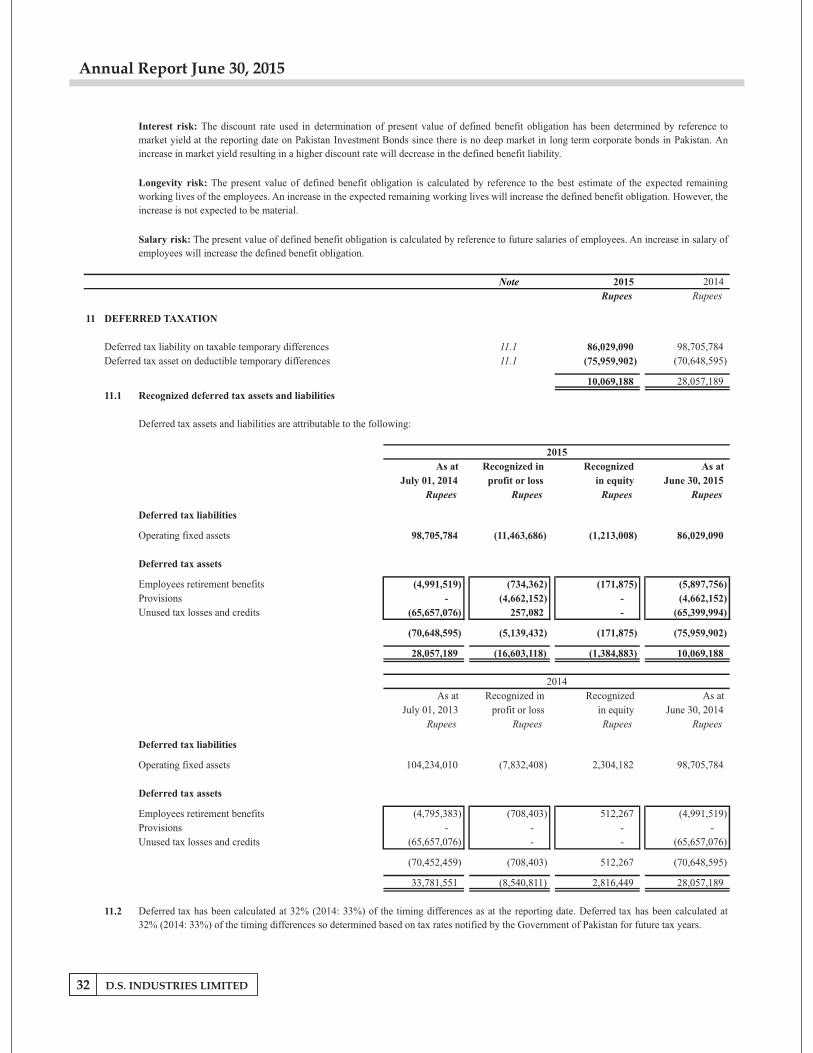
D.S. INDUSTRIES LIMITED32
Annual Report June 30, 2015
Note 2015 2014
Rupees Rupees
11 DEFERRED TAXATION
Deferred tax liability on taxable temporary differences 11.1 86,029,090
98,705,784
Deferred tax asset on deductible temporary differences 11.1 (75,959,902)
(70,648,595)
10,069,188
28,057,189
11.1 Recognized deferred tax assets and liabilities
Deferred tax assets and liabilities are attributable to the following:
As at Recognized in Recognized As at
July 01, 2014 profit or loss in equity June 30, 2015
Rupees Rupees Rupees Rupees
Deferred tax liabilities
Operating fixed assets 98,705,784 (11,463,686) (1,213,008) 86,029,090
Deferred tax assets
Employees retirement benefits (4,991,519) (734,362) (171,875) (5,897,756) Provisions - (4,662,152) - (4,662,152) Unused tax losses and credits (65,657,076) 257,082 - (65,399,994)
(70,648,595) (5,139,432) (171,875) (75,959,902)
28,057,189 (16,603,118) (1,384,883) 10,069,188
As at Recognized in Recognized As at
July 01, 2013 profit or loss in equity June 30, 2014
Rupees Rupees Rupees Rupees
Deferred tax liabilities
Operating fixed assets 104,234,010
(7,832,408)
2,304,182
98,705,784
Deferred tax assets
Employees retirement benefits (4,795,383)
(708,403)
512,267
(4,991,519) Provisions -
-
-
-
Unused tax losses and credits (65,657,076)
-
-
(65,657,076)
(70,452,459)
(708,403)
512,267
(70,648,595)
33,781,551
(8,540,811)
2,816,449
28,057,189
11.2 Deferred tax has been calculated at 32% (2014: 33%) of the timing differences as at the reporting date. Deferred tax has been calculated at
32% (2014: 33%) of the timing differences so determined based on tax rates notified by the Government of Pakistan for future tax years.
2015
2014
Longevity risk: The present value of defined benefit obligation is calculated by reference to the best estimate of the expected remaining
working lives of the employees. An increase in the expected remaining working lives will increase the defined benefit obligation. However, the
increase is not expected to be material.
Salary risk: The present value of defined benefit obligation is calculated by reference to future salaries of employees. An increase in salary of
employees will increase the defined benefit obligation.
Interest risk: The discount rate used in determination of present value of defined benefit obligation has been determined by reference to
market yield at the reporting date on Pakistan Investment Bonds since there is no deep market in long term corporate bonds in Pakistan. An
increase in market yield resulting in a higher discount rate will decrease in the defined benefit liability.
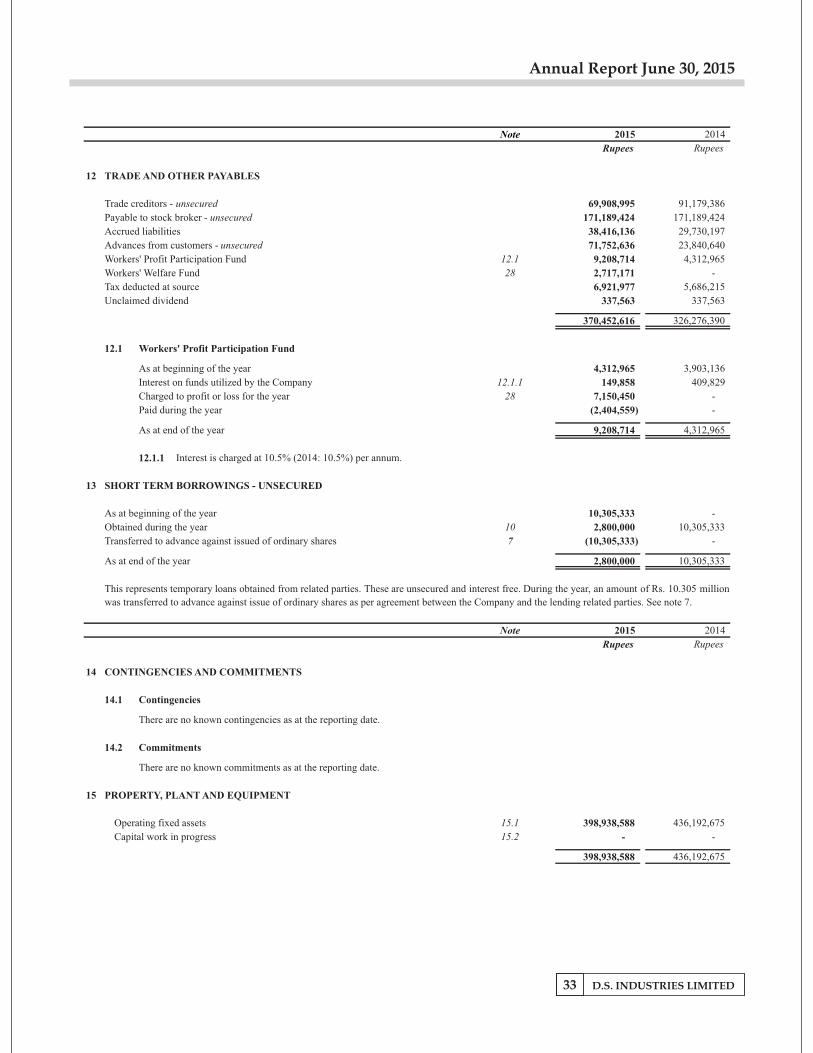
D.S. INDUSTRIES LIMITED33
Annual Report June 30, 2015
Note 2015 2014
Rupees Rupees
12 TRADE AND OTHER PAYABLES
Trade creditors - unsecured 69,908,995
91,179,386
Payable to stock broker - unsecured 171,189,424
171,189,424
Accrued liabilities 38,416,136
29,730,197
Advances from customers - unsecured 71,752,636
23,840,640
Workers' Profit Participation Fund 12.1 9,208,714
4,312,965
Workers' Welfare Fund 28 2,717,171
-
Tax deducted at source 6,921,977
5,686,215
Unclaimed dividend 337,563
337,563
370,452,616
326,276,390
12.1 Workers' Profit Participation Fund
As at beginning of the year 4,312,965 3,903,136
Interest on funds utilized by the Company 12.1.1 149,858 409,829
Charged to profit or loss for the year 28 7,150,450 -
Paid during the year (2,404,559) -
As at end of the year 9,208,714 4,312,965
12.1.1 Interest is charged at 10.5% (2014: 10.5%) per annum.
13 SHORT TERM BORROWINGS - UNSECURED
As at beginning of the year 10,305,333 - Obtained during the year 10 2,800,000 10,305,333 Transferred to advance against issued of ordinary shares 7 (10,305,333) -
As at end of the year 2,800,000 10,305,333
Note 2015 2014
Rupees Rupees
14 CONTINGENCIES AND COMMITMENTS
14.1 Contingencies
14.2 Commitments
There are no known commitments as at the reporting date.
15 PROPERTY, PLANT AND EQUIPMENT
Operating fixed assets 15.1 398,938,588
436,192,675 Capital work in progress 15.2 -
-
398,938,588
436,192,675
There are no known contingencies as at the reporting date.
This represents temporary loans obtained from related parties. These are unsecured and interest free. During the year, an amount of Rs. 10.305 million
was transferred to advance against issue of ordinary shares as per agreement between the Company and the lending related parties. See note 7.
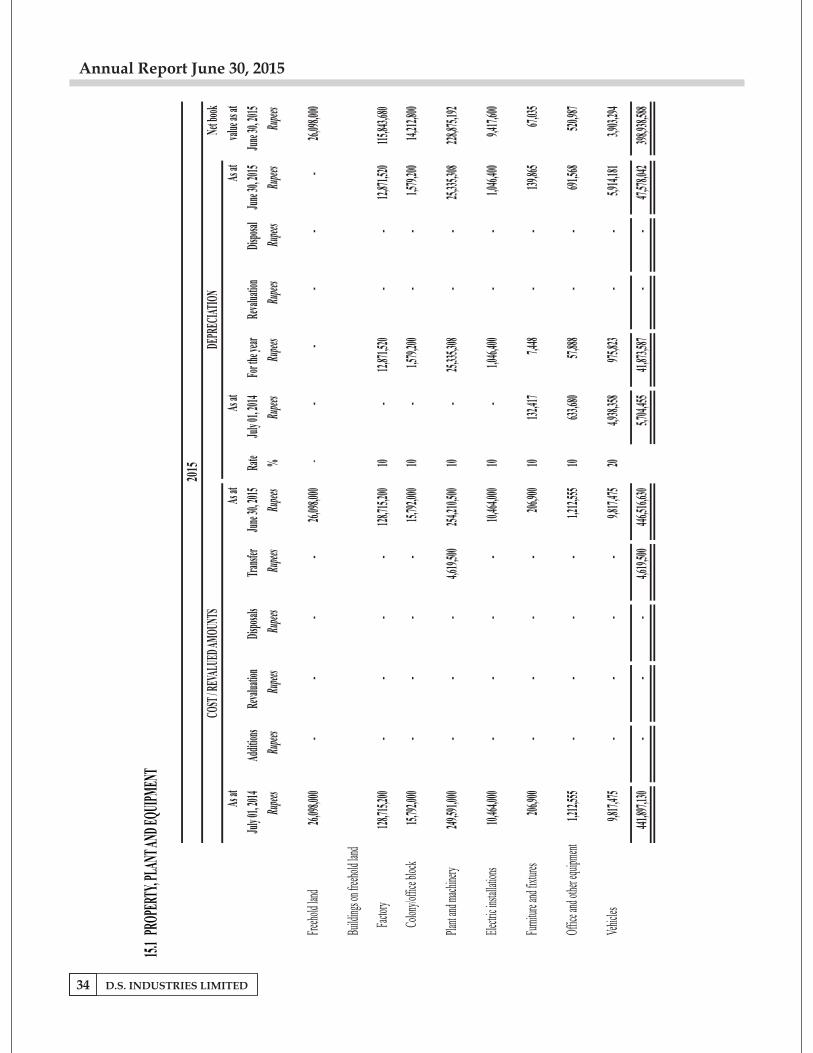
D.S. INDUSTRIES LIMITED34
Annual Report June 30, 2015
15.1
PROP
ERTY
, PLA
NT AN
D EQU
IPME
NT
Net b
ook
As at
As at
As at
As at
value
as at
July
01, 2
014
Addit
ions
Reva
luatio
nDi
sposal
sTr
ansfe
rJu
ne 30
, 201
5Ra
teJu
ly 01
, 201
4Fo
r the
year
Reva
luatio
nDi
sposal
June
30, 2
015
June
30, 2
015
Rupee
sRu
pees
Rupee
sRu
pees
Rupee
sRu
pees
%Ru
pees
Rupee
sRu
pees
Rupee
sRu
pees
Rupee
s
Freeh
old la
nd26
,098,0
00-
--
-26
,098,0
00-
--
--
-26
,098,0
00
Build
ings o
n free
hold
land
Facto
ry12
8,715
,200
-
-
-
-
128,7
15,20
0
10-
12,87
1,520
-
-12
,871,5
20115
,843,6
80
Colon
y/offi
ce blo
ck15
,792,0
00-
-
-
-
15,79
2,000
10-
1,579
,200
-
-1,5
79,20
014
,212,8
00
Plant
and m
achine
ry24
9,591
,000
-
-
-
4,619
,500
254,2
10,50
0
10-
25,33
5,308
-
-25
,335,3
0822
8,875
,192
Electr
ic ins
tallat
ions
10,46
4,000
-
-
-
-
10,46
4,000
10-
1,046
,400
-
-1,0
46,40
09,4
17,60
0
Furni
ture a
nd fix
tures
206,9
00-
-
-
-
206,9
00
1013
2,417
7,448
-
-13
9,865
67,03
5
Offic
e and
othe
r equ
ipmen
t1,2
12,55
5-
-
-
-
1,212
,555
1063
3,680
57,88
8
-
-69
1,568
520,9
87
Vehic
les9,8
17,47
5-
-
-
-
9,817
,475
204,9
38,35
8
975,8
23
-
-5,9
14,18
13,9
03,29
4
441,8
97,13
0-
-
-
4,619
,500
446,5
16,63
0
5,704
,455
41,87
3,587
-
-47
,578,0
4239
8,938
,588
2015
COST
/ REV
ALUE
D AMO
UNTS
DEPR
ECIA
TION
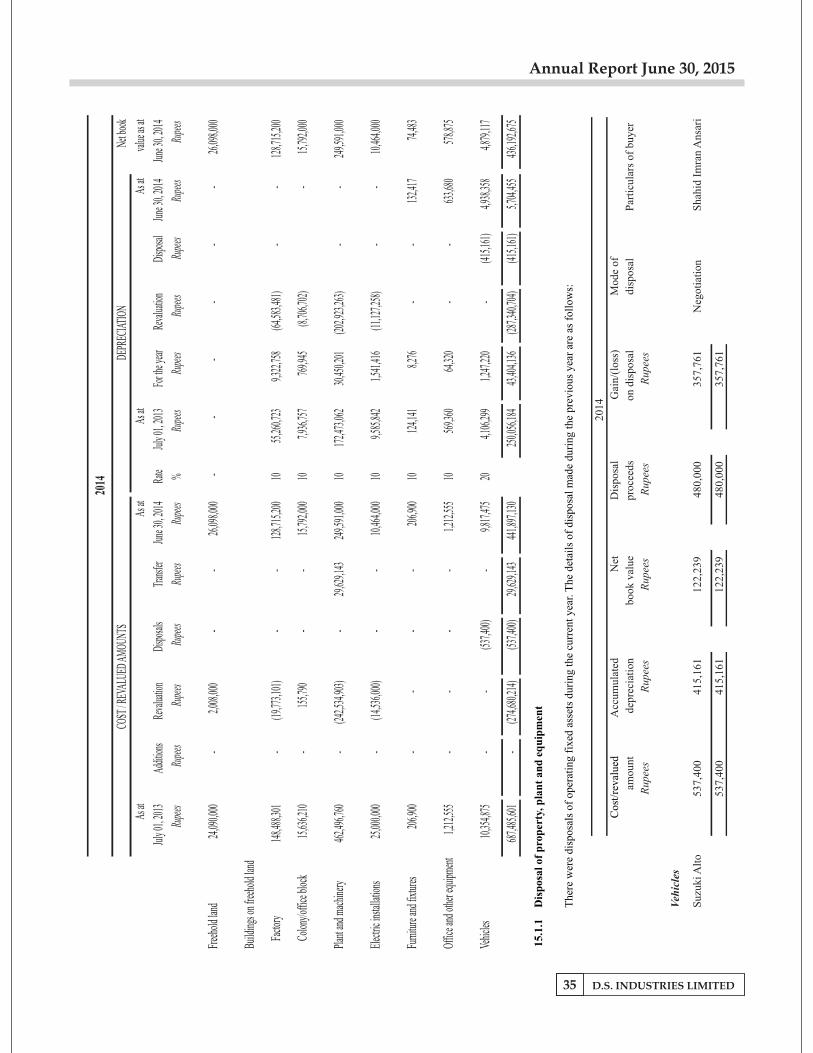
D.S. INDUSTRIES LIMITED35
Annual Report June 30, 2015
Net b
ook
As at
As at
As at
As at
value
as at
July 0
1, 20
13Ad
dition
sRe
valua
tion
Dispo
sals
Tran
sfer
June 3
0, 20
14Ra
teJul
y 01,
2013
For th
e year
Reva
luatio
nDi
sposal
June 3
0, 20
14Jun
e 30,
2014
Rupe
esRu
pees
Rupe
esRu
pees
Rupe
esRu
pees
%Ru
pees
Rupe
esRu
pees
Rupe
esRu
pees
Rupe
es
Free
hold
land
24,09
0,000
-
2,008
,000
-
-
26
,098,0
00
-
-
-
-
-
-26
,098,0
00
Build
ings o
n free
hold
land
Facto
ry14
8,488
,301
-
(19,77
3,101
)
-
-
128,7
15,20
0
1055
,260,7
23
9,3
22,75
8
(64,58
3,481
)
--
128,7
15,20
0
Colon
y/offi
ce bl
ock
15,63
6,210
-
155,7
90
-
-
15
,792,0
00
107,9
36,75
7
76
9,945
(8,70
6,702
)
-15
,792,0
00
Plan
t and
mac
hinery
462,4
96,76
0-
(242,5
34,90
3)-
29,62
9,143
249,5
91,00
010
172,4
73,06
230
,450,2
01(20
2,923
,263)
--
249,5
91,00
0
Elec
tric i
nstal
lation
s25
,000,0
00-
(14,53
6,000
)-
-10
,464,0
0010
9,585
,842
1,541
,416
(11,12
7,258
)-
-10
,464,0
00
Furn
iture
and f
ixtur
es20
6,900
--
--
206,9
0010
124,1
418,2
76-
-13
2,417
74,48
3
Offic
e and
othe
r equ
ipmen
t1,2
12,55
5-
--
-1,2
12,55
510
569,3
6064
,320
--
633,6
8057
8,875
Vehic
les10
,354,8
75-
-(53
7,400
)-
9,817
,475
204,1
06,29
91,2
47,22
0-
(415,1
61)
4,938
,358
4,879
,117
687,4
85,60
1-
(274,6
80,21
4)(53
7,400
)29
,629,1
4344
1,897
,130
250,0
56,18
443
,404,1
36(28
7,340
,704)
(415,1
61)
5,704
,455
436,1
92,67
5
2014
COST
/ REV
ALUE
D AM
OUNT
SDE
PREC
IATI
ON
15.1
.1D
isp
osal
of
pro
per
ty, p
lan
t an
d e
qu
ipm
ent
The
re w
ere
disp
osal
s of
ope
rati
ng f
ixed
ass
ets
duri
ng t
he c
urre
nt y
ear.
The
det
ails
of
disp
osal
mad
e du
ring
the
pre
viou
s ye
ar a
re a
s fo
llow
s:
Cos
t/re
valu
edA
ccum
ulat
edN
etD
ispo
sal
Gai
n/(l
oss)
Mod
e of
amou
ntde
prec
iati
onbo
ok v
alue
proc
eeds
on d
ispo
sal
disp
osal
Par
ticu
lars
of
buye
r
Rup
ees
Rup
ees
Rup
ees
Rup
ees
Rup
ees
Veh
icle
s
Suz
uki A
lto
537,
400
41
5,16
1
12
2,23
9
48
0,00
0
357,
761
N
egot
iati
onS
hahi
d Im
ran
Ans
ari
537,
400
41
5,16
1
12
2,23
9
48
0,00
0
357,
761
2014
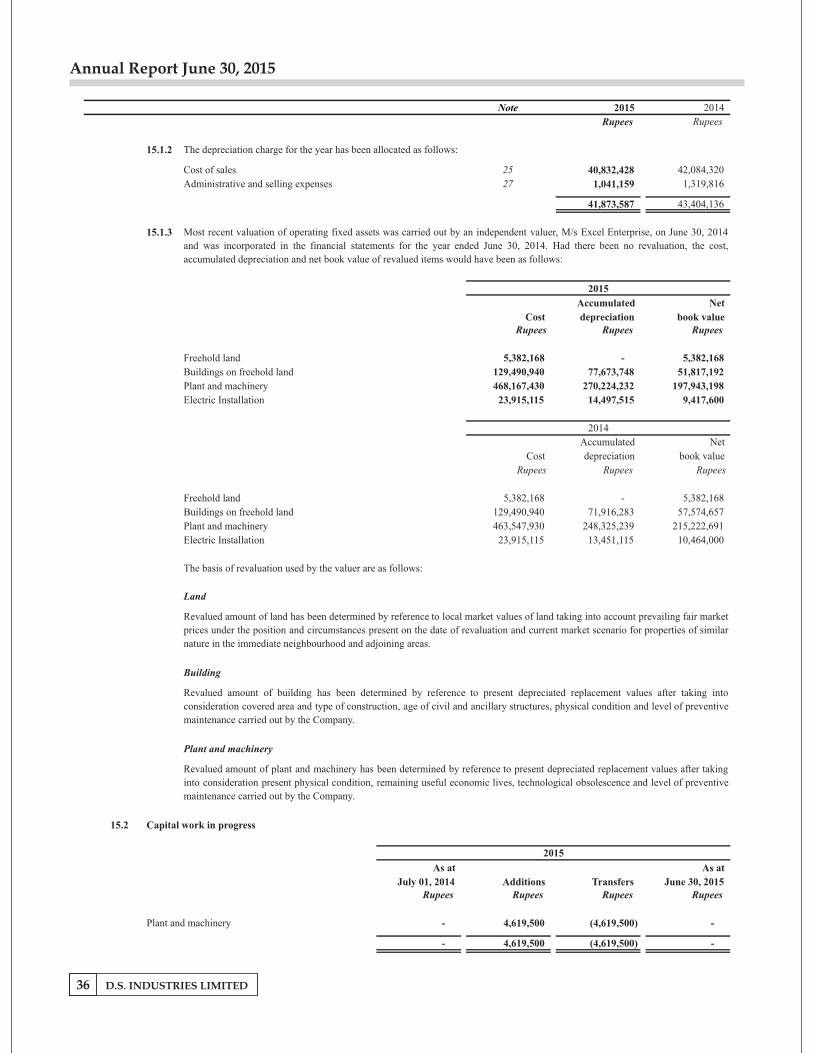
Annual Report June 30, 2015
D.S. INDUSTRIES LIMITED36
Note 2015 2014
Rupees Rupees
15.1.2 The depreciation charge for the year has been allocated as follows:
Cost of sales 25 40,832,428
42,084,320
Administrative and selling expenses 27 1,041,159
1,319,816
41,873,587
43,404,136
15.1.3
Accumulated Net
Cost depreciation book valueRupees Rupees Rupees
Freehold land 5,382,168
-
5,382,168
Buildings on freehold land 129,490,940
77,673,748
51,817,192
Plant and machinery 468,167,430
270,224,232
197,943,198
Electric Installation 23,915,115 14,497,515 9,417,600
Accumulated Net
Cost depreciation book value
Rupees Rupees Rupees
Freehold land 5,382,168 - 5,382,168
Buildings on freehold land 129,490,940 71,916,283 57,574,657
Plant and machinery 463,547,930 248,325,239 215,222,691
Electric Installation 23,915,115 13,451,115 10,464,000
The basis of revaluation used by the valuer are as follows:
Land
Building
Plant and machinery
15.2 Capital work in progress
As at As at
July 01, 2014 Additions Transfers June 30, 2015Rupees Rupees Rupees Rupees
Plant and machinery -
4,619,500
(4,619,500)
-
-
4,619,500
(4,619,500)
-
2015
Most recent valuation of operating fixed assets was carried out by an independent valuer, M/s Excel Enterprise, on June 30, 2014
and was incorporated in the financial statements for the year ended June 30, 2014. Had there been no revaluation, the cost,
accumulated depreciation and net book value of revalued items would have been as follows:
2014
Revalued amount of land has been determined by reference to local market values of land taking into account prevailing fair market
prices under the position and circumstances present on the date of revaluation and current market scenario for properties of similar
nature in the immediate neighbourhood and adjoining areas.
Revalued amount of building has been determined by reference to present depreciated replacement values after taking into
consideration covered area and type of construction, age of civil and ancillary structures, physical condition and level of preventive
maintenance carried out by the Company.
Revalued amount of plant and machinery has been determined by reference to present depreciated replacement values after taking
into consideration present physical condition, remaining useful economic lives, technological obsolescence and level of preventive
maintenance carried out by the Company.
2015
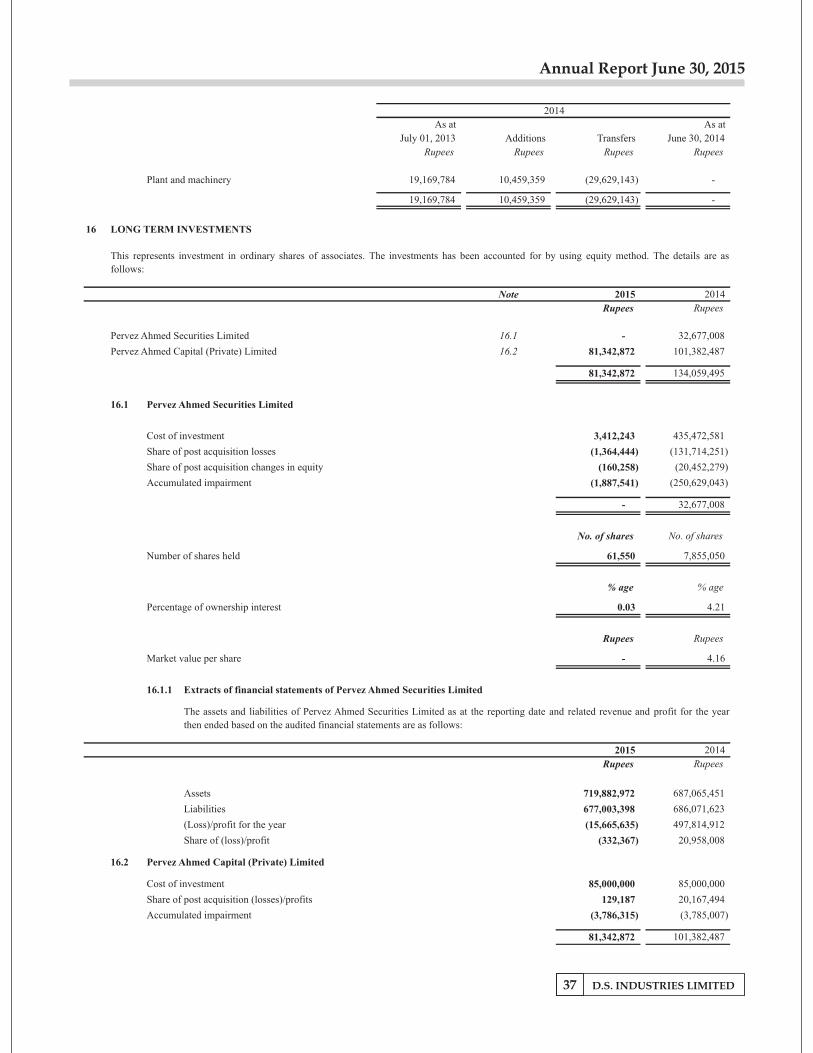
Annual Report June 30, 2015
D.S. INDUSTRIES LIMITED37
As at As at
July 01, 2013 Additions Transfers June 30, 2014
Rupees Rupees Rupees Rupees
Plant and machinery 19,169,784
10,459,359
(29,629,143)
-
19,169,784
10,459,359
(29,629,143)
-
16 LONG TERM INVESTMENTS
Note 2015 2014
Rupees Rupees
Pervez Ahmed Securities Limited 16.1 -
32,677,008
Pervez Ahmed Capital (Private) Limited 16.2 81,342,872
101,382,487
81,342,872
134,059,495
16.1 Pervez Ahmed Securities Limited
Cost of investment 3,412,243 435,472,581
Share of post acquisition losses (1,364,444) (131,714,251)
Share of post acquisition changes in equity (160,258) (20,452,279)
Accumulated impairment (1,887,541) (250,629,043)
- 32,677,008
No. of shares No. of shares
Number of shares held 61,550 7,855,050
% age % age
Percentage of ownership interest 0.03 4.21
Rupees Rupees
Market value per share -
4.16
16.1.1 Extracts of financial statements of Pervez Ahmed Securities Limited
2015 2014
Rupees Rupees
Assets 719,882,972
687,065,451 Liabilities 677,003,398
686,071,623
(Loss)/profit for the year (15,665,635)
497,814,912 Share of (loss)/profit (332,367)
20,958,008
16.2 Pervez Ahmed Capital (Private) Limited
Cost of investment 85,000,000
85,000,000
Share of post acquisition (losses)/profits 129,187
20,167,494
Accumulated impairment (3,786,315)
(3,785,007)
81,342,872
101,382,487
This represents investment in ordinary shares of associates. The investments has been accounted for by using equity method. The details are as
follows:
The assets and liabilities of Pervez Ahmed Securities Limited as at the reporting date and related revenue and profit for the year
then ended based on the audited financial statements are as follows:
2014
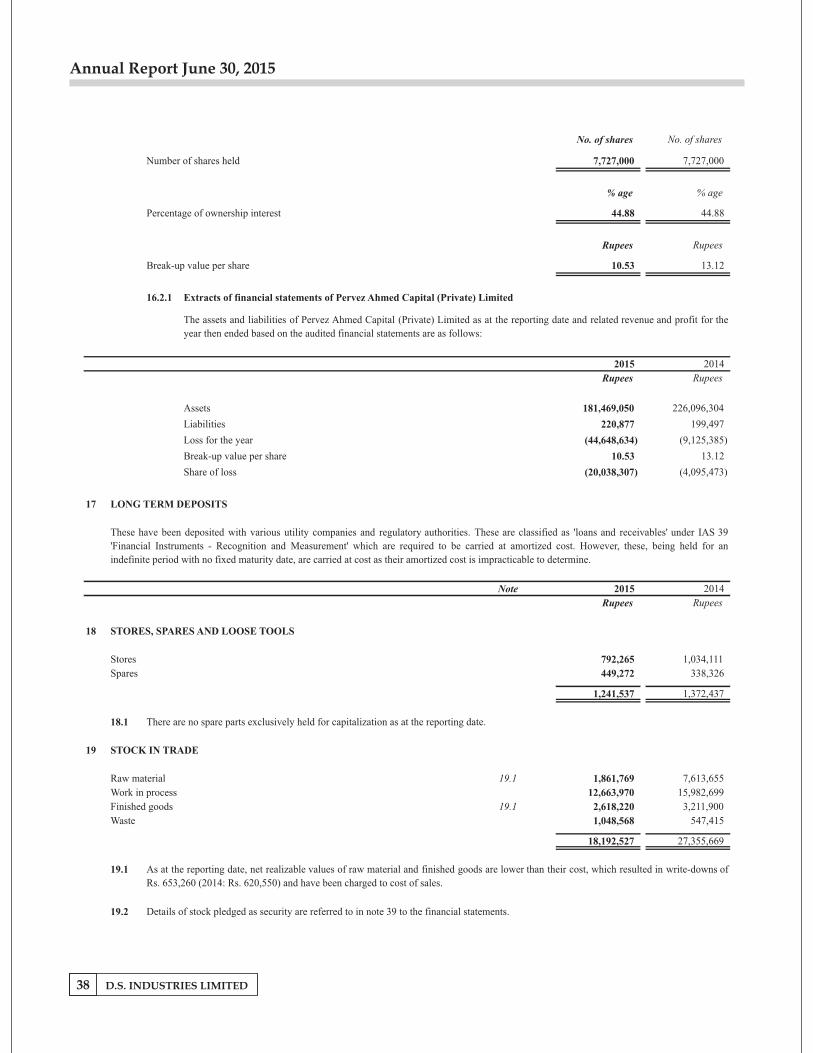
Annual Report June 30, 2015
D.S. INDUSTRIES LIMITED38
No. of shares No. of shares
Number of shares held 7,727,000
7,727,000
% age % age
Percentage of ownership interest 44.88
44.88
Rupees Rupees
Break-up value per share 10.53
13.12
16.2.1 Extracts of financial statements of Pervez Ahmed Capital (Private) Limited
2015 2014
Rupees Rupees
Assets 181,469,050 226,096,304
Liabilities 220,877 199,497
Loss for the year (44,648,634) (9,125,385)
Break-up value per share 10.53 13.12
Share of loss (20,038,307) (4,095,473)
17 LONG TERM DEPOSITS
Note 2015 2014
Rupees Rupees
18 STORES, SPARES AND LOOSE TOOLS
Stores 792,265
1,034,111
Spares 449,272
338,326
1,241,537
1,372,437
18.1
19 STOCK IN TRADE
Raw material 19.1 1,861,769
7,613,655 Work in process 12,663,970
15,982,699
Finished goods 19.1 2,618,220
3,211,900 Waste 1,048,568
547,415
18,192,527
27,355,669
19.1
19.2 Details of stock pledged as security are referred to in note 39 to the financial statements.
As at the reporting date, net realizable values of raw material and finished goods are lower than their cost, which resulted in write-downs of
Rs. 653,260 (2014: Rs. 620,550) and have been charged to cost of sales.
These have been deposited with various utility companies and regulatory authorities. These are classified as 'loans and receivables' under IAS 39
'Financial Instruments - Recognition and Measurement' which are required to be carried at amortized cost. However, these, being held for an
indefinite period with no fixed maturity date, are carried at cost as their amortized cost is impracticable to determine.
The assets and liabilities of Pervez Ahmed Capital (Private) Limited as at the reporting date and related revenue and profit for the
year then ended based on the audited financial statements are as follows:
There are no spare parts exclusively held for capitalization as at the reporting date.
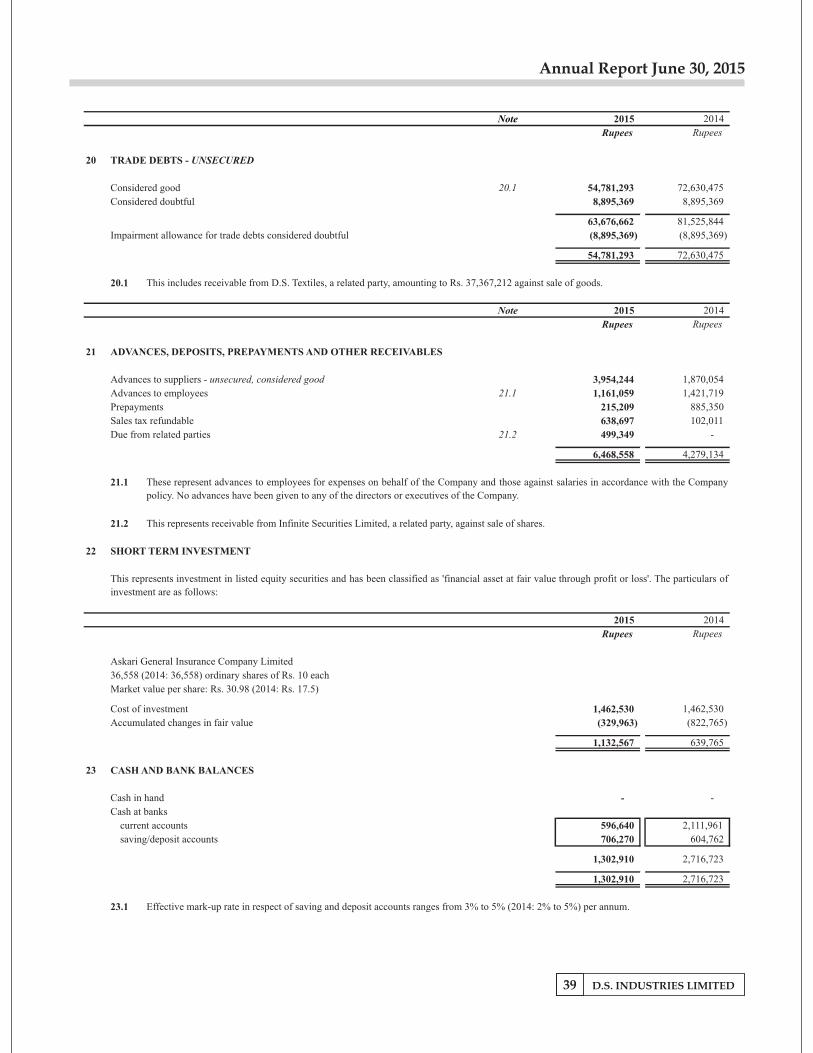
Annual Report June 30, 2015
D.S. INDUSTRIES LIMITED39
Note 2015 2014
Rupees Rupees
20 TRADE DEBTS - UNSECURED
Considered good 20.1 54,781,293
72,630,475
Considered doubtful 8,895,369
8,895,369
63,676,662
81,525,844
Impairment allowance for trade debts considered doubtful (8,895,369)
(8,895,369)
54,781,293
72,630,475
20.1
Note 2015 2014
Rupees Rupees
21 ADVANCES, DEPOSITS, PREPAYMENTS AND OTHER RECEIVABLES
Advances to suppliers - unsecured, considered good 3,954,244
1,870,054
Advances to employees 21.1 1,161,059
1,421,719
Prepayments 215,209 885,350
Sales tax refundable 638,697 102,011
Due from related parties 21.2 499,349 -
6,468,558 4,279,134
21.1
21.2 This represents receivable from Infinite Securities Limited, a related party, against sale of shares.
22 SHORT TERM INVESTMENT
2015 2014
Rupees Rupees
Askari General Insurance Company Limited
36,558 (2014: 36,558) ordinary shares of Rs. 10 each
Market value per share: Rs. 30.98 (2014: Rs. 17.5)
Cost of investment 1,462,530
1,462,530
Accumulated changes in fair value (329,963)
(822,765)
1,132,567
639,765
23 CASH AND BANK BALANCES
Cash in hand -
- Cash at banks
current accounts 596,640
2,111,961 saving/deposit accounts 706,270
604,762
1,302,910
2,716,723
1,302,910
2,716,723
23.1 Effective mark-up rate in respect of saving and deposit accounts ranges from 3% to 5% (2014: 2% to 5%) per annum.
This includes receivable from D.S. Textiles, a related party, amounting to Rs. 37,367,212 against sale of goods.
This represents investment in listed equity securities and has been classified as 'financial asset at fair value through profit or loss'. The particulars of
investment are as follows:
These represent advances to employees for expenses on behalf of the Company and those against salaries in accordance with the Company
policy. No advances have been given to any of the directors or executives of the Company.
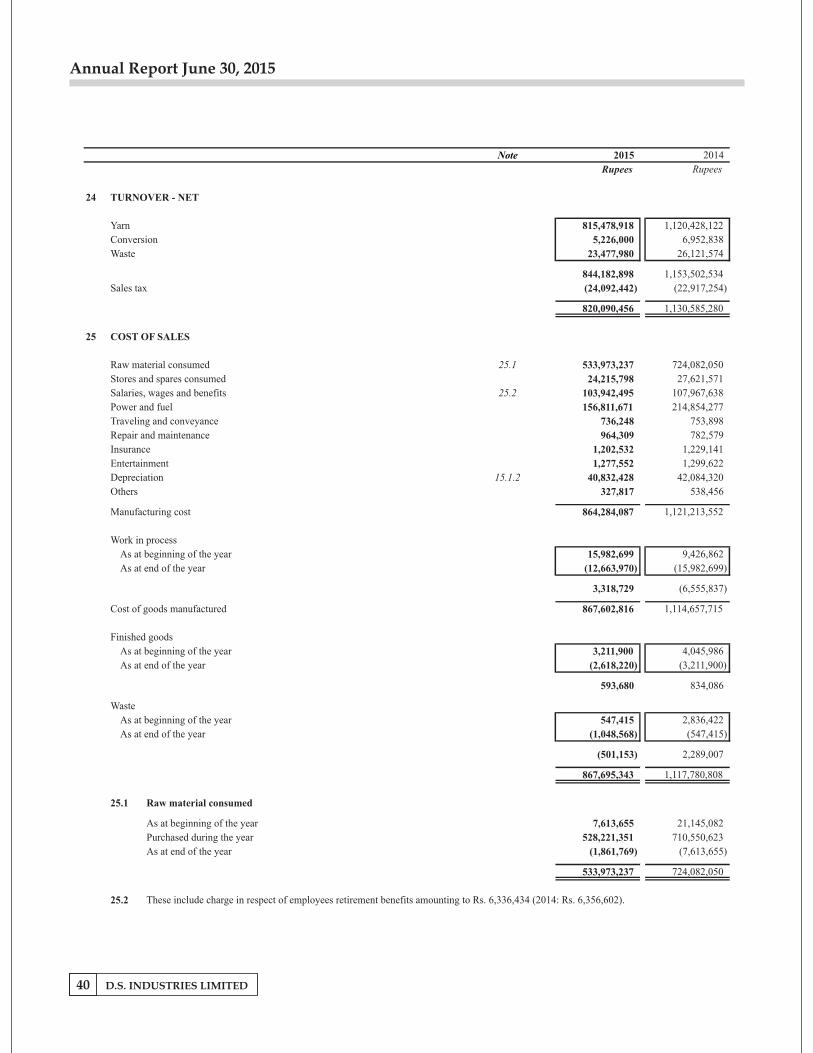
Annual Report June 30, 2015
D.S. INDUSTRIES LIMITED40
Note 2015 2014
Rupees Rupees
24 TURNOVER - NET
Yarn 815,478,918
1,120,428,122
Conversion 5,226,000
6,952,838
Waste 23,477,980
26,121,574
844,182,898
1,153,502,534
Sales tax (24,092,442)
(22,917,254)
820,090,456
1,130,585,280
25 COST OF SALES
Raw material consumed 25.1 533,973,237
724,082,050
Stores and spares consumed 24,215,798
27,621,571
Salaries, wages and benefits 25.2 103,942,495
107,967,638
Power and fuel 156,811,671 214,854,277
Traveling and conveyance 736,248 753,898
Repair and maintenance 964,309 782,579
Insurance 1,202,532 1,229,141
Entertainment 1,277,552 1,299,622
Depreciation 15.1.2 40,832,428 42,084,320
Others 327,817 538,456
Manufacturing cost 864,284,087 1,121,213,552
Work in process
As at beginning of the year 15,982,699 9,426,862 As at end of the year (12,663,970) (15,982,699)
3,318,729 (6,555,837)
Cost of goods manufactured 867,602,816 1,114,657,715
Finished goods
As at beginning of the year 3,211,900 4,045,986
As at end of the year (2,618,220)
(3,211,900)
593,680
834,086
Waste
As at beginning of the year 547,415
2,836,422
As at end of the year (1,048,568)
(547,415)
(501,153)
2,289,007
867,695,343
1,117,780,808
25.1 Raw material consumed
As at beginning of the year 7,613,655
21,145,082 Purchased during the year 528,221,351
710,550,623
As at end of the year (1,861,769)
(7,613,655)
533,973,237
724,082,050
25.2 These include charge in respect of employees retirement benefits amounting to Rs. 6,336,434 (2014: Rs. 6,356,602).
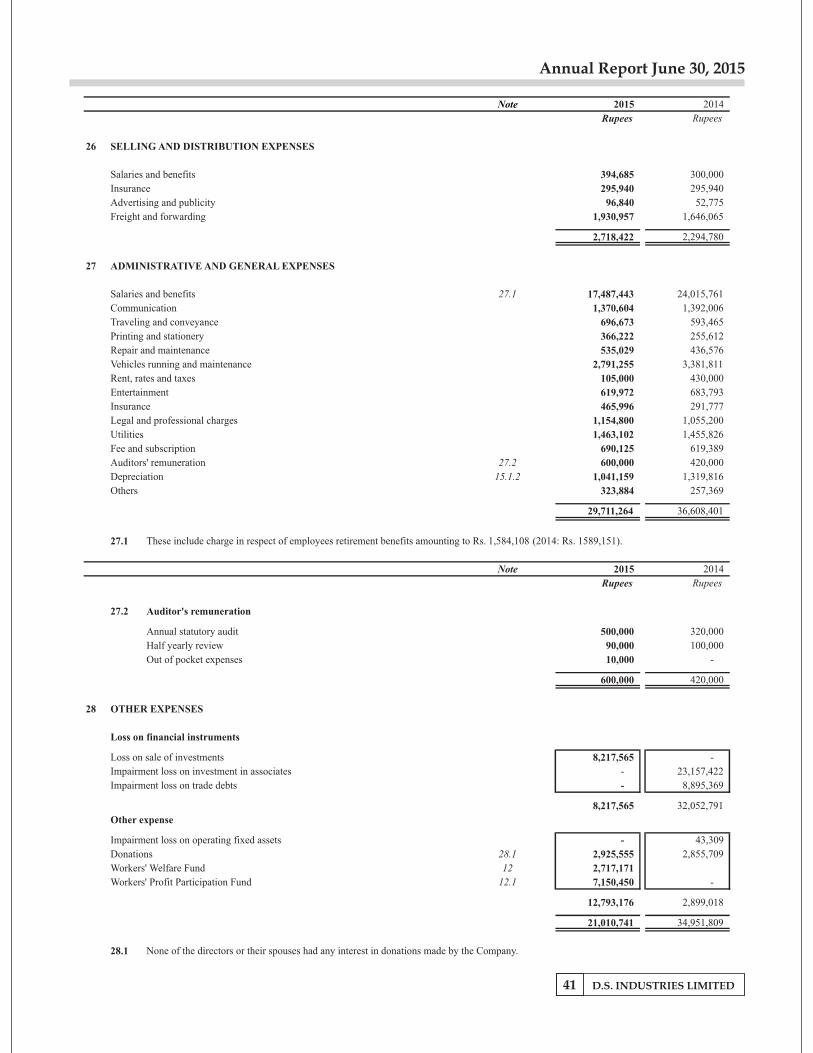
Annual Report June 30, 2015
D.S. INDUSTRIES LIMITED41
Note 2015 2014
Rupees Rupees
26 SELLING AND DISTRIBUTION EXPENSES
Salaries and benefits 394,685
300,000
Insurance 295,940
295,940
Advertising and publicity 96,840
52,775
Freight and forwarding 1,930,957
1,646,065
2,718,422
2,294,780
27 ADMINISTRATIVE AND GENERAL EXPENSES
Salaries and benefits 27.1 17,487,443
24,015,761
Communication 1,370,604
1,392,006
Traveling and conveyance 696,673
593,465
Printing and stationery 366,222
255,612
Repair and maintenance 535,029
436,576
Vehicles running and maintenance 2,791,255
3,381,811
Rent, rates and taxes 105,000
430,000
Entertainment 619,972
683,793
Insurance 465,996 291,777
Legal and professional charges 1,154,800 1,055,200
Utilities 1,463,102 1,455,826
Fee and subscription 690,125 619,389
Auditors' remuneration 27.2 600,000 420,000
Depreciation 15.1.2 1,041,159 1,319,816
Others 323,884 257,369
29,711,264 36,608,401
27.1 These include charge in respect of employees retirement benefits amounting to Rs. 1,584,108 (2014: Rs. 1589,151).
Note 2015 2014
Rupees Rupees
27.2 Auditor's remuneration
Annual statutory audit 500,000 320,000 Half yearly review 90,000 100,000 Out of pocket expenses 10,000
-
600,000
420,000
28 OTHER EXPENSES
Loss on financial instruments
Loss on sale of investments 8,217,565
- Impairment loss on investment in associates -
23,157,422
Impairment loss on trade debts -
8,895,369
8,217,565
32,052,791 Other expense
Impairment loss on operating fixed assets -
43,309
Donations 28.1 2,925,555
2,855,709
Workers' Welfare Fund 12 2,717,171
Workers' Profit Participation Fund 12.1 7,150,450
-
12,793,176
2,899,018
21,010,741
34,951,809
28.1 None of the directors or their spouses had any interest in donations made by the Company.
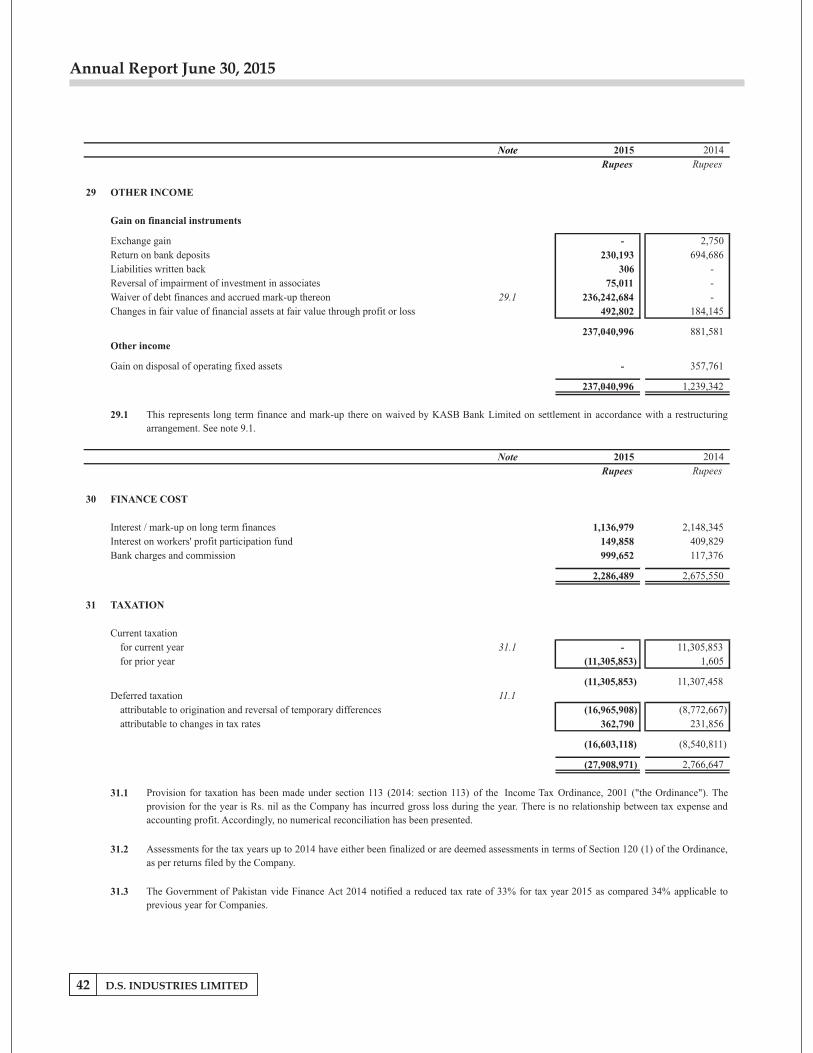
Annual Report June 30, 2015
D.S. INDUSTRIES LIMITED42
Note 2015 2014
Rupees Rupees
29 OTHER INCOME
Gain on financial instruments
Exchange gain -
2,750
Return on bank deposits 230,193
694,686
Liabilities written back 306
-
Reversal of impairment of investment in associates 75,011
-
Waiver of debt finances and accrued mark-up thereon 29.1 236,242,684
-
Changes in fair value of financial assets at fair value through profit or loss 492,802
184,145
237,040,996
881,581
Other income
Gain on disposal of operating fixed assets -
357,761
237,040,996
1,239,342
29.1
Note 2015 2014
Rupees Rupees
30 FINANCE COST
Interest / mark-up on long term finances 1,136,979 2,148,345
Interest on workers' profit participation fund 149,858 409,829 Bank charges and commission 999,652 117,376
2,286,489 2,675,550
31 TAXATION
Current taxation
for current year 31.1 - 11,305,853 for prior year (11,305,853)
1,605
(11,305,853)
11,307,458
Deferred taxation 11.1
attributable to origination and reversal of temporary differences (16,965,908)
(8,772,667)
attributable to changes in tax rates 362,790
231,856
(16,603,118)
(8,540,811)
(27,908,971)
2,766,647
31.1
31.2
31.3
Provision for taxation has been made under section 113 (2014: section 113) of the Income Tax Ordinance, 2001 ("the Ordinance"). The
provision for the year is Rs. nil as the Company has incurred gross loss during the year. There is no relationship between tax expense and
accounting profit. Accordingly, no numerical reconciliation has been presented.
Assessments for the tax years up to 2014 have either been finalized or are deemed assessments in terms of Section 120 (1) of the Ordinance,
as per returns filed by the Company.
The Government of Pakistan vide Finance Act 2014 notified a reduced tax rate of 33% for tax year 2015 as compared 34% applicable to
previous year for Companies.
This represents long term finance and mark-up there on waived by KASB Bank Limited on settlement in accordance with a restructuring
arrangement. See note 9.1.
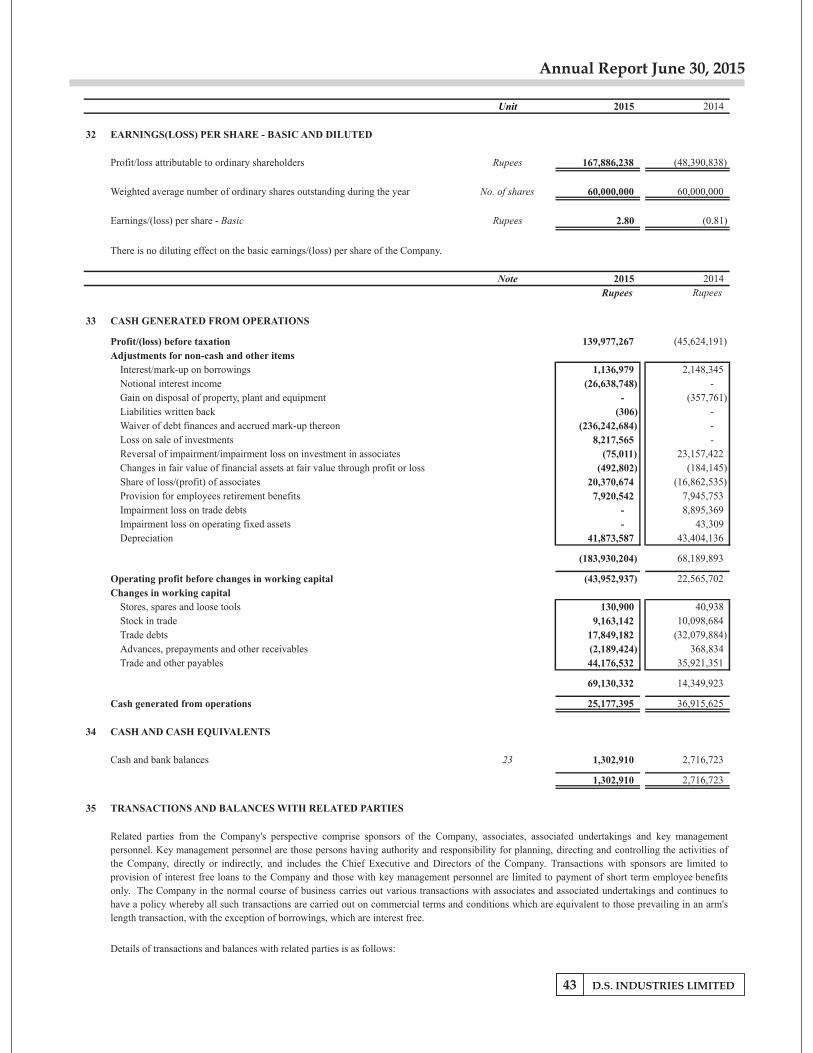
Annual Report June 30, 2015
D.S. INDUSTRIES LIMITED43
Unit 2015 2014
32 EARNINGS(LOSS) PER SHARE - BASIC AND DILUTED
Profit/loss attributable to ordinary shareholders Rupees 167,886,238
(48,390,838)
Weighted average number of ordinary shares outstanding during the year No. of shares 60,000,000
60,000,000
Earnings/(loss) per share - Basic Rupees 2.80
(0.81)
There is no diluting effect on the basic earnings/(loss) per share of the Company.
Note 2015 2014
Rupees Rupees
33 CASH GENERATED FROM OPERATIONS
Profit/(loss) before taxation 139,977,267
(45,624,191)
Adjustments for non-cash and other items
Interest/mark-up on borrowings 1,136,979
2,148,345
Notional interest income (26,638,748)
-
Gain on disposal of property, plant and equipment - (357,761)
Liabilities written back (306) -
Waiver of debt finances and accrued mark-up thereon (236,242,684) -
Loss on sale of investments 8,217,565 -
Reversal of impairment/impairment loss on investment in associates (75,011) 23,157,422
Changes in fair value of financial assets at fair value through profit or loss (492,802) (184,145)
Share of loss/(profit) of associates 20,370,674 (16,862,535)
Provision for employees retirement benefits 7,920,542 7,945,753
Impairment loss on trade debts - 8,895,369
Impairment loss on operating fixed assets - 43,309
Depreciation 41,873,587 43,404,136
(183,930,204) 68,189,893
Operating profit before changes in working capital (43,952,937) 22,565,702 Changes in working capital
Stores, spares and loose tools 130,900 40,938 Stock in trade 9,163,142 10,098,684 Trade debts 17,849,182 (32,079,884) Advances, prepayments and other receivables (2,189,424) 368,834 Trade and other payables 44,176,532
35,921,351
69,130,332
14,349,923
Cash generated from operations 25,177,395
36,915,625
34 CASH AND CASH EQUIVALENTS
Cash and bank balances 23 1,302,910
2,716,723
1,302,910
2,716,723
35 TRANSACTIONS AND BALANCES WITH RELATED PARTIES
Details of transactions and balances with related parties is as follows:
Related parties from the Company's perspective comprise sponsors of the Company, associates, associated undertakings and key management
personnel. Key management personnel are those persons having authority and responsibility for planning, directing and controlling the activities of
the Company, directly or indirectly, and includes the Chief Executive and Directors of the Company. Transactions with sponsors are limited to
provision of interest free loans to the Company and those with key management personnel are limited to payment of short term employee benefits
only. The Company in the normal course of business carries out various transactions with associates and associated undertakings and continues to
have a policy whereby all such transactions are carried out on commercial terms and conditions which are equivalent to those prevailing in an arm's
length transaction, with the exception of borrowings, which are interest free.
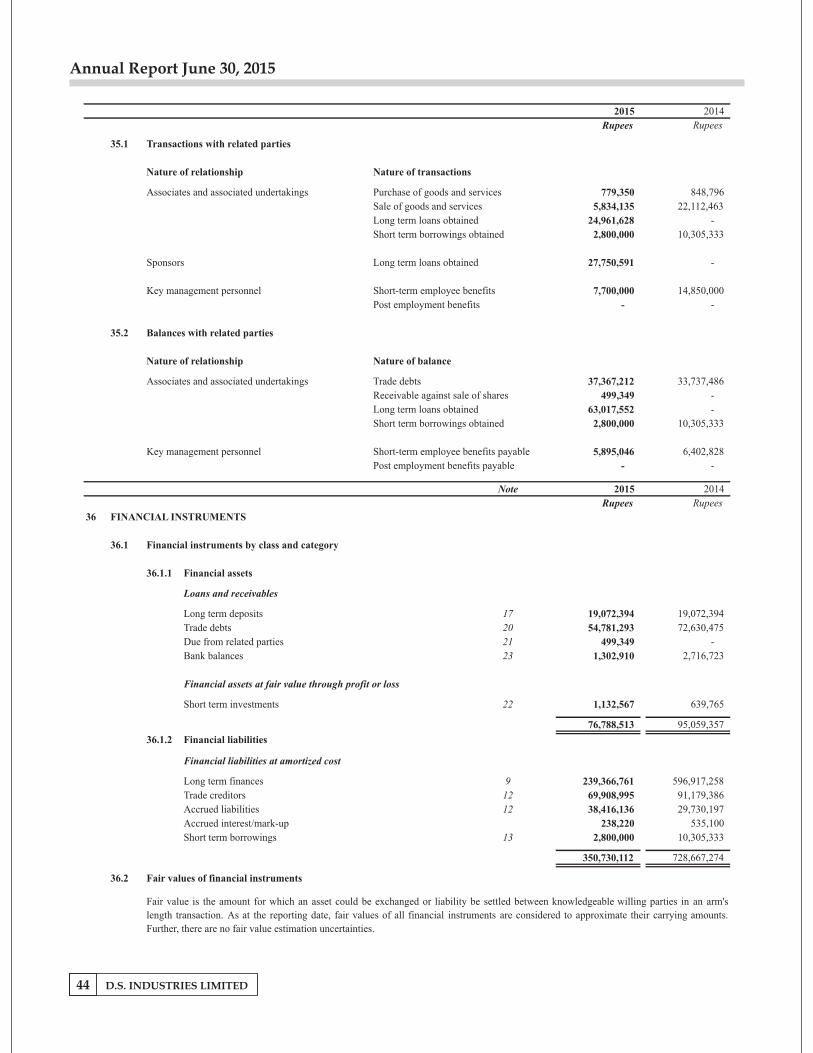
Annual Report June 30, 2015
D.S. INDUSTRIES LIMITED44
2015 2014
Rupees Rupees
35.1 Transactions with related parties
Nature of relationship Nature of transactions
Associates and associated undertakings Purchase of goods and services 779,350
848,796
Sale of goods and services 5,834,135
22,112,463
Long term loans obtained 24,961,628
-
Short term borrowings obtained 2,800,000
10,305,333
Sponsors Long term loans obtained 27,750,591
-
Key management personnel Short-term employee benefits 7,700,000
14,850,000
Post employment benefits -
-
35.2 Balances with related parties
Nature of relationship Nature of balance
Associates and associated undertakings Trade debts 37,367,212
33,737,486
Receivable against sale of shares 499,349
-
Long term loans obtained 63,017,552 -
Short term borrowings obtained 2,800,000 10,305,333
Key management personnel Short-term employee benefits payable 5,895,046 6,402,828
Post employment benefits payable - -
Note 2015 2014
Rupees Rupees
36 FINANCIAL INSTRUMENTS
36.1 Financial instruments by class and category
36.1.1 Financial assets
Loans and receivables
Long term deposits 17 19,072,394 19,072,394 Trade debts 20 54,781,293 72,630,475 Due from related parties 21 499,349
-
Bank balances 23 1,302,910
2,716,723
Financial assets at fair value through profit or loss
Short term investments 22 1,132,567
639,765
76,788,513
95,059,357
36.1.2 Financial liabilities
Financial liabilities at amortized cost
Long term finances 9 239,366,761
596,917,258 Trade creditors 12 69,908,995
91,179,386
Accrued liabilities 12 38,416,136
29,730,197 Accrued interest/mark-up 238,220
535,100
Short term borrowings 13 2,800,000
10,305,333
350,730,112
728,667,274
36.2 Fair values of financial instruments
Fair value is the amount for which an asset could be exchanged or liability be settled between knowledgeable willing parties in an arm's
length transaction. As at the reporting date, fair values of all financial instruments are considered to approximate their carrying amounts.
Further, there are no fair value estimation uncertainties.
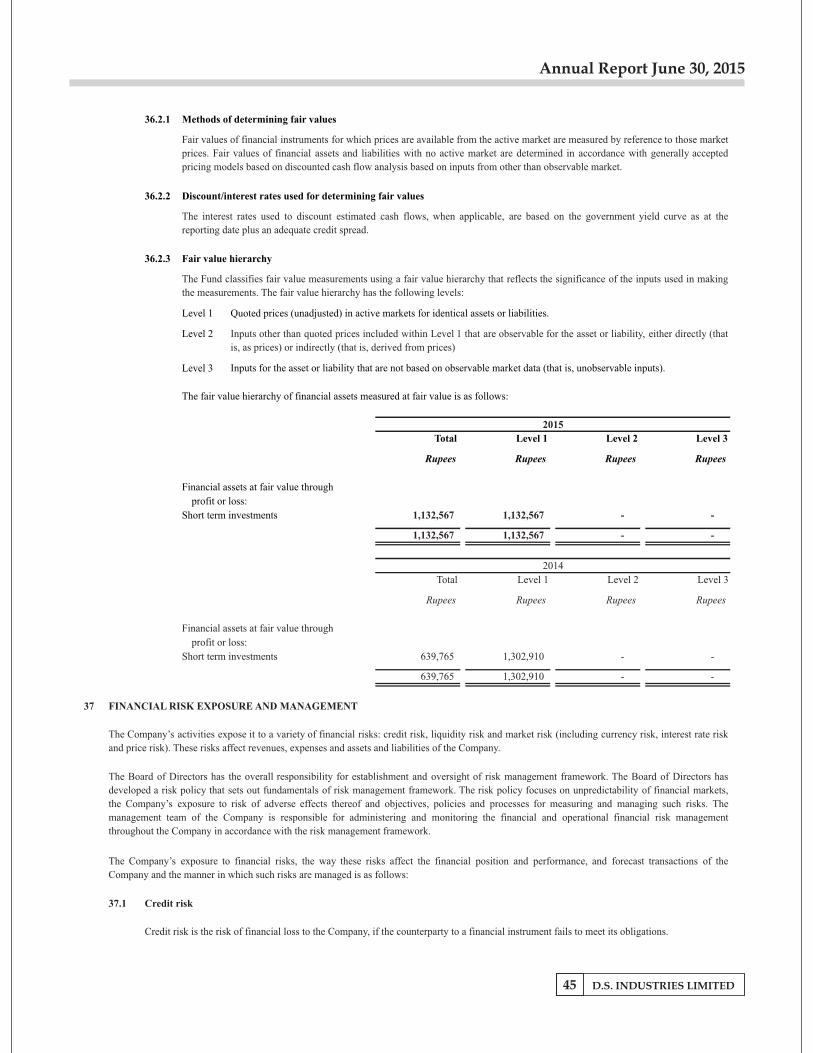
Annual Report June 30, 2015
D.S. INDUSTRIES LIMITED45
36.2.1 Methods of determining fair values
36.2.2 Discount/interest rates used for determining fair values
36.2.3 Fair value hierarchy
Level 1 Quoted prices (unadjusted) in active markets for identical assets or liabilities.
Level 2
Level 3 Inputs for the asset or liability that are not based on observable market data (that is, unobservable inputs).
The fair value hierarchy of financial assets measured at fair value is as follows:
Total Level 1 Level 2 Level 3
Rupees Rupees Rupees Rupees
Financial assets at fair value through
profit or loss:
Short term investments 1,132,567 1,132,567 - -
1,132,567 1,132,567 - -
Total Level 1 Level 2 Level 3
Rupees Rupees Rupees Rupees
Financial assets at fair value through
profit or loss:
Short term investments 639,765
1,302,910
-
-
639,765
1,302,910
-
-
37 FINANCIAL RISK EXPOSURE AND MANAGEMENT
37.1 Credit risk
The Fund classifies fair value measurements using a fair value hierarchy that reflects the significance of the inputs used in making
the measurements. The fair value hierarchy has the following levels:
Inputs other than quoted prices included within Level 1 that are observable for the asset or liability, either directly (that
is, as prices) or indirectly (that is, derived from prices)
2015
2014
The interest rates used to discount estimated cash flows, when applicable, are based on the government yield curve as at the
reporting date plus an adequate credit spread.
Fair values of financial instruments for which prices are available from the active market are measured by reference to those market
prices. Fair values of financial assets and liabilities with no active market are determined in accordance with generally accepted
pricing models based on discounted cash flow analysis based on inputs from other than observable market.
The Company’s activities expose it to a variety of financial risks: credit risk, liquidity risk and market risk (including currency risk, interest rate risk
and price risk). These risks affect revenues, expenses and assets and liabilities of the Company.
The Company’s exposure to financial risks, the way these risks affect the financial position and performance, and forecast transactions of the
Company and the manner in which such risks are managed is as follows:
The Board of Directors has the overall responsibility for establishment and oversight of risk management framework. The Board of Directors has
developed a risk policy that sets out fundamentals of risk management framework. The risk policy focuses on unpredictability of financial markets,
the Company’s exposure to risk of adverse effects thereof and objectives, policies and processes for measuring and managing such risks. The
management team of the Company is responsible for administering and monitoring the financial and operational financial risk management
throughout the Company in accordance with the risk management framework.
Credit risk is the risk of financial loss to the Company, if the counterparty to a financial instrument fails to meet its obligations.
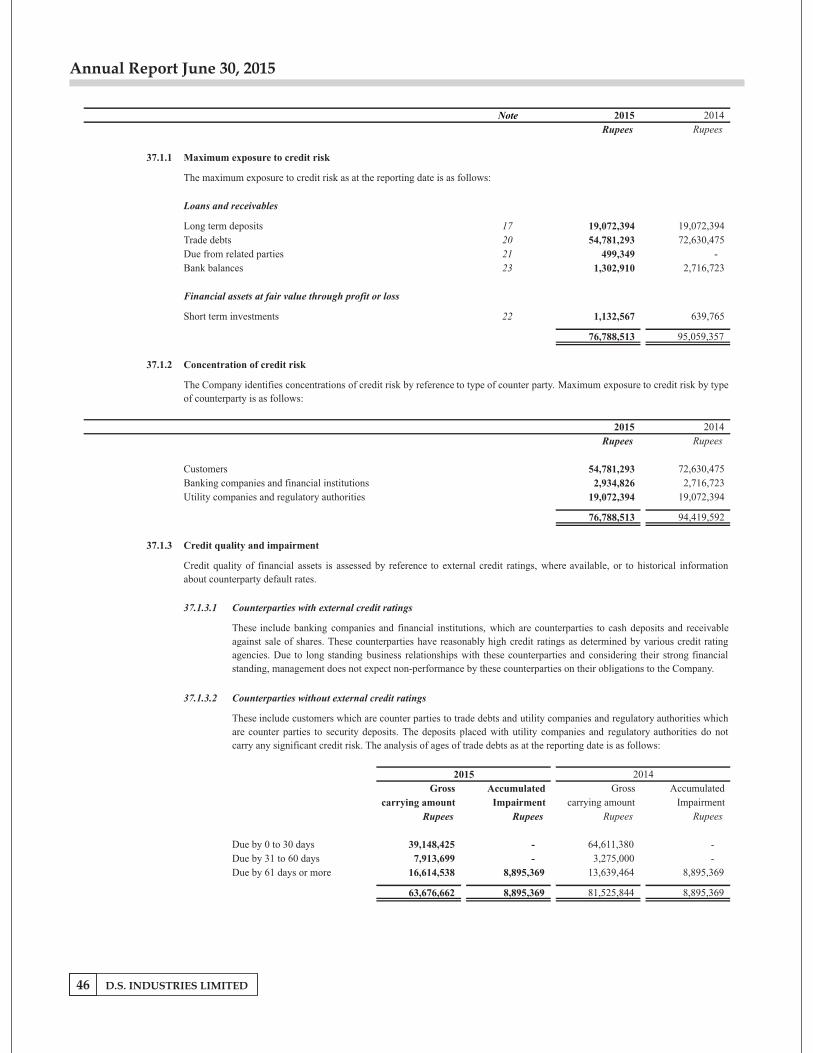
Annual Report June 30, 2015
D.S. INDUSTRIES LIMITED46
Note 2015 2014
Rupees Rupees
37.1.1 Maximum exposure to credit risk
The maximum exposure to credit risk as at the reporting date is as follows:
Loans and receivables
Long term deposits 17 19,072,394 19,072,394
Trade debts 20 54,781,293 72,630,475
Due from related parties 21 499,349 -
Bank balances 23 1,302,910 2,716,723
Financial assets at fair value through profit or loss
Short term investments 22 1,132,567 639,765
76,788,513 95,059,357
37.1.2 Concentration of credit risk
2015 2014
Rupees Rupees
Customers 54,781,293 72,630,475
Banking companies and financial institutions 2,934,826 2,716,723
Utility companies and regulatory authorities 19,072,394 19,072,394
76,788,513 94,419,592
37.1.3 Credit quality and impairment
37.1.3.1 Counterparties with external credit ratings
37.1.3.2 Counterparties without external credit ratings
Gross Accumulated Gross Accumulated
carrying amount Impairment carrying amount Impairment
Rupees Rupees Rupees Rupees
Due by 0 to 30 days 39,148,425
-
64,611,380
-
Due by 31 to 60 days 7,913,699
-
3,275,000
-
Due by 61 days or more 16,614,538
8,895,369
13,639,464
8,895,369
63,676,662
8,895,369
81,525,844
8,895,369
Credit quality of financial assets is assessed by reference to external credit ratings, where available, or to historical information
about counterparty default rates.
These include banking companies and financial institutions, which are counterparties to cash deposits and receivable
against sale of shares. These counterparties have reasonably high credit ratings as determined by various credit rating
agencies. Due to long standing business relationships with these counterparties and considering their strong financial
standing, management does not expect non-performance by these counterparties on their obligations to the Company.
These include customers which are counter parties to trade debts and utility companies and regulatory authorities which
are counter parties to security deposits. The deposits placed with utility companies and regulatory authorities do not
carry any significant credit risk. The analysis of ages of trade debts as at the reporting date is as follows:
20142015
The Company identifies concentrations of credit risk by reference to type of counter party. Maximum exposure to credit risk by type
of counterparty is as follows:
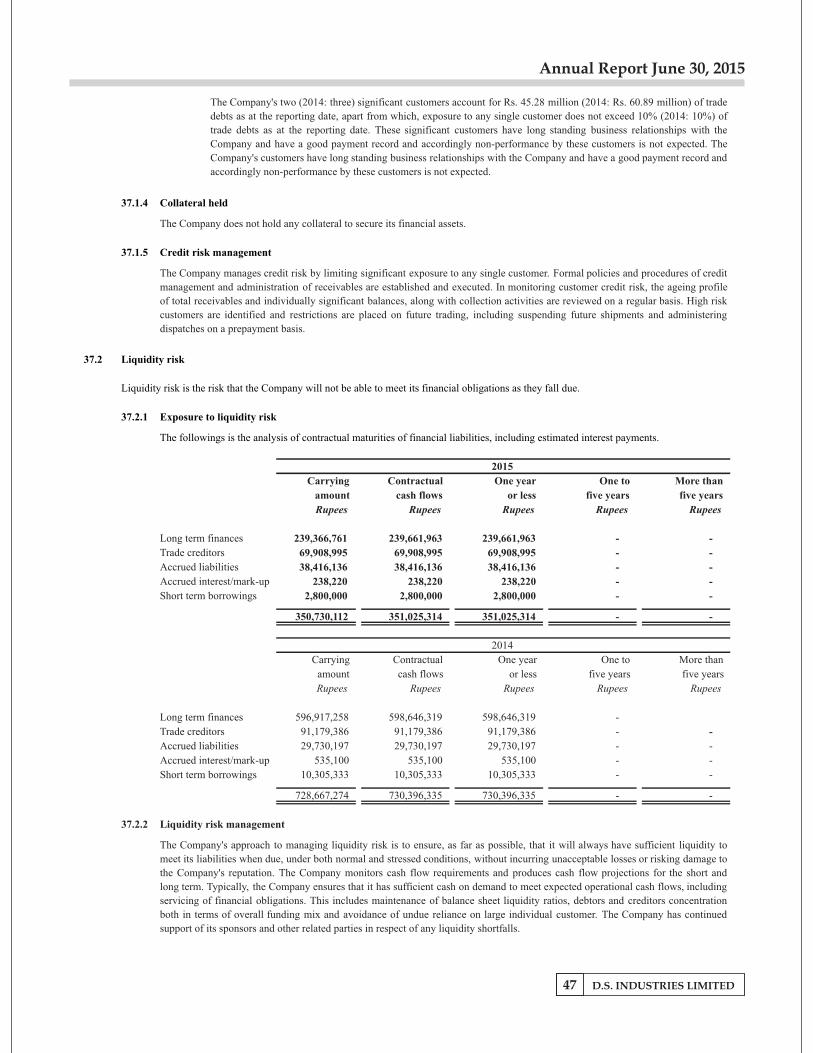
Annual Report June 30, 2015
D.S. INDUSTRIES LIMITED47
37.1.4 Collateral held
37.1.5 Credit risk management
37.2 Liquidity risk
Liquidity risk is the risk that the Company will not be able to meet its financial obligations as they fall due.
37.2.1 Exposure to liquidity risk
The followings is the analysis of contractual maturities of financial liabilities, including estimated interest payments.
Carrying Contractual One year One to More than
amount cash flows or less five years five years
Rupees Rupees Rupees Rupees Rupees
Long term finances 239,366,761 239,661,963 239,661,963 - - Trade creditors 69,908,995 69,908,995 69,908,995 - - Accrued liabilities 38,416,136 38,416,136 38,416,136 - - Accrued interest/mark-up 238,220 238,220 238,220 - - Short term borrowings 2,800,000 2,800,000 2,800,000 - -
350,730,112 351,025,314 351,025,314 - -
Carrying Contractual One year One to More than
amount cash flows or less five years five years
Rupees Rupees Rupees Rupees Rupees
Long term finances 596,917,258
598,646,319
598,646,319
-
Trade creditors 91,179,386
91,179,386
91,179,386
-
- Accrued liabilities 29,730,197
29,730,197
29,730,197
-
-
Accrued interest/mark-up 535,100
535,100
535,100
-
- Short term borrowings 10,305,333
10,305,333
10,305,333
-
-
728,667,274
730,396,335
730,396,335
-
-
37.2.2 Liquidity risk management
The Company manages credit risk by limiting significant exposure to any single customer. Formal policies and procedures of credit
management and administration of receivables are established and executed. In monitoring customer credit risk, the ageing profile
of total receivables and individually significant balances, along with collection activities are reviewed on a regular basis. High risk
customers are identified and restrictions are placed on future trading, including suspending future shipments and administering
dispatches on a prepayment basis.
The Company's approach to managing liquidity risk is to ensure, as far as possible, that it will always have sufficient liquidity to
meet its liabilities when due, under both normal and stressed conditions, without incurring unacceptable losses or risking damage to
the Company's reputation. The Company monitors cash flow requirements and produces cash flow projections for the short and
long term. Typically, the Company ensures that it has sufficient cash on demand to meet expected operational cash flows, including
servicing of financial obligations. This includes maintenance of balance sheet liquidity ratios, debtors and creditors concentration
both in terms of overall funding mix and avoidance of undue reliance on large individual customer. The Company has continued
support of its sponsors and other related parties in respect of any liquidity shortfalls.
2015
2014
The Company's two (2014: three) significant customers account for Rs. 45.28 million (2014: Rs. 60.89 million) of trade
debts as at the reporting date, apart from which, exposure to any single customer does not exceed 10% (2014: 10%) of
trade debts as at the reporting date. These significant customers have long standing business relationships with the
Company and have a good payment record and accordingly non-performance by these customers is not expected. The
Company's customers have long standing business relationships with the Company and have a good payment record and
accordingly non-performance by these customers is not expected.
The Company does not hold any collateral to secure its financial assets.
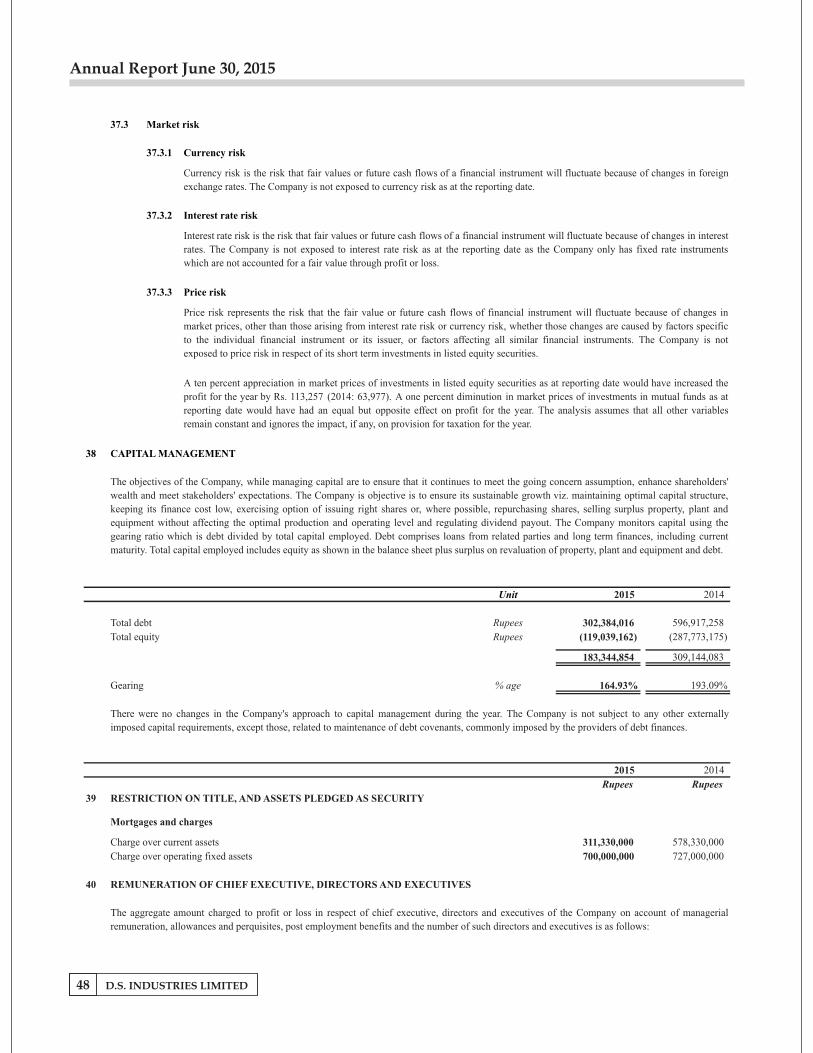
Annual Report June 30, 2015
D.S. INDUSTRIES LIMITED48
37.3 Market risk
37.3.1 Currency risk
37.3.2 Interest rate risk
37.3.3 Price risk
38 CAPITAL MANAGEMENT
Unit 2015 2014
Total debt Rupees 302,384,016 596,917,258 Total equity Rupees (119,039,162) (287,773,175)
183,344,854
309,144,083
Gearing % age 164.93% 193.09%
2015 2014
Rupees Rupees
39 RESTRICTION ON TITLE, AND ASSETS PLEDGED AS SECURITY
Mortgages and charges
Charge over current assets 311,330,000
578,330,000
Charge over operating fixed assets 700,000,000
727,000,000
40 REMUNERATION OF CHIEF EXECUTIVE, DIRECTORS AND EXECUTIVES
A ten percent appreciation in market prices of investments in listed equity securities as at reporting date would have increased the
profit for the year by Rs. 113,257 (2014: 63,977). A one percent diminution in market prices of investments in mutual funds as at
reporting date would have had an equal but opposite effect on profit for the year. The analysis assumes that all other variables
remain constant and ignores the impact, if any, on provision for taxation for the year.
Price risk represents the risk that the fair value or future cash flows of financial instrument will fluctuate because of changes in
market prices, other than those arising from interest rate risk or currency risk, whether those changes are caused by factors specific
to the individual financial instrument or its issuer, or factors affecting all similar financial instruments. The Company is not
exposed to price risk in respect of its short term investments in listed equity securities.
The aggregate amount charged to profit or loss in respect of chief executive, directors and executives of the Company on account of managerial
remuneration, allowances and perquisites, post employment benefits and the number of such directors and executives is as follows:
Interest rate risk is the risk that fair values or future cash flows of a financial instrument will fluctuate because of changes in interest
rates. The Company is not exposed to interest rate risk as at the reporting date as the Company only has fixed rate instruments
which are not accounted for a fair value through profit or loss.
The objectives of the Company, while managing capital are to ensure that it continues to meet the going concern assumption, enhance shareholders'
wealth and meet stakeholders' expectations. The Company is objective is to ensure its sustainable growth viz. maintaining optimal capital structure,
keeping its finance cost low, exercising option of issuing right shares or, where possible, repurchasing shares, selling surplus property, plant and
equipment without affecting the optimal production and operating level and regulating dividend payout. The Company monitors capital using the
gearing ratio which is debt divided by total capital employed. Debt comprises loans from related parties and long term finances, including current
maturity. Total capital employed includes equity as shown in the balance sheet plus surplus on revaluation of property, plant and equipment and debt.
There were no changes in the Company's approach to capital management during the year. The Company is not subject to any other externally
imposed capital requirements, except those, related to maintenance of debt covenants, commonly imposed by the providers of debt finances.
Currency risk is the risk that fair values or future cash flows of a financial instrument will fluctuate because of changes in foreign
exchange rates. The Company is not exposed to currency risk as at the reporting date.
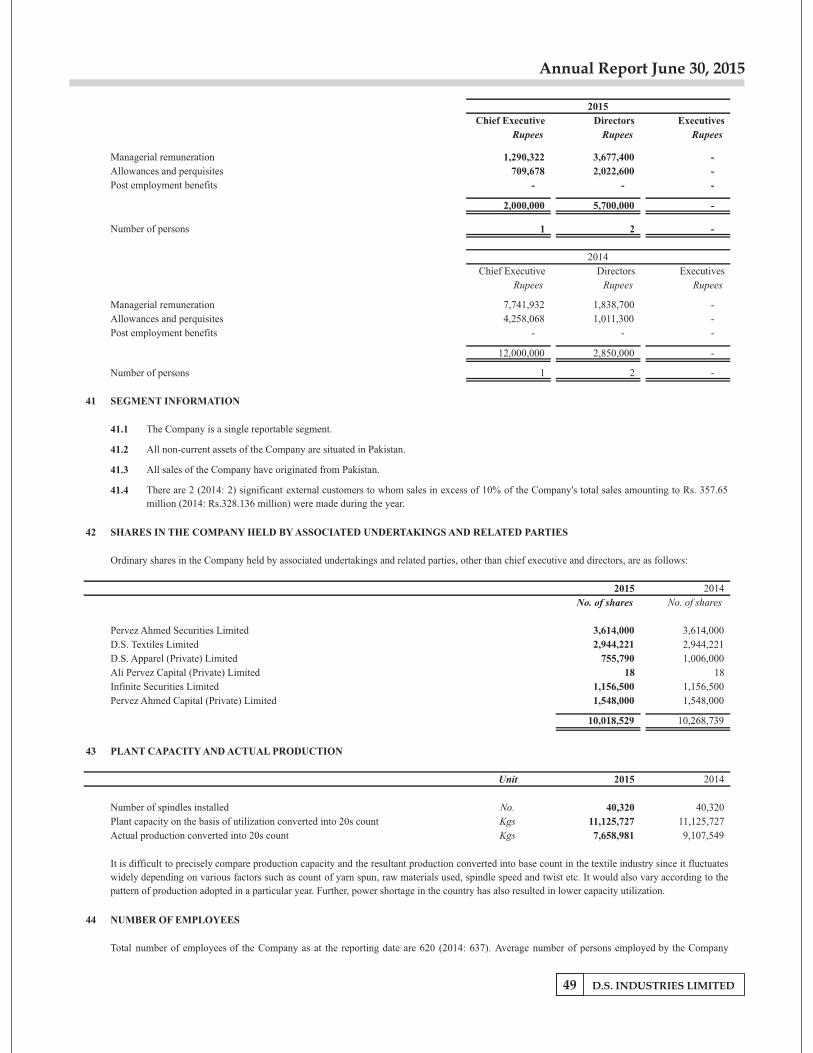
Annual Report June 30, 2015
D.S. INDUSTRIES LIMITED49
Chief Executive Directors Executives
Rupees Rupees Rupees
Managerial remuneration 1,290,322
3,677,400
-
Allowances and perquisites 709,678
2,022,600
-
Post employment benefits -
-
-
2,000,000
5,700,000
-
Number of persons 1
2
-
Chief Executive Directors Executives
Rupees Rupees Rupees
Managerial remuneration 7,741,932
1,838,700
-
Allowances and perquisites 4,258,068
1,011,300
-
Post employment benefits -
-
-
12,000,000
2,850,000
-
Number of persons 1
2
-
41 SEGMENT INFORMATION
41.1 The Company is a single reportable segment.
41.2 All non-current assets of the Company are situated in Pakistan.
41.3 All sales of the Company have originated from Pakistan.
41.4
42 SHARES IN THE COMPANY HELD BY ASSOCIATED UNDERTAKINGS AND RELATED PARTIES
Ordinary shares in the Company held by associated undertakings and related parties, other than chief executive and directors, are as follows:
2015 2014
No. of shares No. of shares
Pervez Ahmed Securities Limited 3,614,000 3,614,000 D.S. Textiles Limited 2,944,221 2,944,221 D.S. Apparel (Private) Limited 755,790 1,006,000 Ali Pervez Capital (Private) Limited 18
18
Infinite Securities Limited 1,156,500
1,156,500
Pervez Ahmed Capital (Private) Limited 1,548,000
1,548,000
10,018,529
10,268,739
43 PLANT CAPACITY AND ACTUAL PRODUCTION
Unit 2015 2014
Number of spindles installed No. 40,320
40,320 Plant capacity on the basis of utilization converted into 20s count Kgs 11,125,727
11,125,727
Actual production converted into 20s count Kgs 7,658,981
9,107,549
44 NUMBER OF EMPLOYEES
2015
2014
It is difficult to precisely compare production capacity and the resultant production converted into base count in the textile industry since it fluctuates
widely depending on various factors such as count of yarn spun, raw materials used, spindle speed and twist etc. It would also vary according to the
pattern of production adopted in a particular year. Further, power shortage in the country has also resulted in lower capacity utilization.
Total number of employees of the Company as at the reporting date are 620 (2014: 637). Average number of persons employed by the Company
There are 2 (2014: 2) significant external customers to whom sales in excess of 10% of the Company's total sales amounting to Rs. 357.65
million (2014: Rs.328.136 million) were made during the year.
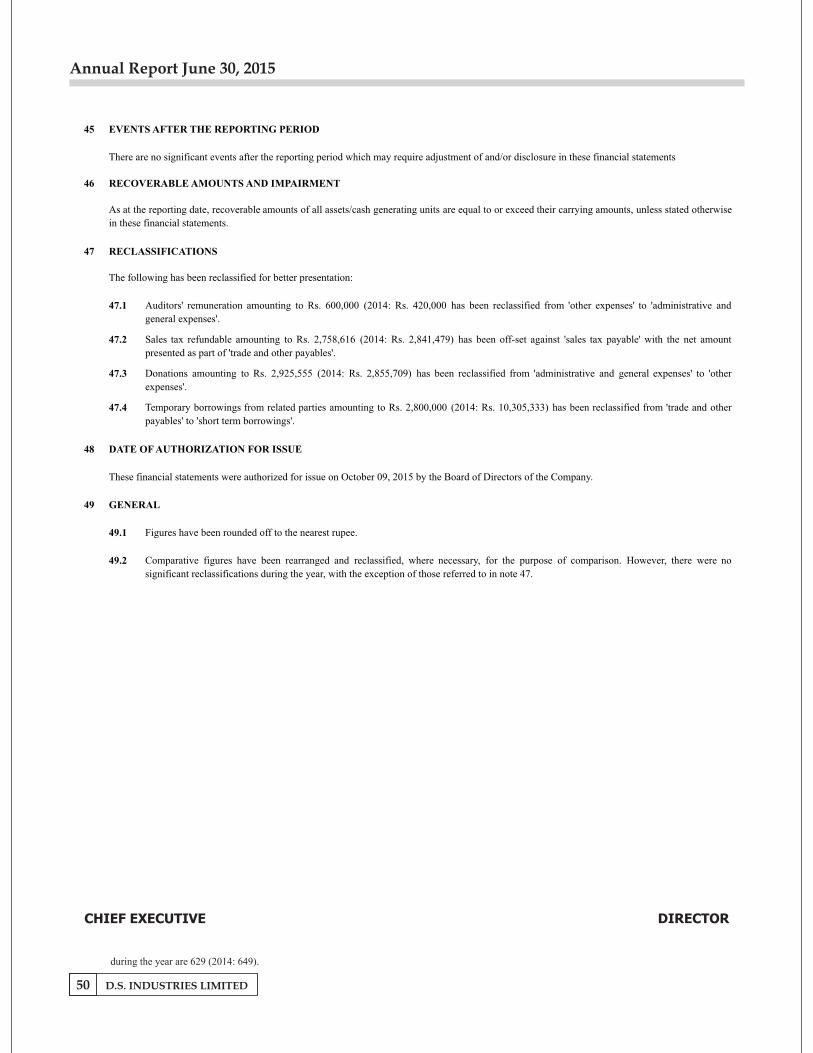
Annual Report June 30, 2015
during the year are 629 (2014: 649).
D.S. INDUSTRIES LIMITED50
45 EVENTS AFTER THE REPORTING PERIOD
46 RECOVERABLE AMOUNTS AND IMPAIRMENT
47 RECLASSIFICATIONS
47.1
47.2
47.3
47.4
48 DATE OF AUTHORIZATION FOR ISSUE
49 GENERAL
49.1 Figures have been rounded off to the nearest rupee.
49.2
Sales tax refundable amounting to Rs. 2,758,616 (2014: Rs. 2,841,479) has been off-set against 'sales tax payable' with the net amount
presented as part of 'trade and other payables'.
Donations amounting to Rs. 2,925,555 (2014: Rs. 2,855,709) has been reclassified from 'administrative and general expenses' to 'other
expenses'.
The following has been reclassified for better presentation:
There are no significant events after the reporting period which may require adjustment of and/or disclosure in these financial statements
Comparative figures have been rearranged and reclassified, where necessary, for the purpose of comparison. However, there were no
significant reclassifications during the year, with the exception of those referred to in note 47.
These financial statements were authorized for issue on October 09, 2015 by the Board of Directors of the Company.
As at the reporting date, recoverable amounts of all assets/cash generating units are equal to or exceed their carrying amounts, unless stated otherwise
in these financial statements.
Auditors' remuneration amounting to Rs. 600,000 (2014: Rs. 420,000 has been reclassified from 'other expenses' to 'administrative and
general expenses'.
Temporary borrowings from related parties amounting to Rs. 2,800,000 (2014: Rs. 10,305,333) has been reclassified from 'trade and other
payables' to 'short term borrowings'.
CHIEF EXECUTIVE DIRECTOR
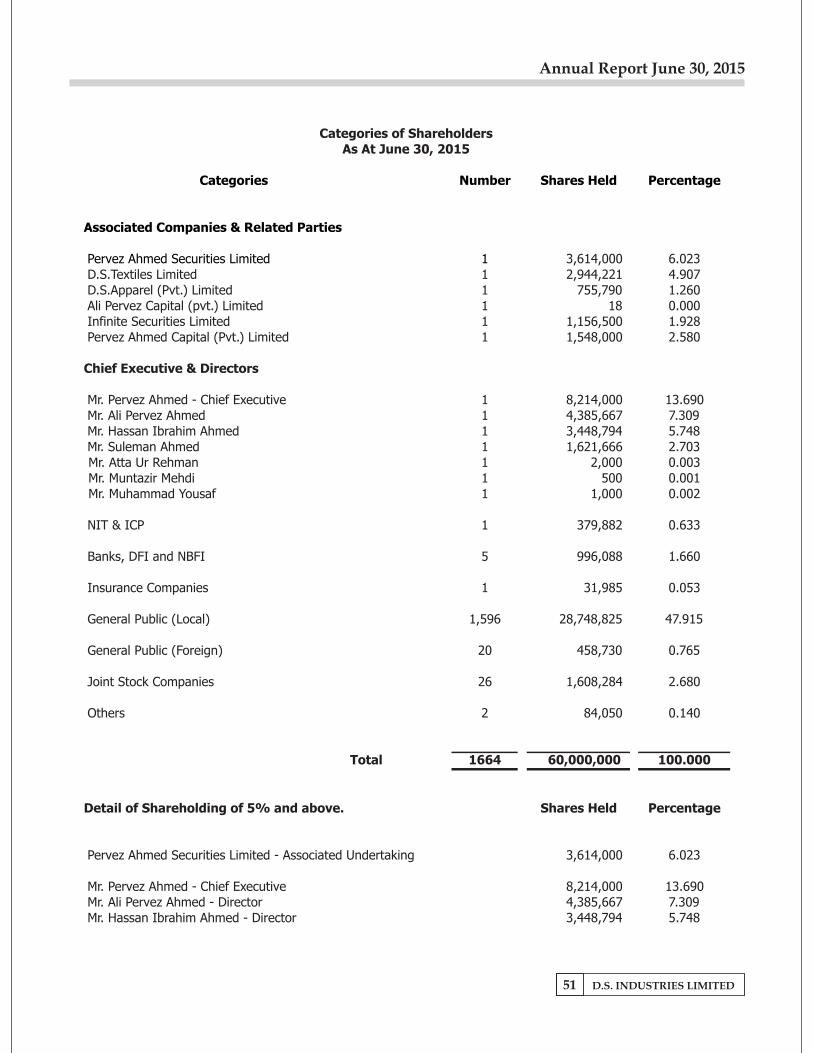
Annual Report June 30, 2015
D.S. INDUSTRIES LIMITED51
Categories Number Shares Held Percentage
Associated Companies & Related Parties
Pervez Ahmed Securities Limited 1 3,614,000
6.023 D.S.Textiles Limited 1 2,944,221
4.907
D.S.Apparel (Pvt.) Limited 1 755,790
1.260 Ali Pervez Capital (pvt.) Limited 1 18
0.000
Infinite Securities Limited 1 1,156,500
1.928 Pervez Ahmed Capital (Pvt.) Limited 1 1,548,000
2.580
Chief Executive & Directors
Mr. Pervez Ahmed - Chief Executive 1 8,214,000 13.690 Mr. Ali Pervez Ahmed 1 4,385,667 7.309 Mr. Hassan Ibrahim Ahmed 1 3,448,794 5.748 Mr. Suleman Ahmed 1 1,621,666 2.703Mr. Atta Ur Rehman 1 2,000 0.003Mr. Muntazir Mehdi 1 500 0.001Mr. Muhammad Yousaf 1 1,000 0.002
NIT & ICP 1 379,882 0.633
Banks, DFI and NBFI 5 996,088 1.660
Insurance Companies 1 31,985 0.053
General Public (Local) 1,596 28,748,825 47.915
General Public (Foreign) 20 458,730 0.765
Joint Stock Companies 26 1,608,284
2.680
Others 2 84,050
0.140
Total 1664 60,000,000
100.000
Detail of Shareholding of 5% and above. Shares Held Percentage
Pervez Ahmed Securities Limited - Associated Undertaking 3,614,000
6.023
Mr. Pervez Ahmed - Chief Executive 8,214,000
13.690 Mr. Ali Pervez Ahmed - Director 4,385,667
7.309
Mr. Hassan Ibrahim Ahmed - Director 3,448,794
5.748
Categories of ShareholdersAs At June 30, 2015
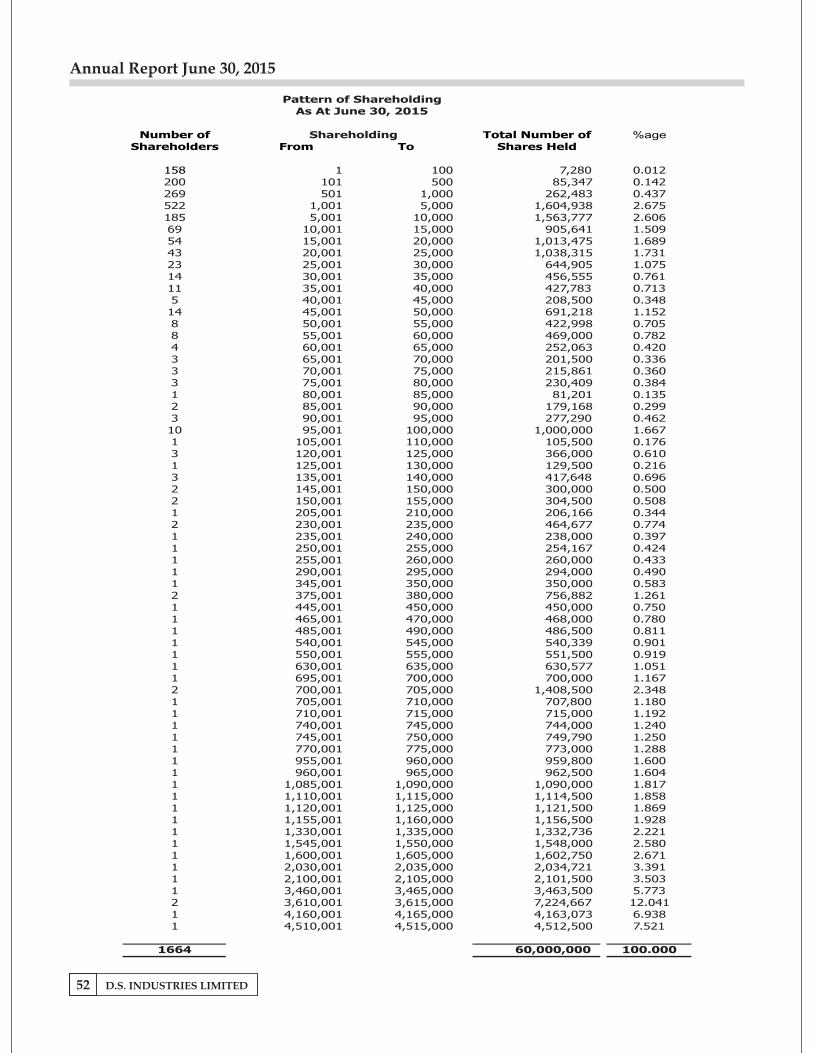
Annual Report June 30, 2015
D.S. INDUSTRIES LIMITED52
Number of Total Number of %ageShareholders From To Shares Held
158 1 100 7,280 0.012200 101 500 85,347 0.142269 501 1,000 262,483 0.437522 1,001 5,000 1,604,938 2.675185 5,001
10,000
1,563,777
2.60669 10,001
15,000
905,641
1.50954 15,001
20,000
1,013,475
1.68943 20,001
25,000
1,038,315
1.73123 25,001
30,000
644,905
1.07514 30,001
35,000
456,555
0.76111 35,001
40,000
427,783
0.7135 40,001
45,000
208,500
0.34814 45,001
50,000
691,218
1.1528 50,001
55,000
422,998
0.7058 55,001
60,000
469,000
0.7824 60,001
65,000
252,063
0.4203 65,001
70,000
201,500
0.3363 70,001
75,000
215,861
0.3603 75,001
80,000
230,409
0.3841 80,001
85,000
81,201
0.1352 85,001
90,000
179,168
0.2993 90,001
95,000
277,290
0.46210 95,001
100,000
1,000,000
1.6671 105,001
110,000
105,500
0.1763 120,001
125,000
366,000
0.6101 125,001
130,000
129,500
0.2163 135,001
140,000
417,648
0.6962 145,001
150,000
300,000
0.500
2 150,001
155,000
304,500
0.5081 205,001 210,000 206,166 0.3442 230,001 235,000 464,677 0.7741 235,001 240,000 238,000 0.3971 250,001
255,000
254,167
0.424
1 255,001
260,000
260,000
0.433
1 290,001
295,000
294,000
0.4901 345,001
350,000
350,000
0.5832 375,001
380,000
756,882
1.2611 445,001
450,000
450,000
0.7501 465,001
470,000
468,000
0.7801 485,001
490,000
486,500
0.8111 540,001
545,000
540,339
0.9011 550,001
555,000
551,500
0.9191 630,001
635,000
630,577
1.0511 695,001
700,000
700,000
1.1672 700,001
705,000
1,408,500
2.3481 705,001
710,000
707,800
1.1801 710,001
715,000
715,000
1.1921 740,001
745,000
744,000
1.2401 745,001
750,000
749,790
1.2501 770,001
775,000
773,000
1.2881 955,001
960,000
959,800
1.6001 960,001
965,000
962,500
1.6041 1,085,001
1,090,000
1,090,000
1.8171 1,110,001
1,115,000
1,114,500
1.8581 1,120,001
1,125,000
1,121,500
1.8691 1,155,001
1,160,000
1,156,500
1.9281 1,330,001
1,335,000
1,332,736
2.2211 1,545,001 1,550,000 1,548,000 2.5801 1,600,001 1,605,000 1,602,750 2.6711 2,030,001 2,035,000 2,034,721 3.3911 2,100,001 2,105,000 2,101,500 3.5031 3,460,001 3,465,000 3,463,500 5.7732 3,610,001 3,615,000 7,224,667 12.0411 4,160,001 4,165,000 4,163,073 6.9381 4,510,001 4,515,000 4,512,500 7.521
1664 60,000,000 100.000
Pattern of ShareholdingAs At June 30, 2015
Shareholding
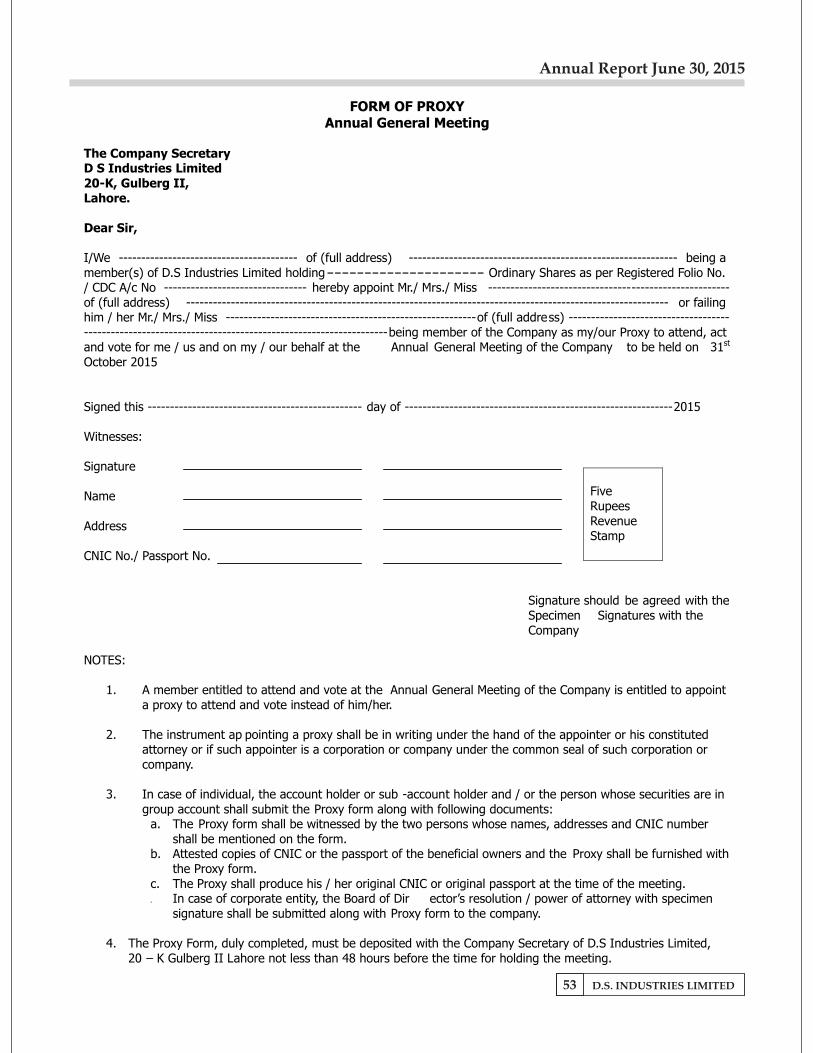
Annual Report June 30, 2015
D.S. INDUSTRIES LIMITED53
FORM OF PROXYAnnual General Meeting
The Company Secretary
D S Industries Limited
20-K, Gulberg II,
Lahore.
Dear Sir,
I/We ----------------------------------------
of (full address) ------------------------------------------------------------
being a member(s) of D.S Industries Limited holding ---------------------
Ordinary Shares as per Registered Folio No. / CDC A/c No --------------------------------
hereby appoint Mr./ Mrs./ Miss ------------------------------------------------------of (full address) ------------------------------------------------------------------------------------------------------------
or failing him / her Mr./ Mrs./ Miss --------------------------------------------------------of (full address) --------------------------------------------------------------------------------------------------------being member of the Company as my/our Proxy to attend, act and vote for me / us and on my / our behalf at the Annual General Meeting of the Company to be held on 31st
October 2015
Signed this ------------------------------------------------ day of ------------------------------------------------------------2015
Witnesses:
Signature
Name
Address
CNIC No./ Passport No.
Signature should be agreed with the Specimen Signatures with the Company
NOTES:
1.
A member entitled to attend and vote at the Annual General Meeting of the Company is entitled to appoint a proxy to attend and vote instead of him/her.
2.
The instrument ap pointing a proxy shall be in writing under the hand of the appointer or his constituted attorney or if such appointer is a corporation or company under the common seal of such corporation or company.
3.
In case of individual, the account holder or sub -account holder and / or the person whose securities are in group account shall submit the Proxy form along with following documents:
a.
The Proxy form shall be witnessed by the two persons whose names, addresses and CNIC number shall be mentioned on the form.
b.
Attested copies of CNIC or the passport of the beneficial owners and the Proxy shall be furnished with the Proxy form.
c.
The Proxy shall produce his / her original CNIC or original passport at the time of the meeting.
d.
In case of corporate entity, the Board of Dir ector’s resolution / power of attorney with specimen signature shall be submitted along with Proxy form to the company.
4. The Proxy Form, duly completed, must be deposited with the Company Secretary of D.S Industries Limited,
20 – K Gulberg II Lahore not less than 48 hours before the time for holding the meeting.
Five Rupees Revenue Stamp