Embed Size (px)
Citation preview
DSM in motion: driving focused growth
SRI roadshow presentation 2012
Safe Harbor Statement
Slide 1
This presentation may contain forward-looking statements with respect to DSM’s future(financial) performance and position. Such statements are based on current
expectations, estimates and projections of DSM and information currently available tothe company. DSM cautions readers that such statements involve certain risks and
uncertainties that are difficult to predict and therefore it should be understood thatmany factors can cause actual performance and position to differ materially from these
statements. DSM has no obligation to update the statements contained in thispresentation, unless required by law.
The English language version of this document is leading.
A more comprehensive discussion of the risk factors affecting DSM’s business can befound in the company’s latest Annual Report, which can be found on
the company's corporate website, www.dsm.com
Overview
• Global trends drive sustainability• Strategic progress• Sustainability achievements• Annexes
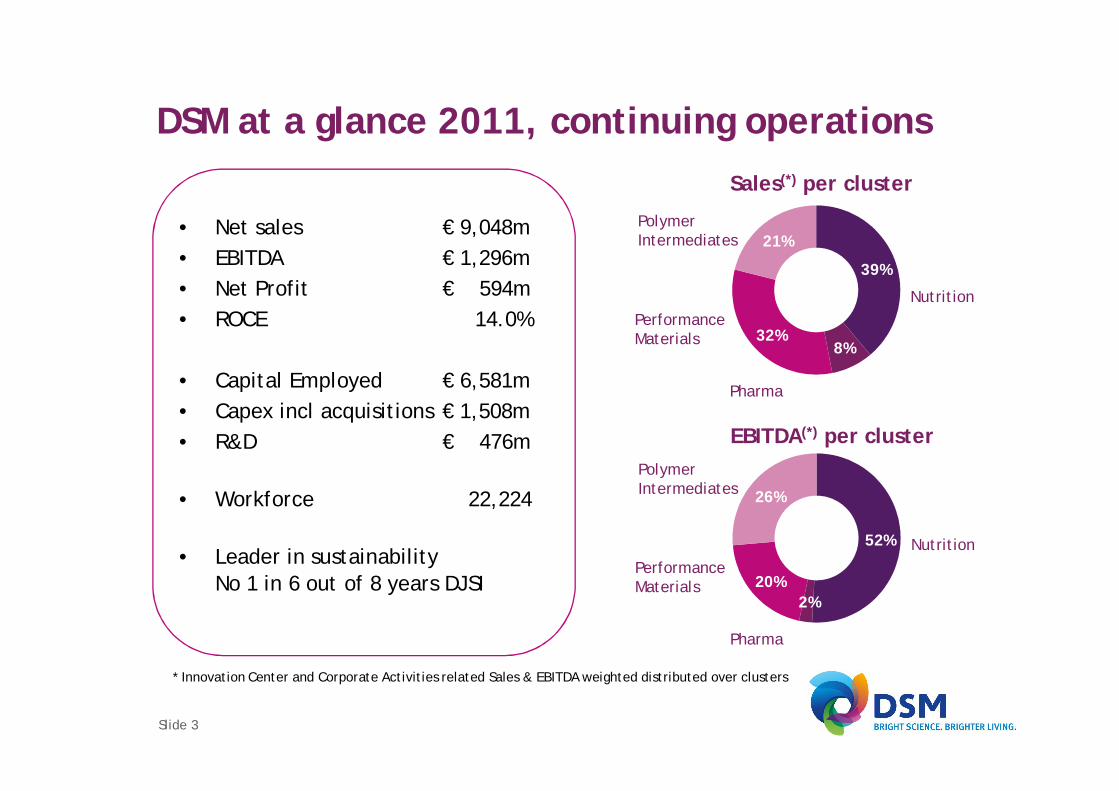
DSM at a glance 2011, continuing operations
• Net sales € 9,048m• EBITDA € 1,296m• Net Profit € 594m• ROCE 14.0%
• Capital Employed € 6,581m• Capex incl acquisitions € 1,508m• R&D € 476m
• Workforce 22,224
• Leader in sustainabilityNo 1 in 6 out of 8 years DJSI
39%
8%32%
21%
Nutrition
Pharma
PolymerIntermediates
PerformanceMaterials
Sales(*) per cluster
52%
2%20%
26%
Nutrition
Pharma
PolymerIntermediates
PerformanceMaterials
EBITDA(*) per cluster
* Innovation Center and Corporate Activities related Sales & EBITDA weighted distributed over clusters
Slide 3
MaterialsNutrition
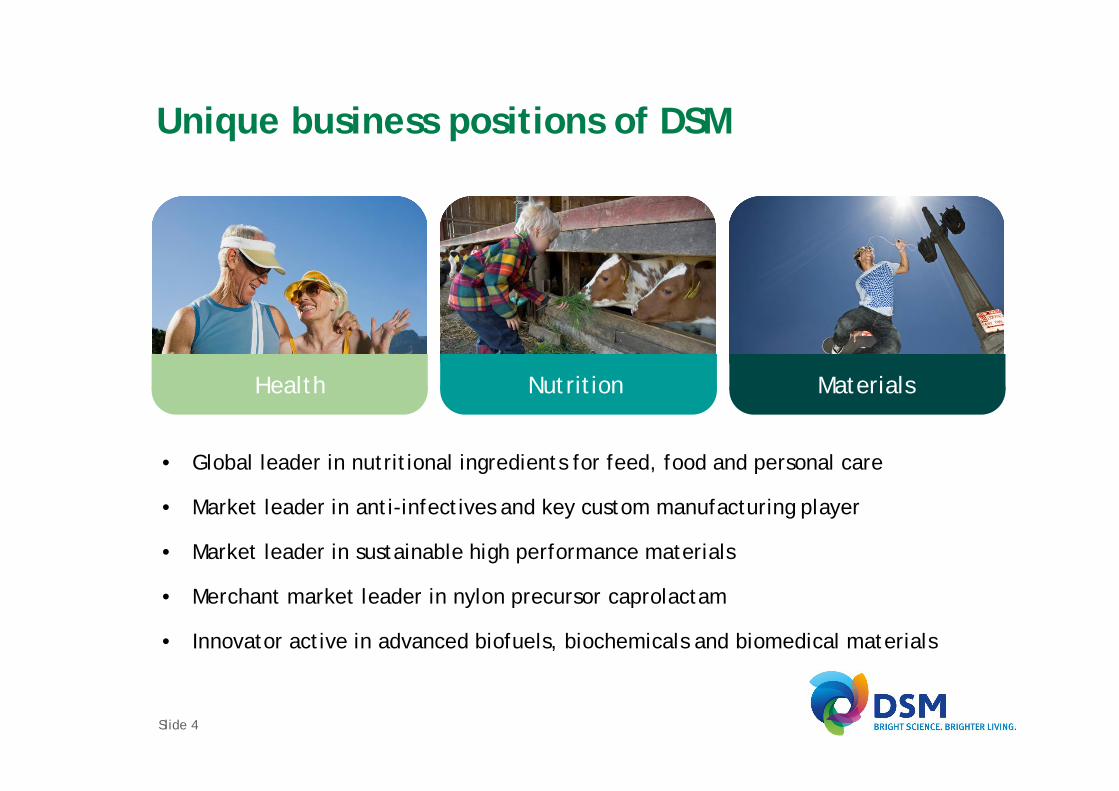
Unique business positions of DSM
• Global leader in nutritional ingredients for feed, food and personal care
• Market leader in anti-infectives and key custom manufacturing player
• Market leader in sustainable high performance materials
• Merchant market leader in nylon precursor caprolactam
• Innovator active in advanced biofuels, biochemicals and biomedical materials
Health
Slide 4
5
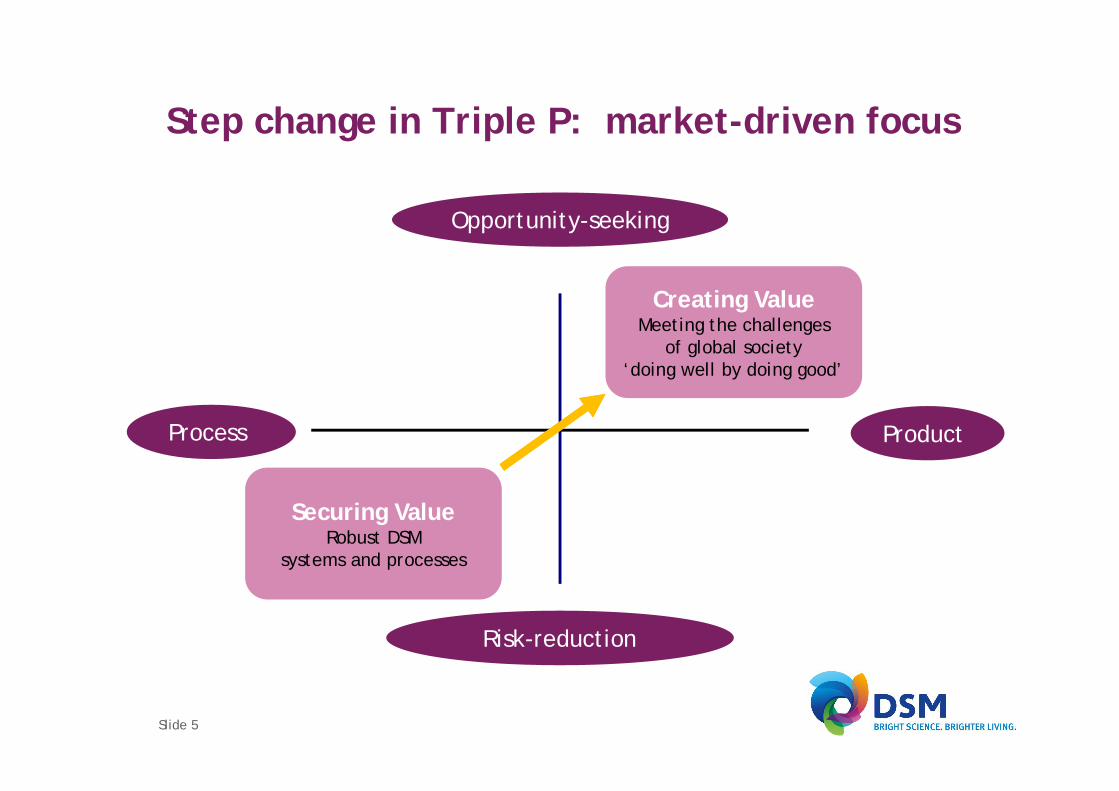
Step change in Triple P: market-driven focus
Opportunity-seeking
Risk-reduction
Process Product
Creating ValueMeeting the challenges
of global society‘doing well by doing good’
Securing ValueRobust DSM
systems and processes
Slide 5
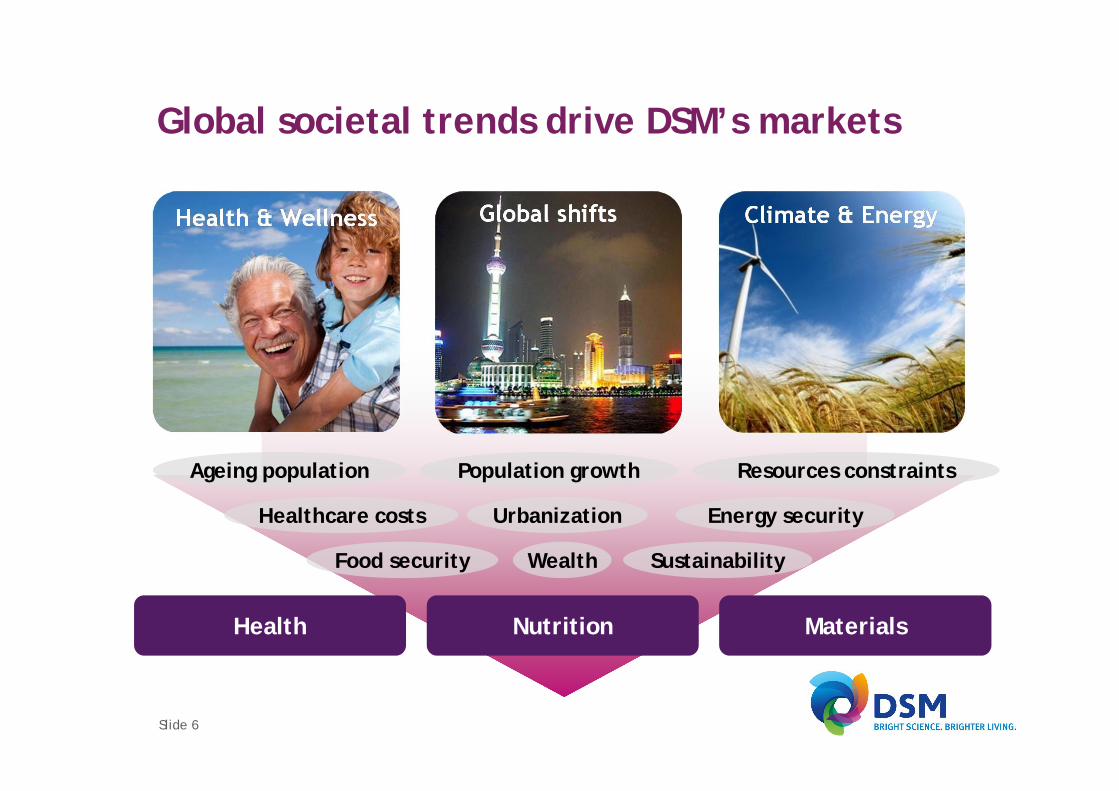
Global societal trends drive DSM’s markets
Population growth
Wealth
Resources constraints
Sustainability
UrbanizationHealthcare costs Energy security
Food security
Ageing population
MaterialsNutritionHealth
Slide 6
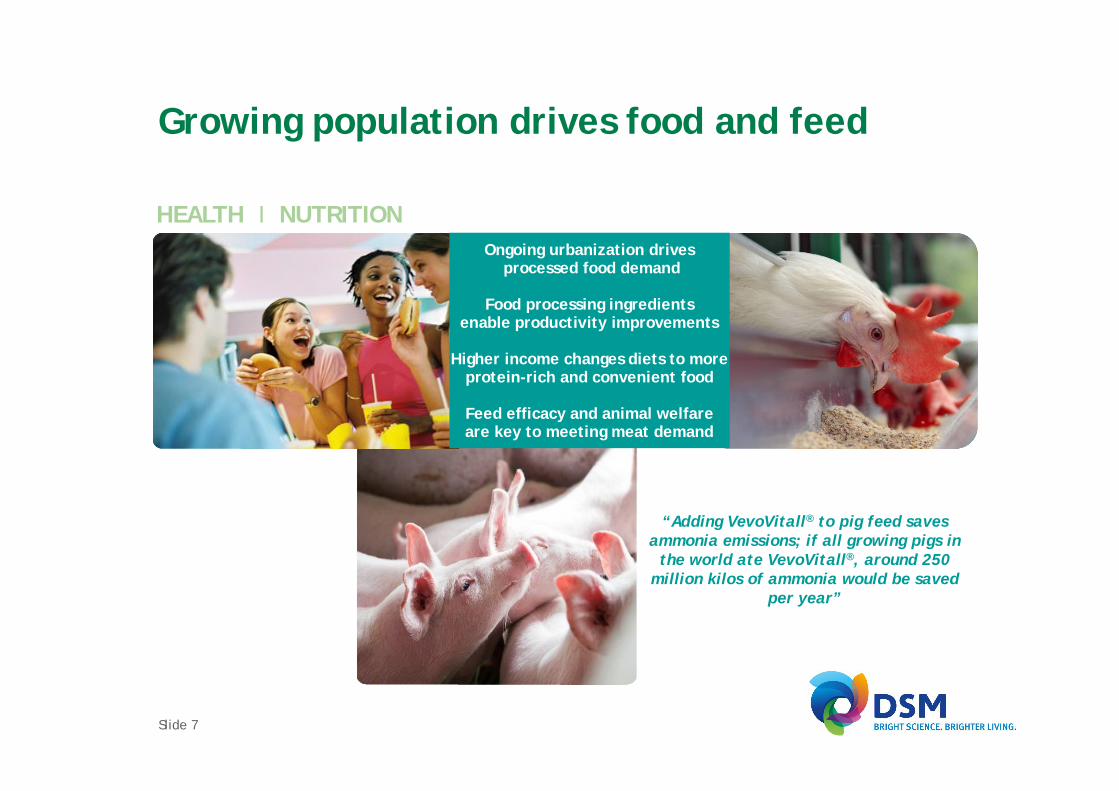
Ongoing urbanization drivesprocessed food demand
Food processing ingredientsenable productivity improvements
Higher income changes diets to moreprotein-rich and convenient food
Feed efficacy and animal welfareare key to meeting meat demand
Growing population drives food and feed
“Adding VevoVitall® to pig feed savesammonia emissions; if all growing pigs in
the world ate VevoVitall®, around 250million kilos of ammonia would be saved
per year”
HEALTH I NUTRITION
Slide 7
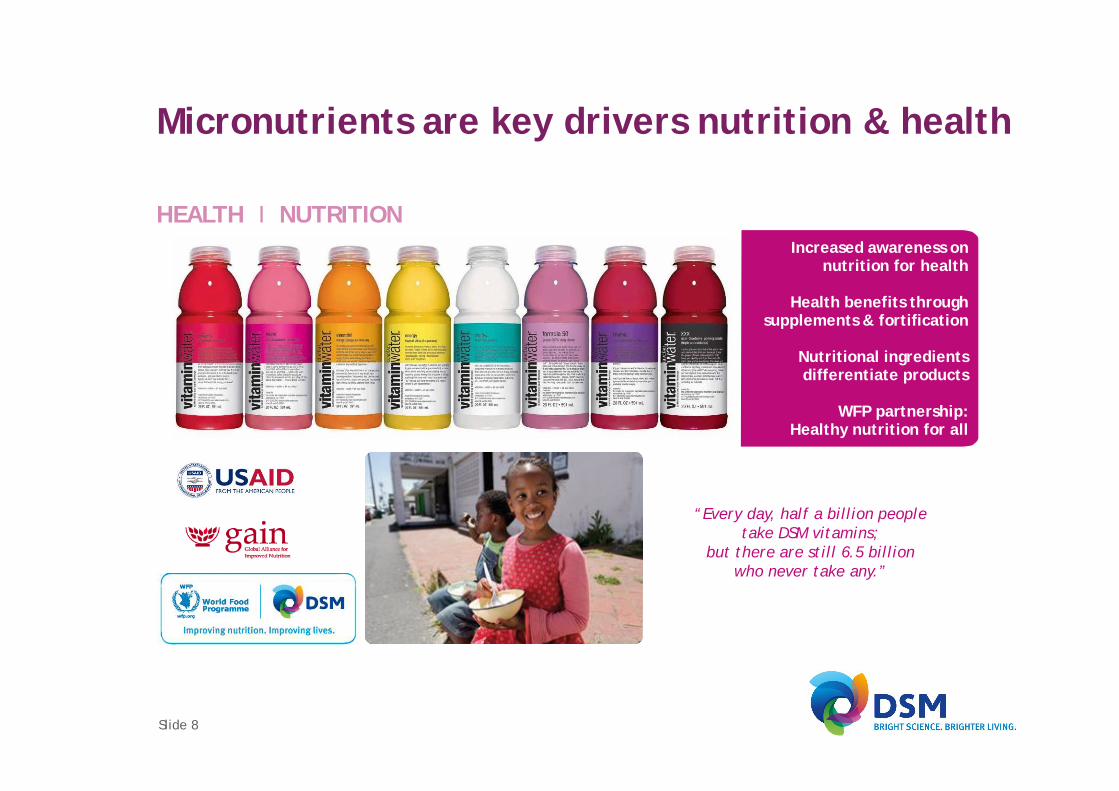
Increased awareness onnutrition for health
Health benefits throughsupplements & fortification
Nutritional ingredientsdifferentiate products
WFP partnership:Healthy nutrition for all
HEALTH I NUTRITION
Micronutrients are key drivers nutrition & health
“Every day, half a billion peopletake DSM vitamins;
but there are still 6.5 billionwho never take any.”
Slide 8
HEALTH I MATERIALS
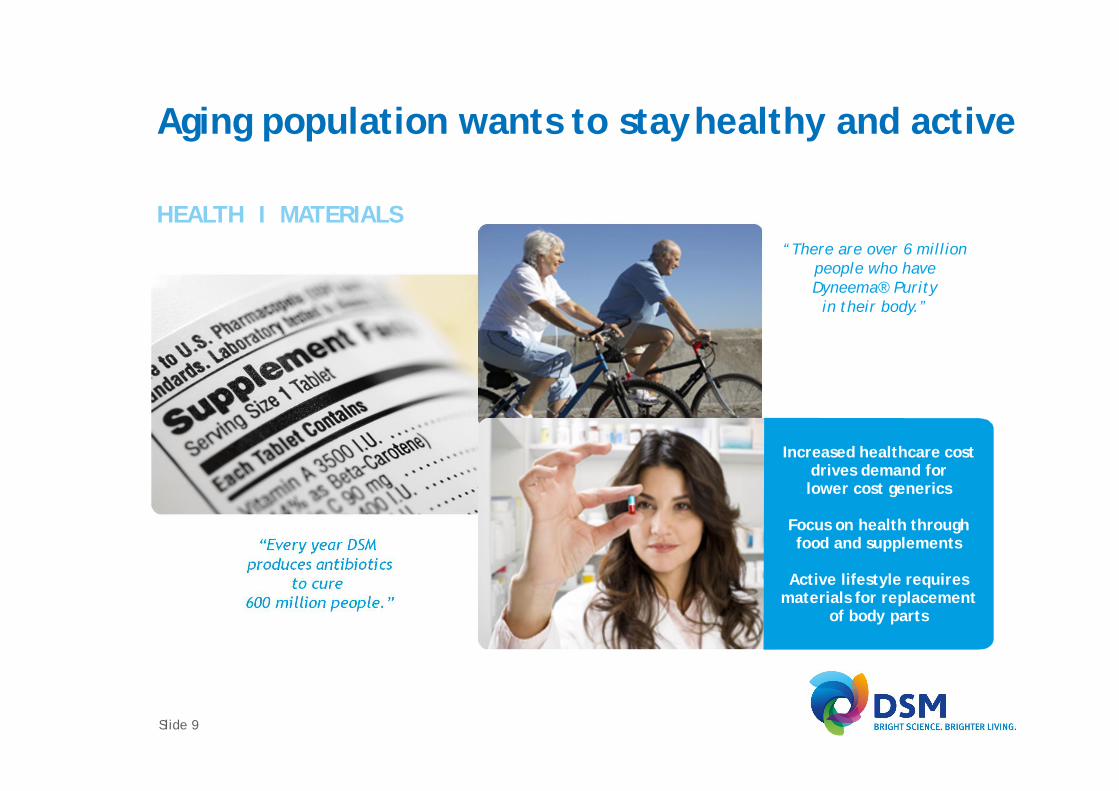
Aging population wants to stayhealthy and active
“Every year DSMproduces antibiotics
to cure600 million people.”
“There are over 6 millionpeople who haveDyneema® Purity
in their body.”
Increased healthcare costdrives demand forlower cost generics
Focus on health throughfood and supplements
Active lifestyle requiresmaterials for replacement
of body parts
Slide 9
HEALTH I NUTRITION I MATERIALS
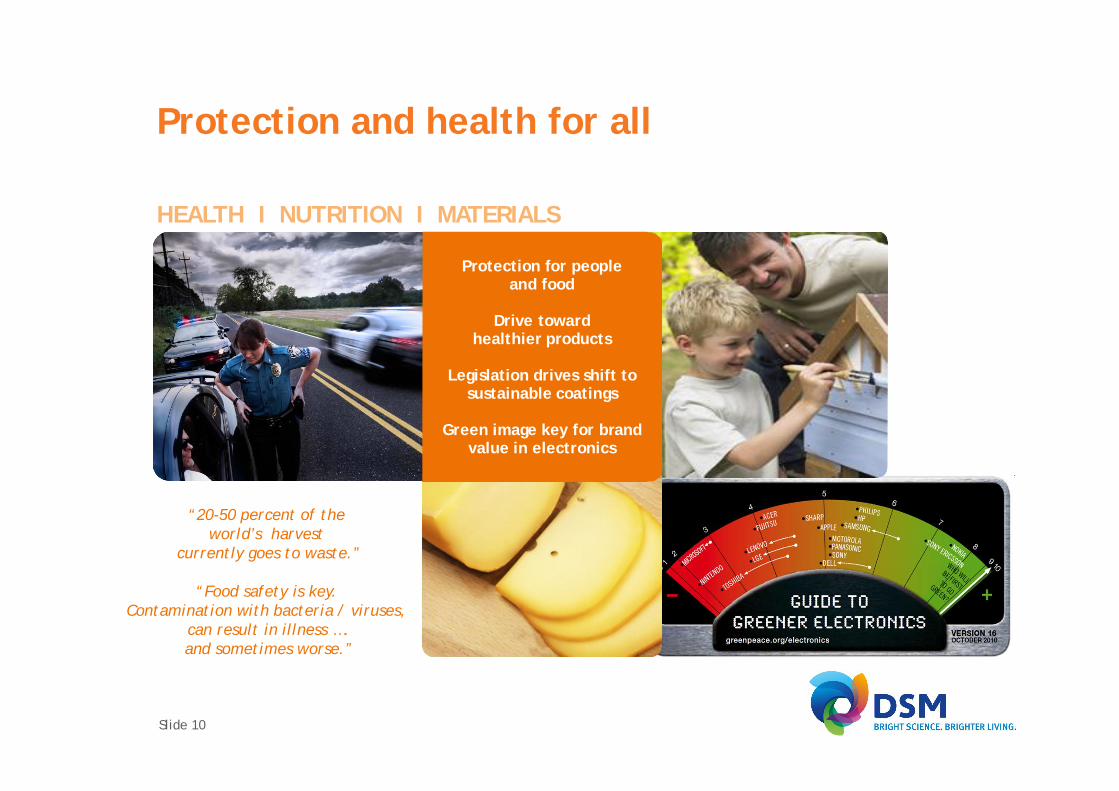
Protection and health for all
“20-50 percent of theworld’s harvest
currently goes to waste.”
“Food safety is key.Contamination with bacteria / viruses,
can result in illness ….and sometimes worse.”
Protection for peopleand food
Drive towardhealthier products
Legislation drives shift tosustainable coatings
Green image key for brandvalue in electronics
Slide 10
MATERIALS
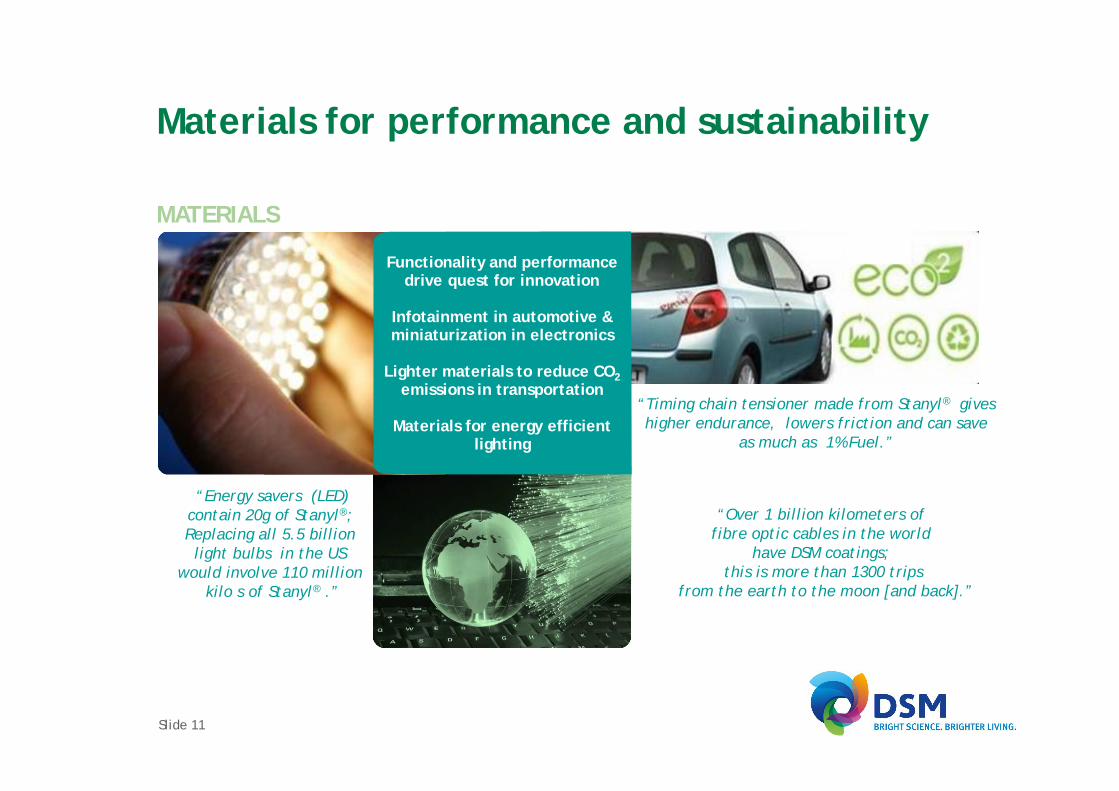
Materials for performance and sustainability
“Energy savers (LED)contain 20g of Stanyl®;Replacing all 5.5 billionlight bulbs in the US
would involve 110 millionkilo s of Stanyl® .”
“Timing chain tensioner made from Stanyl® giveshigher endurance, lowers friction and can save
as much as 1% Fuel.”
“Over 1 billion kilometers offibre optic cables in the world
have DSM coatings;this is more than 1300 trips
from the earth to the moon [and back].”
Functionality and performancedrive quest for innovation
Infotainment in automotive &miniaturization in electronics
Lighter materials to reduce CO2emissions in transportation
Materials for energy efficientlighting
Slide 11
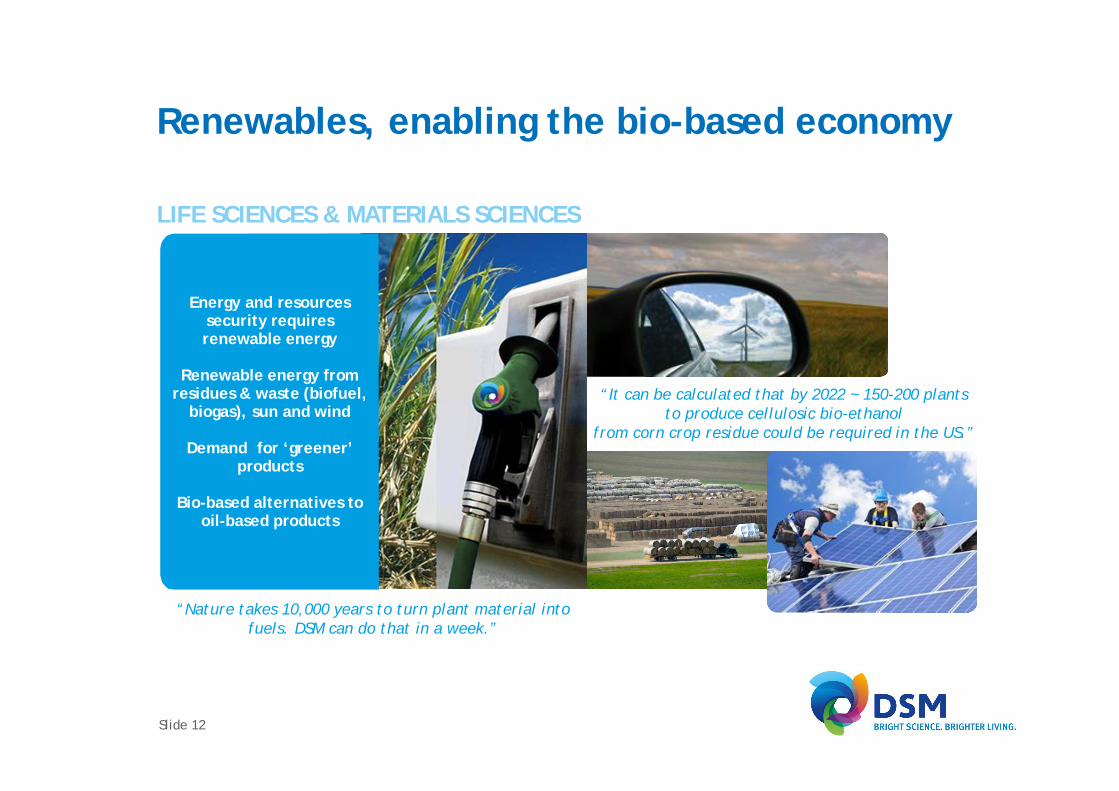
LIFE SCIENCES & MATERIALS SCIENCES
Renewables, enabling the bio-based economy
“Nature takes 10,000 years to turn plant material intofuels. DSM can do that in a week.”
Energy and resourcessecurity requiresrenewable energy
Renewable energy fromresidues & waste (biofuel,
biogas), sun and wind
Demand for ‘greener’products
Bio-based alternatives tooil-based products
“It can be calculated that by 2022 ~ 150-200 plantsto produce cellulosic bio-ethanol
from corn crop residue could be required in the US.”
Slide 12
Overview
• Global trends drive sustainability• Strategic progress• Sustainability achievements• Annexes
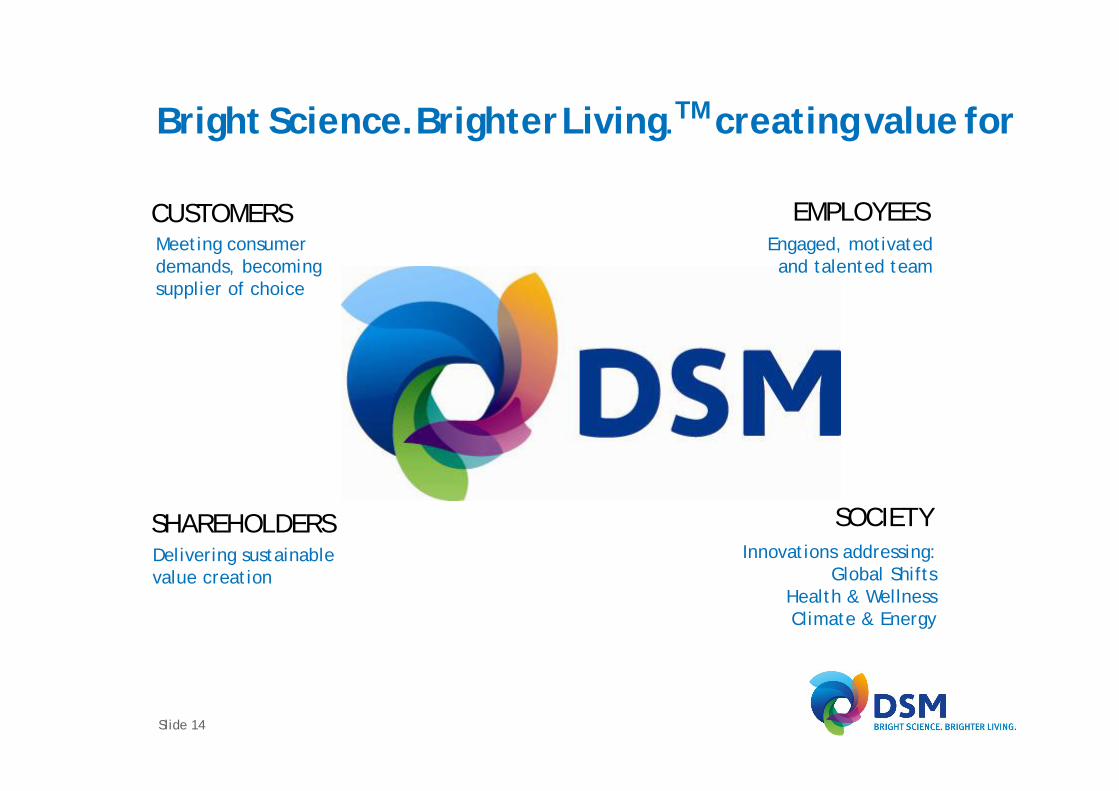
Bright Science.BrighterLiving.TM creating value for
CUSTOMERS EMPLOYEES
SHAREHOLDERS
Meeting consumerdemands, becomingsupplier of choice
Engaged, motivatedand talented team
Delivering sustainablevalue creation
Innovations addressing:Global Shifts
Health & WellnessClimate & Energy
SOCIETY
Slide 14
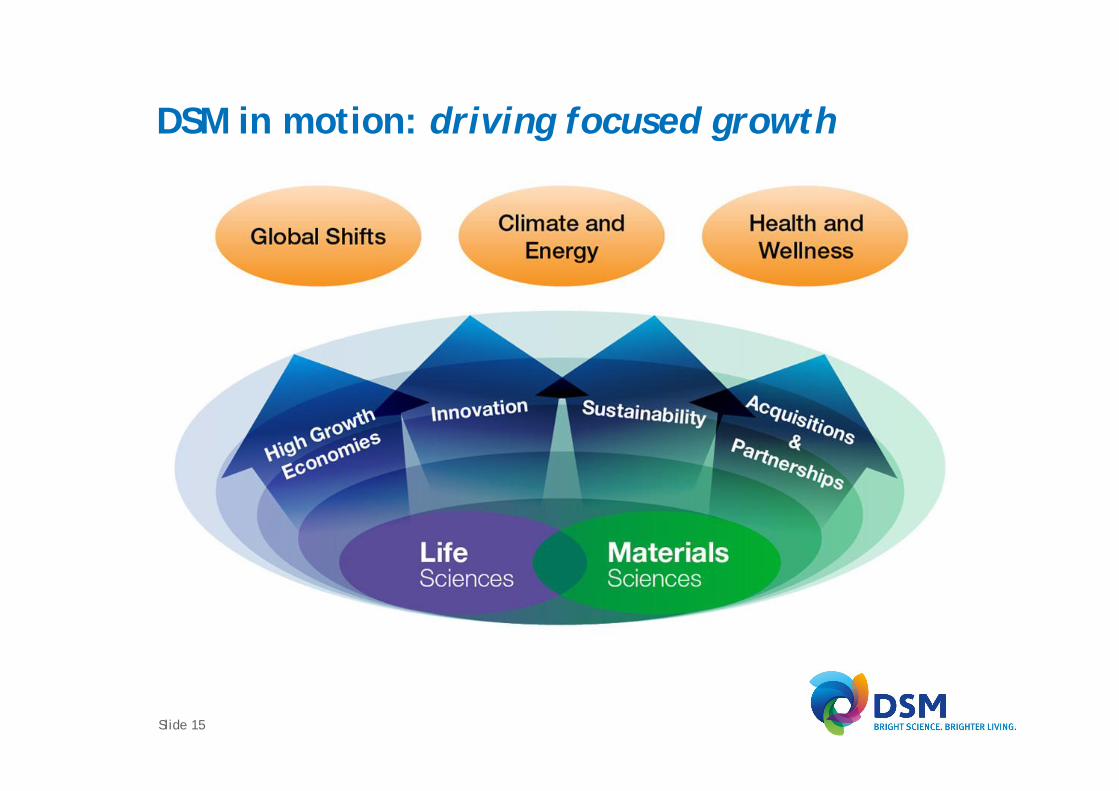
DSM in motion: driving focused growth
Slide 15
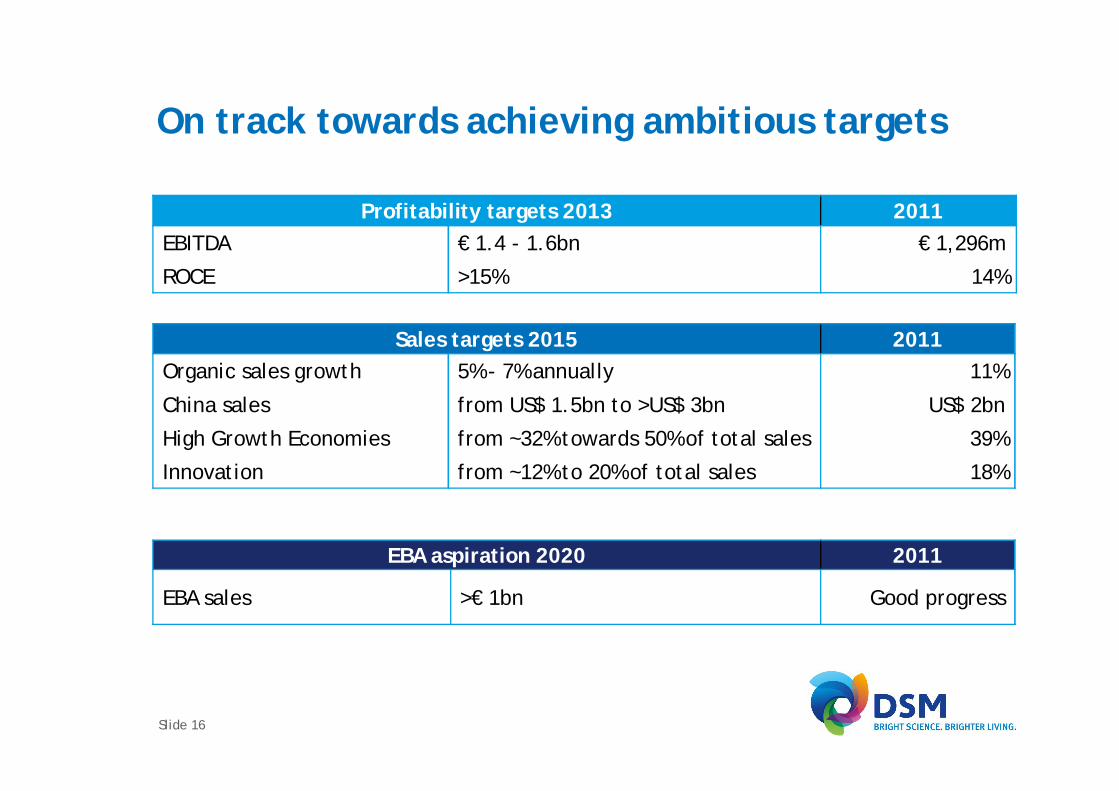
On track towards achieving ambitious targets
Profitability targets 2013 2011EBITDA € 1.4 - 1.6bn € 1,296m
ROCE >15% 14%
Sales targets 2015 2011Organic sales growth 5% - 7% annually 11%
China sales from US$ 1.5bn to >US$ 3bn US$ 2bn
High Growth Economies from ~32% towards 50% of total sales 39%
Innovation from ~12% to 20% of total sales 18%
EBA aspiration 2020 2011
EBA sales >€ 1bn Good progress
Slide 16
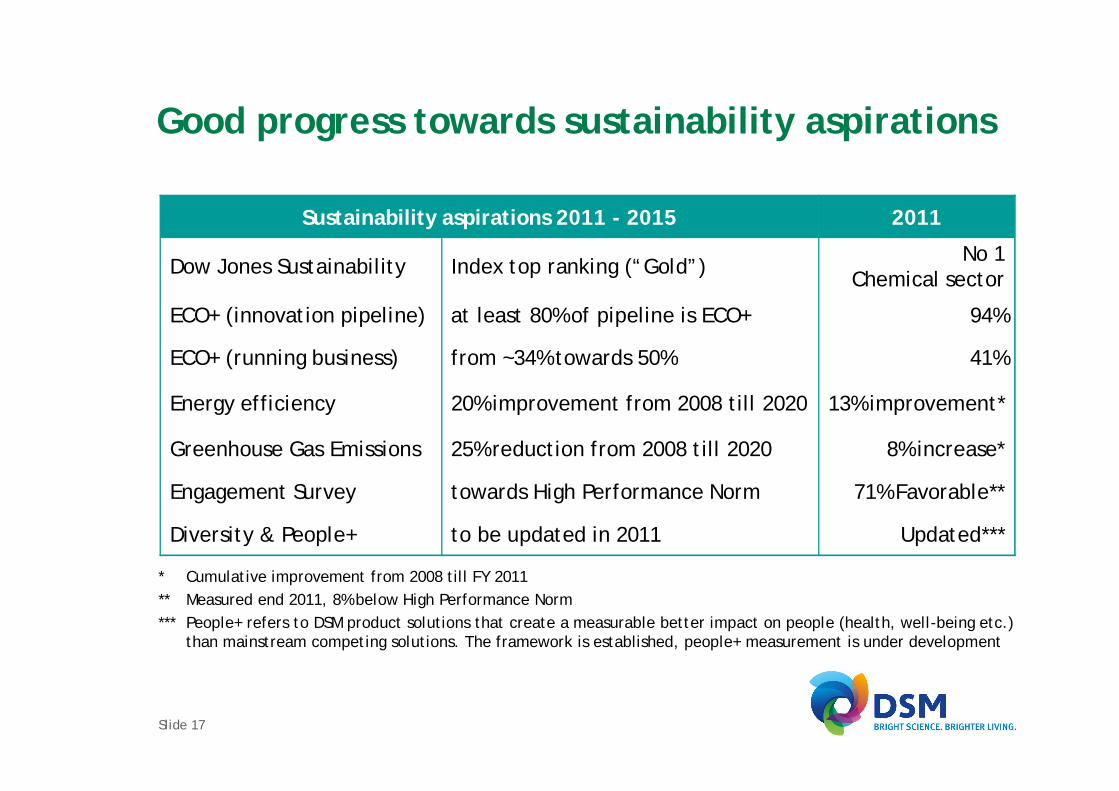
Good progress towards sustainability aspirations
Sustainability aspirations 2011 - 2015 2011
Dow Jones Sustainability Index top ranking (“Gold”) No 1Chemical sector
ECO+ (innovation pipeline) at least 80% of pipeline is ECO+ 94%
ECO+ (running business) from ~34% towards 50% 41%
Energy efficiency 20% improvement from 2008 till 2020 13% improvement*
Greenhouse Gas Emissions 25% reduction from 2008 till 2020 8% increase*
Engagement Survey towards High Performance Norm 71% Favorable**
Diversity & People+ to be updated in 2011 Updated***
* Cumulative improvement from 2008 till FY 2011** Measured end 2011, 8% below High Performance Norm*** People+ refers to DSM product solutions that create a measurable better impact on people (health, well-being etc.)
than mainstream competing solutions. The framework is established, people+ measurement is under development
Slide 17
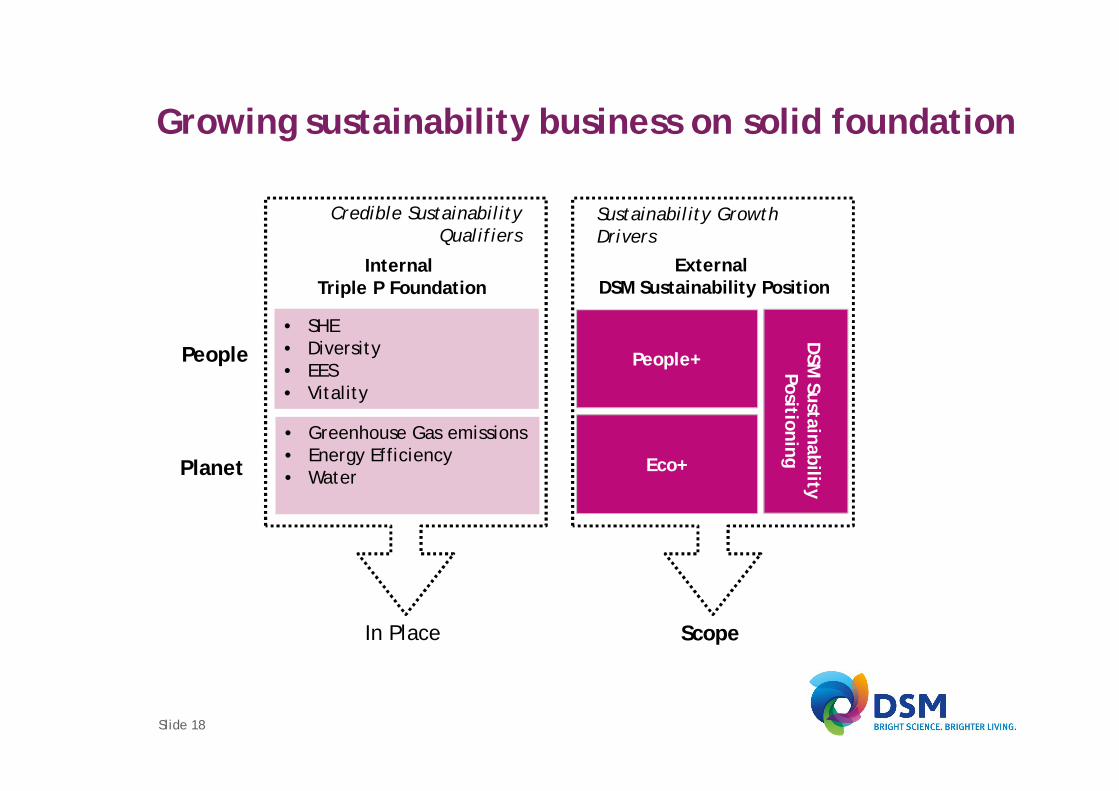
• Greenhouse Gas emissions• Energy Efficiency• Water
• SHE• Diversity• EES• Vitality
Planet
People
InternalTriple P Foundation
ExternalDSM Sustainability Position
Credible SustainabilityQualifiers
Sustainability GrowthDrivers
In Place Scope
DSM
SustainabilityPositioning
People+
Eco+
Growing sustainability business on solid foundation
Slide 18
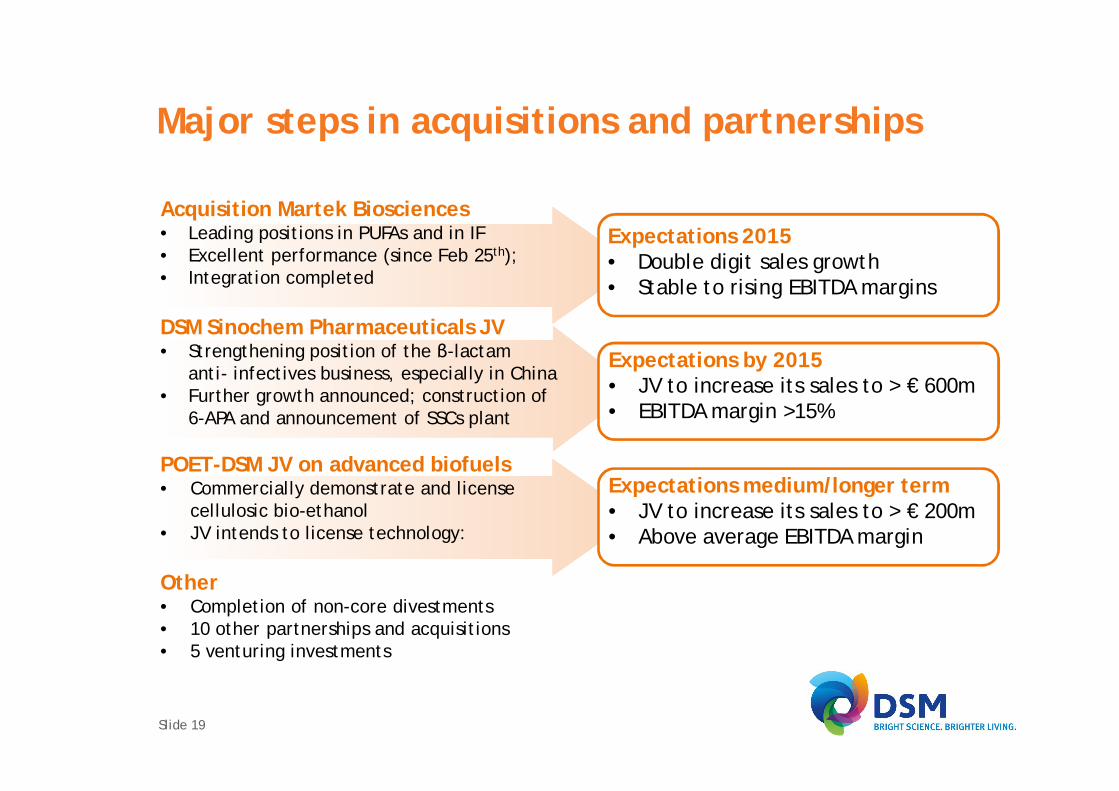
Major steps in acquisitions and partnerships
Slide 19
Acquisition Martek Biosciences• Leading positions in PUFAs and in IF• Excellent performance (since Feb 25th);• Integration completed
DSM Sinochem Pharmaceuticals JV• Strengthening position of the -lactam
anti- infectives business, especially in China• Further growth announced; construction of
6-APA and announcement of SSCs plant
POET-DSM JV on advanced biofuels• Commercially demonstrate and license
cellulosic bio-ethanol• JV intends to license technology:
Other• Completion of non-core divestments• 10 other partnerships and acquisitions• 5 venturing investments
Expectations by 2015• JV to increase its sales to > € 600m• EBITDA margin >15%
Expectations 2015• Double digit sales growth• Stable to rising EBITDA margins
Expectations medium/longer term• JV to increase its sales to > € 200m• Above average EBITDA margin
0.0
1.5
3.0
2005 CMD 2010 FY 2011 Target2015
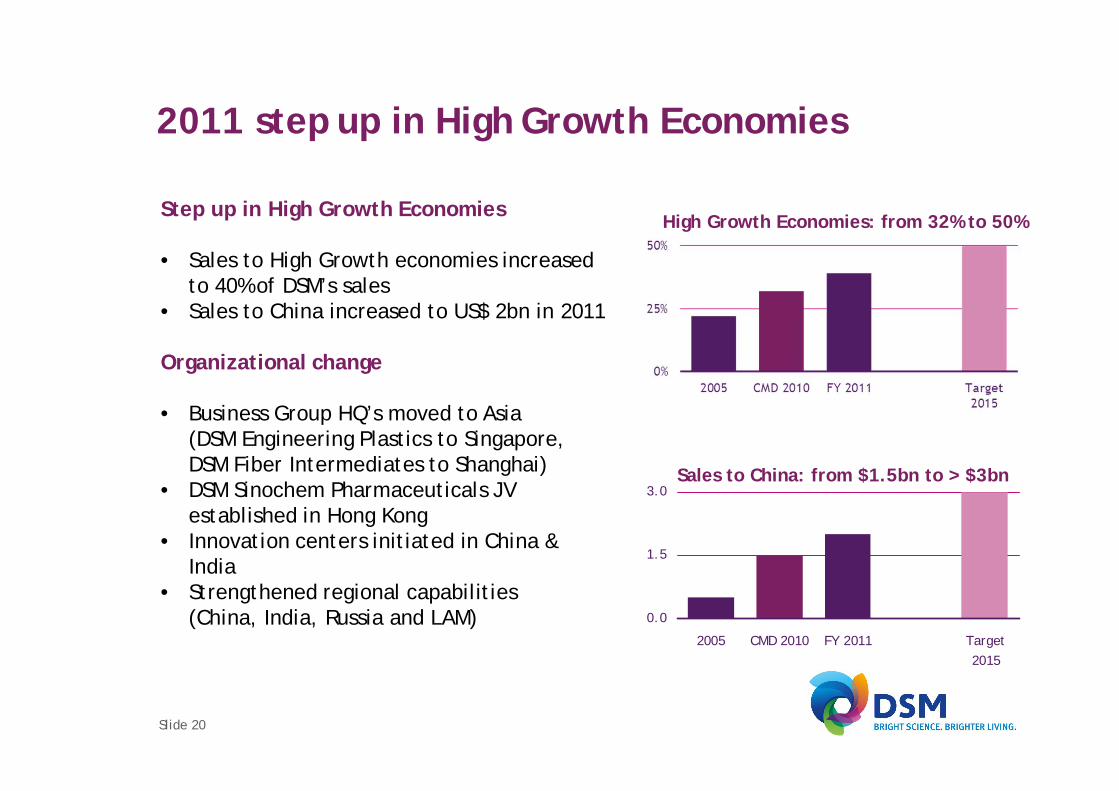
High Growth Economies: from 32% to 50%Step up in High Growth Economies
• Sales to High Growth economies increasedto 40% of DSM’s sales
• Sales to China increased to US$ 2bn in 2011
Organizational change
• Business Group HQ’s moved to Asia(DSM Engineering Plastics to Singapore,DSM Fiber Intermediates to Shanghai)
• DSM Sinochem Pharmaceuticals JVestablished in Hong Kong
• Innovation centers initiated in China &India
• Strengthened regional capabilities(China, India, Russia and LAM)
2011 step up in High Growth Economies
Sales to China: from $1.5bn to > $3bn
Slide 20
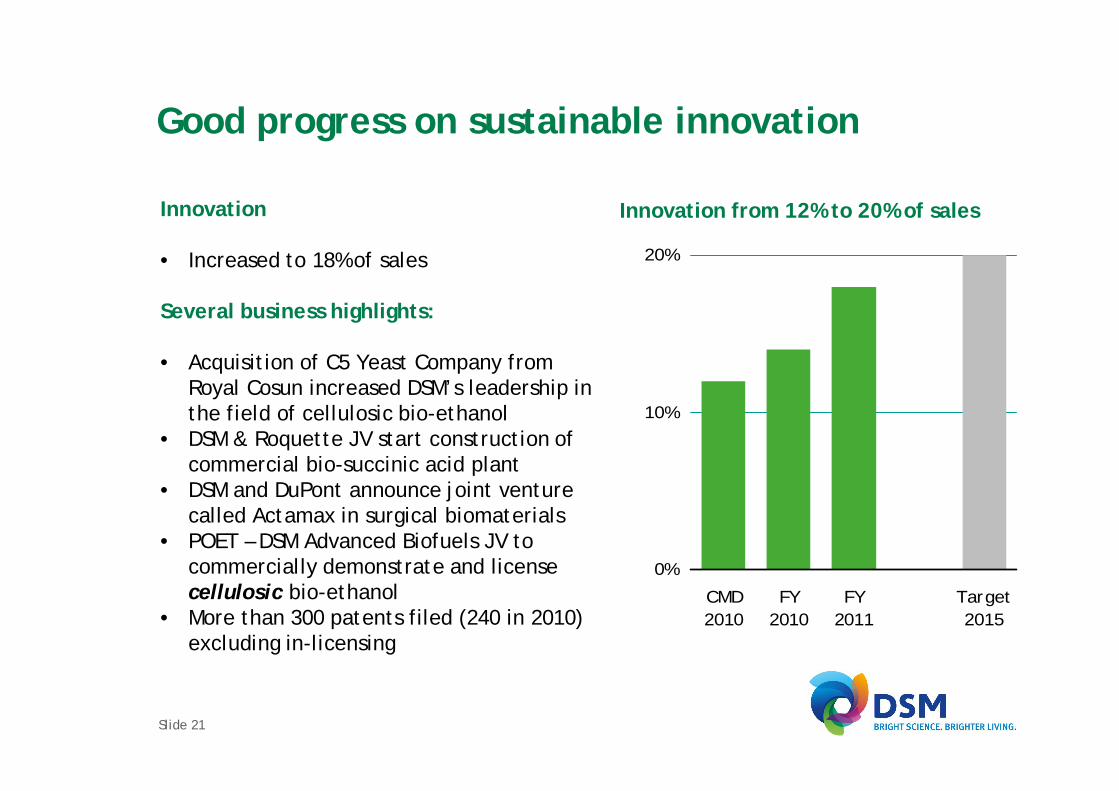
Innovation from 12% to 20% of sales
0%
10%
20%
CMD2010
FY2010
FY2011
Target2015
Innovation
• Increased to 18% of sales
Several business highlights:
• Acquisition of C5 Yeast Company fromRoyal Cosun increased DSM’s leadership inthe field of cellulosic bio-ethanol
• DSM & Roquette JV start construction ofcommercial bio-succinic acid plant
• DSM and DuPont announce joint venturecalled Actamax in surgical biomaterials
• POET – DSM Advanced Biofuels JV tocommercially demonstrate and licensecellulosic bio-ethanol
• More than 300 patents filed (240 in 2010)excluding in-licensing
Good progress on sustainable innovation
Slide 21
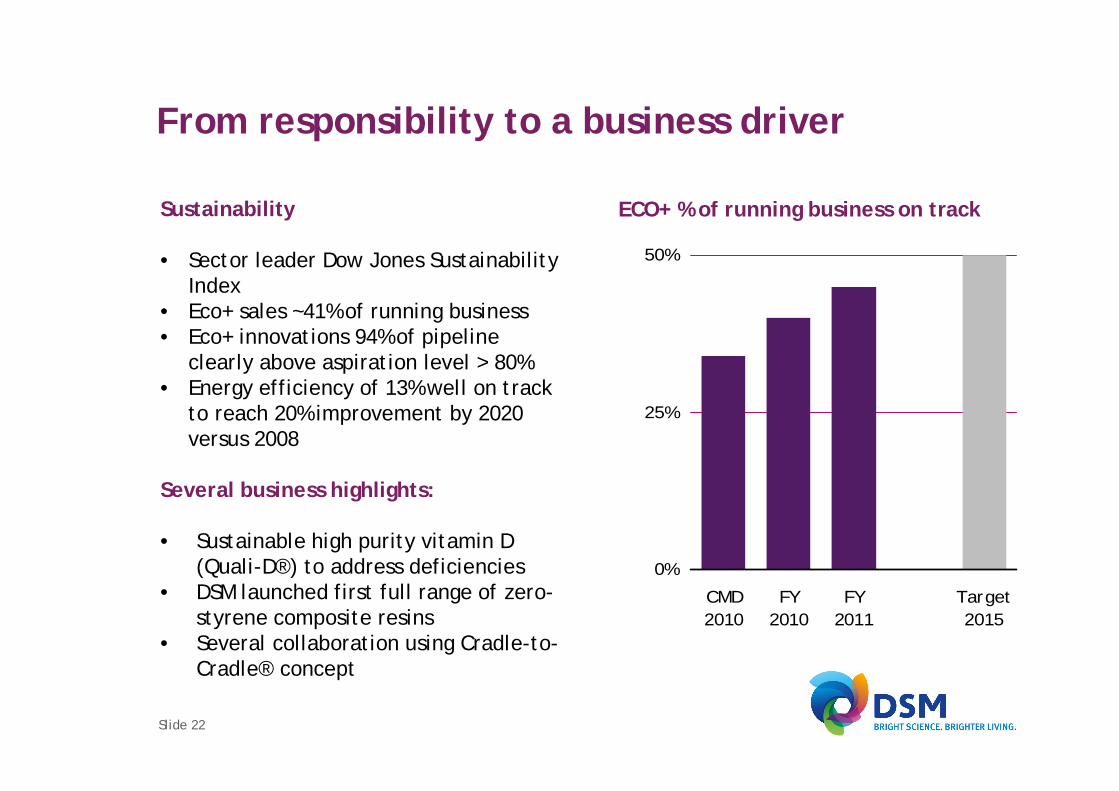
Sustainability
• Sector leader Dow Jones SustainabilityIndex
• Eco+ sales ~41% of running business• Eco+ innovations 94% of pipeline
clearly above aspiration level > 80%• Energy efficiency of 13% well on track
to reach 20% improvement by 2020versus 2008
Several business highlights:
• Sustainable high purity vitamin D(Quali-D®) to address deficiencies
• DSM launched first full range of zero-styrene composite resins
• Several collaboration using Cradle-to-Cradle® concept
0%
25%
50%
CMD2010
FY2010
FY2011
Target2015
ECO+ % of running business on track
From responsibility to a business driver
Slide 22
Overview
• Global trends drive sustainability• Strategic progress• Sustainability achievements• Annexes
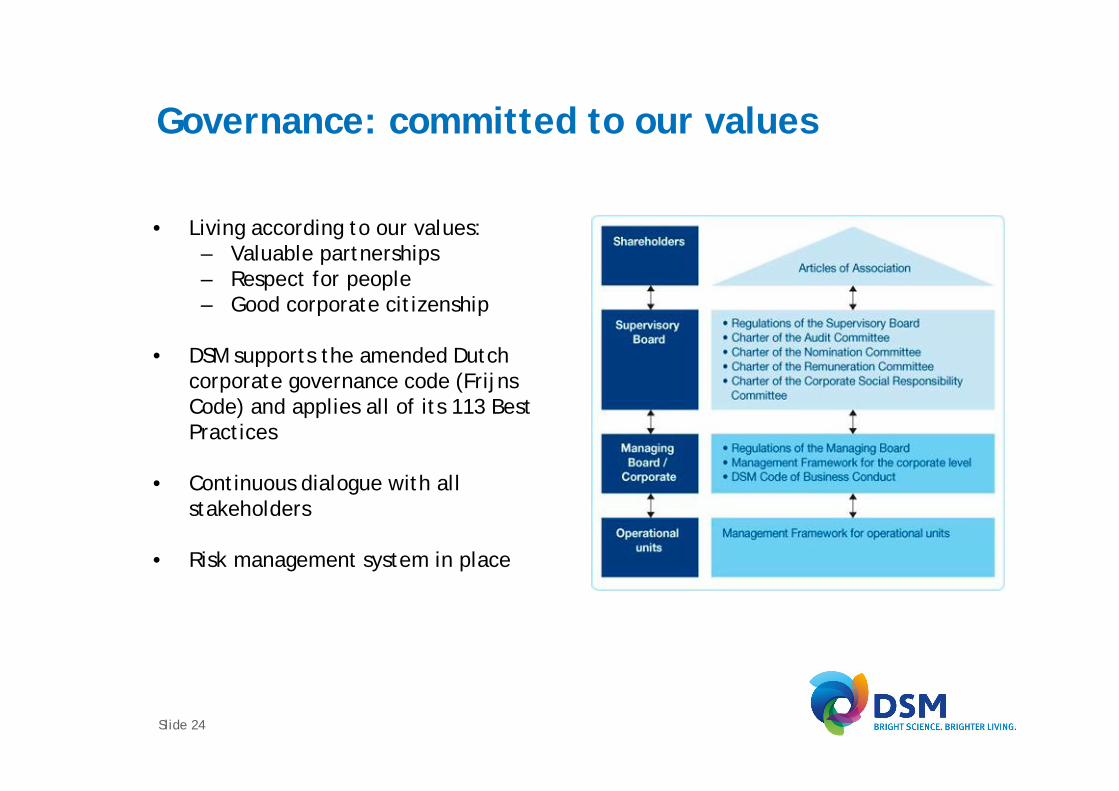
Governance: committed to our values
• Living according to our values:– Valuable partnerships– Respect for people– Good corporate citizenship
• DSM supports the amended Dutchcorporate governance code (FrijnsCode) and applies all of its 113 BestPractices
• Continuous dialogue with allstakeholders
• Risk management system in place
Slide 24
Corporate SHE dept
Managing BoardSustainability Champion: Feike Sijbesma
BG SHE dept’sBG Sustainability
Champions(+ SU / Staffs)
Governments
NGO’s
Employees
Customers
Suppliers
Investors
CorporateSustainability dept
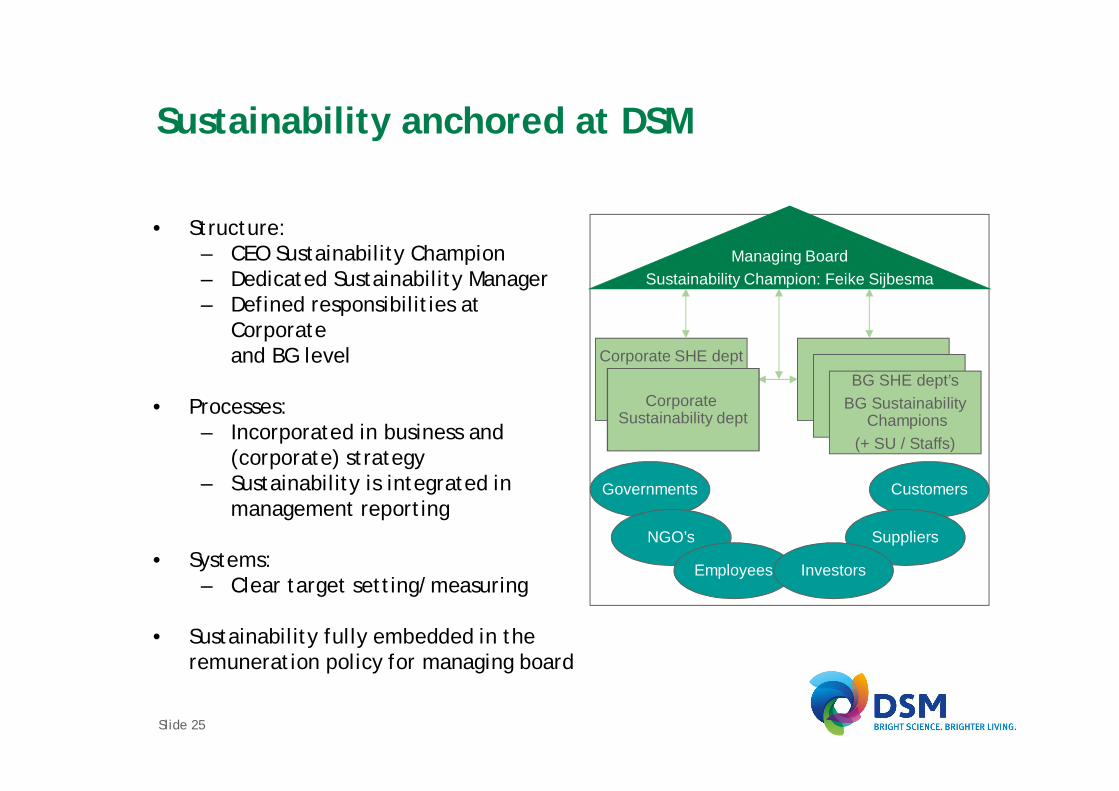
Sustainability anchored at DSM
• Structure:– CEO Sustainability Champion– Dedicated Sustainability Manager– Defined responsibilities at
Corporateand BG level
• Processes:– Incorporated in business and
(corporate) strategy– Sustainability is integrated in
management reporting
• Systems:– Clear target setting/measuring
• Sustainability fully embedded in theremuneration policy for managing board
Slide 25
Slide 26
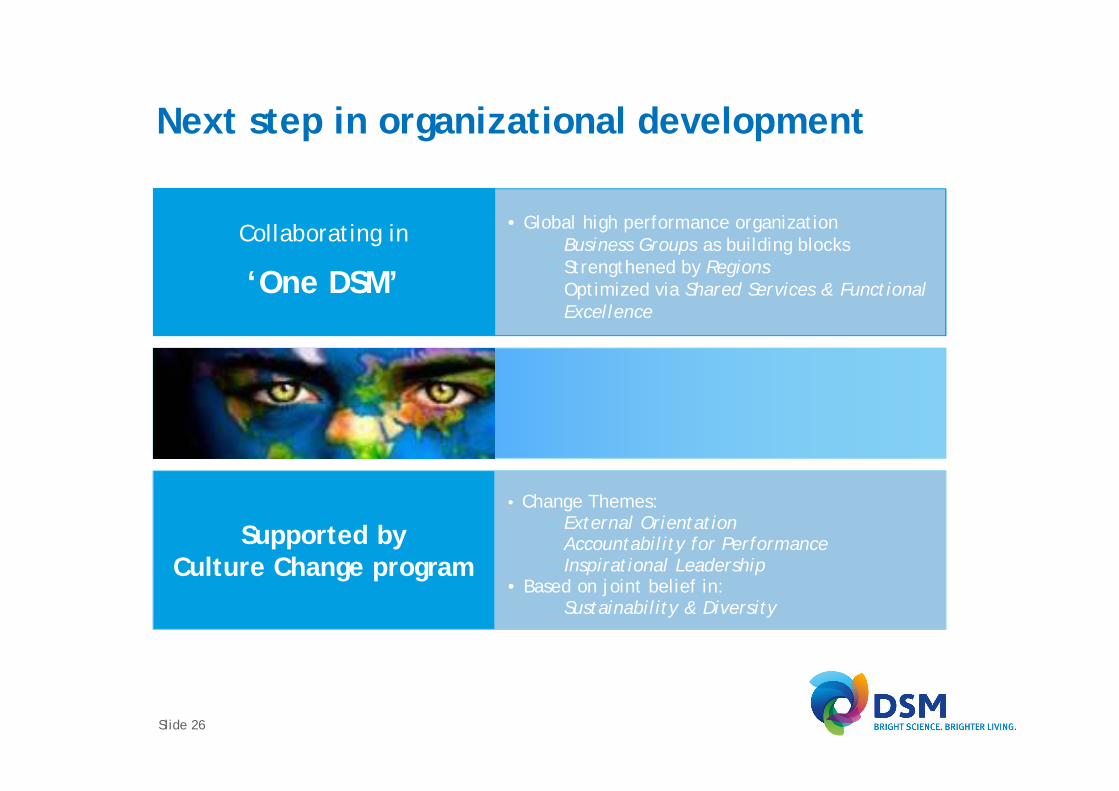
• Global high performance organization– Business Groups as building blocks– Strengthened by Regions– Optimized via Shared Services & Functional
Excellence
Collaborating in
‘One DSM’
• Change Themes:– External Orientation– Accountability for Performance– Inspirational Leadership
• Based on joint belief in:– Sustainability & Diversity
Supported byCulture Change program
Next step in organizational development
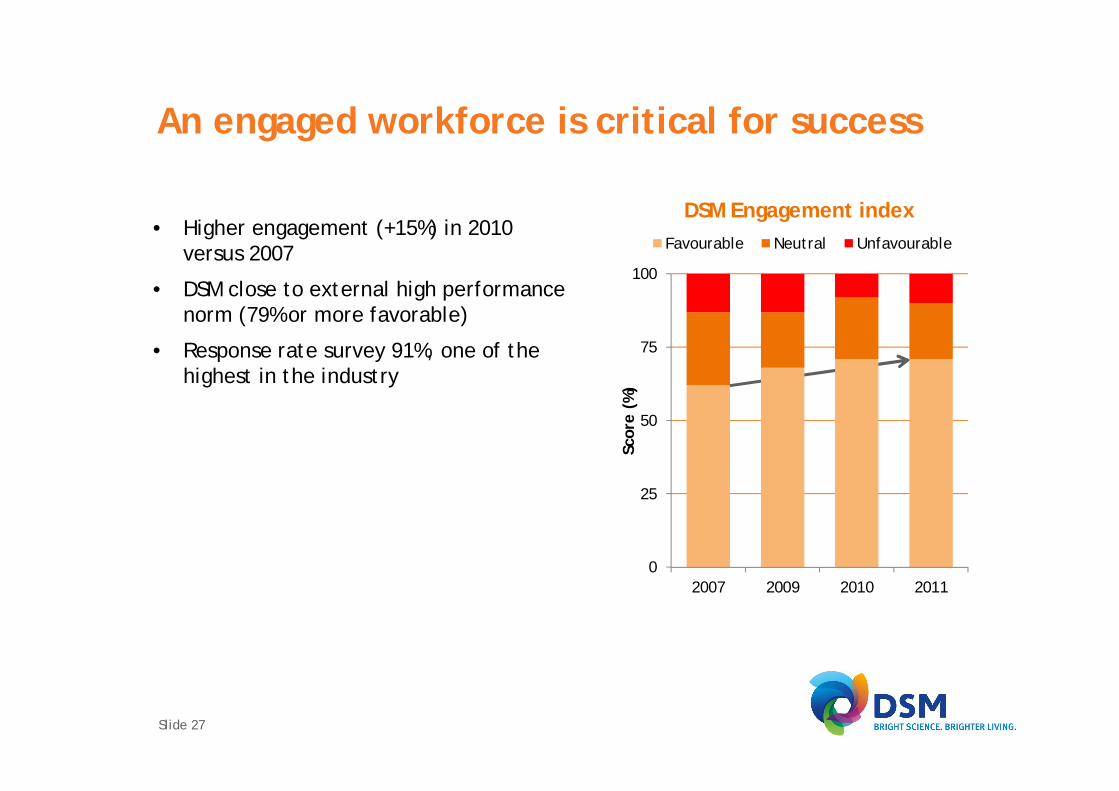
An engaged workforce is critical for success
• Higher engagement (+15%) in 2010versus 2007
• DSM close to external high performancenorm (79% or more favorable)
• Response rate survey 91%, one of thehighest in the industry
Slide 27
DSM Engagement index
0
25
50
75
100
2007 2009 2010 2011
Scor
e (%
)
Favourable Neutral Unfavourable
720 24
820 25
921 26
1021 27
0
25
50
75
100
Executives Management Others
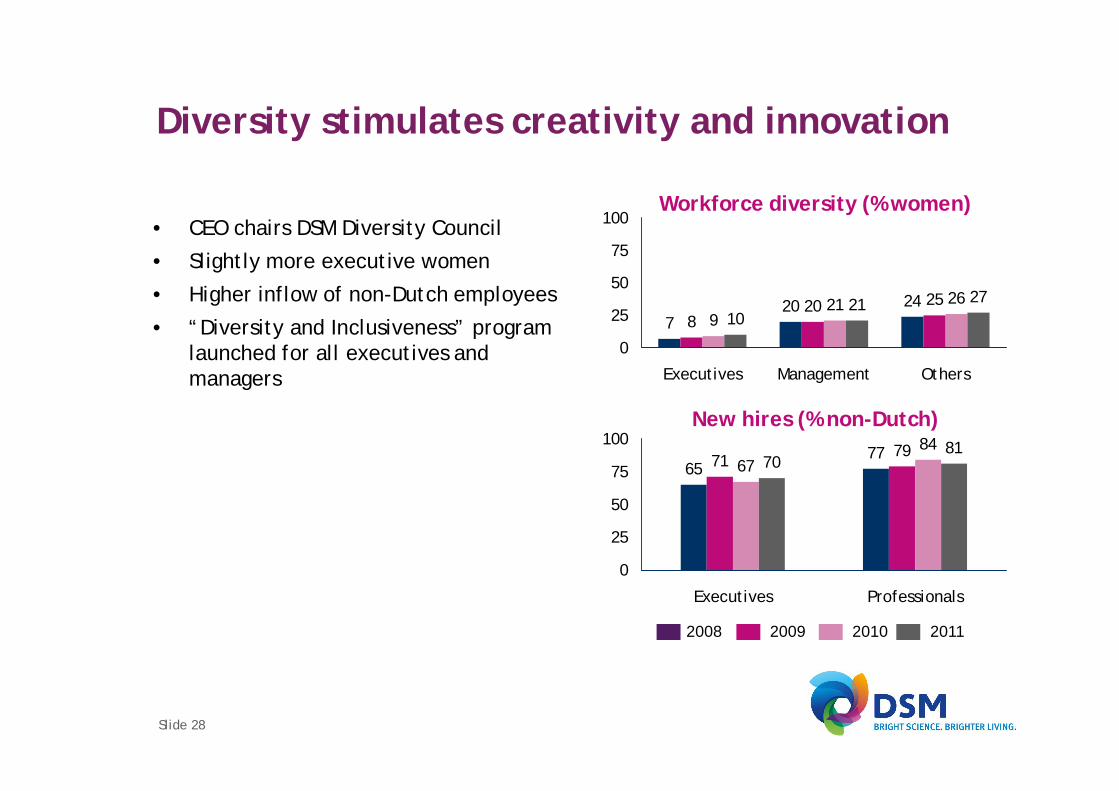
Diversity stimulates creativity and innovation
• CEO chairs DSM Diversity Council
• Slightly more executive women
• Higher inflow of non-Dutch employees
• “Diversity and Inclusiveness” programlaunched for all executives andmanagers
Slide 28
657771
7967
8470
81
0
25
50
75
100
Executives Professionals
Workforce diversity (% women)
New hires (% non-Dutch)
2008 2009 2010 2011
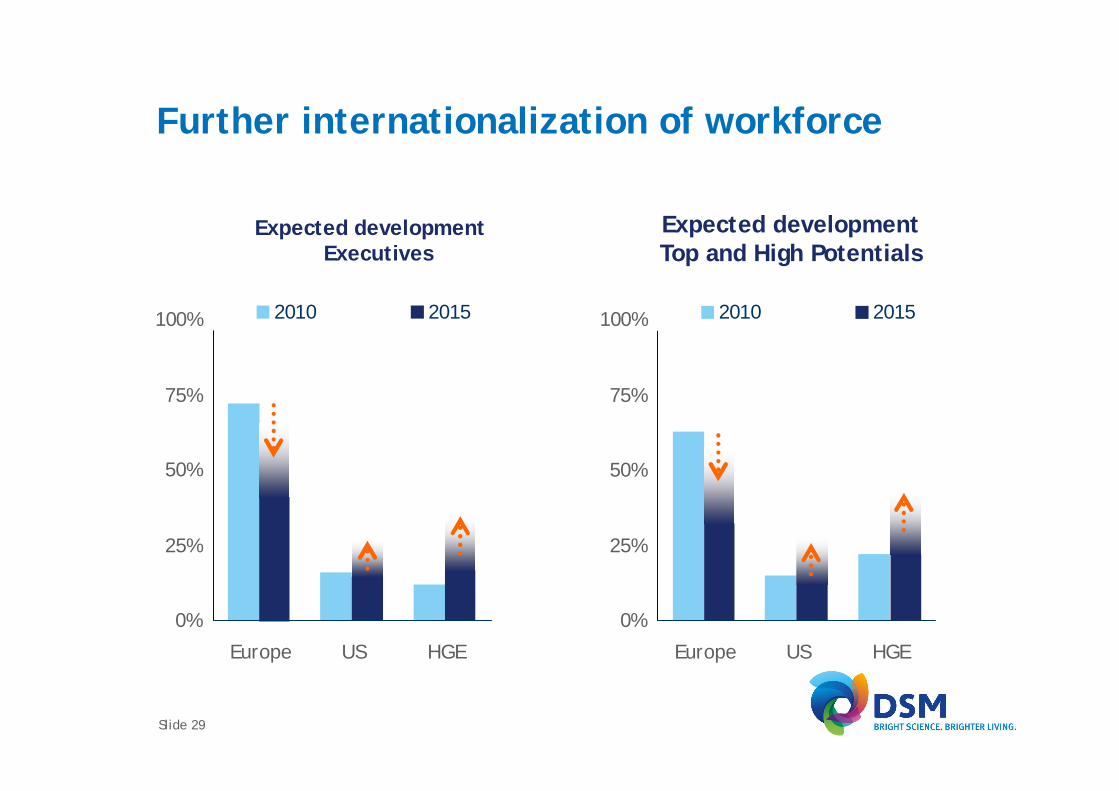
Further internationalization of workforce
Expected developmentExecutives
Expected developmentTop and High Potentials
0%
25%
50%
75%
100%
Europe US HGE
2010 2015
0%
25%
50%
75%
100%
Europe US HGE
2010 2015
Slide 29
Slide 30
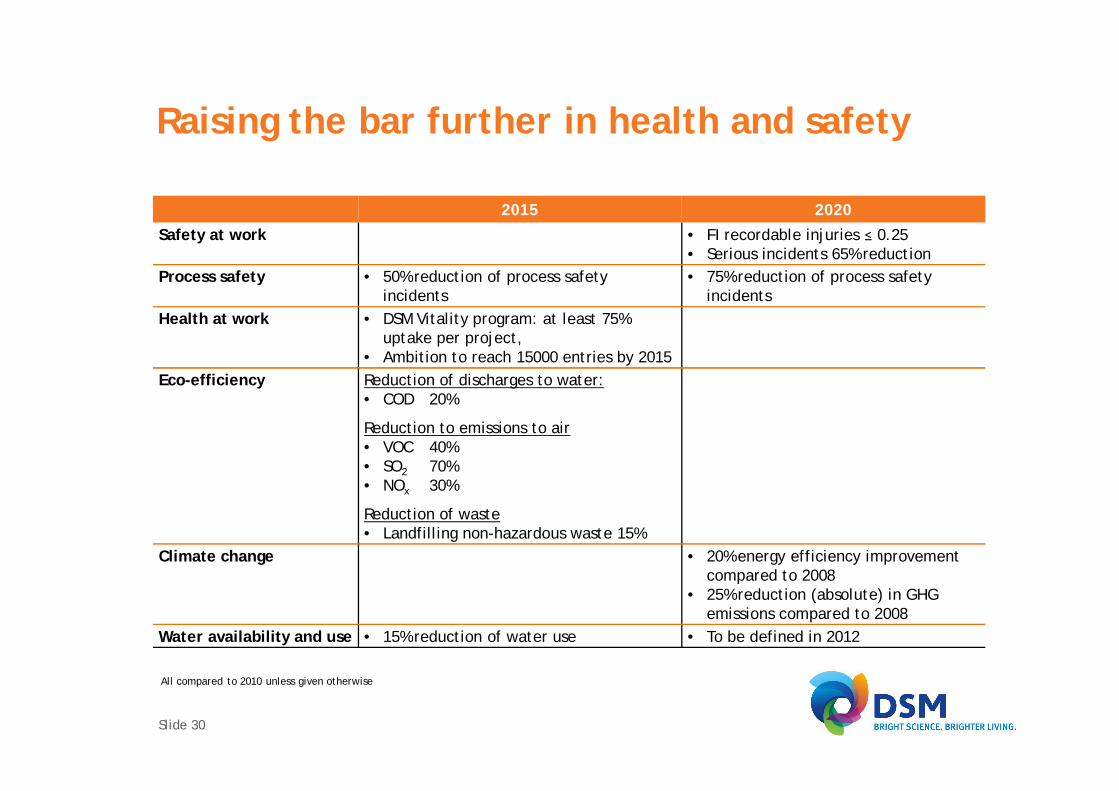
Raising the bar further in health and safety
2015 2020Safety at work • FI recordable injuries 0.25
• Serious incidents 65% reductionProcess safety • 50% reduction of process safety
incidents• 75% reduction of process safety
incidentsHealth at work • DSM Vitality program: at least 75%
uptake per project,• Ambition to reach 15000 entries by 2015
Eco-efficiency Reduction of discharges to water:• COD 20%
Reduction to emissions to air• VOC 40%• SO2 70%• NOx 30%
Reduction of waste• Landfilling non-hazardous waste 15%
Climate change • 20% energy efficiency improvementcompared to 2008
• 25% reduction (absolute) in GHGemissions compared to 2008
Water availability and use • 15% reduction of water use • To be defined in 2012
All compared to 2010 unless given otherwise
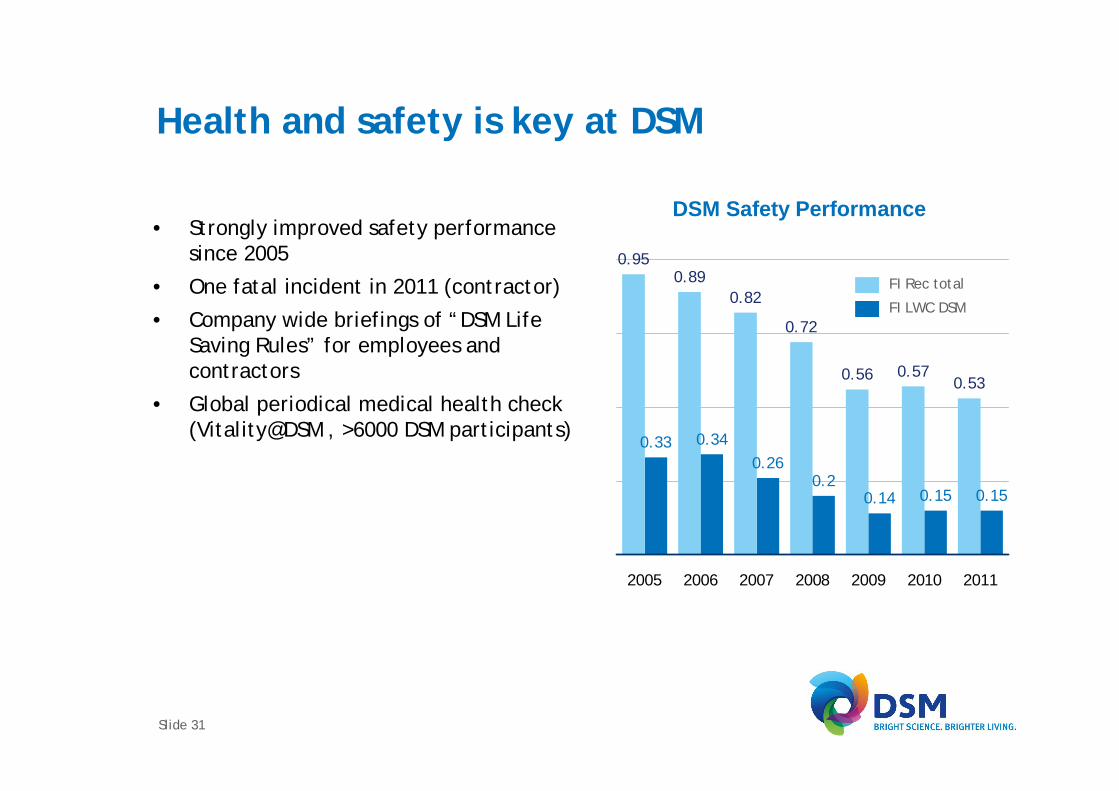
0.950.89
0.82
0.72
0.56 0.570.53
0.33 0.340.26
0.20.14 0.15 0.15
2005 2006 2007 2008 2009 2010 2011
Slide 31
Health and safety is key at DSM
• Strongly improved safety performancesince 2005
• One fatal incident in 2011 (contractor)
• Company wide briefings of “DSM LifeSaving Rules” for employees andcontractors
• Global periodical medical health check(Vitality@DSM , >6000 DSM participants)
DSM Safety Performance
FI Rec total
FI LWC DSM
-20% 0% 20% 40% 60% 80%
COD
VOC
SO2
NOx
Landfill NHW
Total water
GHG
Energy Efficiency
Target Actual
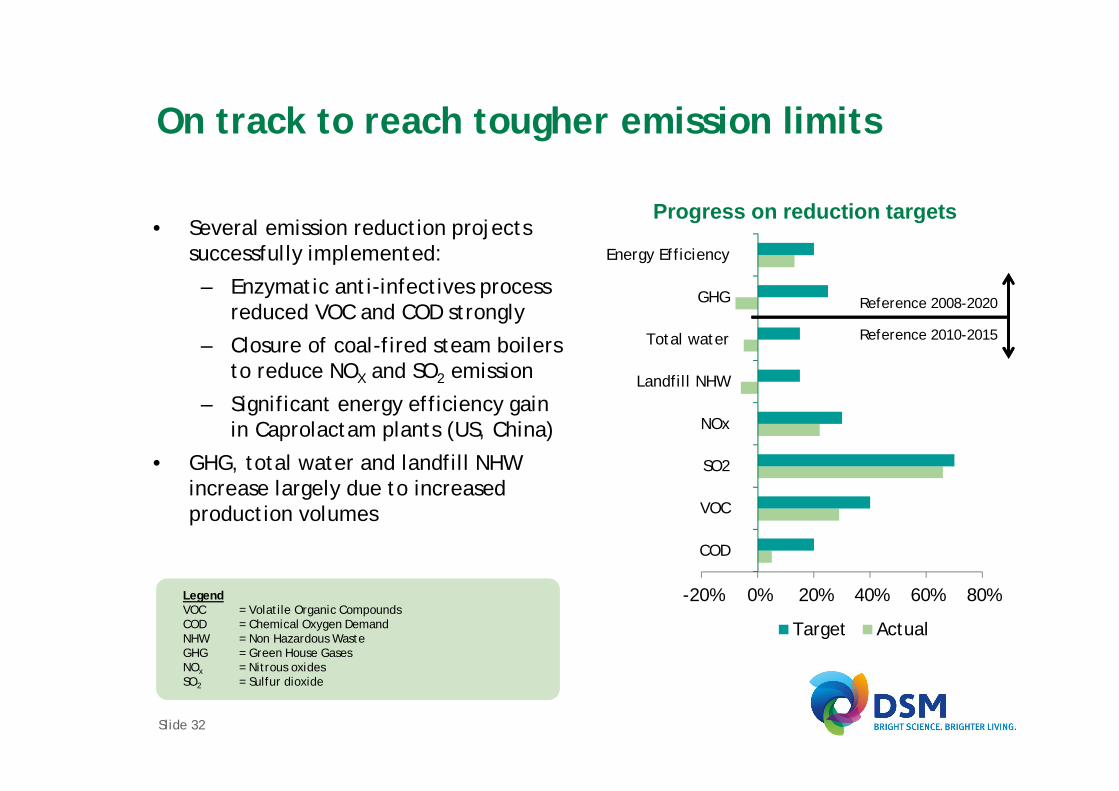
On track to reach tougher emission limits
• Several emission reduction projectssuccessfully implemented:
– Enzymatic anti-infectives processreduced VOC and COD strongly
– Closure of coal-fired steam boilersto reduce NOX and SO2 emission
– Significant energy efficiency gainin Caprolactam plants (US, China)
• GHG, total water and landfill NHWincrease largely due to increasedproduction volumes
Slide 32
Progress on reduction targets
Reference 2008-2020
Reference 2010-2015
LegendVOC = Volatile Organic CompoundsCOD = Chemical Oxygen DemandNHW = Non Hazardous WasteGHG = Green House GasesNOx = Nitrous oxidesSO2 = Sulfur dioxide
Slide 33
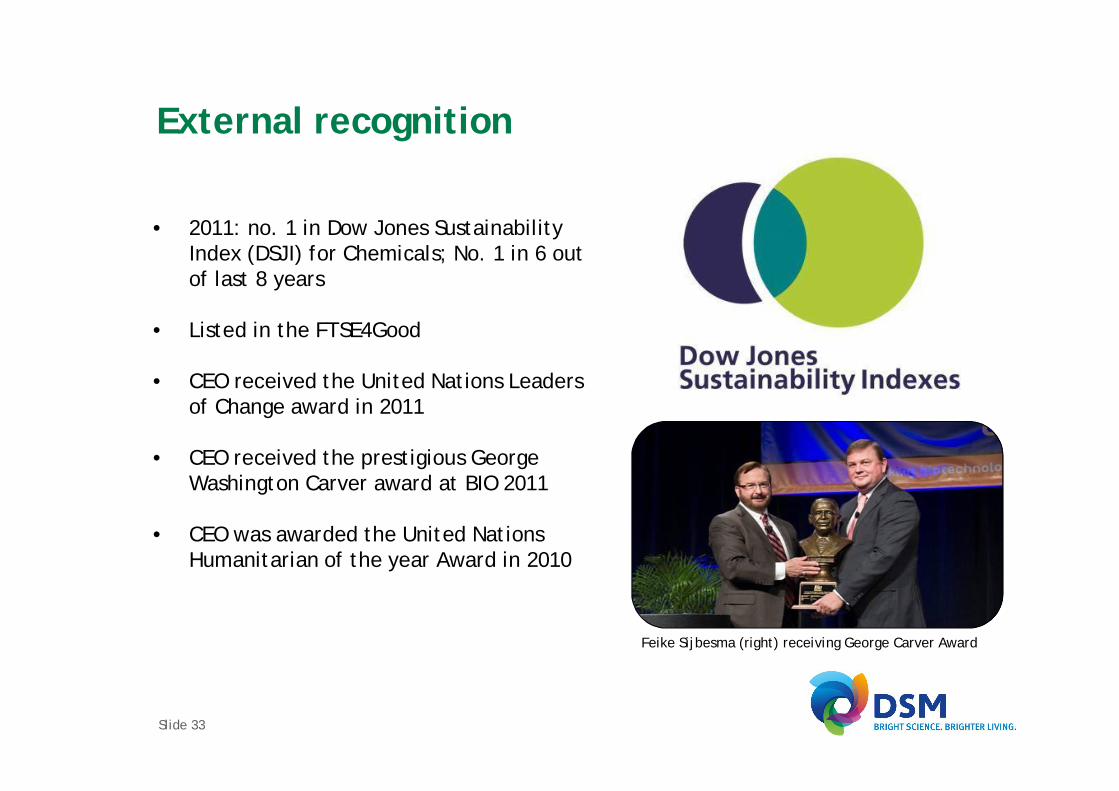
External recognition
• 2011: no. 1 in Dow Jones SustainabilityIndex (DSJI) for Chemicals; No. 1 in 6 outof last 8 years
• Listed in the FTSE4Good
• CEO received the United Nations Leadersof Change award in 2011
• CEO received the prestigious GeorgeWashington Carver award at BIO 2011
• CEO was awarded the United NationsHumanitarian of the year Award in 2010
Feike Sijbesma (right) receiving George Carver Award
Overview
• Global trends drive sustainability• Strategic progress• Sustainability achievements• Annexes
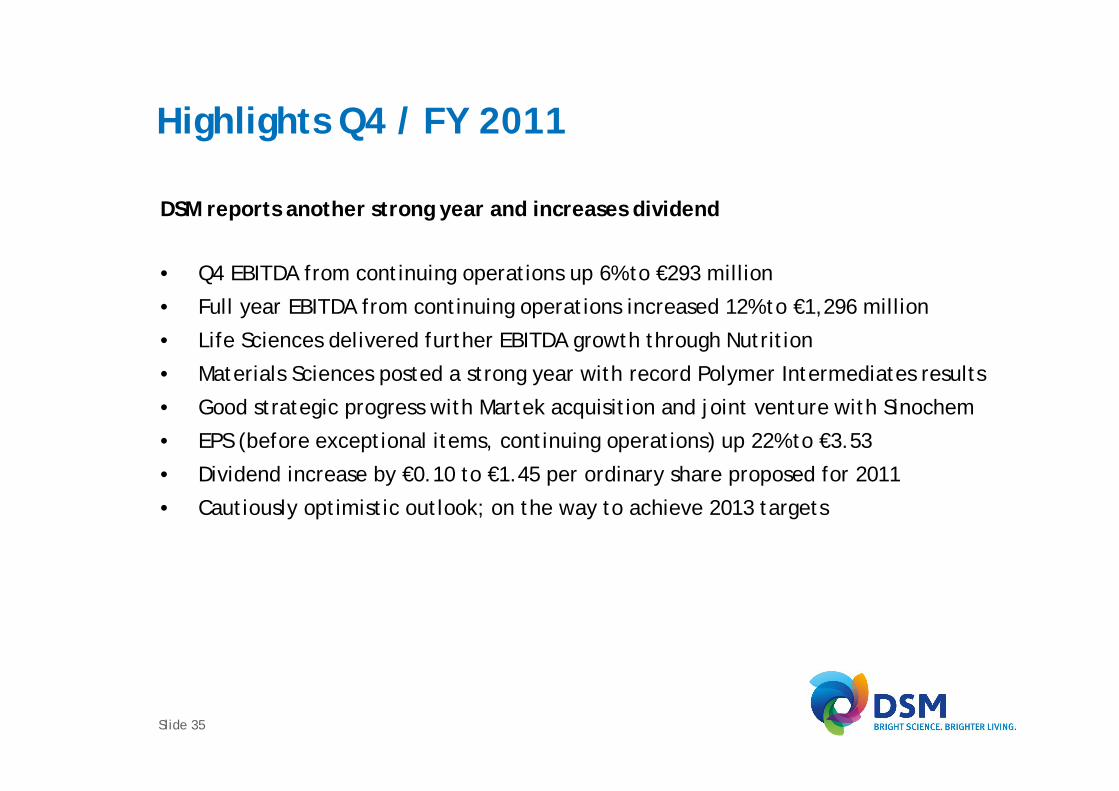
Highlights Q4 / FY 2011
DSM reports another strong year and increases dividend
• Q4 EBITDA from continuing operations up 6% to €293 million
• Full year EBITDA from continuing operations increased 12% to €1,296 million
• Life Sciences delivered further EBITDA growth through Nutrition
• Materials Sciences posted a strong year with record Polymer Intermediates results
• Good strategic progress with Martek acquisition and joint venture with Sinochem
• EPS (before exceptional items, continuing operations) up 22% to €3.53
• Dividend increase by €0.10 to €1.45 per ordinary share proposed for 2011
• Cautiously optimistic outlook; on the way to achieve 2013 targets
Slide 35
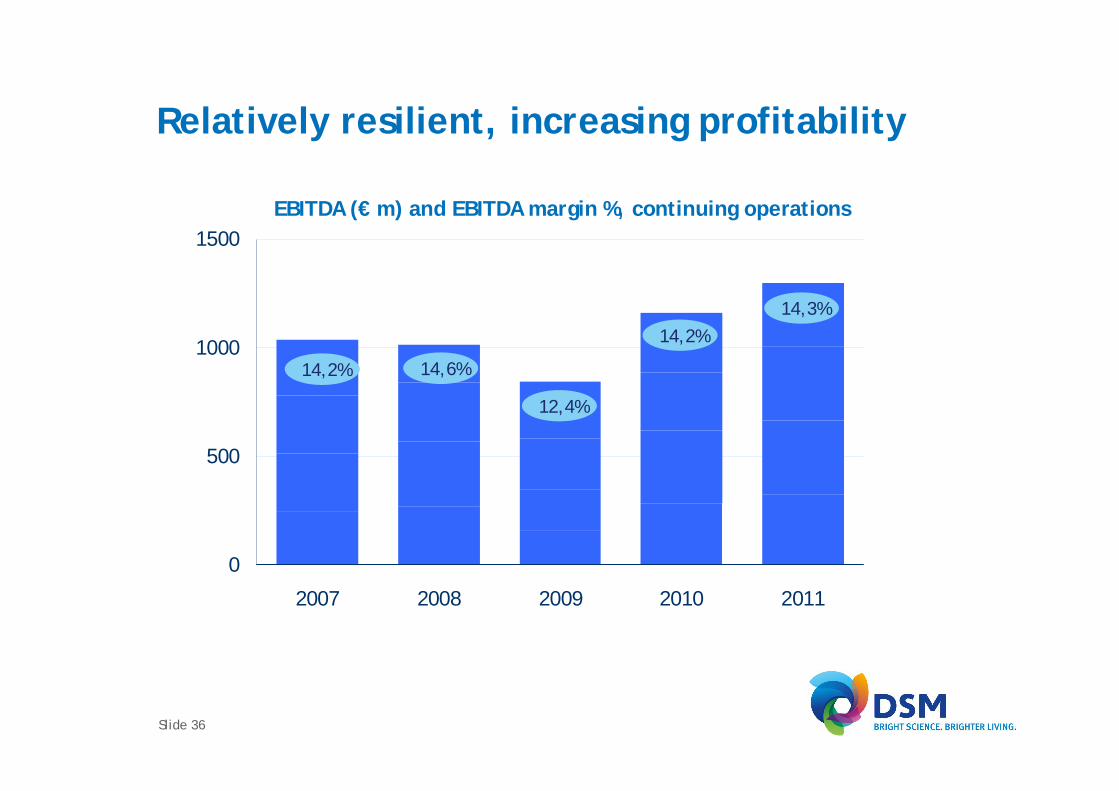
Relatively resilient, increasing profitability
0
500
1000
1500
2007 2008 2009 2010 2011
EBITDA (€ m) and EBITDA margin %, continuing operations
14,2% 14,6%
12,4%
14,2%14,3%
Slide 36
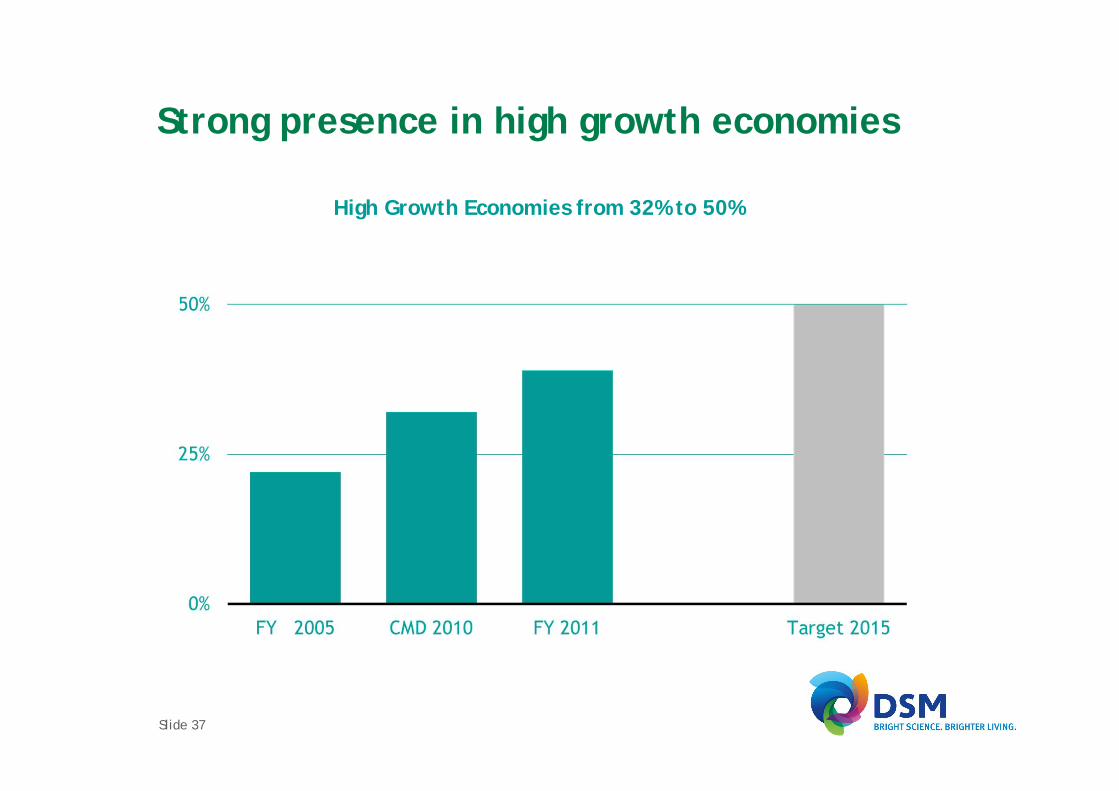
Strong presence in high growth economies
High Growth Economies from 32% to 50%
Slide 37
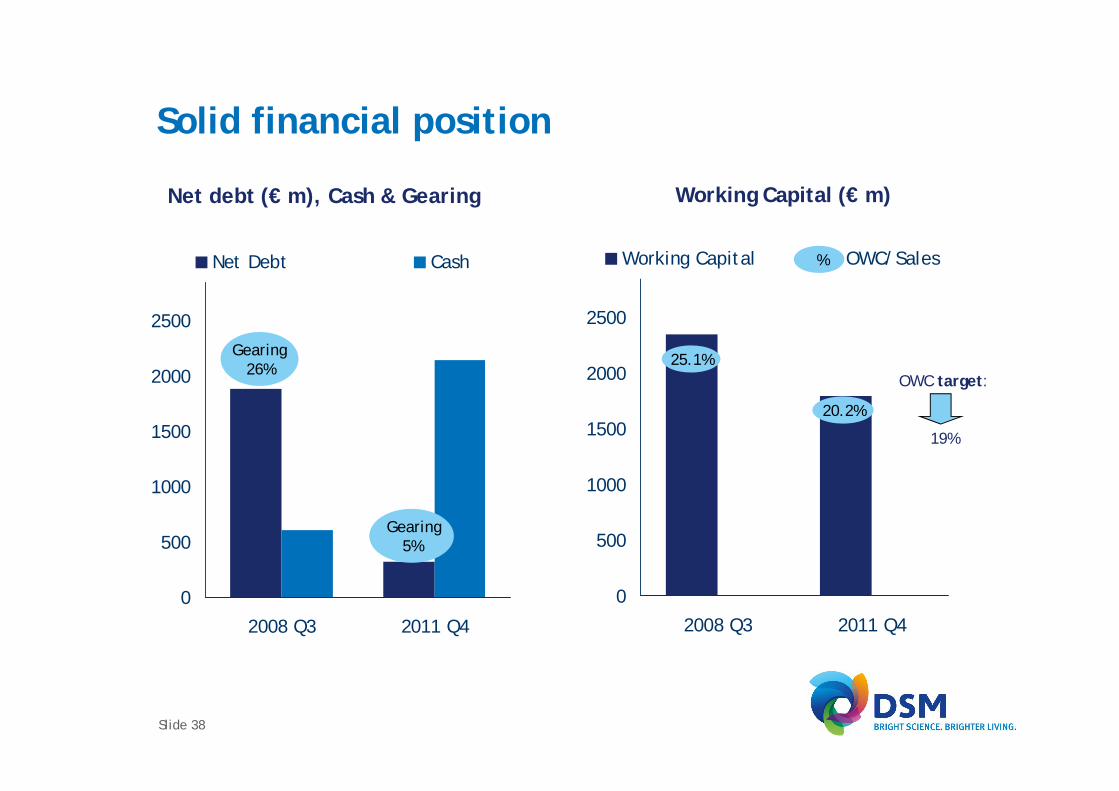
Solid financial position
0
500
1000
1500
2000
2500
3000
2008 Q3 2011 Q4
Net Debt Cash
Net debt (€ m), Cash & Gearing Working Capital (€ m)
Gearing26%
Gearing5%
0
500
1000
1500
2000
2500
3000
2008 Q3 2011 Q4
Working Capital OWC/Sales
20.2%
%
25.1%OWC target:
19%
Slide 38
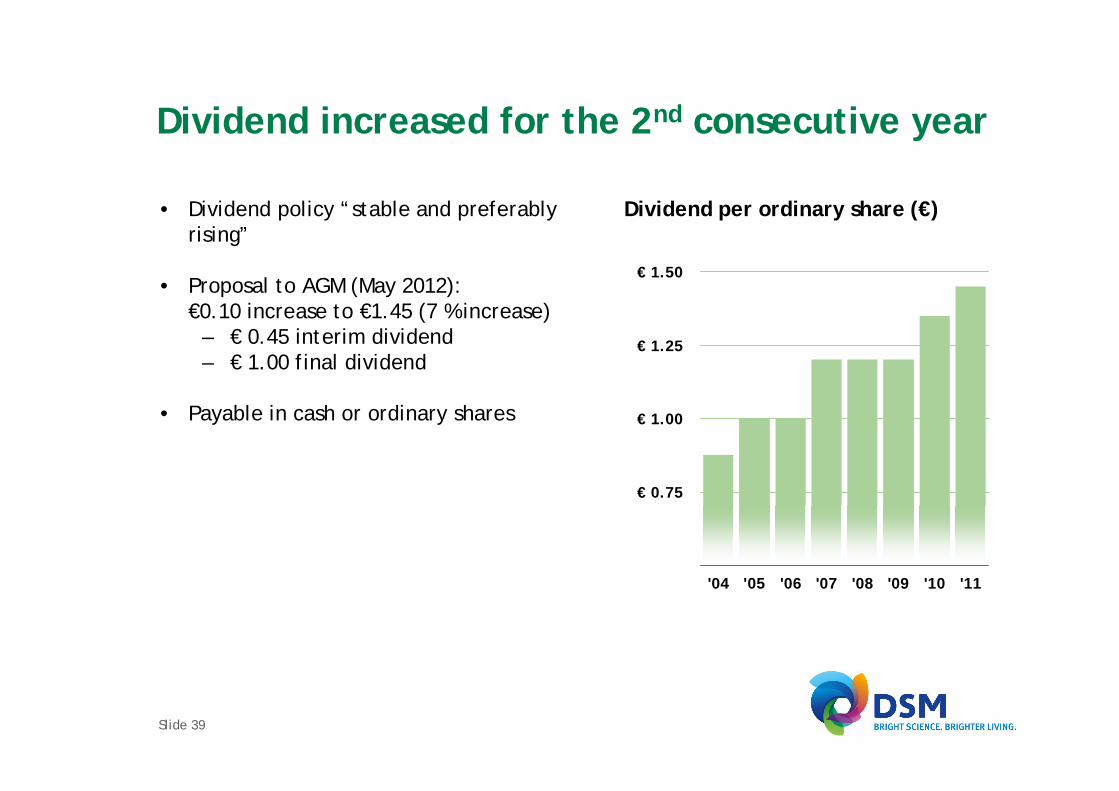
Dividend increased for the 2nd consecutive year
€ 0.50
€ 0.75
€ 1.00
€ 1.25
€ 1.50
'04 '05 '06 '07 '08 '09 '10 '11
Dividend per ordinary share (€)• Dividend policy “stable and preferablyrising”
• Proposal to AGM (May 2012):€0.10 increase to €1.45 (7 % increase)
– € 0.45 interim dividend– € 1.00 final dividend
• Payable in cash or ordinary shares
Slide 39
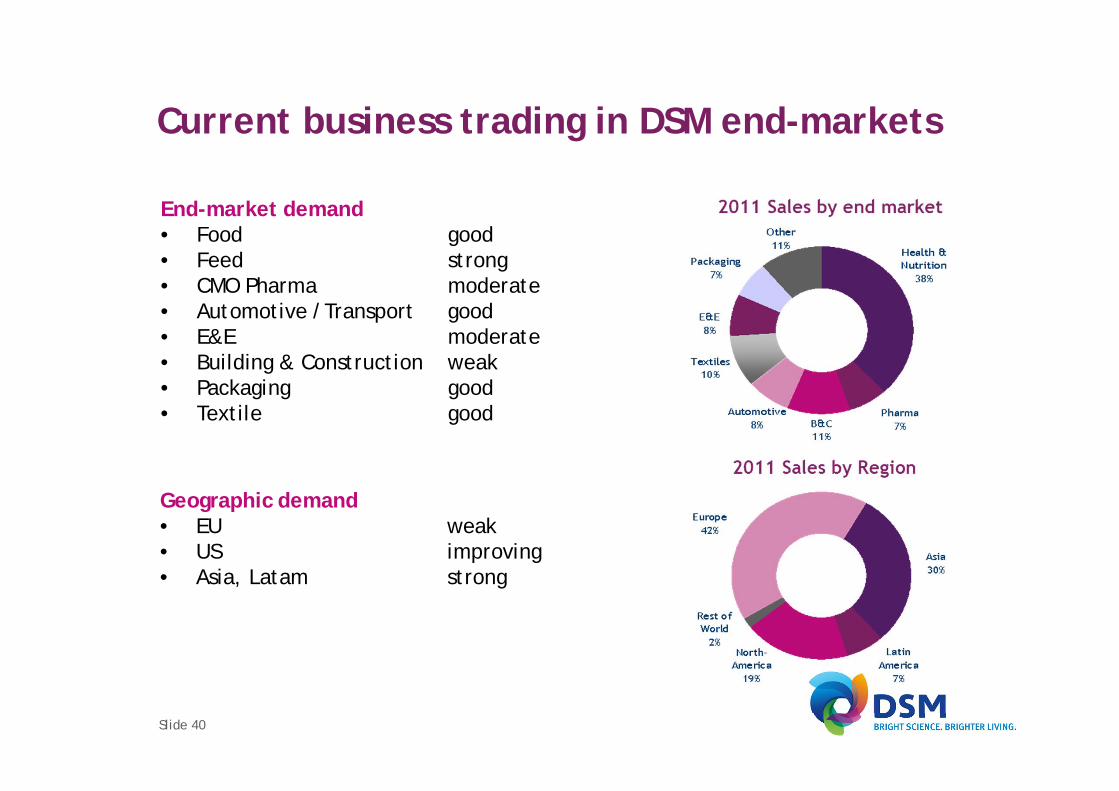
Current business trading in DSM end-markets
End-market demand• Food good• Feed strong• CMO Pharma moderate• Automotive /Transport good• E&E moderate• Building & Construction weak• Packaging good• Textile good
Geographic demand• EU weak• US improving• Asia, Latam strong
Slide 40
Outlook
• Cautiously optimistic outlook.
• In Nutrition EBITDA is expected to be above 2011.
• EBITDA in Pharma is expected to improve slightly compared to 2011, despitethe impact of the 50% deconsolidation of the anti-infectives business.
• Based on current insights EBITDA of the Performance Materials cluster isexpected to be somewhat higher than in 2011.
• For Polymer Intermediates another strong year is expected, at a level abovethe historical average, but the EBITDA will be clearly lower than theexceptional result in 2011.
• DSM expects the second half of 2012 to be stronger than the first half of 2012.
• DSM on its way to achieve 2013 targets.
Slide 41
Wrap up
• 2011 another strong year for DSM
• Good strategic progress• Martek acquisition (poly-unsaturated fatty acids)• JV with DSM Sinochem Pharmaceuticals (anti-infectives)• JV with POET to make advanced biofuels a reality
• DSM is well placed in current macro-economic environment• Relatively resilient portfolio,• Strong presence in High Growth Economies• Strong balance sheet
• Cautiously optimistic outlook, DSM on its way to achieve 2013 targets
Slide 42
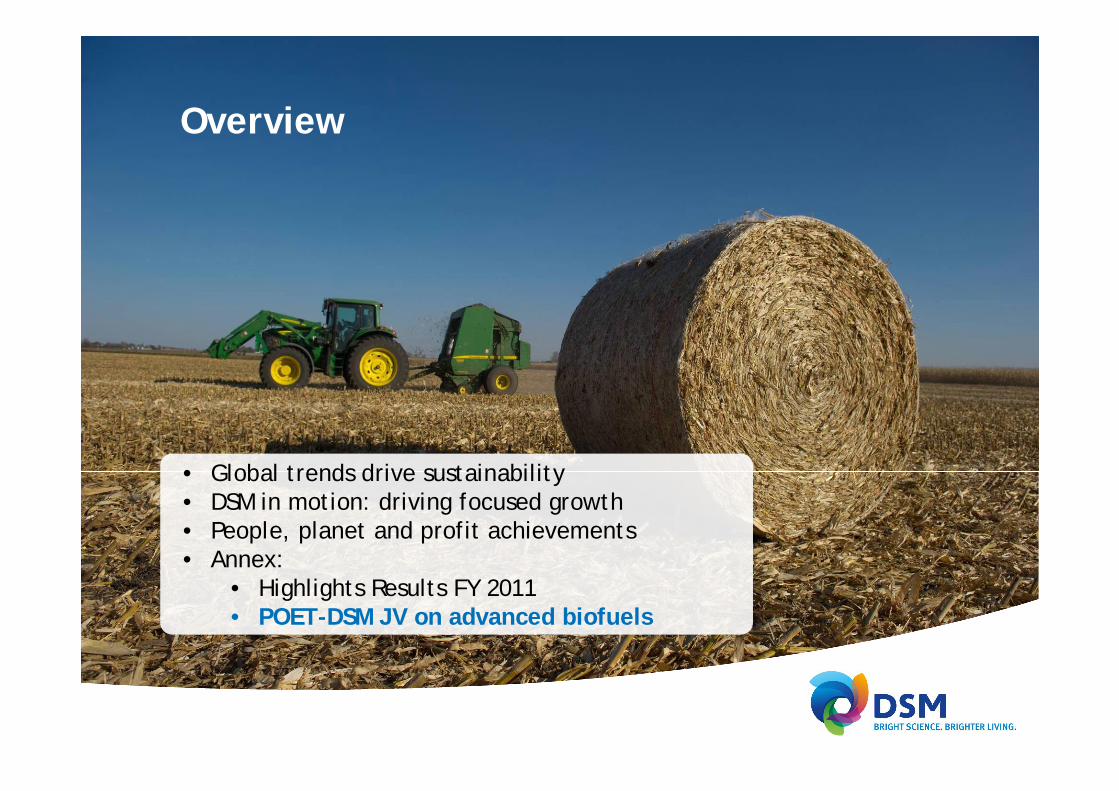
Overview
• Global trends drive sustainability• DSM in motion: driving focused growth• People, planet and profit achievements• Annex:
• Highlights Results FY 2011• POET-DSM JV on advanced biofuels
Slide 44
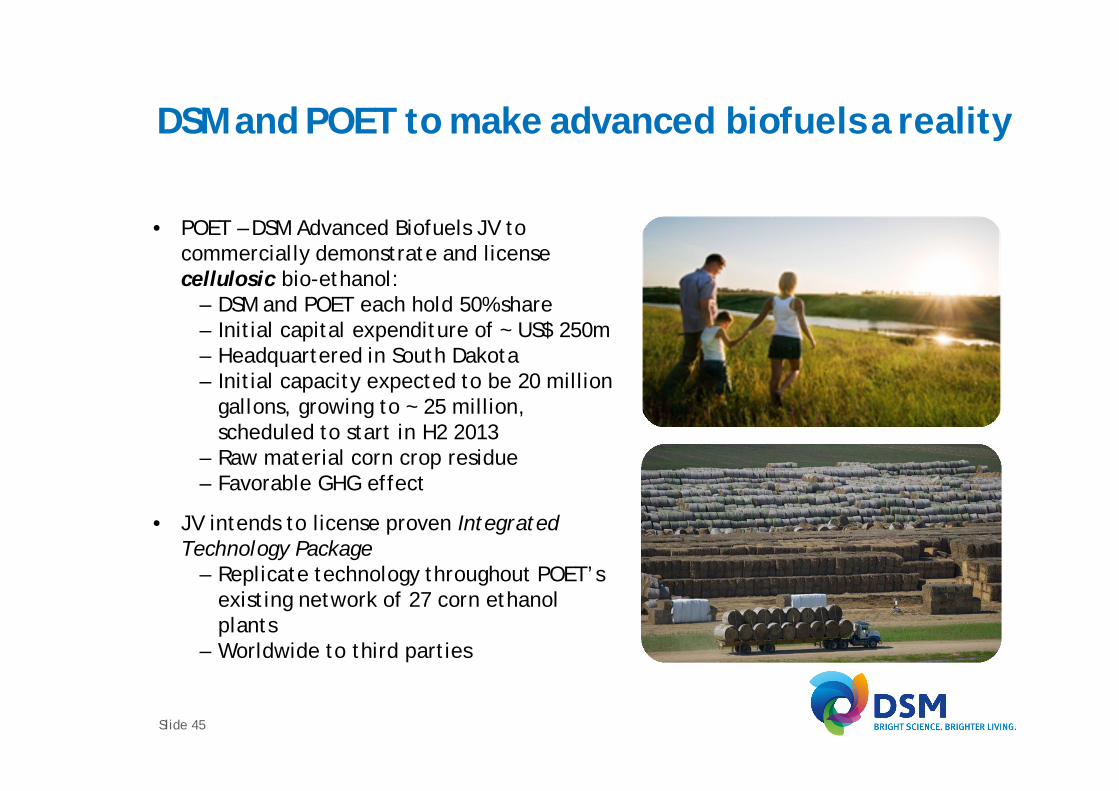
DSM and POET to make advanced biofuels a reality
• POET – DSM Advanced Biofuels JV tocommercially demonstrate and licensecellulosic bio-ethanol:
– DSM and POET each hold 50% share– Initial capital expenditure of ~ US$ 250m– Headquartered in South Dakota– Initial capacity expected to be 20 million
gallons, growing to ~ 25 million,scheduled to start in H2 2013
– Raw material corn crop residue– Favorable GHG effect
• JV intends to license proven IntegratedTechnology Package
– Replicate technology throughout POET’sexisting network of 27 corn ethanolplants
– Worldwide to third parties
Slide 45
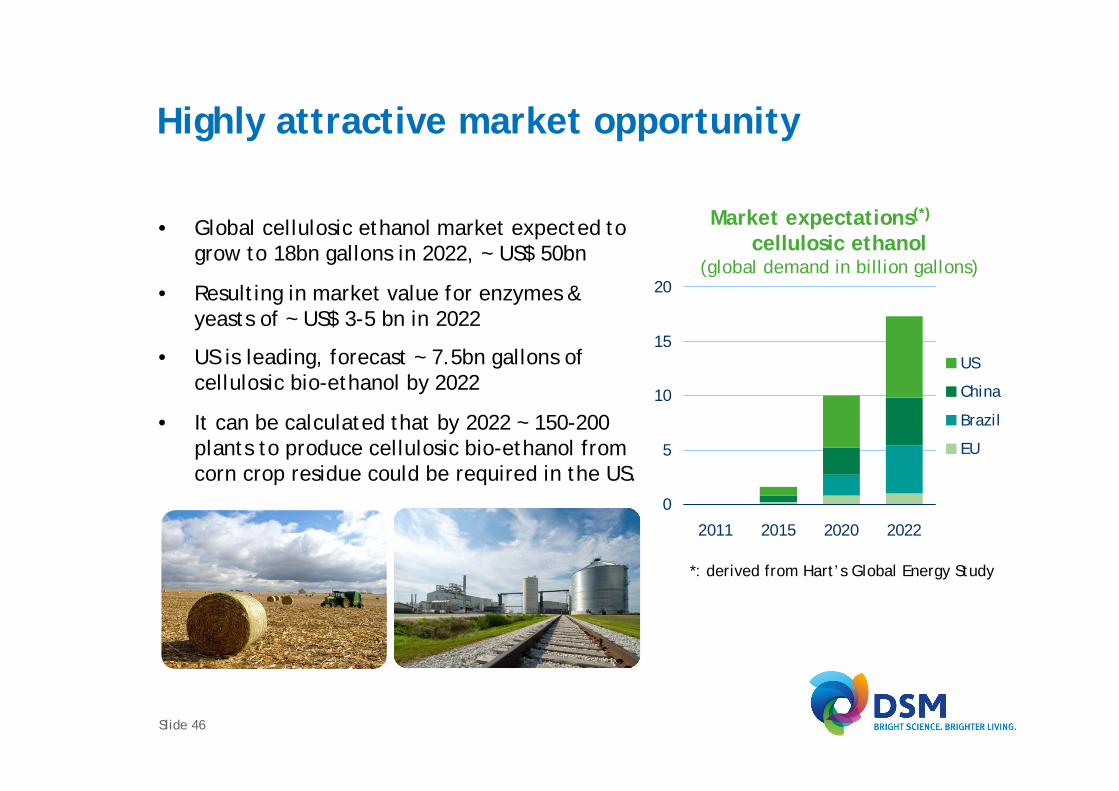
Highly attractive market opportunity
• Global cellulosic ethanol market expected togrow to 18bn gallons in 2022, ~ US$ 50bn
• Resulting in market value for enzymes &yeasts of ~ US$ 3-5 bn in 2022
• US is leading, forecast ~ 7.5bn gallons ofcellulosic bio-ethanol by 2022
• It can be calculated that by 2022 ~ 150-200plants to produce cellulosic bio-ethanol fromcorn crop residue could be required in the US.
0
5
10
15
20
2011 2015 2020 2022
US
China
Brazil
EU
Market expectations(*)
cellulosic ethanol(global demand in billion gallons)
*: derived from Hart’s Global Energy Study
Slide 46
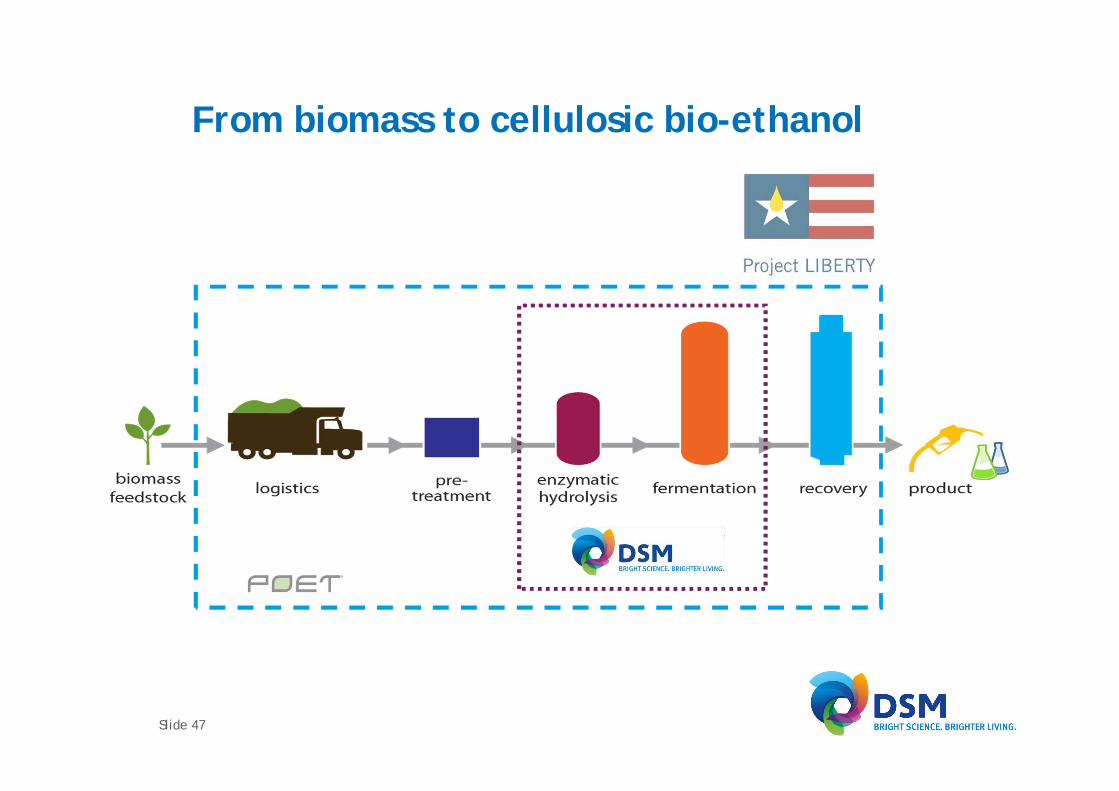
From biomass to cellulosic bio-ethanol
Slide 47
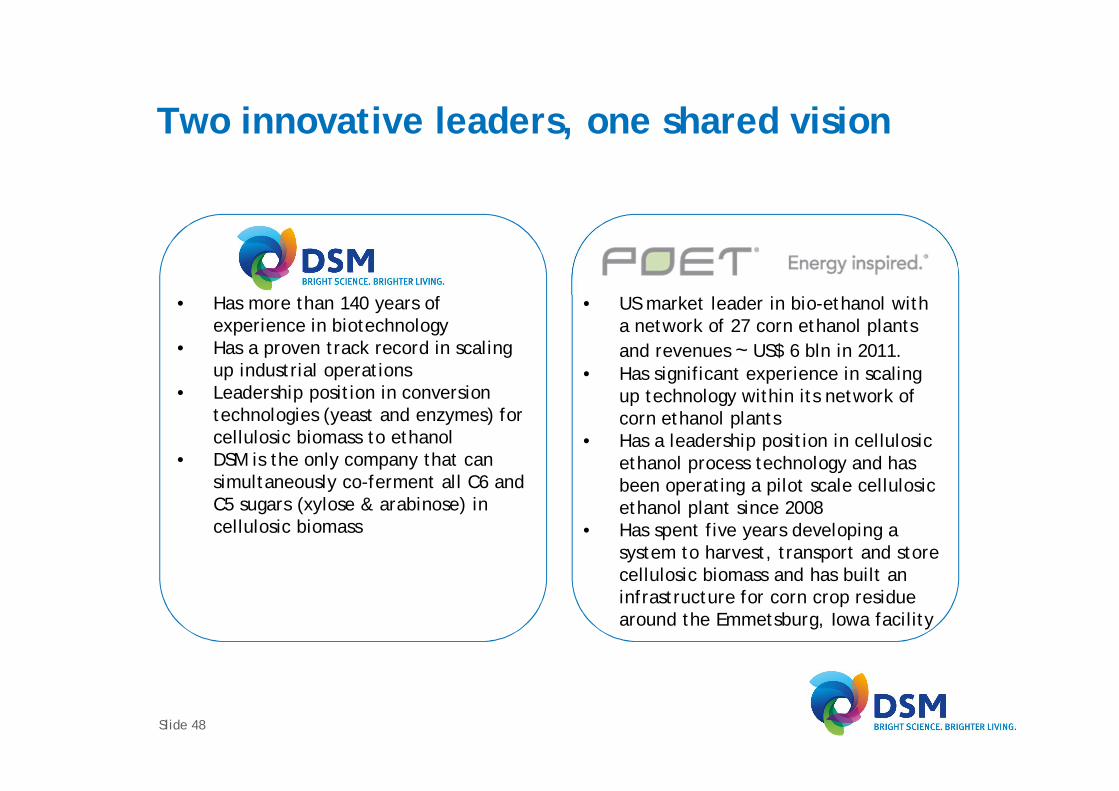
Two innovative leaders, one shared vision
• Has more than 140 years ofexperience in biotechnology
• Has a proven track record in scalingup industrial operations
• Leadership position in conversiontechnologies (yeast and enzymes) forcellulosic biomass to ethanol
• DSM is the only company that cansimultaneously co-ferment all C6 andC5 sugars (xylose & arabinose) incellulosic biomass
• US market leader in bio-ethanol witha network of 27 corn ethanol plantsand revenues ~ US$ 6 bln in 2011.
• Has significant experience in scalingup technology within its network ofcorn ethanol plants
• Has a leadership position in cellulosicethanol process technology and hasbeen operating a pilot scale cellulosicethanol plant since 2008
• Has spent five years developing asystem to harvest, transport and storecellulosic biomass and has built aninfrastructure for corn crop residuearound the Emmetsburg, Iowa facility
Slide 48
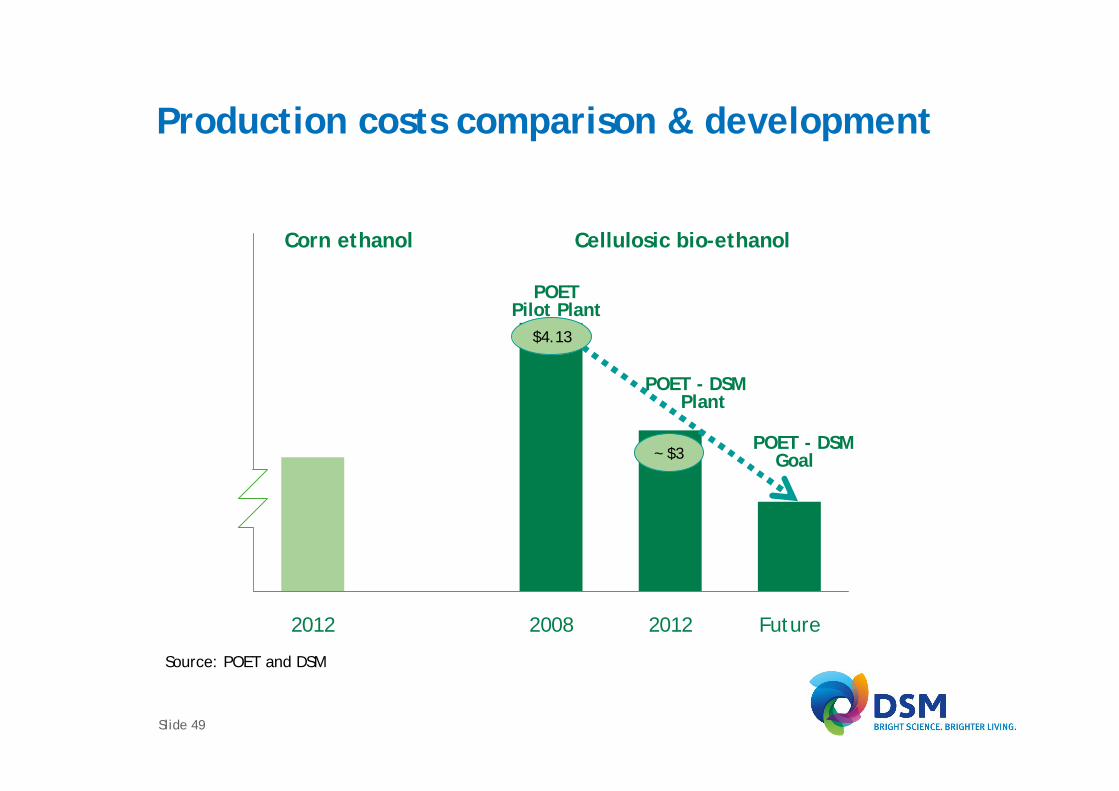
Production costs comparison & development
Source: Poet and DSM
2012 2008 2012 Future
$4.13
~ $3
POETPilot Plant
POET - DSMPlant
Cellulosic bio-ethanolCorn ethanol
POET - DSMGoal
Source: POET and DSM
Slide 49
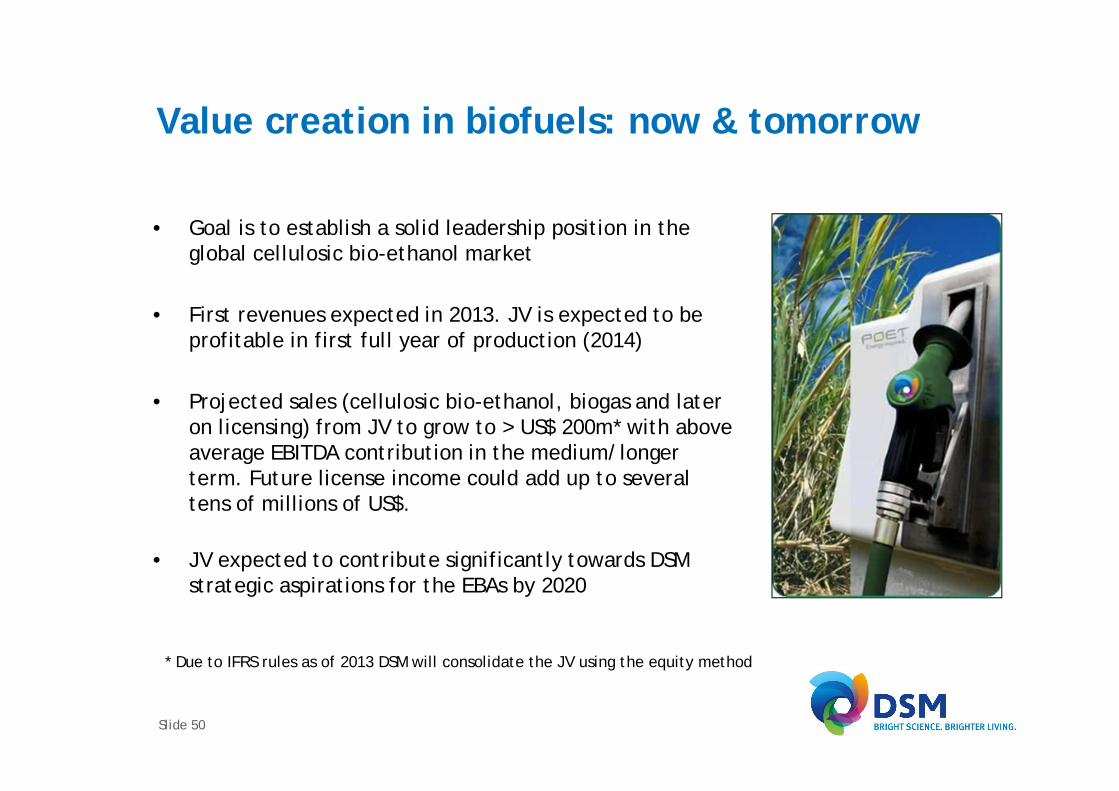
Value creation in biofuels: now & tomorrow
• Goal is to establish a solid leadership position in theglobal cellulosic bio-ethanol market
• First revenues expected in 2013. JV is expected to beprofitable in first full year of production (2014)
• Projected sales (cellulosic bio-ethanol, biogas and lateron licensing) from JV to grow to > US$ 200m* with aboveaverage EBITDA contribution in the medium/longerterm. Future license income could add up to severaltens of millions of US$.
• JV expected to contribute significantly towards DSMstrategic aspirations for the EBAs by 2020
* Due to IFRS rules as of 2013 DSM will consolidate the JV using the equity method
Slide 50
Contact:
DSM Investor RelationsP.O. Box 6500, 6401 JH Heerlen, The Netherlands
(+31) 45 578 2864e-mail: [email protected]
internet: www.dsm.com
visiting address: Het Overloon 1, Heerlen, The Netherlands