Embed Size (px)
Citation preview

Research Collection
Doctoral Thesis
Determinants of environmental product innovationa comparative study on manufacturers of electrical andelectronic appliances in Germany and California
Author(s): Kammerer, Daniel
Publication Date: 2008
Permanent Link: https://doi.org/10.3929/ethz-a-005771793
Rights / License: In Copyright - Non-Commercial Use Permitted
This page was generated automatically upon download from the ETH Zurich Research Collection. For moreinformation please consult the Terms of use.
ETH Library

DISS. ETH NO. 18057
DETERMINANTS OF ENVIRONMENTAL PRODUCT INNOVATION
A Comparative Study on Manufacturers of Electrical and Electronic Appliances in Germany and California
A dissertation submitted to
ETH ZURICH
for the degree of
Doctor of Sciences
presented by
DANIEL KAMMERER
Dipl. Umwelt-Natw. ETH
born 23.04.1974
citizen of Germany
accepted on the recommendation of
Prof. Thomas Bernauer, examiner
Prof. Volker Hoffmann, co-examiner
Dr. Marion Tobler, co-examiner
2008

Acknowledgements
The writing of a PhD thesis is not the work of only one person, but the result of cooper-
ation of many. Therefore, I would like to thank everyone who in one way or another
contributed to this thesis. First of all, I would like to thank the members of my commit-
tee, namely Thomas Bernauer, Volker Hoffmann, and Marion Tobler. They not only
provided academic support and arranged the necessary conditions for good research
but also gave me a lot of freedom to develop my own ideas and make my own plans. I
also want to thank the Swiss National Science Foundation for the funding of these
ideas and plans (grant 100012-112029), which is very much appreciated.
Further, I would like to thank Robert van Buskirk for hosting me at the Lawrence
Berkeley National Laboratory. This stay at the “Berkeley Lab” facilitated the surveying
of Californian companies very much. Furthermore, I am deeply indebted to the com-
panies that participated in my survey. Without their support, this study would not have
been possible.
I also want to thank all my colleagues at the institute for the good company, especially
Marcus Dapp for sharing the office with me through all the ups and downs of writing a
dissertation, Stéphanie Engels and Jazmin Seijas for the discussions and collaboration,
Anna Kalbhenn, Gabriele Ruoff and Lena Schaffer for support in statistics, and Claudia
Jenny for proofreading.
Special thanks go to Emily Sadigh for establishing the contact to the Berkeley Lab and
providing many stimulating experiences in the Bay Area. Further appreciation goes to
Cindy Furukawa and Chuck Smith for making us feel at home in Berkeley.
My warmest thanks go to my friends and family, most of all my parents Edeltraud Erika
and Karl-August Kammerer. My deepest gratitude goes to my fiancée Andrea Schünke
for her love, support and encouragement throughout this entire journey.
1

TABLE OF CONTENTS
Summary 4Zusammenfassung 6Chapter 1: Introduction 9
1 Motivation & Research Design 102 Structure and Main Findings 133 Policy Recommendations 154 Limitations and Further Research 155 References 17
Chapter 2: Explaining Green Innovation 211 Introduction 232 Literature Review and Analytical Framework 25
2.1 Regulation 262.2 Market Factors 292.3 Firm-Internal Factors 33
3 Empirical Application 363.1 Dependent Variable 363.2 Explanatory Variables 373.3 Level of Analysis 373.4 Sample Size 39
4 Conclusion 405 References 42
Chapter 3: The Effects of Customer Benefit and Regulation on Environmental Product Innovation in Germany 49
1 Introduction 512 Conceptual Framework 53
2.1 Regulation 532.2 Customer Benefit 542.3 Green Capabilities 552.4 Control Variables 56
3 Research Design and Data 564 Descriptive Results 58
4.1 Environmental Product Innovation 584.2 Regulatory Stringency 614.3 Customer Benefit 624.4 Green Capabilities 634.5 Conclusion of Descriptive Results 63
5 Statistical Analyses 645.1 Models and Variables 645.2 Binary Model for Environmental Product Innovation 655.3 Ordinal Logit Model for Extent of EP-Innovation 675.4 Ordinal Logit Model for EP-Innovations' Degree of Novelty 68
6 Discussion 707 Policy Recommendations 728 References 739 Appendix 77
2

Chapter 4: The Effects of Customer Benefit and Regulation on Environmental Product Innovation in California and Germany 83
1 Introduction 852 Theoretical Background and Hypotheses 86
2.1 Regulation 872.2 Market Demand and Customer Benefit 882.3 Control variables 89
3 Data Collection and Descriptive Statistics 893.1 Regulatory Stringency 913.2 Customer Benefit 923.3 Existence of EP-Innovation 933.4 Extent of EP-Innovation 943.5 Novelty of EP-Innovation 953.6 Conclusions 97
4 Multiple Analysis 984.1 Existence of EP-Innovation 1004.2 Extent of EP-Innovation 1044.3 Novelty of EP-Innovation 107
5 Conclusion 1106 References 1127 Appendix 115
Appendix A: Questionnaire of Survey in California 129Appendix B: Questionnaire of Survey in Germany 143Curriculum Vitae 157
3

SUMMARY
Environmental product (EP) innovations and their determinants have received increas-
ing attention from researchers during the past years. So far, empirical studies have
shown inconsistent results, especially regarding the impact of regulation. In this dis-
sertation, I contribute to the understanding of corporate EP-innovation by introducing
a novel research framework and testing it in empirical studies on the electrical and
electronic appliances industry.
● First, I apply a novel unit of analysis, the environmental issue level. EP-innova-
tion is not studied in broad terms but specifically for four environmental issues
that are relevant to these appliances: energy efficiency, toxic substances, mater-
ial efficiency, and electromagnetic fields. The firm as principal unit of analysis
may be too general as determinants (e.g., regulation) might vary at the firm
level across different environmental issues.
● Second, customer benefit, a concept from the green marketing literature, is in-
cluded as an explanatory variable for EP-innovation. The argument is that green
products which besides their public benefits have private environmental bene-
fits for the customer (e.g., energy savings) will generate stronger consumer de-
mand and may thus motivate the firms to implement those innovations in the
first place. The link between potential for customer benefit and EP-innovation
has not been tested in systematic empirical analyses so far.
● Third, EP-innovation is observed more comprehensively. In addition to the bin-
ary measurement whether EP-innovations have been implemented, I measure
the extent of the firms' product range for which they implemented the innova-
tions. Furthermore, I observe the degree of novelty, that is I distinguish between
innovations that are novel to the market and innovations that are only novel to
the firm.
4

I apply this research framework to study EP-innovations of Californian and German
manufacturers of electrical and electronic appliances. My results support the issue
level as unit of analysis. The impact of customer benefit and regulation on EP-innova-
tion is analyzed with logit regression and the results clearly show that both customer
benefit and regulation play a key role for EP-innovation.
The potential for customer benefit not only stimulates firms to implement environment-
al product innovations and to apply them to a large share of their products, it also mo-
tivates firms to go beyond the diffusion of already-known improvements and to develop
environmental product innovations that are novel to the market.
The stringency of regulation also promotes the broad implementation of EP-innova-
tions. However an effect on market novelties could only be shown for German manu-
facturers and had statistically weak significance. While customer benefit is more stim-
ulating for EP-innovations that are novel for the market, stringent regulation has a lar-
ger impact on the broad application of EP-innovations that are already known to the
market.
With regard to the actual EP-innovation activity, this study revealed some interesting
differences between California and Germany. Again, there is a distinction between the
extent and the novelty of EP-innovation. On the one hand, a Californian firm is more
likely to implement EP-innovations than a German firm is; and it also implements these
innovations on a broader range. On the other hand, firms in Germany generally devel-
op and implement more EP-innovations that are novel to the market.
5

ZUSAMMENFASSUNG
Ökologische Produktinnovationen (ÖP-Innovationen) und ihre Determinanten wurden
in den letzten Jahren zunehmend Gegenstand der Forschung. Empirische Studien ha-
ben bisher jedoch widersprüchliche Ergebnisse geliefert, vor allem in Bezug auf den
Einfluss von Regulierung. In dieser Dissertation erweitere ich unser Verständnis von
ÖP-Innovationen indem ich ein neues Research-Design entwickle und es zur Untersu-
chung von Herstellern von elektrischer und elektronischer Geräte anwende.
● Zum Einen verwende ich eine neue Untersuchungseinheit. Ich untersuche ÖP-
Innovationen nicht allgemein auf Firmenebene, sondern spezifisch für vier Um-
weltthemen, welche für diese Geräte relevant sind: Energie-Effizienz, Toxische
Substanzen, Material-Effizienz und elektromagnetische Felder. Dadurch behebe
ich die Problematik, dass manche Erklärungsfaktoren (z.B. Regulierung) nicht
statisch sind auf Ebene der Firma, sondern innerhalb der gleichen Firma für die
verschiedenen Umweltthemen variieren.
● Des Weiteren beziehe ich ein Konzept aus der Öko-Marketing Literatur, den di-
rekten Kundennutzen, als erklärende Variable für ÖP-Innovationen ein. Es wird
behauptet, dass jene Öko-Produkte eine höhere Kundennachfrage erzielen, bei
welchen die ökologische Verbesserung nicht nur der Gesellschaft nutzt sondern
auch dem Kunden (z.B. durch geringeren Energieverbrauch in der Nutzung).
Und dass sich Firmen deshalb vermehrt auf solche ÖP-Innovationen konzentrie-
ren, welche das Potenzial für diesen Kundennutzen haben. Dieser Zusammen-
hang zwischen dem Potenzial für Kundennutzen und ÖP-Innovationen wurde bis-
her noch nicht in systematischen, empirischen Studien untersucht.
● Schliesslich erhebe ich ÖP-Innovationen umfassender als bisherige Studien. Zu-
sätzlich zum binären Mass ob Firmen ÖP-Innovationen implementiert haben
oder nicht, erhebe ich das Ausmass und den Neuheitsgrad der ÖP- Innovatio-
nen. D.h. ich untersuche für welchen Anteil der Produktpalette ÖP-Innovationen
implementiert wurden und ob es sich dabei um Firmen- oder Marktneuheiten
handelt.
6

Dieses Research Design wende ich an, um ÖP-Innovationen bei Herstellern von Elek-
tro- und Elektronikgeräten in Kalifornien und Deutschland zu untersuchen. Die Ent-
scheidung für die Untersuchungseinheit Umweltthema wird von meinen Ergebnissen
bestätigt. Die statistische Analyse für die Auswirkung von Kundennutzen und Regulie-
rung auf ÖP-Innovationen wird mit Logit Regressionen durchgeführt. Die Resultate zei-
gen klar, dass Kundennutzen und Regulierung einen wichtigen Einfluss auf ÖP-Innova-
tionen haben.
Die Aussicht auf Kundennutzen stimuliert die Firmen nicht nur zu ökologischen Pro-
duktinnovationen und einem grossen Ausmass bei der Implementierung dieser ÖP-In-
novationen. Sie motiviert Firmen ausserdem über die Diffusion von bereits bekannten
Verbesserungen hinaus ökologische Marktneuheiten zu entwickeln.
Auch die Stringenz der Regulierung fördert die breite Umsetzung von ÖP-Innovatio-
nen. Einen Einfluss auf die Einführung von Marktneuheiten konnte jedoch nur für Her-
steller aus Deutschland nachgewiesen werden und nur mit geringer statistischer Signi-
fikanz. Während das Potenzial für Kundennutzen stärker die Einführung von Marktneu-
heiten fördert, hat stringente Regulierung eine grössere Wirkung hinsichtlich dem
Ausmass der Umsetzung von ÖP-Innovationen, welche bereits bekannt sind auf dem
Markt.
Diese Untersuchung zeigt einige interessante Unterschiede zwischen Kalifornien und
Deutschland bezüglich der tatsächlichen ÖP-Innovationsaktivität auf. Auch hier gibt es
einen Unterschied bezüglich dem Ausmass und der Neuheit von ÖP-Innovationen. Ei-
nerseits implementieren mehr kalifornische Firmen ÖP-Innovationen als es die deut-
schen Firmen tun. Ausserdem werden die Innovationen in Kalifornien auf einen grösse-
ren Teil der Produktpalette angewendet. Andererseits entwickeln und implementieren
deutsche Firmen mehr ökologische Marktneuheiten im Vergleich zu den kalifornischen
Herstellern.
7

(This page is deliberately blank)
8

Chapter 1
Introduction
9

1 Motivation & Research Design
"Over the long haul, perhaps the most important single criterion on which to judge environmental policies is the extent to which they spur new techno-logy toward the efficient conservation of environmental quality."
Kneese and Schultze (1975:82)
Since Kneese and Schulze made their statement more than 30 years ago, the question
of what drives environmental innovation in industry and what role regulation plays in
this regard has become ever more relevant. Although progress has been made for
some environmental issues (e.g., the protection of the ozone layer), the overall con-
sumption of natural resources and degradation of the environment in the developed
countries continued to grow. Moreover, fast growing developing economies such as the
BRIC countries (Brazil, Russia, India, and China) also rapidly increase both, their use
of natural resources and their emission of pollutants (cf. OECD 2008).
Ten years ago, Porter and van der Linde (1995a, b) popularized the win-win proposi-
tion, stating that environmental regulation could induce innovation by making industry
aware of and willing to exploit otherwise missed opportunities. This, they claimed,
would result in environmental benefits and increased competitiveness. The Porter hy-
pothesis has spurred a substantial amount of research on the influence of environ-
mental regulation on innovation, but the results have so far remained inconclusive, es-
pecially with regard to environmental product innovations.
In this dissertation, I focus on environmental product innovations and examine when
and why firms implement them. These innovations encompass all technical improve-
ments which lessen environmental impacts caused by products during their life cycle,
e.g., reduction of toxics and materials in products, improved power consumption and
emission output in use phase, and recycling schemes for obsolete products. While en-
vironmental innovation in general and environmental process innovation in particular
have been studied by researchers for a number of years, environmental product innov-
ations have been analyzed in systematic empirical studies only in recent years.
Through this dissertation, I advance the research on determinants of environmental
product innovation with the following three contributions.
10

(1) A novel unit of analysis:
The research designs used in extant work analyze environmental innovation activities
at the firm level. However, the firm as principal unit of analysis may be too general as
determinants (e.g., regulation) might vary at the firm level across different environ-
mental issues. For example, the regulatory environment a firm is facing regarding the
energy consumption of its products might be very different compared to the one for
the recycling of its products. Likewise, environmental innovations improve only one, at
most a few, environmental attributes of products. Hence, an analysis purely at the firm
level may not be able to directly trace back variation in the dependent variable to vari-
ation in one of the explanatory variables. Consequently, I use the environmental issue
level as unit of analysis. That means I study firms' environmental innovation activities
simultaneously for several environmental issues. This allows me to better analyze the
causal mechanisms.
(2) A new explanatory factor:
Besides the impact of regulation, I also examine the direct customer benefit which can
accrue from these environmental innovations. In the green marketing literature, it is a
common proposition that in order to be commercially successful, green products need
to deliver a private benefit for customers in addition to the public benefit of improved
environmental quality. The argument is that these anticipated customer benefits can
constitute a firm's motivation to develop and implement those environmental product
innovations in the first place. Consequently, firms are expected to focus their environ-
mental innovation activities more towards product improvements and environmental
issues that have a potential for customer benefit. While there are case studies that sup-
port this link between customer benefit and environmental product innovation, it has
not been tested in systematic empirical analyses so far.
(3) More comprehensive operationalization:
In most studies, environmental innovation is measured using a binary yes/no scale or
in terms of patents or R&D expenditure. However, R&D expenditure does not neces-
sarily lead to innovation, many patents do not lead to innovations either, and some in-
novations are not patented. In addition to the binary measurement, I measure the ex-
tent of the firms' product range for which they implemented the innovations. Further-
more, I observe the degree of novelty, that is I distinguish between innovations that
are novel to the market and innovations that are only novel to the firm. Thus, the im-
11

pact of regulation and customer benefit can be analyzed for more dimensions of envir-
onmental product innovation.
In addition to the main explanatory variables environmental regulation and customer
benefit, the analytical framework also includes market and firm-internal factors as con-
trol variables, as illustrated in figure 1.
Figure 1: Analytical Framework with independent variables (IV), control variables (CV), and the dependent variable (DV)
The empirical focus is on the electrical and electronic appliances (EEA) industry in
California and Germany. This industry is globally one of the most dynamic industries
with regard to innovation (Smith, 2005, p. 157) and growth rate (EEIG 2004). Electric-
al and electronic appliances affect the physical environment throughout their life cycle
and have a growing ecological footprint due to their increasing spread to almost every
sphere of modern life. The main environmental burden is caused by a) the high raw
material input for the manufacturing of the appliances, b) the hazardous substances
that are in the products and often generate toxic emissions as a large share of old ap-
pliances is disposed under poor environmental standards, and c) the energy consump-
tion of the appliances (Puckett and Smith, 2002; Kuehr and Williams, 2003; Hilty,
2008). Hence, I use the following environmental issues for the study: energy efficiency,
toxic substances, and material efficiency. Additionally, I use the issue of electromagnet-
ic-fields and their potential health impact. Although currently no scientific basis exists
for this health impact, the issue causes concerns and the World Health Organization
recommends adopting the precautionary principle (WHO, 2000, 2005).
12
Environmental Product Innovation
DV
Regulation
Potential forCustomer Benefits
Firm-InternalFactors
MarketFactors
IV1
IV2
CV1
CV2

Recently enacted regulations in the European Union regarding toxic substances (EU,
2003a) and the recycling (EU, 2003b) of EEA predestine these countries for research
on the effects of environmental regulation. By exceeding non-EU countries' regulations
both in stringency and scope, these EU regulations offer the possibility to analyze reg-
ulatory effects in a cross-national study. California and Germany are a good choice for
this study because both are home to a large population of electrical and electronic ap-
pliances manufacturers (Eurostat, 2004; US-Census-Bureau, 2004a, b, c). Thus, they
allow for relatively large sample sizes and increase the practical relevance of the find-
ings. Further, Germany and California are comparable with regard to the advancement
of environmental policy in general, as both states are the regional leader for this policy
field (for details see Vogel, 1995). Given that US states have wide-ranging authority in
environmental regulation, we can treat California like a country in a federal political
system, with Germany being the equivalent in the EU.
2 Structure and Main Findings
The first study, which I co-authored with Thomas Bernauer, Stéphanie Engels, and
Jazmin Seijas, has been published in a special edition of the Politische Vierteljahress-
chrift (Bernauer et al., 2007) and reprinted in Ghose (2008). In this article, the existing
literature on the determinants of environmental innovation is reviewed. Based on this
review, an analytical framework for further research is developed and its application in
empirical research is discussed. Specifically, it is argued that systematic empirical ana-
lyses of the effects of environmental regulation on environmental innovation have to be
done alongside market and firm-internal conditions. The analytical framework in figure
1 is based on this proposition. Additionally, it is proposed that the application of the
analytical framework at the “innovation field” level within firms can provide further in-
sights into the effects of regulation and customer benefit on environmental innovation.
I use this unit of analysis for my empirical studies in chapter 3 and chapter 4, however
call it the “environmental issue level” as in the previous section.
This theoretical article has been written as part of a research project and led to two
more empirical studies: Jazmin Seijas analyzed the determinants of environmental in-
novation in the German and Swiss chemical industry (2007), and Stéphanie Engels did
the same for the food and beverages industry in these countries (2008).
The second and the third study report the results of the empirical analysis for the EEA
sector. To collect the data for this analysis, I conducted two online-surveys, one for
German firms from summer to winter 2006, and one for Californian firms from spring
13

to autumn 2007. The questionnaires are provided in full length in the appendix. As (un-
fortunately) usual in surveys, not every firm completed all questions. Therefore, I could
not include data from all questions in the analysis. For the logit analysis, I imputed
missing data for the most interesting variables using the multiple imputation approach
proposed by Allison (2001). Compared to listwise deletion that is normally applied in
regression analyses, multiple imputation does not reduce the number of observations
and does not lead to biased estimates.
The second study is accepted for publication in the Journal for Ecological Economics
(Kammerer, 2009). In this study, the effects of customer benefit and regulation on en-
vironmental product innovation (EP-innovation) are analyzed using the data from Ger-
man EEA manufacturers. Altogether, 355 observations are included in the logit ana-
lyses for the three measures of EP-innovation.
The statistical analyses clearly show that customer benefit plays a key role for EP-in-
novations. The potential for customer benefit not only stimulates firms to implement
environmental product innovations and to apply them to a large share of their
products, it also motivates firms to go beyond the diffusion of already-known improve-
ments and to develop environmental product innovations that are novel to the market.
For environmental regulation the results are a little less clear-cut. While firms that
face more stringent regulation are significantly more likely to implement EP-innova-
tions and to implement them at a large extent, the stimulating effect of regulation on
the novelty of EP-innovation is only weakly significant. Thus, more stringent regulation
does lead to EP-innovations and their broad application. But it does not necessarily
lead to EP-innovations that are novel to the market.
In the third study, the data from Californian EEA manufacturers is analyzed and com-
pared to the results from the German sample. Overall, the statistical analysis of the
Californian sample corroborates the findings from the study on German EEA manufac-
turers. The main difference is that regulation showed a weakly significant effect on the
novelty of EP-innovation in the German sample which could not be corroborated by the
Californian sample.
With regard to the actual EP-innovation activity, this study revealed some interesting
differences between California and Germany. Again, there is a distinction between the
extent and the novelty of EP-innovation. On the one hand, Californian firms are more
likely to implement EP-innovations than German firms are; and they also implement
14

these innovations on a broader range. On the other hand, firms in Germany generally
develop and implement more EP-innovations that are novel to the market.
3 Policy Recommendations
Based on the empirical studies in this dissertation, the following policy recommenda-
tions can be derived: first and foremost, regulators should use their power to imple-
ment stringent environmental regulations more bravely. The results clearly show that
stringent environmental regulation does stimulate manufacturers to environmentally
improve their products. This is especially true for the diffusion of improvements that
already exist in the market place. And it is especially important for issues for which
firms cannot derive a direct customer benefit from the improved environmental attrib-
ute. However, stringent regulation alone might be insufficient to stimulate the develop-
ment of real innovations. Firms do concentrate their environmental innovation activit-
ies on areas with large potential for customer benefit. Thus, a further fruitful area for
regulators is the creation of a market conditions that transform the environmental
quality of products into a direct benefit for customer. This could mean taxes on re-
sources and emissions but also differentiated rights of use in dependence of products'
environmental performance. The environmental zones in German cities are an example
for the latter: more and more cities limit access to the city center for cars that have
high pollution profiles.
Additionally, regulators should support firms in identifying and leveraging areas in
which environmental improvements will generate direct customer benefits. To this
end, the development of green capabilities in firms should be promoted through direct
incentives but also through resources and knowledge transfer. Particularly small and
medium firms lack the financial and human resources to develop these capabilities by
themselves. Of course, the impact of all these measures will further grow if supported
by awareness raising activities that inform customers on their potential benefits from
products with higher environmental quality.
4 Limitations and Further Research
This dissertation has some limitations that are mostly related with the mode of data
collection. In contrast to the previous two dissertations on environmental innovation,
which were written at the Center for International Studies at ETH Zurich (Seijas 2007,
Engels 2008), I decided to collect my data using an online-questionnaire instead of
face-to-face interviews. The online-questionnaire has several advantages, with larger
15

sample size and better geographical outreach being the most important ones.
However, there are also some drawbacks associated with this method.
First of all, the response rate is typically lower in questionnaire-based studies (postal
or online) than in studies that apply face-to-face interviews. While the response rate in
the German study is considerably high with 32%, the Californian study has a low re-
sponse rate with only 11%. This might be an indication of self selection however, no
systematic non-response has been found. Moreover, the results do not differ consider-
ably for Germany and California.
A second issue is the reliability of the answers given by the firm representatives. This
is a challenge in every social survey, especially with online-questionnaires. Although a
benchmark-report was offered to every respondent in order to minimize their incentive
for strategically biased answers, there might be some biased answers in my data.
Closely related is the issue that much data was provided on the basis of respondents'
perception. Again, there is the possibility that managers who consider environmental
regulation to be a burden in general overestimate the stringency of some regulations.
And other managers that consider their firm to be ahead of the current regulation
might underestimate the actual burden of some regulation for their firm. This is defin-
itively an issue that further research could improve upon by taking third party data
into consideration as well, e.g. with expert panels.
A further issue is the concept of customer benefit. The results show that customer be-
nefit is not constant within an environmental issue and / or industry sector. Therefore,
not every firm in a sector attributes the same potential for customer benefit to a given
environmental issue. This raises the question of what influences firms in identifying po-
tential customer benefit of environmental issues. Is it their specific market or the kind
of customers they serve (consumers, industry, or public)? Or does it rather depend on
firm-internal factors like customer orientation or environmental strategy whether cus-
tomer benefits are recognized by firms? Further research on these questions is neces-
sary and customer benefit, which has an important impact on EP-innovation, should be
more comprehensively analyzed in further studies, for example with case studies.
Last but not least, my dissertation has a regional as well as sectoral focus. The results
are based on the electrical and electronic appliances industry in California and Ger-
many. To elaborate whether the findings can be generalized to other industries and
economies, further empirical studies will have to be conducted.
16

5 References
Allison, P.D., 2001. Missing Data. SAGE, Thousand Oaks, California.
Bernauer, T., Engels, S., Kammerer, D., Seijas, J., 2007. Explaining Green Innovation - Ten Years after Porter's Win-Win Proposition: How to Study the Effects of Regulation on Corporate Environmental Innovation? In: K. Jacob, F. Biermann, P.-O. Busch, P.H. Feindt (editors), PVS Sonderheft 39 - Politik und Umwelt. VS Verlag fuer Sozialwissenschaften, Wiesbaden, Germany, pp. 323-341.
EEIG, 2004. Convergence and the Digital World. In: EEIG (editors), European Information Technology Observatory 2004. European Economic Interest Grouping (EEIG), Frankfurt a.M., Germany, pp. 144-211.
Engels, S., 2008. Determinants of Environmental Innovation in the Swiss and German Food and Beverages Industry - What Role does Environmental Regulation Play? ETH Zurich, Zurich, Switzerland.
EU, 2003a. Directive 2002/95/EC of the European Parliament and of the Council. Official Journal of the European Union 46(L37): 19-23.
EU, 2003b. Directive 2002/96/EC of the European Parliament and of the Council. Official Journal of the European Union 46(L37): 24-38.
Eurostat, 2004. European Business - Facts and Figures 1998 - 2002. Office for Official Publications of the European Communities, Luxemburg.
Ghose, A., Ed. (2008). Green Marketing Strategies. Hyderabad, India, Icfai University Press.
Hilty, L. M. (2008). Information Technology and Sustainability. Norderstedt, Books on Demand GmbH.
Kammerer, D. (2009). The Effects of Customer Benefit and Regulation on Environmental Product Innovation - Empirical Evidence from Appliance Manufacturers in Germany. Forthcoming in Ecological Economics.
Kneese, A. V. and C. L. Schultze (1975). Pollution, Prices, and Public Policy. Washington D.C., The Brookings Institution.
Kuehr, R. and E. Williams, Eds. (2003). Computers and the Environment: Understanding and Managing their Impacts. Dordrecht, Netherlands, Kluwer Academic.
OECD, 2008. OECD Environmental Outlook to 2030. Organisation for Economic Co-Operation and Development, Paris.
Porter, M.E., van der Linde, C., 1995a. Toward a New Conception of the Environment-Competitiveness Relationship. Journal of Economic Perspectives 9(4): 97-118.
Porter, M.E., van der Linde, C., 1995b. Green and Competitive: Ending the Stalemate. Harvard Business Review 73(5): 120-134.
Puckett, J. and T. Smith (2002). Exporting Harm - The High-Tech Trashing of Asia. Seattle, Washington, The Basel Action Network and Silicon Valley Toxic Coalition.
Seijas-Nogareda, J., 2007. Determinants of Environmental Innovation in the German and Swiss Chemical Industry - With Special Consideration of Environmental Regulation. ETH Zurich, Zurich, Switzerland.
US-Census-Bureau, 2004a. Other Household Appliance Manufacturing, 2002 Economic Census - Manufacturing.
US-Census-Bureau, 2004b. Electronic Computer Manufacturing, 2002 Economic Census - Manufacturing.
17

US-Census-Bureau, 2004c. Audio and Video Equipment Manufacturing, 2002 Economic Census - Manufacturing.
Vogel, D., 1995. Trading Up - Consumer and Environmental Regulation in a Global Economy. Harvard University Press, Cambridge, MA.
WHO (2000). Electromagnetic Fields and Public Health – Cautionary Policies, World Health Organization. http://www.who.int/docstore/peh-emf/publications/facts_press/EMF-Precaution.htm (last accessed 02.04.2008).
WHO (2005). Electromagnetic Fields and Public Health – Fact Sheet N°296, World Health Organization. http://www.who.int/peh-emf/en/ (last accessed 02.04.2008).
18

(This page is deliberately blank)
19

(This page is deliberately blank)
20

Chapter 2
Explaining Green Innovation
Ten Years after Porter’s Win-Win Proposition: How to Study the Effects of Regulation on Corporate
Environmental Innovation?
co-authored with Thomas Bernauer, Stéphanie Engels, and Jazmin Seijas
published in K. Jacob, F. Biermann, P.-O. Busch, P.H. Feindt (editors),
PVS Sonderheft 39 - Politik und Umwelt (2007).
VS Verlag für Sozialwissenschaften, Wiesbaden, Germany, pp. 323-341.
21

ABSTRACT
While consumption and degradation of natural resources and the environment contin-ue to grow worldwide, worries about declining competitiveness of European industry vis-à-vis US and Asian competitors persist. Against this background, the question of what drives environmental innovation in industry and what role regulation plays in this regard has become ever more relevant. Ten years ago, Porter and van der Linde pop-ularized the win-win proposition, stating that environmental regulation could induce innovation by making industry aware of and willing to exploit otherwise missed oppor-tunities. This, they claimed, would result in environmental benefits and increased com-petitiveness. The Porter hypothesis has spurred a substantial amount of research on the influence of environmental regulation on innovation, but the results have so far re-mained inconclusive. We discuss the key problems in extant research and outline a comprehensive analytical framework for studying the effects of environmental regula-tion on innovation alongside firm-internal conditions and external market forces. This framework also takes into account varying opportunities for direct customer benefits across areas of environmental innovation. Very few political scientists have, thus far, ventured into this research area. Those who have, have focused on the sectoral, na-tional or systemic (international) level. To complement this research we propose to im-prove the micro-foundations of our understanding of environmental innovation by ap-plying the framework outlined in this paper at the firm and innovation field level within and across firms, industries, and countries.
22

1 Introduction
“Financial performance and environmental performance can go hand in hand. Eco-efficiency is the key to sustainability, in both economic and ecolo-gical terms. The key to eco-efficiency is innovation and productivity im-provement.”
Alex Krauer, Chairman and CEO, Ciba-Geigy, Switzerland, cited in Milmo (1995, p. 22)
Krauer’s statement is one of countless examples of the “Porter spirit”, which has
emerged in the last 10-15 years in advanced industrialized countries. It reflects the be-
lief that so called win-win opportunities could benefit industry and the environment
alike. The best known heralds of such win-win opportunities are Porter and van der
Linde who argued that “…properly designed environmental standards can trigger in-
novation that may partially or more than offset the costs of complying with them”
(Porter and van der Linde, 1995a, p. 98). Environmental regulation could, they
claimed, induce innovation by making industry aware of and willing to exploit other-
wise missed opportunities.
The “Porter hypothesis” has spurred substantial amounts of research on the influence
of environmental regulation on innovation. While adherents of the Porter hypothesis
have sought to demonstrate the empirical relevance of the win-win claim, neoclassical
economists have argued that such win-win opportunities are exceptions. They have
pointed to significant compliance costs of industry, competitive disadvantages of do-
mestic firms in international markets, and opportunity costs of forced environmental
activities (e.g., Jaffe et al., 1995, Palmer et al., 1995). Recent research has sought to
bridge the boundaries between “traditional” economists and “revisionists” by combin-
ing assumptions from neoclassical and evolutionary economics, and by testing proposi-
tions in large-N quantitative studies (e.g., Johnstone et al., 2007)1. But so far, the res-
ults have remained inconclusive.
The question of what drives environmental innovation in industry and what role envir-
onmental regulation can or should play in this regard has become ever more policy-rel-
evant in recent years. On the one hand, worldwide consumption and degradation of
natural resources and the environment has continued to grow and environmental in-
novations are considered an important option for mitigation or avoidance of environ-
mental degradation. On the other hand, worries about declining competitiveness of
European industry vis-à-vis American and Asian competitors persist and policy makers
1 This publication reports preliminary results from an OECD study that covers more than 4000 facilities in seven OECD countries.
23

are seeking to reduce the regulatory burden on industry. We address this debate by de-
veloping an empirically useful analytical framework for studying the drivers (regulat-
ory and other) of environmental innovation.
We argue that identifying key determinants of “green” innovation requires analysis of
the effects of environmental regulation alongside market and firm-internal conditions.
Presently, research on innovation, including “green” innovation, is scattered across dif-
ferent academic disciplines; each piece of research tends to focus on a narrow range of
determinants and particular levels of analysis. Industrial organization specialists con-
centrate on market structure, while strategic management specialists focus primarily
on firm-internal variables. Those studying the impact of environmental regulation on
green innovation (most often economists, but also some political scientists) tend to
sideline non-regulatory influences. We use previous work by authors such as Hemmel-
skamp (1999), Kemp (1997), and Klemmer et al. (1999) as a starting point. Our contri-
bution focuses on identifying gaps, deficiencies, and unresolved issues in extant stud-
ies and developing a framework for further research.
We locate the principal weaknesses in existing research primarily in problematic defin-
itions / operationalizations of the dependent variable (i.e., innovation), level of analysis
problems (i.e., sector / industry, firm, facility, regulated activity), and poorly under-
stood causal effects of explanatory variables on each other and on innovation. We ar-
gue that changing the focus from the sector / industry level to the firm and innovation
field level – the levels at which environmental innovations in fact take place - can im-
prove our understanding of causal mechanisms. Those few political scientists who have
thus far worked on issues of environmental innovation have concentrated on cross-sec-
tor and cross-country comparisons(e.g., Jaenicke Martin et al., 2000, Jacobs et al.,
2005). This research has offered very useful insights into macro-level trends in this
field but needs to be combined with stronger insights into the underlying micro-level
processes, notably, innovation-related decisions and behavior at the firm level. To this
end, our paper builds primarily on the economic and business studies literature.
The paper is organized as follows. After clarifying some definitional issues, we review
the existing literature and develop an analytical framework for further research. We
end by discussing how this framework could be applied in empirical research.
24

2 Literature Review and Analytical Framework
We begin by clarifying some definitional issues before reviewing the existing literature.
Regulation can be defined broadly “to include the full range of legal instruments by
which governing institutions, at all levels of government, impose obligations or con-
straints on private sector behavior. Constitutions, parliamentary laws, subordinate le-
gislation, decrees, orders, norms, licenses, plans, codes and even some forms of admin-
istrative guidance can all be considered as regulation” (OECD, 1997a, p. 9). Environ-
mental regulation includes environment-related regulation that considers and impacts
the environment (Kemp R., 1998, p. 14).
Environmental innovations encompass all innovations that have a beneficial effect on
the environment regardless of whether this effect was the main objective of the innova-
tion2. They include process, product, and organizational innovations (OECD, 1997b).
We will focus primarily on explanations of product and process innovations.
• Organizational innovations do not reduce environmental impacts directly, but fa-
cilitate the implementation of technical (process and product) environmental in-
novations in companies (Murphy and Gouldson, 2000).
• Process innovations are defined as improvements in the production process res-
ulting in reduced environmental impacts, e.g., closed loops for solvents, materi-
al recycling, or filters.
• The principal environmental impact of many products stems from their use (e.g.,
fuel consumption and CO2 emissions of cars) and disposal (e.g., heavy metals in
batteries) rather than their production. Accordingly, product innovations aim at
reducing environmental impacts during a product’s entire life cycle (from cradle
to grave).
Environmental innovations are different from other innovations; besides producing the
spillover effect typical of most R&D efforts they also produce positive externalities in
and of themselves, i.e., they reduce external environmental costs of production or
products. Rennings (2000, p. 325) has called this characteristic a “double externality
effect”.
The literature on the determinants of innovation is vast. Yet, most of this literature fo-
cuses on particular determinants of innovation, and only small parts of this literature
focus on environmental innovation. Contemporary research on the relationship
2 The terms eco-innovation and green innovation are used synonymously for environmental innovation.
25

between environmental innovation and regulation is based on the assumption that
technology push and market pull factors, firm internal conditions, and regulatory con-
ditions drive the extent and form of environmental innovations. Kemp et al. (2000), for
example, propose to focus on the incentives to innovate, meaning competitive pressure
and market demand, the ability of firms to process and integrate knowledge, and the
managerial capability to handle the innovation process within and across companies.
This approach combines perspectives from evolutionary economics and environmental
economics, as explained in Rennings (2000). It is used in recent “multi-dimensional”
studies that take into account regulatory, market, and firm-internal conditions.
The following literature review, from which we derive a set of hypotheses, is structured
along the following lines: (1) research concentrating on the impact of regulation on
green innovation, (2) studies on market factors and how they influence green innova-
tion, and (3) research focusing on impacts of firm-internal factors on green innovation.
2.1 Regulation
Environmental regulation is viewed in neoclassical economics as a means to force
firms to internalize external costs they would otherwise impose on society. Environ-
mental regulation is (or rather should be), therefore, implemented in cases of market
failure. Though, in principle, its necessity under conditions of market failure is uncon-
tested in environmental economics (Rennings, 2000), the policies to be chosen (instru-
ment type) in particular cases and the stringency of regulation are very much subject
to debate.
Traditionally, the neoclassical economic view has been that (strict) regulation has neg-
ative effects on productivity and competitiveness, as it leads to higher expenses by
businesses and imposes constraints on industry behavior. Regulation can also increase
uncertainty associated with future investments, so that they are postponed. Given that
investment budgets are limited, enforced R&D for cleaner technology can have the ef-
fect of reduced R&D expenditure in other, more profitable areas, such as a firm’s core
business (Gray and Shadbegian, 1995).
In the 1990s, Porter and van der Linde popularized the claim that properly structured
environmental regulation may not only benefit the environment – and hence society as
a whole – but also the regulated industries by making firms realize otherwise neg-
lected investment opportunities (1995b, a)3. Specifically, Porter and van der Linde ar-
gued that (strict) environmental regulation and associated compliance costs could
3 Ashford et al. (1985) and Ashford and Heaton (1983) had made this point already in the early- to mid-1980s.
26

force industry to innovate and thus increase resource efficiency and enhance pro-
ductivity. They suggested that environmental regulation could also increase turnovers
and profits by creating markets for environmentally improved products and technolo-
gies, and that compliance costs may be offset by the gains from these innovations, so-
called innovation offsets.
Neoclassical economists have heavily criticized the “win-win” hypothesis. They have
argued that regulation might motivate firms to develop eco-innovations, but that these
efforts would produce opportunity costs offset only in exceptional cases (see e.g., Jaffe
et al., 1995; Palmer et al., 1995). Some authors have refined Porter’s argument and
have offered more nuanced theoretical explanations for the existence of previously
overlooked win-win opportunities that could be stimulated by regulation (see e.g.,
Roediger-Schluga, 2004). Applying principal-agent theory, bounded rationality, and
spillover effects, Gabel and Sinclair-Desgagné (1998), Bonato and Schmutzler (2000),
Schmutzler (2001) and Mohr (2002) derive possible but rare conditions under which
regulation can induce innovations that fully offset compliance costs.
This theoretical controversy has motivated empirical research on a considerable scale
on the relationship between regulation and green innovation. So far, the empirical res-
ults have remained inconclusive. While qualitative case studies (e.g., Bonifant et al.,
1995, Porter and van der Linde, 1995b, a, Shrivastava, 1995) are based on rather anec-
dotal evidence, more systematic econometric studies have failed to produce unequivoc-
al results (e.g., Jaffe et al., 1995). Quantitative studies in particular often use (overly)
simple indicators, e.g. measuring innovation by the number of patents and R&D invest-
ment (including also non-environmental R&D). Jaffe and Palmer (1997) for instance ob-
tain different results for the aforementioned two innovation indicators. Brunnermeier
and Cohen (2003) find that increases in pollution abatement expenditure influence
green innovation (measured by the number of successful environmental patent applica-
tions granted to industry), but only marginally. Using a theoretical model, Bonato and
Schmutzler (2000) derive strategic (spillover effects) and organizational (principal
agent problem) factors explaining why environmental regulation could stimulate cost-
reducing innovations that would not have been undertaken without regulation.
Another important area of research focuses on the influence of instrument choice, not-
ably market-based incentives versus command-and-control instruments, on technolo-
gical innovation4. Since market-based incentives provide more flexibility for economic
actors, they are generally viewed as more efficient than command-and-control instru-
4 See Jaffe et al.(1995, 1997, 2002, 2004). See Jaffe et al. (2002, 2004) for a detailed review of studies on the effects of instrument choice on technological innovation.
27

ments. However, it remains unclear how and to what extent instrument choice actually
affects innovation (Jaffe et al., 2004). In his comparison of instruments, Kemp (1997, p.
317) finds that “there is no single best policy instrument to stimulate clean technology,
all instruments have a role to play, depending on the context in which they are to be
used”. Based on case studies, Klemmer et al. (1999) reach the same conclusion. A re-
cent study by Frondel et al. (2007) shows that policy stringency is more important than
policy instrument choice.5
Jaenicke et al. (2000) observe that a combination of different policy instruments works
better and propose to take into account policy style, arguing that “[a] policy style is in-
novation friendly if it is based on dialogue and consensus, is calculable, reliable and
has continuity, is decisive, proactive and ambitious, is open and flexible...” (Jaenicke et
al., 2000, p. 135). How these variables could be made operational for purposes of
large-N research remains open (Jacob et al., 2005).
Recent research has moved the unit of analysis from the industry level to the individual
firm and facility level. It also distinguishes between process and product innovations.
These studies survey firms’ environmental behavior and the role played by several de-
terminants of green innovation. They have produced plausible evidence for some firm-
internal determinants of green innovation. However, effects of regulation have been
observed only for environmental process innovation (Cleff and Rennings, 1999, John-
stone et al., 2007), but remain unclear for environmental product innovation. For ex-
ample: a study by Hemmelskamp (1999) suggests a negative influence of regulation on
environmental product innovation, whereas Rehfeld et al. (2007) as well as Johnstone
et al. (2007) find positive effects and Cleff and Rennings (1999) find a positive effect
solely for market-based regulation.
In other words, responding to the question of whether (strict) environmental regula-
tion fosters or impedes environmental innovation appears to require a differentiation
between process and product innovation. Most studies have failed to do so.
We submit that further research should pay particular attention to two aspects of (en-
vironmental) regulation that may have an influence on environmental innovation: strin-
gency and (reliable) predictability. Regulation, measured in those terms, may have two
types of effects on environmental innovation. On the one hand, it can push environ-
mental innovations that have no sufficient market pull or technology push effects or
were simply overlooked by a firm. By setting standards, regulations can force compan-
5 For a discussion of why it is so difficult to determine the influence of single policy instruments see Jaenicke (1997).
28
ies to adapt products or production processes. On the other hand, regulation can pro-
mote environmental (product) innovations by establishing market incentives that prom-
ise an increase in turnovers and profits (market pull effects).
The stringency of regulation can be measured in terms of how much change in a given
firm regulation induces. Whether stringency has a weak or strong effect on innovation
at the firm level depends in part on how well the firm can adapt to external pressure.
The ability to adapt may vary with firm size and market structure, how research driven
the firm is, etc. For example, firms may choose to abstain from research on and devel-
opment of environmentally friendly products if costs are very high and potential mar-
kets do not look promising.
H1: We hypothesize that the stringency of regulation influences environmental in-
novation. The direction and extent of this influence depends on market and firm-intern-
al factors. Regulation is more likely to have a positive impact on process innovations
than on product innovations.
Innovation processes usually involve substantial risks and uncertainties; the strategies
concerned require a long planning horizon. Therefore, predictability – the degree to
which future regulation and its properties can be foreseen – has a positive influence on
innovation because it reduces risks and uncertainty. Predictability not only means that
new regulations are announced early. Early signals of future regulation will only in-
duce prospective action if regulators are considered to be reliable; reliability goes
hand in hand with credibility (Jaenicke, 1997). This means that in assessing predictab-
ility we have to take into account at least the two dimensions: “early announcements”
by a “reliable” actor.
H2: We hypothesize that predictability of regulation supports environmental innova-
tion.
2.2 Market Factors
Research in innovation economics has long centered on whether technological devel-
opment (technology push) or demand factors (market pull) are more important drivers
of technological innovation. Empirical research has shown both to be relevant (Pavitt,
1984). Technology push seems to be more important at the beginning of the product
cycle, market opportunities seem to be more important at later stages (Mowery and
Rosenberg, 1979, Freeman, 1994, Jaenicke et al., 2000). A peculiarity of environmental
29

innovation, however, may be that market pull and technology push are comparatively
weak, calling for a “regulatory push/pull effect” (Rennings, 2000:326).
Market pull includes aspects such as competitiveness (mostly considered by the indus-
trial organization literature) and customer demand (be it the end consumer or corpor-
ate customers; mainly studied by strategic management research). Technology push in-
cludes aspects such as energy or materials efficiency and product quality.
The industrial organization literature focuses on market structure as a key determin-
ant of innovation. Many of these studies are, in one way or another, derived from
Schumpeter’s hypothesis (1942), postulating a positive influence of market concentra-
tion and firm size on innovation. Schumpeter argued that market concentration re-
duces market uncertainty and motivates firms to invest in R&D. Other authors argue
the opposite, claiming that concentration leads to inertia and hinders innovation due to
missing competitive pressure (Levin et al., 1985). Schumpeter (1939) states, further-
more, that the possibility of large firms to act in a monopolistic way increases their
willingness to take risks.
Many authors have tested Schumpeter’s hypothesis, predominantly in regard to forms
of innovation other than environmental. According to Acs and Audretsch (1987), large
firms are more innovative in concentrated, capital-intensive markets; smaller firms
have an advantage in markets that are more competitive. Their smaller size enables
them to react faster to change, because of less bureaucracy, higher commitment of
management, more exposure to competition, higher R&D efficiency, and niche
strategies (Geschka, 1990, Rothwell and Dodgson, 1994). Levin et al. (1985) emphasize
the importance of appropriate technological opportunities and reject the influence of
market concentration on innovation. Baylis et al. (1998) and Clayton et al. (1999) ar-
gue that environmental activities go along with a higher amount of financial and hu-
man resources, which is why larger firms have better opportunities and abilities to re-
duce environmental impacts. Several empirical studies show that, by and large, firm
size has a positive influence on environmental innovation (e.g., Cleff and Rennings,
1999; Rehfeld et al., 2007).
The strategic management and green marketing literature focuses on various market
factors, but pays particular attention to market demand for green products (Meffert
and Kirchgeorg, 1998, Belz, 2001). In this literature, environmental product innova-
tions are seen as a differentiation tool for firms that helps maintain/increase market
share. In the 1980s and early 1990s, green consumerism, i.e., consumers' considera-
tion of environmental aspects in purchasing situations and their willingness to pay
30

premiums for green products, was widely believed to emerge and gain momentum
(Peattie, 2001). For example, Straughan and Roberts (1999) identify high income, high
education level, liberal political orientation and, most importantly, perceived consumer
effectiveness (PCE)6 as positive determinants of environmental attitudes and behavior
(see also Roberts, 1996, Roberts and Bacon, 1997). Yet, other studies show that con-
sumers' claims to prioritize green attributes have mostly not matched their actual pur-
chasing behavior (Wong et al., 1996, Kuckartz, 1998, Prakash, 2002).
Meffert and Kirchgeorg (1998) emphasize that (public) environmental benefits need to
be combined with private consumer benefits for products to be successful in the mar-
ket. Examples of such customer benefits include cost savings through energy efficient
appliances, improved product quality and durability, beneficial health effects, and
prestige enhancement (ibid). Products that have no customer benefits additional to
their environmental benefits are not likely to be favored by the mass-market (Villiger
et al., 2000). Provision of understandable and credible information on products' envir-
onmental attributes is noted as a further success factor for green products (Wong et
al., 1996, Meffert and Kirchgeorg, 1998, Reinhardt, 1998). Such efforts can be facilit-
ated by eco-labelling schemes (Hemmelskamp and Brockmann, 1997, Prakash, 2002).
Only few studies have looked at differences between demand for environmental
product and process innovations, and between corporate customers and end con-
sumers, in respect to purchasing behavior and, therefore, influence on strategic de-
cisions. Cleff and Rennings (1999) find that, empirically, market considerations are
more important for product, and environmental regulation more important for process
innovations. While a firm’s visibility from a public perspective decreases with its dis-
tance from the end consumer, supply chain pressure – large firms demanding environ-
mentally friendly behavior from their suppliers – can be an important driver (Gunning-
ham et al., 1999). But the importance of such supply chain pressure has not been sys-
tematically analyzed and rests on anecdotal evidence, for instance from the automobile
industry.
In summary, the industrial organization literature provides ambiguous evidence on the
influence of market concentration on environmental innovation. The green marketing
literature predicts market success primarily for environmentally improved products
that have bundled customer benefits and / or provide credible information on their en-
vironmental quality. However, empirical studies focusing on these determinants of in-
novation are sparse. We submit that further research should focus particularly on com-
6 Consumers’ attitudes and responses to environmental issues are a function of their beliefs that they can positively influence the outcome of environmental problems. See Straughan and Roberts (1999).
31
petitiveness and customer demand as potential determinants of environmental innova-
tion.
In competitive markets firms’ principal differentiation tools are price and quality– in-
novations are important either to enhance efficiency (reduce costs) or to improve a
product’s quality. Radical innovations often imply high R&D efforts, long development
time, and high risks. Large firms in concentrated markets are more likely to have the
capacity for such efforts.
H3: We hypothesize that the more competitive a market is the more environmental
innovations will occur, particularly in large firms.
Customer demand can be a strong driver of firm behavior. The most promising environ-
mental innovations, from the perspective of firms, are those that offer a triple benefit:
for the environment, the customer, and the producer alike. Such innovations are more
likely to be product innovations, because in this case the potential benefits for the cus-
tomer are clearer and easier to market.7 Products of this kind should offer direct cus-
tomer benefits in addition to diffuse environmental improvement. Such direct benefits
include for instance better quality, longevity, better repair, upgrade, and disposal pos-
sibilities, as well as reduced consumption costs (e.g., energy efficiency) or health im-
pacts (depending on the industry analyzed).
Not every environmental improvement in a product holds the same potential for direct
customer benefits. For instance, higher energy efficiency of products yields a clearer
customer benefit than a reduction of materials – notably, if combined with higher en-
ergy prices (due to market developments or energy taxes). Also, immediate economic
benefits such as higher product longevity or energy efficiency can be more attractive
to customers than more hidden, long-term benefits such as a reduction in toxic sub-
stances. We denote the aspects of products that can be improved as innovations fields.
H4: We hypothesize that firms are more likely to engage in environmental innova-
tion the higher and more obvious the potential customer benefits in an environmental
innovation field are.
7 There are, of course, also non-monetary, say ideational or ideological benefits for certain customers from buying a “green” product without material benefits. But such products tend to occupy very small niche markets.
32

2.3 Firm-Internal Factors
The strategic management literature provides insights into firm-internal conditions
and firm strategies. Theoretically, the consideration of firm-internal factors is often
based on evolutionary theory and most notably the resource-based view of the firm
(Nelson and Winter, 1982, Wernerfelt, 1984, Barney, 1991). The resource-based view of
the firm holds that firm-internal characteristics, such as strategy, structure, and core
capabilities, are important determinants of innovation (Fagerberg et al., 2005) and im-
portant to competitive advantage. Resources are classified into tangible (e.g., financial
reserves), intangible (e.g., reputation), and personnel-based (e.g., culture, training) re-
sources. The consideration and benefits of intangible properties are particularly em-
phasized. Organizational capabilities to “assemble, integrate, and manage” these
bundles of capabilities / resources play an important role (Russo and Fouts, 1997, p.
537). Collis and Montgomery note, “[r]esources cannot be evaluated in isolation, be-
cause their value is determined in the interplay with market forces” (Collis and Mont-
gomery, 1995, p: 120).
Building on the resource-based view, Hart (1995) links competitive advantage to a
firm’s relationship with the natural environment. The strategic implications focus on
pollution prevention, product stewardship, and sustainable development. Pollution pre-
vention can provide win-win opportunities through process innovations (resource-effi-
ciency). Product stewardship can foster competitive advantage through product differ-
entiation and prevention of potential regulation8. Russo and Fouts (1997) elaborate on
this concept and postulate a positive link between firms' environmental and economic
performance based on reputation benefits from environmental performance. Sharma
and Vredenburg (1998) find empirical evidence that companies develop green organiz-
ational capabilities after having adopted a proactive environmental strategy.
As regards innovation, an important asset is the general commitment to innovation.
Besides showing a high commitment, R&D units are considered tools for solving organ-
izational problems. R&D expenditure is a common proxy for and closely related to a
firm's innovation activity (Sanchez, 1997). Rehfeld et al. (2007) find that R&D activities
tend to have a positive influence on environmental product innovation. But they find no
effect for process innovation.
Building on the Porter hypothesis, a considerable body of literature classifies and ana-
lyzes corporate environmental strategies and their potential for gaining competitive
8 There are some indications that the low hanging fruits of direct cost savings through environmental innovations have mostly been found and realized already. See Hoffman (2000).
33

advantage.9 Most typologies differentiate between two dimensions (Meffert and
Kirchgeorg, 1998): first, the timing of corporate activities in relation to regulations or
public concerns; such timing is often viewed in terms of proactiveness or reactiveness.
Second, the scope of corporate environmental activities – usually defined as firm-in-
ternal (processes) or market-oriented (products) or both. Cleff and Rennings (1999)
find significant effects on environmental product innovation only for the strategic goal
of maintaining or increasing market share. In contrast, Rehfeld et al. (2007) find signi-
ficant effects for the goal of complying with existing / anticipated legal requirements.
As regards environmental process innovation, Cleff and Rennings (1999), but not Re-
hfeld et al. (2007), observe that legal compliance as an innovation goal has a signific-
ant effect on environmental innovation.
Some authors concentrate on organizational capabilities, particularly environmental
management systems (EMS), and their influence on green innovation. The assumption
is that (certified) EMS such as ISO 14’001 or its European version EMAS facilitate the
introduction of environmental innovations directly by mandating companies to estab-
lish environmental goals and management structures as well as programs to achieve
them (Coglianese and Nash, 2001, Johnstone, 2001); and indirectly by inducing organ-
izational learning and providing critical environmental information (Melnyk et al.,
2003). Thereby the “capacity to innovate” is enhanced (Bradford et al., 2000, p. 10).
Empirically, a positive impact of EMS on green innovation activity is observed in a re-
cent OECD study (Johnstone et al., 2007). Melnyk et al. (2003) examine the impacts of
certified / non-certified EMS. They find that certified EMS are associated with stronger
overall environmental performance of a firm. Dyllick and Hamschmidt (2000) observe
that the influence of ISO 14’001 appears to be gradually shifting from process to
product innovation. When voluntary self-regulations are employed as surrogate envir-
onmental regulations, a major concern is of course that they might be employed as fig
leafs because there are no impartial control mechanisms. In a quantitative analysis of
data from the US EPA's Toxic Release Inventory (TRI), King and Lenox (2000) find that
particularly the larger, dirtier, and more visible firms participated in the voluntary Re-
sponsible Care program of the chemical industry. But as the authors note, it could also
be that participating firms report their emissions more reliably, and therefore just ap-
pear to be dirtier.
In summary, several studies have examined the influence of firm internal factors on en-
vironmental innovation. EMS certification appears to have a positive effect on environ-
mental innovation, but for environmental strategy / innovation goals, the results are in-
9 Examples include Rugman and Verbeke (1998) and Hoffman (2000).
34

conclusive. Further research should focus particularly on the effects of green capabilit-
ies, R&D intensity, and firm size.
Green capabilities comprise a firm's attitude towards and knowledge of environmental
issues relevant to its business, and procedures for acting and reacting on these issues.
These capabilities as well as related structures and activities facilitate the identifica-
tion of potential environmental innovations. Moreover, when forced by regulation, the
acquired knowledge and procedures facilitate the development and implementation of
environmental innovations to meet those requirements. Green corporate strategies af-
fect whether the search for environmental opportunities is part of the main scope and
a leverage instrument for competitive advantage. The implementation and advance-
ment of an environmental management system generates knowledge on the firm's en-
vironmental impacts as well as procedures to mitigate them.
H5: We hypothesize that with growing maturity of a firm’s green capabilities more
environmental innovations will take place.
Figure 1: Framework for studying the determinants of environmental innovations
Environmental innovations
Green capabilities
Innovativeness
Firm size
Competitiveness
Customer benefit
Regulatory determinants
Market determinants
Firm internal determinants
Stringency
Predictability
General innovativeness increases the probability that firms will also be environment-
ally innovative. As shown in previous studies, the R&D activity of a firm may indicate
its commitment to and experience with environmental innovation. Although R&D does
not automatically lead to innovations, R&D is still the most widely used strategy aim-
ing at innovation - its importance for a firm mirrors the importance of innovation in a
firm's competitive setting.
35
H6: Firms with a stronger commitment to innovation in general (R&D intensity) are
more likely to engage in environmental innovation.
Larger firms tend to have more resources for R&D and environmental activities. They
are also able to exploit economies of scale more easily and thus to acquire innovation
benefits.
H7: We expect firm size to have a positive influence on green innovation.
3 Empirical Application
Recent research focusing on the three types of determinants (regulation, market and
firm-internal conditions) simultaneously has advanced our understanding of when and
how these factors influence innovation activity and how they might interact. Yet, many
if not most of the empirical results on the impacts of individual factors – most notably
regulation – as well as on their interacting effects have remained inconclusive or con-
troversial. This section discusses how the analytical framework sketched above could
be applied in empirical research.
3.1 Dependent Variable
Most empirical studies on environmental innovation use questionable indicators for the
dependent variable. Environmental innovation is usually measured in a binary fashion
(yes/no), often at the facility level, or in terms of patents or R&D expenditure. R&D ex-
penditure does not necessarily lead to innovation, many patents do not lead to innova-
tions, and some innovations are not patented. Also, many industry sectors cannot
and/or do not patent their innovations at all.
We submit that environmental innovation should be measured in more comprehensive
ways. We suggest defining the outcome to be explained in terms of the extent and type
of environmental innovation as well as environmental performance improvement for in-
dividual innovations.
Extent of innovation: The number of environmental innovations within each field of in-
novation provides a much better understanding of firms’ innovation activities than the
simple yes/no measurement of innovation.
Type of innovation (product or process innovation): As discussed above, this distinction
is necessary to disentangle the effects of potential determinants.
36

Environmental performance improvement: It is important to measure the environment-
al relevance of innovations because the ultimate question is in fact to what extent
green innovations really benefit the natural environment.
3.2 Explanatory Variables
Most empirical studies to date have not systematically considered how explanatory
variables may impact differently on different types of environmental innovations (not-
ably, product and process innovations) and how they interact. Most importantly, we
submit that the relevance of regulation as a trigger of environmental innovation is
likely to depend on how important market demand is. It will be crucial to understand
under what conditions governments establish regulation to compensate for weak mar-
ket pull, and with what effect on environmental innovation and environmental perform-
ance.
Analyses of market pull factors mostly focus on market structure and fail to consider
differences between innovation types and direct customer benefits of environmental in-
novations (in addition to environmental improvements). As noted above, product innov-
ations in particular can deliver additional customer benefits (e.g., reduced mainten-
ance costs). These benefits can constitute the firm's motivation to implement those in-
novations in the first place. Producer benefits, in particular cost savings through pro-
cess innovations, have been considered in some studies. But these benefits / cost sav-
ings have been observed only at the firm level, even though, depending on the environ-
mental innovation field, different kinds of process innovations may have different po-
tentials for cost savings (e.g., increased process efficiency versus reduction of toxic
emissions).
3.3 Level of Analysis
In designing empirical studies for the hypotheses outlined above, we need to ascertain
sufficient variation on key explanatory variables and the dependent variable (environ-
mental innovation). In principle, such tests are possible at various levels of analysis.
Sector / industry level. At this level of analysis, the effects of changes in regulation on
sector-wide environmental innovation activity can be studied over time (i.e., with pan-
el-data). Regulation is usually designed for and applied to entire industries. It is not
tailor-made for individual firms. Yet, generating comparable macro-level environmental
and innovation data on industries or sectors without surveying individual firms is diffi-
37

cult. One option is to measure environmental innovation in terms of the relative im-
provement in environmental outcomes (e.g., emissions, concentrations of pollutants,
energy and water and raw materials consumption, extent of recycling, number of or-
ganic products, EMS certification, etc.) along with economic developments of the sec-
tor and its regulation over time. Unfortunately, reliable environmental and innovation
data is usually not available for many sectors and certainly not for long periods of time.
Moreover, drawing inferences in respect to firm-level decision-making and behavior
from sectoral or industry-level data is vulnerable to ecological fallacies.
Firm level. Collecting data on decision-making and behavior at the firm level – the level
where environmental innovation in fact occurs – allows for more direct testing of the
hypotheses outlined above. It also allows for the study of such phenomena at the level
of individual environmental innovations within firms. Sufficient variation on regulatory
variables, arguably the most problematic aspect in focusing on the firm level, can be
obtained by running comparisons of firms across industries, sectors, countries, or
time. Longitudinal studies are very difficult, however, because environmental and in-
novation data is usually available only for a few (recent) years. Comparisons across in-
dustries, sectors, or countries require control of a plethora of other explanatory vari-
ables – controlling systematically for such influences requires sample sizes that usually
exceed the resources of academic researchers. However, sufficient variation in regulat-
ory variables can be obtained even when comparing firms within a single sector and
country: the solution here is not to focus on sectoral regulation per se (which tends to
vary only over time), but to concentrate on individual firms’ (perceived, or actually ex-
perienced) exposure to regulation (e.g., measured in terms of compliance costs).
Innovation fields. Yet another option is to focus on certain innovation fields, i.e. the
various aspects of a product or process that can be improved. Regulations are usually
targeted at such particular aspects or environmental media (e.g., water or air pollu-
tion). Examples include energy use, concentration of pollutants, and prohibition or lim-
itation of certain toxic substances in products. Data for such research will have to be
generated at the firm level. Additionally, this approach provides variation on the regu-
latory variable even within firms, that is, the influence of different regulatory condi-
tions can be compared with constant values for the other explanatory variables. Cross-
sector and cross-country comparisons are also possible within individual innovation
fields.
Only very few political scientists have thus far ventured into research on environment-
al innovation. They have focused on cross-sector and cross-country comparisons (e.g.,
38

Jaenicke et al., 2000; Jacob et al., 2005). Recent quantitative studies by management
experts and economists have surveyed innovations at the facility level (cf. Johnstone et
al., 2007), whereas the development of product innovations usually happens at the firm
level. Furthermore, the simple empirical definitions of environmental innovation at the
facility level cannot provide direct insights into the causal linkages between regulation
and innovation – notably, the design of these studies can usually not exclude the pos-
sibility that green innovation (if reported as yes/no) is in another field than those tar-
geted by existing environmental regulation. That is, firms may report environmental in-
novations and state that they experience strict regulation, but the two phenomena may
be causally unrelated.
We propose to account for variation in the relevance of particular determinants not
only at the firm level, but also at a deeper level within the firm. Regulatory frameworks
and non-environmental benefits vary at the level of environmental innovation fields
within firms (e.g., energy-efficient products, resource-efficient production processes).
Strengthening the micro-foundations of our understanding of environmental innovation
by applying the analytical framework sketched above to the firm and innovation field
level within and across firms, industries, and countries is important for complementing
research on environmental innovation at the sector / industry and country level.
3.4 Sample Size
The research framework outlined in this paper can easily be applied in large-N, medi-
um-N, and small-N (qualitative case study) research at the firm- and innovation field-
level. In view of the advantages and shortcomings of each of the three approaches dis-
cussed below, we submit that a combination of all three approaches will be most fruit-
ful.
The main advantage of large-N surveys, based on questionnaires administered via mail
or telephone – with pure or stratified random samples of several hundred to several
thousand firms – lies in the ability to use sophisticated statistical procedures for draw-
ing broadly generalizable inferences. The main disadvantage, as evident from surveys
in this field carried out to date, stems from response rates that are usually lower than
30% (sometimes no more than 10%). Since it is virtually impossible to control for selec-
tion bias with such low response rates, the results are quite vulnerable because the
coefficients may be strongly biased. Moreover, large-N surveys are usually based on
closed-end questions that do not generate very detailed data on the characteristics of
environmental innovations, how they emerged in firms, and what their drivers were.
39

That is, they usually do not allow for more than (albeit rigorous) testing of rather
simple and static hypotheses.
Medium-N surveys – usually with sample sizes of less than one hundred firms – can ob-
tain much higher response rates. Moreover, they are usually carried out person-to-per-
son. This allows for open questions and collection of much more detailed data, particu-
larly on the dynamics of environmental innovation and their drivers. The downside is
the smaller number of observations and, therefore, the need to rely on simpler statist-
ical tools (usually descriptive statistics, contingency tables, simple OLS, logit or probit
regression with few explanatory variables). Surprisingly in view of its potential for con-
tributing important insights into environmental innovation processes, research based
on medium-N surveys is, thus far, very rare, probably because it is very time-consum-
ing and less attractive to academics intent on demonstrating their statistical skills.
Comparative small-N qualitative case studies, preferably based on most similar or most
different case designs (Mitchell and Bernauer, 2004), are still rare in research on the
determinants of environmental innovation. The business studies literature contains
many case studies, but comparison across cases (firms) is usually not very systematic.
The form of reasoning and empirical analysis in those studies often consists of arguing
by example or deriving “lessons learned”, rather than testing hypotheses. Carefully de-
signed qualitative, comparative case studies can provide important insights into the
processes that lead from firm-external stimuli (such as regulation or market forces) to
environmental innovation. However, future research will have to engage in much more
hypotheses-oriented case studies based on careful case selection as an instrument for
controlling (or holding constant) variables that are of lesser theoretical interest.
4 Conclusion
What started with a simple claim has, ten years after Porter and van der Linde made
the win-win proposition popular among business leaders, turned into a lively field of
academic research. Economists and business studies scholars have carried out most of
this research. Political scientists have only recently started to engage in this endeavor,
focusing mainly on the effects of environmental regulation on innovation at the sector
or national level.
Besides theoretical controversies – particularly among advocates of neoclassical, evol-
utionary, and ecological economics – empirical research on the effects of environment-
al regulation on innovation has thus far produced inconclusive and contested results.
40

At this state of theoretical and empirical knowledge, we are unable to say whether
these inconclusive findings are due to incomplete or wrong model specifications, defi-
cient empirical definitions of key concepts, or problematic data for key variables, or
whether the win-win proposition as such is fundamentally flawed (in the sense that
win-win outcomes are very rare, as neoclassical economists claim).
In this paper we have argued that the jury is still out, and that systematic empirical
testing requires simultaneous analysis of the effects of regulation on environmental in-
novation alongside firm-internal and market conditions. We have also proposed that fo-
cusing on firms and innovation fields within and across firms, industries, and jurisdic-
tions can provide important insights into the combined effects of regulation and produ-
cer and/or consumer benefits of particular environmental innovations. Such research
will take us beyond the overly simplistic focus on whether or not environmental regula-
tion promotes or hinders environmentally beneficial innovation. It forces us to look in
more sophisticated ways at the conditions under which particular kinds of regulation
are more or less conducive to particular kinds of environmental innovation.
41
5 References
Acs, Z.J., Audretsch, D.B., 1987. Innovation, Market Structure, and Firm Size. The Review of Economics and Statistics 69(4): 567-574.
Ashford, N., Heaton, G.R., 1983. Regulation and Technological Innovation in the Chemical Industry. Law and Contemporary Problems 46(3): 109-157.
Ashford, N., Ayers, C., Stone, R.F., 1985. Using Regulation to Change the Market for Innovation. Harvard Environmental Law Review 9(2): 419-466.
Barney, J., 1991. Firm Resources and Sustained Competitive Advantage. Journal of Management 17(1): 99-120.
Baylis, R., Connell, L., Flynn, A., 1998. Company Size, Environmental Regulation and Ecological Modernization: Further Analysis at the Level of the Firm. Business Strategy and the Environment 7(5): 285-296.
Belz, F., 2001. Integratives Oeko-Marketing - Erfolgreiche Vermarktung oekologischer Produkte und Leistungen. DUV, Wiesbaden, Germany.
Bonato, D., Schmutzler, A., 2000. When Do Firms Benefit from Environmental Regulations ? A Simple Microeconomic Approach to the Porter Controversy. Schweizerische Zeitschrift fuerVolkswirtschaft und Statistik 136(4): 513-530.
Bonifant, B.C., Arnold, M.B., Long, F.J., 1995. Gaining Competitive Advantage Through Environmental Investments. Business Horizons 38(4): 37-47.
Bradford, D., Gouldson, A., Hemmelskamp, J., Kottmann, H., Marsanich, A., 2000. The Impact of Eco-Audit Regulation on Innovation in Europe, IPTS Report EUR 19722 EN, Institute for Prospective Technological Studies, Sevilla.
Brunnermeier, S.B., Cohen, M.A., 2003. Determinants of Environmental Innovation in US Manufacturing Industries. Journal of Environmental Economics and Management 45(2): 278-293.
Clayton, A., Spinaradi, G., Williams, R., 1999. Policies for Cleaner Technologies. Earthscan, London, UK.
Cleff, T., Rennings, K., 1999. Determinants of Environmental Product and Process Innovation. European Environment 9(5): 191-201.
Coglianese, C., Nash, J., 2001. Regulating From the Inside - Can Environmental Management Systems Achieve Policy Goals? Resources For The Future, Washington D.C., USA.
Collis, D.J., Montgomery, C.A., 1995. Competing on Resources: Strategy in the 1990s. Harvard Business Review 73(4): 118-129.
Dyllick, T., Hamschmidt, J., 2000. Wirksamkeit und Leistung von Umweltmanagementsystemen - Eine Untersuchung von ISO 14001-zertifizierten Unternehmen in der Schweiz. Vdf, Zuerich.
Fagerberg, J., Mowery, D.C., Nelson, R.R., 2005. The Oxford Handbook of Innovation. Oxford University Press, Oxford, UK.
Freeman, C., 1994. The Economics of Technical Change. Cambridge Journal of Economics 18: 463-514.
Frondel, M., Horbach, J., Rennings, K., 2007. End of Pipe or Cleaner Production? An Empirical Comparison of Environmental Innovation Decisions Across OECD Countries. Business Strategy and the Environment 16: 571-584.
Gabel, H.L., Sinclair-Desgagne, B., 1998. The Firm, its Routines and the Environment. In: T. Tietenberg, H. Folmer (editors), The International Yearbook of Environmental
42
and Resource Economics 1998/1999. Edward Elgar Publishing Limited, Cheltenham UK, pp.
Geschka, H., 1990. Innovationsmanagement. In: H.-C. Pfohl (editors), Betriebswirtschaftslehre der Mittel- und Kleinbetriebe - Groessenspezifische Probleme und Moeglichkeiten zu ihrer Loesung. Schmidt, Berlin, pp. 157-178.
Gray, W.B., Shadbegian, R.J., 1995. Pollution Abatement Costs, Regulation, and Plant-Level Productivity, NBER Working Paper W4994.
Gunningham, N., Philipson, M., Grabosky, P., 1999. Harnessing Third Parties as Surrogate Regulators: Achieving Environmental Outcomes by Alternative Means. Business Strategy and the Environment 8(4): 211-224.
Hart, S.L., 1995. A Natural-Resource-Based View of the Firm. Academy of Management Review 20(4): 986-1014.
Hemmelskamp, J., 1999. Der Einfluss der Umweltpolitik auf das Innovationsverhalten - Eine oekonometrische Untersuchung. Zeitschrift fuer Umweltpolitik & Umweltrecht 1: 33-66.
Hemmelskamp, J., Brockmann, K.L., 1997. Environmental Labels - the German 'Blue Angel'. Futures 29(1): 67-76.
Hoffman, A.J., 2000. Competitive Environmental Strategy - A Guide to the changing Business Landscape. Island Press, Washington D.C.
Jacobs, K., Beise, M., Blazejczak, J., Edler, D., Edler, R., Haum, M., Jaenicke, M., Loew, T., Petschow, U., Rennings, K. (eds), 2005. Lead Markets of Environmental Innovations. Physica, Heidelberg.
Jaenicke, M., 1997. Umweltinnovationen aus der Sicht der Policy-Analyse: vom instrumentellen zum strategischen Ansatz der Umweltpolitik, FFU-Report No. 97, Freie Universitaet Berlin, Berlin.
Jaenicke, M., Blazejczak, J., Edler, D., Hemmelskamp, J., 2000. Environmental Policy and Innovation - An International Comparison of Policy Frameworks and Innovation Effects. In: J. Hemmelskamp, K. Rennings, F. Leone (editors), Innovation-Oriented Environmental Regulation. Physica Verlag, Heidelberg, pp. 125-152.
Jaffe, A.B., Palmer, K., 1997. Environmental Regulation and Innovation: a Panel Data Study. Review of Economics and Statistics 79(4): 610-619.
Jaffe, A.B., Newell, R.G., Stavins, R.N., 2002. Environmental Policy and Technological Change. Environmental and Resource Economics 22(1 - 2): 41-70.
Jaffe, A.B., Newell, R.G., Stavins, R.N., 2004. Technology Policy for Energy and the Environment. Innovation Policy and the Economy 4: 35-68.
Jaffe, A.B., Peterson, S., Portney, P.R., Stavins, R.N., 1995. Environmental Regulation and the Competitiveness of US Manufacturing: What Does the Evidence Tell Us? Journal of Economic Literature 33(March): 132-163.
Johnstone, N., 2001. The Firm, the Environmental, and Public Policy, Final Report for the OECD Working Party on National Environmental Policy, OECD, Environment Directorate, Paris, France.
Johnstone, N., Serravalle, C., Scapecchi, P., Labonne, J., 2007. Overview of the Data and Summary Results. In: N. Johnstone (editors), Environmental Policy and Corporate Behaviour. Edward Elgar, Cheltenham, UK, pp. 1-33.
Kemp, R., 1997. Environmental Policy and Technical Change - A Comparison of the Technological Impact of Policy Instruments. Edward Elgar, Cheltenham, UK; Brookfield, US.
43

Kemp, R., 1998. Environmental Regulation and Innovation - Key Issues and Questions for Research. In: F. Leone, J. Hemmelskamp (editors), The Impact of EU Regulation on Innovation of European Industry, Technical Report Series EUR 18111 EN. Institute for Prospective Technological Studies, Sevilla, pp.
Kemp, R., Smith, K., Becher, G., 2000. How Should We Study the Relationship between Environmental Regulation and Innovation? In: J. Hemmelskamp, K. Rennings, F. Leone (editors), Innovation-Oriented Environmental Regulation. Physica-Verlag, Mannheim, pp. 43-66.
King, A.A., Lenox, M.J., 2000. Industry Self-Regulation Without Sanctions: The Chemical Industry's Responsible Care Program. Academy of Management Journal 43(4): 698-716.
Klemmer, P., Lehr, U., Loebbe, K., 1999. Umweltinnovationen - Anreize und Hemmnisse. Analytica, Berlin.
Kuckartz, U., 1998. Umweltbewusstsein und Umweltverhalten. Springer, Berlin, Germany.
Levin, R.C., Cohen, W.M., Mowery, D.C., 1985. R&D Appropriability, Opportunity, and Market Structure - New Evidence on Some Schumpeterian Hypotheses. The American Economic Review 75(2): 20-24.
Meffert, H., Kirchgeorg, M., 1998. Marktorientiertes Umweltmanagement. Schaefer Poeschel, Stuttgart, Germany.
Melnyk, S.A., Sroufe, R.P., Calantone, R., 2003. Assessing the Impact of Environmental Management Systems on Corporate and Environmental Performance. Journal of Operations Management 21(3): 329-351.
Milmo, S., 1995. Environmental Economics. Chemical Marketing Reporter 247: 22-23.
Mitchell, R., Bernauer, T., 2004. Beyond Story Telling: Designing Case Study Research in International Environmental Policy. University of Michigan Press, Ann Arbor.
Mohr, R.D., 2002. Technical Change, External Economies, and the Porter Hypothesis. Journal of Environmental Economics and Management 43: 158-168.
Mowery, D.C., Rosenberg, N., 1979. The Influence of Market Demand Upon Innovation - A Critical Review of Some Empirical Studies. Research Policy 8: 102-153.
Murphy, J., Gouldson, A., 2000. Environmental Policy and Industrial Innovation - Integrating Environment and Economy through Ecological Modernisation. Geoforum 31(1): 33-44.
Nelson, R.R., Winter, S.G., 1982. An Evolutionary Theory of Economic Change. Harvard University Press, Cambridge, MA.
OECD, 1997a. Reforming Environmental Regulation in OECD Countries. OECD, Paris.
OECD, 1997b. The Oslo Manual - Proposed Guidelines for Collecting and Interpreting Technological Innovation Data. Organisation for Economic Co-operation and Development (OECD), Paris, France.
Palmer, K.L., Oates, W.E., Portney, P.R., 1995. Tightening Environmental Standards: The Benefit-Cost or the No-Cost Paradigm? Journal of Economic Perspectives 9(4): 119-132.
Pavitt, K., 1984. Sectoral Patterns of Technical Change: towards a Taxonomy and a Theory. Research Policy 13(6): 343-373.
Peattie, K., 2001. Golden Goose or Wild Goose? The Hunt for the Green Consumer. Business Strategy and the Environment 10(4): 187-199.
44

Porter, M.E., van der Linde, C., 1995a. Toward a New Conception of the Environment-Competitiveness Relationship. Journal of Economic Perspectives 9(4): 97-118.
Porter, M.E., van der Linde, C., 1995b. Green and Competitive: Ending the Stalemate. Harvard Business Review 73(5): 120-134.
Prakash, A., 2002. Green Marketing, Public Policy and Managerial Strategies. Business Strategy and the Environment 11(5): 285-297.
Rehfeld, K.-M., Rennings, K., Ziegler, A., 2007. Integrated Product Policy and Environmental Product Innovations: an Empirical Analysis. Ecological Economics 61(1): 91-100.
Reinhardt, F.L., 1998. Environmental Product Differentiation: Implications for Corporate Strategy. California Management Review 40(4): 43-73.
Rennings, K., 2000. Redefining Innovation - Eco-Innovation Research and the Contribution from Ecological Economics. Ecological Economics 32(2): 319-332.
Roberts, J.A., 1996. Green Consumers in the 1990s: Profile and Implications for Advertising. Journal of Business Research 36: 217-231.
Roberts, J.A., Bacon, D.R., 1997. Exploring the Suptle Relationship between Environmental Concern and Ecologically Concious Consumer Behavior. Journal of Business Research 40: 79-89.
Roediger-Schluga, T., 2004. The Porter Hypothesis and the Economic Consequences of Environmental Regulation. Edward Elgar Publishing, Northampton, MA.
Rothwell, R., Dodgson, M., 1994. Innovation and Size of Firm. In: M. Dodgson, R. Rothwell (editors), The Handbook of Industrial Innovation. Edward Elgar, Aldershot, pp. 310-324.
Rugman, A.M., Verbeke, A., 1998. Corporate Strategies and Environmental Regulations - An Organizing Framework. Strategic Management Journal 19(4): 363-375.
Russo, M.V., Fouts, P.A., 1997. A Resource-Based Perspective on Corporate Environmental Performance and Profitability. Academy of Management Journal 40(3): 534-559.
Sanchez, C.M., 1997. Environmental Regulation and Firm-Level Innovation. Business & Society 36(2): 140-168.
Schmutzler, A., 2001. Environmental Regulations and Managerial Myopia. Environmental and Resource Economics 18: 87-100.
Schumpeter, J.A., 1939. Business Cycles - A Theoretical, Historical, and Statistical Analysis of the Capitalist Process. McGraw-Hill, New York, NY.
Schumpeter, J.A., 1942. Capitalism, Socialism and Democracy. Harper & Brothers, New York, London.
Sharma, S., Vredenburg, H., 1998. Proactive Corporate Environmental Strategy and the Development of Competitively Valuable Organizational Capabilities. Strategic Management Journal 19(8): 729-753.
Shrivastava, P., 1995. Environmental Technologies and Competitive Advantage. Strategic Management Journal 16: 183-200.
Straughan, R.D., Roberts, J.A., 1999. Environmental Segmentation Alternatives: a Look at Green Consumer Behavior in the New Millenium. Journal of Consumer Marketing 16(6): 558-575.
Villiger, A., Wuestenhagen, R., Meyer, A., Kolibius, M., 2000. Jenseits der Oeko-Nische. Birkhaeuser, Basel.
45

Wernerfelt, B., 1984. A Resource-Based View of the Firm. Strategic Management Journal 5(2): 171-180.
Wong, V., Turner, W., Stoneman, P., 1996. Marketing Strategies and Market Prospects for Environmentally-Friendly Consumer Products. British Journal of Management 7(3): 263-281.
46

(This page is deliberately blank)
47

(This page is deliberately blank)
48

Chapter 3
The Effects of Customer Benefit and
Regulation on Environmental Product
Innovation in Germany
Empirical Evidence from Appliance Manufacturers
forthcoming in Ecological Economics,
doi:10.1016/j.ecolecon.2009.02.016
49

ABSTRACT
Environmental product (EP) innovations and their determinants have received increas-ing attention from researchers during the past years. So far, empirical studies have shown inconsistent results, especially regarding the impact of regulation. In this paper, I seek to advance the understanding of EP-innovation by introducing and testing a nov-el research framework. First, a novel unit of analysis, the environmental issue level, is applied. EP-innovation is not studied in broad terms but specifically for four environ-mental issues that are relevant to the electrical and electronic appliances industry: en-ergy efficiency, toxic substances, material efficiency, and electromagnetic fields. Second, the customer benefit, a concept from the green marketing literature, is in-cluded as an explanatory variable for EP-innovation for the first time. The argument is that green products which besides their public benefits have private environmental be-nefits for the customer (e.g., energy savings) will generate stronger consumer demand and can thus constitute the firm's motivation to implement those innovations in the first place. Third, EP-innovation is observed more comprehensively, measuring its ex-tent and level of novelty. I apply this research framework to study EP-innovations of German manufacturers of electrical and electronic appliances. My results support the issue level as unit of analysis. The impact of customer benefit and regulation on EP-in-novation is analyzed with logit regression and the results clearly show that both cus-tomer benefit and regulation play a key role for EP-innovation. They not only foster the implementation of EP-innovations but also their broad application and their level of novelty.
50

1 Introduction
The electrical and electronic appliances (EEA) industry is globally one of the most dy-
namic industries with regard to innovation (Smith, 2005, p. 157) and growth rate
(EEIG, 2004). The environmental impact of this industry has been a public topic since
the early 1980s (Smith et al., 2006) and while production-related impacts, such as
emissions and toxic spills, were the main concern then, the environmental burden
caused by the products along the product life cycle are the focus of today's public and
regulatory concerns.
The findings by the Gartner research company (2007) that information and communic-
ation technology “accounts for two percent of global CO2 emissions, equivalent to the
amount produced by the aviation industry” brought the increasing energy consumption
of these appliances to the public attention. Even though most devices have become
more energy efficient over the past years, the overall energy consumption is still grow-
ing due to the rapid spread of electronics in almost every sphere of life (EEIG, 2004)
and the increasing trend towards ubiquitous connectivity (OECD, 2006, pp. 245-282).
Additionally, there are environmental issues related to the products' disposal phase. E-
waste accounts already for 8% of municipal waste and is expected to be the fastest
growing waste category (Widmer et al., 2005). Also, these products contain hazardous
substances like heavy metals and flame-retardants. These substances are very prob-
lematic, as a large share of e-waste is further processed under poor environmental
standards in developing countries, thus generating toxic emissions (Puckett and Smith,
2002, Greenpeace, 2005).
Considering these environmental impacts of EEA, it is crucial to better understand
how environmental innovations in this area can be fostered. Academia and regulators
pay increasing attention to environmental innovations for their so-called double di-
vidend: reducing environmental impacts and simultaneously benefiting the industry
(Jaffe et al., 2002, EC, 2004). While the potential of environmental innovations to re-
duce the ecological footprint of products is undisputed, the drivers of these innova-
tions are not. Research on environmental innovation has focused on three types of ex-
planatory variables: regulation, market and firm-internal conditions (cf. Bernauer et
al., 2007). Empirical results on the influence of some individual factors – most notably
regulation – have remained inconclusive, especially regarding environmental product
innovations. This paper seeks to advance our understanding in this area by proposing a
novel research framework.
51
First, empirical data is observed regarding specific environmental issues. The research
designs used in extant work measure environmental innovation in general, either at
the industry or firm level, but do not account for variation of innovation and explanat-
ory variables over different environmental issues. Yet in general, regulations do not
target the overall environmental performance of products but only specific environ-
mental issues (e.g., energy consumption). Likewise, environmental innovations im-
prove only one, at most a few, environmental attributes of products. Therefore, the
firm as the principal unit of analysis may be too general, as regulation and environ-
mental innovation vary also at the level of environmental issues. Hence, for this study I
observed my main variables regarding the following four environmental issues per
firm: energy efficiency, toxic substances, material efficiency, and electromagnetic
fields. This shifts the unit of analysis from the firm level to the environmental issue
level.
Second, the role of customer benefit is explicitly included. The marketing literature
emphasizes customer benefits from environmental innovations (e.g., reduced energy
costs) as a key factor for green market demand. Although empirical research on envir-
onmental product innovation has considered market pull factors in general, the
concept of direct customer benefits has not been included in empirical studies so far.
In this paper, I fill this gap and analyze the effect of customer benefits on environment-
al product innovation.
Finally, environmental product innovation is observed using more comprehensive
measures. So far, econometric studies on environmental innovations have commonly
applied a binary yes/no scale. In this paper, I also utilize the extent and novelty of in-
novations. Thus, the impact of environmental regulation and customer benefits can be
analyzed for more dimensions of environmental product innovation.
This paper is organized as follows: first, I provide basic definitions and discuss the con-
ceptual framework. There I derive the hypotheses that stringent regulation and cus-
tomer benefit have a stimulating effect on environmental product innovation. The next
section describes the data set. I surveyed 92 German manufacturers of EEA regarding
the four aforementioned environmental issues. With the following descriptive results, I
demonstrate that all main variables have substantial variation over these environment-
al issues. This supports my claim for the environmental issue level as unit of analysis
for environmental innovation studies. Subsequently I present the statistical analyses.
The logit models clearly show that regulatory stringency and customer benefit have a
52

positive effect on the different measures of environmental product innovation. After
discussing the results, I conclude with policy recommendations in the final section.
2 Conceptual Framework
In this paper, environmental innovations are defined as all innovations that have a be-
neficial effect on the natural environment regardless of whether this was the main ob-
jective of the innovation. While the Oslo Manual (OECD, 2005) distinguishes four dif-
ferent types of innovations, this paper focuses solely on environmental product innova-
tion. The emergence of life cycle analysis has made it clear that for many products the
major environmental impact stems from their use (e.g., fuel consumption and CO2
emissions of cars) and disposal (e.g., heavy metals in batteries) rather than their pro-
duction (Berkhout and Smith, 1999). Accordingly, environmental product innovations,
hereafter called EP-innovation, may reduce the impacts along a product's total life
cycle for different environmental issues, such as reduction of toxics and materials in
products, improved power consumption and emission output in use phase, as well as
extended use phase or recycling schemes for obsolete products.
The literature on the determinants of innovation is vast. However, most of this literat-
ure focuses on single determinants of innovation, and only very small parts of it focus
on environmental (product) innovation. Environmental innovations are different from
other innovations as besides producing the spillover effect typical for R&D efforts (cf.
Jaffe, 1986) they also produce positive externalities by improving environmental qual-
ity. Rennings (2000, p. 325) has called this characteristic the “double externality prob-
lem” of environmental innovation. As a consequence, environmental innovations are
under provided calling for a “regulatory push / pull effect” (ibid.). Based on this double
externality problem, current research rests on the assumption that regulation, market
and firm-internal factors determine corporate behavior in respect to environmental in-
novation (cf. Bernauer et al., 2007).
2.1 Regulation
Researchers of business strategy and public policy have analyzed the relationship
between regulation and environmental innovation in numerous studies. While qualitat-
ive case studies (e.g., Bonifant et al., 1995, Porter and van der Linde, 1995a, b,
Shrivastava, 1995) are based on rather unsystematic analysis of anecdotal evidence,
more systematic econometric studies often use indicators that are too simple. For in-
stance, Jaffe and Palmer (1997) measure environmental innovation at the industry level
53

by number of patents and R&D investment and obtain very different results for these
two indicators. More recent studies shift the unit of analysis to the individual firm level
and distinguish between environmental process and product innovation.
The effects of regulation on EP-innovation remain disputed. For example, the results in
Hemmelskamp (1999) indicate a negative influence of regulation on EP-innovation,
whereas Cleff and Rennings (1999) find a positive effect, but solely for market-based
regulations. In contrast, Rehfeld et al. (2007) could demonstrate positive impacts of
regulation on EP-innovation. However, these studies may be drawing an inappropriate
conclusion as they do not measure the actual regulatory environment but only observe
whether legal (over-)compliance is an innovation goal for the firm. Another approach
at measuring regulation is to rely on firms' perception of regulatory stringency. Using
this approach, a recent OECD study finds that the stringency of environmental regula-
tion is the single most important factor that drives firms' environmental activities and
technological innovations (Johnstone et al., 2007, Frondel et al., 2008). However this
study did not differentiate between environmental process and product innovation.
Two recent studies that analyze the effect of regulatory stringency on EP-innovation in
Switzerland and Germany show contradictory results: while regulatory stringency has
a positive effect on EP-innovation in the chemical and pharmaceutical industry (Seijas-
Nogareda, 2007), it has no effect in the food and beverages industry (Engels, 2008).
These conflicting findings may be caused by industry characteristics. Another reason
could be that in these studies regulatory stringency does not have enough variation to
lead to statistically significant effects as environmental product policies in Germany
and Switzerland are very similar.
2.2 Customer Benefit
Technology push and market pull factors are relevant drivers for technological innova-
tions in general (Pavitt, 1984) but also for environmental innovations (Rennings, 2000).
In an empirical study on the differences of environmental process and product innova-
tions, Cleff and Rennings (1999) find that market considerations are especially import-
ant for environmental product innovations. Firms may use environmental improve-
ments to differentiate their products from others and thus gain a competitive advant-
age (Reinhardt, 1998). However, many consumers are reluctant to pay premium prices
or trade off other product qualities solely for a product's green attributes (Peattie,
2001)1. Additionally, consumers' claims of prioritizing green attributes have mostly not
matched their actual purchasing behavior (Wong et al., 1996, Kuckartz, 1998, Prakash,
1 For a review of the concept of “green consumers” see Pedersen and Neergaard (2006).
54

2002). The eco-marketing literature suggests that green products which besides their
public benefits also have private (environmental) benefits for the customer will gener-
ate stronger consumer demand (Meffert and Kirchgeorg, 1998, Ottman, 1998, Rein-
hardt, 1998, Belz, 2001, Belz and Bilharz, 2005). Such customer benefits can have dif-
ferent sources, e.g. cost / energy savings through more efficient appliances, improved
product quality and durability, better repair, upgrade, and disposal possibilities, as well
as reduced health impacts.
These customer benefits help firms to overcome the second externality of environment-
al innovations: by shifting some portion of the environmental benefit from the public to
the customers firms can deliver an added value. Thus they are able to increase the de-
mand for their environmentally improved products and can thereby monetize on their
environmental investments. Hemmelskamp and Brockmann (1997) and Reinhardt
(1998) provide anecdotal evidence for environmental product improvements that in-
creased or created customer demand due to private (environmental) benefits for the
consumer. Therefore customer benefits can constitute the firm's motivation to imple-
ment those innovations in the first place. Consequently, firms are expected to focus
their environmental innovation activities more towards product improvements and en-
vironmental issues that have a potential for customer benefit. Econometric studies on
environmental innovations have not taken the effects of customer benefits into account
so far, although the concept is well established in the eco-marketing literature.
2.3 Green Capabilities
The resource-based view of the firm (cf. Wernerfelt, 1984, Barney, 1991) holds that
firm characteristics such as strategy, structure, and core capabilities affect firms' in-
novation activities (Fagerberg et al., 2005). Based on this, Hart (1995) develops a
concept of green capabilities, that is a firm's knowledge of environmental issues relev-
ant to its business and procedures implemented to act and react on these issues. Russo
and Fouts (1997) and Sharma and Vredenburg (1998) further elaborate and empiric-
ally corroborate this concept. Regarding environmental innovation, many studies look
into organizational capabilities, particularly environmental management systems
(EMS). The assumption is that (certified) EMS such as ISO 14001 facilitate environ-
mental innovations directly by introducing environmental goals and management
structures as well as programs to achieve them (Coglianese and Nash, 2001, John-
stone, 2001) and indirectly by inducing organizational learning and providing critical
environmental information (Melnyk et al., 2003). Gonzalez-Benito and Gonzalez-Benito
(2006) point out that the popularity and visibility of EMS certification offers potential
55

for opportunistic (mis-) use to reduce stakeholder pressure without actually improving
any environmentally relevant activities. Empirically, a positive impact of EMS in gener-
al on environmental product innovation activity was found in recent studies by Rehfeld
et al. (2007) and Wagner (2008) whereas Rennings et al. (2006) showed evidence for
the stimulating effect of EMS induced learning processes.
2.4 Control Variables
Baylis et al. (1998) argue that larger firms have better opportunities and abilities to re-
duce environmental impacts due to their higher amount of financial and human re-
sources. Additionally, Greening and Gray (1994) contend that larger firms may be sub-
ject to greater public scrutiny. Several empirical studies show that firm size has a pos-
itive effect on firms' environmental activities in general (King and Lenox, 2001, Melnyk
et al., 2003) and on EP-innovation in particular (Cleff and Rennings, 1999, Hitchens et
al., 2000, Rehfeld et al., 2007). In contrast, Wagner (2008) as well as Seijas-Nogareda
(2007) and Engels (2008) do not support this influence of firm size on EP-innovation.
R&D expenditure is a common proxy for and closely related to a firm's innovation
activity (Acs and Audretsch, 1988). Although R&D does not automatically lead to in-
novations, R&D is still the most widely used strategy aiming at innovation. Rehfeld et
al. (2007) find empirical evidence that R&D activities also have a positive influence on
EP-innovation.
3 Research Design and Data
The empirical focus of this paper is on the electrical and electronic appliances (EEA)
industry in Germany. The German EEA industry is a good case for the analysis of EP-in-
novation as Germany recently enacted public policies that regulate several environ-
mental attributes of these appliances. Additionally, Germany is one of the largest ex-
porters of information and communication technology in the EU (OECD, 2006, p. 91)
and thus provides a large enough sample of manufacturers for an empirical study.
As mentioned in the introduction, I apply a novel unit of analysis for this study: the en-
vironmental issue. Instead of surveying firms regarding EP-innovation, regulation and
customer benefit in general, I observe these variables individually for several environ-
mental issues per firm2. This deeper level of analysis helps to overcome some of the
2 There are empirical studies on environmental innovation that have focused on a specific environmental issue e.g., Hitchens et al. (2000), but none that has utilized environmental issues as unit of analysis for a large-N study and observed data for several environmental issues.
56

limitations of earlier studies. Most importantly, it accounts for the fact that key explan-
atory variables – regulation and customer benefit – are not constant factors within a
firm but do vary over different environmental issues. It is obvious that firms do not
face the same regulatory stringency for each environmental issue. The same holds true
for customer benefit. For example, EP-innovations in the field of energy-efficiency and
those regarding toxic substances most likely have different potentials for customer be-
nefit. Therefore, in order to analyze how these factors are related with EP-innovation
we need to observe and analyze them at the environmental issue level. Additionally,
this provides further variation on the regulatory variable within an industry-specific
study.
I focus on the following four environmental issues in this study: energy efficiency, toxic
substances, material efficiency, and electromagnetic fields. Most importantly, these is-
sues account for the major environmental impacts of EEA products3. Furthermore, they
are regulated by public environmental policies with (presumably) differing stringency:
based on the EU directive RoHS4, the German Electrical and Electronic Equipment Act
(BGBl, 2005) has banned several toxic substances in EEA for sale in Germany since
July 2006. The same act holds producers of EEA responsible for taking back and recyc-
ling obsolete products originally sold by them in Germany, based on EU directive
WEEE5. That is, the issues toxic substances and material efficiency are regulated with
recent and presumably very stringent regulations. In contrast, the German ordinance
on electromagnetic fields (BGBl, 1996) has not been amended or tightened since 2002.
And most programs regarding energy efficiency of EEA are only voluntary6. Therefore
regulations for these two issues are presumably less stringent than for the other two
issues. As will be shown in the descriptive results, firms do rate regulations regarding
energy efficiency to be less stringent than regulations regarding the other issues.
To obtain further variation on regulatory stringency, three different sectors within the
EEA industry have been selected for the sample: information and communication tech-
nology (IT); household appliances including lamps and lighting fixtures (HA); and med-
ical appliances (ME). The HA sector is the only one of these for which the German En-
ergy Consumption Labelling Act (BGBl, 1997) established a mandatory energy label in
1998, thus increasing regulatory variation regarding the issue energy efficiency. The
ME sector provides further variation for the issue toxic substances as these appliances
are currently exempt from the restriction of hazardous substances that is in force for
HA and ICT appliances.
3 Cf. Behrendt and Kuom (1998), Berkhout and Hertin (2001), Kuehr and Williams (2003), and WHO (2008).4 RoHS (restriction of the use of certain hazardous substances), see EU (2003a).5 WEEE (waste electrical and electronic equipment), see EU (2003b).6 The most prominent example is the EU Energy Star, see www.eu-energystar.org.
57

For the data collection a survey was carried out using an online-questionnaire7. A ran-
dom sample of EEA firms was drawn from the databases Creditreform (2006) and Hop-
penstedt (2006), stratified for sector8 and firm size. In total, 360 companies were con-
tacted by phone to identify the most appropriate respondent in the company (typically
the general manager or a director from R&D or environmental affairs) to fill in the
questionnaire. Following the tailored-design method for surveys (Dillman, 2000) each
respondent was contacted several times and by different means (phone, mail, e-mail)
to achieve a high response rate. After the initial phone calls, 75 companies were found
to be ineligible for the study9. From the remaining 285 eligible companies 92 filled in
the online survey resulting in a response rate of 32%. Table 1 shows the amount of re-
spondents and response rates broken down per sector and firm size.
Table 1: Number of respondents and response rate by sector and firm size
EmployeesHousehold
Appliances (HA)Information &
Communication Tech. (IT)Medical
Appliances (ME)Total
20-49 4 (14%) 7 (29%) 11 (44%) 22 (29%)
50-250 12 (31%) 9 (21%) 15 (39%) 36 (30%)
>250 10 (34%) 11 (39%) 13 (42%) 34 (39%)
Total 26 (27%) 27 (28%) 39 (41%) 92 (32%)
4 Descriptive Results
4.1 Environmental Product Innovation
The 92 participating companies were asked about their EP (environmental product) in-
novation activities in the period of 2004 to 2006 regarding each of the four environ-
mental issues. One company clearly answered the key questions in the questionnaire
incorrectly, resulting in this company's removal from the data set. Therefore this data
set consists of 364 cases (4 issues per company) on EP-innovation at the environmental
issue level.
As mentioned earlier, I surveyed different measures of EP-innovation. The most basic
measure is whether firms have implemented any EP-innovations at all regarding the
respective environmental issue. Based on the OECD Oslo Manual innovation has been
defined very broadly as “changes that involve a significant degree of novelty for the
7 The survey questions for all variables used in this study are listed in the appendix.8 The sector allocation was done using NACE, the EU classification system of economic activities. The following
NACE codes have been selected: 2971, 315, and 323 for household appliances; 30 and 322 for information and communication technology; 33101 and 33102 for medical appliances.
9 These are either only sales and distribution subsidiaries or manufacturing facilities that have no influence on the actual product development process.
58

firm” OECD (2005, p. 17). Therefore this measure encompasses novelties to the mar-
ket, or real innovations, and novelties to the firm, sometimes called diffusion (Smith,
2005). As can be seen in table 2, in 78% of the cases an EP-innovation has been imple-
mented. Broken down by sector, IT (86%) clearly exceeds the other two sectors (74%
and 75%, respectively).
Looking at the issue level, almost all companies have implemented EP-innovations re-
garding toxic substances (93%). For each sector it is the issue with the most EP-innov-
ations, ranging from 85% (HA) to 97% (ME). The second issue is electromagnetic fields
for which 77% have implemented EP-innovations. For this issue, considerably fewer
HA companies (60%) have EP-innovations than ME (80%) and IT (88%) ones. In con-
trast, EP-innovations regarding material efficiency have been implemented evenly over
the sectors by around 73% of companies. Energy efficiency is the issue for which the
least companies (68%) have implemented EP-innovations. This relatively low rate is
mainly caused by the ME sector where only 46% of the companies have been innovat-
ive in this area, compared to 81% for HA and 85% for IT.
Table 2: Number and share of firms with environmental product innovations (EPI_ANY) by sector and environmental issue (overall 2% of the cases have missing data for this variable).
“Has your company im-plemented any environ-mental improvements in your products in the past
3 years?”
Household Appliances (HA)
Information & Communication Technology (IT)
Medical Appliances (ME)
Total
Energy efficiency (EFF)
21 (81%) 23 (85%) 17 (46%) 61 (68%)
Toxic substances (TOX)
22 (85%) 26 (96%) 37 (97%) 85 (93%)
Material efficiency (MAT)
19 (73%) 19 (73%) 27 (73%) 65 (73%)
Electromagnetic fields (EMF)
15 (60%) 22 (88%) 28 (80%) 65 (77%)
Total 77 (75%) 90 (86%) 109 (74%) 276 (78%)
A more specific measure of EP-innovation activity is the extent of innovation, defined
as the proportion of products for which EP-innovations have been implemented with
regard to the respective issue. Respondents could choose one of following answer cat-
egories: <5%, 5-25%, 26-50%, 51-75%, or 76-100%, (see table 3). Overall, in around
one quarter of the cases (26%) EP-innovations have been implemented very broadly for
76-100% of the product range. The frequencies in this category range from 15% for
the issue of energy efficiency (EFF) to 36% for toxic substances (TOX). At the other
end of the scale, that is an EP-innovation extent of less than 5%, the reverse applies:
59

EFF has the highest rate (22%) and TOX the lowest (9%). Accordingly, the median cat-
egory for EFF is an extent of 5-25%, while the median for TOX is 51-75%. For the is-
sues of material efficiency (MAT) and electromagnetic fields (EMF) 26-50% is the me-
dian category.
Table 3: Extent of environmental product innovations (EPI_EXT) by environmental issue. 2% of the cases have missing data for EPI_EXT. (Asterisks indicate the median)
“For what percentage of your products have you implemented at least
one improvement in the last 3 years?”
<5% 5-25% 26-50% 51-75% 76-100% Total
Energy efficiency (EFF)
22% * 30% 25% 8% 15% 100%
Toxic substances (TOX)
9% 26% 15% * 15% 36% 100%
Material efficiency (MAT)
16% 20% * 19% 17% 28% 100%
Electromagnetic fields (EMF)
14% 35% * 20% 8% 23% 100%
Total 14% 28% * 19% 12% 26% 100%
The third measure of EP-innovations is the degree of novelty. It distinguishes between
so-called real innovations that are novel to the market and innovations that are only
novel to the implementing firm. Respondents were asked whether their EP-innovations
are mainly market novelties, some market novelties, or no market novelties (see table
4).
Table 4: Novelty of environmental product innovations (EPI_NOV) by environmental issue. 8% of the cases have missing data for EPI_NOV. (Asterisks indicate the median)
“Are these product improve-ments market novelties?”
No Market Novelties
Some Market Novelties
Mainly Market Novelties
Total
Energy efficiency (EFF) 36% * 38% 25% 100%
Toxic substances (TOX) * 50% * 29% 21% 100%
Material efficiency (MAT) * 58% 25% 17% 100%
Electromagnetic fields (EMF)
47% * 33% 20% 100%
Total 48% * 31% 21% 100%
In almost half of all cases (48%), firms have implemented EP-innovations that are no
market novelties. Around one fifth of the cases (21%) were mainly market novelties,
and the remaining 31% have implement some market novelties, meaning their EP-in-
novations are split up in market novelties and firm novelties. Looking at the issue level,
EFF and EMF have the middle category some market novelties as median while TOX
and MAT tend more towards the lowest category no market novelties.
60

In summary, the distribution of each measure for EP-innovation differs over the envir-
onmental issues. For example, for TOX EP-innovations are more likely and have a lar-
ger extent than for the other issues. And regarding novelty, EP-innovations for MAT are
clearly less often market novelties than for the other issues. This shows that the envir-
onmental issue level provides a deeper understanding of EP-innovation and thus sup-
ports our argument for this unit of analysis.
4.2 Regulatory Stringency
Analogous to innovation, firms have been surveyed on regulatory stringency for all
four environmental issues. Regulatory stringency has been defined as how demanding
it was for firms to meet the respective regulations in the last 3 years. Respondents
replied using a 5-point ordinal scale ranging from very easy to very difficult. As shown
in table 5, the maximum score very difficult has only rarely been selected (2%). Each of
the ratings very easy and moderate has been given in around one third of the cases
(32%), with easy getting another fifth of the answers (20%) and difficult the remaining
14%. However, there are clear differences between the issues. For EFF three quarters
of the respondents reported regulations to be very easy to meet (74%). A rating that
was given by less than one fourth of the companies for the other issues. For these is-
sues, the middle category moderate was most frequently selected, making it the medi-
an category as well.
Table 5: Stringency of regulation (REG_STRING) by environmental issue. 3% of the cases have missing data for REG_STRING. (Asterisks indicate the median category)
“In the past 3 years, how easy / difficult was it for your company to
meet regulations in Germany?”
Very Easy Easy Moderate Difficult Very Difficult
Total
Energy efficiency (EFF)
* 74% 9% 16% 1% 0% 100%
Toxic substances (TOX)
21% 22% * 28% 24% 6% 100%
Material efficiency (MAT)
16% 29% * 38% 17% 0% 100%
Electromagnetic fields (EMF)
14% 19% * 47% 16% 4% 100%
Total 32% * 20% 32% 14% 2% 100%
61

4.3 Customer Benefit
Like innovation and regulatory factors, the potential for customer benefit has been
measured at the environmental issue level. The 4-point ordinal scale ranges from no
benefit to large benefit. Looking only at the issues, companies rated customer benefit
most frequently moderate for the issues EFF and EMF, making it the median category
for these issues (see table 6). For TOX and MAT, customer benefit has been rated lower
with little benefit being the median and most frequent answer category.
Table 6: Customer benefit (CUST_BEN) by environmental issue and sector. 1% of the cases have missing data for CUST_BEN. (Asterisks indicate the median category)
“How do you rate the direct benefit to your
customers from product improve-
ments?”
No Benefit Little Benefit
Moderate Benefit
Large Benefit
Total
Energy Efficiency (EFF)
11% 29% * 35% 25% 100%
HA sector 8% 19% * 46% 27% 100%
IT sector 11% 26% * 30% 33% 100%
ME sector 13% * 37% * 32% 18% 100%
Toxic Substances (TOX) 18% * 43% 26% 13% 100%
HA sector 31% * 38% 15% 15% 100%
IT sector 15% * 48% 30% 7% 100%
ME sector 11% * 42% 32% 16% 100%
Material Efficiency (MAT)
19% * 37% 29% 15% 100%
HA sector 31% * 42% 15% 12% 100%
IT sector 19% * 44% 22% 15% 100%
ME sector 11% 29% * 42% 18% 100%
Electromagnetic Fields (EMF) 18% 25% * 39% 18% 100%
HA sector 28% * 36% 20% 16% 100%
IT sector 8% 16% * 60% 16% 100%
ME sector 18% 24% * 37% 21% 100%
Depending on the sector, companies gave different ratings for customer benefit from
better energy efficiency: while moderate is the median category for HA and IT compan-
ies, ME companies consider the EFF issue less beneficial for their customers with the
median lying between little benefit and moderate benefit. The TOX issue is less diverse
among the sectors, with little benefit being the median category for all. Yet, around
30% of companies from the IT and ME sector rate customer benefit to be moderate,
whereas the same share of HA firms sees no benefit at all.
62

For MAT there is again a difference between HA and IT on one side with little benefit
being the median and ME on the other side where moderate benefit is the median. Re-
garding EMF it is the HA sector that differs from the others. While the median IT and
ME company attributes moderate benefit to this issue, the median HA company sees
only little benefit for its customers.
4.4 Green Capabilities
In contrast to the major study variables, firms' green capabilities have been measured
at firm level. Firms may allocate resources and develop specific knowledge for certain
environmental issues, however the underlying green capabilities are the same. There-
fore these factors were surveyed at firm level. Green capabilities have been measured
with 5 indicators (see table 7). Overall, the most prevalent measures are the use of
products' environmental attributes in marketing (45%) and voluntary environmental
targets for products (42%). Few companies have systematic environmental analyses of
products (25%) and environmental trainings for product developers (21%). The least
frequent measure is certified environmental management system, which has only been
implemented by 18%. Broken down by sectors, ME manufacturers clearly have the
lowest rates for each indicator. While environmental trainings and environmental tar-
gets are most common in the IT sector, the other measures are most prevalent with HA
manufacturers.
Table 7: Green capabilities of firms by sector
Does your company...
... use the env. attributes of
your products in marketing?
... have set up voluntary env.
targets for products?
... conduct sys-tematic env. analyses of
your products?
... train its product de-
veloper in env. issues?
... have a certi-fied env. man-agement sys-tem (e.g. ISO
14'001)?
HA sector 54% 46% 31% 23% 23%
IT sector 52% 48% 26% 26% 19%
ME sector 34% 34% 21% 16% 13%
Total 45% 42% 25% 21% 18%
4.5 Conclusion of Descriptive Results
The question of whether the environmental issue level provides additional information
for the main variables of theoretical interest deserves an affirmative answer. The de-
scriptive results clearly show that EP-innovation, regulatory stringency, and customer
benefit have substantial variation over the environmental issues. This supports my pro-
63

posed unit of analysis and provides evidence for the claim that environmental innova-
tion should be studied at the environmental issue level.
5 Statistical Analyses
5.1 Models and Variables
In this section, I use econometric approaches to analyze the specific effects of regulat-
ory stringency and customer benefits on environmental product innovations separated
from other variables' influence. Specifically, I apply binary and ordered logit regression
models10. As seen in the descriptive results, the data set has missing data for some
variables as most survey data sets do. By default, missing data in logit regression is
handled with listwise deletion. This not only reduces the number of observations, but
can also lead to biased estimates (Allison, 2001, p. 6). Therefore, I have imputed miss-
ing values using the multiple imputation method11. However, for 9 of the 364 observa-
tions listwise deletion had to be applied nevertheless, as both the dependent and the
main independent variables (i.e., EP-innovation, regulation and customer benefits) had
missing values. Thus 355 observations are included in the logit regression analysis.
First, I apply a binary logit model. The binary outcome variable is EPI_ANY, measuring
whether or not environmental product innovations were implemented for the respect-
ive environmental issue in the past 3 years. Next, I consider an ordered logit model for
the extent of EP-innovation, again based on the past 3 years. Obviously, only firms that
implemented EP-innovations in the first place (i.e., EPI_ANY is yes) were asked about
the innovation extent. For those observations with no EP-innovation (i.e., EPI_ANY is
no) the ordinal outcome variable EPI_EXT has been recoded to 0. Accordingly, the
scale of EPI_EXT consists of the disjoint and ordinal categories 0%, 1-5%, 6-25%,
26-50%, 51-75%, and 76-100%. Due to this recoding the analysis is not restricted to in-
novative cases only but includes non-innovative cases as well. A further ordered logit
model is applied for the novelty of EP-innovations. Again, firms were not asked about
the novelty of EP-innovations if they did not implement any EP-innovations in the first
place. Therefore the outcome variable EPI_NOV has been recoded in the exact same
manner as EPI_EXT. The resulting categories are no novelties, no market novelties,
some market novelties, and mostly market novelties.
10 Probit models lead to generally identical results as logit models, only the coefficients differ by a factor of 1.6 to 1.8 (Agresti, 2002, p. 246).
11 I created 10 data sets with multiple imputation using the ice package (Royston, 2005) with Stata 9.2. The Stata do-file performing the multiple imputation is available on request.
64

In addition to the main explanatory variables portrayed in the descriptive results sec-
tion, the following variables are included in the logit models: Firms' green capabilities
have been summed up for the variable GREEN_CAP which ranges from 0 for firms with
no capabilities to 5 for firms that have implemented all measures (see table 7). EM-
PLOYEE measures the number of employees (in thousands) the firms had in 2006. Con-
cerning the general R&D activities of companies, the variable R&D_EMPL is included
which is based on the ratio of employees in R&D to employees in total. Finally, I in-
clude dummy variables for the sector (SEC_ME and SEC_IT with HA being the base
category) and environmental issue (I_EFF, I_TOX, I_MAT with EMF as base category).
Note that the control variables are at the firm level and not at the issue level like the
explanatory and outcome variables. That is, the control variables do not vary over the
environmental issues within a firm (e.g., EMPLOYEE). To adjust for this dependence
between observations that stem from identical firms, I employ standard errors that are
robust against clustering by firms.
5.2 Binary Model for Environmental Product Innovation
In the following, I use a binary logit model to explain companies' environmental
product innovation. The dependent variable, EPI_ANY, is measured as a binary variable
for which respondents could state whether or not their company implemented EP-in-
novations. Table 8 reports the parameter estimates with level of significance, robust
standard error, and z-value.
This model clearly shows that the stringency of regulation (REG_STRING) has a highly
significant positive effect on the implementation of EP-innovations. Thus more strin-
gent environmental regulation does increase the probability that a company imple-
ments EP-innovations. Customer benefit (CUST_BEN), the other variable of major the-
oretical interest in this paper, also has a highly significant positive effect on EP-innova-
tion. The more potential for customer benefits a company attributes to an environ-
mental issue, the more likely it is that it has implemented EP-innovations. Two more
variables in the model display a highly significant influence on the likelihood of EP-in-
novation: the more green capabilities (GREEN_CAP) a company has, the more likely it
is to have implemented EP-innovations. Finally, companies are significantly more likely
to have implemented EP-innovations regarding the issue of toxic substances (I_TOX)
than regarding any of the other issues12. There are no significant effects for the re-
maining issue pairs13.
12 A Wald test was used to compare the effects of I_TOX with I_EFF (p=0.001) and I_MAT (p<0.001).13 The Wald test comparing I_EFF to I_MAT reports p=0.745.
65

Number of employees (EMPLOYEE) as well as R&D activities (R&D_EMPL) do not
have a significant effect on EP-innovation. The effects of the sector are not significantly
different either14.
Table 8: Binary logit analysis for existence of EP-innovation (EPI_ANY)
Parameter Estimate
Level of Significance
Robust Std. Error
z-value
REG_STRING 0.707 *** 0.196 3.615
CUST_BEN 1.051 *** 0.190 5.536
EMPLOYEE -0.023 0.040 -0.581
R&D_EMPL 0.017 0.019 0.900
GREEN_CAP 0.609 *** 0.185 3.290
SEC_ME 0.105 0.452 0.232
SEC_IT 0.831 0.571 1.456
I_EFF 0.119 0.456 0.261
I_TOX 2.180 *** 0.542 4.018
I_MAT -0.021 0.381 -0.054
_cons -4.249 *** 0.948 -4.481
aic 278.445
bic 321.038
The estimates are based on 355 observations at the environmental issue level. Robust standard errors are clustered by firm. * (**, ***) means that the null hypothesis that the appropriate parameter is zero can be rejected at the 10% (5%, 1%) level of significance.
I included the observations for all environmental issues in this analysis and thereby im-
plicitly assumed that the effects on EP-innovation are the same for all environmental
issues. In order to test whether this assumption holds true, I analyzed the same model
using different sub-samples. As the sample size is too small for analyzing each environ-
mental issue separately, I used the reversed setup: alternately excluding the observa-
tions for one of the environmental issues. These restrictions of the sample do hardly af-
fect the coefficients' level of significance (see table A1 in the appendix for details). The
sub-sample without observations for material efficiency is the only one with a change,
there the dummy variable for the IT sector obtains a significant effect compared to the
base sector HA. Furthermore, for each coefficient the confidence intervals coincide
across all sub-samples. Therefore, the estimated coefficients are also robust against
excluding observations for one of the environmental issues. So these analyses show
that the existence of EP-innovation has the same determinants across the different en-
vironmental issues and that these determinants affects this variable in the same way.
14 The Wald test comparing SEC_ME to SEC_IT reports p=0.1357.
66

5.3 Ordinal Logit Model for Extent of EP-Innovation
In order to explain the extent of EP-innovation, an ordered logit model is applied. The
outcome to be explained, EPI_EXT, is measured as a 6-point categorical variable. Com-
panies have been asked for what percentage of their product range at least one EP-in-
novation has been implemented in the past 3 years. Answer categories are 0%, 1-5%,
6-25%, 26-50%, 51-75%, and 76-100%. The parameter estimates together with levels
of significance, robust standard errors, and z-values are reported in table 9.
Table 9: Ordered logit analysis for extent of EP-innovation (EPI_EXT)
Parameter Estimate
Level of Significance
RobustStd. Error
z-value
REG_STRING 0.631 *** 0.127 4.978
CUST_BEN 0.623 *** 0.142 4.376
EMPLOYEE 0.079 *** 0.028 2.836
R&D_EMPL 0.001 0.008 0.188
GREEN_CAP 0.282 *** 0.078 3.620
SEC_ME 0.027 0.319 0.083
SEC_IT 0.561 0.354 1.586
I_EFF 0.209 0.306 0.683
I_TOX 1.385 *** 0.249 5.571
I_MAT 0.300 0.283 1.057
cut1_cons 2.618 *** 0.629 4.165
cut2_cons 3.421 *** 0.644 5.314
cut3_cons 4.650 *** 0.691 6.730
cut4_cons 5.500 *** 0.743 7.405
cut5_cons 6.140 *** 0.772 7.953
aic 1108.835
bic 1166.917
The estimates are based on 355 observations at the environmental issue level. Robust standard errors are clustered by firm. * (**, ***) means that the null hypothesis that the appropriate parameter is zero can be rejected at the 10% (5%, 1%) level of significance.
As in the binary model, this model clearly shows a highly significant positive influence
of REG_STRING on the extent of EP-innovations: the more stringent environmental
regulation is, the more likely is a broad implementation of EP-innovations. And again,
CUST_BEN also has a highly significant positive effect on EPI_EXT. Thus, companies
that reported large potential benefits for their customers are more likely to implement
EP-innovations to a large extent. Besides these variables of major theoretical interest,
3 more variables show a strong influence on the extent of EP-innovation: as for
EPI_ANY, green capabilities and the issue of toxic substances have a highly significant
positive effect on EPI_EXT. Companies with more green capabilities are more likely to
67

have implemented EP-innovations broadly, and EP-innovations with regard to TOX are
more likely to have a large extent than the ones regarding the other issues15. There are
no significant effects for the remaining issue pairs16.
In contrast to the binary model, firm size (EMPLOYEE) has a highly significant, posit-
ive effect on EP_EXT. Thus, larger companies are more likely to implement EP-innova-
tions on a broad basis. A weakly significant difference between the sectors IT and med-
ical devices (p=0.0935) is the only effect that the choice of sector has, whereas R&D
has no significant effect.
Again, I re-analyzed the model with sub-samples to test whether these effects are con-
stant across the environmental issues (see table A2 in the appendix). Similar to the
model for existence of EP-innovation, there is no substantial change in the significance
levels besides a significant positive effect of the sector IT compared to the base sector
HA in the sub-sample without material efficiency observations. Also, each coefficient
has overlapping confidence intervals across the sub-samples. So the determinants of
the extent of EP-innovation as well as their effects are the same across the different
environmental issues.
5.4 Ordinal Logit Model for EP-Innovations' Degree of Novelty
Another ordered model is applied to explain the degree of novelty of EP-innovation.
The outcome EPI_NOV is measured as a 4-point categorical variable for which compan-
ies could state how novel their EP-innovations have been on average in the past 3
years. Answer categories are no novelties, no market novelties, some market novelties,
and mainly market novelties. Table 10 shows parameter estimates, levels of signific-
ance, robust standard errors, and z-values for this model.
In contrast to the previous two models, the effect of regulatory stringency is only
weakly significant in this model. Companies that face more stringent environmental
regulation are more likely to implement EP-innovations that are novel to the market.
Customer benefit again has a highly significant effect: large potential for customer be-
nefits increases the probability of EP-innovations that are market novelties. Green cap-
abilities also have a strong influence, with companies having more green capabilities
being significantly more likely to introduce market novelties. A still significant influ-
ence displays the variable EMPLOYEE. The larger a company is, the more likely are
EP-innovations that are market novelties.
15 The Wald test reports p<0.001 for I_TOX and I_EFF and p=0.001 for I_TOX and I_MAT.16 The Wald test result is p=0.7805 for I_EFF compared to I_MAT.
68

R&D activities again have a non-significant coefficient. Regarding the industry sector,
companies from IT have a higher probability of introducing market novelties than the
ones manufacturing medical devices, although only weakly significant (p=0.0982). Like
in the other two models, the only environmental issue that has a highly significant ef-
fect is TOX: EP-innovations regarding this issue are more likely to be market novelties
than the ones regarding the other issues17.
Table 10: Ordered logit analysis for novelty of EP-innovation (EPI_NOV)
Parameter Estimate
Level of Significance
RobustStd. Error
z-value
REG_STRING 0.210 * 0.118 1.775
CUST_BEN 0.615 *** 0.132 4.659
EMPLOYEE 0.060 * 0.032 1.873
R&D_EMPL -0.001 0.011 -0.069
GREEN_CAP 0.221 ** 0.089 2.492
SEC_ME 0.075 0.344 0.219
SEC_IT 0.621 0.427 1.454
I_EFF 0.011 0.319 0.035
I_TOX 0.826 *** 0.248 3.337
I_MAT -0.203 0.261 -0.778
cut1_cons 1.383 * 0.706 1.958
cut2_cons 3.393 *** 0.767 4.425
cut3_cons 4.733 *** 0.843 5.617
aic 885.266
bic 935.604
The estimates are based on 355 observations at the environmental issue level. Robust standard errors are clustered by firm. * (**, ***) means that the null hypothesis that the appropriate parameter is zero can be rejected at the 10% (5%, 1%) level of significance.
As with the other models, the logit analysis of EPI_NOV has also been repeated with
sub-samples excluding observations for each of the environmental issues (see table A3
in the appendix). These analyses show slight changes in the significance levels for reg-
ulatory stringency and firm size. However, the effects of both are only weakly signific-
ant in the unrestricted model. Again, the coefficients do not change across the sub-
samples as the respective confidence intervals are coinciding with each other. There-
fore, these analyses show evidence that my assumption of constant determinants and
effects across environmental issues holds true for the novelty of EP-innovation as well.
17 The p-values are 0.0057 for I_TOX compared to I_EFF; <0.001 for I_TOX compared to I_MAT; and 0.4939 for I_EFF compared to I_MAT.
69
6 Discussion
The aim of this paper is to analyze the influence of customer benefit and regulation on
environmental product innovation and to utilize a novel unit of analysis, the environ-
mental issue level, for this analysis. The statistical analyses clearly show that customer
benefit plays a key role for environmental product innovations. Firms that attribute a
large potential for customer benefit to an environmental issue are significantly more
likely to implement EP-innovations for this issue. Furthermore, they implement their
EP-innovations for more products and their EP-innovations are more often market nov-
elties. In short, customer benefit fosters the implementation of EP-innovations, their
broad application and their level of novelty.
However, as shown in the descriptive statistics section, customer benefit is not con-
stant within an environmental issue and / or industry sector. Therefore, not every firm
in a sector attributes the same potential for customer benefit to a given environmental
issue. This raises the question of what influences firms in identifying potential custom-
er benefit of environmental issues. Is it their specific market or the kind of customers
they serve (consumers, industry, or public)? Or does it rather depend on firm-internal
factors like customer orientation or environmental strategy whether customer benefits
are recognized by firms? Further research on these questions is necessary and custom-
er benefit, which has an important impact on EP-innovation, should be more compre-
hensively analyzed in further empirical studies.
For environmental regulation, the second variable of major theoretical interest in this
paper, the results are a little less clear-cut. The analyses do demonstrate that regula-
tion has a positive impact on the different measures of EP-innovation. While firms that
face more stringent regulation are significantly more likely to implement EP-innova-
tions and to implement them at a large extent, the stimulating effect of regulation on
the novelty of EP-innovation is only weakly significant. Thus, more stringent regulation
does lead to EP-innovations and their broad application. But it does not necessarily
lead to EP-innovations that are novel to the market.
Another result from the statistical analyses is that green capabilities have a significant
positive effect on all measures of EP-innovation. The resources and knowledge that
builds up by implementing these green capabilities not only enable firms to implement
more EP-innovations but also support the development of EP-innovations that are mar-
ket novelties. Green capabilities have been defined very broadly in this study. Besides
the purely capacity building measures EMS, environmental analyses and trainings, I
also included voluntary environmental targets and the use of environmental attributes
70

in marketing into the definition. The latter two are not directly related to environment-
al capacity building, instead they are proxies for the scope of the environmental man-
agement system. To test whether the results are robust for a more restrictive definition
of green capabilities, I also ran the logit analyses without those two measures (see
tables A1 to A3 in the annex). The influence on both, the existence and the extent of
EP-innovation is robust, irrespective whether the broad or restrictive definition of
green capabilities is applied. Yet the impact on novelty of innovation turns non-signific-
ant for the more restrictive definition of green capabilities.
A further firm-internal factor that significantly influences EP-innovation is firm size.
Though larger firms are non-significant less likely to implement an EP-innovation for a
specific environmental issue, once they overcome the initial obstacle they implement
EP-innovations on a significantly wider basis than smaller firms. Economies of scale
might be the underlying effect for this broader application of EP-innovation by larger
firms. Better financial and human resources could be the explanation for the weakly
significant, positive effect of firm size on the implementation of market novelties.
Contrary to the findings of Rehfeld et al. (2007), my results do not support the impact
of firms' general innovation activity on EP-innovation. This different result could stem
from differing operationalizations. In this paper, the share of employees in R&D has
been used while Rehfeld et al. used a dummy measuring whether there were R&D
activities or not (ibid., p. 96). Another explanation could be that the impact of R&D
activities on EP-innovation is sector specific and not very relevant for the electrical and
electronic appliances industry.
For this study, EP-innovation and its hypothesized determinants have not been ob-
served in general but for specific environmental issues. The argument is that EP-innov-
ation as well as regulatory stringency and potential for customer benefit are not con-
stant for firms but do vary over the different environmental issues. Therefore, these
variables also have to be measured at the environmental issue level in order to analyze
how they are related.
The descriptive results have clearly demonstrated that this reasoning is correct: all
measures of EP-innovation as well as regulatory stringency and customer benefit vary
over the different environmental issues. The utilization of this novel unit of analysis
was essential to distinguish between strict regulation for issue A (or large customer
benefit for issue B) and EP-innovation that might have been regarding yet another en-
vironmental issue C. Thus, the environmental issue level facilitates tracing back vari-
ation in one of the EP-innovation measures to variation in one of the variables of in-
71

terest. Therefore, studies on the determinants of environmental innovation should not
look at environmental innovation in general but consider specific environmental issues
for their analysis.
Regarding the limitations of this study, the response rate has to be acknowledged.
While it is larger than in most other surveys on firms' environmental activities18, a re-
sponse rate of 32% might still be an indication of self selection. However, no systemat-
ic non-response has been found besides the slightly higher responses of firms from the
medical appliances sector. A second issue is the regional and sectoral focus of the
study. The results in this paper are based on the electrical and electronic appliances in-
dustry in Germany. To elaborate whether the findings can be generalized to other in-
dustries and economies, further empirical studies will have to be conducted.
7 Policy Recommendations
Based on these results, the following policy recommendations can be derived: Strin-
gent environmental regulation does stimulate manufacturers to environmentally im-
prove their products. This is especially true for the diffusion of improvements that have
already been invented by others. However, stringent regulation alone might be insuffi-
cient to stimulate the development of real innovations.
Firms do concentrate their environmental innovation activities on areas with large po-
tential for customer benefit. In order to leverage these customer benefits, industry
should be supported in identifying and communicating how environmental improve-
ments of products might be directly useful for consumers.
Particularly small and medium firms should be supported in their environmental innov-
ation activities. They lack the financial and human resources to develop market novel-
ties and to implement environmental innovations on a broad product base.
18 E.g., response rates between 15% and 26% have been reported by Johnstone et al. (2007), Rehfeld et al. (2007), and Wagner (2008). However, Rennings et al. (2006) reached an exceptionally high response rate when surveying EMAS certified firms.
72

8 References
Acs, Z.J., Audretsch, D.B., 1988. Innovation in Large and Small Firms - An Empirical Analysis. The American Economic Review 78(4): 678-690.
Agresti, A., 2002. Categorical Data Analysis. John Wiley & Sons, Hoboken, New Jersey.
Allison, P.D., 2001. Missing Data. SAGE, Thousand Oaks, California.
Barney, J., 1991. Firm Resources and Sustained Competitive Advantage. Journal of Management 17(1): 99-120.
Baylis, R., Connell, L., Flynn, A., 1998. Company Size, Environmental Regulation and Ecological Modernization: Further Analysis at the Level of the Firm. Business Strategy and the Environment 7(5): 285-296.
Behrendt, S., Kuom, M., 1998. Innovationen zur Nachhaltigkeit - oekologische Aspekte der Informations- und Kommunikationstechniken. Springer, Berlin, Germany.
Belz, F., 2001. Integratives Oeko-Marketing - Erfolgreiche Vermarktung oekologischer Produkte und Leistungen. DUV, Wiesbaden, Germany.
Belz, F., Bilharz, M., 2005. Nachhaltigkeits-Marketing in Theorie und Praxis. DUV, Wiesbaden, Germany.
Berkhout, F., Smith, D., 1999. Products and the Environment: An Integrated Approach to Policy. European Environment 9(5): 174-185.
Berkhout, F., Hertin, J., 2001. Impacts of Information and Communication Technologies on Environmental Sustainability: Speculations and Evidence, SPRU (Science and Technology Policy Research) - University of Sussex, Brighton, UK.
Bernauer, T., Engels, S., Kammerer, D., Seijas, J., 2007. Explaining Green Innovation - Ten Years after Porter's Win-Win Proposition: How to Study the Effects of Regulation on Corporate Environmental Innovation? In: K. Jacob, F. Biermann, P.-O. Busch, P.H. Feindt (editors), PVS Sonderheft 39 - Politik und Umwelt. VS Verlag fuer Sozialwissenschaften, Wiesbaden, Germany, pp. 323-341.
BGBl, 1996. Verordnung ueber elektromagnetische Felder, BGBl (Bundesgesetzblatt) - Bundesanzeiger Verlag, Bonn, Germany.
BGBl, 1997. Gesetz zur Umsetzung von Rechtsakten der Europaeischen Gemeinschaften auf dem Gebiet der Energieeinsparung bei Geraeten und Kraftfahrzeugen (Energieverbrauchskennzeichnungsgesetz - EnVKG), BGBl (Bundesgesetzblatt) - Bundesanzeiger Verlag, Bonn, Germany.
BGBl, 2005. Gesetz ueber das Inverkehrbringen, die Ruecknahme und die umweltvertraegliche Entsorgung von Elektro- und Elektronikgeraeten (Elektro- und Elektronikgeraetegesetz - ElektroG), BGBl (Bundesgesetzblatt) - Bundesanzeiger Verlag, Bonn, Germany.
Bonifant, B.C., Arnold, M.B., Long, F.J., 1995. Gaining Competitive Advantage Through Environmental Investments. Business Horizons 38(4): 37-47.
Cleff, T., Rennings, K., 1999. Determinants of Environmental Product and Process Innovation. European Environment 9(5): 191-201.
Coglianese, C., Nash, J. (eds), 2001. Regulating From the Inside - Can Environmental Management Systems Achieve Policy Goals? Resources For The Future, Washington D.C, USA.
Creditreform. 2006. Creditreform Deutsche Firmen. Verband der Vereine Creditreform e.V. (last accessed 14.08.2006).
73
Dillman, D.A., 2000. Mail and Internet Surveys - The Tailored Design Method. J. Wiley, New York, USA.
EC, 2004. Stimulating Technologies for Sustainable Development: An Environmental Technologies Action Plan for the European Union, European Commission (EC), Luxembourg.
EEIG, 2004. Convergence and the Digital World. In: EEIG (editors), European Information Technology Observatory 2004. European Economic Interest Grouping (EEIG), Frankfurt a.M., Germany, pp. 144-211.
Engels, S., 2008. Determinants of Environmental Innovation in the Swiss and German Food and Beverages Industry - What Role does Environmental Regulation Play? ETH Zurich, Zurich, Switzerland.
EU, 2003a. Directive 2002/95/EC of the European Parliament and of the Council. Official Journal of the European Union 46(L37): 19-23.
EU, 2003b. Directive 2002/96/EC of the European Parliament and of the Council. Official Journal of the European Union 46(L37): 24-38.
Fagerberg, J., Mowery, D.C., Nelson, R.R. (eds), 2005. The Oxford Handbook of Innovation. Oxford University Press, Oxford, UK.
Frondel, M., Horbach, J., Rennings, K., 2008. What Triggers Environmental Management and Innovation? Empirical Evidence for Germany. Ecological Economics 66(1): 153-160.
Gartner. 2007. Press Release May 22, 2007. http://www.gartner.com/it/page.jsp?id=506571 (last accessed 02.04.2008).
Gonzalez-Benito, J., Gonzalez-Benito, O., 2006. A Review of Determinant Factors of Environmental Proactivity. Business Strategy and the Environment 15(2): 87-102.
Greening, D.W., Gray, B., 1994. Testing a Model of Organizational Response to Social and Political Issues. Academy of Management Journal 37(3): 467-498.
Greenpeace, 2005. Recycling of Electronic Wastes in China & India: Workplace & Environmental Contamination, Greenpeace International, Amsterdam, Netherlands.
Hart, S.L., 1995. A Natural-Resource-Based View of the Firm. Academy of Management Review 20(4): 986-1014.
Hemmelskamp, J., 1999. Der Einfluss der Umweltpolitik auf das Innovationsverhalten - Eine oekonometrische Untersuchung. Zeitschrift fuer Umweltpolitik & Umweltrecht 1: 33-66.
Hemmelskamp, J., Brockmann, K.L., 1997. Environmental Labels - the German 'Blue Angel'. Futures 29(1): 67-76.
Hitchens, D.M.W.N., Birnie, E., Thompson, W., Triebswetter, U., Bertossi, P., Messori, L., 2000. Environmental Regulation and Competitive Advantage: a Study of Packaging Waste in the European Supply Chain. Edward Elgar, Cheltenham, UK.
Hoppenstedt. 2006. Hoppenstedt Firmenprofile. Hoppenstedt Firmeninformationen GmbH. (last accessed 14.08.2006).
Jaffe, A.B., 1986. Technological Opportunity and Spillovers of R & D: Evidence from Firms' Patents, Profits, and Market Value. American Economic Review 76(5): 984-1001.
Jaffe, A.B., Palmer, K., 1997. Environmental Regulation and Innovation: a Panel Data Study. Review of Economics and Statistics 79(4): 610-619.
Jaffe, A.B., Newell, R.G., Stavins, R.N., 2002. Environmental Policy and Technological Change. Environmental and Resource Economics 22(1 - 2): 41-70.
74

Johnstone, N., 2001. The Firm, the Environmental, and Public Policy, OECD, Environment Directorate, Paris, France.
Johnstone, N., Serravalle, C., Scapecchi, P., Labonne, J., 2007. Overview of the Data and Summary Results. In: N. Johnstone (editors), Environmental Policy and Corporate Behaviour. Edward Elgar, Cheltenham, UK, pp. 1-33.
King, A., Lenox, M., 2001. Does it Really Pay to be Green? An Empirical Study of Firm Environmental and Financial Performance. Journal of Industrial Ecology 5(1): 105-116.
Kuckartz, U., 1998. Umweltbewusstsein und Umweltverhalten. Springer, Berlin, Germany.
Kuehr, R., Williams, E. (eds), 2003. Computers and the Environment: Understanding and Managing their Impacts. Kluwer Academic, Dordrecht, Netherlands.
Meffert, H., Kirchgeorg, M., 1998. Marktorientiertes Umweltmanagement. Schaefer Poeschel, Stuttgart, Germany.
Melnyk, S.A., Sroufe, R.P., Calantone, R., 2003. Assessing the Impact of Environmental Management Systems on Corporate and Environmental Performance. Journal of Operations Management 21(3): 329-351.
OECD, 2005. The Oslo Manual - Guidelines for Collecting and Interpreting Innovation Data. Organisation for Economic Co-operation and Development (OECD), Paris, France.
OECD, 2006. OECD Information Technology Outlook. Organisation for Economic Co-Operation and Development, Paris, France.
Ottman, J., 1998. Green Marketing: Opportunity for Innovation. NTC, Lincolnwood, Illinois.
Pavitt, K., 1984. Sectoral Patterns of Technical Change: towards a Taxonomy and a Theory. Research Policy 13(6): 343-373.
Peattie, K., 2001. Golden Goose or Wild Goose? The Hunt for the Green Consumer. Business Strategy and the Environment 10(4): 187-199.
Pedersen, E.R., Neergaard, P., 2006. Caveat Emptor - Let the Buyer Beware! Environmental Labelling and the Limitations of 'Green' Consumerism. Business Strategy and the Environment 15(1): 15-29.
Porter, M.E., van der Linde, C., 1995a. Green and Competitive: Ending the Stalemate. Harvard Business Review 73(5): 120-134.
Porter, M.E., van der Linde, C., 1995b. Toward a New Conception of the Environment-Competitiveness Relationship. Journal of Economic Perspectives 9(4): 97-118.
Prakash, A., 2002. Green Marketing, Public Policy and Managerial Strategies. Business Strategy and the Environment 11(5): 285-297.
Puckett, J., Smith, T., 2002. Exporting Harm - The High-Tech Trashing of Asia, The Basel Action Network and Silicon Valley Toxic Coalition, Seattle, Washington.
Rehfeld, K.-M., Rennings, K., Ziegler, A., 2007. Integrated Product Policy and Environmental Product Innovations: an Empirical Analysis. Ecological Economics 61(1): 91-100.
Reinhardt, F.L., 1998. Environmental Product Differentiation: Implications for Corporate Strategy. California Management Review 40(4): 43-73.
Rennings, K., 2000. Redefining Innovation - Eco-Innovation Research and the Contribution from Ecological Economics. Ecological Economics 32(2): 319-332.
75

Rennings, K., Ziegler, A., Ankele, K., Hoffmann, E., 2006. The Influence of Different Characteristics of the EU Environmental Management and Auditing Scheme on Technical Environmental Innovations and Economic Performance. Ecological Economics 57(1): 45 - 59.
Royston, P., 2005. Multiple Imputation of Missing Values: Update of Ice. The Stata Journal 5(4): 527-536.
Russo, M.V., Fouts, P.A., 1997. A Resource-Based Perspective on Corporate Environmental Performance and Profitability. Academy of Management Journal 40(3): 534-559.
Seijas-Nogareda, J., 2007. Determinants of Environmental Innovation in the German and Swiss Chemical Industry - With Special Consideration of Environmental Regulation. ETH Zurich, Zurich, Switzerland.
Sharma, S., Vredenburg, H., 1998. Proactive Corporate Environmental Strategy and the Development of Competitively Valuable Organizational Capabilities. Strategic Management Journal 19(8): 729-753.
Shrivastava, P., 1995. Environmental Technologies and Competitive Advantage. Strategic Management Journal 16: 183-200.
Smith, K., 2005. Measuring Innovation. In: J. Fagerberg, D.C. Mowery, R.R. Nelson (editors), The Oxford Handbook of Innovation. Oxford University Press, Oxford, UK, pp. 148-177.
Smith, T., Sonnenfeld, D.A., Pellow, D.N. (eds), 2006. Challenging the Chip: Labor Rights and Environmental Justice in the Global Electronics Industry. Temple University Press, Philadelphia, Pennsylvania.
Wagner, M., 2008. Empirical Influence of Environmental Management on Innovation: Evidence from Europe. Ecological Economics 66 (2-3), 392-402.
Wernerfelt, B., 1984. A Resource-Based View of the Firm. Strategic Management Journal 5(2): 171-180.
WHO. 2008. Electromagnetic Fields. World Health Organization. http://www.who.int/peh-emf/en/ (last accessed 02.04.2008).
Widmer, R., Oswald-Krapf, H., Sinha-Khetriwal, D., Schnellmann, M., Boeni, H., 2005. Global Perspectives on E-Waste. Environmental Impact Assessment Review 25(5): 436-458.
Wong, V., Turner, W., Stoneman, P., 1996. Marketing Strategies and Market Prospects for Environmentally-Friendly Consumer Products. British Journal of Management 7(3): 263-281.
76

9 Appendix
Underlying questions for the variables:
Environmental product improvements19 are all technical changes that render a product
more environmentally friendly. It does not matter, whether these changes are ecologic-
ally motivated or not.
EPI_ANY (environmental product innovation): “Has your company implemented any
environmental improvements in your products in the past 3 years (In the area of en-
ergy efficiency; toxic substances; material efficiency; electromagnetic fields)?”
EPI_EXT (extent of EP-innovation): “For what percentage of your products have you
implemented at least one improvement in the last 3 years (In the area of energy effi-
ciency; toxic substances; material efficiency; electromagnetic fields)?”
EPI_NOV (novelty of EP-innovation): “Are these product improvements market novel-
ties (In the area of energy efficiency; toxic substances; material efficiency; electromag-
netic fields)?”
REG_STRING (regulatory stringency): “In the past 3 years, how easy / difficult was it
for your company to meet regulations in Germany (In the area of energy efficiency;
toxic substances; material efficiency; electromagnetic fields)?”
CUST_BEN (Customer benefit): “How do you rate the direct benefit to your customers
from product improvements (In the area of energy efficiency; toxic substances; materi-
al efficiency; electromagnetic fields)?”
GREEN_CAP (Green Capabilities):
• “Does your company have a certified env. management system (e.g. ISO 14'001)?”
• “Does your company train its product developer in env. issues?”
• “Does your company conduct systematic env. analyses of your products?”
• “Has your company set up voluntary env. targets for products?”
• “Does your company use the env. attributes of your products in marketing?”
EMPLOYEE: “How many employees (FTE) did your company have in 2006?”
R&D_EMPL: “How many employees (FTE) did your company have in R&D in 2006?”
19 The questionnaire was tested with a pilot study. A conclusion of this pilot study was that I had to exchange the term “innovation” with the term “improvement” as most respondents in the pilot study wrongly considered innovation to be restricted to novelties to the market and did not consider novelties to the firm for their responses.
77

Table A1: robustness tests for logit analysis of existence of EP-innovation (EPI_ANY)
Parameter Estimate (95% CI)
/Level of Sig.
Normal Model
Sub-Sample 1
Without EFF Obs.
Sub- Sample 2
Without TOX Obs.
Sub-Sample 3
Without MAT Obs.
Sub-Sample 4
Without EMF Obs.
Alternative green_cap
Without voluntary goals and marketing measures
REG_STRING
[0.32;1.09] [0.33;1.22] [0.27;1.12] [0.35;1.22] [0.13;0.96] [0.30;1.02]
*** *** *** *** ** ***
CUST_BEN
[0.68;1.42] [0.52;1.43] [0.68;1.41] [0.65;1.64] [0.61;1.43] [0.71;1.45]
*** *** *** *** *** ***
EMPLOYEE [-0.10;0.05] [-0.17;0.02] [-0.10;0.07] [-0.10;0.10] [-0.11;0.12] [-0.09;0.13]
R&D_EMPL
[-0.02;0.05] [-0.02;0.06] [-0.02;0.05] [-0.02;0.06] [-0.03;0.07] [-0.02;0.05]
GREEN_CAP
[0.25;0.97] [0.27;1.52] [0.19;0.87] [0.06;0.85] [0.30;1.06] [0.13;1.18]
*** *** *** ** *** **
SEC_ME [-0.78;0.99] [-0.36;1.96] [-1.09;0.65] [-0.69;1.13] [-1.23;0.83] [-0.96;0.85]
SEC_IT [-0.29;1.95] [-0.44;2.24] [-0.41;1.76] [0.02;2.51] [-0.75;1.88] [-0.41;1.95]
**
I_EFF [-0.77;1.01] [-0.82;1.07] [-0.77;1.01] [-0.80;0.88]
I_TOX [1.12;3.24] [1.16;3.36] [1.14;3.28] [1.12;3.23] [1.01;3.16]
*** *** *** *** ***
I_MAT [-0.77;0.73] [-0.77;0.79] [-0.76;0.71] [-0.82;0.89] [-0.77;0.67]
_cons [-6.11;-2.39] [-7.25;-2.49] [-5.83;-2.02] [-6.68;-2.51] [-5.42;-2.06] [-5.35;-1.99]
*** *** *** *** *** ***
N 355 265 264 266 270 355
78
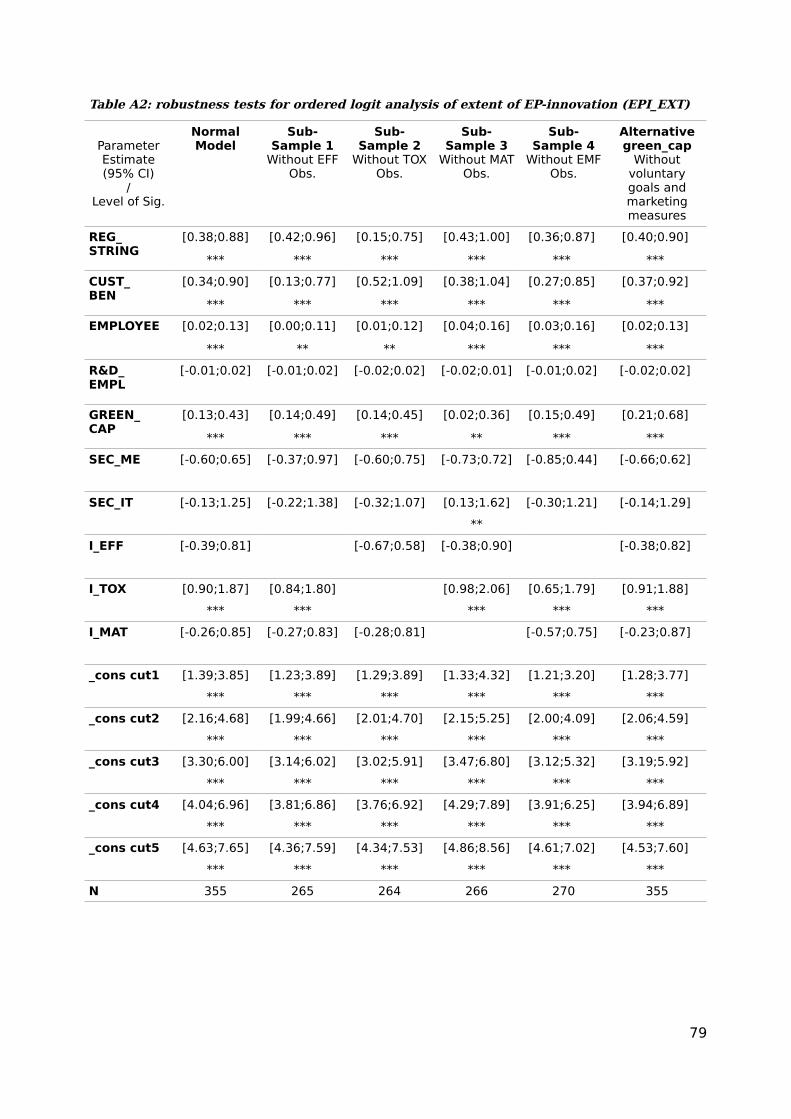
Table A2: robustness tests for ordered logit analysis of extent of EP-innovation (EPI_EXT)
Parameter Estimate (95% CI)
/Level of Sig.
Normal Model
Sub-Sample 1
Without EFF Obs.
Sub- Sample 2
Without TOX Obs.
Sub-Sample 3
Without MAT Obs.
Sub-Sample 4
Without EMF Obs.
Alternative green_cap
Without voluntary goals and marketing measures
REG_STRING
[0.38;0.88] [0.42;0.96] [0.15;0.75] [0.43;1.00] [0.36;0.87] [0.40;0.90]
*** *** *** *** *** ***
CUST_BEN
[0.34;0.90] [0.13;0.77] [0.52;1.09] [0.38;1.04] [0.27;0.85] [0.37;0.92]
*** *** *** *** *** ***
EMPLOYEE [0.02;0.13] [0.00;0.11] [0.01;0.12] [0.04;0.16] [0.03;0.16] [0.02;0.13]
*** ** ** *** *** ***
R&D_EMPL
[-0.01;0.02] [-0.01;0.02] [-0.02;0.02] [-0.02;0.01] [-0.01;0.02] [-0.02;0.02]
GREEN_CAP
[0.13;0.43] [0.14;0.49] [0.14;0.45] [0.02;0.36] [0.15;0.49] [0.21;0.68]
*** *** *** ** *** ***
SEC_ME [-0.60;0.65] [-0.37;0.97] [-0.60;0.75] [-0.73;0.72] [-0.85;0.44] [-0.66;0.62]
SEC_IT [-0.13;1.25] [-0.22;1.38] [-0.32;1.07] [0.13;1.62] [-0.30;1.21] [-0.14;1.29]
**
I_EFF [-0.39;0.81] [-0.67;0.58] [-0.38;0.90] [-0.38;0.82]
I_TOX [0.90;1.87] [0.84;1.80] [0.98;2.06] [0.65;1.79] [0.91;1.88]
*** *** *** *** ***
I_MAT [-0.26;0.85] [-0.27;0.83] [-0.28;0.81] [-0.57;0.75] [-0.23;0.87]
_cons cut1 [1.39;3.85] [1.23;3.89] [1.29;3.89] [1.33;4.32] [1.21;3.20] [1.28;3.77]
*** *** *** *** *** ***
_cons cut2 [2.16;4.68] [1.99;4.66] [2.01;4.70] [2.15;5.25] [2.00;4.09] [2.06;4.59]
*** *** *** *** *** ***
_cons cut3 [3.30;6.00] [3.14;6.02] [3.02;5.91] [3.47;6.80] [3.12;5.32] [3.19;5.92]
*** *** *** *** *** ***
_cons cut4 [4.04;6.96] [3.81;6.86] [3.76;6.92] [4.29;7.89] [3.91;6.25] [3.94;6.89]
*** *** *** *** *** ***
_cons cut5 [4.63;7.65] [4.36;7.59] [4.34;7.53] [4.86;8.56] [4.61;7.02] [4.53;7.60]
*** *** *** *** *** ***
N 355 265 264 266 270 355
79

Table A3: robustness tests for ordered logit analysis of novelty of EP-innovation (EPI_NOV)
Parameter Estimate (95% CI)
/Level of Sig.
Normal Model
Sub-Sample 1
Without EFF Obs.
Sub- Sample 2
Without TOX Obs.
Sub-Sample 3
Without MAT Obs.
Sub-Sample 4
Without EMF Obs.
Alternative green_cap
Without voluntary goals and marketing measures
REG_STRING
[-0.02;0.44] [-0.03;0.48] [-0.01;0.59] [-0.04;0.44] [-0.09;0.39] [-0.02;0.44]
* * * *
CUST_BEN
[0.36;0.87] [0.27;0.84] [0.31;0.86] [0.37;0.99] [0.36;0.89] [0.37;0.89]
*** *** *** *** *** ***
EMPLOYEE [-0.00;0.12] [-0.02;0.11] [-0.01;0.12] [-0.00;0.13] [0.00;0.15] [0.01;0.15]
* * * ** **
R&D_EMPL
[-0.02;0.02] [-0.02;0.02] [-0.02;0.02] [-0.02;0.02] [-0.02;0.03] [-0.02;0.02]
GREEN_CAP
[0.05;0.40] [0.04;0.45] [0.06;0.41] [-0.02;0.36] [0.06;0.41] [-0.10;0.47]
** ** *** * ***
SEC_ME [-0.60;0.75] [-0.29;1.22] [-0.86;0.54] [-0.54;0.96] [-0.85;0.50] [-0.69;0.67]
SEC_IT [-0.22;1.46] [-0.16;1.62] [-0.41;1.39] [-0.04;1.69] [-0.41;1.38] [-0.24;1.44]
*
I_EFF [-0.61;0.64] [-0.56;0.80] [-0.62;0.61] [-0.61;0.64]
I_TOX [0.34;1.31] [0.34;1.35] [0.35;1.35] [0.32;1.53] [0.34;1.30]
*** *** *** *** ***
I_MAT [-0.72;0.31] [-0.76;0.32] [-0.67;0.31] [-0.76;0.50] [-0.71;0.32]
_cons cut1 [-0.00;2.77] [-0.17;2.88] [-0.01;3.05] [0.09;3.00] [-0.00;2.44] [-0.19;2.59]
* * * ** * *
_cons cut2 [1.89;4.90] [1.95;5.30] [1.69;4.96] [1.92;5.11] [1.95;4.62] [1.68;4.66]
*** *** *** *** *** ***
_cons cut3 [3.08;6.38] [3.13;6.76] [2.84;6.44] [3.16;6.65] [3.15;6.11] [2.86;6.13]
*** *** *** *** *** ***
N 355 265 264 266 270 355
80

(This page is deliberately blank)
81

(This page is deliberately blank)
82

Chapter 4
The Effects of Customer Benefit and
Regulation on Environmental Product
Innovation in California and Germany
Evidence from Appliance Manufacturers
83

ABSTRACT
In this article, I explain corporate environmental product innovations with their poten-tial for customer benefit and the effect of environmental regulation. The empirical fo-cus is on appliance manufacturers in California and Germany. The multiple regression results show that the influence of regulation and customer benefit is robust for differ-ent measures of environmental product innovation. The potential for customer benefit not only stimulates firms to implement environmental product innovations and to apply them to a large share of their products, it also motivates firms to go beyond the diffu-sion of already-known improvements and to develop environmental product innova-tions that are novel to the market. While stringent regulation also promotes the broad implementation of environmental product innovations, its effect on market novelties could not be corroborated. Further findings are that more Californian firms implement environmental product innovations and they also implement them on a broader range than German firms. In contrast, German firms implement more environmental product innovations that are novel to the market.
84

1 Introduction
The recent LOHAS (lifestyle of health and sustainability) movement in the industrial-
ized countries draws on an old insight: to reach the goal of sustainable development it
is essential to reduce the environmental burden of our production and consumption
systems, as claimed by the United Nations Rio Declaration (UN, 1992). Environmental
innovations play an important role in achieving this goal. While regulators have been
promoting environmental process innovations to reduce pollution and waste in manu-
facturing processes for a long time, their attention to environmental product innova-
tion to lessen environmental burdens along the whole life cycle of products is more re-
cent. Examples for the latter are the promotion of an integrated product policy (IPP) by
the European Commission (EC, 2001, 2003) and the extended producer responsibility
(EPR) approach (e.g., OECD, 2001, 2004). Accordingly, research on the impact of regu-
lation on environmental innovation primarily focuses on environmental process innova-
tions (e.g., Lanjouw and Mody, 1996, Jaffe and Palmer, 1997, Brunnermeier and Cohen,
2003) or does not distinguish between process and product innovations (e.g., John-
stone et al., 2007b, Frondel et al., 2008). Only in recent years, have environmental
product innovations and their determinants been analyzed in empirical studies (e.g.,
Rehfeld et al., 2007, Seijas-Nogareda, 2007, Wagner, 2008, Engels, 2008).
In this paper, I contribute to the research on determinants of environmental product
innovations (hereafter EP-innovations). Besides the impact of regulation, I also exam-
ine a novel explanatory factor: the direct customer benefit which can accrue from
these environmental innovations. In the green marketing literature, it is a common
proposition that in order to be commercially successful, green products need to deliver
a private benefit for customers in addition to the public benefit of improved environ-
mental quality. Additionally, EP-innovation is measured more comprehensively than in
similar studies to date. I do not only consider whether or not firms implemented EP-in-
novations but also the extent of the product range for which they were implemented as
well as the level of novelty of the EPI.
The empirical focus is on manufacturers of electrical and electronic appliances (EEA)
in California and Germany. These products have a rapidly growing ecological footprint
due to their increasing spread to almost every sphere of modern life (EEIG, 2004). In a
recent study on EP-innovations of the German EEA industry, Kammerer (2008) shows
that both regulation and the potential for customer benefit stimulate firms' environ-
mental innovation activities. The purpose of this paper is twofold. First, the impact of
regulation and customer benefit on EP-innovation is analyzed using a data set from a
85

survey on Californian firms. This analysis validates the findings of Kammerer (2008)
and provides further evidence that customer benefit stimulates firms more strongly to
come up with novel EP-innovations while more stringent regulation leads to a broader
diffusion of EP-innovations already introduced to the market.
Second, EP-innovation and its determinants are compared for California and Germany.
These two states are a good choice for a comparison because they are the largest pro-
ducers of EEA in the US (US-Census-Bureau, 2004a, b, c) and in the European Union
(Eurostat, 2004, p. 184-190) respectively. Thus, they allow for relatively large sample
sizes and increase the practical relevance of the findings. Further, Germany and Cali-
fornia are comparable with regard to the advancement of environmental policy in gen-
eral, as both states are the regional leader for this policy field (for details see Vogel,
1995). And finally, the theory of varieties of capitalism provides an important differ-
ence between Germany and California. Hall and Soskice (2001) distinguish between
two types of political economies: liberal market economies and coordinated market
economies. They postulate that liberal market economies like the United States (and
therefore California) are characterized by intense product competition. In contrast, co-
ordinated market economies like Germany focus more on product differentiation and
niche production. Through this difference in market strategies, the comparison of
these two states provides a perfect research design for my study. The results of the
comparison support the varieties of capitalism theory: while Californian firms are more
likely to implement EP-innovations than German firms and also implement these innov-
ations on a broader range, German firms develop and implement more EP-innovations
that are novel to the market. These results also provide further support for my theory
as they show that the influence of customer benefit and regulation on EP-innovations is
robust with regard to the type of market economy.
In the following section, I will discuss the theoretical arguments and hypotheses to be
tested. Section 3 provides the survey design and descriptive statistics of the data. The
next section reports the results of the multiple regression analyses and is followed by
the conclusion in the final section.
2 Theoretical Background and Hypotheses
In accordance with other studies on this topic (cf. Bernauer et al., 2007), I define envir-
onmental product innovation (EP-innovation) as technical innovations that reduce en-
vironmental impacts along a product's total life cycle, such as reduction of toxics and
materials in products, improved power consumption and emission output in the use
86

phase, or recycling schemes for obsolete products. I use three measures of EP-innova-
tion: besides the binary measure of whether or not a firm has implemented EP-innova-
tions in the last three years, I also examine to what extent these innovations have been
implemented with regard to the firm's product range. The third measure is the novelty
of the EP-innovations, that is whether they are novel to the market or already common
to the market but novel to the implementing firm.
Regarding the determinants of environmental innovations, current research rests on
the assumption that regulation, market and firm-internal factors influence corporate
environmental innovation behavior (cf. Bernauer et al., 2007). The theoretical argu-
ments and derived hypotheses are as follows.
2.1 Regulation
There are two theoretical strands in the literature for the relationship of regulation
and environmental innovation. The “induced innovation” approach (Jaffe et al., 2003,
p. 469) is based on neoclassical theory and the “double externality problem” (Ren-
nings, 2000, p. 325) of environmental innovations: in addition to the spillover effect of
creating knowledge that cannot be appropriated fully by the inventor (Jaffe, 1986), en-
vironmental innovations provide a further positive externality to the public by improv-
ing environmental quality. As a consequence of these market failures, firms under-in-
vest in environmental R&D relative to the social optimum (Jaffe et al., 2003). Environ-
mental regulation implicitly or explicitly changes the prices of environmental goods
and thus induces innovation.
The second approach is based on evolutionary economics and views firms as “satis-
ficing” rather than optimizing (Nelson and Winter, 1982). Following this approach,
firms' R&D activities are path-dependent and rely on routines and rule of thumb. Thus,
environmental regulation functions as an external shock, forcing firms to focus their
attention on environmental issues. As firms are not optimizing, they might find previ-
ously missed inefficiencies or opportunities for competitive advantage through environ-
mental improvements. The famous “win-win” proposition of Porter and van der Linde
(1995a,b) is based on this reasoning.
Empirically, recent studies find that stringency of environmental regulation is the
single most important factor that drives firms' environmental activities and technolo-
gical innovations (Johnstone et al., 2007a, Frondel et al., 2008). However, these studies
87

do not differentiate between environmental process and product innovation. My first
hypothesis is:
Hypothesis 1: Regulatory stringency has a stimulating effect on firms' activ-
ities regarding environmental product innovations.
Adapted to the three kinds of EP-innovation measures used in this study:
More stringent regulation leads to ...
H1a: ... more firms implementing EP-innovations.
H1b: ... firms implementing more EP-innovations.
H1c: ... firms implementing more novel EP-innovations.
2.2 Market Demand and Customer Benefit
Firms can utilize environmental product innovations to differentiate their products and
thus gain a competitive advantage (Reinhardt, 1998, Banerjee et al., 2003). Based on
the green marketing literature (Meffert and Kirchgeorg, 1998, Ottman, 1998, Rein-
hardt, 1998, Belz, 2001, Belz and Bilharz, 2005), market demand is stronger for green
products that can offer a direct benefit to the customer in addition to the public benefit
of reducing the environmental burden. Examples of such customer benefits are cost
savings through energy-efficient appliances or reduced health impacts. Elkington
(1994, p. 90) coined the term “triple win” for these products, as they “simultaneously
benefit company, its customers, and the environment”.
Utilizing EP-innovations that provide products with such customer benefits thus in-
creases the demand for these environmentally improved products. Therefore, anticip-
ated customer benefits can constitute the firm's motivation to develop and implement
those EP-innovations in the first place. Consequently, firms are expected to focus their
environmental innovation activities more towards product improvements and environ-
mental issues that have a potential for customer benefit.
Empirically, the effects of customer benefit on EP-innovation have not been tested sys-
tematically before Kammerer (2008). So my second hypothesis is:
Hypothesis 2: The potential for customer benefit has a stimulating effect on
firms' activities regarding environmental product innovations.
88

Adapted to the three kinds of EP-innovation measures used in this study:
Larger anticipated customer benefit leads to ...
H2a: ... more firms implementing EP-innovations.
H2b: ... firms implementing more EP-innovations.
H2c: ... firms implementing more novel EP-innovations.
2.3 Control variables
In the literature, several firm-internal factors have been proposed to influence firms'
environmental innovation activity. It is argued that larger firms implement more envir-
onmental innovations due to economies of scale and their higher amount of financial
and human resources (1998, Gonzalez-Benito and Gonzalez-Benito, 2006). R&D ex-
penditure is a common proxy for and closely related to a firm's innovation activity (Acs
and Audretsch, 1988). Although R&D does not automatically lead to innovations, R&D
is still the most widely used strategy aiming at innovation. I will control for firm size
and R&D expenditure in the analyses.
Another firm-internal control variable is firms' green capabilities. Based on the re-
source-based view of the firm (cf. Wernerfelt, 1984, Barney, 1991), Hart (1995) devel-
ops a concept of green capabilities. These comprise a firm's knowledge of environ-
mental issues relevant to its business and procedures implemented to act and react on
these issues.
3 Data Collection and Descriptive Statistics
The data for this study was collected in two surveys, one for Californian firms and one
for Germany firms. To reduce any bias and to facilitate the comparison of the results,
both surveys have been conducted using the same framework: first, it has the same
empirical focus, namely the electrical and electronic appliances (EEA) industry. A ran-
dom sample of EEA firms was drawn for each state, stratified for sub-sector and firm
size. The selected sub-sectors are information and communication technology (IT);
household appliances including lamps and lighting fixtures (HA); and medical appli-
ances (ME)1. Second, in both surveys the level of analysis is the environmental issue
level. That is, firms were surveyed on the main study variables (EP-innovation, regulat-
1 For the sampling, the business directory Manufacturers' News (http://www.manufacturersnews.com) was used with the following SIC codes: 363, 3641, 3648, 3651, 366 for HA; 357 for IT; and 384 for ME.
89

ory stringency, and customer benefit) regarding four environmental issues: energy effi-
ciency, toxic substances, material efficiency, and electromagnetic fields. The actual sur-
vey was conducted consecutively using an online-questionnaire. The Germany survey
was performed from summer to winter 2006, the one in California from spring to au-
tumn 2007. The time frame for the surveyed EP-innovation activity is the three years
before the surveying.
The number of respondents and response rates are shown in table 1. With a total re-
sponse rate of 11% the participation is markedly lower in the California sample than in
the Germany sample (32%)2.
Table 1: Number of respondents (and response rate) by sub-sector and firm size
10-49 employees
50-250 employees
>250 employees
Total
Household Appliances (HA)
Cal 9 (9%) 5 (14%) 1 (10%) 15 (10%)
Ger 4 (14%) 12 (31%) 10 (34%) 26 (27%)
Information & Com-munication Techn. (IT)
Cal 7 (11%) 6 (7%) 11 (28%) 24 (12%)
Ger 7 (29%) 9 (21%) 11 (39%) 27 (28%)
Medical Appliances (ME)
Cal 5 (13%) 3 (6%) 5 (12%) 13 (10%)
Ger 11 (44%) 15 (39%) 13 (42%) 39 (41%)
TotalCal 21 (11%) 14 (8%) 17 (18%) 52 (11%)
Ger 22 (29%) 36 (30%) 34 (39%) 92 (32%)
Thus, the California data set consists of 208 cases from 52 firms, with four issues per
firm and the Germany data set of 368 cases (92 firms x 4 issues). As is (unfortunately)
common in surveys, not all questions in the questionnaire were answered by every
firm. Compared to the Germany data set, the share of missings is higher in the Califor-
nia data set, with the EMF issue having the most missings in both data sets3.
In the following, I provide descriptive statistics for the key variables regulatory strin-
gency, customer benefit, and EP-innovation. Their distributions in the California and
Germany sample are displayed and discussed for each environmental issue. Then, I
compare the data from California and Germany using the median and Spearman's rank
correlation, as all variables are ordinal scaled. Additionally, I analyze the bivariate rela-
2 The low response rate is at least partly due to Californian firms being more reluctant to reply to the survey invitation. In the Germany survey, around 20% of the contacted firms answered that they will not participate because of their firm not fulfilling the eligibility criteria. That is their products do not fit into the selected sub-sectors or the product development is not in their responsibility. These non-eligible firms have been removed from the list of non-respondents and therefore considerably increased the response rate calculated for Germany. Further, the OECD study on firms' environmental innovations exhibits similar differences with response rates of 18% in Germany and 12% in the US (Johnstone et al., 2007, p. 6).
3 Missings always raise the question of social desirability bias, e.g., that firms deliberately skipped a question instead of answering that they have not implemented any EP-innovations. As most records with missing data have missings for all main variables in the respective environmental issue, it is not possible to do a non-response analysis for these cases.
90

tionship of regulatory stringency and customer benefit with the EP-innovation vari-
ables. These analyses are first tests of my hypotheses.
3.1 Regulatory Stringency
For each environmental issue the regulatory stringency was surveyed. The participat-
ing firms were asked to rate the difficulty to meet regulations regarding the respective
issue for the last three years (REG_STR). The five answer categories range from „very
easy“ to „very difficult“4. Figure 1 shows the distribution of REG_STR for both samples,
ordered by environmental issue.
Looking first at the California sample, we can see that regulations regarding energy ef-
ficiency (EFF) have the lowest median (“very easy”) while electromagnetic fields
(EMF) has the highest one (“moderate”). The issues toxic substances (TOX) and mater-
ial efficiency (MAT) have a median of “easy”. MAT is the only issue, for which no firm
rated regulations with the maximum rank “very difficult”; for all other issues REG_STR
is distributed over all ranks.
Fig. 1: Regulatory stringency in California and Germany by env. issue5
Corr: (EFF)=0.209**; (TOX)=-0.196**; (MAT)=-0.299***; (EMF)=-0.169*ρ ρ ρ ρ(* p<0.1; ** p<0.05; *** p<0.01)
Spearman's rank correlation coefficients have been computed to compare the data
from California and Germany at the environmental-issue level. A positive coefficient in-
4 The survey questions for all variables used in this study are listed in the appendix.5 See table A1 in the appendix for the data underlying this figure, including information on missing data.
91
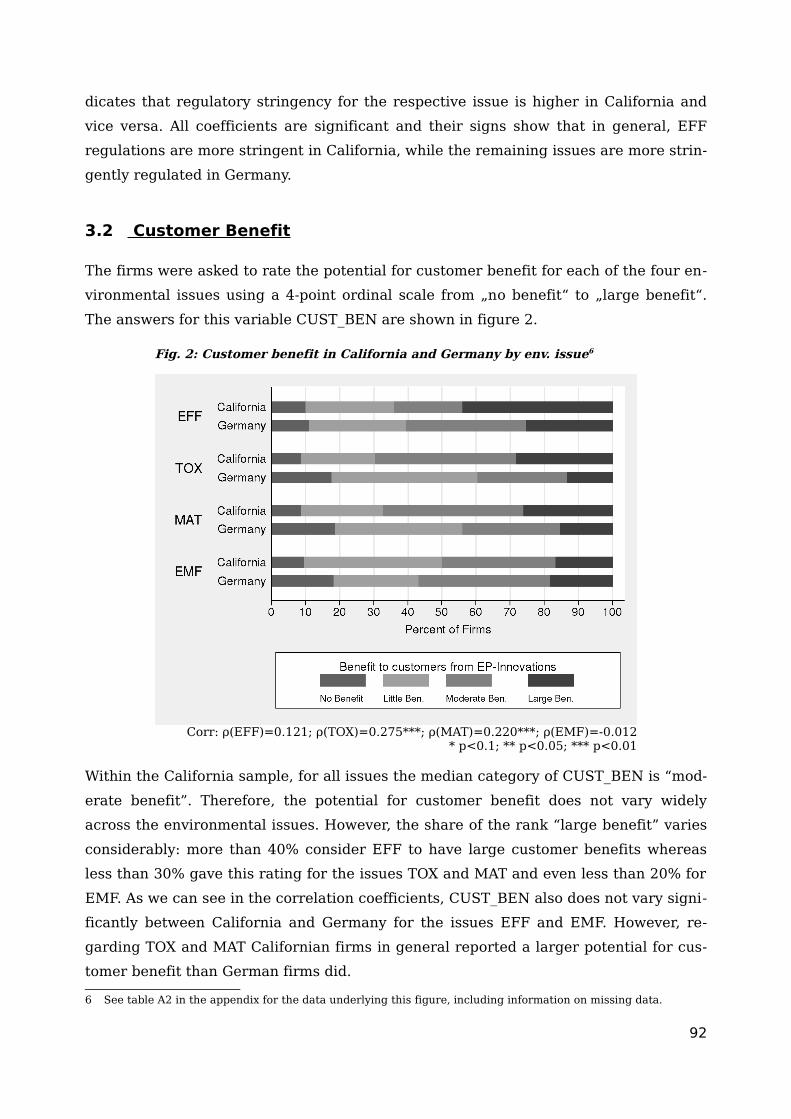
dicates that regulatory stringency for the respective issue is higher in California and
vice versa. All coefficients are significant and their signs show that in general, EFF
regulations are more stringent in California, while the remaining issues are more strin-
gently regulated in Germany.
3.2 Customer Benefit
The firms were asked to rate the potential for customer benefit for each of the four en-
vironmental issues using a 4-point ordinal scale from „no benefit“ to „large benefit“.
The answers for this variable CUST_BEN are shown in figure 2.
Fig. 2: Customer benefit in California and Germany by env. issue6
Corr: (EFF)=0.121; (TOX)=0.275***; (MAT)=0.220***; (EMF)=-0.012ρ ρ ρ ρ* p<0.1; ** p<0.05; *** p<0.01
Within the California sample, for all issues the median category of CUST_BEN is “mod-
erate benefit”. Therefore, the potential for customer benefit does not vary widely
across the environmental issues. However, the share of the rank “large benefit” varies
considerably: more than 40% consider EFF to have large customer benefits whereas
less than 30% gave this rating for the issues TOX and MAT and even less than 20% for
EMF. As we can see in the correlation coefficients, CUST_BEN also does not vary signi-
ficantly between California and Germany for the issues EFF and EMF. However, re-
garding TOX and MAT Californian firms in general reported a larger potential for cus-
tomer benefit than German firms did.
6 See table A2 in the appendix for the data underlying this figure, including information on missing data.
92
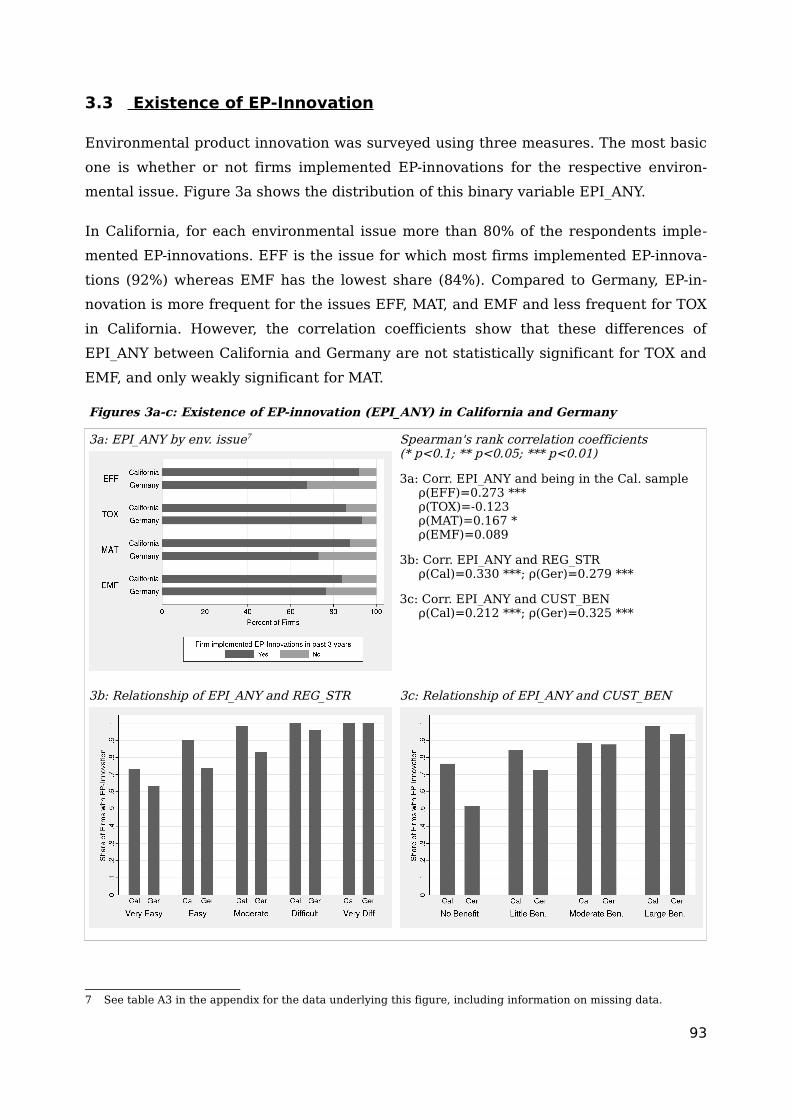
3.3 Existence of EP-Innovation
Environmental product innovation was surveyed using three measures. The most basic
one is whether or not firms implemented EP-innovations for the respective environ-
mental issue. Figure 3a shows the distribution of this binary variable EPI_ANY.
In California, for each environmental issue more than 80% of the respondents imple-
mented EP-innovations. EFF is the issue for which most firms implemented EP-innova-
tions (92%) whereas EMF has the lowest share (84%). Compared to Germany, EP-in-
novation is more frequent for the issues EFF, MAT, and EMF and less frequent for TOX
in California. However, the correlation coefficients show that these differences of
EPI_ANY between California and Germany are not statistically significant for TOX and
EMF, and only weakly significant for MAT.
Figures 3a-c: Existence of EP-innovation (EPI_ANY) in California and Germany
3a: EPI_ANY by env. issue7 Spearman's rank correlation coefficients(* p<0.1; ** p<0.05; *** p<0.01)
3a: Corr. EPI_ANY and being in the Cal. sample(EFF)=0.273 ***ρ(TOX)=-0.123ρ(MAT)=0.167 *ρ(EMF)=0.089ρ
3b: Corr. EPI_ANY and REG_STR(Cal)=0.330 ***; (Ger)=0.279 ***ρ ρ
3c: Corr. EPI_ANY and CUST_BEN(Cal)=0.212 ***; (Ger)=0.325 ***ρ ρ
3b: Relationship of EPI_ANY and REG_STR 3c: Relationship of EPI_ANY and CUST_BEN
7 See table A3 in the appendix for the data underlying this figure, including information on missing data.
93

Figure 3b shows the relationship between firms' rating of regulatory stringency and
whether they implemented EP-innovations. These pairs of REG_STR and EPI_ANY are
at the environmental issue level but have been aggregated over all issues for the pur-
pose of illustration. We can see that the more stringent the regulation is, the larger the
share of firms that implemented EP-innovations, for both states. The evidence of highly
significant correlation coefficients for these variables are a first support for hypothesis
1a that more stringent regulation leads to more firms implementing EP-innovations in
California.
In an analogous way, figure 3c illustrates the relationship between firms' ratings of
customer benefit and whether they implemented EP-innovations. As customer benefit
grows, the likelihood of EP-innovation increases in both states. This evidence is sup-
ported by the highly significant correlation coefficients for these two variables. Thus,
we also have first evidence for hypothesis 1b that customer benefit has a positive influ-
ence on EPI_ANY in California.
Interestingly, the cases with low regulatory stringency or customer benefit have a lar-
ger share of EP-innovation in California than in Germany, while the shares converge
with increasing values of the respective variable.
3.4 Extent of EP-Innovation
To obtain a more detailed measure of EP-innovation, firms were also asked to report
the percentage of products for which they implemented EP-innovations. This extent of
EP-innovation (EPI_EXT) had the following five answer categories: “<5%”, “5-25%”,
“26-50%”, “51-75%, and “76-100%”. For companies that have not implemented any EP-
innovations for the respective issue (i.e., EPI_ANY = 0) this variable has been coded to
“0%”. Figure 4a shows the extent of EP-innovation for all issues in California and Ger-
many.
Within the California sample, the maximum rank “76-100%” is the predominant answer
for each issue; it even reaches a share of almost 50% for the issue TOX. For all issues,
it is rare that EP-innovations were implemented only for a small range of products: less
than 10% of the firms answered to have an extent of EP-innovation of “<5%”. Com-
pared to the Germany sample, in general EPI_EXT is larger in California as can be
seen in the larger medians for each issue. Additionally, the correlation coefficients
have positive signs and are statistically significant except for TOX.
94

I ran a first test of EPI_EXT in California being influenced by regulatory stringency (hy-
pothesis 2a) and customer benefit (hypothesis 2b). Figure 4b demonstrates that more
stringent regulation corresponds with larger extent of EP-innovation in both states: the
median category for EPI_EXT increases with larger REG_STR. This relationship is fur-
ther supported by the significant and positive correlation coefficients (Cal: 0.353; Ger:
0.373). The same holds true for customer benefit in figure 4c, again supported by sig-
nificant correlation coefficients (Cal: 0.313; Ger: 0.273).
Figures 4a-c: Extent of EP-innovation (EPI_EXT) in California and Germany
4a: EPI_EXT by env. issue8 Spearman's rank correlation coefficients(* p<0.1; ** p<0.05; *** p<0.01)
4a: Corr. EPI_EXT and being in the Cal. sample(EFF)=0.407 ***ρ(TOX)=0.072ρ(MAT)=0.183 **ρ(EMF)=0.163 *ρ
4b: Corr. EPI_EXT and REG_STR(Cal)= 0.353 ***; (Ger)=0.373 ***ρ ρ
4c: Corr. EPI_EXT and CUST_BEN(Cal)=0.313 ***; (Ger)=0.273 ***ρ ρ
4b: Relationship of EPI_EXT and REG_STR 4c: Relationship of EPI_EXT and CUST_BEN
3.5 Novelty of EP-Innovation
Another more detailed measure of EP-innovation is the novelty of innovation
(EPI_NOV). Firms were asked to state what share of their EP-innovations could be con-
sidered market novelties. Answer categories are “no market novelties” “some market
novelties” and “mainly market novelties” (see figure 5a). For firms that have not imple-
8 See table A4 in the appendix for the data underlying this figure, including information on missing data.
95

mented any EP-innovations for the respective issue (i.e., EPI_ANY = 0) I coded
EPI_NOV to the minimum category “no novelties”.
Looking first at the California sample, EPI_NOV does not show strong variation across
the issues. “No market novelties” is the median answer category for every issue and
also the predominant one. Only around 10% of the firms implemented “mainly market
novelties”, with EMF having the lowest share. While around 10% of the firms imple-
mented “some market novelties” for the issues TOX and EMF, these shares increase to
more than 20% for EFF and MAT respectively.
Figures 5a-c: Novelty of EP-innovation (EPI_NOV) in California and Germany
5a: EPI_NOV by env. issue9 Spearman's rank correlation coefficients(* p<0.1; ** p<0.05; *** p<0.01)
5a: Corr. EPI_NOV and being in the Cal. sample(EFF)=-0.084ρ(TOX)=-0.253 ***ρ(MAT)=0.076ρ(EMF)=-0.135ρ
5b: Corr. EPI_NOV and REG_STR(Cal)=0.183 **; (Ger)=0.167 ***ρ ρ
5c: Corr. EPI_NOV and CUST_BEN(Cal)=0.402 ***; (Ger)=0.293 ***ρ ρ
5b: Relationship of EPI_NOV and REG_STR 5c: Relationship of EPI_NOV and CUST_BEN
Compared to the California sample, EPI_NOV is distributed more evenly in Germany,
that is the minimum and maximum categories are more frequent. However, here too
“no market novelties” is the median for every issue. The correlation coefficients indic-
ate that TOX is the only issue for which EPI_NOV significantly differs between Califor-
9 See table A5 in the appendix for the data underlying this figure, including information on missing data.
96

nia and Germany: in general the novelty of EP-innovation regarding TOX is larger in
Germany.
Figure 5b illustrates how REG_STR relates to EPI_NOV. Again, the median of EPI_NOV
remains almost constant at “No Market Novelty” for all sub-groups with the exception
of the sub-group “very difficult” in Germany, for which “some market novelties” is the
median. Looking at the Germany data, we can see that the share of firms that imple-
mented at least “some market novelties” is growing with increasing regulatory strin-
gency (with a drop for the “moderate” sub-group). In the California sample, this share
does also somewhat increase for REG_STR values from “very easy” to “difficult”, but
decline to zero for the sub-group “very difficult”. The ambiguity of this relationship is
also found in the relatively low correlation coefficients (Cal: 0.183; Ger: 0.167). In oth-
er words, hypothesis 1c stating that regulatory stringency stimulates the novelty of EP-
innovation in California is only weakly supported by this bivariate analysis.
The relationship between EPI_NOV and CUST_BEN, displayed in figure 5c, is less am-
biguous: the median remains constant at “no market novelties” (except for the sub-
group “large benefit” in California), but the share of firms that implemented at least
“some market novelties” clearly grows with increasing regulatory stringency. This de-
pendency is also demonstrated by the correlation coefficients (Cal: 0.402; Ger: 0.293).
Thus, we have some first evidence for hypothesis 2c, that customer benefit positively
influences the novelty of EP-innovation in California.
3.6 Conclusions
The descriptive statistics show that the main independent variables exhibit consider-
able variation in the California sample. They vary within the environmental issues as
well as across the issues. Compared to Germany, Californian firms generally rated reg-
ulations to be less stringent, with the exception of the issue EFF. Regarding customer
benefit, Californian firms generally reported larger benefits for TOX and MAT, while
there are no significant differences for the other two issues, EFF and EMF.
With regard to the three EP-innovation measures, the descriptive analysis shows two
differences between California and Germany. On the one hand, with regard to whether
firms implement EP-innovations (EPI_ANY) and if so to what extend (EPI_EXT), Califor-
nian firms are at least as innovative as their German counterparts. Californian firms
are even more likely to implement EP-innovations for EFF and MAT. And, overall, they
implement them to a larger extent for the issues EFF, MAT, and EMF. On the other
97

hand, the overall novelty of EP-innovation in the California sample is not larger than in
the Germany sample. For the issue TOX it is even lower in California.
Note that these comparisons cannot be used to test my hypotheses. As hypotheses H1
and H2 state relationships at the firm level and these comparisons are at the aggreg-
ated state level such an inference would be an ecological fallacy.
However, the bivariate correlation tests at the individual level (fig. 3b,c / 4b,c / 5b,c)
provide first evidence for hypotheses H1 and H2: regulatory stringency and customer
benefit have significant positive dependencies with each of the three measures of EP-
innovation in the California sample. The respective correlation coefficients are sum-
marized in table 2. We can see that most correlations for California have a coefficient
of above 0.3, only for the relations of CUST_BEN and EPI_ANY as well as REG_STR
and EPI_NOV the coefficients are around 0.2. While the correlation of REG_STR and
EPI_NOV also has the lowest coefficient in the Germany sample, there the coefficient
for CUST_BEN and EPI_ANY is one of the highest.
Table 2: Spearman's rank correlation coefficients of main variables at the issue level
EPI_ANY EPI_EXT EPI_NOV
Coeff. N Coeff. N Coeff. N
California REG_STR 0.330 *** 184 0.353 *** 184 0.183 ** 171
CUST_BEN 0.212 *** 183 0.313 *** 179 0.402 *** 173
Germany REG_STR 0.279 *** 349 0.373 *** 344 0.167 *** 328
CUST_BEN 0.325 *** 355 0.273 *** 349 0.293 *** 332
* p<0.1; ** p<0.05; *** p<0.01
Of course, these bivariate examinations are not a thorough test of the hypotheses, as
neither is the influence of the other key variable considered (customer benefit or regu-
latory stringency respectively) nor is the ceteris paribus condition fulfilled (e.g., firm
size).
4 Multiple Analysis
In this section, I test the influence of regulatory stringency and customer benefit on
the three EP-innovation measures using multiple regression analysis. Thus, these influ-
ences are analyzed simultaneously while also controlling for firm-internal factors, mar-
ket factors, and environmental issue. For the binary outcome variable EPI_ANY, I apply
logit regression, while ordered logits are used for the outcomes EPI_EXT and
EPI_NOV10.
10 All statistics have been calculated with the software package Stata 9.2.
98

As mentioned, some data records have missing data, especially the ones regarding the
issue EMF. I have imputed these missing values separately for the California and the
German data, using the multiple imputation method11 (Allison, 2001). However, for 29
observations listwise deletion had to be applied nevertheless, as both the dependent
and main independent variables (i.e., EP-innovation, regulation, and customer benefits)
had missing values. Thus, the regressions are based on 192 observations at the issue
level in the California sample and 355 observations in the Germany sample.
To test whether the regression results are robust and not biased by the relatively high
number of missing data (and high number of multiple-imputed data) for the EMF issue
in the California sample, all models were re-estimated without the EMF-specific data.
Overall, the regression results are robust with regard to sign and magnitude of the es-
timated coefficients. Some estimates have a weaker statistical significance in the re-
stricted sample because their sample size is 25% smaller12. I control for the following
variables in the logit models:
Firm internal factors
● EMPLOYEE: size of the firm, measured as number of employees (in thousands)
● EMPL_R&D: general R&D activities of the firm, measured as the share of em-
ployees in R&D
● GREENCAP: green capabilities the firm developed, operationalized as the num-
ber of measures implemented from the following: certified environmental man-
agement system, voluntary environmental targets for products, systematic en-
vironmental analyses of products, use of environmental attributes in marketing,
environmental trainings for product developers
● SCTR_REV: ratio of the firm's revenue in the surveyed sub-sector to total reven-
ue (ranging from 1 for “0-20%” to 5 for “80-100%”)
Market factors
● COMP_PRE: competitive pressure, operationalized as number of direct compet-
itors (measured as “0”, “1-5”, “6-10”, “11-15”, “16-20”, and “>20”)
● SEC_: dummy variables for the firm's sub-sector (_HA, _IT, and _ME)
Environmental issue
● I_: dummy variables for the environmental issue (_EFF, _TOX, _MAT, and _EMF)
11 The multiple imputation process has been performed with the ice package (Royston, 2005) in Stata. The Stata do-file is available from the author on request.
12 The results of these restricted models are provided in the appendix (tables A6-A8).
99

While the main study variables regulatory stringency, customer benefit, and the three
measures of EP-innovation are at the environmental issue level, the control variables
have been measured at the firm level. That is, the control variables do not vary across
the environmental issues within a firm. To adjust for this intra-group correlation, I use
standard errors that are robust against clustering by firms.
For each EP-innovation measure, the regression models for the California sample were
reduced by dropping non-significant control variables. The models for the Germany
sample were re-estimated with the same constrained specification to facilitate their
comparison. I decided for this order of model specification because the California mod-
els are of main interest. The full models containing all predictor variables are provided
in the appendix, as are the original, slightly differently specified, Germany models
from the study of Kammerer (2008). The results of the reduced Germany models in this
study and the ones from the previous study are robust with regard to sign and signific-
ance of effects.
4.1 Existence of EP-Innovation
The results of the logit regression for EPI_ANY are displayed in table 3. The second
column shows coefficients as odds ratios, levels of significance, and robust standard
errors for the California sample. The evidence clearly supports hypotheses H1a and
H2a: both regulatory stringency (REG_STR) and customer benefit (CUST_BEN) have a
statistically significant positive effect on whether firms implement EP-innovations.
While the effect of regulatory stringency is highly significant, customer benefit only
has a weakly significant effect (10% level of significance).
As to the control variables, most firm-internal factors have statistically significant ef-
fects on EPI_ANY as well. GREENCAP has a positive effect: the more green capability
measures a firm has realized, the more likely are EP-innovations. Firm size (EMPLOY-
EE) has a negative effect13, while R&D activity (EMPL_R&D) does not have a statistic-
ally significant effect14. SCTR_REV also has a positive effect: the more important the
surveyed sub-sector is for a firm's total revenue, the more likely are EP-innovations.
13 The odds ratio is the factor by which a 1-unit increase of the predictor variable changes the odds of the outcome. In general, odds is the probability of the successful outcome divided by the probability of the unsuccessful outcome. For EPI_ANY the odds is the probability of having implemented EP-innovations divided by the probability of not having implemented EP-innovations. Therefore an odds ratio between 0 and 1 means that the predictor has a negative effect, while an odds ratio larger than 1 indicates a positive effect.
14 The reduced model has been tested using a Wald test for the dropped variables. The test statistics that the effects of R&D_EMPL, SEC_HA and SEC_IT are simultaneously equal to zero are chi2(3) = 3.73; Prob = 0.2926
100
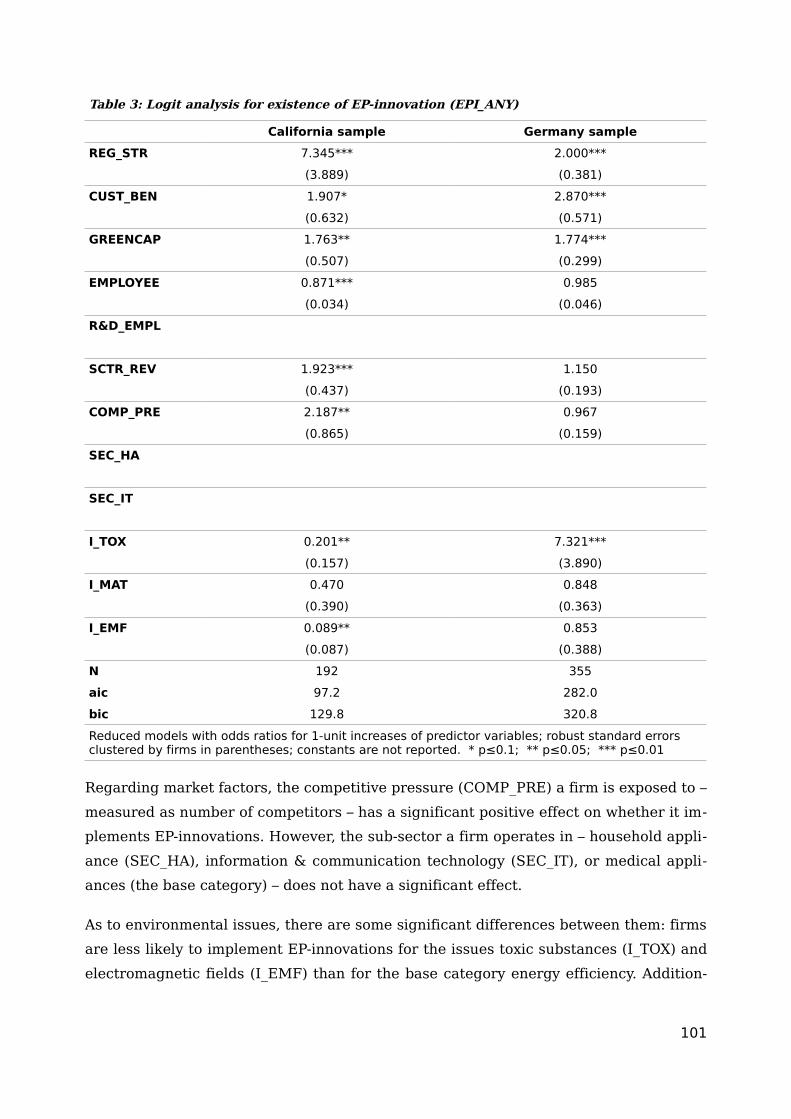
Table 3: Logit analysis for existence of EP-innovation (EPI_ANY)
California sample Germany sample
REG_STR 7.345*** 2.000***
(3.889) (0.381)
CUST_BEN 1.907* 2.870***
(0.632) (0.571)
GREENCAP 1.763** 1.774***
(0.507) (0.299)
EMPLOYEE 0.871*** 0.985
(0.034) (0.046)
R&D_EMPL
SCTR_REV 1.923*** 1.150
(0.437) (0.193)
COMP_PRE 2.187** 0.967
(0.865) (0.159)
SEC_HA
SEC_IT
I_TOX 0.201** 7.321***
(0.157) (3.890)
I_MAT 0.470 0.848
(0.390) (0.363)
I_EMF 0.089** 0.853
(0.087) (0.388)
N 192 355
aic 97.2 282.0
bic 129.8 320.8
Reduced models with odds ratios for 1-unit increases of predictor variables; robust standard errors clustered by firms in parentheses; constants are not reported. * p≤0.1; ** p≤0.05; *** p≤0.01
Regarding market factors, the competitive pressure (COMP_PRE) a firm is exposed to –
measured as number of competitors – has a significant positive effect on whether it im-
plements EP-innovations. However, the sub-sector a firm operates in – household appli-
ance (SEC_HA), information & communication technology (SEC_IT), or medical appli-
ances (the base category) – does not have a significant effect.
As to environmental issues, there are some significant differences between them: firms
are less likely to implement EP-innovations for the issues toxic substances (I_TOX) and
electromagnetic fields (I_EMF) than for the base category energy efficiency. Addition-
101
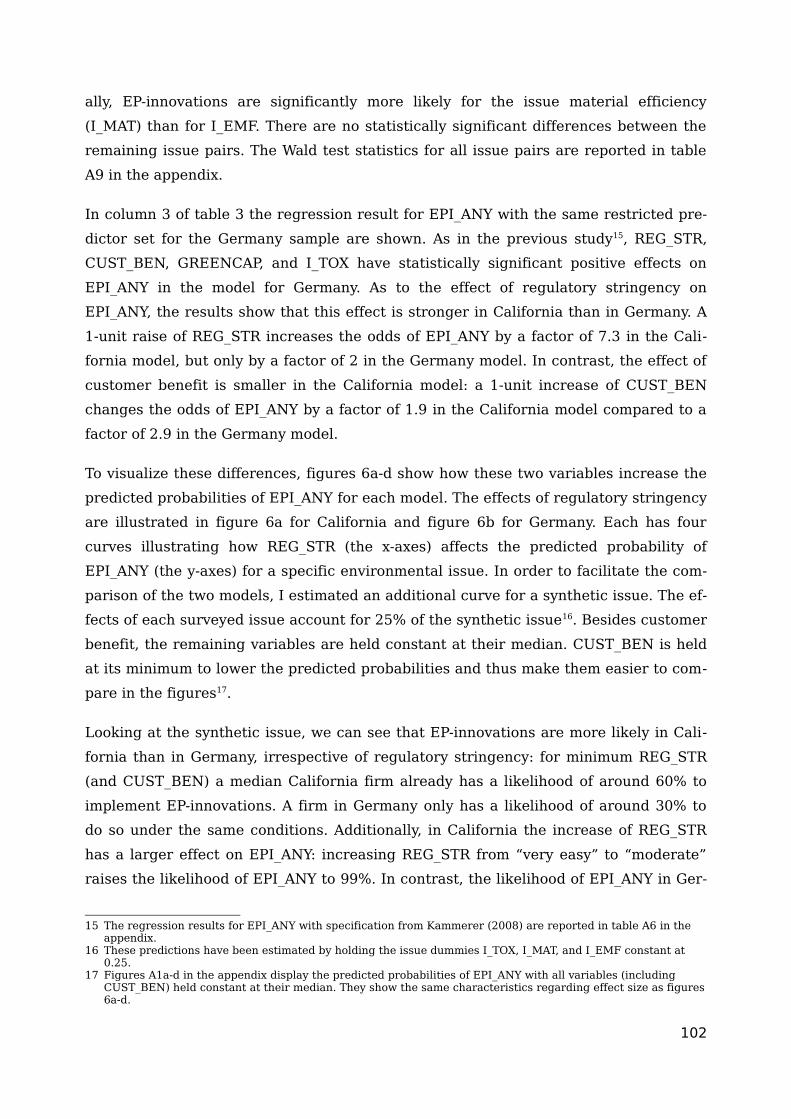
ally, EP-innovations are significantly more likely for the issue material efficiency
(I_MAT) than for I_EMF. There are no statistically significant differences between the
remaining issue pairs. The Wald test statistics for all issue pairs are reported in table
A9 in the appendix.
In column 3 of table 3 the regression result for EPI_ANY with the same restricted pre-
dictor set for the Germany sample are shown. As in the previous study15, REG_STR,
CUST_BEN, GREENCAP, and I_TOX have statistically significant positive effects on
EPI_ANY in the model for Germany. As to the effect of regulatory stringency on
EPI_ANY, the results show that this effect is stronger in California than in Germany. A
1-unit raise of REG_STR increases the odds of EPI_ANY by a factor of 7.3 in the Cali-
fornia model, but only by a factor of 2 in the Germany model. In contrast, the effect of
customer benefit is smaller in the California model: a 1-unit increase of CUST_BEN
changes the odds of EPI_ANY by a factor of 1.9 in the California model compared to a
factor of 2.9 in the Germany model.
To visualize these differences, figures 6a-d show how these two variables increase the
predicted probabilities of EPI_ANY for each model. The effects of regulatory stringency
are illustrated in figure 6a for California and figure 6b for Germany. Each has four
curves illustrating how REG_STR (the x-axes) affects the predicted probability of
EPI_ANY (the y-axes) for a specific environmental issue. In order to facilitate the com-
parison of the two models, I estimated an additional curve for a synthetic issue. The ef-
fects of each surveyed issue account for 25% of the synthetic issue16. Besides customer
benefit, the remaining variables are held constant at their median. CUST_BEN is held
at its minimum to lower the predicted probabilities and thus make them easier to com-
pare in the figures17.
Looking at the synthetic issue, we can see that EP-innovations are more likely in Cali-
fornia than in Germany, irrespective of regulatory stringency: for minimum REG_STR
(and CUST_BEN) a median California firm already has a likelihood of around 60% to
implement EP-innovations. A firm in Germany only has a likelihood of around 30% to
do so under the same conditions. Additionally, in California the increase of REG_STR
has a larger effect on EPI_ANY: increasing REG_STR from “very easy” to “moderate”
raises the likelihood of EPI_ANY to 99%. In contrast, the likelihood of EPI_ANY in Ger-
15 The regression results for EPI_ANY with specification from Kammerer (2008) are reported in table A6 in the appendix.
16 These predictions have been estimated by holding the issue dummies I_TOX, I_MAT, and I_EMF constant at 0.25.
17 Figures A1a-d in the appendix display the predicted probabilities of EPI_ANY with all variables (including CUST_BEN) held constant at their median. They show the same characteristics regarding effect size as figures 6a-d.
102

many rises only to 66%. Interestingly, for all environmental issues the likelihood of
EPI_ANY is larger in California except for TOX. For this issue, the median firm in Ger-
many is more likely to implement EP-innovations than the one in California, as long as
regulatory stringency is at its lowest rank. For all other environmental issues, the me-
dian firm in California is more likely to implement EP-innovations than the one in Ger-
many, regardless of regulatory stringency.
Figures 6a-d: Predicted probabilities of EP-innovation (EPI_ANY)18
6a: Effect of REG_STR in California 6b: Effect of REG_STR in Germany
6c: Effect of CUST_BEN in California 6d: Effect of CUST_BEN in Germany
Figures 6c,d show the effects of customer benefit on EPI_ANY in California (6c) and
Germany (6d) when REG_STR is held constant at its minimum. Obviously, the probabil-
ity of EPI_ANY with minimum customer benefit is larger in California than in Germany
as these are the same conditions as in figures 6a-b: REG_STR and CUST_BEN are at
their minimum and the other variables are at their median. However, with increasing
customer benefit the probability of EPI_ANY rises steeper in Germany. For the maxim-
18 Predicted probabilities for medians of GREENCAP (1), EMPLOYEE (0.12; in thds.), SEC_REV (“81-100%”), COMP_PRE (“6-10”); and for minima of CUST_BEN (fig. 6a,b) and REG_STR (fig. 6c,d), respectively.
103

um customer benefit it even catches up with the probability in California: in both
states, the median firm has a likelihood of 92% to implement EP-innovations.
4.2 Extent of EP-Innovation
Table 4 reports the results for the ordered logit regression of EPI_EXT. The extent of
EP-innovation measures the share of products for which EP-innovations have been im-
plemented.
Table 4: Ordered logit analysis for extent of EP-innovation (EPI_EXT)
California sample Germany sample
REG_STR 1.793*** 1.804***
(0.355) (0.222)
CUST_BEN 1.606** 1.854***
(0.330) (0.271)
GREENCAP
EMPLOYEE
R&D_EMPL
SCTR_REV 1.396** 1.036
(0.199) (0.130)
COMP_PRE 1.343* 1.129
(0.232) (0.149)
SEC_HA
SEC_IT
I_TOX 0.924 2.889***
(0.340) (0.694)
I_MAT 0.676 1.136
(0.182) (0.323)
I_EMF 0.469** 0.818
(0.174) (0.230)
N 192 355
aic 592.5 1152.1
bic 631.6 1198.6
Reduced models with odds ratios for 1-unit increases of predictor variables; robust standard errors clustered by firms in parentheses; thresholds are not reported. * p≤0.1; ** p≤0.05; *** p≤0.01
104

As for the California results in the second column, regulatory stringency and customer
benefit have a highly significant positive effect on the extent of EP-innovation. This
supports hypotheses H1b and H2b: the more stringent regulation is and the larger cus-
tomer benefit, the larger is the extent to which firms implement EP-innovations. Re-
garding the control variables, SCTR_REV is the only firm-internal factor that has a
statistically significant effect: the extent of EP-innovation is larger when a firm's reven-
ue in the surveyed sub-sector exhibits a larger share of its total revenue. However,
neither green capabilities nor firm size or R&D activities have a significant effect on
EPI_EXT19.
The positive impact of competitive pressure on EPI_EXT is only weakly significant,
while the sub-sector itself does not play a role. As for environmental issues, firms im-
plement EP-innovation to a lesser extent for EMF than for EFF or TOX (see table A9).
There are no statistically significant differences between the remaining issue pairs.
To compare the California data with the Germany data, the regression model for the
Germany data – in the third column – has the same predicator variables as the reduced
California model. As in the model of my previous study, in the Germany model
REG_STR, CUST_BEN, and I_TOX have highly significant positive effects on EPI_EXT20.
Comparing the regression results for California and Germany, we can see that the ef-
fect of REG_STR is about the same in both models, whereas the effect of CUST_BEN is
stronger in Germany than in California. Note that regulation has a larger maximal ef-
fect than customer benefit in both models. The odds ratios reported are computed for a
1-unit increase of the predictor variables. As REG_STR has a range of 5 units com-
pared to 4 units for CUST_BEN, the odds ratios for a minimum to maximum change are
considerably larger for regulation21 than for customer benefit22.
To visualize these effect sizes, figures 7a-d show cumulative probabilities of EPI_EXT.
These probabilities have been estimated for the median firm, varying only regulatory
stringency (fig. 7a,b) and customer benefit (fig. 7c,d), respectively. Looking at the up-
per figures we can see that a median firm in California (fig. 7a) implements EP-innova-
tions to a larger extent than its German counterpart does (fig. 7b), irrespective of the
regulatory stringency. For example, with minimum regulatory stringency the cumulat-
ive probability of an EP-innovation extent of “>=50%” is already 0.54 in California, and
increases via 0.79 (medium regulatory stringency) to 0.92 for maximum regulatory
stringency; the same outcome in Germany only has a cumulative probability of 0.29
19 The Wald test statistics for EMPLOYEE, R&D_EMPL, GREENCAP, SEC_HA, and SEC_IT to simultaneously have a coefficient of zero are chi2(5) = 4.36; Prob = 0.4991
20 The test results for EPI_EXT from the previous study are reported in table A7 in the appendix.21 Cal: OR(REG_STR)min->max = (1.793)5 = 18.5; Ger: OR(REG_STR)min->max = (1.804)5 = 19.122 Cal: OR(CUST_BEN)min->max = (1.606)4 = 6.7; Ger: OR(CUST_BEN)min->max = (1.854)4 = 11.8
105
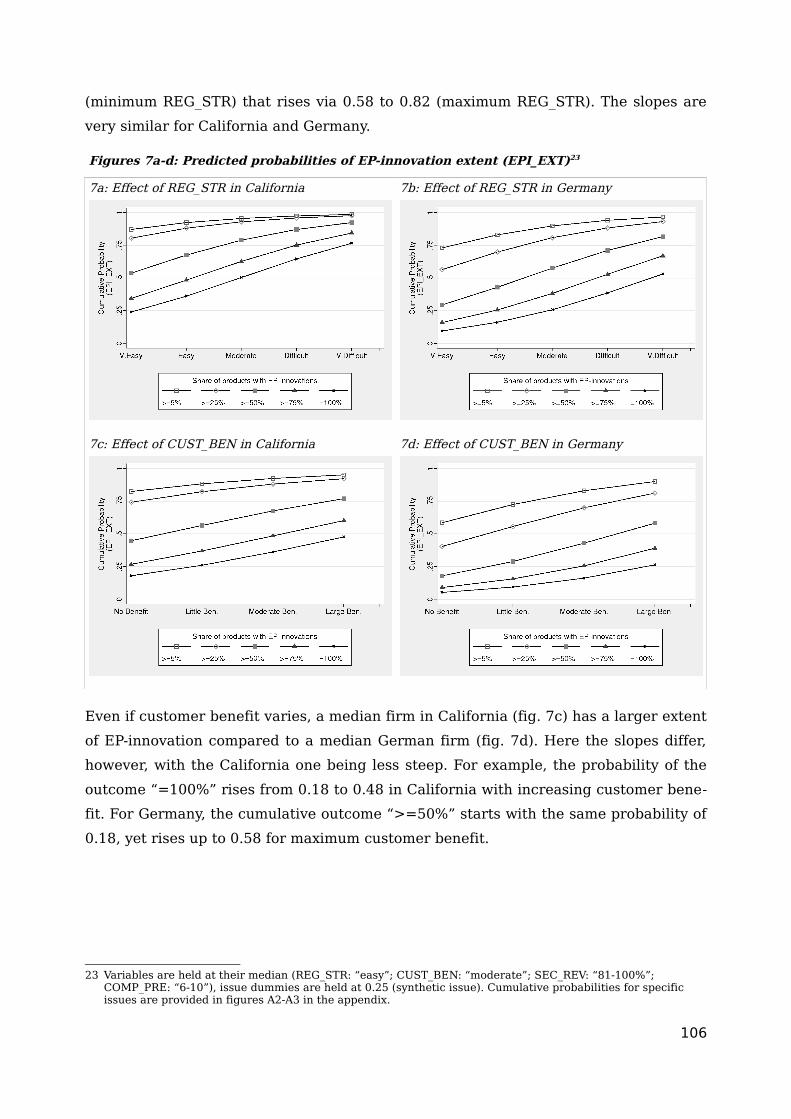
(minimum REG_STR) that rises via 0.58 to 0.82 (maximum REG_STR). The slopes are
very similar for California and Germany.
Figures 7a-d: Predicted probabilities of EP-innovation extent (EPI_EXT)23
7a: Effect of REG_STR in California 7b: Effect of REG_STR in Germany
7c: Effect of CUST_BEN in California 7d: Effect of CUST_BEN in Germany
Even if customer benefit varies, a median firm in California (fig. 7c) has a larger extent
of EP-innovation compared to a median German firm (fig. 7d). Here the slopes differ,
however, with the California one being less steep. For example, the probability of the
outcome “=100%” rises from 0.18 to 0.48 in California with increasing customer bene-
fit. For Germany, the cumulative outcome “>=50%” starts with the same probability of
0.18, yet rises up to 0.58 for maximum customer benefit.
23 Variables are held at their median (REG_STR: “easy”; CUST_BEN: “moderate”; SEC_REV: “81-100%”; COMP_PRE: “6-10”), issue dummies are held at 0.25 (synthetic issue). Cumulative probabilities for specific issues are provided in figures A2-A3 in the appendix.
106
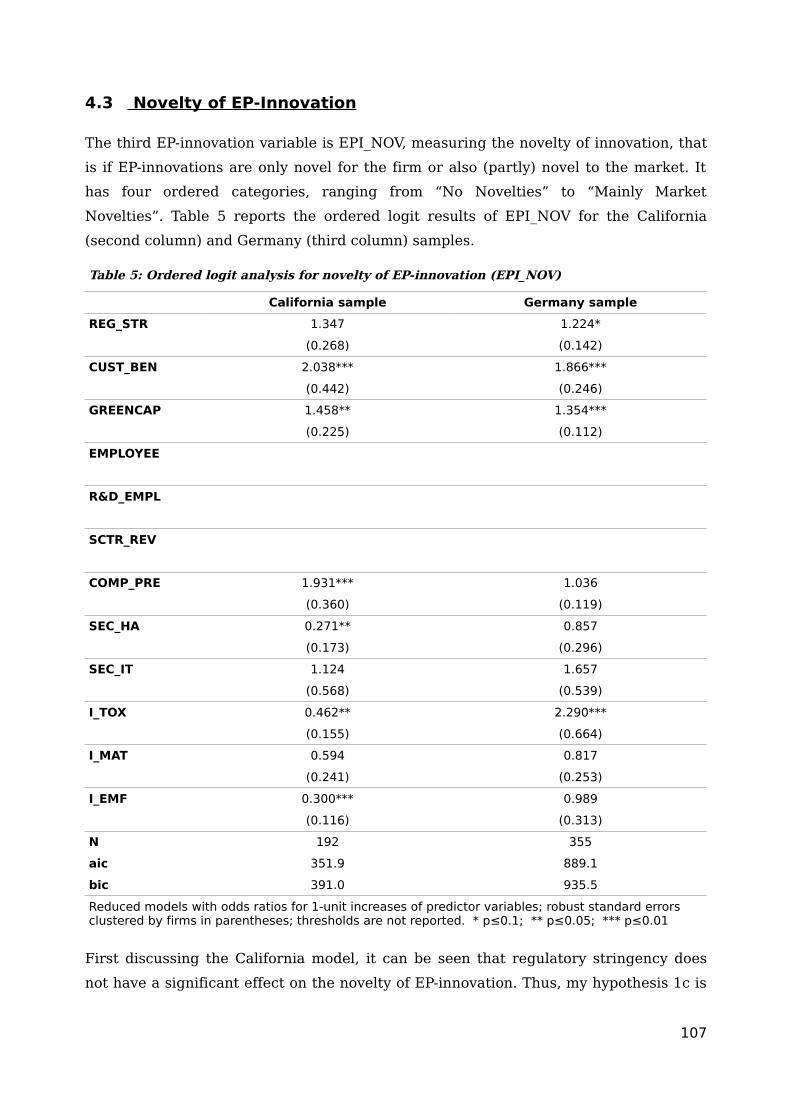
4.3 Novelty of EP-Innovation
The third EP-innovation variable is EPI_NOV, measuring the novelty of innovation, that
is if EP-innovations are only novel for the firm or also (partly) novel to the market. It
has four ordered categories, ranging from “No Novelties” to “Mainly Market
Novelties”. Table 5 reports the ordered logit results of EPI_NOV for the California
(second column) and Germany (third column) samples.
Table 5: Ordered logit analysis for novelty of EP-innovation (EPI_NOV)
California sample Germany sample
REG_STR 1.347 1.224*
(0.268) (0.142)
CUST_BEN 2.038*** 1.866***
(0.442) (0.246)
GREENCAP 1.458** 1.354***
(0.225) (0.112)
EMPLOYEE
R&D_EMPL
SCTR_REV
COMP_PRE 1.931*** 1.036
(0.360) (0.119)
SEC_HA 0.271** 0.857
(0.173) (0.296)
SEC_IT 1.124 1.657
(0.568) (0.539)
I_TOX 0.462** 2.290***
(0.155) (0.664)
I_MAT 0.594 0.817
(0.241) (0.253)
I_EMF 0.300*** 0.989
(0.116) (0.313)
N 192 355
aic 351.9 889.1
bic 391.0 935.5
Reduced models with odds ratios for 1-unit increases of predictor variables; robust standard errors clustered by firms in parentheses; thresholds are not reported. * p≤0.1; ** p≤0.05; *** p≤0.01
First discussing the California model, it can be seen that regulatory stringency does
not have a significant effect on the novelty of EP-innovation. Thus, my hypothesis 1c is
107

rejected by the California data set. Customer benefit however has a highly significant
positive effect on the novelty of EP-innovation supporting hypothesis 2c. As for firm-in-
ternal factors, green capabilities is the only factor to have a significant effect on
EPI_NOV24: the more green capabilities a firm has the more likely it is to implement
EP-innovations that are market novelties. Regarding market factors, EPI_NOV is the
only EP-innovation measure for which there are significant differences between the
sub-sectors: manufacturers of household appliances (SEC_HA) are less likely to imple-
ment market novelties than IT or medical appliances manufacturers25. Additionally,
competitive pressure has a positive influence on EPI_NOV. There are also differences
between the environmental issues. Similar to the results for EPI_ANY, firms implement
more novel EP-innovations for energy efficiency than for toxic substances (I_TOX) and
electromagnetic fields (I_EMF). There are no significant differences between the re-
maining issue pairs (see table A9).
Contrary to the California model, regulatory stringency has a positive effect on
EPI_NOV in the Germany model, yet with weak significance only. Further, CUST_BEN,
GREENCAP, and I_TOX have positive effects on EPI_NOV. Interestingly, there are no
differences between the sub-sectors regarding novelty of EP-innovation in the Ger-
many model.
Figures 8a-f illustrate the effect of CUST_BEN on EPI_NOV in California (left column)
and Germany (right column). In figure 8a, we can see that the median firm in Califor-
nia is very unlikely to implement at least “some market novelties”. Even for a “large”
customer benefit, the probability only reaches 19%. In Germany (fig. 8b), the odds for
market novelties are higher. Here a median firm already has a probability of 53% to
implement at least “some market novelties”. In figures 8c-f, these conditions are re-
tained but firms' green capabilities are raised. Still, the probability of at least “some
market novelties” does not surpass the 50% line in California, unless CUST_BEN and
GREENCAP are at its maximum (fig. 8e). In Germany, the probability of at least “some
market novelties” passes over 50% for firms with a GREENCAP score of 3 and “moder-
ate” customer benefit (fig. 8d); or for firms with a GREENCAP score of 5 if they recog-
nize at least a “little” customer benefit (fig. 8f). For those firms, even the outcome
“mainly market novelties” surpasses the 50% line if they recognize a “large” customer
benefit.
24 The Wald test statistics for EMPLOYEE, R&D_EMPL, and SEC_REV to simultaneously have a coefficient of zero are chi2(3) = 1.36; Prob > chi2 = 0.7149
25 Wald test statistics for SEC_HA = SEC_IT: chi2(1) = 6.98; Prob = 0.0082
108

Figures 8a-f: Effects of customer benefit on EP-innovation novelty (EPI_NOV)26
8a: Effects for GREENCAP=1 in California 8b: Effects for GREENCAP=1 in Germany
8c: Effects for GREENCAP=3 in California 8d: Effects for GREENCAP=3 in Germany
8e: Effects for GREENCAP=5 in California 8f: Effects for GREENCAP=5 in Germany
26 Predicted probabilities for median REG_STR (“easy”) and COMP_PRE (“6-10”); issue dummies are held at 0.25 (synthetic issue) and sector dummies at 0.333 (synthetic sub-sector).
109

5 Conclusion
In this paper, I have examined influence of regulation and customer benefit on environ-
mental product innovation in California. The empirical testing was done on a unique
data set: 52 Californian manufacturers of electrical and electronic appliances have
been surveyed on their environmental product innovations regarding four environ-
mental issues (energy efficiency, toxic substances, material efficiency, and electromag-
netic fields). Additionally, I compared this data with a similar data set on German man-
ufacturers.
The most important empirical finding is that, overall, the stimulating effect of regula-
tion and customer benefit has been corroborated. More specifically, the importance of
customer benefit for firms' environmental innovation activities is supported for all EP-
innovation measures. The potential for customer benefit not only stimulates firms to
implement EP-innovations and to apply them to a large share of their products, it also
motivates firms to go beyond the diffusion of already-known improvements and to de-
velop and implement environmental product innovations that are novel to the market.
The influence of regulation – the other variable of main interest in this study – is less
extensive. It has been shown that more stringent regulation leads to both more firms
implementing EP-innovations and firms implementing EP-innovations more broadly.
However, a relationship between regulation and EP-innovations which are novel to the
market could not be corroborated. This leads me to the conclusion that regulation
plays only a minor role – if at all – for the development and implementation of market
novelties. Nevertheless, for the diffusion of EP-innovations, regulation is more import-
ant than customer benefit, that is, it has a larger effect size. This can be summarized
as customer benefit stimulates firms more strongly to come up with novel EP-innova-
tions while more stringent regulation leads to a broader diffusion of EP-innovations
that have already been introduced to the market.
With regard to the actual EP-innovation activity, this study revealed some interesting
differences between California and Germany. Again, there is a distinction between the
extent and the novelty of EP-innovation. On the one hand, a Californian firm is more
likely to implement EP-innovations than a German firm is; and it also implements these
innovations on a broader range. On the other hand, firms in Germany generally devel-
op and implement more EP-innovations that are novel to the market.
This can be explained by the varieties of capitalism theory. Following this approach,
liberal market economies like California are characterized by intense product competi-
110

tion. In such a competitive market, firms need to quickly adopt new (environmental) at-
tributes that competitors have introduced to their products. This interpretation is fur-
ther supported by the fact that competitive pressure, which has no effect in Germany,
has a positive effect on all EP-innovation measures in California. In contrast, coordin-
ated market economies like Germany focus more on product differentiation and niche
production. Therefore, those firms have the capacity to develop novel solutions to en-
vironmental challenges and they also have a market strategy that embraces novel (en-
vironmental) product attributes.
While it has not been the intention of this paper to test the varieties of capitalism
framework, the fact that my hypotheses are confirmed in a liberal market economy as
well as in a coordinated market economy – and even adapt themselves to the specific
market characteristics – provides strong support for my hypotheses. Therefore, al-
though the hypotheses have only been tested for these two states, I am confident that
they also apply to other states, be they liberal or coordinated market economies.
111

6 References
Acs, Z.J., Audretsch, D.B., 1988. Innovation in Large and Small Firms - An Empirical Analysis. The American Economic Review 78(4): 678-690.
Allison, P.D., 2001. Missing Data. SAGE, Thousand Oaks, California.
Banerjee, S.B., Iyer, E.S., Kashyap, R.K., 2003. Corporate Environmentalism: Antecedents and Influence of Industry Type. Journal of Marketing 67: 106-122.
Barney, J., 1991. Firm Resources and Sustained Competitive Advantage. Journal of Management 17(1): 99-120.
Baylis, R., Connell, L., Flynn, A., 1998. Company Size, Environmental Regulation and Ecological Modernization: Further Analysis at the Level of the Firm. Business Strategy and the Environment 7(5): 285-296.
Belz, F., 2001. Integratives Oeko-Marketing - Erfolgreiche Vermarktung oekologischer Produkte und Leistungen. DUV, Wiesbaden, Germany.
Belz, F., Bilharz, M., 2005. Nachhaltigkeits-Marketing in Theorie und Praxis. DUV, Wiesbaden, Germany.
Bernauer, T., Engels, S., Kammerer, D., Seijas, J., 2007. Explaining Green Innovation - Ten Years after Porter's Win-Win Proposition: How to Study the Effects of Regulation on Corporate Environmental Innovation? In: K. Jacob, F. Biermann, P.-O. Busch, P.H. Feindt (editors), Politik und Umwelt. VS Verlag fuer Sozialwissenschaften, Wiesbaden, Germany, pp. 323-341.
Brunnermeier, S.B., Cohen, M.A., 2003. Determinants of Environmental Innovation in US Manufacturing Industries. Journal of Environmental Economics and Management 45(2): 278-293.
EC, 2001. Green Paper on Integrated Product Policy. European Commission.
EC, 2003. Communication on Integrated Product Policy. European Commission.
EEIG, 2004. Convergence and the Digital World. (editors), European Information Technology Observatory 2004. European Economic Interest Grouping (EEIG), Frankfurt a.M., Germany, pp. 144-211.
Elkington, J., 1994. Towards the Sustainable Corporation: Win-Win-Win Business Strategies for Sustainable Development. California Management Review 36(2): 90-100.
Engels, S., 2008. Determinants of Environmental Innovation in the Swiss and German Food and Beverages Industry - What Role does Environmental Regulation Play? , Diss. ETH Zurich No. 17465, ETH Zurich, Zurich, Switzerland.
Eurostat, 2004. European Business - Facts and Figures 1998 - 2002. Office for Official Publications of the European Communities, Luxemburg.
Frondel, M., Horbach, J., Rennings, K., 2008. What Triggers Environmental Management and Innovation? Empirical Evidence for Germany. Ecological Economics 66(1): 153-160.
Gonzalez-Benito, J., Gonzalez-Benito, O., 2006. A Review of Determinant Factors of Environmental Proactivity. Business Strategy and the Environment 15(2): 87-102.
Hall, P.A., Soskice, D., 2001. An Introduction to Varieties of Capitalism. In: P.A. Hall, D. Soskice (editors), Varieties of Capitalism - The Institutional Foundations of Comparative Advantage. Oxford UP, Oxford, UK, pp. 1-68.
Hart, S.L., 1995. A Natural-Resource-Based View of the Firm. Academy of Management Review 20(4): 986-1014.
112

Jaffe, A.B., 1986. Technological Opportunity and Spillovers of R & D: Evidence from Firms' Patents, Profits, and Market Value. American Economic Review 76(5): 984-1001.
Jaffe, A.B., Palmer, K., 1997. Environmental Regulation and Innovation: a Panel Data Study. Review of Economics and Statistics 79(4): 610-619.
Jaffe, A.B., Newell, R.G., Stavins, R.N., 2003. Technological Change and the Environment. In: K.-G. Maeler, J.R. Vincent (editors), Handbook of Environmental Economics. Elsevier, Amsterdam, pp.
Johnstone, N., Serravalle, C., Scapecchi, P., Labonne, J., 2007a. Overview of the Data and Summary Results. In: N. Johnstone (editors), Environmental Policy and Corporate Behaviour. Edward Elgar, Cheltenham, UK, pp. 1-33.
Johnstone, N., Glachant, M., Serravalle, C., Riedinger, N., Scapecchi, P., 2007b. Many a Slip 'Twixt the Cup and the Lip - Direct and Indirect Public Policy Incentives to Improve Corporate Environmental Performance. In: N. Johnstone (editors), Environmental Policy and Corporate Behaviour. Edward Elgar, Cheltenham, pp. 88-141.
Kammerer, D., 2008. The Effects of Customer Benefit and Regulation on Environmental Product Innovation - Empirical Evidence from Appliance Manufacturers in Germany, CIS Working Paper No.36, ETH Zurich, Zurich.
Lanjouw, J.O., Mody, A., 1996. Innovation and the International Diffusion of Environmentally Responsive Technology Research Policy 25: 549-571.
Meffert, H., Kirchgeorg, M., 1998. Marktorientiertes Umweltmanagement. Schaefer Poeschel, Stuttgart, Germany.
Nelson, R.R., Winter, S.G., 1982. An Evolutionary Theory of Economic Change. Harvard University Press, Cambridge, MA.
OECD, 2001. Extended Producer Responsibility: A Guidance Manual for Governments. Organisation for Economic Co-Operation and Development, Paris.
OECD, 2004. Economic Aspects of Extended Producer Responsibility: Technical Innovation and EPR Policies. Organisation for Economic Co-Operation and Development, Paris.
Ottman, J., 1998. Green Marketing: Opportunity for Innovation. NTC, Lincolnwood, Illinois.
Porter, M.E., van der Linde, C., 1995a. Green and Competitive: Ending the Stalemate. Harvard Business Review 73(5): 120-134.
Porter, M.E., van der Linde, C., 1995b. Toward a New Conception of the Environment-Competitiveness Relationship. Journal of Economic Perspectives 9(4): 97-118.
Rehfeld, K.-M., Rennings, K., Ziegler, A., 2007. Integrated Product Policy and Environmental Product Innovations: an Empirical Analysis. Ecological Economics 61(1): 91-100.
Reinhardt, F.L., 1998. Environmental Product Differentiation: Implications for Corporate Strategy. California Management Review 40(4): 43-73.
Rennings, K., 2000. Redefining Innovation - Eco-Innovation Research and the Contribution from Ecological Economics. Ecological Economics 32(2): 319-332.
Royston, P., 2005. Multiple Imputation of Missing Values: Update of Ice. The Stata Journal 5(4): 527-536.
Seijas-Nogareda, J., 2007. Determinants of Environmental Innovation in the German and Swiss Chemical Industry - With Special Consideration of Environmental Regulation, Diss. ETH Zurich No. 16918, ETH Zurich, Zurich, Switzerland.
113

UN, 1992. Rio Declaration on Environment and Development, United Nations, New York, NY.
US-Census-Bureau, 2004a. Other Household Appliance Manufacturing, 2002 Economic Census - Manufacturing.
US-Census-Bureau, 2004b. Electronic Computer Manufacturing, 2002 Economic Census - Manufacturing.
US-Census-Bureau, 2004c. Audio and Video Equipment Manufacturing, 2002 Economic Census - Manufacturing.
Vogel, D., 1995. Trading Up - Consumer and Environmental Regulation in a Global Economy. Harvard University Press, Cambridge, MA.
Wagner, M., 2008. Empirical Influence of Environmental Management on Innovation: Evidence from Europe. Ecological Economics 66 (2-3), 392-402.
Wernerfelt, B., 1984. A Resource-Based View of the Firm. Strategic Management Journal 5(2): 171-180.
114
7 Appendix
Variables and their underlying questions in the online-questionnaire:
EPI_ANY (environmental product innovation): “Has your company implemented any
environmental improvements in your products in the past 3 years (In the area of en-
ergy efficiency; toxic substances; material efficiency; electromagnetic fields)?”
EPI_EXT (extent of environmental product innovation): “For what percentage of your
products have you implemented at least one improvement in the last 3 years (In the
area of energy efficiency; toxic substances; material efficiency; electromagnetic
fields)?”
EPI_NOV (novelty of environmental product innovation): “Are these product improve-
ments market novelties (In the area of energy efficiency; toxic substances; material ef-
ficiency; electromagnetic fields)?”
REG_STRING (regulatory stringency): “In the past 3 years, how easy / difficult was it
for your company to meet regulations in California (In the area of energy efficiency;
toxic substances; material efficiency; electromagnetic fields)?”
CUST_BEN (customer benefit): “How do you rate the direct benefit to your customers
from product improvements (In the area of energy efficiency; toxic substances; materi-
al efficiency; electromagnetic fields)?”
GREENCAP (green capabilities):
“Does your company have a certified env. management system (e.g. ISO 14'001)?”
“Does your company train its product developer in env. issues?”
“Does your company conduct systematic env. analyses of its products?”
“Has your company set up voluntary env. targets for products?”
“Does your company use the env. attributes of its products in marketing?”
EMPLOYEE (firm size): “How many employees (full-time equivalent) did your company
have in 2006?”
115

R&D_EMPL (employees in R&D) is based on EMPLOYEE and the question: “How many
employees (full-time equivalent) did your company have in research and development
(R&D) in 2006?”
SCTR_REV (sector specific revenue): “What percentage of total revenue did your com-
pany achieve in the past 3 years with household appliances (information & communica-
tion technology / medical appliances) products?”
COMP_PRE: (competitive pressure): “How many direct competitors do you have in the
household appliances (information & communication technology / medical appliances)
industry?”
116
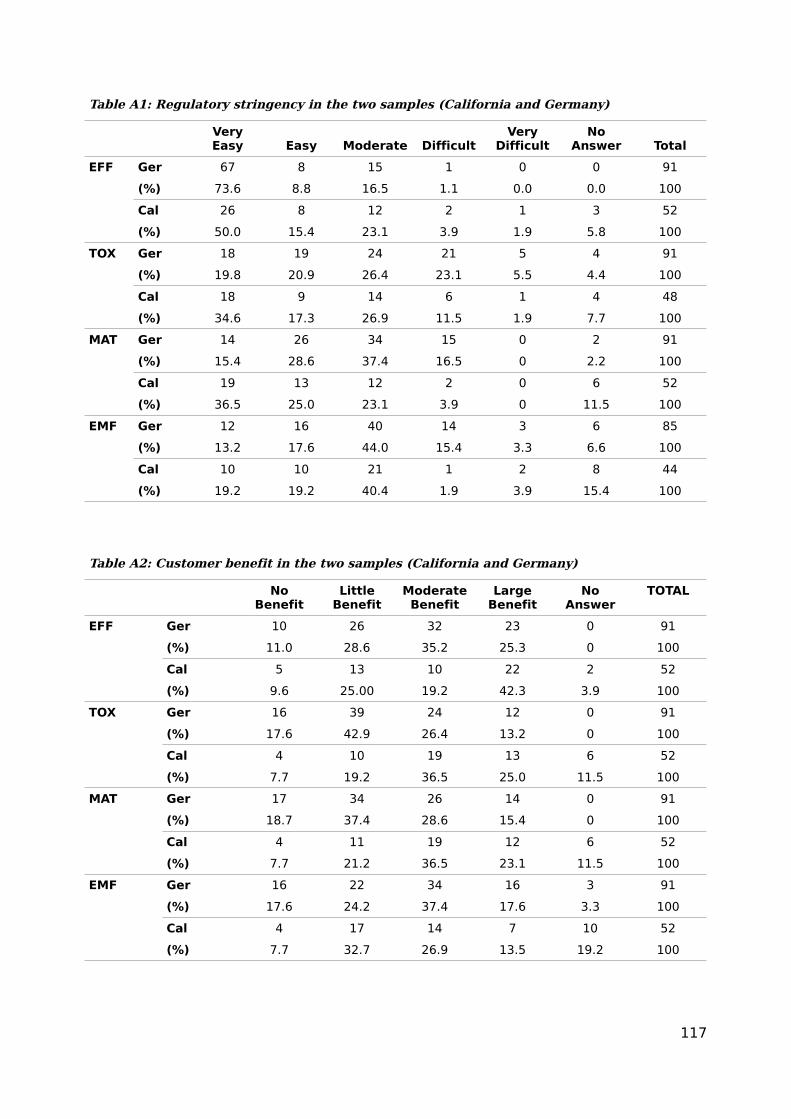
Table A1: Regulatory stringency in the two samples (California and Germany)
VeryEasy Easy Moderate Difficult
VeryDifficult
NoAnswer Total
EFF Ger 67 8 15 1 0 0 91
(%) 73.6 8.8 16.5 1.1 0.0 0.0 100
Cal 26 8 12 2 1 3 52
(%) 50.0 15.4 23.1 3.9 1.9 5.8 100
TOX Ger 18 19 24 21 5 4 91
(%) 19.8 20.9 26.4 23.1 5.5 4.4 100
Cal 18 9 14 6 1 4 48
(%) 34.6 17.3 26.9 11.5 1.9 7.7 100
MAT Ger 14 26 34 15 0 2 91
(%) 15.4 28.6 37.4 16.5 0 2.2 100
Cal 19 13 12 2 0 6 52
(%) 36.5 25.0 23.1 3.9 0 11.5 100
EMF Ger 12 16 40 14 3 6 85
(%) 13.2 17.6 44.0 15.4 3.3 6.6 100
Cal 10 10 21 1 2 8 44
(%) 19.2 19.2 40.4 1.9 3.9 15.4 100
Table A2: Customer benefit in the two samples (California and Germany)
No Benefit
Little Benefit
Moderate Benefit
Large Benefit
No Answer
TOTAL
EFF Ger 10 26 32 23 0 91
(%) 11.0 28.6 35.2 25.3 0 100
Cal 5 13 10 22 2 52
(%) 9.6 25.00 19.2 42.3 3.9 100
TOX Ger 16 39 24 12 0 91
(%) 17.6 42.9 26.4 13.2 0 100
Cal 4 10 19 13 6 52
(%) 7.7 19.2 36.5 25.0 11.5 100
MAT Ger 17 34 26 14 0 91
(%) 18.7 37.4 28.6 15.4 0 100
Cal 4 11 19 12 6 52
(%) 7.7 21.2 36.5 23.1 11.5 100
EMF Ger 16 22 34 16 3 91
(%) 17.6 24.2 37.4 17.6 3.3 100
Cal 4 17 14 7 10 52
(%) 7.7 32.7 26.9 13.5 19.2 100
117

Table A3: EPI_ANY in the two samples (California and Germany)
No Yes No Answer TOTAL
EFF Ger 29 61 1 91
(%) 31.9 67.0 1.1 100
Cal 4 46 2 52
(%) 7.7 88.5 3.9 100
TOX Ger 6 85 0 91
(%) 6.6 93.4 0 100
Cal 7 43 2 52
(%) 13.5 82.7 3.9 100
MAT Ger 24 65 2 91
(%) 26.4 71.4 2.2 100
Cal 6 42 4 52
(%) 11.5 80.8 7.7 100
EMF Ger 20 65 6 91
(%) 22.0 71.4 6.6 100
Cal 7 37 8 52
(%) 13.5 71.2 15.4 100
Table A4: EPI_EXT in the two samples (California and Germany)
0% <5% 5-25% 26-50% 51-75% 76-100% No Answer
TOTAL
EFF Ger 29 13 18 15 5 9 2 91
(%) 31.9 14.3 19.8 16.5 5.5 9.9 2.2 100
Cal 4 2 10 9 6 18 3 52
(%) 7.7 3.9 19.2 17.3 11.5 34.6 5.8 100
TOX Ger 6 7 21 12 12 29 4 91
(%) 6.6 7.7 23.1 13.2 13.2 31.9 4.4 100
Cal 7 3 5 8 3 23 3 52
(%) 13.5 5.8 9.6 15.4 5.8 44.2 5.8 100
MAT Ger 24 10 13 12 11 18 3 91
(%) 26.4 11.0 14.3 13.2 12.1 19.8 3.3 100
Cal 6 1 13 6 6 15 5 52
(%) 11.5 1.9 25.0 11.5 11.5 28.9 9.6 100
EMF Ger 20 9 23 13 5 15 6 91
(%) 22.0 9.9 25.3 14.3 5.5 16.5 6.6 100
Cal 7 3 9 7 5 12 9 52
(%) 13.5 5.8 17.3 13.5 9.6 23.1 17.3 100
118

Table A5: EPI_NOV in the two samples (California and Germany)
No Novelties
No Market Novelties
Some Market
Novelties
Mainly Market
Novelties
No Answer TOTAL
EFF Ger 29 20 21 14 7 91
(%) 31.9 22.0 23.1 15.4 7.7 100
Cal 4 27 12 5 4 52
(%) 7.7 51.9 23.1 9.6 7.7 100
TOX Ger 6 39 23 16 7 91
(%) 6.6 42.9 25.3 17.6 7.7 100
Cal 7 30 4 5 6 52
(%) 13.5 57.7 7.7 9.6 11.5 100
MAT Ger 24 35 15 10 7 91
(%) 26.4 38.5 16.5 11.0 7.7 100
Cal 6 26 10 3 7 52
(%) 11.5 50.0 19.2 5.8 13.5 100
EMF Ger 20 28 20 12 11 91
(%) 22.0 30.8 22.0 13.2 12.1 100
Cal 7 27 5 1 12 52
(%) 13.5 51.9 9.6 1.9 23.1 100
119

Table A6: Full and reduced logit models for EPI_ANY
California sample Germany sample
full model reduced model
reduced (no EMF cases)
full model reduced model
Kammerer 2008 model
REG_STR 6.851*** 7.345*** 13.189** 2.049*** 2.000*** 2.028***
(3.284) (3.889) (16.611) (0.412) (0.381) (0.397)
CUST_BEN 2.156** 1.907* 1.852 2.841*** 2.870*** 2.859***
(0.811) (0.632) (0.741) (0.550) (0.571) (0.543)
GREENCAP 2.095** 1.763** 1.805 1.838*** 1.774*** 1.838***
(0.700) (0.507) (0.657) (0.339) (0.299) (0.340)
EMPLOYEE 0.781 0.871*** 0.840*** 0.982 0.985 0.977
(0.170) (0.034) (0.054) (0.040) (0.046) (0.039)
R&D_EMPL 0.319 5.008 5.418
(1.167) (9.748) (10.167)
SCTR_REV 1.930** 1.923*** 1.817** 1.090 1.150
(0.556) (0.437) (0.448) (0.180) (0.193)
COMP_PRE 2.818** 2.187** 2.819 0.967 0.967
(1.259) (0.865) (1.881) (0.169) (0.159)
SEC_HA 0.164* 0.939 0.901
(0.156) (0.420) (0.407)
SEC_IT 0.540 2.060 2.068
(0.537) (1.008) (1.007)
I_TOX 0.192** 0.201** 0.174* 7.904*** 7.321*** 7.853***
(0.161) (0.157) (0.155) (4.175) (3.890) (4.185)
I_MAT 0.503 0.470 0.450 0.855 0.848 0.870
(0.448) (0.390) (0.402) (0.364) (0.363) (0.373)
I_EMF 0.078*** 0.089** 0.888 0.853 0.888
(0.074) (0.087) (0.405) (0.388) (0.405)
_cons 0.001** 0.001*** 0.000** 0.014*** 0.017*** 0.018***
N 192 192 148 355 355 355
aic 98.4 97.3 69.1 281.8 282.0 278.4
bic 140.8 129.8 96.1 332.2 320.8 321.0
120

Table A7: Full and reduced ordered logit models for EPI_EXT
California sample Germany sample
full model reduced model
reduced (no EMF cases)
full model reduced model
Kammerer 2008 model
REG_STR 1.766*** 1.793*** 1.835*** 1.851*** 1.804*** 1.879***
(0.368) (0.355) (0.395) (0.244) (0.222) (0.238)
CUST_BEN 1.565** 1.606** 1.499* 1.832*** 1.854*** 1.864***
(0.331) (0.330) (0.334) (0.262) (0.271) (0.265)
GREENCAP 1.253 1.335*** 1.325***
(0.213) (0.102) (0.103)
EMPLOYEE 0.965 1.091*** 1.082***
(0.081) (0.030) (0.030)
R&D_EMPL 1.147 1.167 1.160
(1.538) (0.923) (0.917)
SCTR_REV 1.331** 1.396** 1.347** 1.162 1.036
(0.176) (0.199) (0.192) (0.117) (0.130)
COMP_PRE 1.392** 1.343* 1.474** 1.065 1.129
(0.220) (0.232) (0.286) (0.125) (0.149)
SEC_HA 0.514 0.948 0.974
(0.340) (0.305) (0.311)
SEC_IT 0.867 1.620 1.706*
(0.542) (0.512) (0.544)
I_TOX 0.924 0.924 0.906 3.273*** 2.889*** 3.242***
(0.353) (0.340) (0.340) (0.861) (0.694) (0.857)
I_MAT 0.708 0.676 0.667 1.110 1.136 1.095
(0.204) (0.182) (0.183) (0.365) (0.323) (0.355)
I_EMF 0.478** 0.469** 0.834 0.818 0.811
(0.179) (0.174) (0.256) (0.230) (0.248)
cut1 9.988* 10.345* 10.708* 23.470*** 9.323*** 10.826***
cut2 16.736** 16.861** 16.600** 52.545*** 19.527*** 24.164***
cut3 61.286*** 60.010*** 60.507*** 181.237*** 60.446*** 82.599***
cut4 138.708*** 133.185*** 134.809*** 426.303*** 132.013*** 193.372***
cut5 234.783*** 221.113*** 219.764*** 811.022*** 235.240*** 366.473***
N 192 192 148 355 355 355
aic 592.7 592.5 452.4 1108.8 1152.1 1108.8
bic 648.0 631.6 485.3 1174.6 1198.6 1166.9
121

Table A8: Full and reduced ordered logit models for EPI_NOV
California sample Germany sample
full model reduced model
reduced (no EMF cases)
full model reduced model
Kammerer 2008 model
REG_STR 1.282 1.347 1.389 1.231* 1.224* 1.234*
(0.248) (0.268) (0.319) (0.143) (0.142) (0.146)
CUST_BEN 2.051*** 2.038*** 1.884*** 1.835*** 1.866*** 1.849***
(0.458) (0.442) (0.417) (0.246) (0.246) (0.244)
GREENCAP 1.388* 1.458** 1.484** 1.254** 1.354*** 1.247**
(0.258) (0.225) (0.241) (0.114) (0.112) (0.111)
EMPLOYEE 0.990 1.065* 1.062*
(0.088) (0.036) (0.034)
R&D_EMPL 2.379 0.928 0.928
(2.518) (0.998) (1.005)
SCTR_REV 1.107 1.077
(0.184) (0.136)
COMP_PRE 1.999*** 1.931*** 2.103*** 1.018 1.036
(0.393) (0.360) (0.461) (0.118) (0.119)
SEC_HA 0.320 0.271** 0.350 0.909 0.857 0.927
(0.231) (0.173) (0.237) (0.326) (0.296) (0.319)
SEC_IT 1.163 1.124 1.493 1.675 1.657 1.726*
(0.570) (0.568) (0.764) (0.551) (0.539) (0.570)
I_TOX 0.474** 0.462** 0.456** 2.262*** 2.290*** 2.259***
(0.161) (0.155) (0.151) (0.664) (0.664) (0.666)
I_MAT 0.601 0.594 0.603 0.805 0.817 0.807
(0.245) (0.241) (0.244) (0.253) (0.253) (0.253)
I_EMF 0.313*** 0.300*** 0.992 0.989 0.989
(0.124) (0.116) (0.316) (0.313) (0.315)
cut1 13.868** 7.596** 10.737*** 5.189** 4.227** 3.655**
cut2 932.026*** 498.603*** 730.115*** 38.963*** 31.856*** 27.277***
cut3 5210.561*** 2739.003*** 4029.391*** 149.093*** 118.657*** 104.186***
N 192 192 148 355 355 355
aic 355.7 351.9 278.0 888.4 889.1 885.3
bic 404.5 391.0 310.9 946.5 935.5 935.6
122
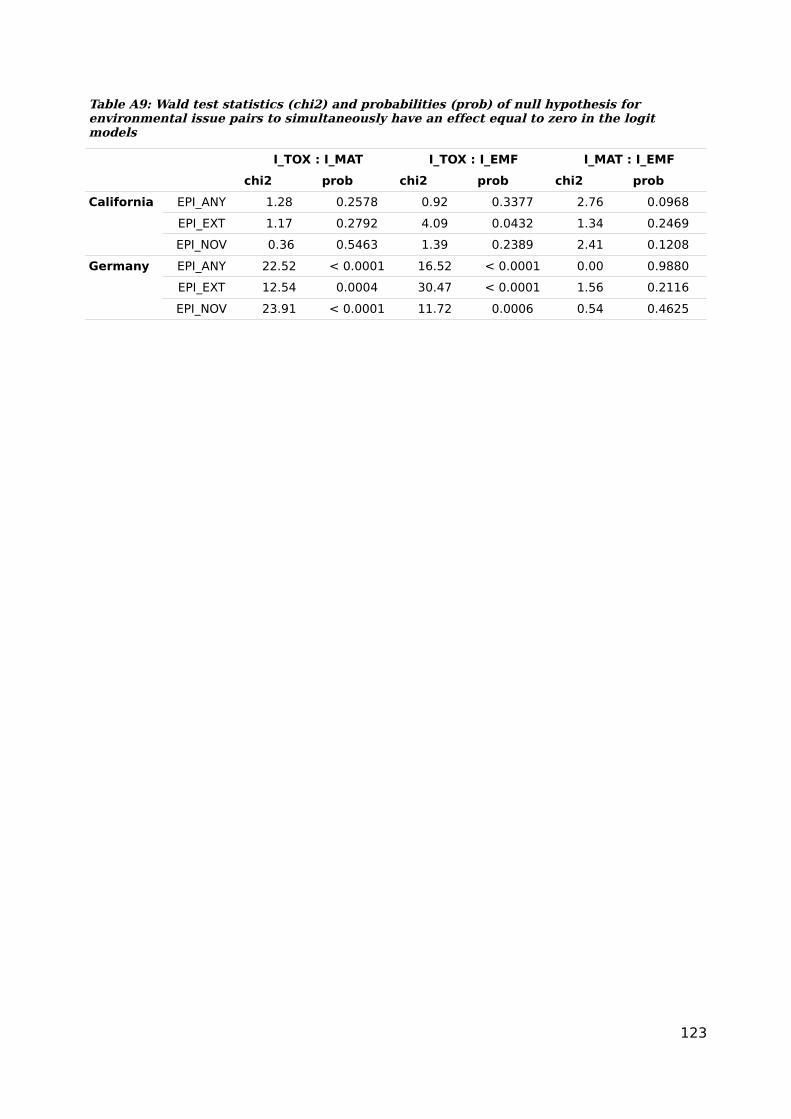
Table A9: Wald test statistics (chi2) and probabilities (prob) of null hypothesis for environmental issue pairs to simultaneously have an effect equal to zero in the logit models
I_TOX : I_MAT I_TOX : I_EMF I_MAT : I_EMF
chi2 prob chi2 prob chi2 prob
California EPI_ANY 1.28 0.2578 0.92 0.3377 2.76 0.0968
EPI_EXT 1.17 0.2792 4.09 0.0432 1.34 0.2469
EPI_NOV 0.36 0.5463 1.39 0.2389 2.41 0.1208
Germany EPI_ANY 22.52 < 0.0001 16.52 < 0.0001 0.00 0.9880
EPI_EXT 12.54 0.0004 30.47 < 0.0001 1.56 0.2116
EPI_NOV 23.91 < 0.0001 11.72 0.0006 0.54 0.4625
123

Figures A1a-d: Predicted probabilities of EPI_ANY
124

Figures A2a-h: Effect of Regulatory Stringency on Predicted probabilities of EPI_EXT
125

Figures A3a-h: Effect of Customer Benefit on Predicted probabilities of EPI_EXT
126

(This page is deliberately blank)
127

(This page is deliberately blank)
128

APPENDIX A: QUESTIONNAIRE OF SURVEY IN CALIFORNIA
Environmental Improvements in Electrical and Electronic Appliances
Welcome to our survey!We would like to thank you and your company for participating in our study.
ETH Zurich in collaboration with the Lawrence Berkeley National Laboratory is conducting this government-funded survey to study the drivers of environmental
improvements in electrical and electronic appliances.
Instructions
Filling out this online-questionnaire is very straightforward. Just follow the instructions below.
Scope
This questionnaire is for the Information & Communication Technology division of the company Sample Company. The following definition of Information & Communication Technology applies to the entire questionnaire:
electronic devices / components for the processing / transmission of information
If your company is part of a multinational corporation, the questions only refer to those products which are developed in California.
Answering questions
The questionnaire consists of 6 sections. It takes about 30 minutes to answer all the questions. If there are any questions you cannot answer (either because you do not know the answer or the question is not applicable to your company) please enter n.a. (no answer) or skip the question altogether.
Personalization
Your name:
Your function in the company:
Your e-mail address:
Please send us the company-specific benchmark report free of charge.
129

Section 1: General company characteristics
This section is intended to help us obtain a general picture of your company regarding ownership structure, size and R&D activities.
1: Company structure
Yes No n.a.
Does your company belong to a business / corporate group?
If yes, are you a subsidiary / branch?
2: Employees
How many employees (full-time equivalent) did your company have in 2006?
3: R&D Manpower
How many employees (full-time equivalent) did your company have in research and development (R&D) in 2006?
4: R&D Investments
What percentage of total revenue did your company spend on research and development (R&D) in the past 3 years?
5: Earning potential
Significantly Worse
Worse Average Better Significantly Better
n.a.
In comparison to the industry, how do you rate your company's earning potential?
130

Section 2: Regulatory Environment
In this section you will be asked about environmental regulation for Information & Communication Technology products. The questions are limited to 4 areas: Energy Efficiency, Toxic Substances in Products, Material Efficiency and Electromagnetic Fields (EMF).
1: Regulations in the area of Energy Efficiency
This area comprises products' energy consumption during use / standby.
What percentage of your Information & Communication Technology products (based on total revenue) are affected by ...
0-25%
26-50%
51-75%
76-100% n.a.
... the DOE Appliances and Commercial Equipment Standards Program? For details click here(www1.eere.energy.gov/buildings/appliance_standards)
... California's 2006 Appliance Efficiency Regulations? For details click here.(www.energy.ca.gov/appliances/2006regulations)
... the DOE Appliance Labeling Rule (EnergyGuide Label)? For details click here. (www.ftc.gov/bcp/conline/edcams/eande/contentframe_appliance_guide.html)
2: Further Regulations
Are there other federal or state regulations (laws, taxes, standards...) that apply to your Information & Communication Technology in the area of Energy Efficiency? If yes, please note.
3: Regulations in the area of Toxic Substances
This area comprises:the number / total amount of toxic substances in the productsand the recycling / disposal of toxic material after the products' service life (e-
waste).
What percentage of your Information & Communication Technology products (based on total revenue) are affected by ...
0-25%
26-50%
51-75%
76-100%
n.a.
... the California RoHS Law? For details click here (www.dtsc.ca.gov/HazardousWaste/RoHS.cfm)
... the California Proposition 65? For details click here(www.oehha.ca.gov/prop65/law/P65Regs.html)
4: Further Regulation
Are there other federal or state regulations (laws, taxes, standards...) that apply to your Information & Communication Technology in the area of Toxic Substances? If yes, please note.
131
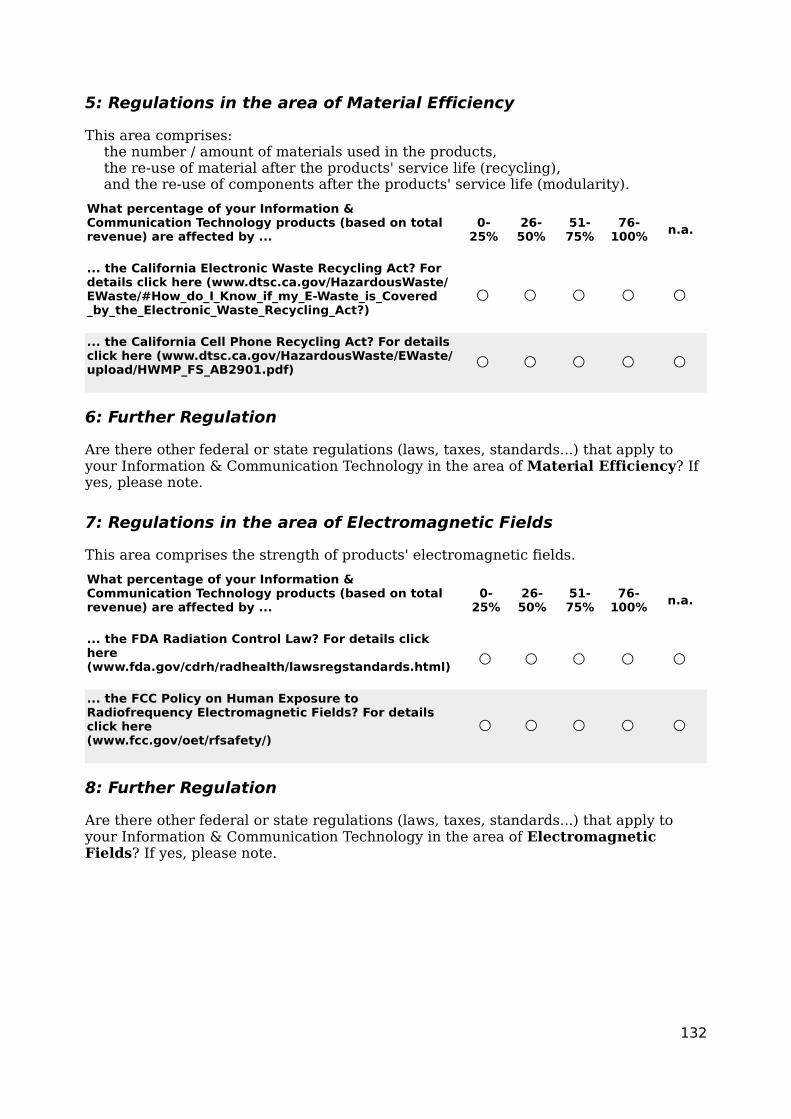
5: Regulations in the area of Material Efficiency
This area comprises:the number / amount of materials used in the products,the re-use of material after the products' service life (recycling),and the re-use of components after the products' service life (modularity).
What percentage of your Information & Communication Technology products (based on total revenue) are affected by ...
0-25%
26-50%
51-75%
76-100% n.a.
... the California Electronic Waste Recycling Act? For details click here (www.dtsc.ca.gov/HazardousWaste/EWaste/#How_do_I_Know_if_my_E-Waste_is_Covered_by_the_Electronic_Waste_Recycling_Act?)
... the California Cell Phone Recycling Act? For details click here (www.dtsc.ca.gov/HazardousWaste/EWaste/upload/HWMP_FS_AB2901.pdf)
6: Further Regulation
Are there other federal or state regulations (laws, taxes, standards...) that apply to your Information & Communication Technology in the area of Material Efficiency? If yes, please note.
7: Regulations in the area of Electromagnetic Fields
This area comprises the strength of products' electromagnetic fields.
What percentage of your Information & Communication Technology products (based on total revenue) are affected by ...
0-25%
26-50%
51-75%
76-100% n.a.
... the FDA Radiation Control Law? For details click here(www.fda.gov/cdrh/radhealth/lawsregstandards.html)
... the FCC Policy on Human Exposure to Radiofrequency Electromagnetic Fields? For details click here(www.fcc.gov/oet/rfsafety/)
8: Further Regulation
Are there other federal or state regulations (laws, taxes, standards...) that apply to your Information & Communication Technology in the area of Electromagnetic Fields? If yes, please note.
132

9: Most Important Products
Is your most commercially important Information & Communication Technology product subject to these regulations?
Yes No n.a.
DOE Appliances and Commercial Equipment Standards
California's 2006 Appliance Efficiency Regulations
DOE Appliance Labeling Rule (EnergyGuide Label)
California RoHS Law
California Proposition 65
California Electronic Waste Recycling Act
California Cell Phone Recycling Act
FDA Radiation Control Law
FCC Policy on Human Exposure to Radiofrequency Electromagnetic Fields
10: Regulatory Stringency
In the past 3 years, how easy / difficult was it for your company to meet (federal or state) regulations in California for Information & Communication Technology?
In the area of ... Very Easy Easy Moderate Difficult Very Difficult
n.a.
... Energy Efficiency
... Toxic Substances
... Material Efficiency
... Electromagnetic Fields
11: Regulatory Outlook
In your opinion, how will the regulatory environment for Information & Communication Technology change in California in the next 5 years?
In the area of ...Much Less Stringent
Less Stringent
Remain As Is
More Stringent
Much More Stringent n.a.
... Energy Efficiency
... Toxic Substances
... Material Efficiency
... Electromagnetic Fields
12: Regulatory Certainty
How easy / difficult is it to estimate the future development of regulations for Information & Communication Technology in California?
In the area of ... Very Easy Easy Moderate Difficult Very Difficult
n.a.
... Energy Efficiency
... Toxic Substances
... Material Efficiency
... Electromagnetic Fields
133

Section 3: Environmental Product Improvements
This section concerns environmental product improvements. Please read the questions and annotations carefully. These are the most important questions for our study.
1: Environmental Product Improvements
Environmental product improvements are all technical changes that render a product more environmentally friendly. It does not matter, whether these changes are• ecologically motivated or not• based on your own developments or on your suppliers'.
Has your company implemented any environmental improvements in your Information & Communication Technology products in the past 3 years? Yes No n.a.
In the area of Energy Efficiency(reduced energy consumption by products during use / standby)
In the area of Toxic Substances(reduced number / amount of toxic substances in products and improved disposal of these substances after service life)
In the area of Material Efficiency(reduced number / amount of materials in products and better re-use of materials and components after service life)
In the area of Electromagnetic Fields(reduced strength of products' electromagnetic fields)
2: Extent of Environmental Product Improvements
For what percentage of your Information & Communication Technology products have you implemented at least one improvement in the last 3 years?
In the area of ... <5%5-
25%26-50%
51-75%
76-100% n.a.
... Energy Efficiency
... Toxic Substances
... Material Efficiency
... Electromagnetic Fields
3: Are these product improvements market novelties?
In the area of ...Mainly Market
Novelties
Some Market
Novelties
No Market Novelties n.a.
... Energy Efficiency
... Toxic Substances
... Material Efficiency
... Electromagnetic Fields
134

4: Origin of KnowHow
Are these product improvements based on in-house developments or externally acquired developments?
In the area of ...Mainly In-
House Developments
Both Equally
Mainly External Developments
n.a.
... Energy Efficiency
... Toxic Substances
... Material Efficiency
... Electromagnetic Fields
5: Reasons for product improvements in the area of Energy Efficiency
How important were the following reasons for the implementation of product improvements in the area of Energy Efficiency?
Not Important
Somewhat Important
Important Very Important
n.a.
Lowering of manufacturing costs
Product differentiation
Legal compliance (National)
Legal compliance (Overseas)
Avoiding further regulations
Improving the company's image
Satisfying customer demands
6: Reasons for product improvements in the area of Toxic Substances
How important were the following reasons for the implementation of product improvements in the area of Toxic Substances?
Not Important
Somewhat Important Important
Very Important n.a.
Lowering of manufacturing costs
Product differentiation
Legal compliance (National)
Legal compliance (Overseas)
Avoiding further regulations
Improving the company's image
Satisfying customer demands
135

7: Reasons for product improvements in the area of Material Efficiency
How important were the following reasons for the implementation of product improvements in the area of Material Efficiency?
Not Important
Somewhat Important Important
Very Important n.a.
Lowering of manufacturing costs
Product differentiation
Legal compliance (National)
Legal compliance (Overseas)
Avoiding further regulations
Improving the company's image
Satisfying customer demands
8: Reasons for product improvements in the area of EMF
How important were the following reasons for the implementation of product improvements in the area of Electromagnetic Fields?
Not Important
Somewhat Important
Important Very Important
n.a.
Lowering of manufacturing costs
Product differentiation
Legal compliance (National)
Legal compliance (Overseas)
Avoiding further regulations
Improving the company's image
Satisfying customer demands
9: Past Eco-Performance of Products
Compared to the competition, how would you rate the eco-performance of your Information & Communication Technology products 3 years ago?
In the area of ...Significantly
Worse Worse Average BetterSignificantly
Better n.a.
... Energy Efficiency
... Toxic Substances
... Material Efficiency
... Electromagnetic Fields
10: Present Eco-Performance of Products
Compared to the competition, how would you rate the eco-performance of your Information & Communication Technology products today?
In the area of ... Significantly Worse
Worse Average Better Significantly Better
n.a.
... Energy Efficiency
... Toxic Substances
... Material Efficiency
... Electromagnetic Fields
136

11: Amount of Environmental Product Improvements
How many product improvements have been implemented in your most popular Information & Communication Technology product / product line in the last 3 years?(If over the last 3 years the same thing has been improved upon, e.g. a more efficient adapter each year, then each single improvement is counted.)
In the area of Energy Efficiency:
In the area of Toxic Substances:
In the area of Material Efficiency:
In the area of Electromagnetic Fields:
Section 4: Direct Customer Benefit
In this section the questions are about direct customer benefit. Environmental product improvements do not just improve the eco-performance of products but can also provide direct benefits to the customer.
1: Direct benefit to customers from product improvements in the area of Energy Efficiency
Potential benefits:• lower electricity costs• less heat build-up• extended battery life for portable devices
How do you rate the direct benefit to your Information & Communication Technology customers from product improvements in the area of ...
NoBenefit
Little Benefit
Moderate Benefit
Large Benefit
n.a.
... Energy Efficiency?
2: Direct benefit to customers from product improvements in the area of Toxic Substances
Potential benefits:• lower health risks• easier waste disposal
How do you rate the direct benefit to your Information & Communication Technology customers from product improvements in the area of ...
NoBenefit
Little Benefit
Moderate Benefit
Large Benefit
n.a.
... Toxic Substances?
137

3: Direct benefit to customers from product improvements in the area of Material Efficiency
Potential benefits:• smaller appliances• improved repair and upgrade possibilities (modular design)• easier disposal in the case of a recycling program
How do you rate the direct benefit to your Information & Communication Technology customers from product improvements in the area of ...
NoBenefit
Little Benefit
Moderate Benefit
Large Benefit n.a.
... Material Efficiency?
4: Direct benefit to customers from product improvements in the area of Electromagnetic Fields
Potential benefits:• lower potential of health risks• less electromagnetic interference with other electronic devices
How do you rate the direct benefit to your Information & Communication Technology customers from product improvements in the area of ...
NoBenefit
Little Benefit
Moderate Benefit
Large Benefit n.a.
... Electromagnetic Fields?
5: Importance of Customer Benefits
Do these customer benefits play an important part in the development and implementation of product improvements in your company?
In the area of ... Not Important
Somewhat Important
Important Very Important
n.a.
... Energy Efficiency
... Toxic Substances
... Material Efficiency
... Electromagnetic Fields
138

Section 5: Environmental Management
This section contains questions related to the environmental activities of your company.
1: Environmental Management
Yes No n.a.
Has your company set up voluntary environmental targets?
If yes, do the voluntary environmental targets also concern your products?
Does your company conduct systematic environmental analyses of its products?
Does your company have environmental checklists for product development?
Does your company train its product developer in environmental issues?
Does your company use the environmental attributes of its products in marketing?
2: Manpower for Environmental Affairs
How many employees (full-time equivalent) did your company have for environmental affairs in 2006?
3: Environmental Management System
Yes No n.a.
Does your company have a certified environmental management system (e.g. ISO 14'001)?
If yesA) according to which standard was it certified?
ISO 14'001EMAS
Other:
B) in what year has it been certified for the first time?
139

Section 6: Market Place
This last section concerns the market place. All questions refer only to your market segments in the Information & Communication Technology industry.
1: Importance of Information & Communication Technology for your company
0-20%
21-40%
41-60%
61-80%
81-100%
n.a.
What percentage of total revenue did your company achieve in the past 3 years with Information & Communication Technology products?
2: Revenue of Information & Communication Technology
What percentage of the Information & Communication Technology revenue did your company achieve in the past 3 years in ...
0-20%
21-40%
41-60%
61-80%
81-100% n.a.
... California?
... other US states?
3: Position in Supply Chain
What percentage of the Information & Communication Technology revenue did your company achieve in the past 3 years with ...
0-20%
21-40%
41-60%
61-80%
81-100%
n.a.
... industry / intermediate goods?
... final goods for private consumers?
... final goods for corporate / public customers?
4: Competitive Strategy
<5%5-
20%21-40%
41-60%
61-80%
81-100% n.a.
For what percentage of your Information & Communication Technology range is cost leadership more important than product differentiation?
5: Product Life Cycle
How long is the average product life cycle of your Information & Communication Technology products (in years)?
140

6: New Information & Communication Technology Products
<5%5-
20%21-40%
41-60%
61-80%
81-100% n.a.
How many new Information & Communication Technology products does your company launch on average every year (as a percentage of total Information & Communication Technology range)?
7: Direct Competitors
0 1-5 6-10 11-15 16-20 >20 n.a.
How many direct competitors do you have in the Information & Communication Technology industry?
8: Environmentally Friendly Products
Very Low Low Moderate Large
Very Large n.a.
How large is the customer demand for Information & Communication Technology that clearly exceed the legally required environmental standards?
How large is the supply of Information & Communication Technology products that clearly exceed the legally required environmental standards?
End of Questionnaire
Finally, you have the opportunity to state your expertise in the specific subjects and comment on the questionnaire.
Please let us know how you rate your personal expertise in relation to the questions raised:
Very Low
Low Moderate High Very High
n.a.
Section 2: Regulatory Environment
Section 3: Environmental Product Improvements
Section 5: Environmental Activities
Section 6: Market Place
Would you like to comment on the questionnaire?
141

(This page is deliberately blank)
142
APPENDIX B: QUESTIONNAIRE OF SURVEY IN GERMANY
Ökologische Verbesserungen von elektrischen & elektronischen Geräten
Willkommen zu unserer Studie
Wir möchten uns herzlich bei Ihnen und Ihrer Firma für die Teilnahme bedanken!Mit Ihren Antworten helfen Sie uns zu untersuchen, welchen Einfluss
Umweltgesetze auf die Produktentwicklung von elektrischen & elektronischen Geräten haben.
Anleitung
Hier noch einige wichtige Instruktionen:
Beantwortung der Fragen
Der Fragebogen besteht insgesamt aus 6 Teilen. Die vollständige Beantwortung benötigt im Durchschnitt nicht länger als 30-40 Minuten. Sollten Sie auf eine der Fragen keine Antwort geben können (weil Sie es nicht wissen, oder die Frage für Ihr Unternehmen nicht passt) so wählen Sie bitte k.A. (keine Antwort) aus bzw. lassen Sie das Antwortfeld frei.
Personalisierung
Dieser Fragebogen ist angepasst für die Informations- und Kommunikationstechnologie Sparte des Unternehmens Musterfirma. Für den gesamten Fragebogen gilt die folgende Definition der Informations- und Kommunikationstechnologie Sparte:
Elektr. Komponenten und Geräte zur Informationsverarbeitung und -übertragung
Falls Ihre Firma zu einem internationalen Konzern gehört, berücksichtigen Sie im Fragebogen bitte nur jene Produkte, welche ihre Firma in Deutschland entwickelt.
Ihr Name und Vorname:
Ihre Funktion im Unternehmen:
Wir möchten die Ergebnisse der Studie (inkl. firmenspezifischem Benchmark-Report) kostenlos zugestellt bekommen.
143

Teil 1: Generelle Angaben zu Ihrem Unternehmen
Zu Beginn befragen wir Sie zu einigen generellen Charakteristika Ihres Unternehmens.
1: Angaben zur Unternehmensstruktur
Ja Nein k.A.
Gehört Ihr Unternehmen einer Unternehmensgruppe an?
Wenn ja, als Tochtergesellschaft?
2: Firmengrösse
Wie viele Beschäftigte (Vollzeitäquivalent) hatte Ihr Unternehmen 2005?
3: F&E Mitarbeiter
Wie viele Beschäftigte (Vollzeitäquivalent) hatte Ihr Unternehmen 2005 im Bereich Forschung und Entwicklung (F&E)?
4: F&E Investitionen
Welchen Anteil des Umsatzes (in Prozent) gab Ihr Unternehmen in den letzten 3 Jahren durchschnittlich für Forschung und Entwicklung (F&E) aus?
5: Bedeutung der Informations- und Kommunikationstechnologie Sparte für Ihr Unternehmen
0-20%
21-40%
41-60%
61-80%
81-100% k.A.
Welchen Anteil Ihres Gesamtumsatzes erzielte Ihr Unternehmen in den letzten 3 Jahren mit der Informations- und Kommunikationstechnologie Sparte?
144

6: Umsatz von Informations- und Kommunikationstechnologie
Welchen Anteil Ihres Informations- und Kommunikationstechnologie-Umsatzes erzielte Ihr Unternehmen in den letzten 3 Jahren in ...
0-20%
21-40%
41-60%
61-80%
81-100% k.A.
... Deutschland?
... den anderen EU-Ländern (inkl. Schweiz)?
7: Position in der Lieferkette
Welchen Anteil Ihres Informations- und Kommunikationstechnologie-Umsatzes erzielte Ihr Unternehmen in den letzten 3 Jahren mit ...
0-20%
21-40%
41-60%
61-80%
81-100%
k.A.
... Zwischenprodukten?
... Endprodukten für Privatkunden?
... Endprodukten für Industrie & Wirtschaft?
8: Angaben zur Ertragskraft
Deutlich Schlechter Schlechter
Im Durchschnitt Besser
Deutlich Besser k.A.
Wie bewerten Sie die Ertragskraft Ihres Unternehmens im Branchenvergleich?
Teil 2: Marktumfeld
Im 2. Teil kommen Fragen zum Marktumfeld. Diese Fragen beziehen sich alle nur auf Ihre Marktsegmente in der Informations- und Kommunikationstechnologie-Branche.
1: Wettbewerbsstrategien
<5%5-
20%21-40%
41-60%
61-80%
81-100% k.A.
Bei wieviel Prozent Ihrer Informations- und Kommunikationstechnologie Produkte ist Kostenführerschaft wichtiger als Produktdifferenzierung?
2: Produktlebenszyklus
Wie viele Jahre beträgt der durchschnittliche Produktlebenszyklus Ihrer Informations- und Kommunikationstechnologie Produkte?
145

3: Neue Informations- und Kommunikationstechnologie Produkte
<5%5-
20%21-40%
41-60%
61-80%
81-100% k.A.
Wie viele neue Informations- und Kommunikationstechnologie Produkte bringt Ihr Unternehmen pro Jahr durchschnittlich auf den Markt (als Prozentsatz vom gesamten IKT Sortiment)?
4: Angaben zu den direkten Konkurrenten
0 1-5 6-10 11-15 16-20 >20 k.A.
Wie gross ist die Anzahl Ihrer direkten Konkurrenten in der Informations- und Kommunikationstechnologie-Branche?
5: Umweltfreundliche Produkte
Sehr Gering Gering Mittel Gross
Sehr Gross k.A.
Wie gross ist in der Informations- und Kommunikationstechnologie-Branche die Nachfrage nach Produkten, welche die gesetzlich geforderten Umweltstandards deutlich übertreffen?
Wie gross ist in der Informations- und Kommunikationstechnologie-Branche das Angebot an Produkten, welche die gesetzlich geforderten Umweltstandards deutlich übertreffen?
Teil 3: Regulatorisches Umfeld
In diesem Teil kommen Fragen zum regulatorischen Umfeld für Informations- und Kommunikationstechnologie Produkte. Die Fragen beschränken sich auf die vier Bereiche: Energie-Effizienz, Toxische Substanzen in Produkten, Material-Recycling und elektromagnetische Felder.
1: Regulierungen im Bereich Energie-Effizienz
Hierzu zählen alle Regulierungen, die den Energieverbrauch von Produkten während der Nutzung / im Ruhezustand (Standby) betreffen.
0-25%
26-50%
51-75%
76-100% k.A.
Welcher Anteil Ihrer Informations- und Kommunikationstechnologie-Produkte (bezüglich Umsatz) ist von der Verordnung zur Energieverbrauchskennzeichnung (EU Energie-Label) betroffen?Für mehr Informationen klicken sie hier:(www.eu-label.de/)
146

2: Weitere Umweltregulierungen
Gibt es weitere Umweltregulierungen (Gesetze, Verordnungen, Steuern...) in Deutschland für Ihre Informations- und Kommunikationstechnologie Produkte im Bereich Energie-Effizienz?
3: Regulierungen im Bereich Toxische Substanzen
Hierzu zählen alle Regulierungen, welche:
● die Anzahl toxischer Substanzen / Gesamtmenge an toxischem Material in den Produkten betreffen
● oder die sichere Verwertung und Entsorgung der toxischen Substanzen nach der Nutzungsphase der Produkte (Elektroschrott) betreffen.
0-25%
26-50%
51-75%
76-100%
k.A.
Welcher Anteil Ihrer Informations- und Kommunikationstechnologie-Produkte (bezüglich Umsatz) ist vom Stoffverbot (RoHS) im Elektro- & Elektronikgerätegesetz betroffen?Für mehr Informationen klicken sie hier:(www.elektrogesetz.de/elektrog.shtml#05)
4: Weitere Umweltregulierungen
Gibt es weitere Umweltregulierungen (Gesetze, Verordnungen, Steuern...) in Deutschland für Ihre Informations- und Kommunikationstechnologie Produkte im Bereich Toxische Substanzen?
5: Regulierungen im Bereich Material-Recycling
Hierzu zählen alle Regulierungen, welche:
● die Anzahl / Gesamtmenge eingesetzter Materialien in den Produkten betreffen,
● die Rückgewinnung von Materialien (Recycling) nach der Nutzungsphase der Produkte betreffen,
● oder die Wieder- / Weiterverwertung von Bauteilen (Modularität) nach der Nutzungsphase betreffen.
0-25%
26-50%
51-75%
76-100%
k.A.
Welcher Anteil Ihrer Informations- und Kommunikationstechnologie-Produkte (bezüglich Umsatz) ist von den Material-Recycling Bestimmungen (WEEE / Elektroschrott) im Elektro- & Elektronikgerätegesetz betroffen?Für mehr Informationen klicken sie hier:(www.elektrogesetz.de/elektrog.shtml#04)
6: Weitere Umweltregulierungen
Gibt es weitere Umweltregulierungen (Gesetze, Verordnungen, Steuern...) in Deutschland für Ihre Informations- und Kommunikationstechnologie Produkte im Bereich Material-Recycling?
147

7: Regulierungen im Bereich Elektromagnetische Felder (EMF)
Hierzu zählen alle Regulierungen, welche die elektromagnetische Feldstärke von Produkten betreffen.
0-25%
26-50%
51-75%
76-100% k.A.
Welcher Anteil Ihrer Informations- und Kommunikationstechnologie-Produkte (bezüglich Umsatz) ist vom Gesetz über Funkanlagen und Telekommunikationsendeinrichtungen (FTEG) betroffen?Für mehr Informationen klicken sie hier:(www.bundesnetzagentur.de/media/archive/741.pdf)
8: Weitere Umweltregulierungen
Gibt es weitere Umweltregulierungen (Gesetze, Verordnungen, Steuern...) in Deutschland für Ihre Informations- und Kommunikationstechnologie Produkte im Bereich Elektromagnetische Felder?
9: Umsatzstärkstes Produkt / Produktlinie
Ist Ihr umsatzstärkstes Informations- und Kommunikationstechnologie Produkt / Produktlinie von den jeweiligen Regulierungen betroffen?
Ja Nein k.A.
Verordnung zur Energieverbrauchskennzeichnung (EU Energie-Label)
Stoffverbot (RoHS) im Elektro- & Elektronikgerätegesetz
DOE Appliance Labeling Rule (EnergyGuide Label) Material-Recycling Bestimmungen (WEEE / Elektroschrott) im Elektro- & Elektronikgerätegesetz
Verordnung über elektromagnetische Felder (FTEG)
10: Stringenz der Umweltregulierungen
Wie leicht bzw. schwer war es für Ihr Unternehmen in den letzten 3 Jahren, die gesetzlich geforderten Umweltstandards in Deutschland für Ihre Informations- und Kommunikationstechnologie Produkte zu erfüllen?
Im Bereich ... Sehr Leicht
Leicht Mittel Schwer Sehr Schwer
k.A.
... Energie-Effizienz
... Toxische Substanzen
... Material-Recycling
... Elektromagnetische Felder
148

11: Regulatorische Entwicklung
Wie wird sich das regulatorische Umfeld in Deutschland für Informations- und Kommunikationstechnologie Produkte Ihrer Meinung nach in den nächsten 5 Jahren entwickeln?
Im Bereich ... Wird Viel Lockerer
Wird Lockerer
Bleibt So Wird Strenger
Wird Viel Strenger
k.A.
... Energie-Effizienz
... Toxische Substanzen
... Material-Recycling
... Elektromagnetische Felder
12: Regulatorische Unsicherheit
Wie gut lässt sich abschätzen, wie sich das regulatorische Umfeld in Deutschland für Ihre Informations- und Kommunikationstechnologie Produkte zukünftig entwickelt?
Im Bereich ...Sehr
Leicht Leicht Mittel SchwerSehr
Schwer k.A.
... Energie-Effizienz
... Toxische Substanzen
... Material-Recycling
... Elektromagnetische Felder
Teil 4: Ökologische Produktverbesserungen
Im 4. Teil kommen Fragen zu ökologischen Produktverbesserungen. Dieser Teil enthält die komplexesten und zugleich wichtigsten Fragen für unsere Untersuchung. Bitte lesen Sie die Fragen und Erläuterungen aufmerksam durch.
1: Ökologische Produktverbesserungen
Als ökologische Produktverbesserungen werden alle technischen Änderungen / Weiterentwicklungen bezeichnet, welche Produkte umweltfreundlicher machen. Es spielt jedoch keine Rolle,
- ob diese Änderungen ökologisch motiviert sind oder nicht,- ob diese Änderungen von Ihnen selber entwickelt oder eingekauft wurden.
Hat Ihr Unternehmen in den letzten 3 Jahren ökologische Produktverbesserungen bei Informations- und Kommunikationstechnologie Produkten implementiert? Ja Nein k.A.
Im Bereich Energie-Effizienz?(reduzierter Energieverbrauch der Produkte bei Nutzung / Standby)
Im Bereich Toxische Inhaltsstoffe?(verringerte Anzahl / Gesamtmenge an toxischen Substanzen in Produkten; bessere Entsorgung dieser Substanzen nach der Nutzungsphase)
Im Bereich Material-Recycling?(verringerte Anzahl / Gesamtmenge an Materialien in Produkten; bessere Rückgewinnung von Materialien nach der Nutzungsphase; bessere Wieder- / Weiterverwertung von Bauteilen nach der Nutzungsphase)
Im Bereich Elektromagnetische Felder?(verringerte elektromagnetische Feldstärken der Produkte)
149
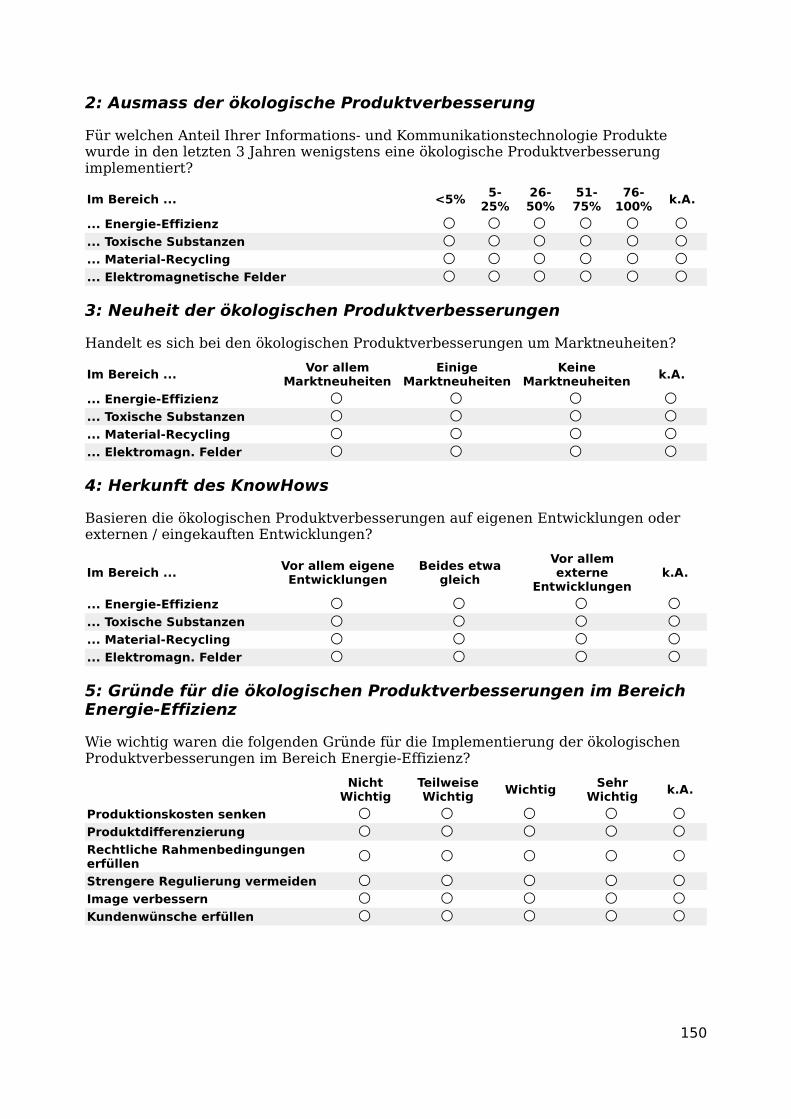
2: Ausmass der ökologische Produktverbesserung
Für welchen Anteil Ihrer Informations- und Kommunikationstechnologie Produkte wurde in den letzten 3 Jahren wenigstens eine ökologische Produktverbesserung implementiert?
Im Bereich ... <5% 5-25%
26-50%
51-75%
76-100%
k.A.
... Energie-Effizienz
... Toxische Substanzen
... Material-Recycling
... Elektromagnetische Felder
3: Neuheit der ökologischen Produktverbesserungen
Handelt es sich bei den ökologischen Produktverbesserungen um Marktneuheiten?
Im Bereich ... Vor allem Marktneuheiten
Einige Marktneuheiten
Keine Marktneuheiten
k.A.
... Energie-Effizienz
... Toxische Substanzen
... Material-Recycling
... Elektromagn. Felder
4: Herkunft des KnowHows
Basieren die ökologischen Produktverbesserungen auf eigenen Entwicklungen oder externen / eingekauften Entwicklungen?
Im Bereich ... Vor allem eigene Entwicklungen
Beides etwa gleich
Vor allem externe
Entwicklungenk.A.
... Energie-Effizienz
... Toxische Substanzen
... Material-Recycling
... Elektromagn. Felder
5: Gründe für die ökologischen Produktverbesserungen im Bereich Energie-Effizienz
Wie wichtig waren die folgenden Gründe für die Implementierung der ökologischen Produktverbesserungen im Bereich Energie-Effizienz?
Nicht Wichtig
Teilweise Wichtig
Wichtig Sehr Wichtig
k.A.
Produktionskosten senken
Produktdifferenzierung
Rechtliche Rahmenbedingungen erfüllen
Strengere Regulierung vermeiden
Image verbessern
Kundenwünsche erfüllen
150

6: Gründe für die ökologischen Produktverbesserungen im Bereich Toxische Substanzen
Wie wichtig waren die folgenden Gründe für die Implementierung der ökologischen Produktverbesserungen im Bereich Toxische Substanzen?
Nicht Wichtig
Teilweise Wichtig Wichtig
Sehr Wichtig k.A.
Produktionskosten senken
Produktdifferenzierung
Rechtliche Rahmenbedingungen erfüllen
Strengere Regulierung vermeiden
Image verbessern
Kundenwünsche erfüllen
7: Gründe für die ökologischen Produktverbesserungen im Bereich Material-Recycling
Wie wichtig waren die folgenden Gründe für die Implementierung der ökologischen Produktverbesserungen im Bereich Material-Recycling?
Nicht Wichtig
Teilweise Wichtig
Wichtig Sehr Wichtig
k.A.
Produktionskosten senken
Produktdifferenzierung
Rechtliche Rahmenbedingungen erfüllen
Strengere Regulierung vermeiden
Image verbessern
Kundenwünsche erfüllen
8: Gründe für die ökologischen Produktverbesserungen im Bereich Elektromagnetische Felder
Wie wichtig waren die folgenden Gründe für die Implementierung der ökologischen Produktverbesserungen im Bereich Elektromagnetische Felder?
Nicht Wichtig
Teilweise Wichtig Wichtig
Sehr Wichtig k.A.
Produktionskosten senken
Produktdifferenzierung
Rechtliche Rahmenbedingungen erfüllen
Strengere Regulierung vermeiden
Image verbessern
Kundenwünsche erfüllen
151

9: Umwelt-Performance vor 3 Jahren
Wie bewerten Sie die Umwelt-Performance, die Ihre Informations- und Kommunikationstechnologie Produkte vor 3 Jahren im Branchenvergleich hatten?
Im Bereich ...Deutlich
Schlechter SchlechterIm
Durchschnitt BesserDeutlich Besser k.A.
... Energie-Effizienz
... Toxische Substanzen
... Material-Recycling
... Elektromagn. Felder
10: Umwelt-Performance heute
Wie bewerten Sie die Umwelt-Performance, die Ihre Informations- und Kommunikationstechnologie Produkte heute im Branchenvergleich haben?
Im Bereich ... Deutlich Schlechter
Schlechter Im Durchschnitt
Besser Deutlich Besser
k.A.
... Energie-Effizienz
... Toxische Substanzen
... Material-Recycling
... Elektromagn. Felder
11: Anzahl ökologischer Produktverbesserungen
Wie viele ökologische Produktverbesserungen wurden in den letzten 3 Jahren bei Ihrem umsatzstärksten Informations- und Kommunikationstechnologie Produkt / Produktlinie implementiert?
Im Bereich Energie-Effizienz:
Im Bereich Toxische Substanzen:
Im Bereich Material-Recycling:
Im Bereich Elektromagnetische Felder:
152

Teil 5: Direkter Kundennutzen
Im vorletzten Teil kommen Fragen zum direkten Kundennutzen. Einige ökologische Produktverbesserungen verbessern nicht nur die Umweltfreundlichkeit der Produkte, sondern bringen auch den Kunden einen direkten Nutzen.
1: Direkter Nutzen für Kunden aus ökologischen Produktverbesserungen im Bereich Energie-Effizienz
Im Bereich Energie-Effizienz können Produktverbesserungen u.a. folgende Kundennutzen bringen:
• geringere Stromkosten• geringere Wärmeentwicklung durch das Gerät• längere Nutzungszeiten bei mobilen Geräten
Als wie gross erachten Sie den direkten Nutzen für Ihre IKT Kunden aus ökologischen Produkt-verbesserungen im Bereich ...
Kein Nutzen
Geringer Nutzen
Mittlerer Nutzen
Grosser Nutzen
k.A.
... Energie-Effizienz?
2: Direkter Nutzen für Kunden aus ökologischen Produktverbesserungen im Bereich Toxische Substanzen
Im Bereich Toxische Substanzen können Produktverbesserungen u.a. folgende Kundennutzen bringen:
• verringertes Gesundheitsrisiko• einfachere Entsorgung
Als wie gross erachten Sie den direkten Nutzen für Ihre IKT Kunden aus ökologischen Produkt-verbesserungen im Bereich ...
Kein Nutzen
Geringer Nutzen
Mittlerer Nutzen
Grosser Nutzen k.A.
... Toxische Substanzen?
3: Direkter Nutzen für Kunden aus ökologischen Produktverbesserungen im Bereich Material-Recycling
Im Bereich Material-Recycling können Produktverbesserungen u.a. folgende Kundennutzen bringen:
• kleinere Geräte• bessere Reparatur- und Upgrademöglichkeiten bei modularer Bauweise• einfachere Entsorgung bei Rücknahmeprogrammen
Als wie gross erachten Sie den direkten Nutzen für Ihre IKT Kunden aus ökologischen Produkt-verbesserungen im Bereich ...
Kein Nutzen
Geringer Nutzen
Mittlerer Nutzen
Grosser Nutzen k.A.
... Material-Recycling?
153

4: Direkter Nutzen für Kunden aus ökologischen Produktverbesserungen im Bereich Elektromagnetische Felder
Im Bereich Elektromagnetische Felder können Produktverbesserungen u.a.folgende Kundennutzen bringen:
• verringertes Gesundheitsrisiko• geringere Störanfälligkeit für andere elektronische Geräte
Als wie gross erachten Sie den direkten Nutzen für Ihre IKT Kunden aus ökologischen Produkt-verbesserungen im Bereich ...
Kein Nutzen
Geringer Nutzen
Mittlerer Nutzen
Grosser Nutzen k.A.
... Elektromagnetische Felder?
5: Relevanz dieser Kundennutzen
Spielen diese Kundennutzen in Ihrem Unternehmen eine wichtige Rolle für die Entwicklung und Einführung von ökologischen Produktverbesserungen?
Im Bereich ... Nicht Wichtig
Teilweise Wichtig
Wichtig Sehr Wichtig
k.A.
... Energie-Effizienz
... Toxische Substanzen
... Material-Recycling
... Elektromagnetische Felder
Teil 6: Angaben zum Umweltmanagement
Im letzten Teil kommen noch Fragen zum Umweltmanagement in Ihrem Unternehmen.
1: Angaben zum Umweltmanagement
Ja Nein k.A.
Hat sich Ihr Unternehmen zu freiwilligen Umweltzielen verpflichtet?
Falls ja, gibt es auch freiwillige Umweltziele für Ihre Produkte?
Führt Ihr Unternehmen systematische Umweltanalysen von Ihren Produkten durch?
Gibt es in Ihrem Unternehmen ökologische Checklisten für die Produktentwicklung?
Führt Ihr Unternehmen ökologische Schulungen für Ihre Produktentwickler durch?
Verwendet Ihr Unternehmen ökologische Produkteigenschaften im Marketing?
154

2: Mitarbeiter im Bereich Umweltmanagement
Wie viele Beschäftigte (Vollzeitäquivalent) hatte Ihr Unternehmen 2005 im Bereich Umweltmanagement?
3: Umweltmanagement-System
Ja Nein k.A.
Hat Ihr Unternehmen ein zertifiziertes Umweltmanagement-System (z.B. ISO 14'001 oder EMAS)?
Falls ja,A) Nach welchen Standards wurde Ihr Umweltmanagement-System zertifiziert?
ISO 14'001EMAS
Anderer:
B) In welchem Jahr wurde es das erste Mal zertifiziert?
Teil 7: Ende des Fragebogens
Sie können jetzt noch Ihre Kompetenz für bestimmte Themenbereiche angeben sowie einen Kommentar zum gesamten Fragebogen abgeben.
Please let us know how you rate your personal expertise in relation to the questions raised
Sehr Gering
Gering Mittel Gross Sehr Gross
k.A.
Teil 2: Marktumfeld
Teil 3: Regulatorisches Umfeld
Teil 4: Ökologische Produktverbesserungen
Teil 6: Umweltmanagement
Möchten Sie noch einen Kommentar zum Fragebogen abgeben?
155

(This page is deliberately blank)
156

CURRICULUM VITAE
Name Daniel Kammerer
Address Grimselstr. 39, CH-8048 Zurich
e-mail [email protected]
Date of Birth 23 April 1974
Nationality German
Education
Sep. 2004 – Sep. 2008 Ph.D. student, ETH ZurichCenter for Comparative and International Studies & Institute for Environmental Decisions
Mar. 2007 – Jul. 2007 Visiting Scholar, Lawrence Berkeley National Laboratory; Berkeley (California)Environmental Energy Technologies Division
Oct. 1997 – Apr. 2003 Diploma in Environmental SciencesETH Zurich
Oct. 1995 – Jul. 1997 Pre-Diploma in Computer ScienceUniversity Freiburg (Germany)
Aug. 1984 – May 1993 High SchoolScheffel-Gymnasium Bad Säckingen (Germany)
Professional Experience
Since Feb. 2009 Consultant, Carbon Management Servicesmyclimate – the climate partnership, Zurich
Nov. 2006 – Jan. 2009 Freelance Environmental ConsultantZurich (part-time)
Jul. 2005 – Feb. 2008 Delegate to the Environmental CommitteeETH Zurich (part-time)
Sep.2004 – Sep. 2008 Research AssociateETH Zurich (part-time)
Aug. 2003 – Jul. 2004 Project LeaderETHsustainability – ETH Competence Center, Zurich
157