Embed Size (px)
Citation preview

Documentosde Trabajo14 14Documentos
de Trabajo2009
José Manuel Pastor Monsálvez
Lorenzo Serrano Martínez
European Integrationand Inequalityamong CountriesA Lifecycle Income Analysis
Plaza de San Nicolás, 448005 BilbaoEspañaTel.: +34 94 487 52 52Fax: +34 94 424 46 21
Paseo de Recoletos, 1028001 MadridEspañaTel.: +34 91 374 54 00Fax: +34 91 374 85 22
dt_bbva_2009_14_european_integration_cubierta:dt_bbva_2009_05 22/9/09 09:43 Página 1

European Integration and Inequalityamong CountriesA Lifecycle Income Analysis
José Manuel Pastor Monsálvez 1,2
Lorenzo Serrano Martínez 1,2
1 U N I V E R S I T Y O F V A L E N C I A2 V A L E N C I A N E C O N O M I C R E S E A R C H I N S T I T U T E (Ivie)
� Abstract
In this working paper we analyze the effects of the ex-pansions of the European Union on inequality usingan approach based on individuals' lifecycle incomes.Such an approach allows us to consider the effect ofdifferent national growth and survival rates on in-equality. It differs from the usual analyses of inequal-ity that focus on the evolution of current per capitaincome for the period. The results show that inequal-ity in terms of permanent income was substantiallyless than in current per capita income at the time ofall the expansions except those of the last ten years.The results point to the key role of policies that stim-ulate growth in the less developed countries. With anannual b-convergence of 2% in current income,inequality in permanent income would be one thirdlower.
� Key words
Permanent income, inequality, European Union.
� Resumen
Este documento de trabajo analiza los efectos de lasampliaciones de la Unión Europea sobre la desigualdadentre los países miembros. A diferencia de los análisishabituales de desigualdad, basados en la evolución dela renta corriente per cápita de períodos particulares, elenfoque aquí utilizado se basa en el conjunto de rentasque las personas obtienen a lo largo de la vida (rentade ciclo vital o renta permanente). Esto permite consi-derar el efecto que tienen sobre la desigualdad las dife-rencias en tasas de crecimiento económico y en espe-ranza de vida. Los resultados muestran que la desigual-dad en renta permanente es sustancialmente menorque en renta corriente en todas las ampliaciones, salvoen las de los últimos diez años. También ponen de ma-nifiesto el papel clave de políticas que estimulen elcrecimiento en los países menos desarrollados. Conuna b-convergencia anual del 2% en renta corriente, ladesigualdad en renta permanente sería un tercio menor.
� Palabras clave
Renta permanente, desigualdad, Unión Europea.

Al publicar el presente documento de trabajo, la Fundación BBVA no asume res-ponsabilidad alguna sobre su contenido ni sobre la inclusión en el mismo dedocumentos o información complementaria facilitada por los autores.
The BBVA Foundation’s decision to publish this working paper does not imply any re-sponsibility for its content, or for the inclusion therein of any supplementary documents orinformation facilitated by the authors.
La serie Documentos de Trabajo tiene como objetivo la rápida difusión de losresultados del trabajo de investigación entre los especialistas de esa área, parapromover así el intercambio de ideas y el debate académico. Cualquier comenta-rio sobre sus contenidos será bien recibido y debe hacerse llegar directamente alos autores, cuyos datos de contacto aparecen en la Nota sobre los autores.
The Working Papers series is intended to disseminate research findings rapidly amongspecialists in the field concerned, in order to encourage the exchange of ideas and academ-ic debate. Comments on this paper would be welcome and should be sent direct to theauthors at the addresses provided in the About the authors section.
Todos los documentos de trabajo están disponibles, de forma gratuita y en for-mato PDF, en la web de la Fundación BBVA. Si desea una copia impresa, puedesolicitarla a través de [email protected].
All working papers can be downloaded free of charge in pdf format from the BBVAFoundation website. Print copies can be ordered from [email protected].
European Integration and Inequality among Countries:A Lifecycle Income Analysis© José Manuel Pastor Monsálvez and Lorenzo Serrano Martínez, 2009© de esta edición / of this edition: Fundación BBVA, 2009
EDITA / PUBLISHED BY
Fundación BBVA, 2009Plaza de San Nicolás, 4. 48005 Bilbao
DEPÓSITO LEGAL / LEGAL DEPOSIT NO.: M-44.308-2009IMPRIME / PRINTED BY: Rógar, S. A.
Impreso en España – Printed in Spain
La serie Documentos de Trabajo de la Fundación BBVA está elaborada con papel 100% reciclado,fabricado a partir de fibras celulósicas recuperadas (papel usado) y no de celulosa virgen, cumplien-do los estándares medioambientales exigidos por la legislación vigente.
The Working Papers series of the BBVA Foundation is produced with 100% recycled paper made from recov-ered cellulose fibre (used paper) rather than virgin cellulose, in conformity with the environmental stan-dards required by current legislation.
El proceso de producción de este papel se ha realizado conforme a las normas y disposicionesmedioambientales europeas y ha merecido los distintivos Nordic Swan y Ángel Azul.
The paper production process complies with European environmental laws and regulations, and has bothNordic Swan and Blue Angel accreditation.
La serie Documentos de Trabajo, así como información sobre otras publicaciones de laFundación BBVA, pueden consultarse en: http://www.fbbva.es
The Working Papers series, as well as information on other BBVA Foundation publications,can be found at: http://www.fbbva.es

C O N T E N T S
1. Introduction . . . . . . . . . . . . . . . . . . . . . . . . . . . . . . . . . . . . . . . . . . . 5
2. The Process of European Integration: The Key Role of EconomicGrowth . . . . . . . . . . . . . . . . . . . . . . . . . . . . . . . . . . . . . . . . . . . . . . . 9
3. Review of the Literature on European Convergence . . . . . . . . . . . . 12
4. General Formulation . . . . . . . . . . . . . . . . . . . . . . . . . . . . . . . . . . . . 14
5. Data and Results . . . . . . . . . . . . . . . . . . . . . . . . . . . . . . . . . . . . . . . . 16
6. Conclusions . . . . . . . . . . . . . . . . . . . . . . . . . . . . . . . . . . . . . . . . . . . . 29
Appendix: Construction of Survival Rates . . . . . . . . . . . . . . . . . . . . . . . . . 31
References . . . . . . . . . . . . . . . . . . . . . . . . . . . . . . . . . . . . . . . . . . . . . . . . . . . . 33
About the Authors . . . . . . . . . . . . . . . . . . . . . . . . . . . . . . . . . . . . . . . . . . . . . 35


1. Introduction
WITH the entry of Romania and Bulgaria in 2007, the European Union(EU) reached the figure of 27 members and culminated, for the moment, aprocess of expansion which began half a century earlier when a group of sixcountries took the first steps in the project of European unity, and fromwhich substantial economic and social benefits were expected. The roadtravelled has not been without difficulties, but it is fair to acknowledge thatthe result of successive expansions, always at the voluntary request of thecandidate countries, shows that the advantages have clearly been greaterthan the possible disadvantages.
The economic dimension of the project of European unity has beenfundamental from the start. Indeed the integration project is frequentlycriticized for the excessive weight of economic aspects to the detriment ofother matters. This is undoubtedly due in part to the substantial economicbenefits that countries expected (and still expect) to obtain in the longterm as a consequence of the process of integration. At the present timethese economic advantages associated with integration continue to be aconstant incentive to progress along the path undertaken, in spite of thedifficulties 1.
One of the reasons given to justify the benefits of economic integra-tion is that the progressive expansion of the markets for goods, services andfactors of production (capital and labor) will generate a greater and moreefficient use of European countries’ resources, stimulating the economic de-velopment of the area. Few doubt the long-term advantages of economic in-tegration for the member countries; however, the process of integrationraises a series of questions that deserve an adequate response. In particular:
5
1. In fact, after the 2004 expansion, in mid-2005, French and Dutch voters rejected the treaty es-tablishing a Constitution for Europe in national referendums, thus throwing into doubt theEU’s ability to work effectively and drive integration forward. At the same time, public scepticismabout future expansions began to mount and this opposition was indeed one of the reasons cit-ed by Dutch and French opponents of the Constitutional Treaty. Many people in the old EUmember states think that the EU has not yet successfully digested the 2004 expansion. They feelthat the addition of the Central and Eastern European countries changed the nature of theUnion.

1) Do all member countries benefit equally?2) Can the more developed countries better exploit the advantages
of a wider market? Or on the contrary?3) Can the less developed countries, due to their lower labor costs,
benefit to a greater extent from the entry of capital, foreign invest-ment and the transfer of technology?
Answering these questions implies analyzing the economic conver-gence of the member countries of the EU. The fundamental question iswhether European integration gives rise to a pattern of growth that gener-ates among the member countries convergence, greater differences, or hasno appreciable effect in this regard. The analysis of this phenomenon is ofspecial relevance since one of the explicit objectives of the EU is conver-gence among its countries and regions, and to this end it has devoted andintends to devote a large part of its budget through instruments such as theEuropean Regional Development Fund (ERDF) or the Cohesion Fund.
The successive expansions, analyzed in greater detail later, have involvedcountries already highly developed (e.g., United Kingdom, Denmark or Swe-den) and others initially less developed (e.g., Ireland, Greece, Spain or East-ern Europe countries). Obviously, though perhaps for different reasons, allthese nations expect to benefit from joining the EU.
At the empirical level there is little literature about the effects of theprocess of European integration on the convergence of the economies ofthe EU, and what there is is not dedicated explicitly to the analysisof the repercussions of the process on inequality in the per capita income ofthe member countries. Thus a first group of studies are dedicated to analyzingthe evolution of economies in the fulfilment of the criteria for forming partof the Euro area (e.g., Guldager, 1997; Cappelen et al., 2003; Ertur andKoch, 2006). Another group of studies analyze convergence at region-al level, rather than at country level (e.g., Quah, 1996), and in most cases donot refer to the explicit analysis of the effects of the process of European in-tegration, but simply test for the existence of convergence among theeconomies analyzed. Finally a third group of studies, though dedicated tothe analysis of the convergence of countries, do not analyze the collectiveof EU countries, but study the individual experiences of countries; thecountries of the Organisation for Economic Co-operation and Develop-ment (OECD) as a whole, or all the economies of the world (e.g., Barro,Sala-i-Martin, 1992; Schultz, 1998, etc.).
Most of these studies use measures of dispersion, such as the standarddeviation of the logarithm of the variable (s-convergence), or analysis of
josé manuel pastor monsálvez and lorenzo serrano martínez
6

b-convergence so as to analyze the evolution of the income disparitiesamong economies. However regardless of the indicator used and the type ofanalysis of convergence, it should be pointed out that these studies are usu-ally based on current per capita income. Although this methodology pro-vides useful information, this approach could be enriched with a methodol-ogy that also takes into account the whole life cycle dimension. Some recentstudies try to consider this issue using alternative measures. Dowrick, Dun-lop and Quiggin (2003) propose their own index based on consumptionand life expectancy, avoiding arbitrary weightings by means of revealedpreferences; Becker, Philipson and Soares (2001, 2005) analyze inequality ofwelfare by giving an economic value to the gains achieved in terms of lifeexpectancy; likewise, Philipson and Soares (2001) propose and analyze theproperties of a measure of total income (Full Income Measure of HumanDevelopment).
In this study, we aim to use an approach that is also different from theconventional one, though complementary to it. It is a type of approach simi-lar to that proposed by Serrano (2006) 2. The main characteristic of themethod is that it considers the lifecycle income of individuals (present valueof future income) and not only the income of a specific period. By usingthe present value (permanent income or lifecycle income), we continue totake into account the level of current income of the period, but we also val-ue aspects such as the different life expectancies in each country and thedifferent pace of future growth of per capita income (which may convergemuch, little or not at all). The idea is that when judging inequality, it may beappropriate to consider lives as a whole, using well known tools of economicanalysis like permanent income or lifecycle income, which are basic to themodern theory of consumption (Modigliani, 1986; Friedman, 1957;Modigliani and Brumberg, 1954).
A country’s entry into the EU marks a structural change in itseconomy, whose effects can only be valued from a long-term perspective.For this reason, it is appropriate to use a lifecycle approach to analyze theeffects of integration on citizens’ lifecycle income, and not only onthe incomes of specific periods.
The proposed approach enriches the traditional approach in that itconsiders that different countries may grow at different rates, and thatwill determine the future incomes of their inhabitants. It also allows us toconsider different rates of survival of the individuals of each country, which
european integration and inequality among countries: a lifecycle income analysis
7
2. Pastor and Serrano (2008) have recently used this approach.

influence the number of years during which incomes are generated, andtherefore the total incomes that they will obtain in the course of their life-time. Both aspects may have important implications when judging the de-gree of inequality of EU economies and their evolution following thesuccessive expansions.
The working paper is organized as follows. The next section reviewsthe positive effects on economic growth associated with integration and,briefly, the history of the European integration process. Section 3 reviewsthe existing literature on European convergence. Section 4 presents thegeneral formulation of the approach. Section 5 presents the data andthe results regarding inequality among EU countries at different momentsin time. Finally the last section presents the main conclusions.
josé manuel pastor monsálvez and lorenzo serrano martínez
8

2. The Processof EuropeanIntegration: The KeyRole of Economic Growth
THE main economic objective of European integration is to increase therate of growth of the incomes of the participating economies, the percapita income, and ultimately the well-being of the European citizens.The underlying idea is that the construction of a wider European economicand social area will benefit the participating economies.
The sources of the potential benefits associated with integration arevery diverse (Viner, 1950). While integration favors greater specializationand better use of the comparative advantages of economies, it permits moreextensive exploitation of economies of scale (Harris, 1984; Gasiorek, Smithand Venables, 1992; Francois, McDonald and Nordström, 1994). Also theopening-up of markets among the member countries (or the elimination oflegal and customs barriers) increases competition, exerting further pressureto increase the efficiency of production (MacDonald, 1994; Caves and Bar-ton, 1990). Countries, then, can purchase raw materials and intermediategoods on better terms, with the consequent increase in productive efficien-cy (Lee, 1992). Finally changes in the quantity and quality of the factors ofproduction used can also be expected due to the greater mobility of the fac-tors of production within the area and to increased technical progress(Maudos, Pastor and Serrano, 1999).
These potential advantages are a continued stimulus towards an evengreater degree of integration among European countries. It has been a longand many-staged process of which the ultimate outcome is the EuropeanUnion of 27 members, with successive phases. It would be appropriate toreview such phases before undertaking the empirical analysis.
The European Union has its origin in the European Coal and SteelCommunity (ECSC) founded in 1951 and formed by six countries (France,the Federal Republic of Germany, Italy, the Netherlands, Belgium and Lux-
9

emburg). These six countries, signatories of the Treaty of Rome in 1957,were the founders of the European Economic Community (EEC), a muchmore ambitious project no longer limited to the coal and steel industries.Such a project led to the total abolition of customs tariffs on industrial prod-ucts in 1968 and to the development of common policies (as in the case ofagricultural and trade policies).
The success of the project attracted new candidates, and in 1973 theEEC expanded to nine members with the entry of Denmark, Ireland andthe United Kingdom. In 1975, the EEC’s field of action expanded with thedevelopment of social, environmental and regional policies, with the cre-ation of the European Regional Development Fund (ERDF).
In the 1980s the process of expansion continued. 1981 saw the entryof Greece and 1986 those of Spain and Portugal. This expansion broughtwith it a greater role for regional policies, with greater budget allocationsfor the structural funds, with the aim of reducing the disparities of econom-ic development among the twelve member countries. In 1986 with the sign-ing of the Single European Act, the creation of a great single market wasagreed, becoming effective in early 1993. At the end of 1990 the reunifica-tion of Germany took place, so that the länder belonging to the former Ger-man Democratic Republic (GDR) came to form part of the EEC.
In 1993 the European Union (EU) treaty came into force planningthe creation of the Monetary Union for 1999, as well as setting in motionvarious institutional reforms and, once again, expanding the EU’s field ofaction with common policies on citizenship, the Common Security andForeign Policy (CSFP), and dispositions regarding homeland security.
At the start of 1995 three other countries joined the EU (Austria, Fin-land and Sweden), raising its total membership to 15. The single currency(the euro) was created on 1 January 1999, and twelve of the EU’s fifteenmember countries adopted it (all except the United Kingdom, Denmarkand Greece, though the latter country would adopt it in 2001). In 2002 thiscurrency physically entered into circulation.
In the mid-1990s the former people’s democracies of the Soviet blocknocked at the EU’s door. As a consequence of the negotiations, which hadbegun in the later years of that decade, in May 2004 there was a new expan-sion with the entry of ten new members (Malta, Cyprus, Czech Republic, Slo-vakia, Hungary, Poland, Slovenia, Estonia, Latvia and Lithuania). The last ex-pansion, for the moment, ocurred in early 2007 with the entry of Romaniaand Bulgaria. The current European Union has, thus, 27 member states.
The reduction of the differences in standard of living among themember states and among their different regions is one of the explicit ob-
josé manuel pastor monsálvez and lorenzo serrano martínez
10

jectives of the EU. Regional policy achieves such reduction by transferringresources from the richest regions to the poorest ones, it being an instru-ment of economic solidarity and a tool of economic integration. After suc-cessive reforms of its operation, the EU’s regional policy is intended tostrengthen the Union with more clearly defined targets. All this togetherwith the dynamic effect of the EU expansion will signify greater equalityamongst its members. The European Commission itself pointed with satis-faction to the case of Ireland (currently with one of the highest per capitagross domestic products [GDPs] when at the time of its entry barelyreached 64% of the EU average) as an example of what can be achieved.
The financial effort has been substantial. In the 2000-2006 period thestructural funds dedicated to this purpose amounted to 213,000 million eu-ros (one third of the EU’s total spending in that period). For the 2007-2013period the resources budgeted are approximately 308,000 million euros, or36% of the total planned expenditure.
european integration and inequality among countries: a lifecycle income analysis
11

3. Review of the Literatureon EuropeanConvergence
THERE is surprisingly little scientific literature about the effects of the Eu-ropean integration process on the convergence of European Union (EU)economies, particularly with regard to an explicit analysis of the repercus-sions of the integration process itself on convergence and inequality in theper capita income of the economies of the member countries followingthe successive expansions of the EU.
The small amount of empirical evidence available on the process of con-vergence in the European Union can be classified into three groups of studies.A first group, perhaps the most numerous, contains studies that in reality focuson the analysis of the criteria for entering and forming part of the eurozone.These types of studies analyze macroeconomic convergence in terms of publicdeficit, interest rates or inflation rate (e.g., Guldager, 1997). Another consider-able part of the literature analyzes convergence in per capita income but at re-gional level rather than by countries (e.g., Quah, 1996) and only sometimes di-rectly linked with the process of European integration (e.g., Ertur and Koch,2006). Finally in a third group of studies, long-term economic growth and theconvergence of the countries of Europe considered as countries is habituallysubsumed in wider collectives such as the Organisation for Economic Co-oper-ation and Development (OECD) or the world as a whole (e.g., Barro and Sala-i-Martin, 1992), or analyzed only for the case of individual experiences (recent-ly, for example, the case of Austria in Stockhammer [2009]).
The empirical literature on the countries of the European Union indi-cates that convergence is not steady over time. Various factors seem to act in op-posing directions, some generating convergence and others divergence. Fur-thermore these factors seem to have different importance for different types ofcountries, so the effect of integration can vary significantly among countries.
Thus the results obtained in Henrekson, Torstensson and Tortensson(1997) suggest that European integration may affect not only static efficien-cy through changes in resource allocation, but also long-term growth rates.
12

Their basic result is a fairly robust association between European integra-tion and growth. The growth effect would be of the order of 0.6-0.8 percent-age points p.a. The results also suggest that technology transfer is the mainmechanism through which European Commission (EC) and European FreeTrade Association (EFTA) membership affect growth.
Delgado-Rodríguez and Álvarez-Ayuso (2008) analyze the evolution oflabor productivity among EU-15 countries over the 1980-2001 period. Usingb-convergence techniques, they identify periods of nonsignificant conver-gence (1980-1985 and 1993-1996), as well as others of rapid and significantconvergence (1986-1992 and 1997-2001) in which less productive economiestend to grow faster than more productive economies. For the whole periodresults are not statistically significant. Physical and human capital accumula-tion appear to be the main driving force behind the process. On the otherhand, technological progress tends to contribute to divergence, although achange in the trend is observed at the end of the period.
Maudos, Pastor and Serrano (1999) analyze the evolution of the countriesof the European Union and the impact on efficiency and productivity of thesuccessive expansions during the 1965-1990 period. The results show that until1990 integration was beneficial for all the participants. The countries thatjoined experienced substantial relative gains in efficiency, greater in all casesthan those registered in the period prior to their entry. Also the total factorproductivity (TFP) growth rate in the founder countries received a positive im-pulse with each new expansion. Kaitila (2004) analyzes both s and b conver-gence and discusses the impact of EU membership. According to the results,the EU-15 countries’ real per capita gross domestic product (GDP) levels, ad-justed for purchasing power, converged in 1960-2001. Convergence occurredin two spells, in 1960-1973 and 1986-2001, with an interim period of stagna-tion. Abiad, Leigh and Mody (2007) stress that due to increasing financial inte-gration, capital in Europe has travelled downhill from rich to poor countries,and has done so with gathering strength. These inflows would have been asso-ciated with a significant acceleration of income convergence. In Reza andZahra (2008) real convergence of the ten new members’ economies to the EUaverage income is tested by using quarterly real GDP per capita data from 1995to 2005. Application of the unit root tests for testing absolute convergence andcatching-up make it possible to conclude that the 10 new members of the EUin 2005 tend to converge towards the EU average income.
In any case, these studies are dedicated to the analysis of convergenceand inequality in current per capita income and/or labor productivity. How-ever the effects of European integration are long-term, so it is natural to usealso a lifecycle approach like that described in the next section.
european integration and inequality among countries: a lifecycle income analysis
13

4. General Formulation
AS we have already indicated, this working paper analyzes inequality withinthe European Union (EU) throughout its existence, using as the key vari-able the per capita permanent income or lifecycle income.
The per capita permanent income (PIi 0) of economy i at time 0 is thediscounted value of the present and future per capita current income (yit),taking into account the survival rate in each period. We define Si (t, t – 1) asthe probability that a person, who is alive in period t – 1, will still be alivein period t. Thus the permanent income at time 0 is defined as indicated inthe following expression:
in which we assume a common and constant interest rate, r, and that the maxi-mum life of an individual is 120 years of age (an unrestrictive assumption).
Our analysis of inequality and convergence in permanent incomeprovides an analytical framework permitting us to identify their determi-nants and their sources of possible convergence. A more formal analysis ofthis type of approximation and its relationship to theoretical models ofgrowth is offered in Serrano (2006).
The approach proposed here is more complete than the traditionalone because it permits the consideration that countries grow at differentrates and individuals have different survival rates. All this influences:
I) inhabitants’ capacity to obtain future incomes, andII) the number of years during which such incomes can be generated.
To illustrate the proposed approach, let us imagine two EU countries.Currently country 1 has a lower per capita income than country 2. If coun-try 1 grows at a faster rate than country 2, the income of country 1 willtherefore be closer to that of country 2 in the future. If we were to measureinequality using not only current income, but all incomes obtained throughoutthe lifetime of individuals, the inequality would be less than that observedwhen we use only current income. A similar argument can be applied to the
14
PIi0 = S120
t = 0
yit Si (t, t – 1), (4.1)(1 + r)t

situation where the countries differ in their survival rates. If individuals havea higher rate of survival in country 2, which is richer, the number of years dur-ing which incomes are generated will be greater, and thus, ceteris paribus, theirfuture flow of incomes will also be greater. If we measure inequality again us-ing not only current income, but all incomes that will be obtained throughoutindividuals’ lives, the inequality in this case will be greater than that observedwhen using only current income 3.
Note that, ceteris paribus, according to expression (4.1), countries willhave higher levels of permanent income:
— the higher their initial per capita incomes (yi0), since the higherthe initial income, the greater the future income flows (yit), giventhe rates of growth (gi), [yit = yio (1 + gi)t];
— the higher their rates of growth (gi), since the higher the rate ofgrowth, the higher their future per capita incomes (yit), given theinitial levels of per capita income (yi 0), [yit = yio (1 + gi)t];
— the greater the survival rates, [Si (t, t – 1)], since such rates will de-termine that incomes will be obtained for more years and that thepresent value of those income flows will increase; and
— the lower the rate of discount (r), since it increases the present val-ue of future incomes.
At empirical level, three factors will influence the inequality in perma-nent income:
— the initial levels of per capita current income,— the per capita future income flows, and— the survival rates of individuals.
Bearing this in mind, in the next section we will consider differentcounterfactual scenarios to evaluate separately the role of each of these de-termining factors. This consideration will enable us to value the effect ofeach of these factors on inequality and convergence in the EU.
european integration and inequality among countries: a lifecycle income analysis
15
3. Although the proposed approach is more complete than the traditional one based on currentincome, the permanent income approach obviously poses some problems: 1) it is not such astraightforward concept as current income, and 2) a number of additional assumptions (on futurecurrent incomes, life expectancy and discount rates) are needed to estimate it. For these reasons,we do not think that the permanent income approach supersedes the current per capita incomeone, which is a very useful and informative way to look at inequality issues. However we do believethat a permanent income analysis is a complementary, useful and suitable way to look at inequalitybetween economies because it tries to take into account whole life cycles of representative individ-uals. This approach, we hope, may provide us with additional insights on the problem.
5. Data and Results
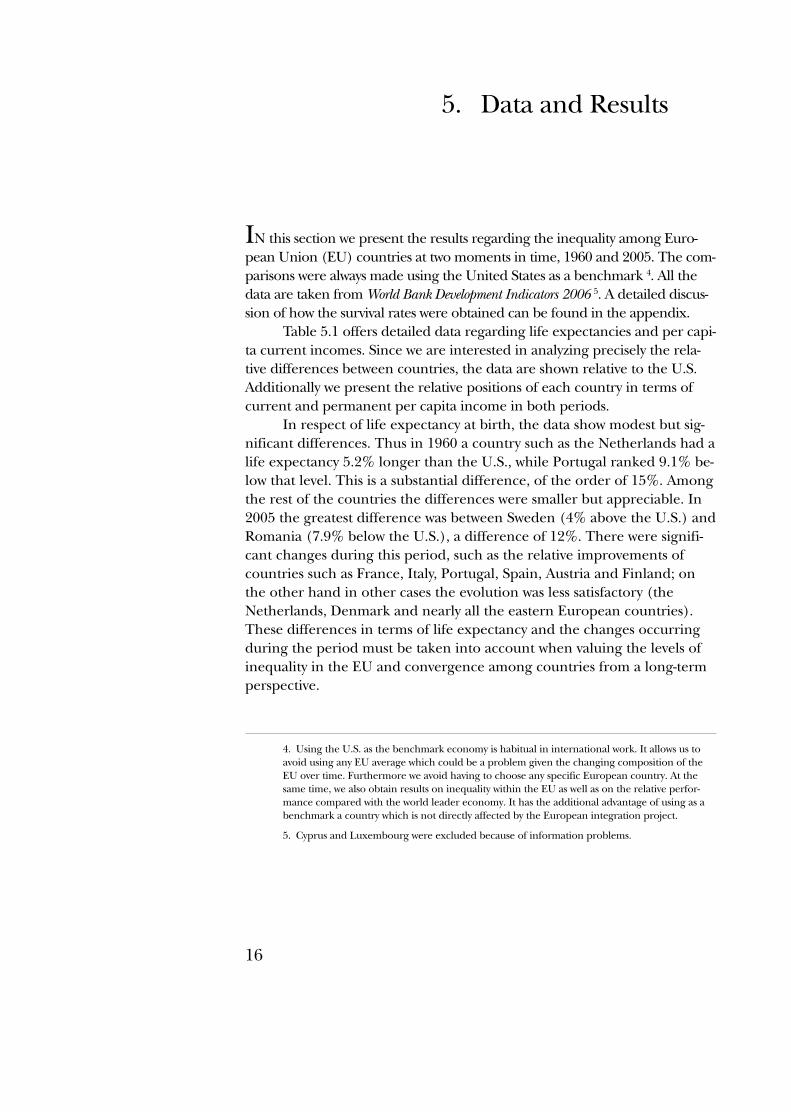
IN this section we present the results regarding the inequality among Euro-pean Union (EU) countries at two moments in time, 1960 and 2005. The com-parisons were always made using the United States as a benchmark 4. All thedata are taken from World Bank Development Indicators 2006 5. A detailed discus-sion of how the survival rates were obtained can be found in the appendix.
Table 5.1 offers detailed data regarding life expectancies and per capi-ta current incomes. Since we are interested in analyzing precisely the rela-tive differences between countries, the data are shown relative to the U.S.Additionally we present the relative positions of each country in terms ofcurrent and permanent per capita income in both periods.
In respect of life expectancy at birth, the data show modest but sig-nificant differences. Thus in 1960 a country such as the Netherlands had alife expectancy 5.2% longer than the U.S., while Portugal ranked 9.1% be-low that level. This is a substantial difference, of the order of 15%. Amongthe rest of the countries the differences were smaller but appreciable. In2005 the greatest difference was between Sweden (4% above the U.S.) andRomania (7.9% below the U.S.), a difference of 12%. There were signifi-cant changes during this period, such as the relative improvements ofcountries such as France, Italy, Portugal, Spain, Austria and Finland; onthe other hand in other cases the evolution was less satisfactory (theNetherlands, Denmark and nearly all the eastern European countries).These differences in terms of life expectancy and the changes occurringduring the period must be taken into account when valuing the levels ofinequality in the EU and convergence among countries from a long-termperspective.
16
4. Using the U.S. as the benchmark economy is habitual in international work. It allows us toavoid using any EU average which could be a problem given the changing composition of theEU over time. Furthermore we avoid having to choose any specific European country. At thesame time, we also obtain results on inequality within the EU as well as on the relative perfor-mance compared with the world leader economy. It has the additional advantage of using as abenchmark a country which is not directly affected by the European integration project.
5. Cyprus and Luxembourg were excluded because of information problems.

european integration and inequality among countries: a lifecycle income analysis
17
TABLE 5.1: Current income, permanent income and life expectancy in the EU countries(benchmark country = 100)
Life Current per capita Permanent income
expectancy income (historical scenario)
Year of EU entry Country
1960 2005 1960 2005 1960 2005
1951 Belgium 100.9 101.9 52.7 62.2 61.9 74.5
1951 France 100.7 103.5 54.5 62.9 62.6 74.8
1951 Germany 99.7 101.4 63.2 64.3 64.0 67.6
1951 Italy 99.1 103.3 41.6 51.6 50.3 66.0
1951 The Netherlands 105.2 101.6 62.9 62.6 65.9 63.5
1973 Denmark 103.4 100.1 88.7 84.1 87.6 80.3
1973 Ireland 99.9 101.1 34.6 78.0 79.5 191.7
1973 United Kingdom 101.9 101.4 73.4 71.0 72.8 70.0
1981 Greece 98.7 102.0 21.6 32.9 32.1 51.7
1986 Portugal 90.9 100.0 15.8 27.4 24.5 48.7
1986 Spain 99.1 103.9 26.6 41.5 40.5 68.8
1995 Austria 98.3 102.3 53.6 67.1 64.8 86.0
1995 Finland 98.6 101.7 51.3 68.1 65.7 91.8
1995 Sweden 104.6 104.0 78.4 78.6 82.3 81.9
2004 Czech Republic 100.8 97.8 22.3 17.3 18.2 13.7
2004 Estonia 98.2 92.4 14.8 15.6 15.3 15.2
2004 Hungary 97.5 93.8 9.2 15.1 14.5 23.4
2004 Latvia 100.0 92.3 9.4 13.4 13.2 17.4
2004 Lithuania 100.1 92.9 17.6 12.9 13.4 9.2
2004 Malta 98.3 101.7 8.0 25.6 27.6 101.3
2004 Poland 97.0 96.2 13.8 13.8 13.4 13.4
2004 Slovak Republic 100.7 95.5 14.8 12.7 13.0 10.6
2004 Slovenia 98.2 98.9 24.3 30.3 29.2 37.2
2007 Bulgaria 99.3 93.5 4.5 5.5 5.4 6.2
2007 Romania 93.8 92.1 5.8 6.0 5.6 5.7
— United States 100.0 100.0 100.0 100.0 100.0 100.0
Deviation coefficient
EU-6 (1951) 0.024 0.010 0.161 0.085 0.101 0.074
EU-9 (1973) 0.021 0.011 0.292 0.152 0.170 0.500
EU-10 (1981) 0.021 0.010 0.371 0.235 0.252 0.509
EU-12 (1986) 0.036 0.013 0.469 0.309 0.336 0.499
EU-15 (1995) 0.035 0.013 0.420 0.278 0.302 0.430
EU-25 (2004) 0.029 0.038 0.670 0.583 0.596 0.699
EU-27 (2007) 0.030 0.042 0.735 0.653 0.666 0.770
Note: Permanent income calculated using individuals’ rates of growth (gi), individual per capita income (yi) and individuals’ survival rates (Si(t,0)). Discount rate = 2%.
Source: World Bank and own preparation.

In terms of per capita income the differences are of greater magnitude.In 1960 Denmark and Bulgaria were the extreme cases with per capita in-comes equivalent respectively to 88.7% and 4.5% of the per capita income inthe U.S. In 2005 these two countries still showed the maximum and minimumvalues within the group of countries currently forming the EU-27, Denmarkwith a per capita income of 84.1% of that in the U.S. and Bulgaria barelyreaching 5.5%. Besides such considerable differences, the changes occurringduring the period should also be taken into account. The extreme values showa stability which would be deceptive to consider as something general. Thuscountries like Ireland, Belgium, Italy, Greece, Portugal, Austria, Finland, Hun-gary, Malta or Slovenia achieved substantial improvements in relative terms.Other countries like Denmark, the Netherlands, United Kingdom, Czech Re-public or Sweden, however, presented a less satisfactory evolution.
This disparity of behaviors over time is significant when valuing the in-equality among those countries at each moment in time; so one must takeinto account not only the per capita incomes at that moment, but also thepresent value of the per capita incomes expected in the future. With suchdisparate growth rates of per capita income, inequality in terms of lifecycleincome can vary significantly from inequality in income of the period.
The third column of table 5.1 shows the estimations of per capitapermanent income based on the historical scenario. In such scenario, accord-ing to expression (4.1), the initial per capita income and the survival ratesare used for each country. Also we use a long term growth rate based on theassumption that per capita income grows at the mean rate achieved duringthe 1960-2005 period. Finally to convert future incomes to present values weuse a discount rate of 2%.
In 1960 permanent income varied between the value for Denmark(87.6% of the U.S’s) and that for Bulgaria (5.4% of the U.S.’s). It wouldseem, therefore, that considering the lifecycle is not too important giventhat the results for both extreme cases are similar to those obtained usingsimply the current income for 1960. However when we observe what hap-pens in the other countries and not only in the extreme cases, we see im-portant changes. Though all the countries are below the U.S., their relativepositions change substantially if current income or permanent income isconsidered. Among others, Belgium, France, Italy, Greece, Portugal, Spain,Austria, Finland, or especially Malta and Ireland improve considerably whenpermanent income is considered 6. Thus, for example, Ireland goes from
josé manuel pastor monsálvez and lorenzo serrano martínez
18
6. The results for Malta and Ireland (both countries showing an estimated permanent incomegreater than the U.S. in 2007) are due to applying the previous long-run rate of growth in this
34.6% of the U.S’s to 79.5%; Spain from 26.6% to 40.5%, or Italy from41.6% to 50.3%. On the other hand, there are countries such as the UnitedKingdom or Denmark where the opposite occurs, and others where the im-provement is unimportant (e.g., Germany, the Netherlands or Poland). In2005 something similar occurs, and it is easy to see that the ranking ofcountries will change considerably if permanent income is considered insteadof current income.
The above results show the existence of differences in terms of life ex-pectancy and economic growth rates among European countries which jus-tify the interest in adopting a permanent income approach to analyze in-equality in the EU. Also the estimations of permanent income indicate thatthe results can differ in many countries from those habitual in exercisesbased on current income. For this reason, we will analyze the evolution ofinequality among countries within the EU throughout the period, and thepossible changes associated with the various expansions thereof, with thislifecycle perspective always in mind.
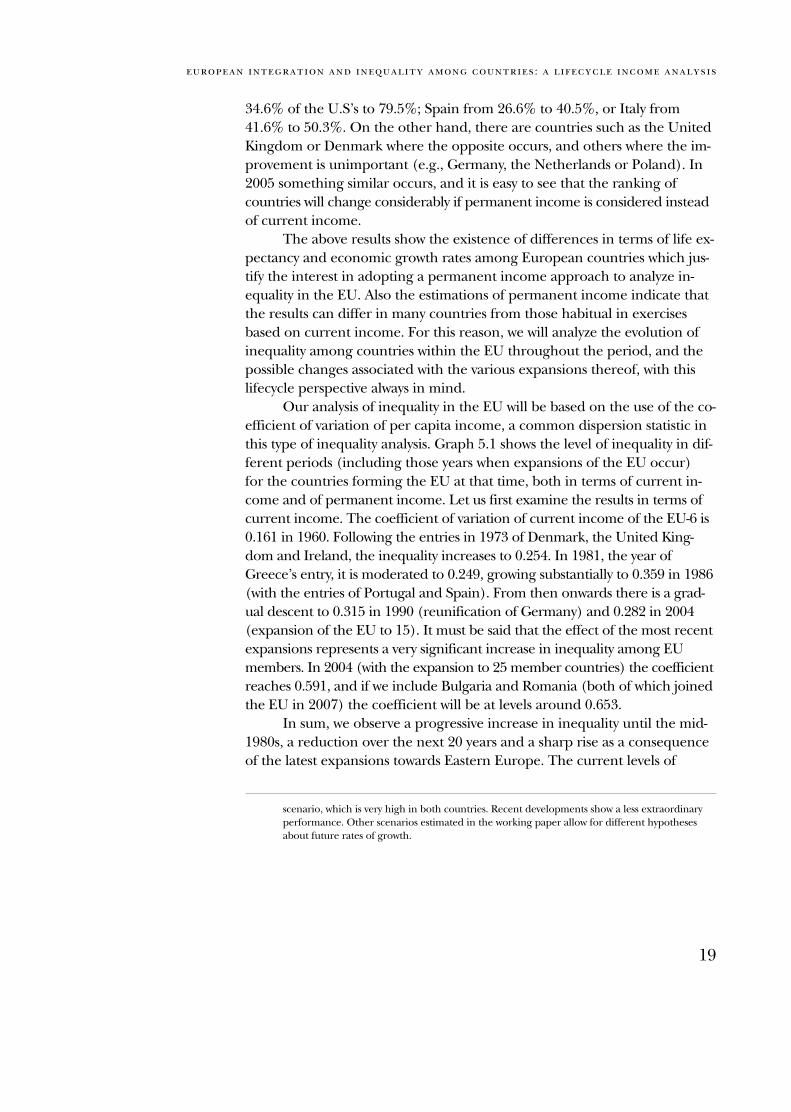
Our analysis of inequality in the EU will be based on the use of the co-efficient of variation of per capita income, a common dispersion statistic inthis type of inequality analysis. Graph 5.1 shows the level of inequality in dif-ferent periods (including those years when expansions of the EU occur)for the countries forming the EU at that time, both in terms of current in-come and of permanent income. Let us first examine the results in terms ofcurrent income. The coefficient of variation of current income of the EU-6 is0.161 in 1960. Following the entries in 1973 of Denmark, the United King-dom and Ireland, the inequality increases to 0.254. In 1981, the year ofGreece’s entry, it is moderated to 0.249, growing substantially to 0.359 in 1986(with the entries of Portugal and Spain). From then onwards there is a grad-ual descent to 0.315 in 1990 (reunification of Germany) and 0.282 in 2004(expansion of the EU to 15). It must be said that the effect of the most recentexpansions represents a very significant increase in inequality among EUmembers. In 2004 (with the expansion to 25 member countries) the coefficientreaches 0.591, and if we include Bulgaria and Romania (both of which joinedthe EU in 2007) the coefficient will be at levels around 0.653.
In sum, we observe a progressive increase in inequality until the mid-1980s, a reduction over the next 20 years and a sharp rise as a consequenceof the latest expansions towards Eastern Europe. The current levels of
european integration and inequality among countries: a lifecycle income analysis
19
scenario, which is very high in both countries. Recent developments show a less extraordinaryperformance. Other scenarios estimated in the working paper allow for different hypothesesabout future rates of growth.

relative inequality, then, within this much more heterogeneous 27-memberEU, multiply several times those existing among the original members ofthe European integration project.
Let us now consider inequality from a lifecycle perspective, usingonce again the coefficient of variation, but in this case that of permanentper capita income. The results are also in graph 5.1. The temporal profilenow shows a continued growth which, indeed, accelerates quite visibly withthe latest expansions. Thus the coefficient starts at a level of 0.101 in 1960(EU-6), increases to 0.141 in 1973, 0.168 in 1981, 0.218 in 1986, 0.236 in1990, 0.258 in 1995, 0.702 in 2004, and 0.770 in 2005. Also when permanentincome is used, we observe that levels of inequality are at maximum valuesfor the EU, much higher than the initial ones.
Comparing the results obtained from these two perspectives (currentand permanent income), we observe some interesting differences. Duringthe period prior to the latest expansion, inequality is much lower if perma-nent income is considered, especially for the years before 1995. That is tosay, taking into account the future, and not only the income of the period,the levels of inequality within the EU are substantially less than those indi-cated by the current per capita income of the period. However after the lat-
josé manuel pastor monsálvez and lorenzo serrano martínez
20
0.90
0.80
0.70
0.60
0.50
0.40
0.30
0.20
0.10
0.00
0.161
0.101
1960EU-6
1973EU-9
1981EU-10
1986EU-12
1990EU-12
1995EU-15
2004EU-25
2005EU-27
Current income Permanent income
0.254
0.141
0.249
0.168
0.359
0.218
0.315
0.236
0.2820.258
0.591
0.702
0.653
0.770
GRAPH 5.1: Inequality in per capita current income and permanent incomein the EU countries(deviation coefficient)
est expansions taking place this century, the picture is quite the contrary. In-equality is greater in terms of permanent per capita income. The differ-ences of life expectancy and of incomes foreseeable in the future tend tomagnify the inequality among the members of the present EU, whereas inthe past the opposite occurred. This means that, unless European cohesionpolicies contribute more actively to changing this panorama, the levels of in-equality in the EU will continue to be high.
In this sense, it should be pointed out that the latest reforms of theEU’s regional policy (European Commission, 2004), motivated to a large ex-tent by the latest expansions with the entry of more heterogeneous countries,are moving in the direction of concentrating their actions on the unequivo-cally less developed areas. The aim of these reforms is to make the region-al policy more effective in boosting the development of the less developedregions, essentially the majority of new member countries.
Once we have analyzed inequality and convergence in permanentincome (scenario 1 or the historical scenario), our next step is to evaluateseparately the role of each of their determining factors, such as survivalrates, per capita current income and rate of convergence. To do so, we willisolate the effect of each one of them step by step, i.e., allowing forchanges only in one of these variables each time. Such variables corre-spond to different assumptions about survival rates, the initial levels of percapita current income and the existence or not of convergence amongcountries in terms of per capita current income. On the basis of these sce-narios, we simulate the inequality of permanent income of the countriesby building some counterfactual scenarios. Particularly the following sce-narios will be considered:
Scenario 1 (historical base scenario): This scenario considers that the percapita income of each economy in the initial period (yi 0) grows at the indi-vidual average rate of growth (gi) during the 1960-2005 period. The series ofper capita incomes (yit) obtained in this way [yit = yio (1 + gi)t] is used to calcu-late permanent income (PIi 0) according to expression (5.1).
Scenario 2 (without convergence in current per capita income): This scenario con-siders that the per capita income of each economy in the initial period (yi0)grows at the average rate of growth of the benchmark economy (gUS) for the1960-2005 period. The series of per capita incomes (yit) obtained in this way
european integration and inequality among countries: a lifecycle income analysis
21
PIi0 = S120
t = 0
yit Si (t, 0) = S120
t = 0
yio (1 + gi)t
Si (t, 0). (5.1)(1 + r)t (1 + r)t

[yit = yio (1 + gUS)t] is used to calculate permanent income (PIi0) according toexpression (5.2).
Scenario 3 (with identical survival rates): This scenario is the same as scenario 1with the sole exception that the per capita incomes of each economy (yit) ob-tained as described [yit = yi0 (1 + gi)t] are combined with the survival rates ofthe benchmark economy (SUS t), obtaining the permanent income (PIi0)according to expression (5.3). This way we can evaluate the differences inpermanent income that will persist even if the survival rates do not differbetween economies.
Scenario 4 (with identical initial per capita incomes): In this scenario, the percapita income of each economy in the initial period is considered equal tothat of the benchmark economy (yi0 = gUS 0) and grows at the individual aver-age rate of growth (gi) during the 1960-2005 period. The series of per capitaincomes (yit) obtained in this way [yit = yUS o (1 + git)t] is used to calculate per-manent income (PIi0) according to expression (5.4).
Scenario 5 (considers the rates of growth since integration): This scenario considersthat the per capita income of each economy in the initial period (yi 0) growsat the individual average rate of growth (gi
POST) during the post-integrationperiod to 2005. The series of per capita incomes (yit) obtained in this way[yit = yio (1 + gi
POST)t] is used to calculate permanent income (PIi 0) accordingto expression (5.5).
Scenario 6 (with convergence in current per capita income): This scenarioconsiders that the per capita income of each economy in each period (yit)converges towards that of the benchmark economy (yUSt) at a speed of con-
josé manuel pastor monsálvez and lorenzo serrano martínez
22
PIi 0 = S120
t = 0
yit Si (t, 0) = S120
t = 0
yio (1 + gUS)t
Si (t, 0). (5.2)(1 + r)t (1 + r)t
PIi0 = S120
t = 0
yit Si (t, 0) = S120
t = 0
yio (1 + gi)t
SUS (t, 0). (5.3)(1 + r)t (1 + r)t
PIi0 = S120
t = 0
yit Si (t, 0) = S120
t = 0
yUSo (1 + git)t
Si (t, 0). (5.4)(1 + r)t (1 + r)t
PIi 0 = S120
t = 0
yit Si (t, 0) = S120
t = 0
yio (1 + giPOST)t
Si (t, 0). (5.5)(1 + r)t (1 + r)t

vergence b. If we define the per capita income of an economy at moment t,relative to the benchmark economy, as ht = yit/yUSt, and we further assume thatthere are no differences in steady state, then convergence at an annual rate ofb makes ht = [1 – e bt (1 – ho)] and yit = yUSt . (1 – (1 – ho)e –bt). The series of percapita incomes (yit) obtained in this way is used to calculate permanent in-come (PIi0) according to expression (5.6). In this scenario, three rates ofconvergence are considered: b = 2%, b = 3% and b = 5%.
Table 5.2 shows the coefficients of variation of permanent per capitaincome corresponding to these new counterfactual scenarios.
As we show above, one of the potentially important factors in determin-ing permanent income is the future rate of growth of current per capita in-come. To estimate its impact on inequality, we define scenario 2. In it we ob-tain the permanent incomes of each country on the assumption of acommon future growth rate. Specifically the growth rate of per capita in-come of the U.S. from 1960 to the present is used for all countries. The ini-tial levels of per capita income and life expectancies, on the other hand,continue to be those of each country. The results of scenario 2 show increas-ing inequalities until the creation of the EU-12, followed by slight reductionsin the 1990s and a sharp rise triggered by the latest expansions. Of more in-terest is the comparison between these results and those of scenario 1, as
european integration and inequality among countries: a lifecycle income analysis
23
PIi 0 = S120
t = 0
yit Si (t, 0) = S120
t = 0
yUSt .(1 – (1 – h0)e–bt) Si (t, 0). (5.6)
(1 + r)t (1 + r)t
TABLE 5.2: Inequality in current income and permanent income in the EU countries. Different scenarios(deviation coefficient)
Permanent income (scenarios)
Current
income Scen. 1 Scen. 2 Scen. 3 Scen. 4 Scen. 5 Scen. 6 Scen. 6 Scen. 6
(gUSA) (SUSA) (YpcUSA) (gpost) (b = 2%) (b = 3%) (b = 5%)
1960 EU-6 0.161 0.101 0.175 0.089 0.075 0.101 0.075 0.060 0.045
1973 EU-9 0.254 0.141 0.263 0.140 0.360 0.241 0.112 0.085 0.058
1981 EU-10 0.249 0.168 0.251 0.182 0.338 0.440 0.099 0.074 0.048
1986 EU-12 0.359 0.218 0.358 0.228 0.313 0.772 0.129 0.093 0.059
1990 EU-12 0.315 0.236 0.313 0.248 0.312 0.851 0.115 0.083 0.053
1995 EU-15 0.282 0.258 0.281 0.267 0.294 1.078 0.106 0.077 0.049
2004 EU-25 0.591 0.702 0.603 0.695 0.507 2.699 0.209 0.157 0.109
2005 EU-27 0.653 0.770 0.667 0.761 0.499 2.850 0.223 0.167 0.116

the differences between the two indicate the part of the inequality in perma-nent income associated with the different, long-term growth rates of thecurrent per capita income of each country. As it can be observed, the differ-ent rates of growth of per capita income during the 1960-2005 period helpto reduce inequality, with the exception of 1960 and 2005. In the successiveexpansions from 1973 to 1995, we can observe that the inequality in perma-nent income of the historical scenario (scenario 1) is always less than thatwhich would be obtained with a common rate of growth. Thus in 1986 thecoefficient of variation of the EU-12 countries is 0.218, but applyingthe common growth rate (scenario 2) this coefficient would be 0.313, indi-cating nearly 50% more inequality in permanent income. The reason isthat, when the member countries of the EU-9, EU-10, EU-12 and EU-15 areconsidered as a whole, the countries with the lowest per capita incomeshowed faster long-term growth during the 1960-2005 period. However thelatest expansions again show differential characteristics. For the EU-25inequality stands at 0.702 and for the EU-27 at 0.77, according to scenario 1.Using a common growth rate, the inequality falls to 0.603 and 0.667,respectively. This is because the latest expansions bring in countries thatare less developed and which in the past have shown less capacity forlong-term growth.
The second important factor for explaining inequality amongcountries is the difference in life expectancy. Scenario 3 is defined for thepurpose of evaluating the importance that differences in life expectancyhave had for the levels of inequality among the countries of the EUthroughout its history. The results of this scenario are obtained under theassumption that all the countries have a common life expectancy, specifi-cally that of the U.S. Therefore the differences between the inequal-ity levels of this scenario 3 and those of scenario 1 (historical scenario)have to be attributed to the differences in life expectancy of each country.Thus in 1960 the differences in life expectancy among the membercountries of the EU-6 explain a significant part of the inequality in perma-nent income (with a common life expectancy like that of the U.S., the coef-ficient of variation of permanent income would be 0.089 instead of 0.101).On the other hand during the 80s and 90s the effect is the opposite,helping to reduce slightly the inequality in permanent income (thus in1995 the coefficient of variation among the countries of the EU-15 with acommon life expectancy would have been 0.267 instead of 0.258). Theimpact of life expectancy is currently very low, and the levels of inequalitywill barely change even though the differences in life expectancydisappear.
josé manuel pastor monsálvez and lorenzo serrano martínez
24

Scenario 4 corresponds to the estimations of permanent income ob-tained by assuming that all the EU countries start with the same initial percapita income, while maintaining the life expectancies and long-termgrowth rates of each country. In 1960 there is an inequality of permanentincome of 0.075, clearly below the inequality in current per capita incomeand also below the inequality observed in the historical scenario (scenario 1).This confirms that differences in life expectancy and, particularly, ingrowth rates, were contributing significantly to the inequality among themember countries of the original EU. From that moment onwards, the im-pact of these two factors becomes more and more substantial. Inequality inpermanent income is greater than those obtained in scenario 1 in 1973,1981, 1986 and 1995. With the latest expansion, this trend is broken sincemost of the new member countries present a substantial gap between theirinitial current per capita incomes and those of the existing member countries.The impact of growth rates and of differences in life expectancy is substantial(thus the inequality in scenario 4 rises from 0.294 for the EU-15 in 1995to 0.507 for the EU-25 in 2004), but the differences are smaller than inscenario 1 (thus in 2004 for the EU-25 inequality in permanent incomeis 0.507 in scenario 4 and 0.702 in scenario 1).
The evidence for the growth trajectories of the European countries af-ter each expansion are not specially encouraging. The results of scenario 5are obtained by estimating the future current incomes for each year on thebasis of the growth rates experienced by each country since that year. Let usrecall that the estimations of scenario 1 are always based on the growth ratesmeasured from 1960 to the present. The comparison between scenario 5and scenario 1 is clear. We can leave aside the result for 1960 which, natural-ly, has to coincide. For the rest of the years, the inequality estimated in per-manent income is significantly greater because post-expansion growths areused. This already occurs in 1973 (0.241 and 0.141), and the phenomenonpersists with increasing intensity. In 1995 the level of inequality will be multi-plied by four (1.078 and 0.258), and with the latest expansion the result issimilar (2.85 and 0.77). Naturally we have to bear in mind that the more re-cent the year analyzed, the shorter the period that serves to calculate thegrowth rates, which may be specially subject to immediate factors and notso much to long-term ones. In sum, the results indicate that if the currentpost-integration growth rates are maintained, substantial levels of inequalitywill remain.
Let us recall that the base estimation (scenario 1) is obtained fromthe rates of growth of per capita long-term income (1960-2005) of eachcountry in the past. A different pattern of growth in the future can have a
european integration and inequality among countries: a lifecycle income analysis
25

substantial impact. In scenario 6 these growth rates are replaced by othersthat correspond to a situation of convergence in per capita current in-comes among the countries of Europe. Under this hypothesis, the countrieswith the lowest per capita income will grow most and will do so faster dueto their relative backwardness. Three different annual convergence ratesare posited: 2, 3 and 5%. These three convergence scenarios correspond tothe hypothesis that each country manages to reduce the gap in current percapita income by 2, 3 or 5% (respectively) each year.
The results indicate a steep reduction of inequality in perma-nent income among countries of the EU. The results of scenario 1 indi-cate that the inequality in permanent income in the EU is currently 0.77.However instead of maintaining the past growth rates of each country,if we assume that in the future there will be an annual convergence of 2%,the estimated inequality in permanent income will currently be only0.223, less than one third. If a somewhat greater annual convergence incurrent per capita income (3%) is achieved, it will be only 0.167. Finallywith a convergence rate of 5%, the inequality in permanent income willbe barely 0.116.
In other words, if thanks to the process of economic integration itselfor to the EU’s cohesion policies a convergence rate of 2% is achieved, theinequality in current income in 2005 of 0.653 will be compatible with alifecycle inequality two-thirds lower (0.223).
It should be emphasized that rates of convergence between econo-mies of 2% are perfectly feasible. Numerous studies estimate similar conver-gence rates among the countries of the Organisation for Economic Co-oper-ation and Development (OECD), the states of the U.S., the prefecturesof Japan, the regions of Germany, Spain, etc. (Barro and Sala-i-Martin,1995). Furthermore any increase in that rate of convergence will have itsreward in an appreciable reduction of the inequality in permanentincome.
After analyzing the influence of the determinants of permanent in-come on inequality, we may wonder about the evolution of inequality follow-ing the successive expansions, both for old member countries, and for thecountries that are joining the EU. Table 5.3 permits us to observe thephenomenon of inequality in this multiple dimension, both in terms ofcurrent per capita income (panel a) and in terms of permanent per capitaincome under scenario 1 (panel b).
The rows of the upper panel let us see the evolution of inequality incurrent per capita income of the successive groups of countries that havecome to form the EU throughout the 1960-2005 period. In the first row, we
josé manuel pastor monsálvez and lorenzo serrano martínez
26

can observe that the inequality among the founding countries at the start ofthe EU (EU-6) decreases progressively from 0.161 to less than half of that in1995 (0.078), rising slightly thereafter (0.085 in 2005), though remainingwell below the initial levels. For the expanded group of countries thatformed the EU-9 in 1973 something similar occurs, with inequality decreas-ing from 0.254 in 1973 to 0.152 in 2005. With the entry of Greece in 1981,the EU-10 is formed, and the reduction of inequality for this group is weak-er (from 0.249 in 1981 to 0.235 in 2005). More positive is the experience ofthe EU-12 with the entries of Spain and Portugal in 1986: inequality is re-duced from a level of 0.359 in that year to 0.309 in 2005. Slight reductionsare also observed for the expanded collectives EU-15 and EU-25 as fromtheir respective creations. That is to say that the general trend is that thesuccessive expansions are accompanied by reductions in the inequalityamong the old members.
european integration and inequality among countries: a lifecycle income analysis
27
TABLE 5.3: Inequality in current income and permanent income in the EU countries(deviation coefficient)
a) Per capita income
1960 1973 1981 1986 1990 1995 2004 2005
EU-6 (1951) 0.161 0.110 0.084 0.086 0.079 0.078 0.082 0.085
EU-9 (1973) 0.292 0.254 0.196 0.222 0.168 0.151 0.143 0.152
EU-10 (1981) 0.371 0.291 0.249 0.282 0.252 0.250 0.232 0.235
EU-12 (1986) 0.469 0.353 0.329 0.359 0.317 0.316 0.306 0.309
EU-12 (1990) 0.466 0.353 0.327 0.357 0.315 0.315 0.306 0.309
EU-15 (1995) 0.420 0.320 0.299 0.324 0.289 0.282 0.274 0.278
EU-25 (2004) 0.670 0.636 0.597 0.608 0.596 0.631 0.591 0.583
EU-27 (2007) 0.735 0.702 0.661 0.671 0.663 0.699 0.661 0.653
b) Permanent income
1960 1973 1981 1986 1990 1995 2004 2005
EU-6 (1951) 0.101 0.068 0.058 0.060 0.064 0.058 0.073 0.074
EU-9 (1973) 0.170 0.141 0.143 0.136 0.182 0.251 0.490 0.500
EU-10 (1981) 0.252 0.158 0.168 0.176 0.222 0.289 0.501 0.509
EU-12 (1986) 0.336 0.199 0.210 0.218 0.236 0.294 0.490 0.499
EU-12 (1990) 0.336 0.199 0.210 0.218 0.236 0.294 0.491 0.498
EU-15 (1995) 0.302 0.187 0.198 0.209 0.218 0.258 0.424 0.430
EU-25 (2004) 0.596 0.567 0.553 0.556 0.577 0.644 0.702 0.699
EU-27 (2007) 0.666 0.640 0.624 0.626 0.650 0.717 0.773 0.770

Analysis of the table columns indicates that the inequality for the totalof the EU countries will increase as a consequence of the entries of new,more heterogeneous countries. Thus observing the levels of inequality incurrent per capita income in 2005 for the different subgroups (last col-umn), we observe that it increases with the subgroup considered: 0.085 forthe EU-6, 0.152 for the EU-9, 0.235 for the EU-10, 0.309 for the EU-12, 0.278for the EU-15 (this is the only exception, which is reasonable given the char-acteristics of the three new members), steep rise to 0.583 for the EU-25, and0.653 for the EU-27 countries.
The lower panel shows the results in terms of permanent per capitaincome. There are many similarities, but also some significant differencesfrom the estimates in terms of current per capita income. Thus observingthe level of inequality in 2005, we can see that the various expansions meana clear increase in inequality for the EU, from the level of 0.074 for thefounding countries (EU-6) to levels of around 0.50 for the EU-9, EU-10 andEU-12 and, finally, levels of 0.699 for the EU-25 and 0.77 for the EU-27. Noincrease in inequality is observed for 2005, when the EU-9 expanded toEU-10 or EU-12, something which does happen when current income is ex-amined.
If we now focus our attention on the impact of the successive expan-sions over time, we will see that only in the case of the founding countries(EU-6) do we observe a reduction of inequality in permanent income: thecoefficient of inequality goes from 0.101 in 1960 to 0.074 in 2005. Forthe rest of the groupings that forms the EU at each time, the trend is theopposite: the EU-9 countries go from 0.141 in 1973 to 0.500 in 2005;the EU-10 countries from 0.168 in 1981 to 0.509 in 2005; the EU-12 countriesfrom 0.218 in 1986 to 0.499 in 2005; and the EU-15 countries from 0.258 in1995 to 0.430 in 2005. The general trend is that the successive expansionsare accompanied by substantial increases in inequality of permanentincomes among the old members, except in the case of the 6 foundingcountries.
josé manuel pastor monsálvez and lorenzo serrano martínez
28

6. Conclusions
ONE of the basic objectives of the European integration process is that thepotential positive effects deriving from it should economically benefit allthe member countries. In particular, the European Union’s regional policydevotes a substantial part of the resources of the Union’s budget for thepurpose of reducing the economic inequalities in the territorial sphere.
The usual analyses of inequality focus on the evolution of the currentper capita income of the period. Thus when a fixed group of countries is ana-lyzed over time (i.e., that formed by the 6 initial member countries or any ofthe groups that have come to form the area, EU-9, EU-12, EU-15, etc.), a trendtowards convergence in current per capita income can be appreciated be-tween 1960 and 2005. When the analysis focuses on the changing group ofcountries that have formed the European Union over time, what we observe isan increasing level of inequality until the 1986 expansion, followed by an in-tense convergence until the latest expansions from 2004 onwards. On the oth-er hand, the latest incorporations have led to the European Union having thehighest levels of inequality among member countries of its entire history.
In this study, to analyze the problem of inequality and convergenceamong the European Union (EU) countries, we adopt a complemen-tary approach to the usual one. This approach is connected with thepermanent income and life-cycle theories. The main issue with these theo-ries is the fact that they consider the complete flow of discounted future in-comes. Regarding inequality, the results obtained with this permanent in-come approach may differ from those obtained when only the differencesin current income are considered. The reason is that this approach takesinto account the fact that countries may grow at different rates, which willdetermine the future incomes of their inhabitants. Moreover if individualsdo not have the same survival rates in different countries, the number ofyears during which the incomes are generated will be different. Such differ-ence will also affect the present value of the total sum of incomes that indi-viduals will obtain throughout their lives.
The results obtained indicate that inequality in terms of permanentincome is substantially less than that shown by current per capita income forthe European Union up until its most recent processes of expansion. How-
29

ever the opposite occurs during the expansions of the last decade. The in-equality in current income currently underestimates the inequality in per-manent income, a somewhat unsatisfactory situation.
Nor does the temporal evolution of inequality in permanent incomepermit us to be too optimistic. Focussing the analysis on the fixed groups ofcountries that have formed the different European Unions, we observe con-vergence until the mid-1980s and divergence from then onwards. On theother hand, the behavior of the changing group of countries that haveformed the European Union in the course of time shows an almost perma-nent tendency towards divergence.
Differences in life expectancy would have helped to increase inequali-ty in permanent income in the initial phases of the European integrationproject. However at present they have very little impact. The overall level ofinequality would now be practically the same even if all the countries hadthe same life expectancy.
The differences in the starting level of per capita current incomes area more important factor of inequality in permanent income, though thesign of their effect varies in the course of the period analyzed. In the 1960sand also at the present time they contribute substantially to generatinggreater inequality in permanent income.
Finally we should point out the influence of the different economicgrowth rates of each country. This factor would have clearly contributed toreducing inequality in permanent income systematically since 1960. Howev-er with the latest expansion its effect has been inverted, and it has become asource of greater inequality in permanent income.
The analysis of the effects of the expansions on the different groupsof countries indicates that the successive expansions are accompanied bysubstantial increases of inequality in permanent income among the oldmembers, except with regard to the case of the 6 founding countries.
All these results point to the key role of economic growth in achievingfurther reductions in inequality in the EU since contribution of other vari-ables such as life expectancy seems, at present, to be rather limited. Policiesthat stimulate greater growth of the less developed countries should haveconsiderable effect. The simulations carried out here show that with an an-nual convergence rate of 2% (i.e., countries reduce the gap existing in cur-rent per capita income by 2% every year), the inequality in permanent in-come will be less than one third of what it is now. This rate of convergenceis ambitious, but not impossible, as it is consistent with that recorded by thecountries of the Organisation for Economic Co-operation and Develop-ment (OECD) in the past, and with those habitually obtained when analyz-ing convergence among the regions of a single country.
josé manuel pastor monsálvez and lorenzo serrano martínez
30

Appendix: Construction ofSurvival Rates
THE survival rates for each age are not available for a large number ofcountries. In this study to calculate them we use the same procedure as inBecker, Philipson and Soares (2001), based on the data offered by WorldBank Development Indicators (WDI) 2006. The procedure is based on fourtypes of information available relating to survival rates 7: infant mortality 8 inthe first year (S (1, 0)), infant mortality in the first five years 9 (S (5, 0)), thesurvival rate at 60 years 10 conditional on reaching 15 (S (60, 15)), and lifeexpectancy at birth (total years) (E0). Using this information, together withsome simplifying assumptions, it is possible to construct the survival rates of89 countries considered in the study for ages between 1 and 120 years.
By definition we have the following relationships between the rates ofsurvival:
where E60 are the additional years of life for a 60 year-old individual.The assumptions made with regard to the rates of survival are as fol-
lows:
S (t, t – 1) = S (t + 1, t), for 2 ≤ t ≤ 4;
S (t, t – 1) = 1, for 6 ≤ t ≤ 15;
31
S (5, 1) = S (5,0)
and E60 = S∞
t = 61S (t, 60) =
E0 – S60
t = 0S (t, 0)
,S (1, 0) S (60, 0)
7. The information provided by the WDI is presented as number of deaths (nij) per 1,000 indi-viduals, so it had to be converted to rates S (i, j) using the following formula:
.
8. Mortality rate, infant (per 1,000 live births).
9. Mortality rate, under-5 (per 1,000 live births).
10. Mortality rate, adult (per 1,000 adults). The information from the World Bank captures themortality rate separately for men and women. In this study we consider the average.
1,000 – n (i, j)S (i, j) =1,000

S (t, t – 1) = S (t + 1, t), for 16 ≤ t ≤ 59;
S (t, 60) = e–(t-60), for 60 ≤ t ≤ 120;
S (t + 1, t) = 0, for t > 120.
Given the information available, it is sufficient to reconstruct all thedistribution of survival. This is done as follows:
S (t, t – 1) = for 2 ≤ t ≤ 4;
S (t, t – 1) = 1, for 6 ≤ t ≤ 15;
S (t, t – 1) = for 16 ≤ t ≤ 59;
S (t, t – 1) = for 60 ≤ t ≤ 120;
S (t + 1, t) = 0, for t > 120,
where S (t, 60) for t > 60 is obtained from S (t, 60) = e–b(t-60) and b = 1E60(from the integration of S (t, 60) of 60 to ∞).
The assumptions adopted are not very far from reality, and permit usto use the full potential of the available information.
josé manuel pastor monsálvez and lorenzo serrano martínez
32
4�S (5, 1),
45�S (60, 15), S (t + 1, 60) ,
S (t, 60)

References
ABIAD, A. G., D. LEIGH and A. MODY (2007): “International Finance and Income Conver-
gence: Europe is Different”, International Monetary Fund (IMF), Working Paper 64.
BARRO, R. J. and X. SALA-I-MARTIN (1992): “Convergence”, Journal of Political Economy (100),
223-251.
— and X. SALA-I-MARTIN (1995): Economic Growth, NY, Mc Graw-Hill.
BECKER, G., T. J. PHILIPSON and R. SOARES (2001): “Growth and Mortality in Less Developed
Nations”, Unpublished manuscript, University of Chicago.
— T. J. PHILIPSON and R. SOARES (2005): “The Quantity and Quality of Life and the Evolu-
tion of World Inequality”, American Economic Review, 95 (1), 277-291.
CAPPELEN, A., F. CASTELLACCI, J. FAGGERBERG and B. VERSPAGEN (2003): “The Impact of EU Re-
gional Support on Growth and Convergence in the European Union”, Journal of Common
Market Studies, 41 (09), 621-644.
CAVES, R. E. and D. R. BARTON (1990): Efficiency in U.S. Manufacturing Industries, MIT Press
Cambridge, Mass.
DELGADO-RODRÍGUEZ, M. J. and I. ÁLVAREZ-AYUSO (2008): “Economic Growth and Conver-
gence of EU-Member Status: An Empirical Investigation”, Review of Development Economics,
12 (3), 486-497.
DOWRICK, S., Y. DUNLOP and J. QUIGGIN (2003): “Social Indicators and Comparisons of Living
Standards”, Journal of Development Economics, 70 (2), 501-529.
ERTUR, C. and W. KOCH (2006): “Regional Disparities in the European Union and the En-
largement Process: An Exploratory Spatial Data Analysis, 1995-2000”, The Annals of Region-
al Science, 40 (4), 723-765.
EUROPEAN COMMISSION (2004): “A New Partnership for Cohesion Convergence Competitive-
ness Cooperation”, Third Report on Economic and Social Cohesion.
FRANCOIS, J. F., B. MCDONALD and H. NORDSTRÖM (1994): The Uruguay Round: A Global General
Equilibrium Assessment, Centre for Economic Policy Research (CEPR), Discussion Paper
1067.
FRIEDMAN, M. (1957): A Theory of the Consumption Function, 4th print ed., Princeton University
Press, Princeton NJ.
GASIOREK, M., A. SMITH and A. VENABLES (1992): “Trade and Welfare: A General Equilibrium
Model”, in Trade Flows and Trade Policy after 1992, Cambridge University Press, 35-63.
GULDAGER, P. (1997): “Convergence of the EU Member States Towards the EMU Require-
ments, 1986 to 1993”, European Journal of Political Economy, 13 (2), 247-259.
33

HARRIS, R. (1984): “Applied General Equilibrium Analysis of Small Open Economies with
Scale Economies and Imperfect Competition”, The American Economic Review, 74 (5),
1016-1032.
HENREKSON, M., J. TORSTENSSON and R. TORSTENSSON (1997): “Growth Effects of European In-
tegration”, European Economic Review (41), 1527-1557.
KAITILA, V. (2004): “Convergence of Real GDP Per Capita in the EU-15: How Do the Acces-
sion Countries Fit in”, European Network of Economic Policy Research Institutes, Working Paper
25, 1-34.
LEE, J. W. (1992): “International Trade, Distortions, and Long-Run Economic Growth”, Inter-
national Monetary Fund, Research Department.
MACDONALD, J. M. (1994): “Does Import Competition Force Efficient Production?”, Review of
Economics and Statistics, 76 (4), 721-727.
MAUDOS, J., J. M. PASTOR and L. SERRANO (1999): “Economic Integration, Efficiency and Eco-
nomic Growth: The European Union Experience”, Applied Economics Letters, 6 (6), 389-392.
MODIGLIANI, F. (1986): “Life Cycle, Individual Thrift, and the Wealth of Nations”, American
Economic Review (76), 297-313.
— and R. BRUMBERG (1954): “Utility Analysis and the Consumption Function: An Interpreta-
tion of Cross-Section Data”, Post-Keynesian Economics (388), 436.
PASTOR, J. M. and L. SERRANO (2008): “Permanent Income, Convergence and Inequality
Among Countries”, Review of Income and Wealth, 54 (1), 105-115.
PHILIPSON, T. J. and R. SOARES (2001): “Human Capital, Longevity, and Economic Growth: A
Quantitative Assessment of Full Income Measures”, Manuscript.
QUAH, D. T. (1996): “Regional Convergence Clusters Across Europe”, European Economic Re-
view, 40 (3-5), 951-958.
REZA, R. and K. T. ZAHRA (2008): “Evaluation of the Income Convergence Hypothesis in Ten
New Members of the European Union. A Panel Unit Root Approach”, Panoeconomicus
(2), 157-166.
SERRANO, L. (2006): “Convergencia y desigualdad en renta permanente y corriente. Factores
determinantes”, BBVA Foundation, Working Paper 1-33.
SCHULTZ, T. P. (1998): “Inequality in the Distribution of Personal Income in the World: How
it Is Changing and Why”, Journal of Population Economics (11), 307-344.
STOCKHAMMER, E. (2009): “Effects of European Integration on Austria’s Economy”, Interna-
tional Review of Applied Economics, 23 (1), 19-40.
VINER, J. (1950): The Customs Union Issue, New York.
josé manuel pastor monsálvez and lorenzo serrano martínez
34

A B O U T T H E A U T H O R S *
LORENZO SERRANO MARTÍNEZ holds a PhD in economics from the Uni-
versity of Valencia. He also completed a degree in monetary eco-
nomics at the Centre of Financial and Monetary Studies in Madrid.
His research interests are economic growth, human capital and re-
gional economics. He has been a research fellow in the SOM Re-
search School of the University of Groningen, and is currently a
professor of economic analysis at the University of Valencia and a re-
search professor in the Valencian Economic Research Institute (Ivie).
E-mail: [email protected]
JOSÉ MANUEL PASTOR MONSÁLVEZ holds a PhD in economics from the
University of Valencia (1996) where he is currently a professor. He
has received scholarships from several institutions (Valencian Re-
gional Government, Fundación Caja Madrid, FIES). He has been a
visiting scholar at Florida State University (1996-1997) and an exter-
nal consultant of the World Bank. His research interests include
banking and regional economics. He has co-authored several books
and has published more than thirty articles in academic journals.
E-mail: [email protected]
Any comments on the contents of this paper can be addressed to JoséManuel Pastor Monsálvez at [email protected].
* The authors wish to thank the Spanish Science and Education Ministry-European Regional Development Fund (ERDF) (SEC2008-03813/ECON)for their financial support.


D O C U M E N T O S D E T R A B A J O
NÚMEROS PUBLICADOS
DT 01/02 Trampa del desempleo y educación: un análisis de las relaciones entre los efectosdesincentivadores de las prestaciones en el Estado del Bienestar y la educaciónJorge Calero Martínez y Mónica Madrigal Bajo
DT 02/02 Un instrumento de contratación externa: los vales o cheques.Análisis teórico y evidencias empíricasIvan Planas Miret
DT 03/02 Financiación capitativa, articulación entre niveles asistencialesy descentralización de las organizaciones sanitariasVicente Ortún-Rubio y Guillem López-Casasnovas
DT 04/02 La reforma del IRPF y los determinantes de la oferta laboralen la familia españolaSantiago Álvarez García y Juan Prieto Rodríguez
DT 05/02 The Use of Correspondence Analysis in the Explorationof Health Survey DataMichael Greenacre
DT 01/03 ¿Quiénes se beneficiaron de la reforma del IRPF de 1999?José Manuel González-Páramo y José Félix Sanz Sanz
DT 02/03 La imagen ciudadana de la JusticiaJosé Juan Toharia Cortés
DT 03/03 Para medir la calidad de la Justicia (I): AbogadosJuan José García de la Cruz Herrero
DT 04/03 Para medir la calidad de la Justicia (II): ProcuradoresJuan José García de la Cruz Herrero
DT 05/03 Dilación, eficiencia y costes: ¿Cómo ayudar a que la imagen de la Justiciase corresponda mejor con la realidad?Santos Pastor Prieto
DT 06/03 Integración vertical y contratación externa en los serviciosgenerales de los hospitales españolesJaume Puig-Junoy y Pol Pérez Sust
DT 07/03 Gasto sanitario y envejecimiento de la población en EspañaNamkee Ahn, Javier Alonso Meseguer y José A. Herce San Miguel

DT 01/04 Métodos de solución de problemas de asignación de recursos sanitarios Helena Ramalhinho Dias Lourenço y Daniel Serra de la Figuera
DT 01/05 Licensing of University Inventions: The Role of a Technology Transfer OfficeInés Macho-Stadler, David Pérez-Castrillo y Reinhilde Veugelers
DT 02/05 Estimating the Intensity of Price and Non-price Competition in Banking:An Application to the Spanish CaseSantiago Carbó Valverde, Juan Fernández de Guevara Radoselovics, David Humphrey
y Joaquín Maudos Villarroya
DT 03/05 Sistemas de pensiones y fecundidad. Un enfoque de generaciones solapadasGemma Abío Roig y Concepció Patxot Cardoner
DT 04/05 Análisis de los factores de exclusión socialJoan Subirats i Humet (Dir.), Ricard Gomà Carmona y Joaquim Brugué Torruella (Coords.)
DT 05/05 Riesgos de exclusión social en las Comunidades AutónomasJoan Subirats i Humet (Dir.), Ricard Gomà Carmona y Joaquim Brugué Torruella (Coords.)
DT 06/05 A Dynamic Stochastic Approach to Fisheries Management Assessment:An Application to some European FisheriesJosé M. Da-Rocha Álvarez y María-José Gutiérrez Huerta
DT 07/05 The New Keynesian Monetary Model: Does it Show the Comovement between Output and Inflation in the U.S. and the Euro Area?Ramón María-Dolores Pedrero y Jesús Vázquez Pérez
DT 08/05 The Relationship between Risk and Expected Return in EuropeÁngel León Valle, Juan Nave Pineda y Gonzalo Rubio Irigoyen
DT 09/05 License Allocation and Performance in Telecommunications MarketsRoberto Burguet Verde
DT 10/05 Procurement with Downward Sloping Demand: More Simple EconomicsRoberto Burguet Verde
DT 11/05 Technological and Physical Obsolescence and the Timing of AdoptionRamón Caminal Echevarría
DT 01/06 El efecto de la inmigración en las oportunidades de empleode los trabajadores nacionales: Evidencia para EspañaRaquel Carrasco Perea, Juan Francisco Jimeno Serrano y Ana Carolina Ortega Masagué
DT 02/06 Inmigración y pensiones: ¿Qué sabemos?José Ignacio Conde-Ruiz, Juan Francisco Jimeno Serrano y Guadalupe Valera Blanes
DT 03/06 A Survey Study of Factors Influencing Risk Taking Behaviorin Real World Decisions under UncertaintyManel Baucells Alibés y Cristina Rata
DT 04/06 Measurement of Social Capital and Growth:An Economic MethodologyFrancisco Pérez García, Lorenzo Serrano Martínez, Vicente Montesinos Santalucía
y Juan Fernández de Guevara Radoselovics

DT 05/06 The Role of ICT in the Spanish Productivity SlowdownMatilde Mas Ivars y Javier Quesada Ibáñez
DT 06/06 Cross-Country Comparisons of Competition and Pricing Powerin European BankingDavid Humphrey, Santiago Carbó Valverde, Joaquín Maudos Villarroya y Philip Molyneux
DT 07/06 The Design of Syndicates in Venture CapitalGiacinta Cestone, Josh Lerner y Lucy White
DT 08/06 Efectos de la confianza en la información contable sobre el coste de la deudaBelén Gill de Albornoz Noguer y Manuel Illueca Muñoz
DT 09/06 Relaciones sociales y envejecimiento saludableÁngel Otero Puime, María Victoria Zunzunegui Pastor, François Béland,
Ángel Rodríguez Laso y María Jesús García de Yébenes y Prous
DT 10/06 Ciclo económico y convergencia real en la Unión Europea:Análisis de los PIB per cápita en la UE-15José Luis Cendejas Bueno, Juan Luis del Hoyo Bernat, Jesús Guillermo Llorente Álvarez,
Manuel Monjas Barroso y Carlos Rivero Rodríguez
DT 11/06 Esperanza de vida en España a lo largo del siglo XX:Las tablas de mortalidad del Instituto Nacional de EstadísticaFrancisco José Goerlich Gisbert y Rafael Pinilla Pallejà
DT 12/06 Convergencia y desigualdad en renta permanente y corriente: Factores determinantesLorenzo Serrano Martínez
DT 13/06 The Common Agricultural Policy and Farming in Protected Ecosystems:A Policy Analysis Matrix ApproachErnest Reig Martínez y Vicent Estruch Guitart
DT 14/06 Infrastructures and New Technologies as Sources of Spanish Economic GrowthMatilde Mas Ivars
DT 15/06 Cumulative Dominance and Heuristic Performancein Binary Multi-Attribute ChoiceManel Baucells Alibés, Juan Antonio Carrasco López y Robin M. Hogarth
DT 16/06 Dynamic Mixed Duopoly: A Model Motivated by Linux versus WindowsRamon Casadesus-Masanell y Pankaj Ghemawat
DT 01/07 Social Preferences, Skill Segregation and Wage DynamicsAntonio Cabrales Goitia, Antoni Calvó-Armengol y Nicola Pavoni
DT 02/07 Stochastic Dominance and Cumulative Prospect TheoryManel Baucells Alibés y Franz H. Heukamp
DT 03/07 Agency RevisitedRamon Casadesus-Masanell y Daniel F. Spulber
DT 04/07 Social Capital and Bank Performance:An International Comparison for OECD CountriesJosé Manuel Pastor Monsálvez y Emili Tortosa-Ausina

DT 05/07 Cooperation and Cultural Transmission in a Coordination GameGonzalo Olcina Vauteren y Vicente Calabuig Alcántara
DT 06/07 The Extended Atkinson Family and Changes in Expenditure Distribution:Spain 1973/74 – 2003Francisco J. Goerlich Gisbert, María Casilda Lasso de la Vega Martínez
y Ana Marta Urrutia Careaga
DT 07/07 Análisis de la evolución de la dependencia en la tercera edad en EspañaDavid Casado Marín
DT 08/07 Designing Contracts for University Spin-offsInés Macho-Stadler, David Pérez-Castrillo y Reinhilde Veugelers
DT 09/07 Regional Differences in Socioeconomic Health Inequalities in SpainPilar García Gómez y Ángel López Nicolás
DT 10/07 The Evolution of Inequity in Access to Health Care in Spain: 1987-2001Pilar García Gómez y Ángel López Nicolás
DT 11/07 The Economics of Credit Cards, Debit Cards and ATMs:A Survey and Some New EvidenceSantiago Carbó-Valverde, Nadia Massoud, Francisco Rodríguez-Fernández,
Anthony Saunders y Barry Scholnick
DT 12/07 El impacto comercial de la integración europea, 1950-2000Luis Fernando Lanaspa Santolaria, Antonio Montañés Bernal,
Marcos Sanso Frago y Fernando Sanz Gracia
DT 13/07 Proyecciones de demanda de educación en EspañaAndrés M. Alonso Fernández, Daniel Peña Sánchez de Rivera
y Julio Rodríguez Puerta
DT 14/07 Aversion to Inequality and Segregating EquilibriaAntonio Cabrales Goitia y Antoni Calvó-Armengol
DT 15/07 Corporate Downsizing to Rebuild Team SpiritAntonio Cabrales Goitia y Antoni Calvó-Armengol
DT 16/07 Maternidad sin matrimonio: Nueva vía de formación de familias en EspañaTeresa Castro Martín
DT 17/07 Immigrant Mothers, Spanish Babies: Childbearing Patterns of Foreign Womenin Spain Marta Roig Vila y Teresa Castro Martín
DT 18/07 Los procesos de convergencia financiera en Europa y su relación con el ciclo económicoJosé Luis Cendejas Bueno, Juan Luis del Hoyo Bernat, Jesús Guillermo Llorente Álvarez,
Manuel Monjas Barroso y Carlos Rivero Rodríguez
DT 19/07 On Capturing Rent from a Non-Renewable Resource International Monopoly:A Dynamic Game ApproachSantiago J. Rubio Jorge

DT 20/07 Simulación de políticas impositivas medioambientales:Un modelo de equilibrio general de la economía españolaAntonio Manresa Sánchez y Ferran Sancho Pifarré
DT 21/07 Causas del crecimiento económico en Argentina (1990-2004):Otro caso de «tiranía de los números»Ariel Alberto Coremberg
DT 22/07 Regional Financial Development and Bank Competition:Effects on Economic GrowthJuan Fernández de Guevara Radoselovics y Joaquín Maudos Villarroya
DT 23/07 Política fiscal e instituciones presupuestarias en los paísesde la reciente ampliación de la Unión EuropeaCarlos Mulas-Granados, Jorge Onrubia Fernández y Javier Salinas Jiménez
DT 24/07 Measuring International Economic Integration:Theory and Evidence of GlobalizationIván Arribas Fernández, Francisco Pérez García y Emili Tortosa-Ausina
DT 25/07 Wage Inequality among Higher Education Graduates:Evidence from EuropeJosé García Montalvo
DT 26/07 Governance of the Knowledge-Intensive FirmVicente Salas Fumás
DT 27/07 Profit, Productivity and Distribution: Differences Across Organizational FormEmili Grifell-Tatjé y C. A. Knox Lovell
DT 28/07 Identifying Human Capital Externalities: Theory with ApplicationsAntonio Ciccone y Giovanni Peri
DT 01/08 A Multiplicative Human Development IndexCarmen Herrero Blanco, Ricardo Martínez Rico y Antonio Villar Notario
DT 02/08 Real Exchange Rate Appreciation in Central and Eastern European Countries:Why the Balassa-Samuelson Effect Does Not Explain the Whole StoryJosé García Solanes
DT 03/08 Can International Environmental Cooperation Be Bought?Cristina Fuentes Albero y Santiago J. Rubio Jorge
DT 04/08 On the Dynamics of GlobalizationIván Arribas Fernández, Francisco Pérez García y Emili Tortosa-Ausina
DT 05/08 Los motores de la aglomeración en España: Geografía versus historiaFrancisco J. Goerlich Gisbert y Matilde Mas Ivars
DT 06/08 Sobre el tamaño de las ciudades en España:Dos reflexiones y una regularidad empíricaFrancisco J. Goerlich Gisbert y Matilde Mas Ivars

DT 07/08 Managing Waiting Lists in a Fair WayCarmen Herrero
DT 08/08 Estimación del capital social en España: Series temporales por territoriosFrancisco Pérez García, Lorenzo Serrano Martínez
y Juan Fernández de Guevara Radoselovics
DT 09/08 Estimation of Social Capital in the World: Time Series by CountryFrancisco Pérez García, Lorenzo Serrano Martínez
y Juan Fernández de Guevara Radoselovics
DT 10/08 Capabilities and Opportunities in HealthCarmen Herrero y José Luis Pinto Prades
DT 11/08 Cultural Transmission and the Evolution of Trustand Reciprocity in the Labor MarketGonzalo Olcina Vauteren y Vicente Calabuig Alcántara
DT 12/08 Vertical and Horizontal Separation in the European Railway Sector:Effects on ProductivityPedro Cantos Sánchez, José Manuel Pastor Monsálvez y Lorenzo Serrano Martínez
DT 01/09 How Effective Are Rewards Programs in Promoting Payment Card Usage?:Empirical EvidenceSantiago Carbó-Valverde y José Manuel Liñares-Zegarra
DT 02/09 Comparative Advantage Across Goods and Product QualityFrancisco Alcalá
DT 03/09 El transporte ferroviario de alta velocidad: Una visión económicaJavier Campos Méndez, Ginés de Rus Mendoza e Ignacio Barrón de Angoiti
DT 04/09 ¿En qué circunstancias está justificado invertir en líneasde alta velocidad ferroviaria?Ginés de Rus Mendoza y Chris Nash
DT 05/09 Openness and Geographic Neutrality:How Do They Contribute to International Banking Integration?Iván Arribas Fernández, Francisco Pérez García y Emili Tortosa-Ausina
DT 06/09 Firms’ Main Market, Human Capital and WagesFrancisco Alcalá y Pedro J. Hernández
DT 07/09 Tax Evasion, Technology Shocks and the Cyclicality of Government RevenuesJudith Panadés Martí
DT 08/09 Parameterizing Expectations for Incomplete Markets EconomiesFrancesc Obiols-Homs
DT 09/09 Endogenous Financial IntermediationRadim Bohácek y Hugo Rodríguez Mendizábal
DT 10/09 The Economic Impact of Migration:Productivity Analysis for Spain and the United KingdomMari Kangasniemi, Matilde Mas Ivars, Catherine Robinson y Lorenzo Serrano Martínez

DT 11/09 Time, Quality and GrowthFrancisco Alcalá
DT 12/09 Competing Technologies for Payments:Automated Teller Machines (ATMs), Point of Sale (POS) Terminalsand the Demand for CurrencySantiago Carbó-Valverde y Francisco Rodríguez-Fernández
DT 13/09 Education, Utilitarianism and Equality of OpportunityAitor Calo-Blanco y Antonio Villar Notario


Documentosde Trabajo14 14Documentos
de Trabajo2009
José Manuel Pastor Monsálvez
Lorenzo Serrano Martínez
European Integrationand Inequalityamong CountriesA Lifecycle Income Analysis
Plaza de San Nicolás, 448005 BilbaoEspañaTel.: +34 94 487 52 52Fax: +34 94 424 46 21
Paseo de Recoletos, 1028001 MadridEspañaTel.: +34 91 374 54 00Fax: +34 91 374 85 22
dt_bbva_2009_14_european_integration_cubierta:dt_bbva_2009_05 22/9/09 09:43 Página 1