Embed Size (px)
Citation preview

Electronic copy available at: http://ssrn.com/abstract=2236182
Due Diligence and Investee Performance*
Douglas Cumming Professor and Ontario Research Chair
York University - Schulich School of Business
4700 Keele Street
Toronto, Ontario M3J 1P3
Canada
e-mail: [email protected]
Web: http://ssrn.com/author=75390
Simona Zambelli University of Bologna
School of Economics, Management and Statistics
Piazzale della Vittoria, 15
47100, Forlì, Italy
e-mail: [email protected]
Web: http://www2.sa.unibo.it/~simona.zambelli/
December 8, 2015
* We would like to thank the participants at York University seminar series (March 2013, Toronto,
Canada), the 2013 IFABS Conference (June 2013, Nottingham, UK), the 2014 EFMA Conference (June
2014, Rome, Italy), Paris Financial Management Conference (December 2014, Paris), 4th European
Business Research Conference (April 2015, London), as well as Pierpaolo Pattitoni, Mohammad Hoque,
Jeffrey James Austin, Ali Mohammadi, Feng Zhan, Davide Raggi, Silvia Pazzi, and Matteo Lippi Bruni
for comments and suggestions. Simona Zambelli owes special thanks to the Fondazione Cariplo (Milan)
for financial support. Douglas Cumming owes thanks to the Social Sciences and Humanities Research
Council of Canada for financial support.

Electronic copy available at: http://ssrn.com/abstract=2236182
1
Due Diligence and Investee Performance
Abstract
Our study provides new evidence on due diligence (DD) and its impact on investee performance.
We estimate the economic value of due diligence (DD) in the context of private equity (PE) by
investigating the relationship between DD and investee performance, while controlling for endogeneity.
With the adoption of a novel and unique dataset, we find evidence highly consistent with the view that a
thorough DD is associated with improved future investee performance. We also distinguish the role of
different types of DD and show that the DD carried out internally by fund managers has a more
pronounced impact on performance. Instead, the DD mainly performed by external agents, such as
consultants, lawyers and accountants, gives rise to puzzling results and imperfect matching, highlighting
the existence of apparent agency problems.
JEL Classification: G23, G24, G28
Keywords: Due Diligence, Governance, Performance, Private Equity
2
“What we hope ever to do with ease, we must learn first to do with diligence.”
Samuel Johnson (Boswell, 2010. Life of Johnson, Volume 1, 1709-1765)
1. Introduction
This study aims at empirically investigating the determinants and economic value of due
diligence (DD) in the context of private equity (PE) financing, as well as the impact of different
types of DD (e.g., internal vs. external) on firm performance. Despite the emphasis placed on the
importance of DD by various industry guides and venture capital associations (e.g., the European
Venture Capital Association, the National Venture Capital Association, and the Canadian Venture
Capital Association), very few academic studies have investigated its efficacy and economic
value. For the purpose of this paper, we adopt the term “private equity” to refer to the later stage
financing of existing firms, in line with the definition provided by the Italian Venture Capital
Association (AIFI), Capizzi (2004), and Heed (2010), among others. This definition, which
differs from the one typically adopted in USA (see, e.g., Korteweg and Sorensen, 2014), excludes
the funding of start-up and early stage firms (venture capital investments) and includes: a)
development or expansion financing b) leveraged buyout (LBO) deals, and c) replacement and
turnaround financing (see, e.g., Zambelli, 2010; 2014). Historically, the PE sector has dominated
the Italian alternative financing industry, while early stage investments have always represented a
minority (see AIFI Statistics Reports from 1999 onwards, Caselli et al., 2013).
Research in entrepreneurial finance has stressed the importance of due diligence, but
primarily from a theoretical perspective (Yung, 2009). While empirical studies to date have
emphasized the importance of investor characteristics, reputation, and cultural differences among
venture capital (VC) and private equity (PE) intermediaries (Casamatta and Haritchabalet, 2007;
Caselli et al., 2013; Das et al., 2010; Masulis and Nahata, 2009, Nahata, 2008; Nahata et al.,

3
2013; Sevilir, 2010), no empirical studies have formally examined the economic value and impact
of DD. Related research in corporate finance (Li and Prabhala, 2006) and entrepreneurial finance
(Sorensen, 2007; Yung, 2009; Bengtsson and Hsu, 2012) has focused on selection models.
However, there have been no empirical studies examining the financial importance of selection
and matching investors and investees in a PE setting. Also, little evidence exists on how such
screening takes place and who exactly carries out due diligence. In this paper, we provide some
of the first evidence on screening by empirically investigating the determinants and the economic
value of the due diligence in the context of private equity (PE) financing. Moreover, we provide a
novel look at the impact of different types of due diligence (e.g., internal vs. external) on firm
performance. We compare the role of lawyers, accountants, and consultants carrying out due
diligence to assess whether there are agency costs associated with delegating due diligence.
As highlighted by Brown et al. (2008, 2009, 2012), due diligence is crucial for hedge fund
and other types of alternative investments, including but not limited to PE financing. Likewise,
we would expect that due diligence is particularly important in PE financing where value-added
fund managers are actively involved in the governance and management of their portfolio
companies (Gorman and Sahlman, 1989; Gompers and Lerner, 1999; Casamatta, 2003; Inderst
and Muller, 2004; Yung, 2009; Ivanov and Xie, 2010). Also, private equity funds are generally
not well diversified and, as such, fund managers take extra care to mitigate idiosyncratic risks
(Kanniainen and Keuschnigg, 2003, 2004; Nahata, 2008; Nielsen, 2008; Knill, 2009; Wang and
Wang, 2011, 2012; Altintig et al., 2013; Nahata et al., 2013).
In the context of our analysis, due diligence refers to the investigation process of a
prospective investment in a particular target firm by PE investors (hereafter venture capitalists, or
VCs). Due diligence involves a thorough assessment of a number of factors, e.g., management
skills, target industry and competitors, project opportunity, financial forecasts, and strategic fit
4
with the fund portfolio companies (Camp, 2002), as well as operational and financial risk (Brown
et al. 2008). This evaluation process may be performed mainly internally by PE fund managers
themselves (“internal DD”) or mainly externally by strategic and financial consultants, or law and
accountancy firms (“external DD”). For the purpose of this study, when we use the terms
“internal” or “external” due diligence we refer to the agents (internal or external) who performed
the majority of the due diligence process (not the entire process). These activities are not
mutually exclusive and may act as complements. For example, an “internal” DD refers to a
situation in which the majority of the DD is performed by the PE investor internally and it is
possible that a small part of this activity (e.g., the legal DD) is delegated externally (see Table 1
for more details on the definitions of the different types of DD adopted in our study).
A rigorous due diligence is costly and takes time. Expenses for due diligence include
direct costs of paying for information pertaining to the investee, legal costs for background
checks, and the value of time spent on the due diligence. Indirect costs of due diligence include
the potential lost opportunity in terms of the investee walking away from the deal or getting
financing elsewhere. Indirect costs likewise include opportunity costs on time not spent
considering other potential projects, or time not spent on adding value to other firms in a fund’s
portfolio. Considering the costs, time and effort involved, important research questions are: a)
How worth is the time spent on implementing it?; b) Would it be better to save time and delegate
this investigation process to external agents (e.g., strategic consultants, law firms, or
accountants)? As highlighted by Camp (2002), the main reason underlying such deep
investigation of prospective investments in target companies is that, by doing so, VCs hope to
make better investment decisions, and thereby enhance the returns on their overall portfolios.
However, considering the direct and indirect costs involved, PE investors may be tempted to rush

5
the DD process or to delegate it to external agents and it is not exactly clear as to whether or not
additional due diligence is worth it in terms of performance payoffs.
Despite the existence of a vast literature on selection criteria (for a recent review see, e.g.,
Alemany and Villanueva, 2014), no prior study has empirically investigated the economic value
of DD and its efficacy with reference to how much the investment in due diligence pays in terms
of obtaining better future performance from the investee. The importance and the costs of due
diligence for PE funds have been examined solely from a theoretical perspective by Yung (2009),
who argues that due diligence facilitates matching and mitigates adverse selection problems. To
the best of our knowledge no prior study has empirically examined the relationship between PE
due diligence and investment performance. Partial exceptions are Wangerin (2015), who analyzes
the DD in the context of M&A transactions, Brown et al. (2008), who investigated the role of due
diligence solely for hedge funds, Sorensen (2007), who estimates the impact of sorting and
matching in the context of investments made in early stage and startup companies, and Baum and
Silverman (2004), who examined the screening role of VC funds by focusing only on the
biotechnology industry and start-up firms. These studies highlight the need for further and
broader research on the selection process in PE settings.
In this paper, we contribute to filling this gap by empirically assessing the efficacy and
time-value of DD through the adoption of a novel and unique hand-collected dataset, which
covers the majority of the funds actively involved in the Italian PE market, whose transactions
experienced relevant legal changes that affected their frequency and the allocation of attention of
PE funds.1 More specifically, we investigate the economic value of an additional week of DD,
and account for the role played by the particular agent performing such DD (i.e., PE fund
1 See Heed (2010) and Nahata et al. (2013) for related studies investigating the impact of the legal environment in
PE finance; see Zambelli (2010) for details regarding the changes experienced by the PE legal setting in Italy.
6
managers, external legal advisors, chartered accountants, or other external consultants). Sorensen
(2007) provides a matching model without any empirical analysis of factors pertinent to internal versus
external due diligence or the extent of internal versus external due diligence. Our study is the first to
empirically evaluate this aspect.
In terms of outcomes, the key performance measures underlying our study are related to
investee firms. In line with Richard et al. (2009) and Kabir and Roosenboom (2003), for each
investee firm we track two operating performance indicators over the first three years from the
investment date: the Return on Assets (ROA) and the operating profit margin (EBITDA to Sales
ratio, hereafter EBITDA/Sales), as measures of operating profitability. These performance
measures on a firm level are also consistent with Caselli et al. (2013), and Cao (2013).2 The key
independent variable underlying our study is represented by the time spent on due diligence,
considered as a proxy of the importance and effort given by the investor to that particular activity,
in line with a recent tendency in the entrepreneurial field (e.g., Wangerin 2015; Achleitner et al.,
2014).3
2 It is worth noting that other performance measures on a fund level could be considered (IRR and IPO exit).
However, we decided to focus on ROA and EBITDA/SALES because we want to measure 3-year performance from
date of investment to have a uniform measure of performance that can be reasonably connected to due diligence.
IRRs are difficult to use, as many firms will not have had an exit within 3 years, and hence IRRs are based on
imprecise valuations which are often wrong (Cumming and Walz, 2010). And because we look at a 3 years horizon
where many firms do not yet have an exit, we cannot examine IPOs. Moreover, as highlighted in Caselli et al.
(2013), ROA and EBITDA/SALES do not heavily depend on market conditions as IRR does (which is influenced by
the entry and exit prices paid by the PE fund). The IPO exit is also a coarse measure of an investment outcome (i.e.,
ROA and EBIT/Sales can vary widely across different IPOs), despite his wide usage, as highlighted by Sorensen
(2007). Nevertheless, for robustness purposes in Section 6.4. we do show results on the impact of DD on IPOs, and
the findings are consistent. 3 We decided to use the time spent on DD as a proxy of the importance given by investors to the DD activity and
their effort in implementing such activity. The intuition behind this decision is that the time dedicated to a certain
activity can capture the role and importance that this activity plays for a particular agent. This is especially true for
the PE industry where the opportunity cost of time is enormous and PE investors may be tempted to rush the due
diligence activity of perspective investments in order to allocate more attention to managing and adding value to
existing portfolio firms. By looking at the high variability in the time spent on DD among different PE investors and
within the same PE fund, we imply that such difference can effectively capture a different level of effort, which
differs on a case-by-case basis. The more time and attention a fund manager allocates to the due diligence of a certain
firm, more resources the fund is allocating to that firm, and this captures the underlying importance given by such
investor to the activity of due diligence. This is also in line with a recent evidence in the entrepreneurial finance field

7
Our empirical analyses consistently highlight the efficacy and importance of due diligence
in improving firm performance (especially if the due diligence activity is carried out by internal
fund managers). Our results are highly consistent with the view that the time spent on due
diligence has substantial economic value, and reinforces the implications underlying the
theoretical model of Yung (2009), and the evidence provided by Brown et al. (2008; 2012).
Overall, an extra week of due diligence is statistically associated with higher levels of ROA and
EBITDA/Sales over a three-year period after the investment date, even after controlling for
endogeneity and other things being equal. PE funds on average carry out seven weeks of due
diligence, and our estimates suggest that the effect of an extra four weeks of due diligence is on
average associated with a doubling of three-year ROA performance.
Our data also allow us to distinguish the role played by different agents implementing the
majority of due diligence. Our findings show that, when the majority of the due diligence is
performed internally by PE investment managers, a more pronounced role on firm performance
emerges. Surprisingly, when the majority of the due diligence is carried out externally by law
firms, accounting firms, and external strategic management consultants there is no significant
impact on target firm performance. This result suggests the existence of apparent agency costs
associated with external due diligence and emphasizes the need for more theoretical and
empirical research in this field. Our study contributes to the literature in several ways. First, it
helps advance the knowledge on the role and importance of due diligence. Second, it sheds some
light on the economic value of the time spent on due diligence, in terms of future performance of
investee firms. Third, it shows a greater efficacy of the due diligence implemented by PE fund
manager, highlighting the existence of agency costs associated to the delegation of such activity
(see, e.g., Wangerin 2015, Achleitner et al., 2014) where the time spent in implementing or discussing a certain
activity is considered a proxy of the importance of such activity.

8
This paper is organized as follows. Section 2 reviews the literature and develops testable
hypotheses. Section 3 discusses the institutional setting. Section 4 describes the employed
research methodology and the dataset, as well as provides representative tests and summary
statistics. Sections 5 and 6 present the univariate and multivariate tests, respectively. The last
section provides concluding remarks and suggestions for future research.
2. Related Literature and Testable Hypotheses
Our paper is related to three main streams of literature. The first stream pertains to the
literature directly related to due diligence in terms of the value of screening. The second stream
pertains to matching models. The third pertains to the private equity literature in terms of the
drivers of performance. In this section we briefly discuss each in turn.
Our paper is most closely related to Yung’s (2009) theoretical model of the tradeoffs
associated with undertaking costly due diligence. One of the main reasons underlying the
existence of private equity funds is that banks and other financial intermediaries offering more
traditional sources of capital are unable to perform, in a cost effective manner, the screening
required to undertake due diligence and monitor an investee that exhibits significant adverse
selection costs (Yung, 2009). Adverse selection costs of attracting excessively risky companies
are particularly pronounced for banks and other loan sources of capital (Stiglitz and Weiss, 1981).
As a result, private equity funds that are able to mitigate adverse selection by undertaking costly
due diligence are in a better position to finance such investee companies. Moreover, the investee
companies that are able to incur costly signals of quality are more likely to obtain funding. Costly
due diligence is typically more effective than costly signals of quality incurred by target
companies because the latter are cash constrained while investors are in a better position to incur
costs of due diligence (Yung, 2009).
9
How entrepreneurial firms and private equity funds form matches has been the subject of
recent scholarly research (Bengtsson and Hsu, 2012). Matching models more generally are useful
in this regard because they enable evaluation of selection effects distinguished from other effects
such as value-added. Sorenson (2007) uses general matching models to empirically study the
importance of matching and finds that matching is roughly twice as important as private equity
experience, in terms of explaining IPO exit outcomes (see Li et al., 2006 for a survey of these
models). Empirical studies in venture capital and private equity have examined both screening
and the drivers of returns. Kaplan and Stromberg (2004) study screening in terms of factors
considered in due diligence and provide examples of what led an investor to invest in the context
of venture capital deals. Drivers of returns are studied in numerous papers, such as Nahata
(2008), Cao and Lerner (2009), and Chaplinsky and Haushalter (2010).
Our context is quite different, since we study private equity deals and measure the extent
of due diligence and who exactly carried out the due diligence (internally, or externally by an
accounting firm, law firm, or consulting firm). Prior work has not studied the link between the
duration of due diligence effort and PE investee performance. Prior work in the context hedge
funds shows that due diligence is a source of alpha (Brown et al., 2008; 2009; 2012). Brown et
al., however, do not consider the extent of due diligence effort in terms of the time, but rather
examine materials related to registration statements. Our paper is different insofar as we measure
screening by the extent of due diligence, and relate this due diligence to performance measures
pertinent to the entrepreneurial firm, including ROA and EBITDA/Sales. Guided from the results
of Brown et al. (2008; 2012), we expect a positive relation between firm performance and due
diligence due to the improved decision making over whether to invest, and a better matching
between investor and entrepreneur.

10
H1: There is a positive but diminishing relation between weeks spent on due diligence and
investee performance due to improved screening and matching.
Also, we consider differences in this relationship for different parties that carry out due
diligence. Guided from the implications underlying Yung’s (2009) theoretical model, we expect
that internal due diligence is more effective than external due diligence for the purpose of the
matching function between entrepreneurs and their investors. The intuition is that external due
diligence service providers such as accounting firms, law firms and consulting firms face
information asymmetries associated with the skills of the private equity fund and its fund
managers, thereby leading to imperfect knowledge in matching with entrepreneurial teams. By
contrast, private equity fund managers face no information asymmetries about themselves, and
only face the same information asymmetries that external service providers face vis-à-vis the
entrepreneurial team. If the ability of the internal management team is the same as the ability of
the external consultants in mitigating the information asymmetries with the entrepreneurial team,
then the private equity fund managers will be more effective at finding a more suitable match
than the external consultants.
H2. When due diligence is primarily done internally (as opposed to primarily done externally
by a law firm, accounting firm, or consulting firm), there is a stronger link between due
diligence and performance due to the improved matching of the investor and the
entrepreneur.
In respect of H2, we note that different external service providers (accounting firms, law
firms, and consulting firms) may have different abilities in terms of mitigating information
asymmetries vis-à-vis the entrepreneurial firms. If so, we would expect different results
depending on who carries out the due diligence. We do not conjecture who is most effective in
advance of presenting the data, but we do carry out such tests in the analysis of the data.
11
These above hypotheses are tested for the first time in the subsequent sections. Our tests
are based on unique and detailed data that are described below in section 4. The data are based
on the Italian private equity industry, and as such in section 3 we first describe the institutional
context from which the data are derived.
3. Institutional Context Affecting the Italian PE Industry
Buyout transactions in Italy experienced a period of uncertain legitimacy and illegality
and only recently did they become outright legal (with the issuance of the new corporate
governance law, Legislative Decree 6/2003, applicable as of January 1, 2004; for details see
Zambelli, 2010).
Over the ‘90s, the legitimacy of leveraged buyouts were severely criticized and highly
debated, because LBOs were accused of involving a lack of full disclosure and contributing to the
weakening of the target firms. Leveraged buyout transactions even received an illegality
declaration by the Italian Supreme Court which prohibited these types of transactions reinforcing
the decisions of illegality made by various lower courts in prior years (see the Supreme Court
Decision 5503/2000). In October 2001, the Italian Parliament issued a new Bill of Law (Law
366/2001) announcing its intention of reconsidering the buyout legal framework and create a
safer harbor for such types of transactions (Article 7d). This Bill of Law 366/2001 was not
immediately applicable in Italy as it was solely an enabling act with which the Government
received the power of legalizing leveraged buyouts under specific guidelines. Even though this
Bill of Law provided investors with some hope for a more favorable LBO legal harbor, there was
no certainty regarding dates and outcomes of the new buyout reform. Moreover, in 2002, a new
criminal law reform (Legislative Decree 61/2002) became effective introducing new prosecutions
applicable to LBOs in the case of bankruptcy of the target firms. In January 1, 2004, a new law
12
came into force and leveraged buyouts were legalized under a set of conditions, especially with
reference to disclosure (see the article 2501 bis, of the Legislative Decree 6/2003, applicable as of
January 1, 2004). Contrary to what occurred in previous years, the new LBO reform reversed the
burden of proof: LBOs are now considered legal until proven otherwise (see Zambelli, 2010 for
more details). For the investment period spanning 1999–2006, it is possible to identify three
different sub-periods, associated with a number of changes in legal settings experienced by the
Italian PE industry. As shown in Cumming and Zambelli (2010), these legal changes significantly
affected the frequency and the governance structure of PE transactions in Italy and, as such, it is
plausible to expect that they may also affect the DD time and the type of DD performed by PE
funds.
In order to account for these legal changes we have created three different dummy
variables that are metaphorically labeled: “Dark period”, “Hope period”, and “Sun period” (as in
Cumming and Zambelli 2010, 2013). In our data, the “Dark period” identifies the period of
illegality and represents the time span from January 1999 to September 2001 over which the
legitimacy of leveraged buyouts was highly disputed and LBOs were deemed illegal by the
Italian Supreme Court (for a detailed discussion on the reasons and case law underlying the
illegality of LBOs in Italy, see Zambelli, 2010). The subsequent period, characterized by
Parliament’s announcement of rendering LBOs legal, is instead labeled the “Hope period”, and it
covers the October 2001–December 2003 time horizon. The period subsequent to January 2004
(and ending July 2006 in our data) identifies the time horizon over which LBOs became legal.
This particular period is labeled the “Sun period” (or period of legality) and represents the period
over which the legitimacy of LBO was ultimately clarified.
The different institutional settings provide useful instruments for our empirical analyses
below. We expect a weaker DD over the Dark period, since PE funds in that period are aimed at

13
minimizing the risk of a legal dispute with the target firm that could end up with an illegality
declaration. The threat of a legal dispute at that time may distort the investors’ incentives to
implement a thorough DD. Over the dark period, PE investors have obvious legal incentives to
not invest in hostile targets (as shown in Cumming and Zambelli 2010). Cumming and Zambelli
(2010) show the perils of a restrictive regulation. They show how the periods of illegality and
uncertain legality in Italy have increased the incentives for PE investors to implement a distorted
due diligence of target firms, because PE investors seem to be more motivated to screen firms
according to the level of agreeableness with their target management and minority shareholders
in the hopes of reducing the risk of a subsequent legal dispute that could turn into an illegality
declaration of the entire acquisition process.
4. Data
One of the major problems faced by scholars in PE financing is the lack of detailed public
data. Typically, PE organizations and their investee companies are privately held and are not
required to disclose detailed information on their investments, capital structure, governance, and
performance. The most commonly used public database on PE financing is Thomson Financial
Venture Economics, which is not helpful for our research purpose because it includes solely
standard and basic information on PE deals around the world, e.g., target firms, lead investors,
syndicated investors, invested and divested amounts, financing rounds, number of investors
involved, equity stake, investment location. Moreover, for countries outside the U.S. and Canada,
Thomson Financial Venture Economics only includes a small fraction of the PE deals carried out
in each year. With reference to the Italian PE market, a few industry datasets exist: a) the AIFI
Statistics Report, which disclose aggregate information of the private equity and venture capital
activity in Italy; b) the Venture Capital Monitor (VEM), which reports start-up deals; and c) the

14
Private Equity Monitor (PEM), which reports generic data on the private equity deals. Both VEM
and PEM datasets are collected by the Italian Venture Capital Association in association with the
Università Cattaneo di Castellanza. The above industry datasets include generic information on
the deals carried out in Italy and do not report information on deal structure, due diligence, and
investee performance. In the absence of high quality publicly available information on due
diligence and investment outcomes, we hand-collected a unique proprietary dataset gathered from
a number of primary and secondary sources.
Our primary source of information is represented by a three-stage survey of PE
investments carried out in Italy over the 1999-2006 time horizon and related divestments realized
from January 2000 to December 2012. For each survey, we followed the methodology discussed
in Cumming and Zambelli (2010, 2013). Our secondary sources of information are represented by
various publicly available data on Italian PE deals (e.g., PEM database), performance of private
firms (e.g., AIDA), market characteristics, fund websites, and economic press release, employed
to integrate, cross-check and validate the information collected through the survey instrument
(see the Appendix for detailed information on the secondary sources employed).
The data underlying this paper provide unique and new information on due diligence and
investee performance, among other things, that were specifically collected for the purpose of this
study and not available for use in earlier studies, as described herein. The entire data collection
procedure, the survey design and the associated response rates are summarized in Figure 1, and
described in greater detail in the Appendix.
[include Figure 1]
In the Appendix we also provide detailed information pertaining to the representativeness
of our ultimate dataset by thoroughly discussing different comparison tests. In particular, to
evaluate the representativeness of our ultimate sample, we compared our dataset with both AIFI
15
Statistics Reports and the Private Equity Monitor (PEM®
) database which includes generic
information on PE deals realized in Italy. We performed a number of comparison tests between
our sample and the PEM dataset (or AIFI database) with reference to various investee and
investment characteristics, such as: area and industry distribution of the target firms, yearly
distribution of PE investments, as well as exit distribution of the divestments occurred within the
2000-2012 period. Apart from a few exceptions, we did not find significant differences between
our sample and the AIFI and PEM databases (for more details on the representativeness tests, see
the Appendix, Table A.1, Panels B–G). The three-stage survey implementation and its validation
took considerable time and effort but it ultimately allowed us to create a unique dataset
containing detailed information on PE investment cycle, security design, deal structure, and
investment outcomes.
Our ultimate dataset covers approximately 85% of the buyout investors operating in Italy
over the 1999-2006 investment period (see the Appendix, Panel A), and comprises in depth
information on the divestments carried out by PE funds over the 2000-2012 time horizon. Our
dataset includes 178 investee firms acquired by 27 PE organizations over the period from 1999 to
2006 (second quarter). Among these 178 PE investments, 150 have been divested within the
period from January 2000 and December 2012 (for details on the yearly exit distribution over the
2000-2012 divestment period, see the Appendix, Table 1, Panel E).
In terms of types of exits employed by PE investors, our data show that the most
commonly used divestment route is represented by the trade sale (51%), followed by the
secondary sale (27%), IPO (9%), and buyback by the entrepreneur or founder (4%). This
evidence is consistent with Caselli et al. (2013). Our sample also includes a portion of write-offs
(10%), mostly associated with the exits that occurred after the global financial crisis (post August
2007 – 2009 period). In terms of type of transactions, our database includes 116 (65%) leveraged

16
buyouts and 62 (35%) expansion and replacement financing.4 With reference to investor
characteristics, our dataset includes the following types of PE funds: 4 (15%) are Italian bank-
subsidiaries, 12 (44%) are Italian independent closed-end funds, 3 (11%) are international bank
subsidiaries, and the remaining 8 PE firms (30%) are international independent limited partners.
In Table 1 we describe the dependent and explanatory variables included in our dataset
and provide related summary statistics. The main dependent variables are represented by firm
performance indicators (in terms of Return on Assets - ROA - and EBITDA to Sales ratio, as
defined and motivated in Footnote 2), which are measured in terms of percentage difference over
the first three years from the investment date. For example, the variable “Return on Assets three-
year difference” represents the percentage difference between the ROA achieved by the target
firm after three years (ROA 3) from the entrance of the PE investor (investment date) and the
ROA at the investment date (ROA 0). Similarly, the variable “Return on Assets two-tear
Difference” represents the percentage difference between the ROA achieved by the firm after two
years (ROA 2) from the investment date and the ROA at the time of the investment (ROA 0).
Table 1 provides statistics on due diligence efforts (measured in terms of time spent in
implementing the due diligence) and type of due diligence (primarily internal or external). PE
fund managers on average spend 7 weeks on due diligence prior to making a first investment in a
portfolio firm. Forty-seven percent of the PE funds in the sample perform the vast majority of the
due diligence internally. Sixty-six percent also employ consultants, 68% use lawyers, and 11%
use accountants in their due diligence efforts.5
4 Our database does not allow to distinguish repeated investments in the same firms. However, as highlighted by
Caselli et al. (2013), the standard investment strategy generally adopted in Italy by PE investors is “one firm – one
investment”, which implies that PE funds do not frequently employ stage financing. 5 It is worth noting that these percentages are not mutually exclusive. For example, a PE fund performing the
majority of DD internally can still delegate some part of DD to external specialized agents. In case of delegation, the
PE fund can employ different agents (e.g., specialized consultants and/or lawyers and/or accountants).
17
Table 1 also shows a wide set of other control variables aimed at capturing the impact of:
market conditions (i.e., market returns); investment characteristics (e.g., investment values, which
represents the transaction value and is used as a proxy for the investment size, and number of
syndicated investors for each financing rounds); characteristics of the target firms (i.e. location
and industry market to book values; and fund characteristics (i.e., fund-age and number of funds
managed by the PE organization before investing in the investee, considered as proxies for fund
manager experience; portfolio size, and fund-independency). Table 1 also includes variables that
capture the different legal settings during the 1999-2006 investment period in Italy, as explained
above in section 3.
[Insert Table 1 About Here]
5. Univariate Tests
Table 2 reports comparison of means and medians for our main performance measures
described in Table 1 (ROA differences, EBITDA/Sales differences). These performance
measures are reported in association with different due diligence time length (i.e., above or below
10 weeks6) and different types of due diligence (prevalent internal or external DD; consultants’
DD; legal DD; accountants’ DD). The comparison of means and median tests are reported for the
entire sample (178 transactions).
As reported in Table 2 (Panel A), the target firms for which PE investors spent more time
on due diligence (i.e., employing more than 10 weeks) show better performance, consistent with
our first hypothesis (H1), even though the differences are significant only in terms of three-year
ROA and EBITDA/Sales (the difference in the three-year ROA is significant at the 10% level for
both the mean and the median; the difference in the tree-year EBITDA/Sales is significant at the
1% level only for median). Similarly, PE transactions for which PE funds implemented the
6 We also considered different cut-off periods (e.g., the median) and results did not materially change.

18
majority of due diligence (Panel B) show better firm performance in terms of three-year
differences (e.g., the difference in the three-year ROA is significant at the 5% level for the
median, and the three-year EBIDTDA/Sale difference is significant at the 1% level for median
and 10% level for mean), consistent with our second hypothesis (H2). Panels C–E focus on the
performance associated with external due diligence: consultants’ due diligence (Panel C), legal
due diligence (Panel D), and accountants’ due diligence (Panel E). The transactions for which the
due diligence was delegated to consultancy firms (consultants’ due diligence) or legal firms (legal
due diligence), do not show significant differences in terms of performance. It is instead puzzling
to notice worse performance associated with the due diligence delegated to chartered accountants
(accountants’ due diligence). Only the three-year EBITDA/Sales ratios show a statistically
significant difference at the 5% level (in terms of mean).
In Panels F-G of Table 2 we report the comparison tests of means and medians of the time
spent on due diligence over the Dark period compared with the due diligence effort over the Hope
and Sun periods. As expected, the Dark period is characterized by a weaker due diligence
compared with the time spent on due diligence over the Hope and Sun periods and these
differences are statistically significant in terms of mean and median. As explained in Section 3,
over the Dark period the higher transaction risk regarding the possibility of entering into a legal
dispute with the investee may distort the due diligence process by pushing PE investors to focus
more on selecting non-hostile targets.
[Insert Table 2 About Here]
6. Multivariate Tests
In this section we present a number of multivariate tests for the impact of due diligence on
investment performance. We proceed in three steps. First, we present evidence on the
19
determinants of weeks of due diligence in subsection 6.1. Second, we present evidence of the
impact of due diligence on ROA and EBITDA/Sales in subsection 6.2. Third, we present
evidence from subsets of the data based on who carries out due diligence in subsection 6.3.
Fourth, in subsection 6.4, we present and discuss the results of a number of additional regression
specifications in order to evaluate and confirm the robustness of our main findings.
6.1. The Determinants of Due Diligence
Because the impact of due diligence on investment performance may be affected by
endogeneity, we first examine why due diligence is more intensive for some investments but not
others. In Table 3 we present correlation statistics across select variables in the data to examine
whether or not there are variables that are correlated with due diligence, but unrelated with ROA
and EBITDA/Sales. The data highlight the importance of three such variables: the Dark period
dummy variable, preplanned IPOs, and the number of funds managed by the PE firm at the time
of investment. These findings are in line with intuition, since in the Dark period PE investors
focused their attention primarily towards finding non-hostile target firms (Cumming and
Zambelli, 2010). Likewise, we expect that preplanned IPOs would impact the intensity of due
diligence since an investor would want to more intensively examine a target firm that is supposed
to hopefully undergo the scrutiny of a securities regulatory commission in an IPO (Megginson
and Weiss, 1991; Levis, 2011; Cumming and Johan, 2013).
Finally, in line with Nahata (2008) and Yung (2009), more experienced investors are
naturally more likely to be more diligent in their due diligence. More experienced investors also
certify the quality of the entrepreneurial firm upon exit, which can give rise to improvement in
performance upon sale of the company (Nahata, 2008). However, our performance measures are
not recorded at the time of sale of the company but instead within the 1-3 year period after the
20
initial investment (for ROA and EBITDA/Sales). More experience could lead to greater value
added in the 1-3 year time period; however, such investor value added is more likely to be
directed at long term performance to maximize the value of the investee firm at the time of its
sale, and not at any point in the interim period (the only reason to maximize value in the interim
period prior to exit would be to report inflated investment values to institutional investors, which
is something that more experienced investors would not do; see Cumming and Johan, 2013). In
short, there is no reason to expect that more experience will affect performance in this 1-3 year
time horizon other than through the channel of better and more due diligence. Therefore, since
there is no reason to necessarily expect a direct correlation between these three instruments and
our performance measures, and given these variables are not significantly correlated with our
performance measures, we identify them as candidate instruments for our subsequent analyses of
the relationship between due diligence and investee performance. Of course, instrumental
variable methods allow consistent estimation when the explanatory variables are correlated with
the error terms of a regression relationship, but the error term is unknown, so we investigated the
correlation with the dependent variable as a proxy. Our findings are quite robust to the use of
different instruments and exclusion of any one of these three instruments.
[Insert Table 3 About Here]
Table 4 presents regressions for the determinants of natural log of the number of weeks of
due diligence (in this Table we report first stage OLS estimates). We present two models: Model
1 includes fund dummy variables, year dummy variables, and double-clusters standard errors by
fund and year, while Model 2 excludes these dummy variables and does not cluster standard

21
errors.7 These alternative models are presented merely for a robustness check in our subsequent
analyses in Tables 5 and 6.
[Insert Table 4 About Here]
The regressions in Table 4 indicate two robust determinants of due diligence. First,
buyouts require less due diligence and this effect is significant in both Models 1 and 2 at the 5%
and 10% levels, respectively, which is expected since buyout transactions focus more on
established target companies with more readily available information and a longer track record.
Second, investors that run more funds spend more time on due diligence. This result may
be attributed to the value of experience that motivates PE investors to implement a more thorough
due diligence of new deals (in line with Nahata, 2008 and Yung, 2009), or to the constrained
attention due to a higher number of funds managed (in line with Jääskeläinen et al., 2006). We
note that this latter variable is an important one, and given that it is not correlated with investee
performance as discussed above it may represent a useful candidate instrumental variable.
Another useful candidate as an instrument is the location of the target firm (e.g., we considered
whether or not the target is located in the same region of the PE funds) or, alternatively, the
geographic proximity, measured in terms of kilometric distance, of the target to its investor (in
line with Tian, 2011). As robustness check purposes, we also considered other instruments (see
Section 6.4. for more details) and the results are not materially different from those reported in
this Section.
7 We also considered different specifications of Models 1-2, available upon request, and the results did not
materially change. For example, in Model 1, we excluded Dark and Hope variables and left the year dummies.
Moreover, in Models 1-2, we controlled for other fund characteristics (e.g., number of partners, number of
syndicated investors, international affiliation, lead investor status) and the results are in line with our expectations
and quite robust with the models reported in this paper.

22
Also, there is some evidence of less due diligence in the Dark period (Model 2) and this
effect is significant at the 5 % level, but this effect is not significant in Model 1 due to the
inclusion of the year dummy variables. Similarly there is evidence, significant at the 10% level,
of more due diligence in the Hope period, but this effect is not significant in Model 2. Preplanned
IPOs have more due diligence in Model 2, but this effect is not significant in Model 1 due to the
inclusion of the fund and year dummies. Model 1 highlights that older funds carry out more due
diligence, arguably due to more experience, and funds with larger portfolios per manager carry
out less due diligence due to a dilution in the allocation of their time and attention (in line with
the results highlighted by Hamdouni, 2011 and Jääskeläinen et al., 2006). However, these effects
are not significant in Model 2.
6.2. Relationship between Due Diligence and Investment Performance
Table 5 presents second stage estimates and includes three panels examining the impact of
due diligence on the subsequent 3-year ROA (Panel A), subsequent 3-year EBITDA/Sales (Panel
B), and subsequent 1- and 2-year ROA and EBITDA/Sales (Panel C). Panels A and B each
present 5 different regression models to check for robustness. We include three regressions with
the use of the due diligence fitted values from Model 1 in Table 4 (Models 3-5 in Panel A and
Models 8-10 in Panel B), one regression with the use of the fitted values from Model 2 in Table 4
(Model 6 in Panel A and Model 11 in Panel B), as well as one regression without fitted values
(i.e., no control for possible endogeneity), in Model 7 (Panel A) and Model 12 (Panel B). The
Panel C regressions for 1- and 2-year ROA and EBITDA/Sales use the Table 4 Model 1 fitted
values; for conciseness we do not report the same sets of models as in Panels A and B for 1- and
2-year ROA and EBITDA/Sales since the results were not materially different. Alternative
specifications are available on request.
23
[Insert Table 5 About Here]
Our data consistently indicate that the number of weeks of due diligence is consistently
associated with stronger 3-year ROA and EBITDA/Sales performance, consistent with H1. We
model the effect with the use of logs to account for diminishing changes in returns associated
with each extra week of due diligence. The effect is statistically significant, at least at the 10%
level in each of the models in Panels A and B. The most conservative economic significance is
obtained from the regressions without the endogeneity controls (Models 7 and 12). In those
estimates, a 1-standard deviation increase in the weeks of due diligence from the average due
diligence level of 8 weeks gives rise to a 197.44% increase in three-year ROA relative to the
average three-year ROA in the sample (and this effect is smaller at 113.51% if one starts from the
maximum level of weeks of due diligence of 15 weeks, and larger at 533.95% if one starts from
the minimum level of due diligence of 2 weeks). Put differently, an extra four weeks of due
diligence is on average associated with a doubling of three-year ROA performance.
The effect of due diligence on EBITDA/Sales is similarly consistent in all of the
regression models, and the economic significance is most conservative in the models that do not
correct for endogeneity. In those estimates, a 1-standard deviation increase in the weeks of due
diligence from the average level of due diligence of 8 weeks gives rise to a 52.07% increase in
three-year EBITDA/Sales relative to the average three-year EBITDA/Sales in the sample (and
this effect is smaller at 29.94% if one starts from the maximum level of weeks of due diligence of
15 weeks, and larger at 140.82% if one starts from the minimum level of due diligence of 2
weeks).
Panel C of Table 5 shows that the impact of due diligence on EBITDA/Sales ratio is
significant for the one- and two-years after investment, but the economic significance is higher

24
with each year up to the three-year period after investment for the comparable model (Model 8)
in Panel B. Due diligence, by contrast, is statistically unrelated to ROA in the one- and two-year
period after investment.
The large economic significance and consistent statistical significance of the impact of
due diligence in Panels A and B is contrasted by the weak economic significance and inconsistent
statistical significance of all of the control variables.
Additionally, for robustness purposes, we have considered a number of different
specifications by including, in the second stage, variables that may be related to the value of
experience of PE investors and, as such, may have an impact on performance, e.g.: number of
funds managed, or capital under managed, or portfolio size. We have also considered
specifications controlling for the value added capacity of PE investors. Additionally, we have
considered new instruments, e.g., the kilometric distance between the target and the PE investor
(in line with Tian, 2011) or the time spent in performing the DD in other target firms belonging to
the same industry and acquired in the same year. Results remain robust to the inclusion or
exclusions of the above variables and do not materially change the main findings discussed in this
Section (the robustness checks that we have performed are explained in greater detail in the
Section 6.4.).
6.3. The Role of Different Agents Carrying Out Due Diligence
In Table 6 we present second stage regressions for various sample-subsets according to
the specific agent performing the majority of due diligence (e.g., the fund managers or external
firms). The Models in Table 6 are comparable to the Models 5 and 10 in Table 5. The regressions
highlight a more pronounced impact on performance associated with the due diligence carried out
internally by the PE investment managers themselves, consistent with H2. When the majority of
25
due diligence is performed externally by law firms, accounting firms and/or consulting firms
there is an insignificant relation between weeks of due diligence and performance. These findings
are consistent with Table 2 (Panel A). For example, when due diligence is primarily performed by
accountants, on average the performances of investee companies are worse compared to the
performance of the other transactions for which no accounting firm was hired to perform the due
diligence, consistent with Models 31 and 32 in Table 6.
The evidence provided in Table 6 highlights the importance for PE firms to undertake an
internal due diligence. Our results highlight the existence of apparent agency costs associated
with the due diligence performed externally by law firms, accounting firms, and consultancy
firms, and call for future theoretical and empirical research to investigate the mechanisms to
mitigate agency costs incurred in the delegation of due diligence.
[Insert Table 6 About Here]
6.4. Additional Robustness Checks
In the course of our analyses we carried out a number of preliminary robustness checks.
First, we considered longer performance horizons, including four and five years. The findings
were generally consistent, but to a much greater degree influenced by outliers that are more than
likely unanticipated and unrelated to due diligence. Hence, we focus on 3-year performance.
Second, we considered performance measures provided by the fund managers themselves versus
financial statement information obtained from official sources filed in accordance with the Italian
accounting rules. Our performance measures reported herein are those based on the AIDA
database by Bureau Van Dijk, and we did not find major discrepancies with self-reporting in our
surveys. Third, we considered other explanatory variables including but not limited to specific
contractual terms described in Cumming and Zambelli (2013). The findings are robust (explicitly

26
shown in the Online Appendices 1 and 2 shown at the back of this paper). We note due diligence
is weakly positively correlated to more detailed contracts in our data, which in part is consistent
with the findings herein. We do not include these contractual analyses in the results reported
herein since the causal link between contracts and due diligence is in need of further empirical
testing with other datasets. Fourth, in order to evaluate whether the length of DD is affected by
the involvement of external actors, we have run a number of specifications on the determinant of
DD, similar to those reported in Models 1 and 2 (Table 4), by including an additional variable to
control for the impact of external agents performing the due diligence. Also, we have considered
other control variables, such as the size of the investee firm and the control power of the PE
investor (see Section 6.4.1. for details). We found no significant correlation between the time
spent on DD and the involvement of external agents performing the due diligence process. For
brevity reasons we did not report these results because they do not materially change the main
findings discussed in the previous sections and presented in Table 4 (they are available upon
request). Fifth, we controlled for buyouts versus expansion deals in all of our analyses. The PE
funds in the sample do both types of deals, and hence we include them all in the sample. The
results are robust to excluding the expansion deals, although not robust to excluding the buyout
deals as most of the deals are buyout deals. Furthermore, we run a number of different second-
stage regression specifications in order to control for the cost of debt and the debt-to-equity ratio
and results are in line with the main findings of Tables 5-6 discussed in the paper with reference
to the impact on performance of DD duration and internal DD.
To further reinforce the robustness of our main results, we carried out a number of
additional analyses and tests, as summarized below:
1. Isolating the effect of due diligence on performance:

27
a. Control for the value added capacity of PE investors;
b. Control for both the value added capacity of PE investors and size of Investee
Firms;
2. Treatment Effect Model (similar to Heckman selection model);
3. Two-stage IV regression for the determinants of internal versus external due diligence;
4. Propensity Score Matching models, comparing the impact on performance of longer and
shorter DD, as well as the impact on performance of internal and external DD;
5. Inclusion or exclusion of different instruments; adoption of a new instrument measuring
the geographic distance between PE funds and their target companies (“distance km”);
adoption of a new instrument created by considering the average time spent on
implementing the due diligence in other target firms active in the same industry and
acquired in the same year (“dd_weeks_OTHER”; and “ln_dd_weeks_OTHER”);
6. Inclusion of other performance measures: Return on Equity investment (ROE) and IPO
exit outcomes.
7. Inclusion of performance measures (ROA, ROE, and EBITDA/Sales) recorded at the
time of exit, and the time of investment.
In the following sub-sections we report the details of the robustness checks mentioned above.
6.4.1. Isolating the Effect of Due Diligence and Controlling for the Size of Target Firms
As highlighted in the literature, private equity fund managers are actively involved in the
governance and management of their portfolio companies (see, e.g., Sorensen, 2007) and the
screening process may depends on the size of the company (Yung, 2009). In order to isolate the
impact of DD on investees performance, we performed a number of robustness tests aimed at
considering the value added capacity of the PE investors, as well as the size of their target firms
28
(see Tables 7-8). Our results remain robust to the inclusion of these additional control variables.
In particular, consistent with the models reported in Tables 4-5, in Table 7 we show first-stage
estimates related to the determinants of due diligence and in Table 8 (Panels A, B and C) we
report second-stage estimates on the impact of the due diligence on investee performance. In all
Models shown in Tables 7 and 8, we included a variable that is aimed at capturing the level of
involvement and control power played by the PE fund manager. In line with Cumming and Johan
(2013), as a proxy for the PE involvement, we have considered an index given by the sum of veto
and control rights held by the PE investors (see Table 1 for more details on the specific control
and veto rights included). Among the control rights, we have considered the right to choose and
substitute the CEO, the right to add board members, the right to retain board control, as well as
other exit rights, such as the first refusal in sale, and IPO registration rights. Among the veto
rights, we have considered the veto power of the PE investor over various decisions, such as the
issuance of equity, control changes, asset purchase or asset sale.8 We have included the veto
rights because they allow the PE fund manager to influence the outcome of a number of
important business decisions. In Table 7 we show the first stage estimates, while in Table 8 we
report the second stage estimates of the impact of due diligence on investee performance, after
controlling for the PE involvement and the size of the target firms (in terms of log of the number
of employees).9 The results reported in Tables 7-8 are consistent with our main findings discussed
in the previous sections and further reinforce the results reported in Tables 4-5.10
[Insert Tables 7-8 here]
8 For a recent review of the control and veto rights held by PE investors, see Zambelli (2014).
9 The number of employees was not available for all companies.
10 In Table 8 we show the impact of due diligence effort on investee performance, after controlling for the PE
involvement and value added capacity. We also controlled for the size of the target firms (in terms of number of
employees). The number of employees was not available for all companies. For space reasons, we decided to not
include the additional robustness checks that control for the different size of target firms given the fact that the results
from these additional robustness tests do not materially change the main findings discussed in the paper. Results are
available upon request.
29
6.4.2. Considering Treatment Effect Models for potential sample selection biases
The decision of performing the majority of DD internally (rather than externally) is a
choice variable and this may raise sample selection biases.
In order to address the above issues, we have employed a treatment effect method (similar
to a Heckman selection model)11
by estimating, in the first step, the probability of having an
internal due diligence (as a function of investee location and fund characteristics, such as
portfolio size and legal structure) and, in the second step, the related outcomes in terms of impact
on firm performance, given the results in the first step. In particular, in Table 9 we report the
second stage estimates of the treatment effect model for the decision of implementing an internal
DD (for space reasons, the first stage estimates for the selection equation are not included). In
Models 1, 2 and 3 we show the impact of DD on ROA 3Y, 2Y, and 1Y differences; in Models 4,
5 and 6 we show the impact of DD on EBTDA/sales 3Y, 2Y, and 1Y differences, respectively. It
is worth noting that in the first-step we have considered specifications with only one variable
(e.g., the geographic distance between the PE fund and target) to keep the model parsimonious, as
well as specifications with additional variables related to fund characteristics (e.g., lead investor,
capital under management, fund legal structure, and number of portfolio firms). Given the recent
evidence on the impact of spatial proximity on VC behavior (see, e.g., Tian, 2011) and contract
design (e.g., Hirsch and Sharifzadeh, 2009; Cumming and Johan, 2013), it is reasonable to expect
that the geographic distance between the fund and the target may affect the type of due diligence
(internal versus external).12
We have also considered specifications with additional selection
11 The model is a treatment model (similar to a Heckman model) with the “treatreg” function in Stata. A nice feature
of the treatreg function is that it does not have the same restriction as the Heckman regression to have all of the same
variables in the first step regression, plus extra variables. 12
In order to consider the recent evidence (see, e.g., Tian, 2011) on the positive impact of geographic proximity on
the monitoring of target firms and their performance, in our treatment effect model the variable related to spatial
proximity has been included both in the selection equation and in the outcome equation. In our data, the geographic

30
criteria related to fund characteristics (e.g., capital under management) to take into account the
evidence shown in Brown et al. (2008). The second-step results are extremely similar to what is
reported in the paper without the selection equation. Likewise, the findings remain robust to the
inclusion of one or more selection criteria to the first-step regression equation (for details, see
Table 9).
[Insert Table 9 here]
In order to take into account potential selection biases regarding the internal versus
external due diligence, we ran additional robustness tests (not reported in the paper for space
reasons, but available upon request). For example, we have considered two-step IV methods for
the determinants of internal versus external due diligence, with the use of instruments (instead of
a treatreg specification) as in the case discussed for the number of weeks of due diligence. The
results do not materially change. In particular, we considered two-stage IV regressions by
estimating, in the first step, the determinants of the internal versus external due diligence and, in
the second stage, the impact on performance of the internal DD predicted in the first step. In the
second stage, we have also considered the predicted value of the due diligence time, driven from
Models 1 and 2 reported in Table 4 of the paper. The first step regression on the determinants of
internal due diligence shows (as the most robust finding) that bigger funds (e.g., funds with larger
portfolio sizes per manager) are more likely to delegate the majority of the due diligence to
external agents, and this is in line with the evidence shown by Brown et al. (2008). The results of
the first-step estimates do not materially change the main findings of our study. Likewise, the
second-step estimates always highlight a positive and significant relationship between due
diligence time and firm performance. The fitted values for the internal due diligence included in
proximity is significant only in the first step-regression (as a determinant of internal due diligence) but not in the
second step.

31
the second step are statistically insignificant in all the specifications included in Table 5 Panels A,
B and C, regardless of the specification adopted in the first step. Similarly, the simple variable for
internal versus external due diligence (without fitted values) is statistically insignificant in Table
5, and does not change the inferences drawn regarding the weeks of due diligence. Hence, we do
not include such a variable in the reported results to keep the models as parsimonious as possible
(the results are available upon request).
Ultimately, as an additional robustness check, we considered Propensity Score Matching
Models related to the impact of long due diligence (i.e., longer than 10 weeks) versus short due
diligence. As shown in Table 10, the Average Treatment Effect (ATE) of longer due diligence is
positive and significant, in line with the main findings discussed in the paper.13
[Insert Table 10 here]
6.4.3. Considering other Performance Measures
For robustness check purposes, we have considered other performance measures, such as
IRR, Return on Equity (ROE), and IPO exit outcomes.
Regarding IRRs, however, we have information only for a subsample in our data, as many
of the deals were not exited at the time of data collection and, at the time of our survey on
investee performance, the IRR was not provided (or not publicly available) for a number of exited
investments. Therefore, we are effectively restricted to using ROA and EBITDA/Sales which
were confirmed by AIDA database and auditor reports in order to use the full sample (and our
choice is in line with Cao, 2013 and Richard et al., 2009). It is worth noting that different
measures of operating profitability can be adopted. For example, Florin (2005) employs the EBIT
13
We have also considered Propensity Matching Models with reference to the internal versus external due diligence
and we obtained results in line with the main findings discussed in the paper.

32
to Sales ratio; Kabir and Roosenboom (2003) employ both the EBIT to Sales ratio and the
EBITDA to Sales ratio. However, the latter ratio is more appropriate to assess the operating profit
margin from a strategic and managerial point of view, as the EBITDA represents the portion of
firm’s operating profit that is not affected by depreciation, amortization, interest and taxes.
Moreover, since the EBITDA is adjusted to remove the impact of noncash expenses (e.g.,
depreciation and amortization), the profit margin expressed in terms of EBITDA/Sales is also
more appropriate to better evaluate the firm efficiency (see, e.g., Richard et al., 2009).
Given the relevant number of missing values related to IRRs, as an approximation, for
robustness check purposes we have collected additional information from AIDA database on the
Return on Equity (ROE) of all target firms included in our dataset and estimated the impact of
DD duration on ROE. Additionally, we have considered other performance measures represented
by the IPO exit outcomes (collected from our third survey and confirmed by the information
publicly available in “Borsa Italiana”). Results are shown in Table 11 (Panel A). Ultimately, in
Panel B of Table 11, we have considered the investee performance at the time of exit (instead of a
three-year period). Since the decision to exit is a non-random event, we also included
specifications with a treatment of potential sample selection for the exit decision by predicting, in
the first step, the probability of an exit (as a function of the investment year) and estimating, in
the second step, the outcome from that exit (in terms of investee performance).14
The results
reported in Table 11 are in line with the main findings provided in the paper. A thorough DD is
14
In the second stage, we have considered the predicted value of the due diligence time, driven from Models 1 and 2
reported in Table 4 of the paper.
33
associated with higher IPO exit outcomes, higher ROE, as well as higher firm performance at the
time of exit.15
[Insert Table 11, Panels A, B]
6.4.4. Different Instruments
For robustness check purposes, we have considered other specifications such as excluding
year dummy variables in Models 3 and 4 while leaving the dark and hope dummies, and the
effect of due diligence remains highly significant. Additionally, we considered different second-
stage regression specifications, by including in the second stage variables related to investor
characteristics (e.g., fund age, capital under management and number of funds managed by the
PE organization at the time of the first investment in the target firm). We ran a number of
different specifications and overall the impact of due diligence effort on firm performance
remains highly significant. The second stage estimates reported in Panel A of Table 12 are in line
with the findings discussed in the paper and presented in Table 5. Overall, our main findings are
robust to the inclusion or exclusion of the above control variables (see Table 12 Panel A).
We further included other possible instruments to control for endogeneity and our findings
are quite robust to the inclusion and exclusion of different instruments. For example, we ran the
regression specifications shown in Tables 4-5 by including a new instrument based on the
kilometric distance between the fund and the target company, in line with Tian (2011). The
results from the first and second stage regressions are consistent with the main findings discussed
15
It is worth noting that, for robustness check purposes, we also considered the impact of DD on performance at the
time of first investment. The findings do not show significantly different results and the external DD is associated
with worse firm performance. Ultimately, with reference to the internal versus external DD, we have also considered
the role of PE size in terms of capital under management, number of firms included in the portfolio and number of
funds managed by PE investors. The results are consistent with our main findings discussed in the paper and internal
DD remains associated with better firm performance (both in terms of ROA three-year difference and EBITDA/Sales
three-year difference).

34
in the paper (see Table 12, Panel B). Ultimately, we considered the adoption of an alternative new
instrument given by the time spent on performing the due diligence in other target firms
belonging to the same industry and acquired in the same year (see Table 12, Panel C). The
impact of due diligence effort on firm performance remains relevant and significant and the main
finding discussed in the paper are confirmed.
[Insert Table 12, Panels A – B - C]
7. Conclusions
In this paper we have investigated the efficacy of due diligence and quantified the time-
value of due diligence in the context of private equity (PE) investments. We have shown a link
between the time spent on due diligence and the future performance of investee firms, measured
in terms of changes in the return on assets (ROA) and EBITDA/sales ratios over the first three
years of the investment.
Very few academic studies, if any, have analyzed the economic value of due diligence and
its crucial role in predicting better future performance of the investee firms. Based on a novel and
unique hand-collected dataset comprising the majority of PE investors in Italy, our results show
that due diligence enables selection of better investees in the portfolio and strongly support the
view that a diligent due diligence is associated with improved firm performance. Moreover, our
data show that the due diligence carried out internally by fund managers has a more pronounced
impact on performance. No significant impact emerges with reference to the due diligence
performed by external agents, i.e., accounting firms, law firms or consultants.
Our study reinforces the evidence highlighted by Brown et al. (2008) who argue that due
diligence is a source of alpha for hedge funds. Likewise, the due diligence has a crucial role and
a high economic value in the context of PE.

35
Overall, our findings contribute to advance the knowledge on the role of the selection and
evaluation process underlying the acquisition of a target firm. One important implication for PE
investors and advisors derived from our study is that, in a PE setting, the time spent on due
diligence is a source of value in terms of observed better future performance of investee firms. A
second important implication for PE fund managers is that the time spent on due diligence is
especially worth it when the majority of that time is spent in implementing a DD internally.
Ultimately, our findings suggest the existence of apparent agency costs underlying the due
diligence delegated to external agents. More theoretical and empirical research is needed in order
to enrich the knowledge on agency costs associated with the delegation of due diligence,
especially in the context of PE where the opportunity cost of time is enormous and investors may
be tempted to rush the evaluation process underlying the due diligence or to delegate it outside in
order to allocate more attention to managing and adding value to their existing portfolio firms.
Further research could likewise examine bargaining over contractual terms during the due
diligence process to better understand how contracts are negotiated in practice and their impact
on performance.
References
Achleitner, A.K., Heister, P., Spiess-Knafl, W. (2014). What really matters: a theoretical model
for the assessment of social enterprise performance. In: Phan, P., Kickul, J., Bacq, S.,
Nordqvist, M. (2014). Theory and Empirical Research in Social Entrepreneurship. Edward
Elgar, Northampton, Massachusetts (USA).
Alemany, L., Villanueva, J. (2014). Early-Stage Investors’ Criteria and New Venture Financial
Performance: Are They Related? Available at SSRN
Altintig, A., Chiu, H.-H., Goktan, M.S., 2013. How Does Uncertainty Resolution Affect VC
Syndication? Financial Management 42, 611–646,
Baum, J., Silverman, B., 2004. Picking Winners or Building Them? Alliance, Intellectual, and Human

36
Capital as Selection Criteria in Venture Financing and Performance of Biotechnology Startups.
Journal of Business Venturing 19, 411–436.
Bengtsson, O., Hsu, D., 2012. How Do Venture Capital Partners Match with Startup Founders?
Working Paper, Lund University and University of Pennsylvania.
Brau, J.C., Fawcett, S.E., 2006. Initial public offerings: an analysis of theory and practice. Journal
of Finance 61, 399-436.
Brown, S., Fraser, T., Liang, B., 2008. Hedge Fund Due Diligence: A Source of Alpha in a
Hedge Fund Portfolio Strategy, Journal of Investment Management 6, 23-33.
Brown, S., Goetzmann, W., Liang, B., Schwarz, C., 2009. Estimating Operational Risk for Hedge
Funds: The ω-Score, with, Financial Analysts Journal 65, 43-53.
Brown, S., Goetzmann, W., Liang, B., Schwarz, C., 2012. Trust and Delegation, Journal of
Financial Economics 103, 221-234.
Camp, J.J., 2002. Venture Capital Due Diligence. Wiley: New York.
Capizzi, V., 2004. The Constitution of a Venture Capital Company: The Case of Italian Closed-
End Funds. In: Caselli S., Gatti S., (Eds.), Venture Capital. A Euro-System Approach.
Springer-Verlag: Berlin.
Cao, J., Lerner, J., 2009. The performance of reverse leveraged buyouts. Journal of Financial
Economics 91, 139-157.
Casamatta, C., 2003. Financing and Advising: Optimal Financial Contracts with Venture
Capitalists. Journal of Finance 58, 2059-2085.
Casamatta, C., Haritchabalet, C., 2007. Experience, screening and syndication in venture capital
investments, Journal of Financial Intermediation, 16, 368-398.
Caselli, S., Garcia-Appendini, E., Ippolito, F., 2013. Contracts and returns in private equity
investments, Journal of Financial Intermediation, 22, 201-217.
Cao, J., 2013. Private Equity, RLBOs, and IPO Performance. In: Levis, M., Vismara, S., 2013.
Handbook of Research on IPOs. Cheltenham: Edward Elgar.
Chaplinsky, S., Haushalter, D. 2010. Financing Under Extreme Risk: Contract Terms and Returns
to Private Investments in Public Equity. Review of Financial Studies 23, 2789-2820.
Chaplinsky, S., Gupta-Mukherjee, S., 2009. The Rise of M&A Exits in Venture Capital:
Implications for Capital Recovery, Darden Working Paper.

37
Cumming, D., Johan, S., 2013. Venture Capital and Private Equity Contracting: An International
Perspective. Second Edition. Academic Press: Burlington, M.A.
Cumming, D., Walz, U., 2010. “Private Equity Returns and Disclosure around the World. Journal
of International Business Studies 41, 727-754.
Cumming, D., Zambelli, S., 2010. Illegal Buyouts. Journal of Banking and Finance 34, 441-456.
Cumming, D., Zambelli, S., 2013. Private Equity Performance under Extreme Regulation.
Journal of Banking and Finance 37, 1508-1523.
Das, S.R., H. Jo, Y. Kim, 2010. Polishing diamonds in the rough: The sources of syndicated
venture performance, Journal of Financial Intermediation, 20, 199-230.
De Leeuw, E.D., 2005. To mix or not to mix data collection modes in surveys. The Journal of
Official Statistics 21, 233-255.
Dillman, D., 2000. Mail and Internet surveys: The Tailored Design Method. John Wiley: NY.
Dillman, D., Phelps, G., Tortora, R., Swift, K., Kohrell, J., Berck, J., 2009. Response rate and
measurement differences in mixed mode surveys using mail, telephone, interactive voice
response and the Internet. Social Science Research 38, 1–18.
Florin, J., 2005. Is venture capital worth it? Effects on firm performance and founder returns.
Journal of Business Venturing 20, 113–135.
Gompers, P., Lerner, J., 1999. The Venture Capital Cycle, MIT Press: Cambridge, MA.
Gorman, M, Sahlman, W., 1989. What Do Venture Capitalists Do? Journal of Business
Venturing 4, 231-248.
Graham, J.R., Harvey, C.R., 2001. The Theory and Practice of Corporate Finance: Evidence from
the Field. Journal of Financial Economics 60, 187–243.
Hamdouni, A., 2011. Venture Capitalist's Monitoring through Board Membership and the
Performance of IPO Firms: Empirical Evidence from France. International Research Journal
of Finance and Economics 65, 124-133.
Heed, A., 2010. Regulation of Private Equity. Journal of Banking Regulation 12, 24-47.
Hirsch, J., Sharifzadeh A., 2009. Geography and Contract Design in the Venture Capital Industry.
RICAFE working paper / London School of Economics and Political Science.
Inderst, R., Müller, H., 2004. The Effects of Capital Market Characteristics on the Value of Start-
Up Firms. Journal of Financial Economics 72, 319-356.

38
Kabir, R., Roosenboom, P., 2003. Can the stock market anticipate future operating performance?
Evidence from equity rights issues. Journal of Corporate Finance 9, 93–113.
Korteweg, A., Sorensen, M., 2014. Skill and Luck in Private Equity Performance. Working
paper available from SSRN.
Ivanov, V., Xie, F., 2010. Do Corporate Venture Capitalists Add Value to Start-Up Firms?
Evidence from IPOs and Acquisitions of VC-Backed Companies, Financial Management
39, 129–152.
Jääskeläinen, M., Maula, M., Seppä, T., 2006. Allocation of attention to portfolio companies and
the performance of venture capital firms. Entrepreneurship Theory & Practice 30, 185-206.
Kanniainen, V., Keuschnigg, C. 2003. The optimal portfolio of start-up firms in venture capital
finance, Journal of Corporate Finance, 9, 521-534.
Kanniainen, V., Keuschnigg, C. 2004. Start-up investment with scarce venture capital support,
Journal of Banking and Finance 28, 1935-1959.
Knill, A., 2009. Should venture capitalists put all their eggs in one basket? Diversification versus
pure play strategies in venture capital. Financial Management 38, 441-486.
Levis, M., 2011. The Performance of Private Equity-Backed IPOs, Financial Management 40,
253–277.
Li, K., Prabhala, N.R., 2006. Self-Selection Models in Corporate Finance, in Espen Eckbo, ed.:
Handbook of Corporate Finance: Empirical Corporate Finance, Elsevier: North-Holland.
Masulis, R.W., Nahata, R., 2009. Financial contracting with strategic investors: Evidence from
corporate venture capital backed IPOs, Journal of Financial Intermediation, 18, 599-631.
Megginson, W., Weiss, K., 1991. Venture Capitalist Certification in Initial Public Offerings.
Journal of Finance 46, 879-903.
Nahata, R., 2008. Venture Capital Reputation and Investment Performance. Journal of Financial
Economics 90, 127−151.
Nahata, R., Hazarika, S., Tandon, K., 2013. Success in global venture capital investing: Do
institutional and cultural differences matter? Journal of Financial and Quantitative
Analysis, forthcoming.
Nielsen, K., 2008. Institutional investors and private equity. Review of Finance 12, 185-219.
Nielsen, K., 2010. The Return to Direct Investment in Private Firms: New Evidence on the
Private Equity Premium Puzzle. European Financial Management 17, 436-463.

39
Richard, P.J., Devinney, T.M., Yip, G.S., Johnson, G., 2009. Measuring Organizational
Performance: Towards Methodological Best Practice. Journal of Management 35, 718-804.
Sevilir, M., 2010. Human capital investment, new firm creation and venture capital, Journal of
Financial Intermediation, 19, 483-508.
Sorensen, M., 2007. How Smart is Smart Money? A Two-Sided Matching Model of Venture
Capital. Journal of Finance 62, 2725-2762.
Stiglitz, J., Weiss, A., 1981. Credit rationing in markets with imperfect information, American
Economic Review 73, 393-409.
Tian, X., 2011, The Causes and Consequences of Venture Capital Stage Financing, Journal of
Financial Economics 101, 132-159.
Wang, L., Wang, S., 2011a. Cross-Border Venture Capital Performance: Evidence from China.
Pacific-Basin Finance Journal 19, 71-97.
Wang, L., Wang, S., 2012. Economic Freedom and Cross-Border Venture Capital Performance.
Journal of Empirical Finance 19, 26-50.
Wangerin D., 2015. Do Fools Rush In? The Importance of Due Diligence in M&A Transactions.
Working Paper, Michigan State University.
Yung, C., 2009. Entrepreneurial Financing and Costly Due Diligence. Financial Review 44, 137-
149.
Zambelli, S., 2010. Private Equity and Leveraged Buyouts in Italy. To Prohibit or not to Prohibit,
that is the Question. In: Cumming, D., (Ed.), Private Equity. Fund Types, Risks and
Returns, and Regulation. Wiley: Hoboken, New Jersey, 463–510.
Zambelli, S., 2014. ‘If the Facts don’t fit the Theory...’ The Security Design Puzzle in Venture
Finance. International Journal of Management Reviews 16, 500-520.

40
Table 1. Definitions of Variables and Summary Statistics
This table defines the variables and provides summary statistics. The full sample comprises of 178 observations, of which 116 are leveraged
buyouts and 63 expansion financing deals. Summary statistics are provided for the entire sample. The data derive from the survey and interviews
with the PE investors carried out in 2005, as described in the body of the paper.
Variable Definition
Number of
Observations Mean Median
Standard
Deviation Min Max
Dependent Variables
Firm Performance Indicators
Return on Asset
(Roa) Three-Year
Difference
Difference (in %) between Roa at the third year after
the investment and Roa at Investment Date. Source:
AIDA database by Bureau Van Dijk 178 0.77 0.86 13.27 -71.16 55.80
Ebitda/Sales Three-
Year Difference
Difference between Ebitda/Sales at the third year
after the investment and Ebitda/Sales at Investment
Date. Source: AIDA database by Bureau Van Dijk 178 2.65 1.87 12.12 -31.02 73.39
Return on Asset
Two-Year Difference
Difference (in %) between the ROA at the second
year after the investment and the Roa at the
investment date. Source: AIDA database by Bureau
Van Dijk 178 -0.27 0.10 9.90 -71 34.9
Ebitda/Sales Two-Year Difference
Difference between Ebitda/Sales at the second year after the investment and Ebitda/Sales at the
investment date. Source: AIDA database by Bureau
Van Dijk 178 1.58 1.38 8.62 -31.02 65.08
Return on Asset
One-Year Difference
Difference (in %) between the ROA at the first year
after the investment and the ROA at the investment
date. Source: AIDA database by Bureau Van Dijk 178 0.73 0.21 7.59 -38.31 38.52
Ebitda/Sales One-
Year Difference
Difference between Ebitda/Sales at the first year after
the investment and Ebitda/Sales at the investment
date. Source: AIDA database by Bureau Van Dijk 178 1.15 0.82 5.98 -18.87 53.65
Key-Explanatory Variables
Due Diligence Length and Types
Ln (Number of
Weeks of Due
Diligence)
Natural Log. of number of weeks actively spent on
due diligence. Source: Author’s surveys 178 1.93 1.95 0.54 0.69 2.71
Prevalent Internal
Fund Due Diligence
A dummy variable equal to 1 if the PE investor spent
more than half of the time doing due diligence checks
themselves as opposed to using consultants, lawyers, and/or accountants. Source: Author’s surveys 178 0.47 0 0.50 0 1
Consultants’ Due
Diligence
A dummy variable equal to 1 if the PE delegated the
majority of due diligence to a consultancy firm
specialized in audit, tax, and advisory services (e.g.,
KPMG). Source: Author’s surveys 178 0.66 1 0.48 0 1
Legal Due Diligence
A dummy variable equal to 1 if a legal due diligence
was performed by a professional lawyer. Source:
Author’s surveys 178 0.68 1 0.47 0 1
Accountants’ Due
Diligence
A dummy variable equal to 1 if the PE investor
delegated the majority of due diligence to a
professional chartered accountant. Source: Author’s surveys 178 0.11 0 0.31 0 1
Other Control Variables
Market Conditions
12-Month Stock
Market Return
The return on the stock market for the 3–12 month
horizon preceding the investment date. Source:
MSCI 178 0.08 0.14 0.17 -0.32 0.41
MSCI Annual Return
over Investment
Horizon
The annualized public equities return for Italy over
the contemporaneous investment horizon. Source:
MSCI 178 -0.05 -0.15 0.33 -0.57 0.72
Legal Settings (Source: Cumming and Zambelli, 2010, 2013)
Dark Period
A dummy variable equal to 1 for the “Dark” period
during which leveraged buyouts are illegal (January
1999– September 2001 for the transactions in the
data set). 178 0.21 0.00 0.41 0.00 1.00

41
Hope Period
A dummy variable equal to 1 for the “Hope” period
during which it is announced by the Italian
Parliament that buyouts will soon be legal (October
2001 – December 2003). 178 0.31 0.00 0.47 0.00 1.00
Sun Period
A dummy variable equal to 1 for the “Sun” period during which buyouts are legal (January 2004, and
ending at July 2006 in the data set). 178 0.48 0.00 0.50 0.00 1.00
Investee Characteristics
Industry Market /
Book
The industry market-to- book value for publicly
traded firms at the time of investment. 178 2.42 1.88 1.66 0.38 11.58
Geographic
proximity (Same
Region)
Dummy variable equal to 1 if the investee firm is
located in the same region of the PE investor. 178 0.31 0.00 0.46 0.00 1.00
Deal Structure Characteristics & Value Added Capacity of PE investors
Level of PE control and involvement
(Sum of Control and
Veto Rights)
The sum of control and veto rights contractually held
by the PE investor (i.e., right to choose board
members, right to retain board control, right to add
board members, right to choose the CEO and other
key managers, right to substitute the CEO and key
managers, right to add coinvestors, drag along,
redemption, right of first refusal, cosale, liquidation
rights, ipo rights, veto on issuance of equity, veto on asset purchase, veto on asset sale, and veto on
ownership changes). 178 10 12 3.7 1 16
Investor Characteristics (Source: Cumming and Zambelli, 2010, 2013)
Age of PE investor
The age of the fund in years from date of formation
to date of first investment in the investee firm. 178 5.68 4.00 8.51 0.00 74.00
No. of Funds Under
Management Number of funds managed by the same PE firm. 178 1.88 1.00 1.44 1.00 7.00
Limited Partnership A dummy variable equal to 1 for a limited partnership fund.
178 0.545 1.000 0.499 0 1
Portfolio Size per
Manager
The portfolio size (number of investees) per manager
at the time of first investment 178 2.47 1.40 5.40 0.50 37.50
Investment Characteristics (Source: Cumming and Zambelli, 2010, 2013)
Buyout Dummy variable equal to 1 if the transaction is a
leveraged buyout (LBO). 178 0.65 1.00 0.48 0.00 1.00
Investment Value
The total amount invested by the PE investor as at
July 2006. 178 9685 4450 21254 90 183400
Preplanned IPO
A dummy variable equal to 1 if the PE investor
preplanned the IPO. 178 0.31 0.00 0.46 0.00 1.00
Preplanned Trade
Sale
A dummy variable equal to 1 if the PE investor
preplanned a trade sale. 178 0.38 0.00 0.49 0.00 1.00
Ebitda/Sales at the
Investment Year Ebitda/Investment Ratio at the Investment Year. 178 10.33 10.00 8.61 -52.19 41.41
Syndication The number of syndicated PE investors. 178 1.067 1.000 1.201 0 6
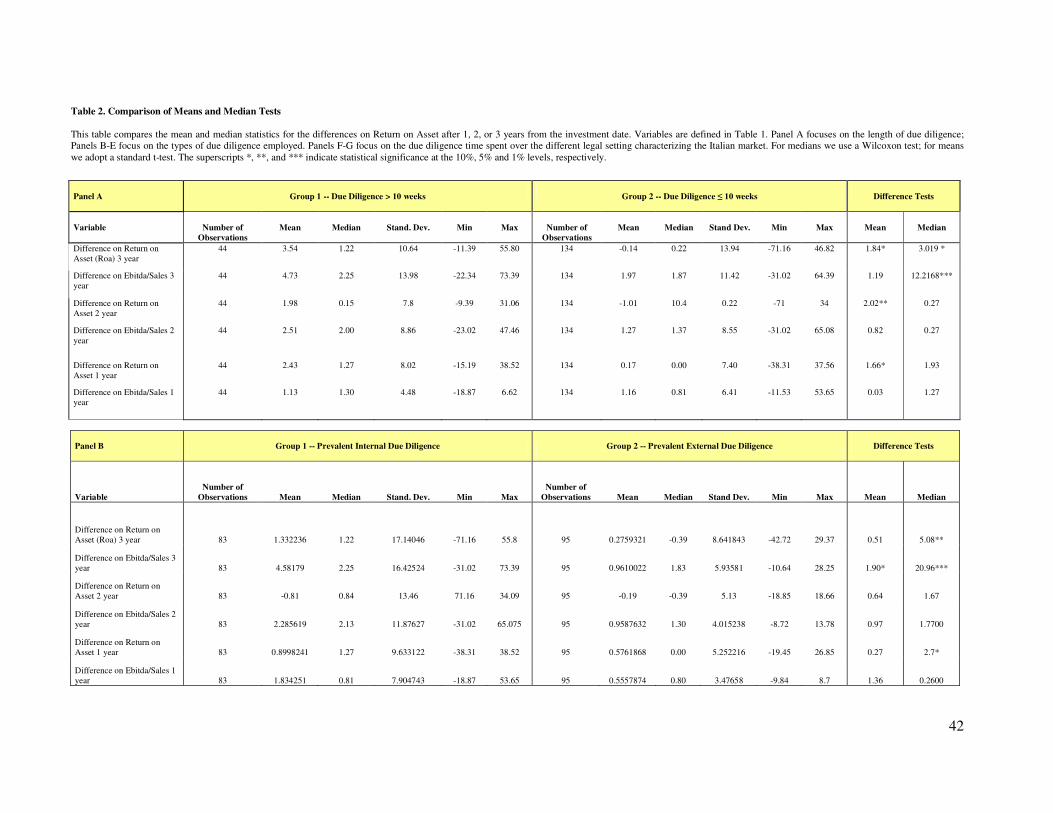
42
Table 2. Comparison of Means and Median Tests
This table compares the mean and median statistics for the differences on Return on Asset after 1, 2, or 3 years from the investment date. Variables are defined in Table 1. Panel A focuses on the length of due diligence; Panels B-E focus on the types of due diligence employed. Panels F-G focus on the due diligence time spent over the different legal setting characterizing the Italian market. For medians we use a Wilcoxon test; for means
we adopt a standard t-test. The superscripts *, **, and *** indicate statistical significance at the 10%, 5% and 1% levels, respectively.
Panel A
Group 1 -- Due Diligence > 10 weeks
Group 2 -- Due Diligence ≤ 10 weeks
Difference Tests
Variable
Number of
Observations
Mean
Median
Stand. Dev.
Min
Max
Number of
Observations
Mean
Median
Stand Dev.
Min
Max
Mean
Median
Difference on Return on
Asset (Roa) 3 year
44 3.54 1.22 10.64 -11.39 55.80 134 -0.14 0.22 13.94 -71.16 46.82 1.84* 3.019 *
Difference on Ebitda/Sales 3
year
44 4.73 2.25 13.98 -22.34 73.39 134 1.97 1.87 11.42 -31.02 64.39 1.19 12.2168***
Difference on Return on
Asset 2 year
44 1.98 0.15 7.8 -9.39 31.06 134 -1.01 10.4 0.22 -71 34 2.02** 0.27
Difference on Ebitda/Sales 2
year
44 2.51 2.00 8.86 -23.02 47.46 134 1.27 1.37 8.55 -31.02 65.08 0.82 0.27
Difference on Return on
Asset 1 year
44 2.43 1.27 8.02 -15.19 38.52 134 0.17 0.00 7.40 -38.31 37.56 1.66* 1.93
Difference on Ebitda/Sales 1
year
44 1.13 1.30 4.48 -18.87 6.62 134 1.16 0.81 6.41 -11.53 53.65 0.03 1.27
Panel B
Group 1 -- Prevalent Internal Due Diligence
Group 2 -- Prevalent External Due Diligence
Difference Tests
Variable
Number of
Observations Mean Median Stand. Dev. Min Max
Number of
Observations Mean Median Stand Dev. Min Max Mean Median
Difference on Return on
Asset (Roa) 3 year 83 1.332236 1.22 17.14046 -71.16 55.8 95 0.2759321 -0.39 8.641843 -42.72 29.37 0.51 5.08**
Difference on Ebitda/Sales 3
year 83 4.58179 2.25 16.42524 -31.02 73.39 95 0.9610022 1.83 5.93581 -10.64 28.25 1.90* 20.96***
Difference on Return on
Asset 2 year 83 -0.81 0.84 13.46 71.16 34.09 95 -0.19 -0.39 5.13 -18.85 18.66 0.64 1.67
Difference on Ebitda/Sales 2
year 83 2.285619 2.13 11.87627 -31.02 65.075 95 0.9587632 1.30 4.015238 -8.72 13.78 0.97 1.7700
Difference on Return on
Asset 1 year 83 0.8998241 1.27 9.633122 -38.31 38.52 95 0.5761868 0.00 5.252216 -19.45 26.85 0.27 2.7*
Difference on Ebitda/Sales 1
year 83 1.834251 0.81 7.904743 -18.87 53.65 95 0.5557874 0.80 3.47658 -9.84 8.7 1.36 0.2600

43
Table 2 continued
Panel C
Group 1 -- Consultants’ Due Diligence
Group 2 -- No Consultants’ Due Diligence
Difference Tests
Variable
Number of
Observations Mean Median Stand. Dev. Min Max
Number of
Observations Mean Median Stand Dev. Min Max Mean Median
Difference on Return on
Asset (Roa) 3 year 117 0.94 0.84 9.08 -42.72 46.82 61.00 0.43 1.17 18.97 -71.16 55.80 0.20 0.02
Difference on Ebitda/Sales 3
year 117 2.94 1.87 10.97 -22.34 73.39 61.00 2.10 0.53 14.16 -31.02 64.39 0.40 0.04
Difference on Return on
Asset 2 year 117 0.49 0.10 5.68 -18.85 31.06 61.00 -1.6 1.27 14.98 -71 34.09 1.04 0.03
Difference on Ebitda/Sales 2
year 117 1.79 2.06 6.75 -23.02 47.46 61.00 1.17 1.34 11.44 -31.02 65.08 0.39 0.8000
Difference on Return on
Asset 1 year 117 0.65 0.00 5.44 -19.45 38.52 61.00 0.87 1.27 10.63 -38.31 37.56 0.15 0.2200
Difference on Ebitda/Sales 1
year 117 0.93 0.80 4.07 -18.87 8.70 61.00 1.59 0.74 8.55 -11.53 53.65 0.57 0.2000
Panel D
Group 1 -- Legal Due Diligence
Group 2 -- No Legal Due Diligence
Difference Tests
Variable
Number of
Observations Mean Median Stand. Dev. Min Max
Number of
Observations Mean Median Stand Dev. Min Max Mean Median
Difference on Return on
Asset (Roa) 3 year 121 1.06 0.88 9.14 -42.72 46.82 57.00 0.15 0.68 19.42 -71.16 55.80 0.33 0.03
Difference on Ebitda/Sales 3
year 121 2.89 1.87 10.81 -22.34 73.39 57.00 2.13 0.53 14.62 -31.02 64.39 0.35 0.01
Difference on Return on
Asset 2 year 121 0.65 0.09 5.87 -18.8 31.06 57.00 -2.24 0.10 15.19 71.2 34.09 1.38 0.26
Difference on Ebitda/Sales 2
year 121 1.77 1.80 6.68 -23.02 47.46 57.00 1.16 1.37 11.80 -31.02 65.08 0.37 0.35
Difference on Return on
Asset 1 year 121 0.82 0.11 5.50 -19.45 38.52 57.00 0.53 1.26 10.83 -38.31 37.56 0.19 0.03
Difference on Ebitda/Sales 1
year 121 1.02 0.81 4.06 -18.87 8.70 57.00 1.42 0.18 8.82 -11.53 53.65 0.32 0.71
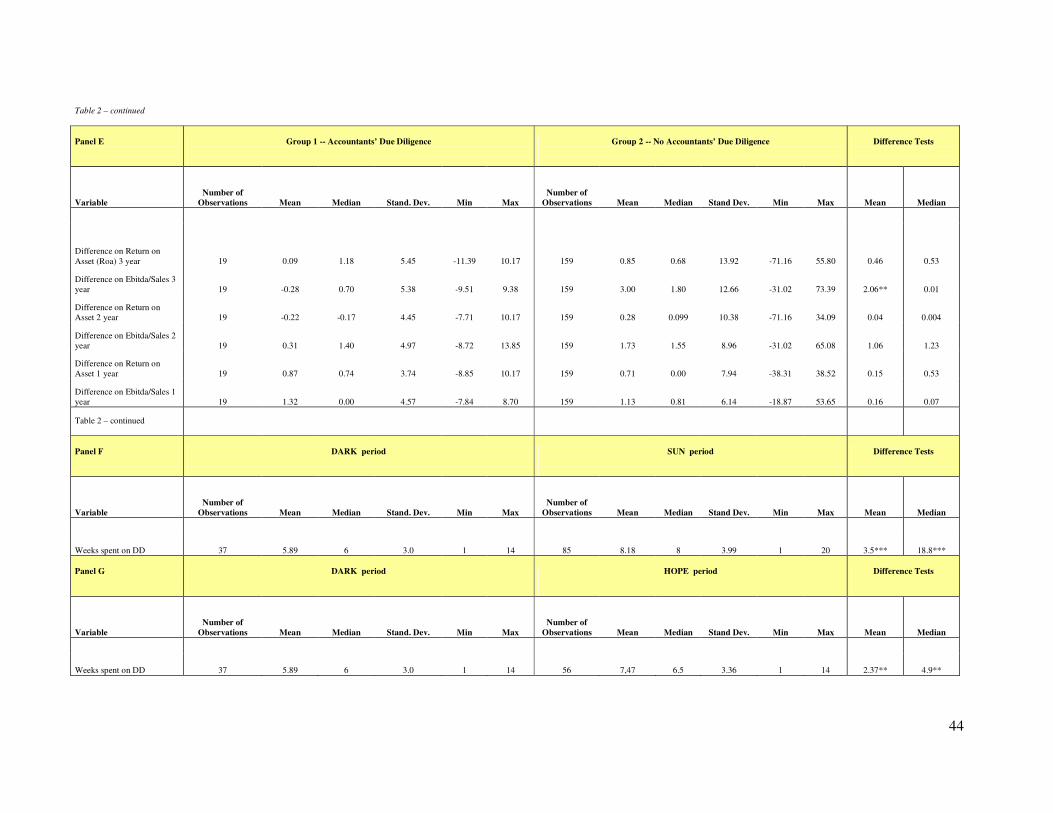
44
Table 2 – continued
Panel E
Group 1 -- Accountants’ Due Diligence
Group 2 -- No Accountants’ Due Diligence
Difference Tests
Variable
Number of
Observations Mean Median Stand. Dev. Min Max
Number of
Observations Mean Median Stand Dev. Min Max Mean Median
Difference on Return on
Asset (Roa) 3 year 19 0.09 1.18 5.45 -11.39 10.17 159 0.85 0.68 13.92 -71.16 55.80 0.46 0.53
Difference on Ebitda/Sales 3
year 19 -0.28 0.70 5.38 -9.51 9.38 159 3.00 1.80 12.66 -31.02 73.39 2.06** 0.01
Difference on Return on
Asset 2 year 19 -0.22 -0.17 4.45 -7.71 10.17 159 0.28 0.099 10.38 -71.16 34.09 0.04 0.004
Difference on Ebitda/Sales 2
year 19 0.31 1.40 4.97 -8.72 13.85 159 1.73 1.55 8.96 -31.02 65.08 1.06 1.23
Difference on Return on
Asset 1 year 19 0.87 0.74 3.74 -8.85 10.17 159 0.71 0.00 7.94 -38.31 38.52 0.15 0.53
Difference on Ebitda/Sales 1
year 19 1.32 0.00 4.57 -7.84 8.70 159 1.13 0.81 6.14 -18.87 53.65 0.16 0.07
Table 2 – continued
Panel F
DARK period
SUN period
Difference Tests
Variable
Number of
Observations Mean Median Stand. Dev. Min Max
Number of
Observations Mean Median Stand Dev. Min Max Mean Median
Weeks spent on DD 37 5.89 6 3.0 1 14 85 8.18 8 3.99 1 20 3.5*** 18.8***
Panel G
DARK period
HOPE period
Difference Tests
Variable
Number of
Observations Mean Median Stand. Dev. Min Max
Number of
Observations Mean Median Stand Dev. Min Max Mean Median
Weeks spent on DD 37 5.89 6 3.0 1 14 56 7,47 6.5 3.36 1 14 2.37** 4.9**

45
Table 3. Correlation Matrix
This table presents correlations across select dependent variables, potentially endogenous due diligence variables, potential instruments and other explanatory variables. Correlations greater than 0.13, 0.15 and 0.20 in
absolute value are statistically significant at the 10%, 5% and 1% levels, respectively. Correlations greater than 0.15 in absolute value are highlighted with an underline. Correlations among potential instruments that are
significant at the 5% level with the number of weeks of due diligence but not the two main dependent variables (EBIT/Sales Difference and ROA Difference) are highlighted in bold.
[1] [2] [3] [4] [5] [6] [7] [8] [9] [10] [11] [12] [13] [14]
[15]
EBITDA / Sales Difference from 3 Years relative to Investment
Year [1] 1.00
ROA Difference from 3 Years to Investment Year [2] 0.50 1.00
Number of Weeks of Due Diligence [3] 0.19 0.16 1.00
Dark Period [4] -0.14 -0.01 -0.24 1.00
Hope Period [5] -0.04 0.02 0.06 -0.35 1.00
Investment Value [6] 0.01 0.03 0.05 0.00 0.05 1.00
Buyout Dummy [7] 0.14 0.06 0.03 -0.12 -0.11 0.19 1.00
Industry Market / Book [8] -0.04 -0.03 -0.10 0.45 -0.22 -0.10 -0.13 1.00
Same Region
[9] 0.00 -0.01 0.00 -0.07 -0.14 -0.04 0.00 -0.03 1.00
Return 1 year prior
[10] 0.12 0.00 0.00 0.15 -0.66 0.11 0.02 0.07 0.00 1.00
EBIT / Sales in Most Recent Period Prior to Investment [11] -0.53 -0.31 -0.11 0.05 -0.05 0.00 -0.12 0.08 0.02 0.01 1.00
Preplanned IPO [12] -0.08 -0.04 0.16 0.08 0.04 -0.03 -0.10 0.14 -0.05 0.11 0.06 1.00
Preplanned Acquisition [13] 0.14 0.11 0.03 -0.14 -0.03 -0.02 0.37 -0.17 0.01 -0.12 -0.15 -0.34 1.00
Fund Age [14] -0.01 -0.02 0.08 -0.17 -0.07 0.23 0.15 -0.07 -0.09 0.08 -0.06 -0.12 0.14 1.00
Portfolio Size Per Manager [15] -0.04 0.00 -0.08 -0.08 0.14 0.38 0.05 -0.08 0.08 -0.07 -0.04 -0.04 0.00 -0.06 1.00
Number of Funds [16] 0.14 0.14 0.35 -0.12 -0.08 0.11 0.33 0.01 0.06 0.02 -0.07 0.10 0.05 0.22 -0.07

46
Table 4. First Stage Regressions to Explain the Number of Weeks of Due Diligence
This table presents OLS estimates of the number of weeks of due diligence in Model 1, and the natural log of the number of weeks of due diligence in Model 2. Variables
are as defined in Table 1. *, **, *** Significant at the 10%, 5%, and 1% levels, respectively.
Model 1:
Ln (Number of Weeks Due Diligence)
Model 2:
Ln (Number of Weeks Due Diligence)
Coefficient t-statistic Coefficient t-statistic
Dark Period -0.1283 -0.51 -0.2946 -2.57**
Hope Period 0.1872 1.75* -0.0312 -0.25
Investment Value 1.86E-06 1.12 2.30E-06 1.10
Buyout Dummy -0.1927 -2.15** -0.1687 -1.81*
Industry Market / Book -0.0212 -1.00 -0.0099 -0.38
Same Region -0.0072 -0.09 -0.0253 -0.30
Return 1 year prior 0.3544 1.18 -0.0202 -0.06
EBITDA / Sales in Most Recent Period Prior to
Investment -0.0018 -0.70 -0.0059 -1.32
Preplanned IPO -0.0128 -0.10 0.1914 2.13**
Preplanned Acquisition 0.0747 0.67 0.0900 0.98
Fund Age 0.0490 2.12** -0.0026 -0.52
Portfolio Size Per Manager -0.0089 -4.15** -0.0092 -1.17
Number of Funds 0.0256 1.89* 0.1285 4.39***
Year of Investment Dummies? Yes No
Fund Dummies? Yes No
Clustering by Fund and Year? Yes No
Constant 1.8385 55.15*** 1.8898 12.36***
Number of Observations 178 178
Adjusted R2 0.4142 0.1542

47
Table 5. Impact of Due Diligence on Three-Year ROA and Three-Year EBITDA/Sales
This table presents second stage OLS estimates of the impact of due diligence on Three-Year ROA in Panel A and EBITDA / Sales in Panel B. Estimates are for the difference between the year 3 performance values versus
the year of investment values. Variables are as defined in Table 1. *, **, *** Significant at the 10%, 5% and 1% levels, respectively.
Panel A. Three-Year ROA
Model 3
(With Outliers)
Model 4
(Outliers Removed)
Model 5
(No Year and Fund
Dummies)
Model 6
(No Clustering)
Model 7
(No Endogeneity Controls)
Coefficient t-statistic Coefficient t-statistic Coefficient t-statistic Coefficient t-statistic Coefficient t-statistic
Ln Number of Weeks Due Diligence (Fitted, Table 4, Model 1) 24.9441 1.67* 17.3146 2.09** 5.4510 3.10***
Ln Number of Weeks Due Diligence (Fitted, Table 4, Model 2) 5.3885 2.28**
Ln Number of Weeks Due Diligence 3.8341 2.03**
MSCI Return Over Horizon 2.5370 0.59 3.4617 0.89 4.3838 1.54 4.5397 1.30 4.4879 1.28
Dark -1.9701 -0.40 1.7224 0.32 2.4681 1.44 2.6100 0.88 2.0829 0.71
Hope -4.5435 -1.10 0.5027 0.12 -0.7276 -0.34 -0.6766 -0.26 -0.7096 -0.27
Buyout Dummy 2.7514 0.86 -0.9458 -0.74 1.6932 1.03 1.6280 0.76 1.6205 0.76
Market / Book 0.2545 0.32 -0.2520 -0.46 -0.2635 -0.74 -0.2679 -0.40 -0.2623 -0.39
Fund Age -0.0363 -0.52
Portfolio Size Per Manager 0.0156 0.17
Year of Investment Dummies? Yes Yes No No No
Fund Dummies? Yes Yes No No No
Clustering by Fund and Year? Yes Yes Yes No No
Constant -49.6825 -1.57 -32.5327 -1.86* -10.12083 -3.43*** -10.1514 -1.83* -7.0361 -1.48
Number of Observations 178 175 178 178 178
Adjusted R2 0.2565 0.2739 0.0461 0.0121 0.0061
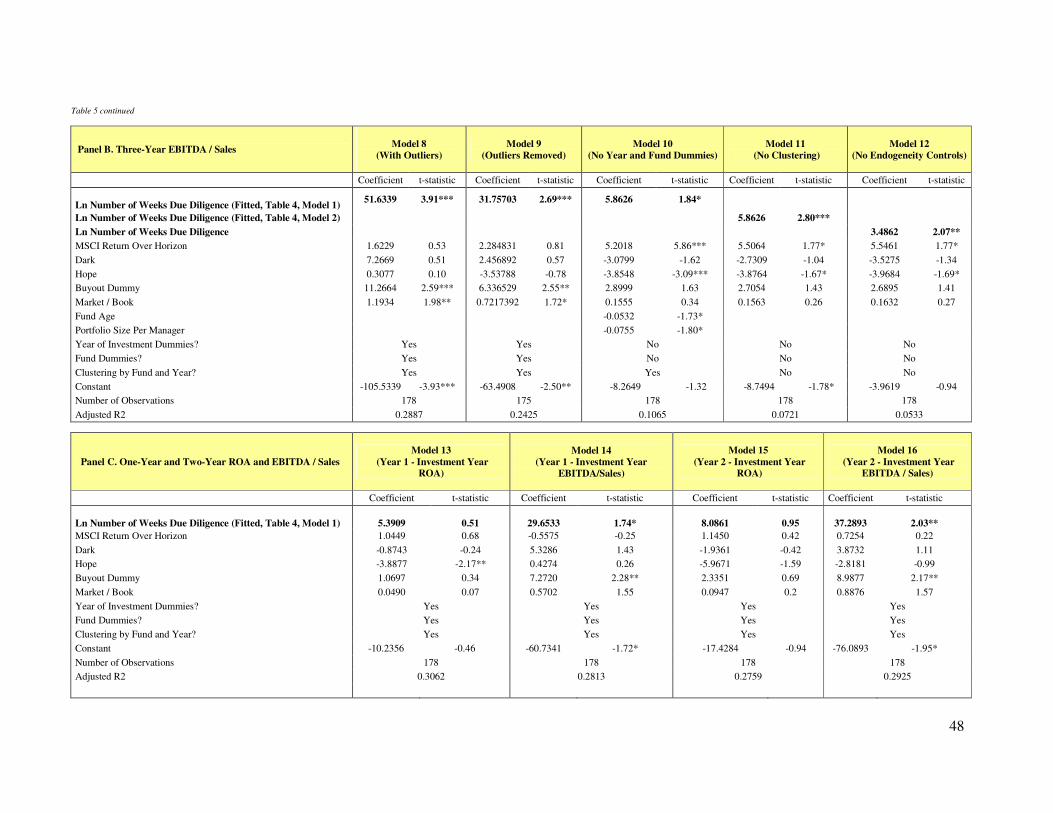
48
Table 5 continued
Panel B. Three-Year EBITDA / Sales
Model 8
(With Outliers)
Model 9
(Outliers Removed)
Model 10
(No Year and Fund Dummies)
Model 11
(No Clustering)
Model 12
(No Endogeneity Controls)
Coefficient t-statistic Coefficient t-statistic Coefficient t-statistic Coefficient t-statistic Coefficient t-statistic
Ln Number of Weeks Due Diligence (Fitted, Table 4, Model 1) 51.6339 3.91*** 31.75703 2.69*** 5.8626 1.84*
Ln Number of Weeks Due Diligence (Fitted, Table 4, Model 2) 5.8626 2.80***
Ln Number of Weeks Due Diligence 3.4862 2.07**
MSCI Return Over Horizon 1.6229 0.53 2.284831 0.81 5.2018 5.86*** 5.5064 1.77* 5.5461 1.77*
Dark 7.2669 0.51 2.456892 0.57 -3.0799 -1.62 -2.7309 -1.04 -3.5275 -1.34
Hope 0.3077 0.10 -3.53788 -0.78 -3.8548 -3.09*** -3.8764 -1.67* -3.9684 -1.69*
Buyout Dummy 11.2664 2.59*** 6.336529 2.55** 2.8999 1.63 2.7054 1.43 2.6895 1.41
Market / Book 1.1934 1.98** 0.7217392 1.72* 0.1555 0.34 0.1563 0.26 0.1632 0.27
Fund Age -0.0532 -1.73*
Portfolio Size Per Manager -0.0755 -1.80*
Year of Investment Dummies? Yes Yes No No No
Fund Dummies? Yes Yes No No No
Clustering by Fund and Year? Yes Yes Yes No No
Constant -105.5339 -3.93*** -63.4908 -2.50** -8.2649 -1.32 -8.7494 -1.78* -3.9619 -0.94
Number of Observations 178 175 178 178 178
Adjusted R2 0.2887 0.2425 0.1065 0.0721 0.0533
Panel C. One-Year and Two-Year ROA and EBITDA / Sales
Model 13
(Year 1 - Investment Year
ROA)
Model 14
(Year 1 - Investment Year
EBITDA/Sales)
Model 15
(Year 2 - Investment Year
ROA)
Model 16
(Year 2 - Investment Year
EBITDA / Sales)
Coefficient t-statistic Coefficient t-statistic Coefficient t-statistic Coefficient t-statistic
Ln Number of Weeks Due Diligence (Fitted, Table 4, Model 1)
5.3909
0.51
29.6533
1.74*
8.0861
0.95
37.2893
2.03**
MSCI Return Over Horizon 1.0449 0.68 -0.5575 -0.25 1.1450 0.42 0.7254 0.22
Dark -0.8743 -0.24 5.3286 1.43 -1.9361 -0.42 3.8732 1.11
Hope -3.8877 -2.17** 0.4274 0.26 -5.9671 -1.59 -2.8181 -0.99
Buyout Dummy 1.0697 0.34 7.2720 2.28** 2.3351 0.69 8.9877 2.17**
Market / Book 0.0490 0.07 0.5702 1.55 0.0947 0.2 0.8876 1.57
Year of Investment Dummies? Yes Yes Yes Yes
Fund Dummies? Yes Yes Yes Yes
Clustering by Fund and Year? Yes Yes Yes Yes
Constant -10.2356 -0.46 -60.7341 -1.72* -17.4284 -0.94 -76.0893 -1.95*
Number of Observations 178 178 178 178
Adjusted R2 0.3062 0.2813 0.2759 0.2925

49
Table 6. Regression Analyses for Different Agents Carrying Out Due Diligence
This table presents OLS estimates of the impact of due diligence on Three-Year ROA in Panel A and EBITDA / Sales in Panel B. Regressions are based on the different subsamples for different agents carrying out due
diligence: primarily the fund, whether or not consultants are used, whether or not external law firms are used, and whether or not external accounting firms are used. Estimates are for the difference between the year 3 performance values versus the year of investment values. Variables are as defined in Table 1. Where variables are excluded in the regressions it was due to necessity in the subsamples (e.g., in the case of consultants in the
Dark period, for example). *, **, *** Significant at the 10%, 5% and 1% levels, respectively.
Panel A. Three Year ROA with subsets of the data by Due
Diligence Types
Model 17
Prevalent Internal Fund Due
Diligence
Model 18
Prevalent External Due
Diligence
Model 19
Consultants’ Due Diligence
Model 20
No Consultants’ Due Diligence
Coefficient t-statistic Coefficient t-statistic Coefficient t-statistic Coefficient t-statistic
Ln Number of Weeks Due Diligence (Fitted, Table 4, Model 1) 10.4179 2.38** -2.0003 -0.83 1.2482 0.93 15.4722 2.92***
MSCI Return Over Horizon 1.7337 0.37 7.0056 2.90*** 5.4701 1.44 1.9902 0.3
Dark 4.0836 1.5 -0.0685 -0.04 0.6783 0.17 7.6875 3.47
Hope 1.8136 0.33 -3.2929 -2.45 -3.3307 -2.03** 5.9219 0.52
Buyout Dummy 1.7968 1.03 -0.3378 -0.15 1.1721 0.72 2.6648 0.68
Market / Book -0.4613 -1.06 -0.4333 -0.47 -0.7483 -0.88 0.5346 0.36
Portfolio Size Per Manager -4.3185 -0.49 -0.0233 -0.18 -0.0247 -0.18 2.3067 0.66
Year of Investment Dummies? No No No No
Fund Dummies? No No No No
Clustering by Fund and Year? Yes Yes Yes Yes
Constant -14.73654 -1.59 7.0884 1.33 0.7338 0.25 -36.0129 -3.64***
Number of Observations 83 95 117 61
Adjusted R2 0.0650 0.0560 0.0583 0.1350
Model 21
Legal Due Diligence
Model 22
No Legal Due Diligence
Model 23
Accountants’ Due Diligence
Model 24
No Accountants’ Due Diligence
Coefficient t-statistic Coefficient t-statistic Coefficient t-statistic Coefficient t-statistic
Ln Number of Weeks Due Diligence (Fitted, Table 4, Model 1) 1.4851 1.49 20.6433 3.87*** -2.9945 -1.38 7.3279 3.07***
MSCI Return Over Horizon 5.6285 1.6 1.1184 0.15 1.2143 0.52 5.2251 1.53
Dark 0.5670 0.14 7.6147 1.97** -8.5574 -2.90*** 4.0426 2.14**
Hope -3.1003 -2.08** 5.9196 0.44 -0.2985 -0.08 -0.2108 -0.07
Buyout Dummy 1.4498 0.91 2.3813 0.72 7.1457 2.23** 1.8869 0.87
Market / Book -0.6640 -0.87 0.9600 2.40** 1.8999 0.4 -0.3574 -0.83
Portfolio Size Per Manager -0.0178 -0.13 9.6564 0.32 -0.0893 -2.15** 0.5490 1.09
Year of Investment Dummies? No No No No
Fund Dummies? No No No No
Clustering by Fund and Year? Yes Yes Yes Yes
Constant -0.0978 -0.02 -55.6239 -1.31 -1.3937 -0.12 -14.9546 -4.03***
Number of Observations 121 57 19 159
Adjusted R2 0.0607 0.1530 0.3674 0.0650
Table 6 continued
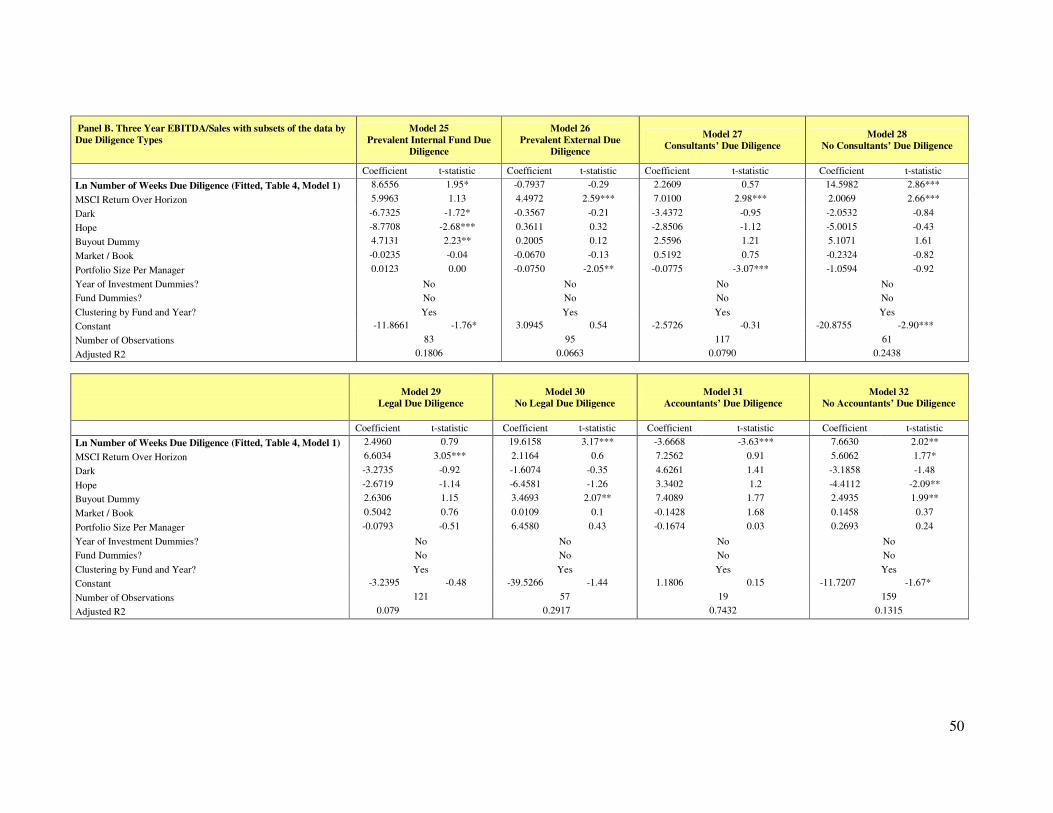
50
Panel B. Three Year EBITDA/Sales with subsets of the data by
Due Diligence Types
Model 25
Prevalent Internal Fund Due
Diligence
Model 26
Prevalent External Due
Diligence
Model 27
Consultants’ Due Diligence
Model 28
No Consultants’ Due Diligence
Coefficient t-statistic Coefficient t-statistic Coefficient t-statistic Coefficient t-statistic
Ln Number of Weeks Due Diligence (Fitted, Table 4, Model 1) 8.6556 1.95* -0.7937 -0.29 2.2609 0.57 14.5982 2.86***
MSCI Return Over Horizon 5.9963 1.13 4.4972 2.59*** 7.0100 2.98*** 2.0069 2.66***
Dark -6.7325 -1.72* -0.3567 -0.21 -3.4372 -0.95 -2.0532 -0.84
Hope -8.7708 -2.68*** 0.3611 0.32 -2.8506 -1.12 -5.0015 -0.43
Buyout Dummy 4.7131 2.23** 0.2005 0.12 2.5596 1.21 5.1071 1.61
Market / Book -0.0235 -0.04 -0.0670 -0.13 0.5192 0.75 -0.2324 -0.82
Portfolio Size Per Manager 0.0123 0.00 -0.0750 -2.05** -0.0775 -3.07*** -1.0594 -0.92
Year of Investment Dummies? No No No No
Fund Dummies? No No No No
Clustering by Fund and Year? Yes Yes Yes Yes
Constant -11.8661 -1.76* 3.0945 0.54 -2.5726 -0.31 -20.8755 -2.90***
Number of Observations 83 95 117 61
Adjusted R2 0.1806 0.0663 0.0790 0.2438
Model 29
Legal Due Diligence
Model 30
No Legal Due Diligence
Model 31
Accountants’ Due Diligence
Model 32
No Accountants’ Due Diligence
Coefficient t-statistic Coefficient t-statistic Coefficient t-statistic Coefficient t-statistic
Ln Number of Weeks Due Diligence (Fitted, Table 4, Model 1) 2.4960 0.79 19.6158 3.17*** -3.6668 -3.63*** 7.6630 2.02**
MSCI Return Over Horizon 6.6034 3.05*** 2.1164 0.6 7.2562 0.91 5.6062 1.77*
Dark -3.2735 -0.92 -1.6074 -0.35 4.6261 1.41 -3.1858 -1.48
Hope -2.6719 -1.14 -6.4581 -1.26 3.3402 1.2 -4.4112 -2.09**
Buyout Dummy 2.6306 1.15 3.4693 2.07** 7.4089 1.77 2.4935 1.99**
Market / Book 0.5042 0.76 0.0109 0.1 -0.1428 1.68 0.1458 0.37
Portfolio Size Per Manager -0.0793 -0.51 6.4580 0.43 -0.1674 0.03 0.2693 0.24
Year of Investment Dummies? No No No No
Fund Dummies? No No No No
Clustering by Fund and Year? Yes Yes Yes Yes
Constant -3.2395 -0.48 -39.5266 -1.44 1.1806 0.15 -11.7207 -1.67*
Number of Observations 121 57 19 159
Adjusted R2 0.079 0.2917 0.7432 0.1315
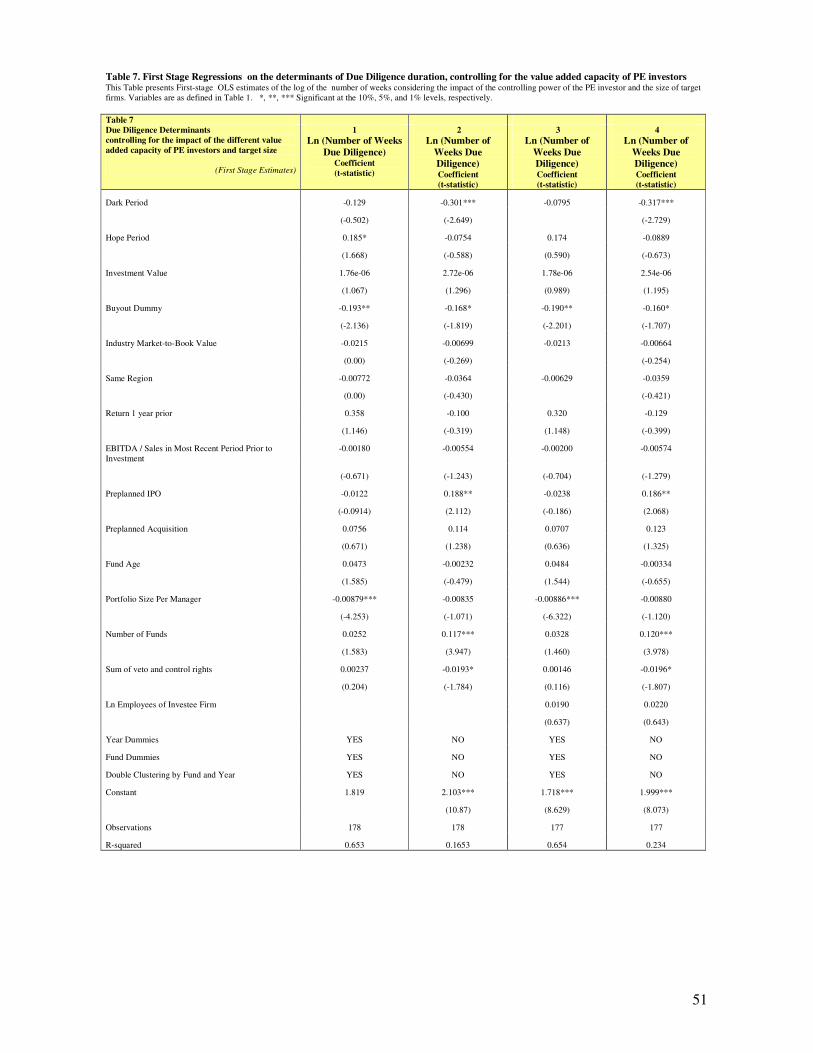
51
Table 7. First Stage Regressions on the determinants of Due Diligence duration, controlling for the value added capacity of PE investors
This Table presents First-stage OLS estimates of the log of the number of weeks considering the impact of the controlling power of the PE investor and the size of target
firms. Variables are as defined in Table 1. *, **, *** Significant at the 10%, 5%, and 1% levels, respectively.
Table 7
Due Diligence Determinants
controlling for the impact of the different value
added capacity of PE investors and target size
(First Stage Estimates)
1
Ln (Number of Weeks
Due Diligence)
Coefficient
(t-statistic)
2
Ln (Number of
Weeks Due
Diligence)
Coefficient
(t-statistic)
3
Ln (Number of
Weeks Due
Diligence) Coefficient
(t-statistic)
4
Ln (Number of
Weeks Due
Diligence)
Coefficient
(t-statistic)
Dark Period -0.129 -0.301*** -0.0795 -0.317***
(-0.502) (-2.649) (-2.729)
Hope Period 0.185* -0.0754 0.174 -0.0889
(1.668) (-0.588) (0.590) (-0.673)
Investment Value 1.76e-06 2.72e-06 1.78e-06 2.54e-06
(1.067) (1.296) (0.989) (1.195)
Buyout Dummy -0.193** -0.168* -0.190** -0.160*
(-2.136) (-1.819) (-2.201) (-1.707)
Industry Market-to-Book Value -0.0215 -0.00699 -0.0213 -0.00664
(0.00) (-0.269) (-0.254)
Same Region -0.00772 -0.0364 -0.00629 -0.0359
(0.00) (-0.430) (-0.421)
Return 1 year prior 0.358 -0.100 0.320 -0.129
(1.146) (-0.319) (1.148) (-0.399)
EBITDA / Sales in Most Recent Period Prior to
Investment
-0.00180 -0.00554 -0.00200 -0.00574
(-0.671) (-1.243) (-0.704) (-1.279)
Preplanned IPO -0.0122 0.188** -0.0238 0.186**
(-0.0914) (2.112) (-0.186) (2.068)
Preplanned Acquisition 0.0756 0.114 0.0707 0.123
(0.671) (1.238) (0.636) (1.325)
Fund Age 0.0473 -0.00232 0.0484 -0.00334
(1.585) (-0.479) (1.544) (-0.655)
Portfolio Size Per Manager -0.00879*** -0.00835 -0.00886*** -0.00880
(-4.253) (-1.071) (-6.322) (-1.120)
Number of Funds 0.0252 0.117*** 0.0328 0.120***
(1.583) (3.947) (1.460) (3.978)
Sum of veto and control rights 0.00237 -0.0193* 0.00146 -0.0196*
(0.204) (-1.784) (0.116) (-1.807)
Ln Employees of Investee Firm 0.0190 0.0220
(0.637) (0.643)
Year Dummies YES NO YES NO
Fund Dummies YES NO YES NO
Double Clustering by Fund and Year YES NO YES NO
Constant 1.819 2.103*** 1.718*** 1.999***
(10.87) (8.629) (8.073)
Observations 178 178 177 177
R-squared 0.653 0.1653 0.654 0.234
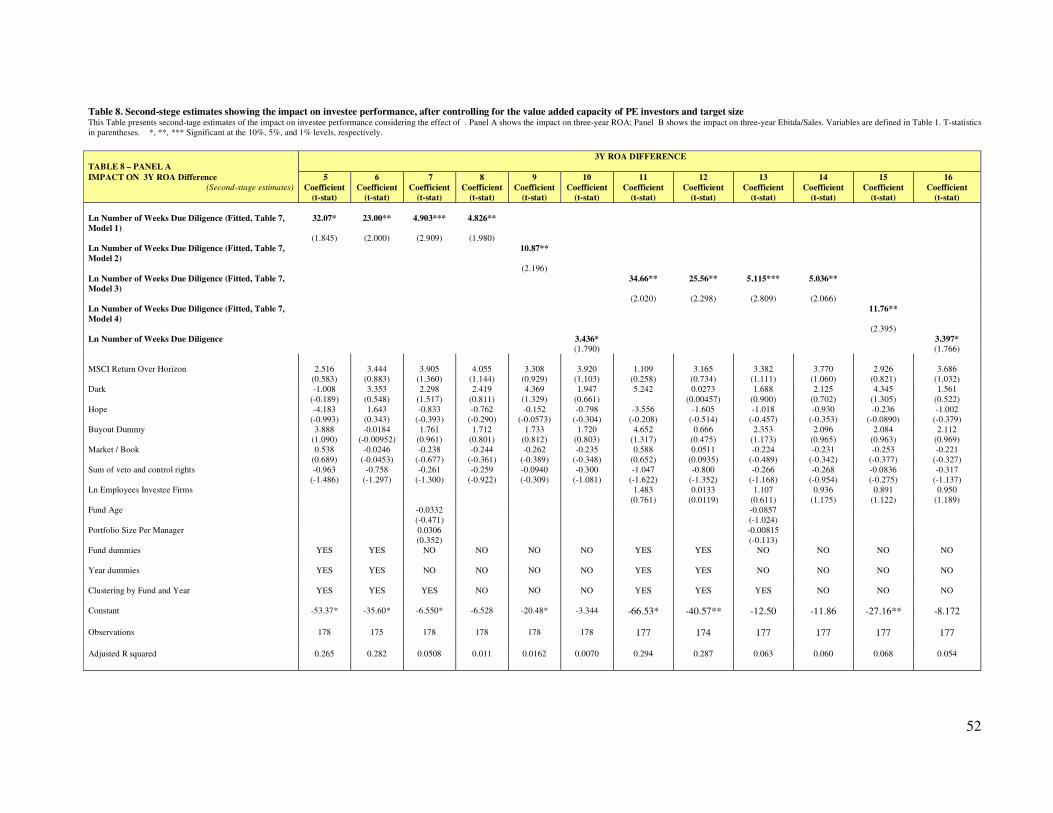
52
Table 8. Second-stege estimates showing the impact on investee performance, after controlling for the value added capacity of PE investors and target size This Table presents second-tage estimates of the impact on investee performance considering the effect of . Panel A shows the impact on three-year ROA; Panel B shows the impact on three-year Ebitda/Sales. Variables are defined in Table 1. T-statistics
in parentheses. *, **, *** Significant at the 10%, 5%, and 1% levels, respectively.
TABLE 8 – PANEL A
3Y ROA DIFFERENCE
IMPACT ON 3Y ROA Difference
(Second-stage estimates)
5
Coefficient
(t-stat)
6
Coefficient
(t-stat)
7
Coefficient
(t-stat)
8
Coefficient
(t-stat)
9
Coefficient
(t-stat)
10
Coefficient
(t-stat)
11
Coefficient
(t-stat)
12
Coefficient
(t-stat)
13
Coefficient
(t-stat)
14
Coefficient
(t-stat)
15
Coefficient
(t-stat)
16
Coefficient
(t-stat)
Ln Number of Weeks Due Diligence (Fitted, Table 7,
Model 1)
32.07* 23.00** 4.903*** 4.826**
(1.845) (2.000) (2.909) (1.980)
Ln Number of Weeks Due Diligence (Fitted, Table 7,
Model 2)
10.87**
(2.196)
Ln Number of Weeks Due Diligence (Fitted, Table 7,
Model 3)
34.66** 25.56** 5.115*** 5.036**
(2.020) (2.298) (2.809) (2.066)
Ln Number of Weeks Due Diligence (Fitted, Table 7,
Model 4)
11.76**
(2.395)
Ln Number of Weeks Due Diligence 3.436* 3.397*
(1.790) (1.766)
MSCI Return Over Horizon 2.516 3.444 3.905 4.055 3.308 3.920 1.109 3.165 3.382 3.770 2.926 3.686
(0.583) (0.883) (1.360) (1.144) (0.929) (1.103) (0.258) (0.734) (1.111) (1.060) (0.821) (1.032)
Dark -1.008 3.353 2.298 2.419 4.369 1.947 5.242 0.0273 1.688 2.125 4.345 1.561
(-0.189) (0.548) (1.517) (0.811) (1.329) (0.661) (0.00457) (0.900) (0.702) (1.305) (0.522)
Hope -4.183 1.643 -0.833 -0.762 -0.152 -0.798 -3.556 -1.605 -1.018 -0.930 -0.236 -1.002
(-0.993) (0.343) (-0.393) (-0.290) (-0.0573) (-0.304) (-0.208) (-0.514) (-0.457) (-0.353) (-0.0890) (-0.379)
Buyout Dummy 3.888 -0.0184 1.761 1.712 1.733 1.720 4.652 0.666 2.353 2.096 2.084 2.112
(1.090) (-0.00952) (0.961) (0.801) (0.812) (0.803) (1.317) (0.475) (1.173) (0.965) (0.963) (0.969)
Market / Book 0.538 -0.0246 -0.238 -0.244 -0.262 -0.235 0.588 0.0511 -0.224 -0.231 -0.253 -0.221
(0.689) (-0.0453) (-0.677) (-0.361) (-0.389) (-0.348) (0.652) (0.0935) (-0.489) (-0.342) (-0.377) (-0.327)
Sum of veto and control rights -0.963 -0.758 -0.261 -0.259 -0.0940 -0.300 -1.047 -0.800 -0.266 -0.268 -0.0836 -0.317
(-1.486) (-1.297) (-1.300) (-0.922) (-0.309) (-1.081) (-1.622) (-1.352) (-1.168) (-0.954) (-0.275) (-1.137)
Ln Employees Investee Firms 1.483 0.0133 1.107 0.936 0.891 0.950
(0.761) (0.0119) (0.611) (1.175) (1.122) (1.189)
Fund Age -0.0332 -0.0857
(-0.471) (-1.024)
Portfolio Size Per Manager 0.0306 -0.00815
(0.352) (-0.113)
Fund dummies YES YES NO NO NO NO YES YES NO NO NO NO
Year dummies YES YES NO NO NO NO YES YES NO NO NO NO
Clustering by Fund and Year YES YES YES NO NO NO YES YES YES NO NO NO
Constant -53.37* -35.60* -6.550* -6.528 -20.48* -3.344 -66.53* -40.57** -12.50 -11.86 -27.16** -8.172
Observations 178 175 178 178 178 178 177 174 177 177 177 177
Adjusted R squared 0.265 0.282 0.0508 0.011 0.0162 0.0070 0.294 0.287 0.063 0.060 0.068 0.054

53
TABLE 8– PANEL B 3Y EBITDA/SALES DIFFERENCE
IMPACT ON 3Y EBITDA/SALES
(Second-stage estimates)
Model 17
Coefficient
(t-stat)
Model 18
Coefficient
(t-stat)
Model 19
Coefficient
(t-stat)
Model 20
Coefficient
(t-stat)
Model 21
Coefficient
(t-stat)
Model 22
Coefficient
(t-stat)
Model 23
Coefficient
(t-stat)
Model 24
Coefficient
(t-stat)
Model 25
Coefficient
(t-stat)
Model 26
Coefficient
(t-stat)
Model 27
Coefficient
(t-stat)
Model 28
Coefficient
(t-stat)
Ln Number of Weeks Due Diligence
(Fitted, Table 7, Model 1))
59.64*** 56.72*** 5.367* 5.330**
(3.991) (3.695) (1.908) (2.471)
Ln Number of Weeks Due Diligence
(Fitted, Table 7, Model 2))
8.932**
(2.023)
Ln Number of Weeks Due Diligence
(Fitted, Table 7, Model 3)
63.42*** 60.45*** 5.469* 5.441**
(3.998) (3.656) (1.930) (2.513)
Ln Number of Weeks Due Diligence
(Fitted, Table 7, Model 4)
9.582**
(2.177)
Ln Number of Weeks Due Diligence 3.064* 3.038*
(1.79) (1.768)
MSCI Return Over Horizon 1.607 1.672 4.754*** 5.033 4.461 4.945 1.033 1.546 4.467*** 4.914 4.279 4.875
(0.555) (0.622) (9.464) (1.604) (1.404) (1.562) (0.321) (0.515) (3.350) (1.556) (1.339) (1.529)
Dark 8.344 8.061* -3.233* -2.911 -1.759 -3.671 7.680*** 5.629 -3.649** -3.088 -1.730 -3.907
(1.763) (-1.756) (-1.103) (-0.599) (-1.400) (2.883) (1.451) (-2.064) (-1.150) (-0.580) (-1.463)
Hope 0.652 1.045 -3.953*** -3.958* -3.552 -4.062* 0.989 1.800 -4.053*** -4.019* -3.553 -4.153*
(0.194) (0.184) (-2.804) (-1.704) (-1.503) (-1.735) (0.0752) (0.588) (-3.009) (-1.720) (-1.496) (-1.761)
Buyout Dummy 12.58** 11.16* 2.963 2.787 2.805 2.795 13.41** 11.98* 3.332* 2.980 2.977 2.999
(2.530) (1.947) (1.586) (1.473) (1.474) (1.465) (2.492) (1.967) (1.683) (1.544) (1.536) (1.540)
Market / Book 1.495** 1.282* 0.180 0.180 0.171 0.192 1.589** 1.390* 0.192 0.189 0.177 0.202
(2.562) (1.746) (0.393) (0.301) (0.285) (0.319) (2.326) (1.769) (0.385) (0.315) (0.293) (0.333)
Portfolio Size Per Manager 0.123 0.129 -0.0391 0.137 0.143 -0.0608**
(1.399) (1.528) (-0.983) (1.372) (1.651) (-2.634)
Sum of veto and control rights -0.969 -0.895 -0.243 -0.252 -0.155 -0.318 -1.017 -0.927 -0.248 -0.257 -0.145 -0.327
(-1.355) (-1.225) (-0.902) (-1.015) (-0.573) (-1.287) (-1.449) (-1.272) (-0.885) (-1.029) (-0.531) (-1.314)
Ln Employees Investee Firm -0.226 -0.796 0.617 0.383 0.357 0.403
(-0.186) (-0.859) (0.652) (0.542) (0.502) (0.565)
Fund Age -0.0726* -0.102**
(-1.798) (-2.116)
Fund dummies YES YES NO NO NO NO YES YES NO NO NO NO
Year dummies YES YES NO NO NO NO YES YES NO NO NO NO
Clustering by Fund and Year YES YES YES NO NO NO YES YES YES NO NO NO
Constant -111.4*** -105.8*** -4.967 -5.252 -13.58 -0.0484 -117.6*** -108.8*** -8.261 -7.507 -16.94 -2.094
(-4.082) (-3.780) (-1.124) (-0.875) (-1.265) (-0.00929) (-4.804) (-4.156) (-1.034) (-1.074) (-1.517) (-0.329)
Observations 178 175 178 178 178 178 177 174 177 177 177 177
R-squared 0.300 0.290 0.112 0.0724 0.0616 0.0569 0.316 0.299 0.117 0.112 0.104 0.096
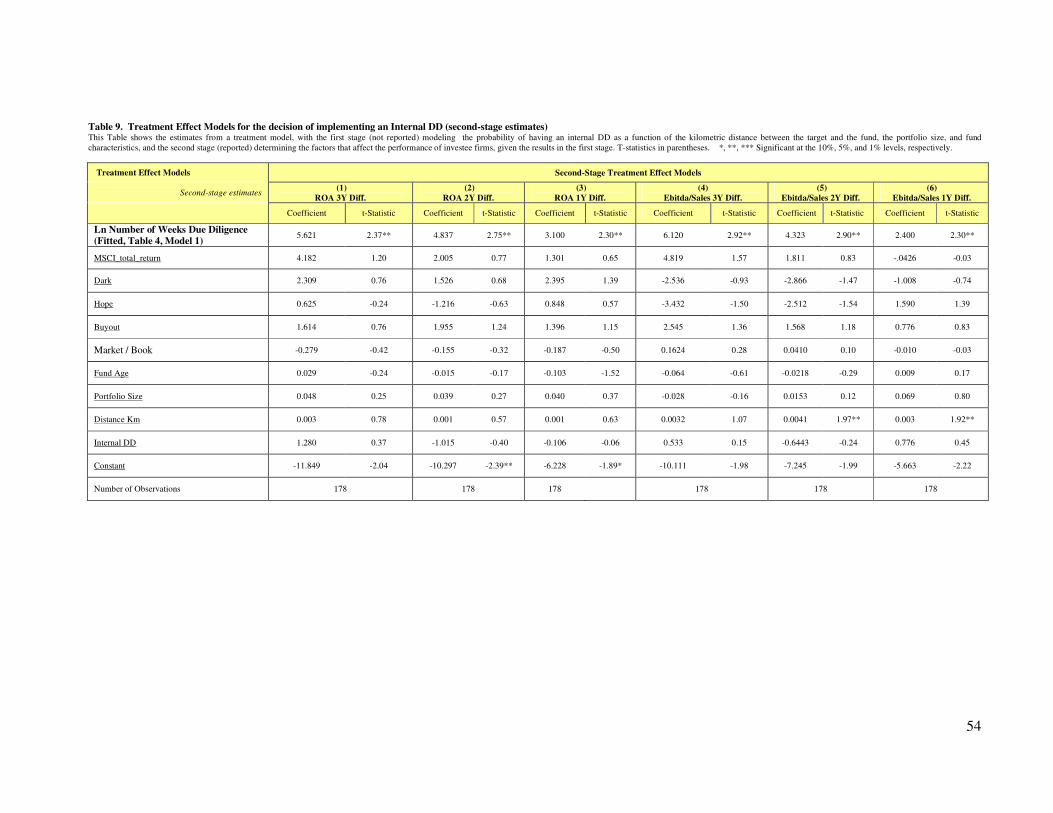
54
Table 9. Treatment Effect Models for the decision of implementing an Internal DD (second-stage estimates) This Table shows the estimates from a treatment model, with the first stage (not reported) modeling the probability of having an internal DD as a function of the kilometric distance between the target and the fund, the portfolio size, and fund
characteristics, and the second stage (reported) determining the factors that affect the performance of investee firms, given the results in the first stage. T-statistics in parentheses. *, **, *** Significant at the 10%, 5%, and 1% levels, respectively.
Treatment Effect Models Second-Stage Treatment Effect Models
Second-stage estimates (1)
ROA 3Y Diff.
(2)
ROA 2Y Diff.
(3)
ROA 1Y Diff.
(4)
Ebitda/Sales 3Y Diff.
(5)
Ebitda/Sales 2Y Diff.
(6)
Ebitda/Sales 1Y Diff.
Coefficient t-Statistic Coefficient t-Statistic Coefficient t-Statistic Coefficient t-Statistic Coefficient t-Statistic Coefficient t-Statistic
Ln Number of Weeks Due Diligence
(Fitted, Table 4, Model 1) 5.621 2.37** 4.837 2.75** 3.100 2.30** 6.120 2.92** 4.323 2.90** 2.400 2.30**
MSCI_total_return 4.182 1.20 2.005 0.77 1.301 0.65 4.819 1.57 1.811 0.83 -.0426 -0.03
Dark 2.309 0.76 1.526 0.68 2.395 1.39 -2.536 -0.93 -2.866 -1.47 -1.008 -0.74
Hope 0.625 -0.24 -1.216 -0.63 0.848 0.57 -3.432 -1.50 -2.512 -1.54 1.590 1.39
Buyout 1.614 0.76 1.955 1.24 1.396 1.15 2.545 1.36 1.568 1.18 0.776 0.83
Market / Book -0.279 -0.42 -0.155 -0.32 -0.187 -0.50 0.1624 0.28 0.0410 0.10 -0.010 -0.03
Fund Age 0.029 -0.24 -0.015 -0.17 -0.103 -1.52 -0.064 -0.61 -0.0218 -0.29 0.009 0.17
Portfolio Size 0.048 0.25 0.039 0.27 0.040 0.37 -0.028 -0.16 0.0153 0.12 0.069 0.80
Distance Km 0.003 0.78 0.001 0.57 0.001 0.63 0.0032 1.07 0.0041 1.97** 0.003 1.92**
Internal DD 1.280 0.37 -1.015 -0.40 -0.106 -0.06 0.533 0.15 -0.6443 -0.24 0.776 0.45
Constant -11.849 -2.04 -10.297 -2.39** -6.228 -1.89* -10.111 -1.98 -7.245 -1.99 -5.663 -2.22
Number of Observations 178 178 178 178 178 178
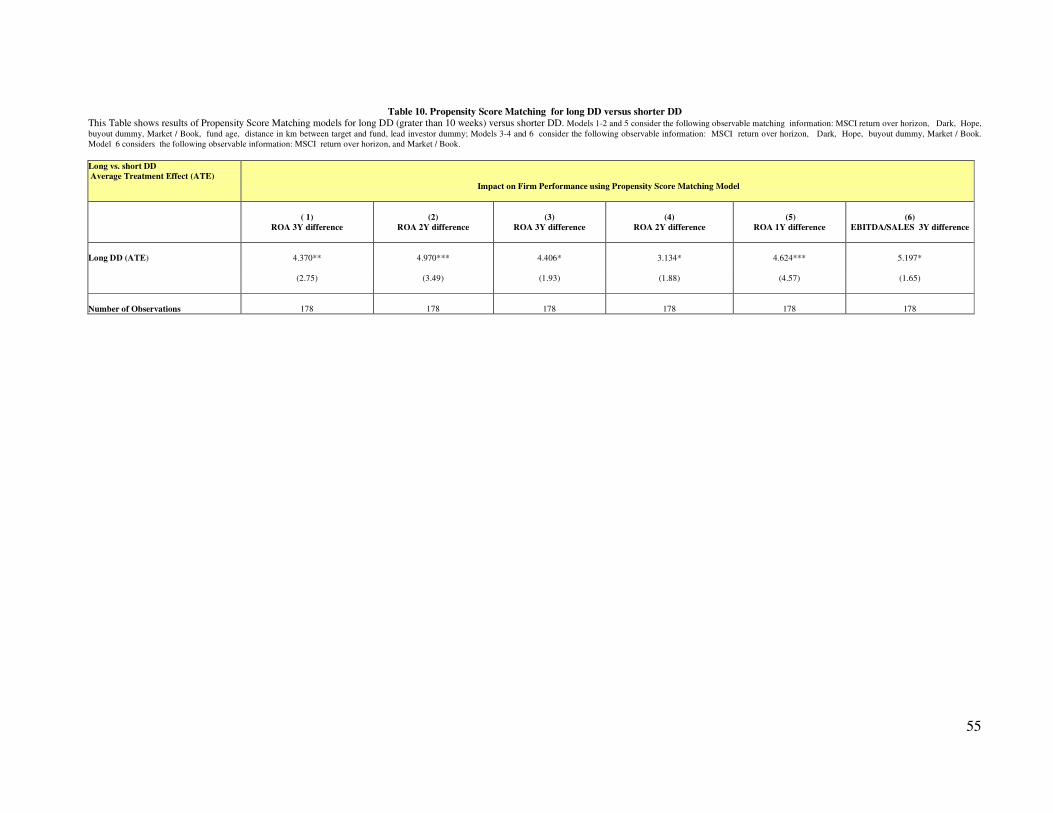
55
Table 10. Propensity Score Matching for long DD versus shorter DD
This Table shows results of Propensity Score Matching models for long DD (grater than 10 weeks) versus shorter DD. Models 1-2 and 5 consider the following observable matching information: MSCI return over horizon, Dark, Hope,
buyout dummy, Market / Book, fund age, distance in km between target and fund, lead investor dummy; Models 3-4 and 6 consider the following observable information: MSCI return over horizon, Dark, Hope, buyout dummy, Market / Book.
Model 6 considers the following observable information: MSCI return over horizon, and Market / Book.
Long vs. short DD
Average Treatment Effect (ATE)
Impact on Firm Performance using Propensity Score Matching Model
( 1)
ROA 3Y difference
(2)
ROA 2Y difference
(3)
ROA 3Y difference
(4)
ROA 2Y difference
(5)
ROA 1Y difference
(6)
EBITDA/SALES 3Y difference
Long DD (ATE)
4.370**
4.970***
4.406*
3.134*
4.624***
5.197*
(2.75)
(3.49)
(1.93)
(1.88)
(4.57)
(1.65)
Number of Observations 178
178
178
178
178
178

56
Table 11. Impact of DD Duration on Other Performance Measures and Other Performance Timing This Table presents second-stage estimates of the impact of DD duration on other performance measures. Panel A shows the impact on IPO exit outcomes (Models 1-3), as well as the impact on three-year ROE differences (Model 4 is similar to the
specification presented in Model 5 of Table 5; Models 5-6 are similar to the specification presented in Model 6, Table 5) . Panel B shows the impact on ROA, ROE and EBITDA/SALES recorded at the time of exit. Variables are defined in Table 1. T-
statistics in parentheses. *, **, *** Significant at the 10%, 5%, and 1% levels, respectively.
Table 11 - Panel A : IPO and ROE Second-Stage Estimates
Impact of DD duration on IPO exit outcomes Impact of DD duration on ROE 3Y difference
Second-Stage Estimates
(1)
logit
(2)
logit
(3)
Heckman Probit Selection
(4)
Double clustering by fund and
year, No Year and Fund
Dummies
(5)
No double clustering,
no year and fund
dummies
(6)
No double clustering, no
year and fund dummies
Coefficient t-Statistic Coefficient t-Statistic Coefficient t-Statistic Coefficient t-Statistic Coefficient t-Statistic Coefficient t-Statistic
Ln Number of Weeks Due Diligence
(Fitted, Table 4, Model 2)
7.013 2.08** 6.970 2.06 ** 2.440 1.71 * 25.429 2.52** 23.692 2.57** 25.429 2.66**
MSCI_total_return 2.165 1.87* 2.082 1.79 1.091 1.70* -.8037 -0.22 -0.196 -0.03 -0.804 -0.11
Dark 3.575 2.43** 3.412 2.27* 1.192 1.00 7.5268 1.99* 7.374 1.13 7.527 1.14
Hope -0.391 -0.43 -0.4126 -0.45 -0.408 -0.72 2.458 0.72 2.785 0.53 2.458 0.46
Buyout 0.9283 1.05 0.8739 0.98 1.273 0.55 1.213 0.28 1.273 0.29
Market / Book 0.093 0.63 0.090 0.60 0.033 0.38 -0.800 - -0.832 -0.62 -0.800 -0.59
Portfolio Size -0.573 -0.64 -0.645 -0.68 -0.474 -0.92 0.231 0.86 0.230 0.60
N. of funds -1.035 -1.88* -0.965 -1.69* -0.308 -1.30
Fund Age -0.047 -0.40 -0.030 -0.46 -0.099 -0.73 -0.099 -0.40
Fund Dummies NO NO NO YES NO NO
Year Dummies NO NO NO NO NO NO
Double Clustering by Fund and Year NO NO NO NO NO NO
N. of syndicated investor 0.045 0.33
Constant -15.197 -2.23 ** -14.834 -2.17** -5.081 -1.69 -51.233 -2.49** -47.785 -2.44** -51.233 -2.52 **
Number of Observations 150 150 157 178 178 178
R-squared 1.1668 0.1692 0.0458 0.0428 0.0458

57
Table 11 - Panel B: Performance at Time of Exit Impact on Firm Performance , measured at time or exit - Second-Stage Estimates
Second-Stage Estimates
(7)
Impact on ROA recorded at the
time of exit (double clustering by
fund and year, no Year and Fund
Dummies)
(8)
Impact on ROA at the time of exit,
with control for sample selection
biases for the decision of exit (using
the “treatreg” command in Stata)
(9)
Impact on EBITDA/SALES
recorded at the time of exit (OLS,
Clustered SE by Fund)
(.10)
Impact on EBITDA/SALES recorded at
the time of exit with control for sample
selection biases for the decision of exit (using
the “treatreg” command in Stata)
Coefficient t-Statistic Coefficient t-Statistic Coefficient t-Statistic Coefficient t-Statistic
Ln Number of Weeks Due Diligence (Fitted, Table 4, Model
1)
4.292666 2.55** 3.011046 1.69*
Ln Number of Weeks Due Diligence (Fitted, Table 4, Model
2) 5.403774 4.38*** 5.393153 2.51**
MSCI_total_return 8.074677 2.23** 8.388335 2.00** 6.37659 1.13 7.886671 2.81**
Dark 1.706252 0.66 2.079738 0.79 -5.396404 -1.75* -4.313342 -1.73*
Hope -1.633067 -1.63 -1.488414 -0.68 -6.626974 -2.04* -6.086175 -2.97**
Buyout -.0344121 -0.02 .0052219 0.00 1.43396 0.93 .456812 0.28
Market / Book .2777362 2.21** .2755038 0.78 .4608759 1.69 .4015963 0.79
Portfolio Size .0315435 0.27 .0337145 0.74
Fund Age -.1605734 -1.50 -.1709404 -1.83 -.1681064 -3.08** -.1160093 -1.28
Financial crisis dummy 7.256506 1.90* 7.445651 1.52 1.066826 0.37
Constant -5.982094 -3.81*** 4.950598 0.48 7.432412 1.95* 9.750145 1.59
Number of Observations 131 131 131
131
R-squared 0.0675 0.1311
* p<0.1, ** p<0.05, *** p<0.01.

58
Table 12. Robustness checks considering different type of instruments
This Table reports second-stage estimates showing the impact of DD duration on firm performance by considering different instruments. Panel A considers the inclusion in the second stage of different types of fund
characteristics (e.g., number of funds managed, number of portfolio firms). Panel B considers the impact on firm performance derived by the adoption of a new instrument (i.e., the kilometric distance between the fund and the target company). Panel C considers the adoption of another alternative new instrument given by the time spent on performing the due diligence in other target firms belonging to the same industry and acquired in the
same year. T-statistics in parentheses. *, **, *** Significant at the 10%, 5%, and 1% levels, respectively.
PANEL A: Control for fund characteristics IMPACT ON ROA 3Y DIFFERENCE IMPACT ON EBITDA/SALES 3Y DIFFERENCE
(1) (2) (3) (4) (5) (6) (7) (8) (9) (10) (11)
Second-Stage Estimates Double
Clustering Double
Clustering Double
Clustering
Double
Clustering
OLS OLS Double
Clustering
Double
Clustering
Double
Clustering
OLS OLS
Ln Number of Weeks Due Diligence (Fitted,
Table 4, Model 1)
41.73** 42.34* 4.525** 5.967*** 4.525* 72.77*** 69.61*** 70.76*
(2.028) (1.987) (2.599) (4.542) (1.699) (3.213) (3.025) (1.931)
Ln Number of Weeks Due Diligence (Fitted,
Table 4, Model 2)
15.85*** 24.76*** 15.15***
(2.925) (2.935) (3.155)
MSCI_total_return 2.331 2.157 4.103 4.514 4.103 3.679 1.161 1.208 1.194 4.456 4.842
(0.542) (0.501) (1.538) (1.471) (1.145) (1.030) (0.413) (0.477) (0.481) (1.404) (1.530)
Dark -3.107 -1.728 2.439 2.814** 2.439 5.991* 7.562 -4.188 -4.193 1.832 0.0724
(-0.452) (-0.291) (1.437) (2.281) (0.802) (1.762) (-0.924) (-0.928) (0.534) (0.0240)
Hope -8.913** -8.911** -0.550 -0.577 -0.550 -0.00216 -4.999 -15.88*** -16.49** -3.734 -3.201
(-2.416) (-2.372) (-0.276) (-0.236) (-0.206) (-0.000817) (-1.313) (-2.907) (-2.200) (-1.590) (-1.365)
Buyout 5.083 5.279 1.090 0.829 1.090 1.002 14.34** 12.89** 13.19 5.509** 2.465
(1.422) (1.309) (0.699) (0.490) (0.474) (0.438) (2.514) (2.013) (1.470) (2.412) (1.216)
Market / Book 0.831 0.833 -0.316 -0.126 -0.316 -0.0645 1.896** 1.676 1.692 0.366 0.364
(1.159) (1.063) (-0.914) (-0.824) (-0.463) (-0.0949) (2.058) (1.610) (1.476) (0.604) (0.605)
Preplanned IPO -1.068 -1.906 -4.238 0.218 -5.343**
(-0.656) (-1.108) (-1.602) (0.155) (-2.280)
Preplanned Acquisition -0.290 2.190 1.553 -0.293 0.596
(-0.126) (0.710) (0.654) (-0.0772) (0.283)
Fund Age -2.733** -2.775*** -0.0530 -0.0555 -0.0530 -0.0887 -3.371 -3.236 -3.304 -0.0458 -0.126
(-2.634) (-3.026) (-0.765) (-0.870) (-0.426) (-0.721) (-1.650) (-1.594) (-1.326) (-0.417) (-1.157)
Portfolio Size 0.272 0.264 0.0209 0.0183 0.0209 0.0992 0.213 0.216 0.221 0.0639 0.0142
(1.344) (1.643) (0.228) (0.215) (0.110) (0.110) (1.271) (1.336) (0.836) (0.366) (0.0835)
N. of Funds 0.0148 0.677 0.677 -2.787 -2.582 -2.769**
(0.0154) (1.241) (0.799) (-1.408) (-1.237) (-2.058)
Fund dummies YES YES NO NO NO NO YES YES YES NO NO
Year dummies YES YES NO NO NO NO YES YES YES NO NO
Clustering by Fund and Year YES YES YES YES NO NO YES YES YES NO NO
Constant -73.56* -74.71* -9.066*** -11.13*** -9.066 -30.46*** -132.7*** -126.6*** -131.3* -43.39*** -25.79***
(-1.846) (-1.838) (-3.204) (-9.309) (-1.557) (-2.766) (-3.399) (-3.176) (-1.930) (-2.714) (-2.643)
Observations 178 178 178 178 178 178 178 175 175 178 178
R-squared 0.271 0.270 0.050 0.058 0.050 0.073 0.313 0.303 0.303 0.116 0.128

59
PANEL B: Adoption of a new instrument given by the
kilometric distance between funds and their target firms
IMPACT ON ROA 3Y DIFFERENCE IMPACT ON EBITDA/SALES 3Y DIFFERENCE
(1) (2) (3) (4) (5) (6) (7) (.8)
Second-Stage Estimates Double Clustering Double Clustering OLS OLS Double Clustering Double Clustering Double Clustering OLS
Ln Number of Weeks Due Diligence (Fitted, Table 4,
Model 1, with the adoption of the instrument “km
distance” instead of “same region”)
4.748*** 5.873*** 38.41*** 46.41** 5.740*
(3.817) (4.510) (3.651) (2.051) (1.843)
Ln Number of Weeks Due Diligence (Fitted, Table 4,
Model 2, with the adoption of the instrument “km
distance” instead of “same region”)
10.91** 15.94*** 9.461**
(2.374) (2.938) (2.304)
MSCI_total_return 4.203 4.566 3.873 3.657 2.171 1.945 5.258*** 5.036
(1.439) (1.475) (1.098) (1.024) (0.655) (0.665) (5.251) (1.599)
Dark 2.770** 2.788** 4.417 6.018* 5.305 2.570 -3.115 -1.557
(2.405) (2.235) (1.363) (1.770) (0.674) (-1.634) (-0.538)
Hope -0.365 -0.597 -0.262 0.00757 0.357 -3.464 -3.876*** -3.594
(-0.156) (-0.244) (-0.0995) (0.00286) (0.114) (-1.111) (-3.057) (-1.528)
Buyout -0.00129 0.826 1.687 1.004 8.607** 8.962 2.897 2.745
(-0.000829) (0.494) (0.791) (0.439) (2.045) (1.387) (1.650) (1.441)
Market / Book -0.182*** -0.127 -0.276 -0.0638 0.930 1.324 0.155 0.152
(-2.711) (-0.843) (-0.409) (-0.0939) (1.536) (1.365) (0.252)
Preplanned IPO -1.916 -1.887 -4.258 -0.798
(-1.158) (-1.114) (-1.610) (-0.529)
Preplanned Acquisition 2.438 2.194 1.548 1.611
(0.775) (0.710) (0.652) (0.575)
Fund Age -0.0767 -0.0550 -0.0891 -2.110 -0.0750*
(-1.125) (-0.861) (-0.724) (-1.108) (-1.800)
Portfolio Size 0.0245 0.0175 0.1000 0.0225 0.0854 (0.329)
(0.301) (0.204) (0.522) (0.283) (0.572) -0.0543*
N. of Funds 0.831* -2.059
(1.830) (-1.134)
Fund dummies NO NO NO NO YES YES NO NO
Year dummies NO NO NO NO YES YES NO NO
Clustering by Fund and Year YES YES NO NO YES YES YES NO
Constant -9.723 -10.94*** -21.40** -30.63*** -78.22*** -83.79** -8.008 -16.08*
(-8.807) (-2.195) (-2.779) (-3.766) (-2.051) (-1.313) (-1.847)
Observations 178 178 178 178 178 178 178 178
R-squared 0.063 0.058 0.048 0.073 0.269 0.285 0.105 0.091
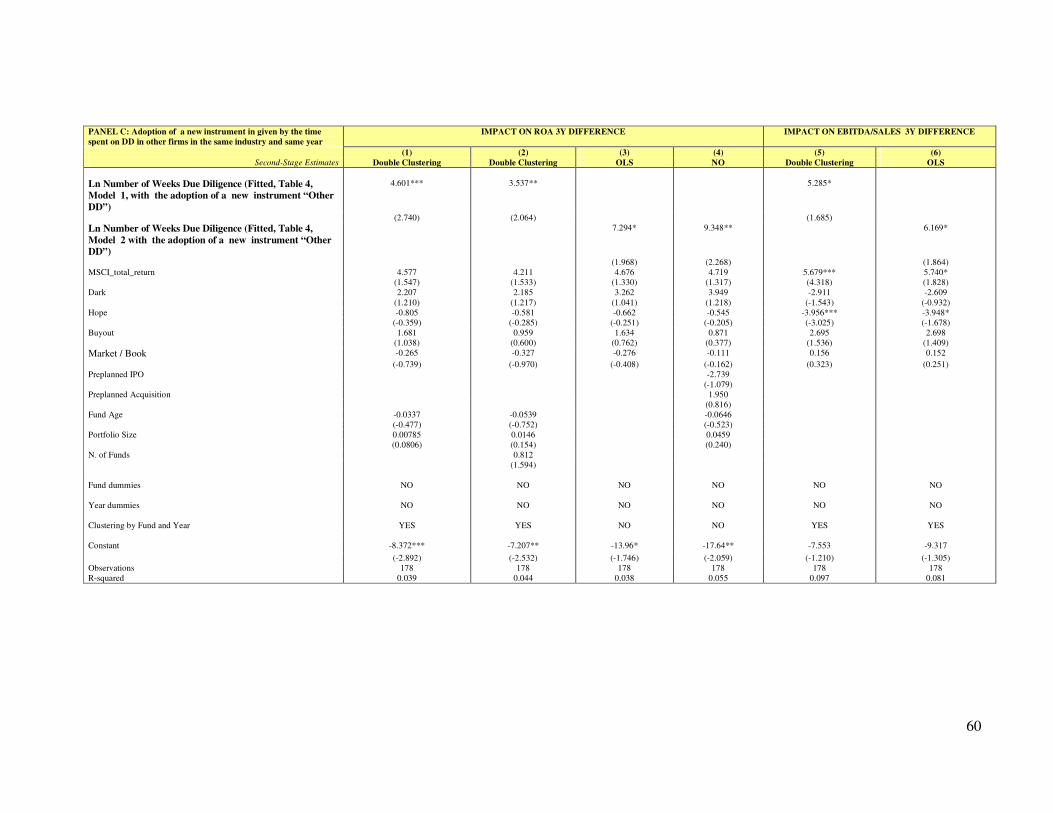
60
PANEL C: Adoption of a new instrument in given by the time
spent on DD in other firms in the same industry and same year
IMPACT ON ROA 3Y DIFFERENCE IMPACT ON EBITDA/SALES 3Y DIFFERENCE
(1) (2) (3) (4) (5) (6)
Second-Stage Estimates Double Clustering Double Clustering OLS NO Double Clustering OLS
Ln Number of Weeks Due Diligence (Fitted, Table 4,
Model 1, with the adoption of a new instrument “Other
DD”)
4.601*** 3.537** 5.285*
(2.740) (2.064) (1.685)
Ln Number of Weeks Due Diligence (Fitted, Table 4,
Model 2 with the adoption of a new instrument “Other
DD”)
7.294* 9.348** 6.169*
(1.968) (2.268) (1.864)
MSCI_total_return 4.577 4.211 4.676 4.719 5.679*** 5.740*
(1.547) (1.533) (1.330) (1.317) (4.318) (1.828)
Dark 2.207 2.185 3.262 3.949 -2.911 -2.609
(1.210) (1.217) (1.041) (1.218) (-1.543) (-0.932)
Hope -0.805 -0.581 -0.662 -0.545 -3.956*** -3.948*
(-0.359) (-0.285) (-0.251) (-0.205) (-3.025) (-1.678)
Buyout 1.681 0.959 1.634 0.871 2.695 2.698
(1.038) (0.600) (0.762) (0.377) (1.536) (1.409)
Market / Book -0.265 -0.327 -0.276 -0.111 0.156 0.152
(-0.739) (-0.970) (-0.408) (-0.162) (0.323) (0.251)
Preplanned IPO -2.739
(-1.079)
Preplanned Acquisition 1.950
(0.816)
Fund Age -0.0337 -0.0539 -0.0646
(-0.477) (-0.752) (-0.523)
Portfolio Size 0.00785 0.0146 0.0459
(0.0806) (0.154) (0.240)
N. of Funds 0.812
(1.594)
Fund dummies NO NO NO NO NO NO
Year dummies NO NO NO NO NO NO
Clustering by Fund and Year YES YES NO NO YES YES
Constant -8.372*** -7.207** -13.96* -17.64** -7.553 -9.317
(-2.892) (-2.532) (-1.746) (-2.059) (-1.210) (-1.305)
Observations 178 178 178 178 178 178
R-squared 0.039 0.044 0.038 0.055 0.097 0.081

61
Figure 1. Survey Procedure and Timing
This Figure summarizes the three-stage survey employed to collect the data underlying this paper.
Part A
Part B
Jan.
2010
Mar.
2013
Jul.
2013
3rd Stage
Survey
on
Divestments and
Firm Performance
By the end of second
survey
survey
Interviews
Exit period
up to Dec. 2012
23 additional exits
(Total 150 exits)
Cross Checks of
Performance,
Delistings, Frauds
& Survey
integration
5 Funds
12 Firms
RR (25%)
15 Funds
39 Firms
RR (75%)
Jan.
2013
CCoovveerraaggee:: 117788 PE deals; 2277 PE funds; 115500 completed investments (exited investments) by December 2012;
2288 non-exited investments.
51 non-
exited
investments
� 20 Funds
20 Funds
From Jan. 2010, we
waited 3 additional years
to allow investors to exit
28 non-
exited
Firms
13
Funds.
Dec.
2005
May
2006
Aug.
2006
Dec.
2006 Jan.
2010
Jul
2010
Dec.
2010
1st Stage
Survey
on PE Cycle &
Governance
2nd
Stage Survey
on Divestments,
Exit Outcomes,
Expectations
Survey validation:
Cross Checks
& Survey
Integration
Internet survey
Interviews Mail
survey
Interviews
Total Response Rate/Coverage: 117788 investments; 112277 exits; 27 PE funds;
8844%% of PE investors actively involved in the buyout industry; 38% of buyout deals
47% of the PE funds actively engaged in the PE industry;
Exit period
up to Dec. 2009
(127 exits)
Cross
Checks
& Survey
integration
5 Funds
19 firms
RR (9%)
8 Funds
49 firms
RR (14%)
19 Funds
93 firms
RR (70%)
8 Funds
85 firms
RR (30%)
We waited
3 years
to allow investors to exit
14 Funds
110 firms
RR (24%)
Oct.
2005
survey �
� 88 (All VC Members)
but 57 are active in PE mkt.
� 27 Funds

62
APPENDIX: Data Collection, Response Rate and Representativeness of our Database
In this section we describe the methodology employed to collect our data, as well as present
summary statistics of the PE investments carried out in Italy over the 1999-2006 period, and the
associated divestments occurred over the 2000-2012 period. Part A of this Appendix describes the
methodology underlying our dataset. It describes in greater detail the survey procedure, the
response rate we obtained and the survey-integrations we carried out to maximize the
representativeness of our ultimate sample. Part B discusses sample representativeness by describing
a number of representativeness tests and potential sample selection bias.
Part A. Data Collection Methods
The primary source of information underlying our database is represented by a three-stage
survey of PE deals carried out from 1999 to 2006 (investment period), and PE divestments realized
from 2000 to 2012 (divestment period).
(a) Survey Procedure
We collected the data by undertaking a three-stage survey of international and local venture
capitalists actively involved in Italy over the 1999-2006 period. For each survey we employed a
sequential mixed mode (SMM) survey approach (see De Leeuw 2005 and Dillman et al. 2009 for
details), in combination with the “Total Design Method” (TDM), developed by Dillman (1978)
specifically for mail and telephone surveys. The sequential mixed mode survey (SMM) is a
particular survey procedure that recommends the adoption of a different survey mode in sequential
phases.16
To better highlight the research framework and time frame underlying our study, in the
following sub-section we summarize the entire survey procedure employed to collect our database.
16
With the sequential mixed mode approach, the non respondents to a mail survey (phase 1) are contacted and
requested to answer the questionnaire through a different survey mode, e.g., web survey (phase 2). Thereafter, the non
respondents of phase 2 are contacted and requested to answer the questionnaire through a different mode (e.g., a
telephone or a face-to-face interview). Recent studies show that this survey methodology significantly improves the
response rate (see, e.g., De Leeuw, 2005; Dillman et al., 2009).
63
1st Survey - In October 2005 we prepared a first survey on PE investment cycle
(characterized by a four-page questionnaire) and conducted a pilot study in order to test its efficacy
and clearness. The feedbacks on our pilot study helped us review the questionnaire. The ultimate
version of the questionnaire was sent in December 2005. In order to minimize potential sample
biases, we sent the questionnaire to all members of the Italian Venture Capital Association (AIFI),
which at that time recorded 88 full members.17
In the first place, we administered our survey by
post and devoted particular attention to following all the steps highlighted by Dillman (1978). The
purpose of our first survey was to gather detailed and unique information on investment
characteristics, screening criteria of target firms, due diligence procedure, deal structure and
governance mechanisms employed by international and local PE investors active in Italy, as well as
exit rights and exit expectations. After eliminating double-counted investors and various non-
applicable replies that we received in the subsequently weeks (e.g., some investors were new, other
investors were not active in the PE sector but only in the early stage sector), we identified 57
investors actively involved in the PE industry. This number was in line with the number of active
investors published by the PEM database and PEM Statistics in 2005. After performing our mail
survey, only 5 PE investors replied (response rate of 9%) and provided us with detailed information
on 19 target firms. In line with the suggestions of Dillman et al. (2009), a few months later we
contacted the non respondents to the mail survey and asked them to answer the questionnaire via
fax (or e-mail). Thereafter, 8 PE investors replied (response rate of 14%) providing us with
17
According to AIFI statistics published in October 2005, the total number of AIFI members was 88. According to the
PEM database, the total number of investors actively involved in the PE sector was lower (57). However, the
information about the specific identity of the investors active in the PE sector was not publicly available. Therefore, we
decided to send the questionnaire to all 88 AIFI members, being aware of the fact that this list was not entirely
applicable to our survey (some investors were new, others were not actively involved in the PE industry because they
were specialized in start-up financing only). For our mail survey, we followed all the steps and suggestions
recommended by Dillman (1978), devoting particular attention on the content of the package that was sent to each
investor along with the questionnaire. Each investor received a package containing: a four-page questionnaire, a cover
letter containing the motivation underlying the research project and a presentation of the authors’ main research; a
signed confidential agreement; a glossary of the PE terminology included in the questionnaire, and a reward promise
made by the authors in terms of follow-up reports summarizing the results of the survey.

64
complete information on additional 49 PE investee firms. In June 2006, we contacted the non-
respondents once again in order to ask their permission to perform a face-to-face interview in their
office. Additional 14 investors (response rate 24%) agreed to partake in our survey and provided
full information about 110 target firms. By the end of August 2006, we completed the interview
process related to our first survey and collected detailed data on PE investments in 178 target firms
acquired in Italy over the period from January 1999 to 2006 (second quarter). For each investee
firm, we gathered information on target companies, screening procedure, investor rights and
governance mechanisms employed by PE investors.
2nd
Survey - Normally, PE fund managers exit their investments in 3-5 years (see, e.g.,
Cumming and Johan 2009). In order to investigate exit outcomes, we waited for another three years
and a half to allow PE funds to exit their investee firms. In January 2010, we started a second
survey of the same 27 PE investors included in our sample, with the aim of collecting information
on the development of the investee firms included in our sample and gather additional information
on exited investments, associated investment returns (in terms of IRR), and exit expectations for the
non-exited investments. Upon request, 19 PE firms replied to our second survey directly via e-mail
(response rate of 70%), providing us with information on the performance of their investments in 93
target firms. The remaining 8 PE firms (30%) agreed to answer the second survey only trough a
face-to-face interview. By the end of July 2010, we completed the scheduled interviews and we
collected information on exit outcomes of additional 85 target firms. By the end of our second
survey, we collected detailed information on 127 divestments, which occurred from January 2000
to December 2009. For each divestment we recorded the following information: exit routes (i.e.,
IPO, trade sale, secondary sale, buyback, write-off), divestment values, exit years, and associated
investor returns (in terms of IRR). For each non-exited investments, we gathered information on
exit expectations of PE investors (e.g., expected year, expected divestment route and value, as well
as expected IRR returns). By the end of our second survey, in December 2010, our dataset included
51 non-exited investments performed by 20 PE funds.

65
3rd
Survey - In order to have a more complete picture of the exited investments, we waited
for three more years to allow the remaining PE funds to exit their investee firms. In January 2013,
we started our third survey by contacting the remaining 20 PE investors included in our database.
Our purpose was to collect information on additional divestments, exit routes, exit outcomes, and
firm performances. Upon request, 5 PE investors replied promptly to our mail survey, providing us
with detailed information on their divestments in 12 target firms. The remaining 15 investors
accepted to answer the questionnaire through an interview, after which we collected information on
39 target firms. By the end of our third survey (March 2013), our database included 150
divestments, occurred over the period from January 2000 to December 2012. We also monitored the
performance of the venture-backed firms that went public over the same divestment year, and
collected information on potential post-IPO bankruptcies, legal investigations, and the delisting
occurred until December 2012.
(b) Survey Integration and Response Rates
In order to validate, correct and integrate the information gathered through our three-stage
survey, we considered a number of secondary sources. First, we compared our data with the
Statistics Report provided by the Italian Venture Capital Association (AIFI), available at the AIFI
website, in combination with two additional private equity databases: a) the Private Equity Monitor
(PEM®
) dataset, developed by AIFI in association with Università Cattaneo – LIUC, and b) Venture
Economics database. With this first comparison we cross-checked, and eventually corrected, the
information we received on investment characteristics (i.e., target firm, location, investment year,
industry, invested amounts and divestment values). Second, we considered the AIDA database by
Bureau Van Dijk to collect information on financial performances of the target firms included in
our database, e.g., Return on Assets (ROA) Ratios, and EBITDA to sales ratios, as well as the
balance sheets of the target firms included in our database, their Debt to Equity ratios, and the cost
of debt over the 1999-2006 period. Third, we collected further information on market conditions, by
looking at Datastream by the Thomson Corporation, MSCI database, and Borsa Italiana. We

66
integrated our database with important control variables related to market returns, and industry
market to book values. Fourth, we considered additional sources of information in order to make
sure that our dataset included the majority of the investments listed in each fund website, as well as
minimize potential sample biases and avoid the risk of having a sample biased toward the most
successful PE deals. Among these additional sources, we checked investor websites, financial
reports provided by investors, and the most relevant economic press release. In so doing, we
gathered important information about fund characteristics (i.e., age, location, portfolio size, capital
under management, legal structure, independency, number of partners, executives and directors).
The response rates associated with our survey are reported in Table A.1, Panel A. Despite
the difficulties associated with the implementation of a three-stage survey on confidential
information, we obtained a high response rate. With reference to the PE market as a whole, we
obtained a total response rate of 47% (27 over 57 investors actively involved in the PE industry in
2005). Considering the buyout sub-sector, our survey covers 84% of the buyout investors active in
Italy by the end of 2005 (21 over 25 PE funds). Considering the total number of buyout transactions
reported in the PEM®
Statistics, our dataset comprises 38% of the buyouts carried out in Italy over
the 1999-2006 period (see Table A.1, Panel A). These response rates compare favorably with
previous surveys in the finance field (e.g., Brau and Fawcett, 2006, who received a total response
rate of 19%; Graham and Harvey, 2001, who obtained a 9% response rate).
Part B. Sample characteristics and Sample Representativeness
Our ultimate dataset includes 178 target firms, acquired by 27 private equity organizations
covering approximately 85% of the buyout investors operating in Italy from 1999 to 2006
investment period. The data include detailed information on 150 exits realized over the 2000-2012
divestment period. Our dataset includes both quantitative and qualitative information about: a)
investment and divestment values; b) deal structure; c) valuation models employed by investors; d)
returns associated with the exited investments; d) performance of the target firms (from the

67
investment date up to three years after the investment); e) screening criteria employed by PE
investors to screen out non attractive investment opportunities; these criteria are ranked on a scale
of 1–5 in order to capture the level of relevance associated with each criterion, as perceived by PE
investors; f) financial forms employed by PE investors, as well as the control and cash flow rights
retained by them (including exit rights and events upon which a reallocation of cash flow and
control right may occur).
To evaluate the representativeness of our sample, we compared our dataset with both AIFI
Statistics Reports and the Private Equity Monitor (PEM®
) database, which includes generic and
standard information about all PE deals realized in Italy. Table A.1 shows the various comparison
tests we performed between the PEM data (or AIFI data) and our sample to ensure the
representativeness of our dataset (see Table A.1 Panels B–G). In particular, Panels B-D compare
our database with the PEM sample, while Panels E–G compare our data with the AIFI Statistics
Reports. We performed several comparison tests with respect to various sample characteristics:
target firm location (Panel B); industry distribution of PE transactions (Panel C, part 1) and buyouts
(Panel C, part 2); yearly distribution of PE investments over the 1999-2006 period (Panel D); exit
distribution of PE divestments over the 2000-2012 period (Panel E); IPO distribution over the 2000-
2012 time horizon (Panel F); and write-off distribution (Panel G). As highlighted in Table A.1
(Panels B–G), our sample is quite similar to the datasets provided by AIFI and PEM. Apart from a
few exceptions, no statistically significant differences exist between our dataset and the PEM
database (Panels B–D). Similar patterns emerge when comparing our dataset with the AIFI
Statistics Reports (Panels E–G): the comparison tests do not show statistically significant
differences, apart from a few rare cases. For example, Panels B and C focus on the location
distribution of target firms (Panel B) and industry distribution of PE investments realized in Italy
(Panel C). The comparison tests show no significant differences between Private Equity Monitor
68
(PEM) data and our sample.18
Similar trends are observed in Panel E, which focuses on distribution
of divestments realized from 2000 to 2012. In terms of exit distribution, the comparison tests in
Panel E do not show statistically significant differences. In terms of yearly distribution of buyout
investments (Panel D), IPO distribution (Panel F) and write-off distribution (Panel G), the
comparison tests indicate scant statistical significance in terms of differences between our sample
and the PEM®
or AIFI data. Panel D shows that the proportion of buyouts is similar in both
datasets, apart from the years of 2000 and 2004, for which our sample comprises a higher
proportion of buyouts. The comparison tests in Panels F do not highlight significant differences
except for the years of 2003 and 2004, for which AIFI Statistics report higher proportion of IPO
exits. Similar conclusions can be driven by looking at Panel G, which compares the write-off
distribution related to AIFI dataset with the one related to our sample. In Panel G, no relevant
differences emerge, aside from the sole exception of the year 2007, for which our database report a
higher percentage of write off.
[Insert Table A.1 About Here]
18 It is worth noting that the PEM® data highlighted in Panels B–D cover the period 1999–2003, the years for which the
information is available. For Panels B–D, comparison tests in our sample are reported for the 1999–2006 period. We
also performed comparison tests with reference to the shorter period (1999–2003) and did not observe materially
different results.

69
Table A.1. Representativeness Tests
This Table presents comparison of proportions tests between the survey data used in this paper relative to the data reported by the PEM® database,
published by the Italian Venture Capital and Private Equity Association (AIFI) in association with the “Masters in Merchant Banking” team of
Università Carlo Cattaneo ( LIUC). To show that the data are representative of the population, we perform various comparison tests (see Panels B- G). Panel A summarizes the response rate and coverage for our sample. Panel B compares the proportion of investments by location, Panel C
compares the industry sectors for all types of PE investments and buyout transactions, Panel D compares the years of investment, Panel E compares
the exit year distributions of investments, Panel F compares the IPO exit years, Panel G companies the write-off exit years. The *, **, *** indicate statistical significance at the 10%, 5% and 1% levels, respectively.
Panel A: Response Rate
PEM & AIFI STATISTICS
REPORTS OUR SURVEY
RESPONSE RATE &
COVERAGE
Total number of AIFI members in
Oct. 2005, including new funds, VC
funds and PE funds (source: AIFI
statistics, October 2005) 88 27 31%
Total number of buyout deals carried
out within the 2000-06 period
(source: PEM database) 284 109* 38%
Total number of PE firms actively
involved in the PE industry at the
time of our survey (source: PEM
Report 2005) 57 27 47%
Total number of PE firms actively
involved in the buyout industry at
the time of our survey (source: AIFI
statistics, 1st term 2005) 25 21 84%
* with reference to the 2000-06 period
Panel B: Location Comparison PEM SURVEY OUR SURVEY COMPARISON
Location of target firms - Area of
investment (within Italy)
Total # of
Transactions in PEM
(1999-2003)
Proportion ALL
Transactions IN
PEM (1999-2003)
# TOTAL
Transactions in
Our Data (1999-
2006 2nd
quarter) *
Proportion
ALL transactions in
our Data
Comparison of
Proportions Test
North 317 0.81 173 0.78 0.79
Center 317 0.15 173 0.17 -0.58
South 317 0.04 173 0.05 -0.32
Source: PEM 1999-2003
* From our database we excluded 5 transactions carried out
abroad to ensure comparison with the AIFI data
Panel C: Industry Distribution
Comparison PEM SURVEY OUR SURVEY
COMPARISON
(1) All PE transactions
Total # of
Total
Transactions in PEM (99-
2003)
Proportion of
transactions in PEM
(99-2003)
Total #
Transactions in
Our Data (1999-2006 2nd
quarter)
Proportion of
PE deals in
our Data
Comparison of
Proportions Test
Industrial / Basic Material 317 0.45 178 0.46 -0.21
Consumer Goods 317 0.20 178 0.16 1.02
Services / Financial Services 317 0.24 178 0.22 0.45
Telecommunication / Utilities 317 0.06 178 0.05 0.46
Technology 317 0.03 178 0.06 -1.62
Healthcare 317 0.02 178 0.05 -1.85 *
1.00 1.00
Source: PEM 1999-2003

70
Table A.1 continued
(2) Buyouts transactions
Total # of
Total Buyouts
in PEM (1999-2003)
Proportion Buyouts
PEM (99-2003)
Total # Buyouts
Transactions in
Our Data (1999-
2006 2nd
quarter)
Proportion of
Buyout deals
in our Data
Comparison of
Proportions Test
Industrial / Basic Material 134 0.57 115 0.56 0.16
Consumer Goods 134 0.19 115 0.16 0.62
Services / Financial Services 134 0.15 115 0.18 -0.64
Telecommunication / Utilities 134 0.04 115 0.03 0.43
Technology 134 0.03 115 0.04 -0.22
Healthcare 134 0.02 115 0.04 -0.73
1.00 1.00
Source: PEM 1999-2003
PEM SURVEY OUR SURVEY COMPARISON
Panel D: Yearly Distribution
Comparison
Buyouts
Total # of
Transactions
in PEM (1999-2006) °
Proportion Buyouts
PEM (1999-2006)
# TOTAL
Transactions in
Our Data (1999-
2006 2nd
quarter)
Proportion
Buyouts our
Data
Comparison of
Proportions Test
1999 56 0.45 14 0.50 -0.34
2000 69 0.33 16 0.63 -2.18 **
2001 60 0.20 8 0.38 -1.12
2002 61 0.56 26 0.62 -0.48
2003 71 0.56 29 0.55 0.08
2004 55 0.71 29 0.90 -1.94 *
2005 89 0.70 42 0.67 0.38
2006 2nd quarter °° 95 0.36 14 0.36 0.02
° Source: PEM 1999-2003; PEM 2005 for years 2004-2005. 178
°° Source: AIFI Statistic Report 2006, 2nd quarter (where the total number of expansion, replacement and buyout deals is 48, 13, and 34
respectively).
AIFI DATABASE OUR SURVEY COMPARISON
Panel E: Exit Distribution
Comparison
EXIT DISTRIBUTION-ALL TRANSACTIONS (2000-2009)
Total # of exit in AIFI
database
(1999-2012)
Proportion of exits through
trade sale in
AIFI
# Exits in Our
Dataset (1999-
2012)
Proportion of exits through
trade sale in
our Database
Comparison of Proportions Test
2000 188 0.58 3 0.67 -0.31
2001 148 0.55 3 0.66 -0.38
2002 149 0.52 3 0.33 0.65
2003 222 0.52 10 0.50 0.12
2004 137 0.36 11 0.45 -0.60
2005 150 0.47 10 0.70 -1.41
2006 181 0.38 22 0.52 -1.27
2007 207 0.51 25 0.50 0.09
2008 181 0.54 21 0.53 0.09
2009° 143 0.6 19 0.47 1.05
2010 123 0.51 3 0.66 -0.51
2011 139 0.44 2 1.00 -1.58
2012°° 44 0.5 18 0.33 1.22
Source: AIFI statistics 150
° It is worth noting that in 2009, Aifi Annual Report excludes write off from the proportion of exits through Trade Sale.
°° It is worth noting that the total number of Exits recorded in AIFI in 2012 refers to the first semester only.
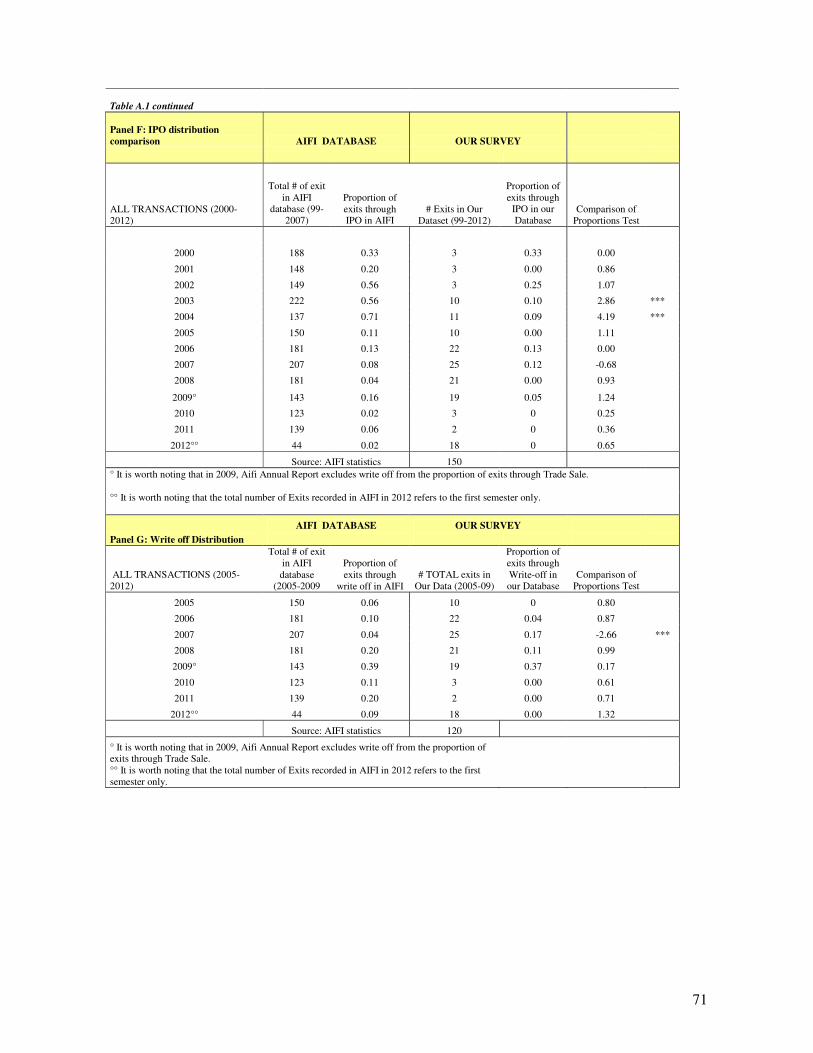
71
Table A.1 continued
Panel F: IPO distribution
comparison AIFI DATABASE OUR SURVEY
ALL TRANSACTIONS (2000-
2012)
Total # of exit
in AIFI database (99-
2007)
Proportion of
exits through IPO in AIFI
# Exits in Our
Dataset (99-2012)
Proportion of
exits through IPO in our
Database Comparison of
Proportions Test
2000 188 0.33 3 0.33 0.00
2001 148 0.20 3 0.00 0.86
2002 149 0.56 3 0.25 1.07
2003 222 0.56 10 0.10 2.86 ***
2004 137 0.71 11 0.09 4.19 ***
2005 150 0.11 10 0.00 1.11
2006 181 0.13 22 0.13 0.00
2007 207 0.08 25 0.12 -0.68
2008 181 0.04 21 0.00 0.93
2009° 143 0.16 19 0.05 1.24
2010 123 0.02 3 0 0.25
2011 139 0.06 2 0 0.36
2012°° 44 0.02 18 0 0.65
Source: AIFI statistics 150
° It is worth noting that in 2009, Aifi Annual Report excludes write off from the proportion of exits through Trade Sale.
°° It is worth noting that the total number of Exits recorded in AIFI in 2012 refers to the first semester only.
AIFI DATABASE OUR SURVEY
Panel G: Write off Distribution
ALL TRANSACTIONS (2005-
2012)
Total # of exit
in AIFI
database (2005-2009
Proportion of
exits through
write off in AIFI
# TOTAL exits in
Our Data (2005-09)
Proportion of
exits through
Write-off in our Database
Comparison of
Proportions Test
2005 150 0.06 10 0 0.80
2006 181 0.10 22 0.04 0.87
2007 207 0.04 25 0.17 -2.66 ***
2008 181 0.20 21 0.11 0.99
2009° 143 0.39 19 0.37 0.17
2010 123 0.11 3 0.00 0.61
2011 139 0.20 2 0.00 0.71
2012°° 44 0.09 18 0.00 1.32
Source: AIFI statistics 120
° It is worth noting that in 2009, Aifi Annual Report excludes write off from the proportion of exits through Trade Sale.
°° It is worth noting that the total number of Exits recorded in AIFI in 2012 refers to the first
semester only.