Embed Size (px)
Citation preview

Weekly Market Review
Talking Points
Weekly Highlights
• Last Friday’s terrorist attacks had little impact on the global equity markets. Unlike many recent events of similar magnitude, the Paris attacks did not trigger a market sell-off on Monday. Perhaps market participants have noticed the losses in the first few days after such events in previous years have typically been recouped in short order.
• The minutes from the October Fed Meeting were released this
week. Among the highlights were the members’ concerns that the delay in raising rates was both increasing the level of uncertainty in the markets and could be interpreted as a lack of confidence in the strength of the U.S. economy. The minutes also emphasized once again the members’ need for positive data over the intervening six weeks, not just general trends, before considering a rate hike on December 15th.
• CPI Index swings back to the positive. The October CPI Index
was up 0.2% after negative readings in August and September. This may be somewhat overstated, however, as the “seasonal adjustments” showed an increase in energy prices even though the price of gasoline actually fell. Over the last 12 months overall inflation is up just 0.2%. Core inflation, excluding food and energy prices, is up 1.9%, very near the Fed’s target inflation rate.
Chart of the Week
November 20, 2015
• Equities were strong, both in the U.S. and internationally, though the emerging markets lagged slightly. England and Germany were leaders in Europe, while Russia dominated the EM names. In the U.S., large cap names outperformed smaller caps and growth modestly outperformed value.
• Treasury yields were mixed during
the week, with 2-year yields rising steadily in the week, 10-year yields were mostly unchanged after rising sharply early in the week before falling below the week’s opening level on Thursday and 30-year yields falling for most of the week.
• Commodities were generally
lower, led by energy and precious metals prices.
• An up and down week for the
dollar started with a modest rally through most of Wednesday, before giving back most of the gains by Thursday’s close. Mario Draghi’s dovish comments on Friday started another modest rally.
• Among other economic data
released this week, weekly unemployment claims dropped slightly to 271,000. Housing starts came in slightly lower than expected (1.06 million vs. 1.15 million) and the home builders sentiment index dropped to 62 from a 10-year high in October of 65. Mortgage applications were up 6.2% last week and are 19% higher than a year ago.
Please note: The PMC Weekly Review will not be published on Friday, November 27th due to the Thanksgiving holiday
1.40
1.60
1.80
2.00
2.20
2.40
2.60
May-15 Jun-15 Jul-15 Aug-15 Sep-15 Oct-15
Yiel
d %
10-Year Treasury Yield - Trailing 180 Days
Source: Bloomberg

PMC Weekly Market Review
2
November 20, 2015
MARKET DASHBOARD
L
S
Source: B loomberg
2.62% 3.32% 3.97%
2.80% 2.87% 2.93%
0.84%-2.45%-5.77%
One Week
Value Growth
2.41% 2.49% 2.57%
YTD
Value Growth
-3.72% 2.40% 8.60%
-4.00% -1.60% 0.67%
1700
1750
1800
1850
1900
1950
2000
2050
2100
2150
5/26 6/9 6/23 7/7 7/21 8/4 8/18 9/1 9/15 9/29 10/13 10/27 11/10
Source: Bloomberg
S&P 500 Index: Trailing 180 Days
% Wgt in
S&P 500
Week %
Chg. YTD % Chg.
Consumer Discretionary 13.1 4.52% 12.4%
Consumer Staples 9.5 2.55% 0.7%
Energy 6.9 1.31% -16.5%
Financials 16.6 3.14% -0.5%
Health Care 14.6 2.75% 4.2%
Industrials 10.2 3.20% -1.2%
Information Technology 21.0 4.28% 7.5%
Materials 2.8 2.48% -6.5%
Telecom Services 2.3 3.24% -3.4%
Utilities 2.9 2.01% -8.7%
Source: Bloomberg
Sector Performance:
S&P/Global Industry Classification Sectors (GICS)
10
15
20
25
30
35
40
45
May-15 Jun-15 Jul-15 Aug-15 Sep-15 Oct-15
Source: Bloomberg
VIX Index: Trailing 180 Days
Last Price Change % Chg. YTD % Last Price Change % Chg. YTD %
S&P 500 2,089.17 66.13 3.27% 1.5% Russell Global EM 2,594.88 49.61 1.91% -11.3%
Dow Industrials 17,823.81 578.57 3.35% 0.0% 10-Year US Treas. 2.26 -2 bps NM NM
Nasdaq 5,104.92 177.04 3.59% 7.8% DJ UBS Comm. Idx. 81.42 -1.01 -1.22% -22.0%
Russell 2000 1,175.15 28.60 2.49% -2.5% Gold $1,078.00 -$5.45 -0.50% -8.9%
Euro Stoxx Index 381.79 12.26 3.32% 11.5% Crude Oil $41.55 -$0.42 -1.00% -30.7%
Shanghai Composite 3,630.50 49.66 1.39% 12.2% Dollar Index 99.63 0.62 0.62% 10.4%
Russell Global 1,687.23 43.12 2.61% -1.7% VIX Index 15.47 -4.61 -22.96% -19.4%Source: Bloomberg; Index % change is based on price.
0.7
0.8
0.9
1
1.1
1.2
1.3
Oct-13 Dec-13 Feb-14 Apr-14 Jun-14 Aug-14 Oct-14 Dec-14 Feb-15 Apr-15 Jun-15 Aug-15 Oct-15
Source: Bloomberg
Wealth Index|Growth of $1: Trailing 24 Months
S&P 500 Dow Industrials Small Cap EAFE Emerging Mkts.

PMC Weekly Market Review
3
November 20, 2015
134135136137138139140141142143144 Dec-10 Feb-11 Apr-11 Jun-11 Aug-11 Oct-11Index S&P/Case-Shiller Home Price Index-Trailing 12 Mos.
Source: Bloomberg
THE ECONOMY AND MARKETS
A Macro View – Crying Wolf Over Rising Interest Rates As we enter the last few weeks of 2015, the sense of déjà vu for economists, portfolio managers, and analysts focused on the domestic fixed income markets must be overwhelming. Starting about this time in 2009, the forecast for the next calendar year was for modestly stronger economic growth and the near certainty that the Fed finally would increase short term interest rates. Yet each succeeding year, growth was muted, if not flat, and the Fed stood pat, but the consensus was that next year would be the year. And here we sit, roughly a month before the final Fed meeting of 2015, with Fed Funds still effectively at 0% and only the possibility of a rate hike. Not only are short rates unchanged, but the 10-year Treasury yield has fallen from 3.88% at the end of 2009 to 2.30% today, and 2013 was the single year in which the 10-year yield ended the year higher than it began. A similar pattern holds for the 30-year Treasury, though it most likely will end 2015 with a yield that is higher than the 2.75% with which it began the year. One might think after six consecutive years of “crying wolf” and being wrong, the outlook and behavior for both professional and retail investors would change. But once again, the consensus is for modestly better growth and at least one rate hike in 2016, whether or not the December hike is realized. And investors of all types continue to clamor for shorter maturity investments to protect them from the “wolf” of rising rates. From the beginning of 2009 through the end of the third quarter, investors have pushed $225 billion into short taxable and municipal mutual funds, increasing AUM in those categories by 3.7x and 3.0x, respectively1. By comparison, intermediate taxable and municipal funds added $350 billion in new assets, but both categories grew by just 2.2x. The “x-factor” is the massive growth in the non-traditional category, which ended 2008 with just under $9 billion in total net assets, but now represents $145 billion (after peaking at $160 billion)—an increase of 16.0x. These funds often have little or even negative duration, and use complex, hedge fund like strategies to create returns. Only slightly more than one-quarter of the more than 120 funds in this space currently have a five-year history, and the median return of those that do is just 1.8%, as of the end of the third quarter. Compare that to the 3.1% return of the Barclays Aggregate Bond Index, or 2.4% return of the Barclays Intermediate Government Credit Bond Index, over the same period. But what would be the “cost” of a series of rate increases over the next 12 months? That would depend heavily on the forecast of when and how many; however, in all but the most extreme scenarios, the cost appears to be rather nominal. At the high end, for example, if the Fed raised rates by a quarter point four times over 12 months, the Barclays Aggregate Bond Index, with a duration of slightly more than 5.5 years, would see a price decline of a little more than 5%, which would be partially offset by income of a little more than 2.5%, for a total loss of 2.50-2.75%2. This would come close to the worst calendar year return on the Index in the last 25 years: -2.92% in 1994, when the Fed hiked rates 2.5% in 12 months. A much more likely scenario would be just two Fed rate hikes in the next 12 months, in which case the Barclays Aggregate Bond Index would come close to breaking even (about a 2.5% price loss offset by the 2.5% income). Both of these estimates are simplistic and crude, and ignore any changes in spreads or outside influences such as a risk-off flight to Treasuries. They do illustrate, however, that the currently expected slow pace of increases in the Fed Funds rate (whenever it actually starts) may create sub-par returns in the major indices (and thus most active managers) in the short term, but they will cluster either side of break-even, rather than produce significant losses. Nathan Behan, CFA, CAIA Senior Vice President, Investment Research
_________________________________ 1 Morningstar Fund Flow Data as of 10/31/2015 2 A purely parallel shift in the yield curve would result in a price loss of 5.5%, ignoring the time effect. We have assumed a slight flattening of the yield curve. Income is estimated off the current YTW and increased slightly as coupon income rises with the rate increases

PMC Weekly Market Review
4
November 20, 2015
134135136137138139140141142143144 Dec-10 Feb-11 Apr-11 Jun-11 Aug-11 Oct-11Index S&P/Case-Shiller Home Price Index-Trailing 12 Mos.
Source: Bloomberg
ECONOMIC DATA
5.0
5.1
5.2
5.3
5.4
5.5
5.6
5.7
5.8
5.9
Nov-14 Jan-15 Mar-15 May-15 Jul-15 Sep-15
%
Unemployment Rate-Trailing 12 Mos.
Source: Bloomberg
-0.8
-0.6
-0.4
-0.2
0
0.2
0.4
0.6
Nov-14 Jan-15 Mar-15 May-15 Jul-15 Sep-15
Mo
nth
ly %
Ch
g.
Consumer Price Index-Trailing 12 Mos.
Headline CPI Core CPISource: Bloomberg
80.0
85.0
90.0
95.0
100.0
105.0
Nov-14 Jan-15 Mar-15 May-15 Jul-15 Sep-15
Ind
ex
Consumer Board Confidence Index - Trailing 12 Mos.
Source: Bloomberg
0
50
100
150
200
250
300
350
400
450
Nov-14 Jan-15 Mar-15 May-15 Jul-15 Sep-15
Tho
usa
nd
s
Non-Farm Payrolls-Trailing 12 Mos.
Source: Bloomberg
-2.0
-1.0
0.0
1.0
2.0
3.0
4.0
5.0
Dec-12 Jun-13 Dec-13 Jun-14 Dec-14 Jun-15
%
Real GDP Growth Rate - Annualized - 12 Qtrs.
Source: Bloomberg
240
245
250
255
260
265
270
275
280
285
8/28 9/11 9/25 10/9 10/23 11/6
Tho
usa
nd
s
Initial Jobless Claims-Trailing 12 Wks.
Source: Bloomberg

PMC Weekly Market Review November 20, 2015
EUROZONE
5
Last Change % Chg. YTD % Last Change % Chg. YTD %
Germany 10-Yr. Govt. 0.48 8 bps NM NM France 10-Yr. Govt. 0.82 5 bps NM NM
Greece 10-Yr. Govt. 6.96 7 bps NM NM Ireland 10-Yr. Govt. 1.01 8 bps NM NM
Italy 10-Yr. Govt. 1.49 6 bps NM NM Portugal 10-Yr. Govt. 2.48 23 bps NM NM
Spain 10-Yr. Govt. 1.64 14 bps NM NM Netherlands 10-Yr. Govt. 0.65 7 bps NM NM
Belgium 10-Yr. Govt. 0.78 5 bps NM NM U.K. 10-Yr. Govt. 1.87 10 bps NM NM
SELECTED EUROPEAN SOVEREIGN YIELD PERFORMANCE
Source: Bloomberg
Basis points (bps)
0.00
0.10
0.20
0.30
0.40
0.50
0.60
0.70
0.80
0.90
8/27 9/10 9/24 10/8 10/22 11/5 11/19
%
Germany 10-Year Government Bond Yield
Source: Bloomberg
1.0
1.2
1.4
1.6
1.8
2.0
2.2
8/24 9/7 9/21 10/5 10/19 11/2 11/16
%
Spain 10-Year Government Bond Yield
Source: Bloomberg
1.1
1.3
1.5
1.7
1.9
2.1
2.3
8/27 9/10 9/24 10/8 10/22 11/5 11/19
%
Italy 10-Year Government Bond Yield
Source: Bloomberg
4.0
5.0
6.0
7.0
8.0
9.0
10.0
11.0
8/24 9/7 9/21 10/5 10/19 11/2 11/16
%
Greece 10-Year Government Bond Yield
Source: Bloomberg

PMC Weekly Market Review November 20, 2015
EQUITIES
6
4,000
4,200
4,400
4,600
4,800
5,000
5,200
8/24 9/7 9/21 10/5 10/19 11/2 11/16
Ind
exNasdaq Composite-Trailing 90 Days
Source: Bloomberg
2,000
2,200
2,400
2,600
2,800
3,000
3,200
3,400
3,600
3,800
8/24 9/7 9/21 10/5 10/19 11/2 11/16
Ind
ex
Shanghai Composite Index-Trailing 90 Days
Source: Bloomberg
300
310
320
330
340
350
360
370
380
390
8/24 9/7 9/21 10/5 10/19 11/2 11/16
Ind
ex
Euro Stoxx Index-Trailing 90 Days
Source: Bloomberg
14,500
15,000
15,500
16,000
16,500
17,000
17,500
18,000
18,500
8/24 9/7 9/21 10/5 10/19 11/2 11/16
Ind
ex
Dow Jones Industrial Average -Trailing 90 Days
Source: Bloomberg
Last Change % Chg. YTD % Last Change % Chg. YTD %
S&P 500 2,089.17 66.13 3.27% 1.47% Swiss Market Index 9,015.83 265.99 3.04% 0.36%
Dow Industrials 17,823.81 578.57 3.35% 0.00% CAC 40 Index (France) 4,910.97 103.02 2.14% 14.94%
Nasdaq Composite 5,104.92 177.04 3.59% 7.79% DAX Index (Germany) 11,119.83 411.43 3.84% 13.40%
Russell Global 1,687.23 43.12 2.61% -1.7% Irish Overall Index 6,714.37 238.61 3.68% 28.52%
Russell Global EM 2,594.88 49.61 1.91% -11.3% Nikkei 225 19,879.81 282.90 1.44% 13.92%
S&P/TSX (Canada) 13,433.49 358.07 2.74% -8.19% Hang Seng Index 22,754.72 358.58 1.60% -3.60%
Mexico IPC 44,895.02 1277.29 2.93% 4.05% Shanghai Composite 3,630.50 49.66 1.39% 12.24%
Brazil Bovespa 48,138.89 1621.85 3.49% -3.74% Kospi Index (S. Korea) 1,989.86 16.57 0.84% 3.88%
Euro Stoxx 600 381.79 12.26 3.32% 11.46% Taiwan Taiex Index 8,465.45 135.95 1.63% -9.04%
FTSE 100 6,334.63 216.35 3.54% -3.53% Tel Aviv 25 Index 1,573.66 16.17 1.04% 7.42%
IBEX 35 (Spain) 10,290.30 178.90 1.77% 0.11% MICEX Index (Russia) 1,826.72 98.55 5.70% 30.80%
WORLD MARKET PERFORMANCE
Source: Bloomberg; Index % change is based on price.

PMC Weekly Market Review November 20, 2015
EQUITIES – EMERGING AND FRONTIER MARKETS
7
Last Change % Chg. YTD % Last Change % Chg. YTD %
Mexico IPC 44,895.02 1277.29 2.9% 4.1% Hang Seng Index 22,754.72 358.58 1.6% -3.6%
Brazil (Bovespa Index) 48,138.89 1621.85 3.5% -3.7% India (Sensex 30) 25,868.49 257.96 1.0% -5.9%
MICEX Index (Russia) 1,826.72 98.55 5.7% 30.8% Malaysia (KLCI Index) 1,661.89 2.98 0.2% -5.6%
Czech Republic (Prague) 993.86 12.80 1.3% 5.0% Singapore (Straits Times Index) 2,917.91 -7.77 -0.3% -13.3%
Turkey (Istanbul) 80,681.67 -1197.08 -1.5% -5.9% Thailand (SET Index) 1,393.84 11.38 0.8% -6.9%
Egypt (Hermes Index) 598.05 -17.66 -2.9% -28.3% Indonesia (Jakarta) 4,561.33 88.50 2.0% -12.7%
Kenya (Nairobi 20 Index) 3,992.58 74.94 1.9% -21.9% Pakistan (Karachi KSE 100) 33,857.00 -287.78 -0.8% 5.4%
Saudi Arabia (TASI Index) 7,034.08 -49.35 -0.7% -15.6% Vietnam (Ho Chi Minh) 604.46 -6.81 -1.1% 10.8%
Lebanon (Beirut BLOM Index) 1,133.71 -10.02 -0.9% -3.1% Sri Lanka (Colombo) 7,017.44 15.63 0.2% -3.9%
Palestine 508.80 0.98 0.2% 1.2% Cambodia (Laos) 1,250.10 -14.55 -1.2% -11.6%
EMERGING AND FRONTIER MARKET PERFORMANCE
Source: Bloomberg; Index % change is based on price.
42,000
43,000
44,000
45,000
46,000
47,000
48,000
49,000
50,000
8/24 9/7 9/21 10/5 10/19 11/2 11/16
Ind
ex
Brazil (Bovespa Index)-Trailing 90 Days
Source: Bloomberg
23,500
24,000
24,500
25,000
25,500
26,000
26,500
27,000
27,500
28,000
8/24 9/7 9/21 10/5 10/19 11/2 11/16
Ind
ex
India (Sensex Index)-Trailing 90 Days
Source: Bloomberg
400
450
500
550
600
650
700
750
8/23 9/6 9/20 10/4 10/18 11/1 11/15
Ind
ex
Egypt (Hermes Index)-Trailing 90 Days
Source: Bloomberg
2,600
2,650
2,700
2,750
2,800
2,850
2,900
2,950
3,000
3,050
3,100
3,150
8/24 9/7 9/21 10/5 10/19 11/2 11/16
Ind
ex
Singapore (Straits Times Index)-Trailing 90 Days
Source: Bloomberg

PMC Weekly Market Review November 20, 2015
INTEREST RATES
YIELD CURVES
8
Last Change % Chg. YTD % Last Change % Chg. YTD %
2-Yr. U.S. Treasury 0.92% -1 bps NM NM Prime Rate 3.25% 0.00 NM NM
5-Yr. U.S. Treasury 1.69% 2 bps NM NM Fed Funds Rate 0.25% 0.00 NM NM
10-Yr. U.S. Treasury 2.26% -2 bps NM NM Discount Rate 0.75% 0.00 NM NM
30-Yr. U.S. Treasury 3.02% -4 bps NM NM LIBOR (3 Mo.) 0.38% 1 bps NM NM
German 10-Yr. Govt. 0.48% 8 bps NM NM Bond Buyer 40 Muni 3.92% -11 bps NM NM
France 10-Yr. 0.82% 5 bps NM NM Bond Buyer 40 G.O. 3.65% NA NM NM
Italy 10-Yr. 1.49% 6 bps NM NM Bond Buyer 40 Rev. 4.04% NA NM NM
Fed 5-Yr Fwd BE Inf. 1.85% 1 bps NM NM
SELECTED INTEREST RATES
Source: Bloomberg
1M 1Y 3Y 5Y 8Y 10Y 15Y 20Y 30Y0.00
1.00
2.00
3.00
4.00
5.00
6.00
US Treasury Actives Curve 20151113
US Treasury Actives Curve 20151120
USD US Industrial (BB) BFV Cur 20151121
USD Composite (BBB) BFV Curve 20151121
1.50
1.70
1.90
2.10
2.30
2.50
2.70
5/26 6/26 7/26 8/26 9/26 10/26
Yiel
d %
10-Year Treasury Yield - Trailing 180 Days
Source: Bloomberg
1.00
1.20
1.40
1.60
1.80
2.00
2.20
5/25 6/25 7/25 8/25 9/25 10/25
Ind
ex
BBB/Baa- 10-Yr Treas. Spread Rising Line = Risk Aversion
Source: Bloomberg
Source: Bloomberg

PMC Weekly Market Review November 20, 2015
CURRENCIES
9
90
92
94
96
98
100
102
5/25 6/25 7/25 8/25 9/25 10/25
U.S. Dollar Index - Trailing Six Months
Source: Bloomberg
0.80
0.85
0.90
0.95
1.00
1.05
1.10
1.15
1.20
5/25 6/25 7/25 8/25 9/25 10/25
Euro - U.S. Dollars per Euro
Source: Bloomberg
114.00
116.00
118.00
120.00
122.00
124.00
126.00
128.00
5/25 6/25 7/25 8/25 9/25 10/25
Japanese yen - Yen per U.S. Dollar
Source: Bloomberg
Last Change % Chg. YTD % Last Change % Chg. YTD %
Dollar Index 99.63 0.616 0.62% 10.35% Chinese Yuan 6.38 0.011 -0.17% -2.81%
Euro 1.06 -0.013 -1.22% -12.04% Swiss Franc 1.02 0.013 -1.25% -2.40%
Japanese Yen 122.82 0.210 -0.17% -2.48% New Zealand Dollar 0.66 0.002 0.31% -15.87%
British Pound 1.52 -0.005 -0.32% -2.49% Brazilian Real 3.71 -0.144 3.88% -28.29%
Canadian Dollar 1.34 0.003 -0.22% -12.96% Mexican Peso 16.54 -0.137 0.83% -10.85%
SELECTED CURRENCY PERFORMANCE
Source: Bloomberg
6.05
6.10
6.15
6.20
6.25
6.30
6.35
6.40
6.45
5/25 6/25 7/25 8/25 9/25 10/25
Chinese yuan - yuan per U.S. Dollar
Source: Bloomberg

PMC Weekly Market Review November 20, 2015
COMMODITIES
10
0
10
20
30
40
50
60
70
5/26 6/26 7/26 8/26 9/26 10/26
$ p
er b
arre
l
Crude Oil - Light Crude ($ per barrel)
Source: Bloomberg
1,000
1,050
1,100
1,150
1,200
1,250
5/25 6/25 7/25 8/25 9/25 10/25
$ p
er o
un
ce
Gold - Spot gold price ($ per ounce)
Source: Bloomberg
0
1,000
2,000
3,000
4,000
5,000
6,000
7,000
5/26 6/25 7/25 8/24 9/23 10/23
Ind
ex
Copper
Source: Bloomberg
320
340
360
380
400
420
440
460
480
5/26 6/26 7/26 8/26 9/26 10/26
$ p
er b
ush
el
Corn - Active Contract
Source: Bloomberg
Last Change % Chg. YTD % Last Change % Chg. YTD %
DJ UBS Comm. Idx. 81.42 -1.01 -1.22% -21.95% Platinum Spot $854.45 -$4.95 -0.58% -29.26%
Rogers Int. Comm. Idx. 2141.37 -34.45 -1.58% -23.32% Corn 369.75 4.25 1.16% -13.86%
Crude Oil $41.55 -$0.42 -1.00% -30.67% Wheat 490.00 -7.75 -1.56% -20.84%
Natural Gas $2.14 -$0.23 -9.66% -36.86% Soybeans 857.50 2.25 0.26% -15.08%
Gasoline ($/Gal.) $2.10 -$0.08 -3.49% -6.21% Sugar 15.30 0.26 1.73% -6.82%
Heating Oil 136.56 -1.42 -1.03% -28.59% Orange Juice 150.05 -2.90 -1.90% 3.02%
Gold Spot $1,078.00 -$5.45 -0.50% -8.94% Aluminum 1,466.00 -25.00 -1.68% -20.86%
Silver Spot $14.19 -$0.08 -0.53% -9.70% Copper 4,630.50 -194.50 -4.03% -26.50%
Source: Bloomberg; % change is based on price.
SELECTED COMMODITY MARKET PERFORMANCE
PMC Weekly Market Review November 20, 2015
ALTERNATIVE INVESTMENTS
11
1,155
1,160
1,165
1,170
1,175
1,180
1,185
1,190
1,195
1,200
1,205
1,210
8/24 9/7 9/21 10/5 10/19 11/2 11/16
Ind
ex
HFRX Global Hedge Fund Index - Trailing 90 Days
Source: Bloomberg
980
990
1,000
1,010
1,020
1,030
1,040
1,050
8/24 9/7 9/21 10/5 10/19 11/2 11/16
Ind
ex
HFRX Equity Market Neutral - Trailing 90 Days
Source: Bloomberg
1,355
1,360
1,365
1,370
1,375
1,380
1,385
1,390
1,395
1,400
8/24 9/7 9/21 10/5 10/19 11/2 11/16
Ind
ex
IQ Fixed Income Beta Arb Index - Trailing 90 Days
Source: Bloomberg
1,110
1,120
1,130
1,140
1,150
1,160
1,170
1,180
8/24 9/7 9/21 10/5 10/19 11/2 11/16
Ind
ex
HFRX Equity Hedge Index - Trailing 90 Days
Source: Bloomberg
Last Change % Chg. YTD % Last Change % Chg. YTD %
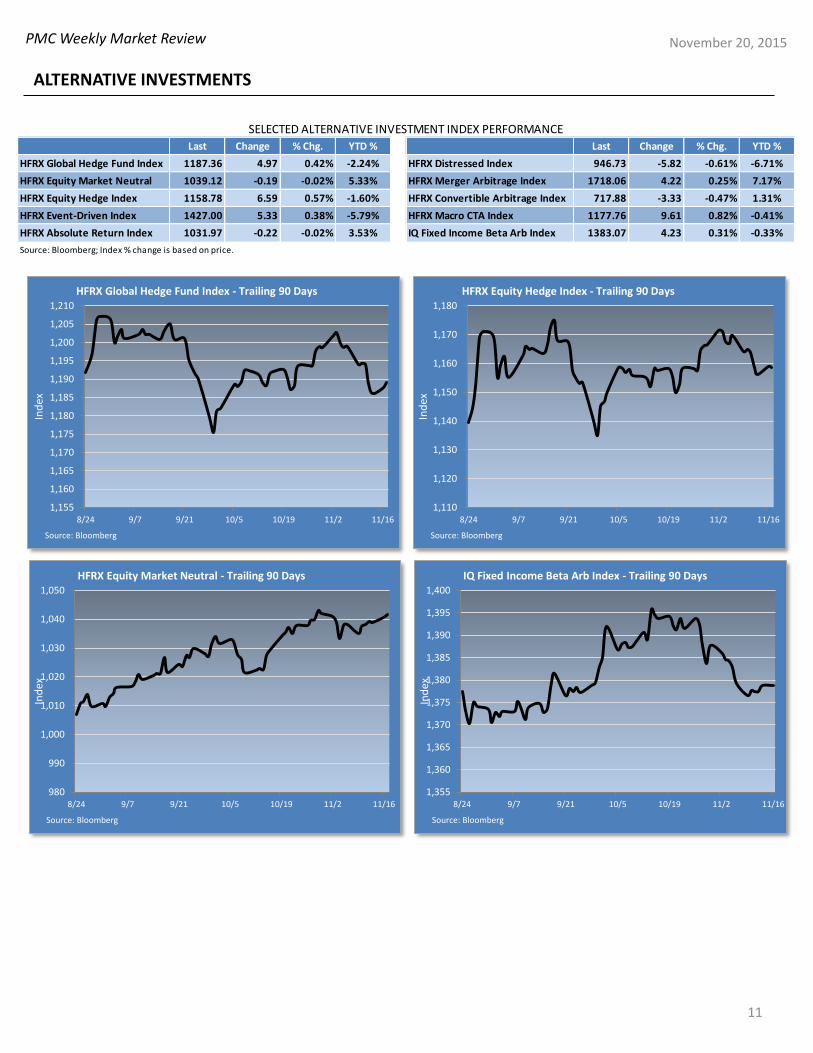
HFRX Global Hedge Fund Index 1187.36 4.97 0.42% -2.24% HFRX Distressed Index 946.73 -5.82 -0.61% -6.71%
HFRX Equity Market Neutral 1039.12 -0.19 -0.02% 5.33% HFRX Merger Arbitrage Index 1718.06 4.22 0.25% 7.17%
HFRX Equity Hedge Index 1158.78 6.59 0.57% -1.60% HFRX Convertible Arbitrage Index 717.88 -3.33 -0.47% 1.31%
HFRX Event-Driven Index 1427.00 5.33 0.38% -5.79% HFRX Macro CTA Index 1177.76 9.61 0.82% -0.41%
HFRX Absolute Return Index 1031.97 -0.22 -0.02% 3.53% IQ Fixed Income Beta Arb Index 1383.07 4.23 0.31% -0.33%
SELECTED ALTERNATIVE INVESTMENT INDEX PERFORMANCE
Source: Bloomberg; Index % change is based on price.

PMC Weekly Market Review
2.90
3.00
3.10
3.20
3.30
3.40
3.50
5/26 6/26 7/26 8/26 9/26 10/26
Ind
ex
S&P 500/MSCI EAFE - Trailing 180 Days
Source: Bloomberg
1.45
1.50
1.55
1.60
1.65
1.70
1.75
1.80
1.85
1.90
5/26 6/26 7/26 8/26 9/26 10/26
Ind
ex
MSCI EAFE/MSCI EM - Trailing 180 Days
Source: Bloomberg
0.35
0.36
0.37
0.38
0.39
0.40
0.41
0.42
5/26 6/26 7/26 8/26 9/26 10/26
Ind
exLarge Cap/Small Cap - Trailing 180 Days
Source: Bloomberg
0.76
0.77
0.78
0.79
0.80
0.81
0.82
0.83
0.84
5/26 6/26 7/26 8/26 9/26 10/26
Ind
ex
Growth/Value - Trailing 180 Days
Source: Bloomberg
November 20, 2015
12
PORTFOLIO CONSTRUCTION
3.00
3.50
4.00
4.50
5.00
5.50
6.00
6.50
5/26 6/26 7/26 8/26 9/26 10/26
Ind
ex
S&P 500/MSCI EM - Trailing 180 Days
Source: Bloomberg

PMC Weekly Market Review
0.280
0.290
0.300
0.310
0.320
0.330
0.340
5/26 6/26 7/26 8/26 9/26 10/26
Ind
exHigh Yield/Inv. Grade Bonds - Trailing 180 Days
Source: Bloomberg
0.192
0.194
0.196
0.198
0.200
0.202
0.204
0.206
0.208
0.210
0.212
0.214
5/26 6/26 7/26 8/26 9/26 10/26
Ind
ex
Info Tech/S&P 500 - Trailing 180 Days
Source: Bloomberg
1.73
1.74
1.75
1.76
1.77
1.78
1.79
1.80
1.81
1.82
1.83
5/26 6/26 7/26 8/26 9/26 10/26
Ind
ex
Inv. Grade Bonds/Int. Govt. Bonds - Trailing 180 Days
Source: Bloomberg
0.50
0.52
0.54
0.56
0.58
0.60
0.62
5/26 6/26 7/26 8/26 9/26 10/26
Ind
ex
High Yield Bonds/Int. Govt. Bonds - Trailing 180 Days
Source: Bloomberg
November 20, 2015
13
PORTFOLIO CONSTRUCTION (cont’d.)

PMC Weekly Market Review
14
November 20, 2015
The Relative Strength Matrix provides an indication of how the various asset classes have performed relative to one another over the past 30 days. A number greater than 1.0 indicates that the asset class in the far left column has outperformed the corresponding asset class in the top row over the past 30 days. A number below 1.0 means the asset class on the left has underperformed the asset class at the top. The green shading indicates outperformance, and the red shading indicates underperformance.
Source: Bloomberg
Large Cap
Core
Large Cap
Growth
Large Cap
Value
Mid Cap
Core
Mid Cap
Growth
Mid Cap
Value
Small Cap
Core
Small Cap
Growth
Small Cap
Value
Int'l.
Developed
Emerging
Markets REITs Comm. Int. Bond High Yield
Large Cap Core 1.00 0.98 1.03 1.10 1.10 1.10 1.12 1.13 1.11 1.08 1.15 1.07 1.64 1.21 1.63
Large Cap Growth 1.02 1.00 1.06 1.13 1.13 1.12 1.14 1.15 1.13 1.11 1.18 1.09 1.67 1.24 1.66
Large Cap Value 0.97 0.95 1.00 1.07 1.07 1.06 1.08 1.09 1.07 1.05 1.12 1.03 1.58 1.17 1.57
Mid Cap Core 0.91 0.89 0.94 1.00 1.00 1.00 1.02 1.02 1.01 0.98 1.05 0.97 1.49 1.10 1.48
Mid Cap Growth 0.91 0.88 0.94 1.00 1.00 0.99 1.01 1.02 1.00 0.98 1.04 0.97 1.48 1.09 1.47
Mid Cap Value 0.91 0.89 0.94 1.00 1.01 1.00 1.02 1.03 1.01 0.99 1.05 0.97 1.49 1.10 1.48
Small Cap Core 0.89 0.87 0.92 0.98 0.99 0.98 1.00 1.01 0.99 0.97 1.03 0.95 1.46 1.08 1.46
Small Cap Growth 0.89 0.87 0.92 0.98 0.98 0.97 0.99 1.00 0.98 0.96 1.02 0.95 1.45 1.07 1.45
Small Cap Value 0.90 0.88 0.93 0.99 1.00 0.99 1.01 1.02 1.00 0.98 1.04 0.96 1.48 1.09 1.47
Int'l. Developed 0.93 0.90 0.96 1.02 1.02 1.01 1.03 1.04 1.03 1.00 1.07 0.99 1.51 1.12 1.51
Emerging Markets 0.87 0.85 0.90 0.95 0.96 0.95 0.97 0.98 0.96 0.94 1.00 0.92 1.42 1.05 1.41
REITs 0.94 0.92 0.97 1.03 1.04 1.03 1.05 1.06 1.04 1.01 1.08 1.00 1.53 1.13 1.53
Commodities 0.61 0.60 0.63 0.67 0.68 0.67 0.68 0.69 0.68 0.66 0.70 0.65 1.00 0.74 0.99
Int. Bond 0.83 0.81 0.86 0.91 0.92 0.91 0.93 0.93 0.92 0.90 0.96 0.88 1.36 1.00 1.35
High Yield 0.61 0.60 0.63 0.68 0.68 0.67 0.69 0.69 0.68 0.66 0.71 0.66 1.01 0.74 1.00
RELATIVE STRENGTH MATRIX (BASED ON 30-DAY RSI)
9/3 9/10 9/17 9/24 10/1 10/8 10/15 10/22 10/29 11/5 11/12 11/19
Large Cap
(R200)-1.90% 0.10% 1.94% -2.79% -0.41% 4.51% 0.69% 1.51% 2.16% 0.43% -2.44% 1.80%
Small Cap
(R2000)-0.73% 0.69% 2.40% -3.66% -3.51% 5.99% -0.04% -0.71% 0.96% 2.15% -3.01% 1.03%
MSCI EAFE -1.56% 0.36% 1.27% -5.35% 0.96% 4.75% 1.17% 0.33% -0.01% -0.06% -1.69% 1.66%
MSCI Em.
Mkts.-1.43% 0.33% 2.90% -5.05% 1.52% 6.36% 1.93% -0.76% -1.40% 2.13% -3.52% 0.41%
BarCap Agg.
(AGG)-0.05% -0.10% 0.24% 0.10% 0.15% -0.04% 0.42% 0.05% -0.71% -0.36% -0.40% 0.32%
High Yield
(JNK)-0.32% 0.62% -0.40% -1.87% -2.40% 2.63% -0.22% 0.64% 0.03% -0.49% -2.15% -0.39%
DJ UBS Index 1.94% -0.31% -0.13% -1.30% -0.84% 3.69% -0.56% -1.85% -1.48% -1.20% -3.45% -1.36%
Hedge Funds
(HFRX Global)-0.21% -0.10% 0.22% -1.14% -0.77% 0.89% -0.10% -0.27% 0.91% -0.02% -0.82% 0.18%
60/40* -0.99% 0.16% 1.22% -2.32% -0.32% 3.10% 0.61% 0.44% 0.43% 0.29% -1.71% 1.01%
48/32/20
(w/Alts.)**-0.83% 0.11% 1.02% -2.08% -0.41% 2.66% 0.47% 0.30% 0.52% 0.23% -1.53% 0.84%
Source: Bloomberg; *60/40 portfolio = 30% Large Cap/10% Small Cap/15% EAFE/5% Emerging Markets/35% BarCap Agg./5% High Yield.
**48/32/20 portfolio = 24% Large Cap/8% Small Cap/12% EAFE/4% Emerging Markets/28% BarCap Agg./4% High Yield/20% HFRX Global Index.
WEEKLY ASSET CLASS PERFORMANCE (Prior 12 weeks ending Thursday)
Alternatives
Asset Allocation
Domestic
Equity
Int'l.
Equity
Fixed Income
Commodities
Equity

PMC Weekly Market Review November 20, 2015
15
INDEX OVERVIEW & KEY DEFINITIONS Fed, The Fed or FED refers to the Federal Reserve System, the central bank of the United States. The Federal Open Market Committee (FOMC) is the monetary policymaking body of the Federal Reserve System. Fed Funds Rate, the interest rate at which a depository institution lends funds maintained at the Federal Reserve to another depository institution overnight. The European Central Bank (ECB) is the central bank for Europe's single currency, the euro. The ECB’s main task is to maintain the euro's purchasing power and thus price stability in the euro area. The euro area comprises the 19 European Union countries that have introduced the euro since 1999. The Gross Domestic Product (GDP) rate is a measurement of the output of goods and services produced by labor and property located in the United States. Basis Point(s) is a unit that is equal to 1/100th of 1%, and is used to denote the change in a financial instrument. The basis point is commonly used for calculating changes in interest rates, equity indexes and the yield of a fixed-income security. A separately managed account (SMA) is an individual managed investment account offered typically by a brokerage firm through one of their brokers or financial consultants and managed by independent investment management firms (often called money managers for short) and have varying fee structures. The Consumer Price Index (CPI) measures the change in the cost of a fixed basket of products and services. The Producer Price Index (PPI) program measures the average change over time in the selling prices received by domestic producers for their output. The prices included in the PPI are from the first commercial transaction for many products and some services. Core CPI is an additional CPI Index, excludes energy and food item price changes, and measures the “core” or “underlying” rate of inflation. The PCE (Personal Consumption Expenditure) Index of Prices is a US-‐wide indicator of the average increase in prices for all domestic personal consumption. Using a variety of data including U.S. Consumer Price Index and Producer Price Index prices, it is derived from personal consumption expenditures; essentially a measure of goods and services targeted towards individuals and consumed by individuals.
The Dow Jones Industrial Average (DOW or DJIA) is an unmanaged index of 30 common stocks comprised of 30 actively traded blue chip stocks, primarily industrials and assumes reinvestment of dividends. The S&P 500 Index is an unmanaged index comprised of 500 widely held securities considered to be representative of the stock market in general. The S&P/Case-Shiller Home Price Indices measure the residential housing market, tracking changes in the value of the residential real estate market in 20 metropolitan regions across the United States. The Nasdaq Composite Index is a stock market index of the common stocks and similar securities listed on the NASDAQ stock market. The US Dollar Index is a measure of the value of the United States dollar relative to a basket of foreign currencies. It is a weighted geometric mean of the dollar's value relative to other select currencies (Euro, Japanese yen, Pound sterling, Canadian dollar, Swedish krona (SEK) & Swiss franc). The Nikkei Index (Nikkei 225 or Nikkei) is a stock market index for the Tokyo Stock Exchange calculated daily by the Nihon Keizai Shimbun (Nikkei) newspaper since 1950. It is a price-weighted index (the unit is yen), and the components are reviewed once a year. The FTSE 100 Index (FTSE 100) is a share index of the 100 companies listed on the London Stock Exchange (LSE) with the highest market capitalization. The Bloomberg Commodity Index (formerly the Dow Jones-UBS Commodity Index) tracks prices of futures contracts on physical commodities on the commodity markets and is designed to minimize concentration in any one commodity or sector (currently 22 commodity futures in seven sectors). The Barclays Capital US Credit Index is an unmanaged index considered representative of publicly issued, SEC-registered US corporate and specified foreign debentures and secured notes. The Barclays Capital US Aggregate Bond Index is a market capitalization-weighted index of investment-grade, fixed-rate debt issues, including government, corporate, asset-backed, and mortgage-backed securities, with maturities of at least one year. The Barclays Capital US Corporate High Yield Index covers the USD-denominated, non-investment grade, fixed-rate, taxable corporate bond market. Securities are classified as high-yield if the middle rating of Moody’s, Fitch and S&P is Ba1/BB+/BB+ or below. The index may include emerging market debt. The Barclays Capital Municipal Bond Index is an unmanaged index comprised of investment-grade, fixed-rate municipal securities representative of the tax-exempt bond market in general. The Barclays Capital US Treasury Total Return Index is an unmanaged index of public obligations of the US Treasury with a remaining maturity of one year or more. The Barclays Capital Global Aggregate ex-U.S. Index is a market capitalization-weighted index, meaning the securities in the index are weighted according to the market size of each bond type. Most U.S. traded investment grade bonds are represented. Municipal bonds, and Treasury Inflation-Protected Securities are excluded, due to tax treatment issues. The index includes Treasury securities, Government agency bonds, Mortgage-backed bonds, Corporate bonds, and a small amount of foreign bonds traded in U.S. The Barclays Capital U.S. 5-10 Year Corporate Bond Index measures the investment return of U.S. dollar denominated, investment-grade, fixed rate, taxable securities issued by industrial, utility, and financial companies with maturities between 5 and 10 years. Treasury securities, mortgage-backed securities (MBS) foreign bonds, government agency bonds and corporate bonds are some of the categories included in the index. The Barclays Capital U.S Corporate High-Yield Index is composed of fixed-rate, publicly issued, non-investment grade debt. The Barclays Capital U.S. Corporate 5-10 Year Index includes U.S. dollar-denominated, investment-grade, fixed-rate, taxable securities issued by industrial, utility, & financial companies, with maturities between 5 & 10 years. The DJ-UBS Commodity Index Total Return SM measures the collateralized returns from a basket of 19 commodity futures contracts representing the energy, precious metals, industrial metals, grains, softs and livestock sectors. The Russell 1000 Index is a market capitalization-weighted benchmark index made up of the 1000 largest U.S. companies in the Russell 3000 Index. The Russell 1000 Growth Index is an unmanaged index considered representative of large-cap growth stocks. The Russell 1000 Value Index is an unmanaged index considered representative of large-cap value stocks. The Russell 2000 Index is an unmanaged index considered representative of small-cap stocks. The Russell 2000 Growth Index is an unmanaged index considered representative of small-cap growth stocks. The Russell 2000 Growth Index is an unmanaged index considered representative of small-cap value stocks. The Russell 3000 Index is an unmanaged index considered representative of the US stock market. The Russell Midcap Index is a subset of the Russell 1000 Index. It includes approximately 800 of the smallest securities based on a combination of their market cap and current index membership. The Russell Midcap Growth Index is an unmanaged index considered representative of mid-cap growth stocks. The Russell Midcap Value Index is an unmanaged index considered representative of mid-cap value stocks. The HFRX Indices are a series of benchmarks of hedge fund industry performance which are engineered to achieve representative performance of a larger universe of hedge fund strategies. Hedge Fund Research, Inc. employs the HFRX Methodology (UCITS compliant), a proprietary and highly quantitative process by which hedge funds are selected as constituents for the HFRX Indices. The University of Michigan Consumer Sentiment Index (MCSI) is a survey of consumer confidence conducted by the University of Michigan using telephone surveys to gather information on consumer expectations regarding the overall economy. The CBOE Volatility Index (VIX) is an up-to-the-minute market estimate of expected volatility that is calculated by using real-time S&P 500 Index option bid/ask quotes. The Index uses nearby and second nearby options with at least 8 days left to expiration and then weights them to yield a constant, 30-day measure of the expected volatility of the S&P 500 Index. The MSCI EAFE Index is designed to measure the equity market performance of developed markets outside of the U.S. & Canada. The MSCI EAFE Growth Index is an unmanaged index considered representative of growth stocks of Europe, Australasia and the Far East. The MSCI EAFE Value Index is an unmanaged index considered representative of value stocks of Europe, Australasia and the Far East. The MSCI EM (Emerging Markets) Latin America Index is a free float-adjusted market capitalization weighted index that is designed to measure the equity market performance of emerging markets in Latin America. The MSCI World ex-U.S. Index captures large and mid-cap representation across 22 of 23 Developed Markets (DM) countries - excluding the US. With 1,002 constituents, the index covers approximately 85% of the free float-adjusted market capitalization in each country. (DM countries include: Australia, Austria, Belgium, Canada, Denmark, Finland, France, Germany, Hong Kong, Ireland, Israel, Italy, Japan, Netherlands, New Zealand, Norway, Portugal, Singapore, Spain, Sweden, Switzerland and the UK.) The MSCI Japan Index is designed to measure the performance of the large and mid-cap segments of the Japanese market. With 320 constituents, the index covers approximately 85% of the free float-adjusted market capitalization in Japan. The MSCI Emerging Markets Index is a free float-adjusted market capitalization index that is designed to measure equity market performance in the global emerging markets. The MSCI Europe Index is an unmanaged index considered representative of stocks of developed European countries. The MSCI Pacific Index is a free float-adjusted market capitalization weighted index that is designed to measure the equity market performance of the developed markets in the Pacific region. The Barclays Intermediate US Government/Credit Bond Index is a market capitalization-weighted index of investment-grade, fixed-rate debt issues, including Treasuries, government-related and U.S. corporate securities, with maturities of at least one year and less than 10 years. The Housing Market Index (HMI) (sentiment index) is based on a monthly survey of NAHB members designed to take the pulse of the single-family housing market. The survey asks respondents to rate market conditions for the sale of new homes at the present time and in the next six months as well as the traffic of prospective buyers of new homes. (11/20/15)

PMC Weekly Market Review November 20, 2015
16
The information, analysis, and opinions expressed herein are for general and educational purposes only. Nothing contained in this weekly review is intended to constitute legal, tax, accounting, securities, or investment advice, nor an opinion regarding the appropriateness of any investment, nor a solicitation of any type. All investments carry a certain risk, and there is no assurance that an investment will provide positive performance over any period of time. An investor may experience loss of principal. Investment decisions should always be made based on the investor’s specific financial needs and objectives, goals, time horizon, and risk tolerance. The asset classes and/or investment strategies described may not be suitable for all investors and investors should consult with an investment advisor to determine the appropriate investment strategy. Past performance is not indicative of future results. Information obtained from third party sources are believed to be reliable but not guaranteed. Envestnet|PMC™ makes no representation regarding the accuracy or completeness of information provided herein. All opinions and views constitute our judgments as of the date of writing and are subject to change at any time without notice. Investments in smaller companies carry greater risk than is customarily associated with larger companies for various reasons such as volatility of earnings and prospects, higher failure rates, and limited markets, product lines or financial resources. Investing overseas involves special risks, including the volatility of currency exchange rates and, in some cases, limited geographic focus, political and economic instability, and relatively illiquid markets. Income (bond) securities are subject to interest rate risk, which is the risk that debt securities in a portfolio will decline in value because of increases in market interest rates. Exchange Traded Funds (ETFs) are subject to risks similar to those of stocks, such as market risk. Investing in ETFs may bear indirect fees and expenses charged by ETFs in addition to its direct fees and expenses, as well as indirectly bearing the principal risks of those ETFs. ETFs may trade at a discount to their net asset value and are subject to the market fluctuations of their underlying investments. Investing in commodities can be volatile and can suffer from periods of prolonged decline in value and may not be suitable for all investors. Index Performance is presented for illustrative purposes only and does not represent the performance of any specific investment product or portfolio. An investment cannot be made directly into an index. Alternative Investments may have complex terms and features that are not easily understood and are not suitable for all investors. You should conduct your own due diligence to ensure you understand the features of the product before investing. Alternative investment strategies may employ a variety of hedging techniques and non-traditional instruments such as inverse and leveraged products. Certain hedging techniques include matched combinations that neutralize or offset individual risks such as merger arbitrage, long/short equity, convertible bond arbitrage and fixed-income arbitrage. Leveraged products are those that employ financial derivatives and debt to try to achieve a multiple (for example two or three times) of the return or inverse return of a stated index or benchmark over the course of a single day. Inverse products utilize short selling, derivatives trading, and other leveraged investment techniques, such as futures trading to achieve their objectives, mainly to track the inverse of their benchmarks. As with all investments, there is no assurance that any investment strategies will achieve their objectives or protect against losses. Neither Envestnet, Envestnet|PMC™ nor its representatives render tax, accounting or legal advice. Any tax statements contained herein are not intended or written to be used, and cannot be used, for the purpose of avoiding U.S. federal, state, or local tax penalties. Taxpayers should always seek advice based on their own particular circumstances from an independent tax advisor. © 2015 Envestnet Asset Management, Inc. All rights reserved. ABOUT ENVESTNET® Envestnet, Inc. (NYSE: ENV) is a leading provider of unified wealth management technology and services to investment advisors. Our open-architecture platforms unify and fortify the wealth management process, delivering unparalleled flexibility, accuracy, performance and value. Envestnet solutions enable the transformation of wealth management into a transparent, objective, independent and fully-aligned standard of care, and empower advisors to deliver better results. Envestnet's Advisor Suite® software empowers financial advisors to better manage client outcomes and strengthen their practice. Envestnet provides institutional-quality research and advanced portfolio solutions through our Portfolio Management Consultants group, Envestnet | PMC®. Envestnet | Tamarac provides leading rebalancing, reporting and practice management software. For more information on Envestnet, please visit www.envestnet.com.
07.17.15