Embed Size (px)
Citation preview

http://poloclub.gatech.edu/cse6242
CSE6242: Data & Visual Analytics
Classification Key Concepts
Duen Horng (Polo) Chau Associate Professor, College of Computing
Associate Director, MS Analytics
Georgia Tech
Mahdi Roozbahani Lecturer, Computational Science & Engineering, Georgia Tech
Founder of Filio, a visual asset management platform
Partly based on materials by
Professors Guy Lebanon, Jeffrey Heer, John Stasko, Christos Faloutsos

Songs Like?
Some nights
Skyfall
Comfortably numb
We are young
... ...
... ...
Chopin's 5th ???
How will I rate "Chopin's 5th Symphony"?
2
3
What tools do you need for classification?
1. Data S = {(xi, yi)}i = 1,...,n
o xi : data example with d attributes
o yi : label of example (what you care about)
2. Classification model f(a,b,c,....) with some
parameters a, b, c,...
3. Loss function L(y, f(x))o how to penalize mistakes
Classification

Terminology Explanation
5
Song name Artist Length ... Like?
Some nights Fun 4:23 ...
Skyfall Adele 4:00 ...
Comf. numb Pink Fl. 6:13 ...
We are young Fun 3:50 ...
... ... ... ... ...
... ... ... ... ...
Chopin's 5th Chopin 5:32 ... ??
Data S = {(xi, yi)}i = 1,...,n
o xi : data example with d attributes
o yi : label of example
data example = data instance
attribute = feature = dimension
label = target attribute

What is a “model”?
“a simplified representation of reality created to serve
a purpose” Data Science for Business
Example: maps are abstract models of the physical world
There can be many models!!(Everyone sees the world differently, so each of us has a different model.)
In data science, a model is formula to estimate what
you care about. The formula may be mathematical, a set
of rules, a combination, etc.
6
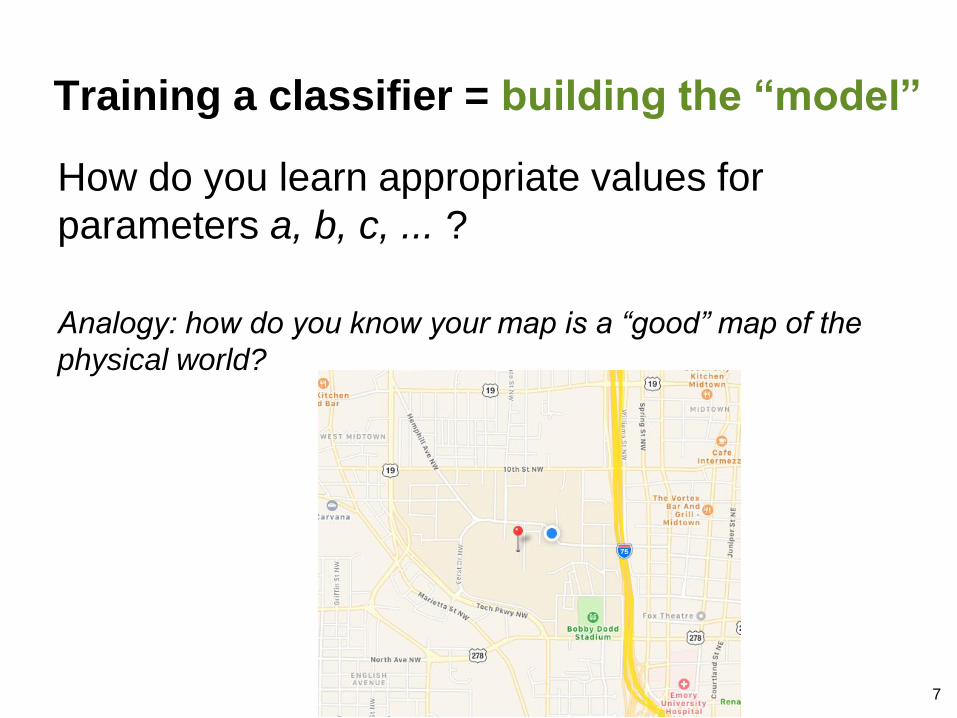
Training a classifier = building the “model”
How do you learn appropriate values for
parameters a, b, c, ... ?
Analogy: how do you know your map is a “good” map of the
physical world?
7

Classification loss function
Most common loss: 0-1 loss function
More general loss functions are defined by a
m x m cost matrix C such that
where y = a and f(x) = b
T0 (true class 0), T1 (true class 1)
P0 (predicted class 0), P1 (predicted class 1)
8
Class P0 P1
T0 0 C10
T1 C01 0

9
Song name Artist Length ... Like?
Some nights Fun 4:23 ...
Skyfall Adele 4:00 ...
Comf. numb Pink Fl. 6:13 ...
We are young Fun 3:50 ...
... ... ... ... ...
... ... ... ... ...
Chopin's 5th Chopin 5:32 ... ??
An ideal model should correctly estimate:o known or seen data examples’ labels
o unknown or unseen data examples’ labels

Training a classifier = building the “model”
Q: How do you learn appropriate values for
parameters a, b, c, ... ?(Analogy: how do you know your map is a “good” map?)
• yi = f(a,b,c,....)(xi), i = 1, ..., no Low/no error on training data (“seen” or “known”)
• y = f(a,b,c,....)(x), for any new xo Low/no error on test data (“unseen” or “unknown”)
Possible A: Minimize
with respect to a, b, c,...
10
It is very easy to achieve perfect
classification on training/seen/known
data. Why?

11
If your model works really
well for training data, but
poorly for test data, your
model is “overfitting”.
How to avoid overfitting?

12
Example: one run of 5-fold cross validation
Image credit: http://stats.stackexchange.com/questions/1826/cross-validation-in-plain-english
You should do a few runs and compute the average
(e.g., error rates if that’s your evaluation metrics)

Cross validation
1.Divide your data into n parts
2.Hold 1 part as “test set” or “hold out set”
3.Train classifier on remaining n-1 parts “training set”
4.Compute test error on test set
5.Repeat above steps n times, once for each n-th part
6.Compute the average test error over all n folds
(i.e., cross-validation test error)
13

Cross-validation variations
K-fold cross-validation
• Test sets of size (n / K)
• K = 10 is most common (i.e., 10-fold CV)
Leave-one-out cross-validation (LOO-CV)
• test sets of size 1
14

Example:
k-Nearest-Neighbor classifier
15
Like Whiskey
Don’t like whiskey
Image credit: Data Science for Business

But k-NN is so simple!
It can work really well! Pandora (acquired by
SiriusXM) uses it or has used it: https://goo.gl/foLfMP(from the book “Data Mining for Business Intelligence”)
16Image credit: https://www.fool.com/investing/general/2015/03/16/will-the-music-industry-end-pandoras-business-mode.aspx

17
Simple(few parameters)
Effective 🤗
Complex(more parameters)
Effective (if significantly more so than
simple methods)
🤗
Complex(many parameters)
Not-so-effective 😱
What are good
models?

k-Nearest-Neighbor Classifier
The classifier:
f(x) = majority label of the
k nearest neighbors (NN) of x
Model parameters:
• Number of neighbors k
• Distance/similarity function d(.,.)18

k-Nearest-Neighbor Classifier
If k and d(.,.) are fixed
Things to learn: ?
How to learn them: ?
If d(.,.) is fixed, but you can change k
Things to learn: ?
How to learn them: ?
19

If k and d(.,.) are fixed
Things to learn: Nothing
How to learn them: N/A
If d(.,.) is fixed, but you can change k
Selecting k: How?
k-Nearest-Neighbor Classifier
20

How to find best k in k-NN?
Use cross validation (CV).
21

22

k-Nearest-Neighbor Classifier
If k is fixed, but you can change d(.,.)
Possible distance functions:
• Euclidean distance:
• Manhattan distance:
• …
23

Summary on k-NN classifier
• Advantageso Little learning (unless you are learning the distance functions)
o Quite powerful in practice (and has theoretical guarantees)
• Caveatso Computationally expensive at test time
Reading material:
• The Elements of Statistical Learning (ESL)
book, Chapter 13.3https://web.stanford.edu/~hastie/ElemStatLearn/
24

The classifier:fT(x): majority class in the leaf in the tree T containing xModel parameters: The tree structure and size
!24
Weather?
Decision trees (DT)

!25
Highly recommended!
Visual Introduction to Decision Tree Building a tree to distinguish homes in New York from homesin San Francisco http://www.r2d3.us/visual-intro-to-machine-learning-part-1/

Decision treesThings to learn: ?How to learn them: ?Cross-validation: ?
!26
Weather?

!27
Things to learn: the tree structureHow to learn them: (greedily) minimize the
overall classification lossCross-validation: finding the best sized tree
with K-fold cross-validation
Learning the Tree Structure

!28
Pieces:1. Find the best attribute to split on2. Find the best split on the chosen attribute3. Decide on when to stop splitting4. Cross-validation
Decision trees
http://www.cs.cmu.edu/afs/cs.cmu.edu/academic/class/15381-s06/www/DTs.pdfHighly recommended lecture slides from CMU

Choosing the split pointSplit types for a selected attribute j: 1. Categorical attribute (e.g. “genre”)
x1j = Rock, x2j = Classical, x3j = Pop
2. Ordinal attribute (e.g., “achievement”) x1j=Platinum, x2j=Gold, x3j=Silver
3. Continuous attribute (e.g., song duration) x1j = 235, x2j = 543, x3j = 378
!29
x1,x2,x3
x1 x2 x3
x1,x2,x3
x1 x2 x3
x1,x2,x3
x1,x3 x2
Split on genre Split on achievement Split on duration
Rock Classical Pop Plat. Gold Silver

Choosing the split pointAt a node T for a given attribute d,select a split s as following:
mins loss(TL) + loss(TR)where loss(T) is the loss at node T
Common node loss functions:• Misclassification rate• Expected loss• Normalized negative log-likelihood (= cross-entropy)
!30
More details on loss functions, see Chapter 3.3:http://www.stat.cmu.edu/~cshalizi/350/lectures/22/lecture-22.pdf

Choosing the attribute
Choice of attribute:1. Attribute providing the maximum improvement
in training loss2. Attribute with highest information gain
(mutual information)
!31
Intuition: an attribute with highest information gain helps most rapidly describe an instance (i.e., most rapidly reduces “uncertainty”)

!32
Excellent refresher on information gain: using it pick splitting attribute and split point (for that attribute)
http://www.cs.cmu.edu/afs/cs.cmu.edu/academic/class/15381-s06/www/DTs.pdf
PDF page 7 to 21

When to stop splitting? Common strategies:1. Pure and impure leave nodes
• All points belong to the same class; OR
• All points from one class completely overlap with points from another class (i.e., same attributes)
• Output majority class as this leaf’s label
2. Node contains points fewer than some threshold
3. Node purity is higher than some threshold4. Further splits provide no improvement in
training loss(loss(T) <= loss(TL) + loss(TR))
!33Graphics from: http://www.cs.cmu.edu/afs/cs.cmu.edu/academic/class/15381-s06/www/DTs.pdf

Parameters vs Hyper-parametersExample hyper-parameters (need to experiment/try)
• k-NN: k, similarity function • Decision tree: #node, • Can be determined using CV and optimization
strategies, e.g., “grid search” (fancy way to say “try all
combinations”), random search, etc.(http://scikit-learn.org/stable/modules/grid_search.html)
Example parameters (can be “learned” / “estimated” / “computed” directly from data)
• Decision tree (entropy-based): • which attribute to split • split point for an attribute
!34

Summary on decision treesAdvantages
• Easy to implement• Interpretable• Very fast test time• Can work seamlessly with mixed attributes• Works quite well in practice
Caveats• “Too basic” — but OK if it works!• Training can be very expensive• Cross-validation is hard (node-level CV)
!35