Embed Size (px)
Citation preview

(~ DUKE ENERGY*
VIA ELECTRONIC FILING
The Honorable Jocelyn G. Boyd Chief Clerk/ Administrator
October 14, 2016
Public Service Commission of South Carolina I 0 I Executive Center Drive, Suite I 00 Columbia, South Carolina 29210
Rebecca J . Dulin Senior Counsel
Duke Energy 1201 Main Street
Capital Center Building Suite 1180
Columbia, SC 29201
0 803.988 7130 r 803.988.7123
Rebecca.Dulin@duke-energy com
Re: 2016 Duke Energy Carolinas Integrated Resource Plan Supplemental Filing Docket No. 2016-10-E
Dear Mrs. Boyd:
On September I, 2016, Duke Energy Carolinas, LLC ("DEC" or the "Company' ) filed with this Commission its 2016 Integrated Resource Plan ("2016 DEC IRP"). Upon internal review, DEC became aware of several non-substantive errors in its IRP that it is correcting through this filing. The corrections are summarized below:
• Page I : Changes to title • Page 13: Add natural gas boiler to list of generation assets • Page 29 (and Page 141 ): Add landfill gas to the list of dispatchable
technologies that were evaluated • Page 42: Correct nuclear uprate from 91 MW to 85 MW • Page 50, Table 8-H: Correct CT total from 700 MW to 468 MW • Page 51, Table 8-1 1
: Move New CT from 2027 to 2026 • Pages 57-582
: Correct information on North Carolina RFP compliance • Page 72, Table A-23
: Add additional descriptive language • Page 734
: Correct reference from Portfolio #4 to Portfolio #1 • Page 1265
: Correct year reference from 2033 to 2031 • Page 1396
: Correct typographical error
1 Listed as page 52 on red-lined version due to formatting changes when including revisions. 2 Listed as pages 59-60 on red-lined version. 3 Listed as page 74 on red-lined version. 4 Listed as page 75 on red-lined version. 5 Listed as page 128 on red-lined version. 6 Listed as page 141 on red-lined version.

• Page 141 7: Move reference to battery from Non-Dispatchable to
Dispatchable • Page 159, Table H-28
: Corrections to Confidential Version
Enclosed for electronic filing is a corrected copy of the Public Version of the 2016 DEC IRP, along with a red-lined version of the revised pages of the Public Version showing where the corrections have been made, with the exception of Page 159, which is confidential in nature.
In addition, we are hand delivering to the Commission and the Office of Regulatory Staff copies of the corrected Public and Confidential Versions and a red-lined version of the revised pages of the Public Version and the Confidential Version. Consistent with the initial filing of the 2016 DEC IRP, the Company is filing the corrected Confidential Version and the red-lined version the Confidential Version under seal and requests the Commission extend by reference the confidential treatment of the September I, 2016 filing granted in Order No. 2016-656 to this supplemental filing.
Should you have any questions regarding this matter, please do not hesitate to contact me at 803.988.7130.
Sincerely,
'fJJw · Rebecca J. Dulin
Enclosure
cc: Dawn Hipp, ORS - Director of Utilities, Safety & Transportation Nanette S. Edwards, ORS - Deputy Executive Director Jeffrey M. Nelson, ORS - Chief Counsel & Director of Legal Services Shannon Bowyer Hudson, ORS - Deputy Director of Legal Services J. Blanding Holman, IV, Counsel, Southern Environmental Law Center Frank R. Ellerbe, III, Robinson, McFadden & Moore, P.C. Heather S. Smith, Deputy General Counsel, Duke Energy Carolinas, LLC
7 Listed as page 143 on red-lined version. 8 Listed as page 161 on CONFIDENTIAL red-lined version.
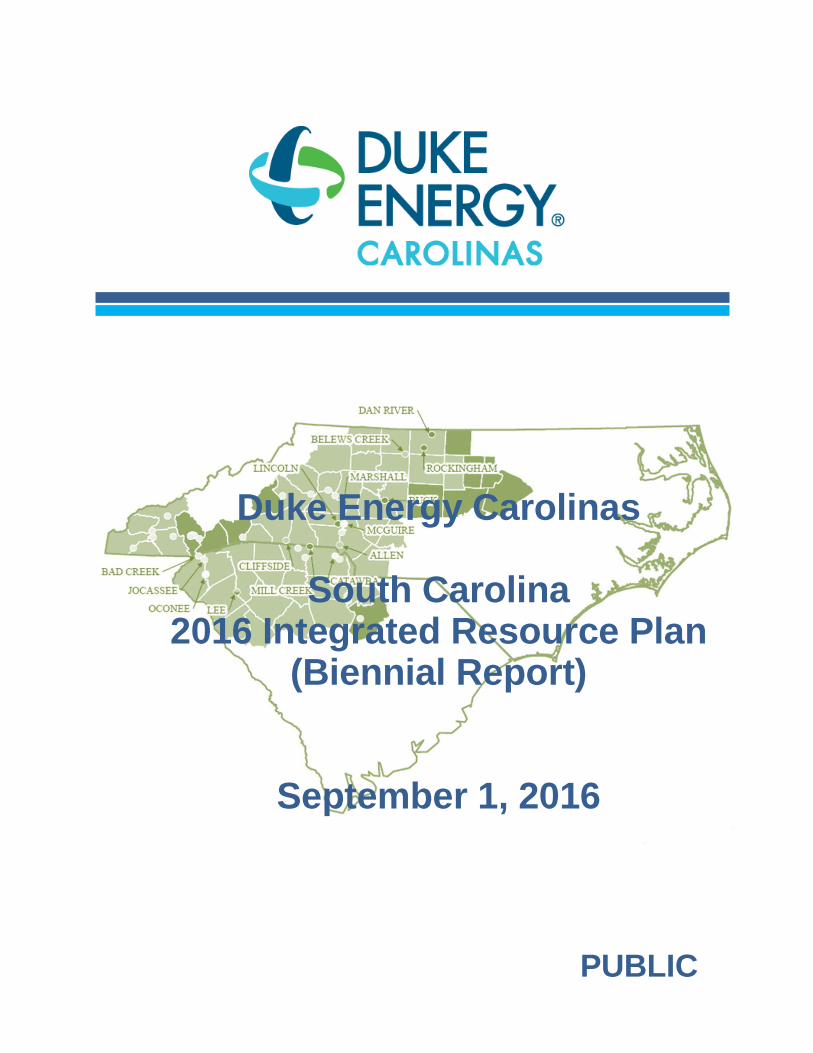
Duke Energy Carolinas
South Carolina 2016 Integrated Resource Plan
(Biennial Report)
September 1, 2016
Confidential
PUBLIC
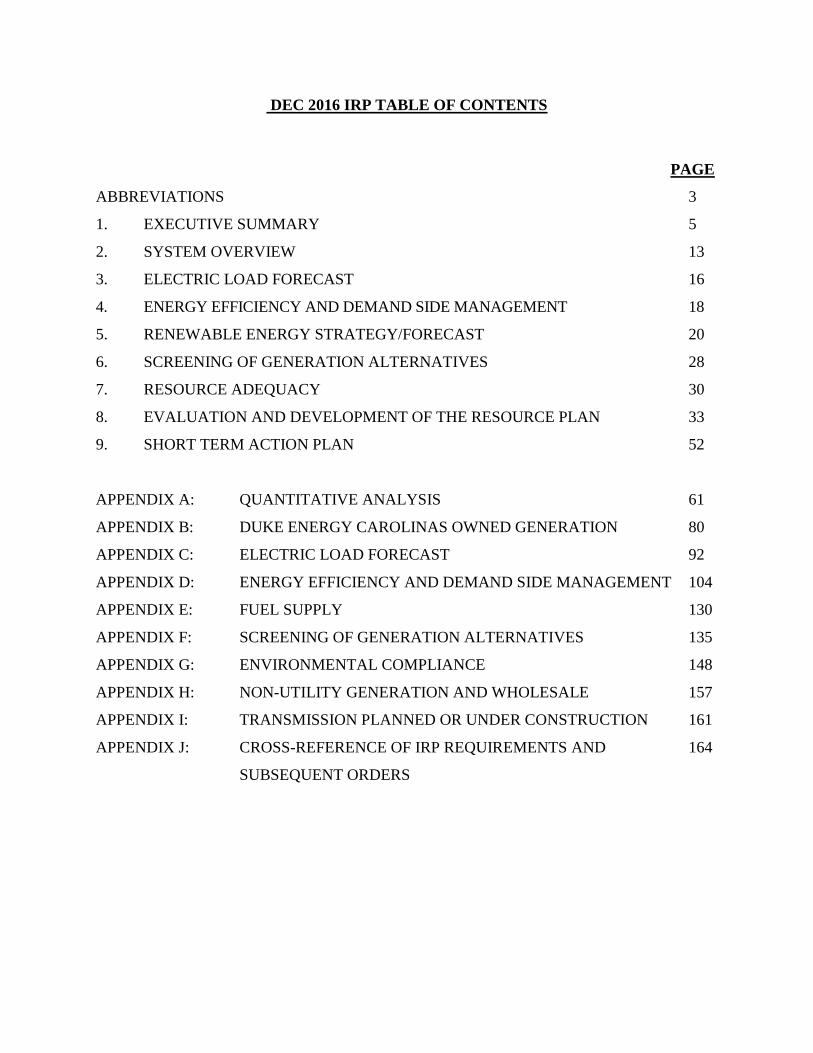
DEC 2016 IRP TABLE OF CONTENTS
PAGE
ABBREVIATIONS 3
1. EXECUTIVE SUMMARY 5
2. SYSTEM OVERVIEW 13
3. ELECTRIC LOAD FORECAST 16
4. ENERGY EFFICIENCY AND DEMAND SIDE MANAGEMENT 18
5. RENEWABLE ENERGY STRATEGY/FORECAST 20
6. SCREENING OF GENERATION ALTERNATIVES 28
7. RESOURCE ADEQUACY 30
8. EVALUATION AND DEVELOPMENT OF THE RESOURCE PLAN 33
9. SHORT TERM ACTION PLAN 52
APPENDIX A: QUANTITATIVE ANALYSIS 61
APPENDIX B: DUKE ENERGY CAROLINAS OWNED GENERATION 80
APPENDIX C: ELECTRIC LOAD FORECAST 92
APPENDIX D: ENERGY EFFICIENCY AND DEMAND SIDE MANAGEMENT 104
APPENDIX E: FUEL SUPPLY 130
APPENDIX F: SCREENING OF GENERATION ALTERNATIVES 135
APPENDIX G: ENVIRONMENTAL COMPLIANCE 148
APPENDIX H: NON-UTILITY GENERATION AND WHOLESALE 157
APPENDIX I: TRANSMISSION PLANNED OR UNDER CONSTRUCTION 161
APPENDIX J: CROSS-REFERENCE OF IRP REQUIREMENTS AND 164
SUBSEQUENT ORDERS
3
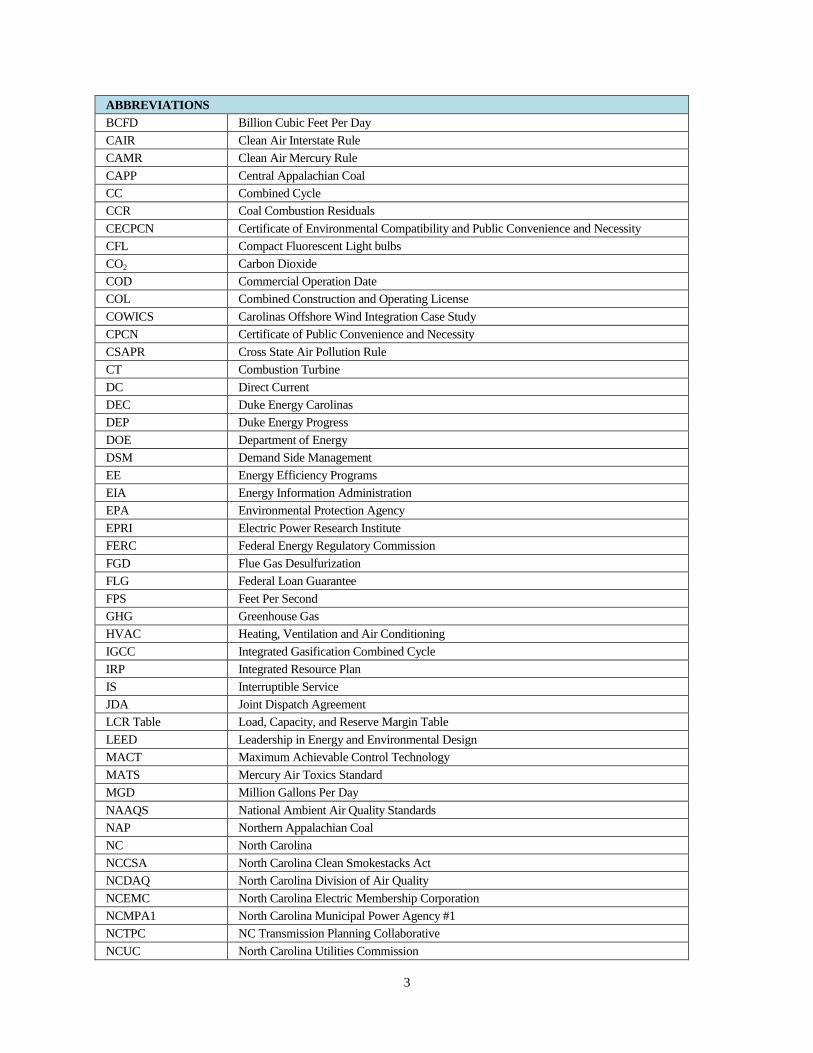
ABBREVIATIONS
BCFD Billion Cubic Feet Per Day
CAIR Clean Air Interstate Rule
CAMR Clean Air Mercury Rule
CAPP Central Appalachian Coal
CC Combined Cycle
CCR Coal Combustion Residuals
CECPCN Certificate of Environmental Compatibility and Public Convenience and Necessity
CFL Compact Fluorescent Light bulbs
CO2 Carbon Dioxide
COD Commercial Operation Date
COL Combined Construction and Operating License
COWICS Carolinas Offshore Wind Integration Case Study
CPCN Certificate of Public Convenience and Necessity
CSAPR Cross State Air Pollution Rule
CT Combustion Turbine
DC Direct Current
DEC Duke Energy Carolinas
DEP Duke Energy Progress
DOE Department of Energy
DSM Demand Side Management
EE Energy Efficiency Programs
EIA Energy Information Administration
EPA Environmental Protection Agency
EPRI Electric Power Research Institute
FERC Federal Energy Regulatory Commission
FGD Flue Gas Desulfurization
FLG Federal Loan Guarantee
FPS Feet Per Second
GHG Greenhouse Gas
HVAC Heating, Ventilation and Air Conditioning
IGCC Integrated Gasification Combined Cycle
IRP Integrated Resource Plan
IS Interruptible Service
JDA Joint Dispatch Agreement
LCR Table Load, Capacity, and Reserve Margin Table
LEED Leadership in Energy and Environmental Design
MACT Maximum Achievable Control Technology
MATS Mercury Air Toxics Standard
MGD Million Gallons Per Day
NAAQS National Ambient Air Quality Standards
NAP Northern Appalachian Coal
NC North Carolina
NCCSA North Carolina Clean Smokestacks Act
NCDAQ North Carolina Division of Air Quality
NCEMC North Carolina Electric Membership Corporation
NCMPA1 North Carolina Municipal Power Agency #1
NCTPC NC Transmission Planning Collaborative
NCUC North Carolina Utilities Commission

4
ABBREVIATIONS CONT.
NERC North American Electric Reliability Corp
NOx Nitrogen Oxide
NPDES National Pollutant Discharge Elimination System
NRC Nuclear Regulatory Commission
NSPS New Source Performance Standard
OATT Open Access Transmission Tariff
PD Power Delivery
PEV Plug-In Electric Vehicles
PMPA Piedmont Municipal Power Agency
PPA Purchase Power Agreement
PPB Parts Per Billion
PSCSC Public Service Commission of South Carolina
PSD Prevention of Significant Deterioration
PV Photovoltaic
PVDG Solar Photovoltaic Distributed Generation Program
PVRR Present Value Revenue Requirements
QF Qualifying Facility
RCRA Resource Conservation Recovery Act
REC Renewable Energy Certificates
REPS Renewable Energy and Energy Efficiency Portfolio Standard
RFP Request for Proposal
RIM Rate Impact Measure
RPS Renewable Portfolio Standard
SC South Carolina
SCR Selective Catalytic Reduction
SEPA Southeastern Power Administration
SERC SERC Reliability Corporation
SG Standby Generation
SIP State Implementation Plan
SO2 Sulfur Dioxide
TAG Technology Assessment Guide
TRC Total Resource Cost
The Company Duke Energy Carolinas
The Plan Duke Energy Carolinas Annual Plan
UG/M3 Micrograms Per Cubic Meter
UCT Utility Cost Test
VACAR Virginia/Carolinas
VAR Volt Ampere Reactive
Duke Energy Carolinas
South Carolina
PUBLIC
2016 IRP Annual Report
Integrated Resource Plan
September 1, 2016
5
1. EXECUTIVE SUMMARY
Overview
For more than a century, Duke Energy Carolinas (DEC) has provided affordable and reliable
electricity to customers in North Carolina (NC) and South Carolina (SC) now totaling more than
2.4 million in number. Each year, as required by the North Carolina Utilities Commission
(NCUC) and the Public Service Commission of South Carolina (PSCSC), DEC submits a long-
range planning document called the Integrated Resource Plan (IRP) detailing potential
infrastructure needed to meet the forecasted electricity requirements for our customers over the
next 15 years.
The 2016 IRP is the best projection of how the Company’s energy portfolio will look over the
next 15 years, based on current data assumptions. This projection may change over time as
variables such as the projected load forecasts, fuel price forecasts, environmental regulations,
technology performance characteristics and other outside factors change.
The proposed plan will meet the following objectives:
Provide reliable electricity especially during peak demand periods by maintaining
adequate reserve margins. Peak demand refers to the highest amount of electricity being
consumed for any given hour across DEC’s entire system.
Add new resources at the lowest reasonable cost to customers. These resources include a
balance of energy efficiency (EE) programs, demand-side management programs (DSM),
renewable resources, nuclear facilities, hydro generation and natural gas generation.
Improve the environmental footprint of the portfolio by meeting or exceeding all federal,
state and local environmental regulations.
A New Era – Plans to Specifically Include Consideration of Winter Demand for Power
Historically, DEC’s resource plans have projected the need for new resources based primarily on the
need to meet summer afternoon peak demand projections. For the first time in the 2016 IRP, DEC is
now developing resource plans that also include new resource additions driven by winter peak
demand projections inclusive of winter reserve requirements. The completion of a comprehensive
reliability study demonstrated the need to include winter peak planning in the IRP process. The
study recognized the growing volatility associated with winter morning peak demand conditions
such as those observed during recent polar vortex events. The study also incorporated the expected
growth in “summer-oriented resources” such as solar facilities and air conditioning load control
programs that provide valuable assistance in meeting summer afternoon peak demands on the

Duke Energy Carolinas
South Carolina
PUBLIC
2016 IRP Annual Report
Integrated Resource Plan
September 1, 2016
6
system but do little to assist in meeting demand for power on cold winter mornings. As a result of
the reliability study, DEC has now added a winter planning reserve target of 17% to its 2016 IRP.
The Road Ahead— Determining Customer Electricity Needs 2017 – 2031
The 2016 IRP identifies the incremental amount of electricity our customers will require over the
next 15 years using the following basic formula:
Growth in Peak
Demand and Energy
Consumption
+ Resource Retirements = New Resource Needs
The annual energy consumption growth rate for all customers is forecasted to be 1.1%. This
growth rate is offset by projections for utility-sponsored EE impacts, reducing the projected
growth rate by 0.1% for a net growth rate of 1.0% after accounting for energy efficiency. Peak
demand growth net of EE is expected to grow slightly faster than overall energy consumption
with an average projected growth rate of 1.3% (winter).
Peak demand refers to the highest hourly level of energy consumption, given expected weather,
throughout the year. The Company also carries reserve capacity to provide reliable supply during
extreme weather conditions.
Projected electricity consumption growth rates net of EE by customer class are as follows:
Commercial class, mainly driven by offices, education and retail, is the fastest growing
class with a projected growth rate of 1.3%.
Industrial class has a projected growth rate of 0.9%.
Residential class has a projected growth rate of 1.2%.
In addition to customer growth, plant retirements and expiring purchase power contracts create the
need to add incremental resources to allow the Company to reliably meet future customer demand.
Over the last several years, aging, less efficient coal power plants have been replaced with a
combination of renewable energy, EE, DSM, hydro generation and state-of-the art natural gas
generation facilities.
The Company recently closed its last coal facility not equipped with advanced emission controls. In
April 2015, Lee Steam Station Units 1 and 2 in Anderson County, SC were shuttered. Unit 3 was
Duke Energy Carolinas
South Carolina
PUBLIC
2016 IRP Annual Report
Integrated Resource Plan
September 1, 2016
7
converted into a natural gas-fired unit. These closings are the most recent in a series of coal unit
retirements totaling approximately 1,700 megawatts (MW) (winter/summer) of cumulative
retirements. Additionally, the Company plans to retire the 1,161 MW/1,127 MW (winter/summer)
Allen Steam Station with Units 1-3 scheduled to retire by December 2024 and Units 4 and 5 in
2028. Finally, DEC has retired approximately 400 MW (summer/winter) of older combustion
turbine (CT) units.
The ultimate timing of unit retirements can be influenced by factors that impact the economics of
continued unit operations. Such factors include changes in relative fuel prices, operations and
maintenance costs and the costs associated with compliance of evolving environmental regulations.
As such, unit retirement schedules are expected to change over time as market conditions change.
Strategy to Meet Customer Needs
Natural Gas
Currently, natural gas resources such as combined cycles (CC) and combustion turbines only make
up 20% of the winter generating capacity in DEC. The 2016 IRP identifies the need for additional
natural gas resources that are economic, highly efficient and reliable. The planning document
outlines the following relative to new natural gas resources. Locations for most of these facilities
have not been finalized:
Complete construction of the 683 MW/653 MW (winter/summer) natural gas combined
cycle plant at Lee Steam Station, Anderson County, SC, (Lee CC) expected to be
commercially available by the end of 2017. An additional 100 MW of capacity will be
purchased by North Carolina Electric Membership Corporation (NCEMC).
Plan for a 1,221 MW/1,123 MW (winter/summer) natural gas combined cycle in 2023.
Plan for 468 MW/435 MW (winter/summer) of combustion turbine resources in 2025.
Nuclear Power
The Company expects to receive the Combined Construction and Operating License (COL) for
the W.S. Lee Nuclear Station (Lee Nuclear) by the end of 2016. The 2016 IRP continues to
support new nuclear generation as a carbon-free, cost-effective, reliable option within the
Company’s resource portfolio. Historically low natural gas prices, ambiguity regarding the timing
and impact of environmental regulations and uncertainty regarding the potential to extend the
licenses of existing nuclear units affects the timing of the need for new nuclear generation. The
Duke Energy Carolinas
South Carolina
PUBLIC
2016 IRP Annual Report
Integrated Resource Plan
September 1, 2016
8
Company views all of its nuclear plants as excellent candidates for license extensions, however to
date no nuclear plant licenses have been extended to operate from 60 years to 80 years. As such,
there is uncertainty regarding the ability to receive a license extension, as well as, any costs that may
be required to operate an additional 20 years. Given the uncertainty of license extension, the IRP
Base Case does not assume license extension at this time, but rather considers relicensing as a
sensitivity to the Base Case.
Additionally, final resolution of environmental regulations, such as the Environmental Protection
Agency’s (EPA’s) Clean Power Plan (CPP), will significantly impact the Company’s generation
portfolio. In light of this uncertainty and the historic volatility of natural gas prices, the Company
evaluated its resource needs, including new nuclear generation, over a range of reasonable
scenarios. The results of this evaluation demonstrated the need for new nuclear generation across
the scenarios, though the timing of the need varied from the mid- 2020s to the early 2030s
depending upon the assumptions. The Company believes these results demonstrate the value of
obtaining the COL for the W.S. Lee Nuclear Station (Lee Nuclear) to the portfolio and
customers.
The base planning case in this IRP models commercial operation of the Lee nuclear units in 2026
and 2028. The uncertainties described above may result in a potential accelerated need for Lee
Nuclear when compared to the base planning case. The COL application anticipates the need for
Lee Nuclear as early as 2024 and 2026 and those dates are reflected in the license application.
The current IRP base plan identifies the following:
Commercial operation of the first unit at the Lee Nuclear Station by November 2026.
Review the potential need for additional new nuclear capacity so that it is available in
advance of the Oconee license expiration.
Study the possibility of a license extension from the current 60 years to 80 years at the
Oconee Nuclear Station extending its operations until the 2053-2054 time frame.
Renewable Energy and Solar Resources
Renewable mandates, substantial tax subsidies and declining costs make solar energy the
Company’s primary renewable energy resource in the 2016 IRP. DEC continues to add solar energy
to its resource mix through Purchased Power Agreements (PPAs), Renewable Energy Credit (REC)
purchases and utility-owned solar generation. The 2016 IRP projects:

Duke Energy Carolinas
South Carolina
PUBLIC
2016 IRP Annual Report
Integrated Resource Plan
September 1, 2016
9
Increasing all solar energy resources from 735 MW in 2017 to 2,168 MW (nameplate) in
2031.
Complying with NC Renewable Energy and Energy Efficiency Portfolio Standards (NC
REPS or REPS) through a combination of solar, other renewables, EE and REC
purchases.
Meeting increasing goals of the South Carolina Distributed Energy Resource Program
(SC DER) through 2020.
Meeting growing customer demand for renewable resources outside of mandated
compliance programs.
While the Company is aggressively pursuing solar as a renewable resource, the 2016 IRP
recognizes and plans for its operational limitations. Solar energy is an intermittent renewable energy
source that cannot be dispatched to meet changing customer demand during all hours of the day and
night or through all types of weather. Solar has limited ability to meet peak demand conditions that
occur during early morning winter hours or summer evening hours. As such, solar energy must be
combined with resources such as EE, DSM, natural gas, hydro and nuclear generation to make up
the Company’s diverse resource portfolio to ensure system reliability.
Energy Efficiency and Demand-Side Management
Existing programs along with new EE and DSM programs approved since the last biennial IRP
in 2014 are supporting efforts to reduce the annual forecasted demand growth over the next 15
years. Aggressive marketing campaigns have been launched to make customers aware of DEC’s
extensive EE and DSM program offerings, successfully increasing customer adoption. The
Company is forecasting continued energy and capacity savings from both EE and DSM
programs through the planning period as depicted in the table below.
Table Exec-1: DEC Projected EE and DSM Energy and Capacity Savings (Winter)
Projected EE and DSM Energy and Capacity Savings
Year Energy (MWh) Capacity (MW)
2017 600,000 547
2031 3,564,500 1,130
Cost-effective EE and DSM programs can help delay the Company’s need to construct and operate
new generation. The Base Case includes the current projections for cost-effective achievable
Duke Energy Carolinas
South Carolina
PUBLIC
2016 IRP Annual Report
Integrated Resource Plan
September 1, 2016
10
savings. Even greater savings may be possible depending on variables such as customer
participation and future technology innovations. Alternative resource portfolios with these higher
levels are presented in Appendix A.
Existing Resources and Alternative Generation
DEC continues to look for opportunities to make enhancements to its existing resources. As such,
the Company expects to complete uprates to each unit of its Bad Creek pumped storage facility in
the 2020 – 2023 timeframe. Each uprate is expected to provide an additional 46 MW to each unit.
These uprates will not only provide valuable capacity to the DEC system, but will also be an
important asset for providing support to the transmission system as intermittent sources of energy,
such as solar, continue to grow in the Carolinas.
DEC continues to explore alternative generation types for feasibility and economic viability to
potentially meet future customer demand. As these generation types become viable and
economically feasible, the Company will consider them in the planning process. In the 2016 IRP,
capacity from Combined Heat and Power (CHP) projects have been increased in the resource plan.
CHP projects efficiently provide both power to the grid while simultaneously meeting the steam
requirements of large institutions and industries in the Carolinas. The current CHP projection for
DEC is 109 MW/100 MW (winter/summer) of CHP in the 2018 – 2021 timeframe.
Strong Trend Toward Cleaner, More Environmentally Friendly Generation
When viewed in total, more than 54% of DEC and DEP’s collective energy needs in 2017 are met
by emission-free resources. This includes nuclear energy, hydro-electric power, DSM, EE and
renewable energy. The remaining 46% of the energy portfolio includes clean, efficient natural gas
units and coal plants that are equipped with state-of-the-art emission technology. Based upon the
EPA carbon standards for new generation, the 2016 IRP does not call for the construction of any
new coal plants.
The EPA’s Clean Power Plan continues to influence the development of the Company’s resource
plans. While the CPP was stayed by the U.S. Supreme Court in 2016, the Company continues to
plan for a range of carbon dioxide (CO2) legislative outcomes. As such, DEC’s base resource plan
assumes some level of carbon emission restrictions consistent with the CPP, while alternate views
of CO2 legislative outcomes were considered as sensitivities.
Duke Energy Carolinas
South Carolina
PUBLIC
2016 IRP Annual Report
Integrated Resource Plan
September 1, 2016
11
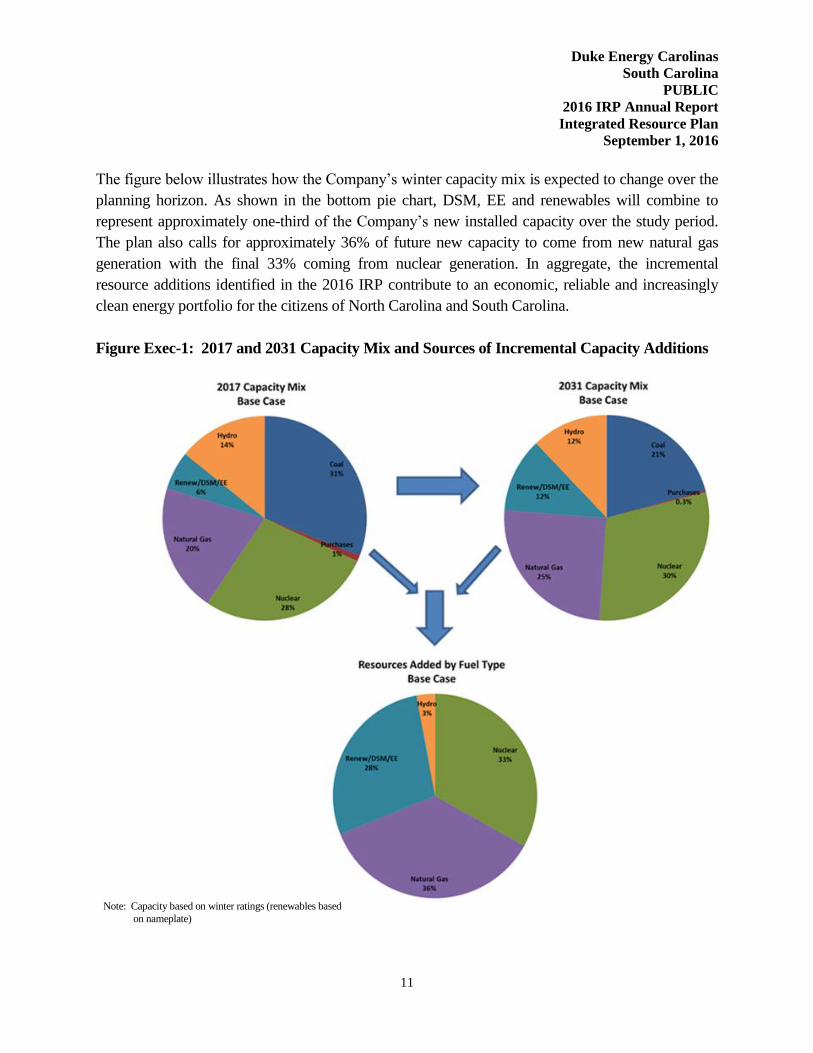
The figure below illustrates how the Company’s winter capacity mix is expected to change over the
planning horizon. As shown in the bottom pie chart, DSM, EE and renewables will combine to
represent approximately one-third of the Company’s new installed capacity over the study period.
The plan also calls for approximately 36% of future new capacity to come from new natural gas
generation with the final 33% coming from nuclear generation. In aggregate, the incremental
resource additions identified in the 2016 IRP contribute to an economic, reliable and increasingly
clean energy portfolio for the citizens of North Carolina and South Carolina.
Figure Exec-1: 2017 and 2031 Capacity Mix and Sources of Incremental Capacity Additions
Note: Capacity based on winter ratings (renewables based
on nameplate)
Duke Energy Carolinas
South Carolina
PUBLIC
2016 IRP Annual Report
Integrated Resource Plan
September 1, 2016
12
This report is intended to provide stakeholders insight into the Company’s planning process for
meeting forecasted customer peak demand and cumulative energy needs over the 15-year planning
horizon. Such stakeholders include: legislative policymakers, public utility commissioners and their
staffs, residential, commercial and industrial retail customers, wholesale customers, environmental
advocates, renewable resource industry groups and the general public. A more detailed presentation
of the Base Case, as described in the above Executive Summary, is included in this document in
Chapter 8 and Appendix A.
The following chapters of this document provide an overview of the inputs, analysis and results
included in the 2016 IRP. In addition to the Base Case, five different resource portfolios were
analyzed under multiple sensitivities. Finally, the appendices to the document give even greater
detail and specific information regarding the input development and the analytic process utilized in
the 2016 IRP.

Duke Energy Carolinas
South Carolina
PUBLIC
2016 IRP Annual Report
Integrated Resource Plan
September 1, 2016
13
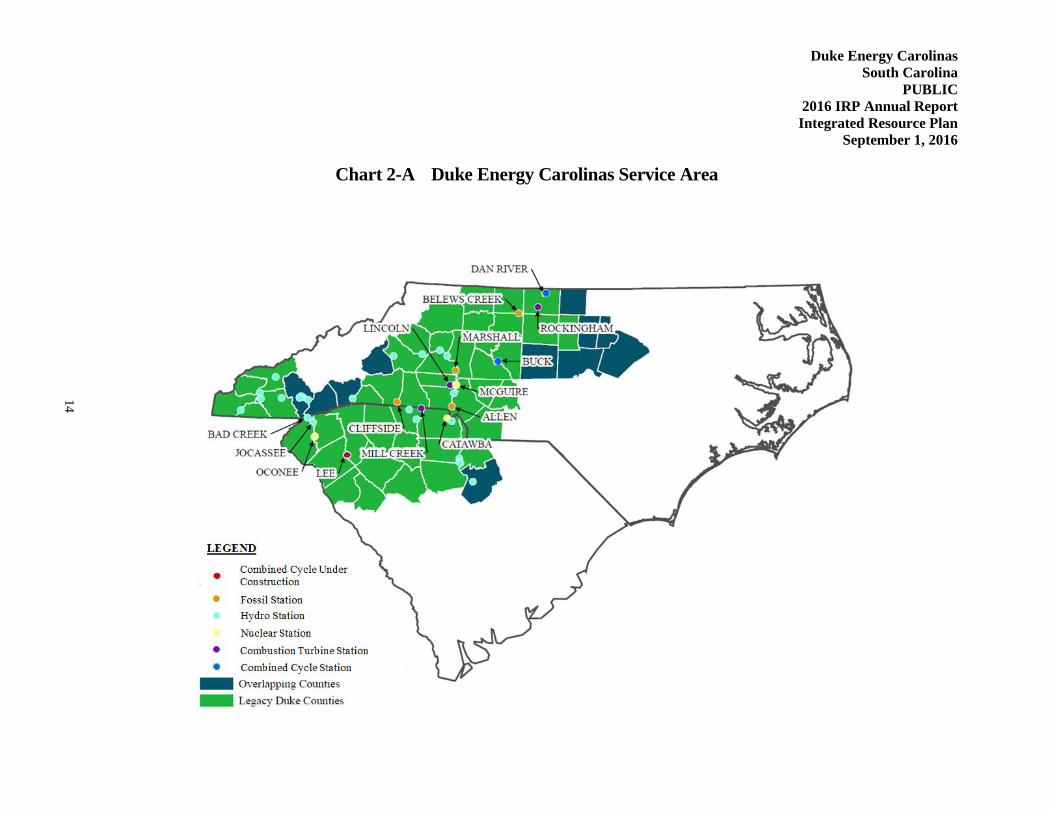
2. SYSTEM OVERVIEW
DEC provides electric service to an approximately 24,088-square-mile service area in central and
western North Carolina and western South Carolina. In addition to retail sales to approximately
2.48 million customers, the Company also sells wholesale electricity to incorporated
municipalities and to public and private utilities. Recent historical values for the number of
customers and sales of electricity by customer groupings may be found in Appendix C.
DEC currently meets energy demand, in part, by purchases from the open market, through longer-
term purchased power contracts and from the following electric generation assets:
Three nuclear generating stations with a combined capacity of 7,358 MW/7,160 MW
(winter/summer)
Four coal-fired stations with a combined capacity of 6,859 MW/ 6,821 MW
(winter/summer)
29 hydroelectric stations (including two pumped-storage facilities) with a combined
capacity of 3,238 MW (winter/summer)
Four CT stations and two CC stations with a combined capacity of 4,607 MW/4,089 MW
(winter/summer)
18 utility-owned solar facilities with a combined firm capacity of 3.9 MW
One natural gas boiler with a capacity of 170 MW (winter/summer)
The Company’s power delivery system consists of approximately 103,140 miles of distribution
lines and 13,087 miles of transmission lines. The transmission system is directly connected to all of
the Transmission Operators that surround the DEC service territory. There are 36 tie-line circuits
connecting with nine different Transmission Operators: DEP, PJM Interconnection, LLC (PJM),
Tennessee Valley Authority (TVA), Smokey Mountain Transmission, Southern Company, Yadkin,
Southeastern Power Administration (SEPA), South Carolina Electric & Gas (SCE&G) and Santee
Cooper. These interconnections allow utilities to work together to provide an additional level of
reliability. The strength of the system is also reinforced through coordination with other electric
service providers in the Virginia-Carolinas (VACAR) sub-region, SERC Reliability Corporation
(SERC) (formerly Southeastern Electric Reliability Council) and North American Electric
Reliability Corporation (NERC).
The map on the following page provides a high-level view of the DEC service area.
Duke Energy Carolinas
South Carolina
PUBLIC
2016 IRP Annual Report
Integrated Resource Plan
September 1, 2016
14
Chart 2-A Duke Energy Carolinas Service Area
Duke Energy Carolinas
South Carolina
PUBLIC
2016 IRP Annual Report
Integrated Resource Plan
September 1, 2016
15
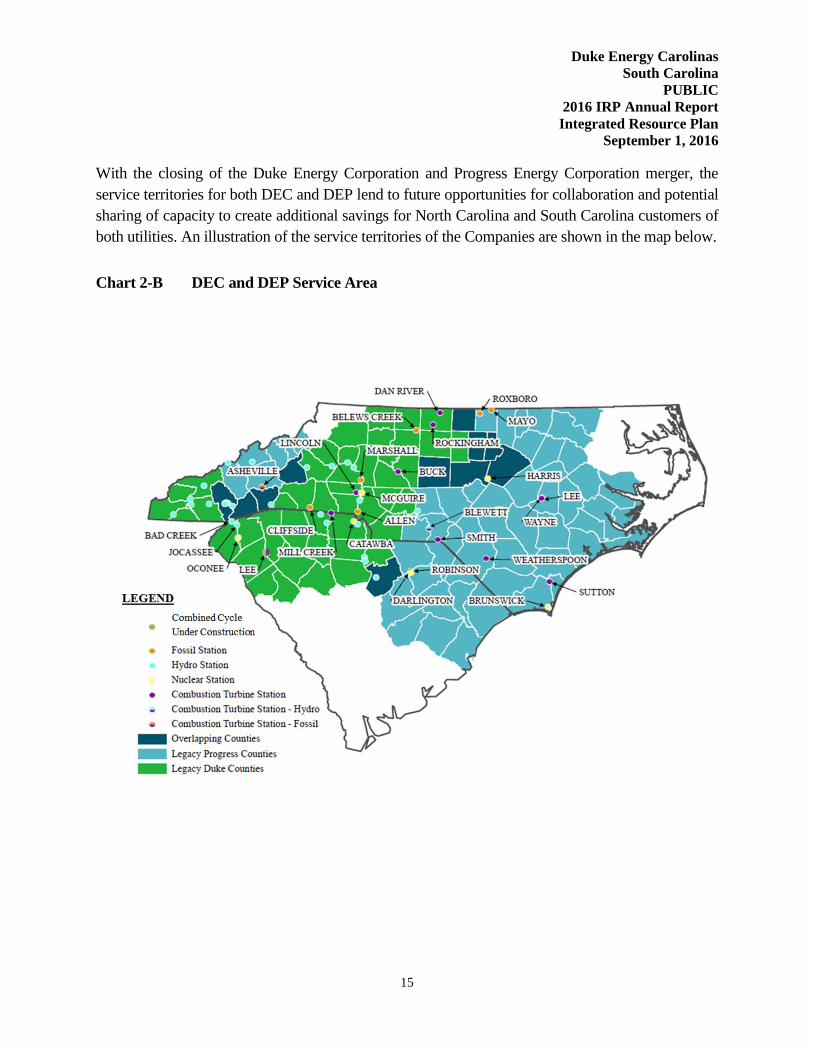
With the closing of the Duke Energy Corporation and Progress Energy Corporation merger, the
service territories for both DEC and DEP lend to future opportunities for collaboration and potential
sharing of capacity to create additional savings for North Carolina and South Carolina customers of
both utilities. An illustration of the service territories of the Companies are shown in the map below.
Chart 2-B DEC and DEP Service Area
Duke Energy Carolinas
South Carolina
PUBLIC
2016 IRP Annual Report
Integrated Resource Plan
September 1, 2016
16
3. ELECTRIC LOAD FORECAST
The Duke Energy Carolinas’ Spring 2016 Forecast provides projections of the energy and peak
demand needs for its service area. The forecast covers the time period of 2017 – 2031 and
represents the needs of the Retail customers and Wholesale customers.
Energy projections are developed with econometric models using key economic factors such as
income, electricity prices, industrial production indices, along with weather, appliance efficiency
trends, rooftop solar trends, and electric vehicle trends. Population is also used in the Residential
customer model. DEC has used regression analysis since 1979 and this technique has yielded
consistently reasonable results over the years.
The economic projections used in the Spring 2016 Forecast are obtained from Moody’s
Analytics, a nationally recognized economic forecasting firm, and include economic forecasts for
the states of North Carolina and South Carolina.
The Retail forecast consists of the three major classes: Residential, Commercial and Industrial.
The Residential class sales forecast is comprised of two projections. The first is the number of
residential customers, which is driven by population. The second is energy usage per customer,
which is driven by weather, regional economic and demographic trends, electric price and
appliance efficiencies.
The usage per customer forecast was derived using a Statistical Adjusted End-Use Model (SAE).
This is a regression-based framework that uses projected appliance saturation and efficiency
trends developed by Itron using Energy Information Administration (EIA) data. It incorporates
naturally occurring efficiency trends and government mandates more explicitly than other
models. The outlook for usage per customer is slightly negative to flat through much of the
forecast horizon, so most of the growth is primarily due to customer increases. The projected
energy growth rate of Residential in the Spring 2016 Forecast after all adjustments for Utility
Energy Efficiency (UEE) programs, Solar and Electric Vehicles from 2017-2031 is 1.2%.
The Commercial forecast also uses an SAE model in an effort to reflect naturally occurring, as
well as government mandated efficiency changes. The three largest sectors in the Commercial
class are Offices, Education and Retail. Commercial is expected to be the fastest growing class,
with a projected energy growth rate of 1.3%, after all adjustments.
The Industrial class is forecasted by a standard econometric model with drivers such as total
manufacturing output, textile output, and the price of electricity. Overall, Industrial energy sales
are expected to grow 0.9% over the forecast horizon, after all adjustments.

Duke Energy Carolinas
South Carolina
PUBLIC
2016 IRP Annual Report
Integrated Resource Plan
September 1, 2016
17
Peak Demand and Energy Forecast
If the impacts of new Duke Energy Carolinas UEE1 programs are included, the projected compound
annual growth rate for the summer peak demand is 1.2%, while winter peaks are forecasted to grow
at a rate of 1.3%. The forecasted compound annual growth rate for annual energy consumption is
1.0% after the impacts of UEE programs are subtracted.
The Spring 2016 Forecast is lower than the Spring 2015 Forecast, with a growth in the summer
peak of 1.4% in the 2015 forecast versus 1.2% in the new forecast. The Spring 2016 Forecast is
lower due to a large Industrial plant closing, strong UEE accomplishments in recent years, and
stronger projected Commercial heating and cooling efficiencies. The load forecast projection for
energy and capacity including the impacts of EE that was utilized in the 2016 IRP is shown in
Table 3-A.
Table 3-A Load Forecast with Energy Efficiency Programs
YEAR SUMMER
(MW)
WINTER
(MW)
ENERGY
(GWh)
2017 18,729 18,416 97,470
2018 18,948 18,665 98,345
2019 18,916 18,721 98,131
2020 19,127 18,957 99,132
2021 19,362 19,259 99,973
2022 19,562 19,466 100,630
2023 19,804 19,731 101,676
2024 20,046 20,011 102,902
2025 20,321 20,223 103,890
2026 20,581 20,570 105,078
2027 20,842 20,844 106,255
2028 21,146 21,161 107,646
2029 21,427 21,478 108,794
2030 21,723 21,734 110,074
2031 22,028 22,068 111,407 Note: Tables 8-B and 8-C differ from these values due to a 47 MW Piedmont Municipal Power Agency (PMPA)
backstand contract through 2020.
A detailed discussion of the electric load forecast is provided in Appendix C.
1 The term UEE is utilized in the load forecasting sections which represents utility-sponsored EE impacts net of free
riders. The term “Gross EE” represents UEE plus naturally occurring energy efficiency in the marketplace.
Duke Energy Carolinas
South Carolina
PUBLIC
2016 IRP Annual Report
Integrated Resource Plan
September 1, 2016
18
4. ENERGY EFFICIENCY AND DEMAND SIDE MANAGEMENT
DEC is committed to making sure electricity remains available, reliable and affordable and that it
is produced in an environmentally sound manner and, therefore, DEC advocates a balanced
solution to meeting future energy needs in the Carolinas. That balance includes a strong
commitment to energy efficiency and demand side management.
Since 2009, DEC has been actively developing and implementing new EE and DSM programs
throughout its North Carolina and South Carolina service areas to help customers reduce their
electricity demands. DEC’s EE and DSM plan is designed to be flexible, with programs being
evaluated on an ongoing basis so that program refinements and budget adjustments can be made
in a timely fashion to maximize benefits and cost-effectiveness. Initiatives are aimed at helping
all customer classes and market segments use energy more wisely. The potential for new
technologies and new delivery options is also reviewed on an ongoing basis in order to provide
customers with access to a comprehensive and current portfolio of programs.
DEC’s EE programs encourage customers to save electricity by installing high efficiency
measures and/or changing the way they use their existing electrical equipment. DEC evaluates
the cost-effectiveness of EE/DSM programs from the perspective of program participants, non-
participants, all customers as a whole and total utility spending using the four California
Standard Practice tests (i.e., Participant Test, Rate Impact Measure (RIM) Test, Total Resource
Cost (TRC) Test and Utility Cost Test (UCT), respectively) to ensure the programs can be
provided at a lower cost than building supply-side alternatives. The use of multiple tests can
ensure the development of a reasonable set of programs and indicate the likelihood that
customers will participate. DEC will continue to seek approval from State utility commissions to
implement EE and DSM programs that are cost-effective and consistent with DEC’s forecasted
resource needs over the planning horizon. DEC currently has approval from the NCUC and
PSCSC to offer a large variety of EE and DSM programs and measures to help reduce electricity
consumption across all types of customers and end-uses.
For IRP purposes, these EE-based demand and energy savings are treated as a reduction to the
load forecast, which also serves to reduce the associated need to build new supply-side
generation, transmission and distribution facilities. DEC also offers a variety of DSM (or
demand response) programs that signal customers to reduce electricity use during select peak
hours as specified by the Company. The IRP treats these “dispatchable” types of programs as
resource options that can be dispatched to meet system capacity needs during periods of peak
demand.

Duke Energy Carolinas
South Carolina
PUBLIC
2016 IRP Annual Report
Integrated Resource Plan
September 1, 2016
19
In 2011, DEC commissioned an EE market potential study to obtain estimates of the technical,
economic and achievable potential for EE savings within the DEC service area. The final report
was prepared by Forefront Economics Inc. and H. Gil Peach and Associates, LLC and was
completed on February 23, 2012. The results of the market potential study are suitable for
integrated resource planning purposes and use in long-range system planning models. However,
the study did not attempt to closely forecast short-term EE achievements from year to year.
Therefore, the Base Case EE/DSM savings contained in this IRP were projected by blending
DEC’s five-year program planning forecast into the long-term achievable potential projections
from the market potential study. An updated Market Potential Study is currently underway and
the results of that study should be available in time for the next DEC IRP process.
DEC prepared a Base Portfolio savings projection that was based on DEC’s five year program
plan for 2016-2020. For periods beyond 2020, the Base Portfolio assumed that the annual
savings projected for 2020 would continue to be achieved in each year thereafter until such time
as the total cumulative EE projections reached approximately 60% of the Economic Potential as
estimated by the Market Potential Study described above. Beyond reaching 60% of the
Economic Potential, sufficient EE savings would be added to keep up with growth in the
customer load.
DEC also prepared a High Portfolio EE savings projection that assumed that the same types of
programs in the Base Portfolio, including potential new technologies, can be offered at higher
levels of participation provided that additional money is spent on program costs to encourage
additional customers to participate.
Additionally, for both the Base and High Portfolios described above, DEC included an
assumption that, when the EE measures included in the forecast reach the end of their useful
lives, the impacts associated with these measures are removed from the future projected EE
impacts. This concept of “rolling off” the impacts from EE programs is explained further in
Appendix C.
See Appendix D for further detail on DEC’s EE, DSM and consumer education programs, which
also includes a discussion of the methodology for determining the cost effectiveness of EE and
DSM programs. Grid modernization demand response impacts are also discussed in Appendix D.

Duke Energy Carolinas
South Carolina
PUBLIC
2016 IRP Annual Report
Integrated Resource Plan
September 1, 2016
20
5. RENEWABLE ENERGY STRATEGY / FORECAST
Since the last IRP was filed, the growth of renewable generation in the US continues to outpace that
of non-renewable generation. In 2015, over 13,000 MW of wind and solar capacity were installed
nationwide compared to 6,500 MW for natural gas, coal, nuclear, and other technologies. Most of
the renewable growth is occurring in states with higher than average retail rates, renewable state
mandates like NC REPS and/or tax incentives. Additionally, the requirements of the Public
Utilities Regulatory Policy Act (PURPA) have driven renewable generation growth, especially in
states with higher avoided cost rates and/or contract terms that are favorable to Qualifying Facilities
(QFs). North Carolina has experienced this growth firsthand. The state ranked in the top 3 in the
country in universal solar installations (>1MW in size) during the last two years, with the majority
of that generating capacity owned by non-utility third parties.
Renewable mandates, substantial federal and state tax subsidies, and declining installed costs make
solar capacity the Company’s primary renewable energy resource in the 2016 IRP. The 2016 IRP
makes the following key assumptions regarding renewable energy:
Solar capacity increases from 735 MW in 2017 to 2,168 MW in 20312 (Base Case);
Compliance with the NC REPS continues to be met through a combination of solar, other
renewables, EE, and REC purchases;
Achievement of the South Carolina Distributed Energy Resource Program goal of 120 MW
of solar capacity located in DEC-South Carolina (DEC-SC);
With no change in policy, and even with the expiration of the NC state tax incentive in
2015, additional renewable capacity, particularly in the form of solar, will continue
unabated, above and beyond the NC REPS requirements, driven by continued expected
technology cost declines, local, state, and/or Federal incentives for these technologies, and
PURPA implementation unique to North Carolina.
NC REPS Compliance
DEC is committed to meeting the requirements of NC REPS, including the poultry waste, swine
waste, and solar set-asides, and the general requirement, which will be met with additional solar,
hydro, biomass, landfill gas, wind, and EE resources. NC REPS allows for compliance utilizing
not only renewable energy resources supplying bundled energy, RECs, and EE, but also by
procuring unbundled RECs (both in-state and out-of-state) and thermal RECs. Therefore, the
2 Solar capacities are adjusted to account for an annual 0.50% degradation of nameplate capacity.

Duke Energy Carolinas
South Carolina
PUBLIC
2016 IRP Annual Report
Integrated Resource Plan
September 1, 2016
21
actual renewable energy delivered to the DEC system is impacted by the amount of EE,
unbundled RECs and thermal RECs utilized for compliance.
Based on currently signed projects and projections of what will materialize from the
interconnection queue to support NC REPS compliance, DEC will have a need for additional
RECs to meet the general compliance requirement in the future without additional resources.
DEC is therefore planning to issue a Request for Proposal (RFP) for additional renewable
resources in the Fall of 2016 in support of its compliance targets. For details of DEC’s NC
REPS compliance plan, please reference the NC REPS Compliance Plan attachment.
Additional information on DEC’s RFP plans can be found in Chapter 9.
Solar: PURPA and the Interconnection Queue
The rapid growth of new solar facilities continues to dominate the renewable energy market
landscape. As discussed above, DEC purchases solar energy from non-utility generators in
North Carolina to comply with NC REPS requirements. In addition to the NC REPS
compliance requirements, however, DEC is also subject to PURPA, which requires that it
purchase power from QFs at its avoided cost, regardless of the utility’s need for such energy.
Thus, another driver of the significant growth in QF solar purchases relates to the avoided cost
rates a utility must pay for this power under PURPA. The utility’s avoided cost rates, as
approved by the NCUC, are a critical input for forecasting renewable penetration from QFs.
Expected avoided costs, which are a key input to the rates paid to solar generators, are subject
to factors such as commodity price volatility, regulatory changes, system operating conditions,
and weather. Therefore, determining the future value of avoided costs is not easy and cannot be
done with a high degree of accuracy.
Given the currently approved avoided cost rates and standard offer terms in NC, the NC REPS
mandate, continuing impacts from the 35% North Carolina Renewable Energy Investment Tax
Credit Safe Harbor Provision (which expired at the end of 2015), and the 30% Federal Solar
Investment Tax Credit (ITC) (which was extended in December 2015), the QF market remains
very active in the DEC service territory. Illustrating this trend are these facts:
DEC had over 300 MW-AC (includes compliance and non-compliance MW) of third-
party solar facilities on its system through the end of 2015, with close to half of the
facilities interconnecting in 2015.
When renewable resources were evaluated for the 2016 IRP, DEC reported another
~140 MW of third-party solar under construction and over 900 MW in the

Duke Energy Carolinas
South Carolina
PUBLIC
2016 IRP Annual Report
Integrated Resource Plan
September 1, 2016
22
interconnection queue, including over 200 MW requested during the first quarter of
2016.
Projecting future solar connections from the interconnection queue, and its impact on future
resource needs, presents a significant challenge as a large number of projects and
interconnection requests have historically been cancelled or their ownership has changed hands
numerous times. Given the size of the DEC and DEP queues, the time to complete the process
from interconnection request to project completion where a facility is connected and supplying
energy to the grid, often takes 2 years or more (please refer to Docket E-100 Sub 101A). The
interconnection queue as of June 30, 2016 is provided in Appendix H.
While forecasting what will materialize from the current queue is difficult, projecting long-
term solar growth is even more challenging. There are a number of factors that are difficult to
predict, but necessary to estimate future renewable generation. These variables include, but are
not limited to, interest rates, technology costs, construction and maintenance costs, energy and
tax policy and operational constraints such as interconnection feasibility or land availability. In
total, DEC expects 204 MW-AC of nameplate non-compliance mandated PURPA solar
capacity by 2031, some of which could be converted to compliance resources.
Utility-Owned Solar and Integration
DEC continues to evaluate utility-owned solar additions to support its compliance targets and
operational flexibility. For example, DEC has two new utility-scale solar projects under
construction listed below which should be producing RECs and available for the summer peak
of 2017:
Monroe Solar Facility – 60MW, located in Union County; and
Mocksville Solar Facility – 15MW, located in Davie County.
While there is uncertainty in the rate of decline in the cost of solar over time, in most scenarios
evaluated in the IRP planning process, additional utility-owned solar was not selected above and
beyond the total capacity expected for NC REPS compliance, PURPA puts, and customer product
offerings like the Green Source Rider and SC DER. As described in more detail in Appendix A,
scenarios where solar was selected required assumptions in which lower installed solar costs and/or
higher emissions constraints were utilized relative to the Base Case assumptions. Such price
declines may be realized, and the Company will continue to position itself for delivering quality,
cost-effective projects that leverage the utility’s scale and knowledge. DEC continues to build its
relationships with suppliers, Engineering, Procurement, and Construction Contractors (EPCs), and
Duke Energy Carolinas
South Carolina
PUBLIC
2016 IRP Annual Report
Integrated Resource Plan
September 1, 2016
23
other entities to create greater efficiencies in the supply chain, reduce construction costs, reduce
operating and maintenance costs (O&M), and enhance system design. DEC will continue to
evaluate how to increase its ownership of renewable generation to expand its portfolio of clean
energy resources, meet future customer demand, and comply with evolving government regulations
that promote the use of such resources.
Positioning itself to properly integrate renewable resources to the grid, especially solar, is critical.
The Company is already observing that significant volumes of solar capacity result in excess energy
challenges during the middle of the day during mild conditions when overall system demand is low.
As a result, the Company sees an increasing need for operational control of the solar facilities
connected to the grid. Additionally, the intermittency of solar output will require the Company to
evaluate and invest in technologies to provide solutions for voltage, (Volt Ampere Reactive) VaR,
and/or higher ancillary reserve requirements. DEC expects that it can safely and reliably integrate
renewable resources like solar through a combination of utility-owned assets and cooperation with
third parties. DEC will evaluate the potential for acquiring facilities, where appropriate, to help
ensure the Company has needed operational control, while minimizing the costs associated
with system integration.
SC DER Solar and Customer Program Solar
In addition to PURPA and NC REPS compliance solar, solar growth has also been embraced with
customer-oriented strategies such as the Green Source Rider and SC DER. The Green Source Rider
allows DEC to procure renewable energy on behalf of the customer. The customer pays for the REC
during their project term and DEC may acquire the REC following the contract term. Customers
such as Cisco and Google have participated in this program, which is anticipated to grow to 102
MW-AC (nameplate capacity) by 2017. DEC is evaluating additional programs similar to the Green
Source Rider as companies nationwide have demonstrated a desire for solar to support growing
sustainability goals. For example, technology companies that often have data centers have signed
around 1 GW of renewable energy PPAs nationally from 2015-June 2016.
In 2015, the Company’s DER plan was approved by the PSCSC, thus allowing the Company to
pursue a portfolio of initiatives designed to increase the solar capacity located in the Company’s
South Carolina service area. The program contains three tiers; each is equivalent to 1% of the

Duke Energy Carolinas
South Carolina
PUBLIC
2016 IRP Annual Report
Integrated Resource Plan
September 1, 2016
24
Company’s estimated average South Carolina retail peak demand (or 40 MW of nameplate solar
capacity). The plan calls for a total of ~120MW of solar capacity3 distributed across three tiers:
Tier I: 40 MW of solar capacity from facilities each >1 MW and less than 10 MW in size.
Tier II: 40 MW met via behind-the-meter rooftop solar facilities ≤1 MW for residential,
commercial, and industrial customers with at least a quarter of that capacity from
facilities each ≤ 20 kilowatts (kW). Since Tier II is behind the meter, the expected solar
generation is embedded in the load forecast as a reduction to expected load.
Tier III: Investment by the utility in 40 MW of solar capacity from facilities each >1 MW
and less than 10 MW in size. Upon completion of Tiers I and II (to occur no later than
2021), the Company can directly invest in additional solar generation to complete Tier
III.
In DEC-South Carolina, as part of the SC DER plan, the Company launched its first Shared Solar
program. Often called “community solar,” shared solar refers to both a solar facility and a billing
structure in which multiple customers subscribe to and share in the economic benefits of the output
of a single solar facility. The Company designed its initial SC DER shared solar program such that
it would have strong appeal to residential and commercial customers who rent or lease their
premise, to residential customers who reside in multifamily housing units or shaded housing, and to
residential customers for whom the relatively high up-front costs of solar photovoltaic (PV) make
net metering unattainable. The Company is evaluating the potential for a shared solar offer to North
Carolina customers. Furthermore, the Company continues to study the potential for programs that
support more load-centered rooftop solar PV installation in North Carolina.
Battery Storage and Wind
In addition to solar, the Company is assessing renewable technologies such as battery storage and
wind. Battery storage costs are expected to decline significantly which may make it a viable option
in the long run to support operational challenges caused by uncontrolled solar penetration. In the
short run, battery storage is expected to be used primarily to support localized distribution based
issues.
Similar to solar, at the end of 2015, wind received a boost from the announcement of a multi-year
extension of the wind energy Production Tax Credit (PTC). Investing in wind inside of DEC’s
3 1% of the Company’s South Carolina retail peak is equal to approximately 40 MW.

Duke Energy Carolinas
South Carolina
PUBLIC
2016 IRP Annual Report
Integrated Resource Plan
September 1, 2016
25
footprint is unlikely in the short term in spite of the PTC. This is primarily due to a lack of suitable
sites and permitting challenges, as well as less significant expected drops in capital costs compared
to other renewable technologies like solar. As discussed in the NC REPS compliance plan however,
additional opportunities may be pursued to transmit wind energy from out of state regions where
wind is more prevalent and into the Carolinas.
Summary of Expected Renewable Resource Capacity Additions
The 2016 IRP incorporated three different renewable capacity forecasts: Low Case, Base Case,
and High Case. Each of these cases includes renewable capacity required for compliance with
NC REPS, non-compliance PURPA renewable purchases, as well as SC DER, Green Source
Rider, and other solar capacity associated with customer programs. The Company anticipates a
diverse portfolio including solar, biomass, hydro, and other resources. Actual results could
vary substantially depending on the uncertainties listed above as well as other potential
changes to future legislative requirements, supportive tax policies, technology, and other
market forces. The details of the forecasted capacity additions, including both nameplate and
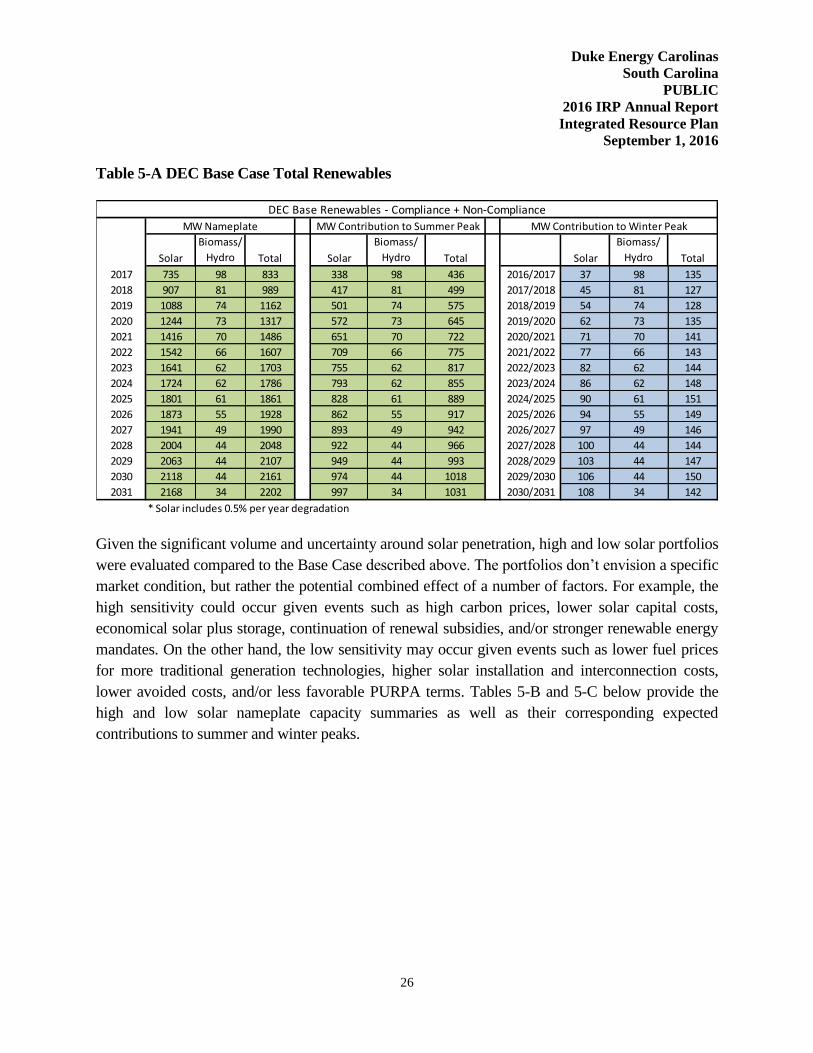
contribution to winter and summer peaks are summarized in Table 5-A below.
While solar doesn’t normally reach its maximum output at the time of DEC’s expected peak
load in the summer, solar’s contribution to summer peak (net of solar) load is large enough
(46% of nameplate solar capacity) that it may push the time of summer peak from hour
beginning 4:00 PM to 5:00 PM or later if solar penetration levels continue to increase. Note,
however, that solar is unlikely to have a similar impact on the morning winter peak (net of
solar) due to lower expected solar output in the morning hours (5% of nameplate solar capacity
contribution).
Duke Energy Carolinas
South Carolina
PUBLIC
2016 IRP Annual Report
Integrated Resource Plan
September 1, 2016
26
Table 5-A DEC Base Case Total Renewables
Given the significant volume and uncertainty around solar penetration, high and low solar portfolios
were evaluated compared to the Base Case described above. The portfolios don’t envision a specific
market condition, but rather the potential combined effect of a number of factors. For example, the
high sensitivity could occur given events such as high carbon prices, lower solar capital costs,
economical solar plus storage, continuation of renewal subsidies, and/or stronger renewable energy
mandates. On the other hand, the low sensitivity may occur given events such as lower fuel prices
for more traditional generation technologies, higher solar installation and interconnection costs,
lower avoided costs, and/or less favorable PURPA terms. Tables 5-B and 5-C below provide the
high and low solar nameplate capacity summaries as well as their corresponding expected
contributions to summer and winter peaks.
Solar
Biomass/
Hydro Total Solar
Biomass/
Hydro Total Solar
Biomass/
Hydro Total
2017 735 98 833 338 98 436 2016/2017 37 98 135
2018 907 81 989 417 81 499 2017/2018 45 81 127
2019 1088 74 1162 501 74 575 2018/2019 54 74 128
2020 1244 73 1317 572 73 645 2019/2020 62 73 135
2021 1416 70 1486 651 70 722 2020/2021 71 70 141
2022 1542 66 1607 709 66 775 2021/2022 77 66 143
2023 1641 62 1703 755 62 817 2022/2023 82 62 144
2024 1724 62 1786 793 62 855 2023/2024 86 62 148
2025 1801 61 1861 828 61 889 2024/2025 90 61 151
2026 1873 55 1928 862 55 917 2025/2026 94 55 149
2027 1941 49 1990 893 49 942 2026/2027 97 49 146
2028 2004 44 2048 922 44 966 2027/2028 100 44 144
2029 2063 44 2107 949 44 993 2028/2029 103 44 147
2030 2118 44 2161 974 44 1018 2029/2030 106 44 150
2031 2168 34 2202 997 34 1031 2030/2031 108 34 142
* Solar includes 0.5% per year degradation
MW Contribution to Summer Peak
DEC Base Renewables - Compliance + Non-Compliance
MW Contribution to Winter PeakMW Nameplate
Duke Energy Carolinas
South Carolina
PUBLIC
2016 IRP Annual Report
Integrated Resource Plan
September 1, 2016
27
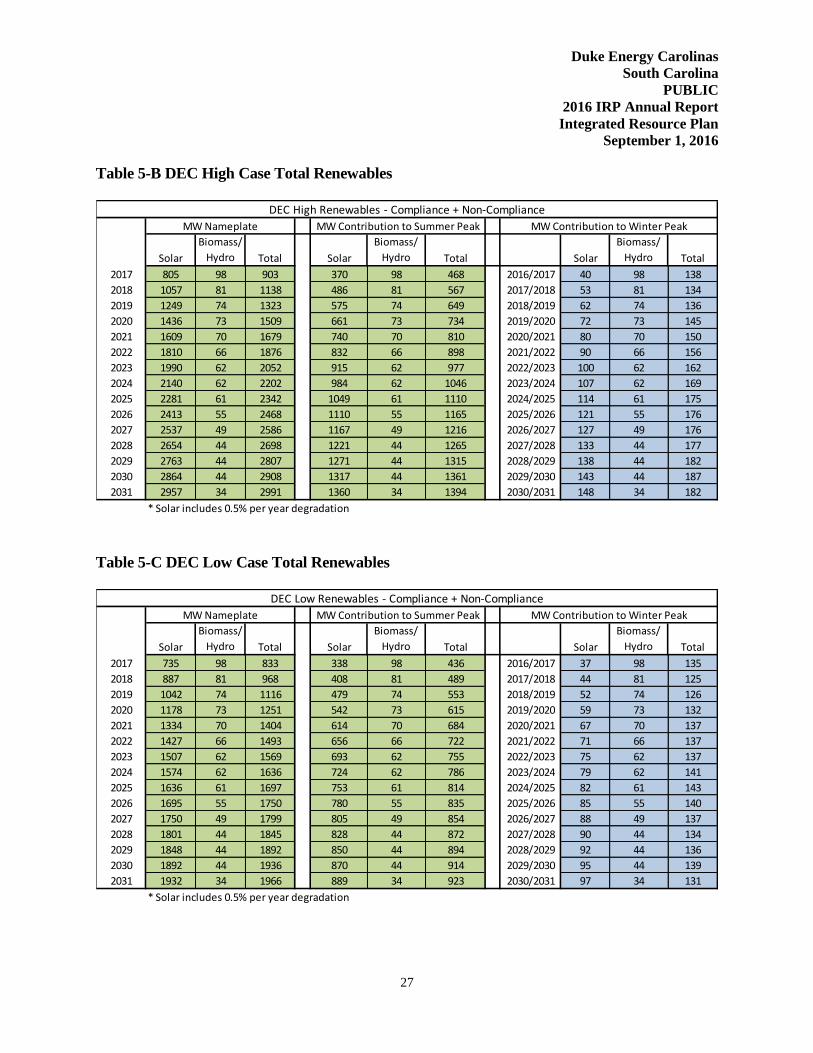
Table 5-B DEC High Case Total Renewables
Table 5-C DEC Low Case Total Renewables
Solar
Biomass/
Hydro Total Solar
Biomass/
Hydro Total Solar
Biomass/
Hydro Total
2017 805 98 903 370 98 468 2016/2017 40 98 138
2018 1057 81 1138 486 81 567 2017/2018 53 81 134
2019 1249 74 1323 575 74 649 2018/2019 62 74 136
2020 1436 73 1509 661 73 734 2019/2020 72 73 145
2021 1609 70 1679 740 70 810 2020/2021 80 70 150
2022 1810 66 1876 832 66 898 2021/2022 90 66 156
2023 1990 62 2052 915 62 977 2022/2023 100 62 162
2024 2140 62 2202 984 62 1046 2023/2024 107 62 169
2025 2281 61 2342 1049 61 1110 2024/2025 114 61 175
2026 2413 55 2468 1110 55 1165 2025/2026 121 55 176
2027 2537 49 2586 1167 49 1216 2026/2027 127 49 176
2028 2654 44 2698 1221 44 1265 2027/2028 133 44 177
2029 2763 44 2807 1271 44 1315 2028/2029 138 44 182
2030 2864 44 2908 1317 44 1361 2029/2030 143 44 187
2031 2957 34 2991 1360 34 1394 2030/2031 148 34 182
* Solar includes 0.5% per year degradation
DEC High Renewables - Compliance + Non-Compliance
MW Nameplate MW Contribution to Summer Peak MW Contribution to Winter Peak
Solar
Biomass/
Hydro Total Solar
Biomass/
Hydro Total Solar
Biomass/
Hydro Total
2017 735 98 833 338 98 436 2016/2017 37 98 135
2018 887 81 968 408 81 489 2017/2018 44 81 125
2019 1042 74 1116 479 74 553 2018/2019 52 74 126
2020 1178 73 1251 542 73 615 2019/2020 59 73 132
2021 1334 70 1404 614 70 684 2020/2021 67 70 137
2022 1427 66 1493 656 66 722 2021/2022 71 66 137
2023 1507 62 1569 693 62 755 2022/2023 75 62 137
2024 1574 62 1636 724 62 786 2023/2024 79 62 141
2025 1636 61 1697 753 61 814 2024/2025 82 61 143
2026 1695 55 1750 780 55 835 2025/2026 85 55 140
2027 1750 49 1799 805 49 854 2026/2027 88 49 137
2028 1801 44 1845 828 44 872 2027/2028 90 44 134
2029 1848 44 1892 850 44 894 2028/2029 92 44 136
2030 1892 44 1936 870 44 914 2029/2030 95 44 139
2031 1932 34 1966 889 34 923 2030/2031 97 34 131
* Solar includes 0.5% per year degradation
DEC Low Renewables - Compliance + Non-Compliance
MW Nameplate MW Contribution to Summer Peak MW Contribution to Winter Peak

Duke Energy Carolinas
South Carolina
PUBLIC
2016 IRP Annual Report
Integrated Resource Plan
September 1, 2016
28
6. SCREENING OF GENERATION ALTERNATIVES
As previously discussed, the Company develops the load forecast and adjusts for the impacts of EE
programs that have been pre-screened for cost-effectiveness. The growth in this adjusted load
forecast and associated reserve requirements, along with existing unit retirements or purchased
power contract expirations, creates a need for future generation. This need is partially met with
demand side management (DSM) resources and the renewable resources required for compliance
with NC REPS. The remainder of the future generation needs can be met with a variety of potential
supply side technologies.
For purposes of the 2016 IRP, the Company considered a diverse range of technology choices
utilizing a variety of different fuels, including ultra-supercritical pulverized coal (USCPC) units
with carbon capture and sequestration (CCS), integrated gasification combined cycle (IGCC) with
CCS, CTs, CCs with inlet chillers and duct firing, Combined Heat and Power, reciprocating
engines, and nuclear units. In addition, Duke Energy Carolinas considered renewable technologies
such as wind, solar, battery storage and landfill gas in the screening analysis.
For the 2016 IRP screening analysis, the Company screened technology types within their own
respective general categories of baseload, peaking/intermediate and renewable, with the ultimate
goal of screening to pass the best alternatives from each of these three categories to the integration
process. As in past years, the reason for the initial screening analysis is to determine the most viable
and cost-effective resources for further evaluation. This initial screening evaluation is necessary to
narrow down options to be further evaluated in the quantitative analysis process as discussed in
Appendix A.
The results of these screening processes determine a smaller, more manageable subset of
technologies for detailed analysis in the expansion planning model. The following list details the
technologies that were evaluated in the screening analysis phase of the IRP process. The technical
and economic screening is discussed in detail in Appendix F.
Dispatchable (Summer Ratings)
• Base load – 782 MW Ultra-Supercritical Pulverized Coal with CCS
• Base load – 557 MW 2x1 IGCC with CCS
• Base load – 2 x 1,117 MW Nuclear Units (AP1000)
• Base load – 576 MW – 1x1x1 Advanced Combined Cycle (Inlet Chiller and Fired)
• Base load – 1,160 MW – 2x2x1 Advanced Combined Cycle (Inlet Chiller and Fired)
• Base load – 20 MW – Combined Heat & Power (CHP)

Duke Energy Carolinas
South Carolina
PUBLIC
2016 IRP Annual Report
Integrated Resource Plan
September 1, 2016
29
• Peaking/Intermediate – 166 MW 4 x LM6000 Combustion Turbines
• Peaking/Intermediate – 201 MW 12 x Reciprocating Engine Plant
• Peaking/Intermediate – 870 MW 4 x 7FA.05 Combustion Turbines
• Renewable – 2 MW / 8 MWh Li-ion Battery
• Renewable – 5 MW Landfill gas
Non-Dispatchable
• Renewable – 150 MW Wind - On-Shore
• Renewable – 5 MW Solar PV
Duke Energy Carolinas
South Carolina
PUBLIC
2016 IRP Annual Report
Integrated Resource Plan
September 1, 2016
30
7. RESOURCE ADEQUACY
Background
Resource adequacy refers to the ability of the electric system to supply the aggregate electrical
demand and energy requirements of the end-use customers at all times, taking into account
scheduled and reasonably expected unscheduled outages of system elements. Utilities require a
margin of reserve generating capacity in order to provide reliable service. Periodic scheduled
outages are required to perform maintenance, inspections of generating plant equipment, and to
refuel nuclear plants. Unanticipated mechanical failures may occur at any given time, which may
require shutdown of equipment to repair failed components. Adequate reserve capacity must be
available to accommodate these unplanned outages and to compensate for higher than projected
peak demand due to forecast uncertainty and weather extremes. The Company utilizes a reserve
margin target in its IRP process to ensure resource adequacy. Reserve margin is defined as total
resources minus peak demand, divided by peak demand. The reserve margin target is established
based on probabilistic assessments as described below.
In 2012, the Company retained Astrape Consulting to conduct a resource adequacy study to
determine the level of reserves needed to maintain adequate generation system reliability. Based on
results of the 2012 Astrape analysis, the Company adopted a 14.5% minimum summer planning
reserve margin for scheduling new resource additions.
In 2016, the Company again retained Astrape Consulting to conduct an update to the resource
adequacy study performed in 2012. The updated study was warranted due to two primary factors.
First, the extreme weather experienced in the service territory in recent winter periods was so
impactful to the system that additional review with the inclusion of recent years’ weather history
was warranted. Second, since the last resource adequacy study the system has added, and projects
to add, a large amount of resources that provide meaningful capacity benefits in the summer. From
a peak reduction perspective, summer-oriented resources include summer load control programs,
chiller additions to natural gas combined cycle units, and solar generation. Solar resources
contribute approximately 46% of nameplate capacity at the time of the expected summer peak
demand and only about 5% of nameplate capacity at the time of expected winter peak demand. The
interconnection queue for solar facilities shows the potential to add significantly to the solar
resources already incorporated on the system.
Duke Energy Carolinas
South Carolina
PUBLIC
2016 IRP Annual Report
Integrated Resource Plan
September 1, 2016
31
2016 Resource Adequacy Study Results
Astrape conducted an updated resource adequacy assessment in 2016 that incorporated the
uncertainty of weather, economic load growth, unit availability, and the availability of
transmission and generation capacity for emergency assistance. Astrape analyzed the optimal
planning reserve margin based on providing an acceptable level of physical reliability and
minimizing economic costs to customers. The most common physical reliability metric used in the
industry is to target a system reserve margin that satisfies the one day in 10 years Loss of Load
Expectation (LOLE) standard. This standard is interpreted as one firm load shed event every 10
years due to a shortage of generating capacity. From an economic perspective, as planning reserve
margin increases, the total cost of reserves increases while the costs related to reliability events
decline. Similarly, as planning reserve margin decreases, the cost of reserves decreases while the
costs related to reliability events increase, including the costs to customers for loss of power. Thus,
there is an economic optimum point where the cost of additional reserves plus the cost of reliability
events to customers is minimized.
In the past, loss of load risk has typically been concentrated during the summer months and a
summer reserve margin target provided adequate reserves in the summer and winter and was thus
sufficient for ensuring resource adequacy. However, the incorporation of recent winter load data
and the significant amount of solar penetration in the updated study, shows that the majority of loss
of load risk is now heavily concentrated during the winter period. Since solar capacity contribution
to peak is much greater in the summer compared to the winter, use of a summer reserve margin
target will no longer ensure that adequate reserve levels are maintained in the winter. As a result, a
winter planning reserve margin target is now needed to ensure that adequate resources are available
throughout the year to meet customer demand.
Based on results of the 2016 resource adequacy assessment, the Company has adopted a 17%
minimum winter reserve margin target for scheduling new resource additions. Astrape also
recommends maintaining a 15% minimum summer reserve margin to ensure adequate reliability is
maintained during the summer period. However, given the portfolio of existing and projected new
resources, a 15% summer reserve margin will always be satisfied if a 17% winter reserve margin is
maintained. The Company will continue to monitor its generation portfolio and other planning
assumptions that can impact resource adequacy and initiate new studies as appropriate.
Adequacy of Projected Reserves DEC’s resource plan reflects winter reserve margins ranging from approximately 17% to 22%.
Reserves projected in DEC’s IRP meet the minimum planning reserve margin target and thus

Duke Energy Carolinas
South Carolina
PUBLIC
2016 IRP Annual Report
Integrated Resource Plan
September 1, 2016
32
satisfy the one day in 10 years LOLE criterion. The projected reserve margin exceeds the minimum
17% winter target by 3% or more in 2017/18 and 2018/19 as a result of the Lee combined-cycle
addition in November 2017. The reserve margin exceeds the minimum target by 3% in 2022/23
and 2023/24 due to the addition of a large combined cycle unit in December 2022. Also, the
reserve margin exceeds the minimum target by 3% in 2026/27 due to the addition of a baseload
nuclear unit in November 2026.
The IRP provides general guidance in the type and timing of resource additions. Since capacity is
generally added in large blocks to take advantage of economies of scale, it should be noted that
projected planning reserve margins in years immediately following new generation additions will
often be somewhat higher than the minimum target. Large resource additions are deemed
economic only if they have a lower Present Value Revenue Requirement (PVRR) over the life
of the asset as compared to smaller resources that better fit the short-term reserve margin
need. Reserves projected in DEC’s IRP are appropriate for providing an economic and reliable
power supply.
Duke Energy Carolinas
South Carolina
PUBLIC
2016 IRP Annual Report
Integrated Resource Plan
September 1, 2016
33
8. EVALUATION AND DEVELOPMENT OF THE RESOURCE PLAN
As described in the previous chapter, DEC has added a winter planning reserve margin criteria to
the IRP process. To meet the future needs of DEC’s customers, it is necessary for the Company to
adequately understand the load and resource balance. For each year of the planning horizon, DEC
develops a load forecast of cumulative energy sales and hourly peak demand. To determine total
resources needed, the Company considers the peak demand load obligation plus a 17% minimum
planning winter reserve margin. The projected capability of existing resources, including generating
units, EE and DSM, renewable resources and purchased power contracts is measured against the
total resource need. Any deficit in future years will be met by a mix of additional resources that
reliably and cost-effectively meet the load obligation and planning reserve margin while complying
with all environmental and regulatory requirements. It should be noted that DEC considers the non-
firm energy purchases and sales associated with the Joint Dispatch Agreement (JDA) with DEP in
the development of its independent Base Case and five alternative portfolios as discussed later in
this chapter and in Appendix A.
IRP Process
The following section summarizes the Data Input, Generation Alternative Screening, Portfolio
Development and Detailed Analysis steps in the IRP process. A more detailed discussion of the IRP
Process and development of the Base Case and additional portfolios is provided in Appendix A.
Data Inputs
The initial step in the IRP development process is one of input data refreshment and revision. For
the 2016 IRP, data inputs such as load forecast, EE and DSM projections, fuel prices, projected CO2
prices, individual plant operating and cost information, and future resource information were
updated with the most current data. These data inputs were developed and provided by Company
subject matter experts and/or based upon vendor studies, where available. Furthermore, DEC and
DEP continue to benefit from the combined experience of both utilities’ subject matter experts
utilizing best practices from each utility in the development of their respective IRP inputs. Where
appropriate, common data inputs were utilized.
As expected, certain data elements and issues have a larger impact on the IRP than others. Any
changes in these elements may result in a noticeable impact to the plan, and as such, these elements
are closely monitored. Some of the most consequential data elements are listed below. A detailed
discussion of each of these data elements has been presented throughout this document and are
examined in more detail in the appendices.
Duke Energy Carolinas
South Carolina
PUBLIC
2016 IRP Annual Report
Integrated Resource Plan
September 1, 2016
34
Load Forecast for Customer Demand
EE/DSM
Renewable Resources and Cost Projections
Fuel Costs Forecasts
Technology Costs and Operating Characteristics
Environmental Legislation and Regulation
Generation Alternative Screening
DEC reviews generation resource alternatives on a technical and economic basis. Resources must
also be demonstrated to be commercially available for utility scale operations. The resources that
are found to be both technically and economically viable are then passed to the detailed analysis
process for further analysis.
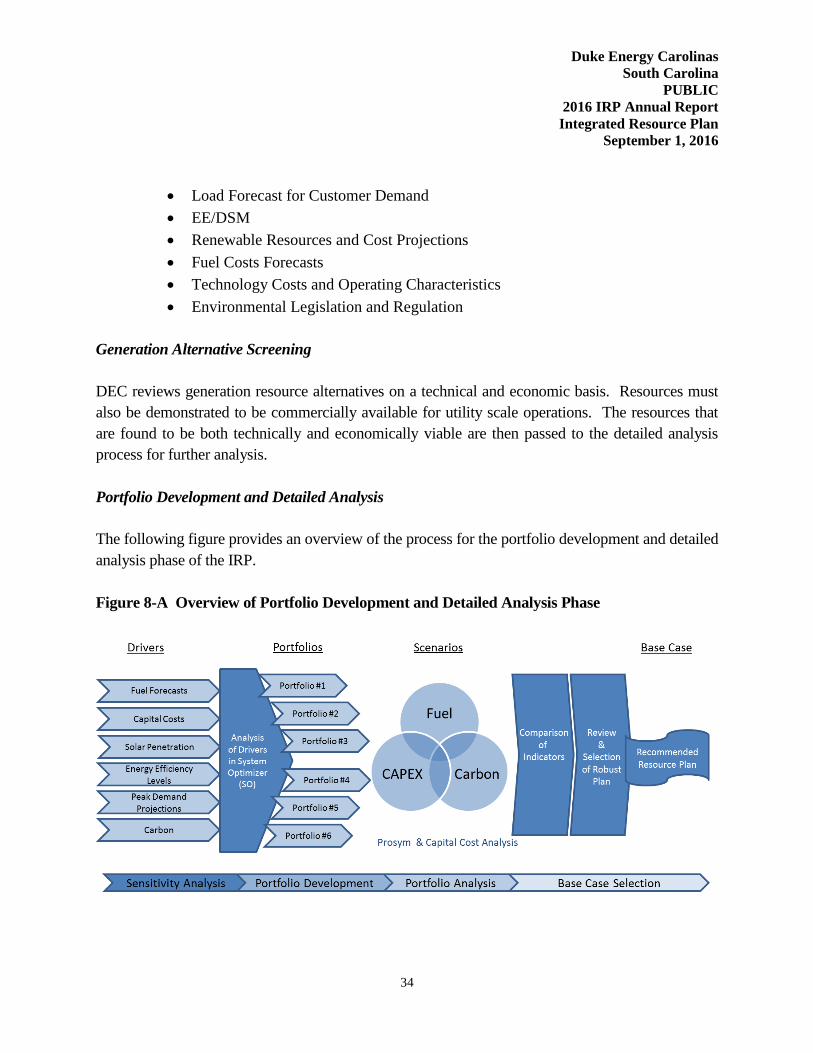
Portfolio Development and Detailed Analysis
The following figure provides an overview of the process for the portfolio development and detailed
analysis phase of the IRP.
Figure 8-A Overview of Portfolio Development and Detailed Analysis Phase

Duke Energy Carolinas
South Carolina
PUBLIC
2016 IRP Annual Report
Integrated Resource Plan
September 1, 2016
35
The Sensitivity Analysis and Portfolio Development phases rely upon the updated data inputs and
results of the generation alternative screening process to derive resource portfolios or resource
plans. The Sensitivity Analysis and Portfolio Development phases utilize an expansion planning
model to determine the best mix of capacity additions for the Company’s short- and long-term
resource needs with an objective of selecting a robust plan that minimizes the PVRR and is
environmentally sound complying with all State and Federal regulations.
Sensitivity analysis of input variables such as load forecast, fuel costs, renewable energy, EE, and
capital costs are considered as part of the quantitative analysis within the resource planning process.
Utilizing the results of these sensitivities, possible expansion plan options for the DEC system are
developed. These expansion plans are reviewed to determine if any overarching trends are present
across the plans, and based on this analysis, specific portfolios are developed to represent these
trends. Finally, the portfolios are analyzed using a capital cost model and an hourly production cost
model (PROSYM) under various fuel price, capital cost and carbon scenarios to evaluate the
robustness and economic value of each portfolio, and at this point, the Base Case portfolio is
selected.
In addition to evaluating these portfolios solely within the DEC system, the potential benefits of
sharing capacity within DEC and DEP are examined in a common Joint Planning Case. A detailed
discussion of these portfolios is provided in Appendix A.
Selected Portfolios
For the 2016 IRP, six representative portfolios were identified through the Sensitivity Analysis and
Portfolio Development steps. Four of the portfolios were developed under a Carbon Tax paradigm
where varying levels of an intrastate CO2 tax were applied to existing coal and gas units as
envisioned in EPA’s Clean Power Plan. Three of these portfolios included Lee Nuclear Plant in
2026 and 2028 and varied levels of EE and renewable penetration, while the fourth portfolio
replaced Lee Nuclear plant with mainly CC generation.
The remaining two portfolios were developed under a System CO2 Mass Cap that represented an
alternative outcome of the CPP. In these portfolios total system CO2 emissions were constrained
starting in 2022 and declined until 2030, and total system emission were held flat from 2030
throughout the remaining planning horizon.
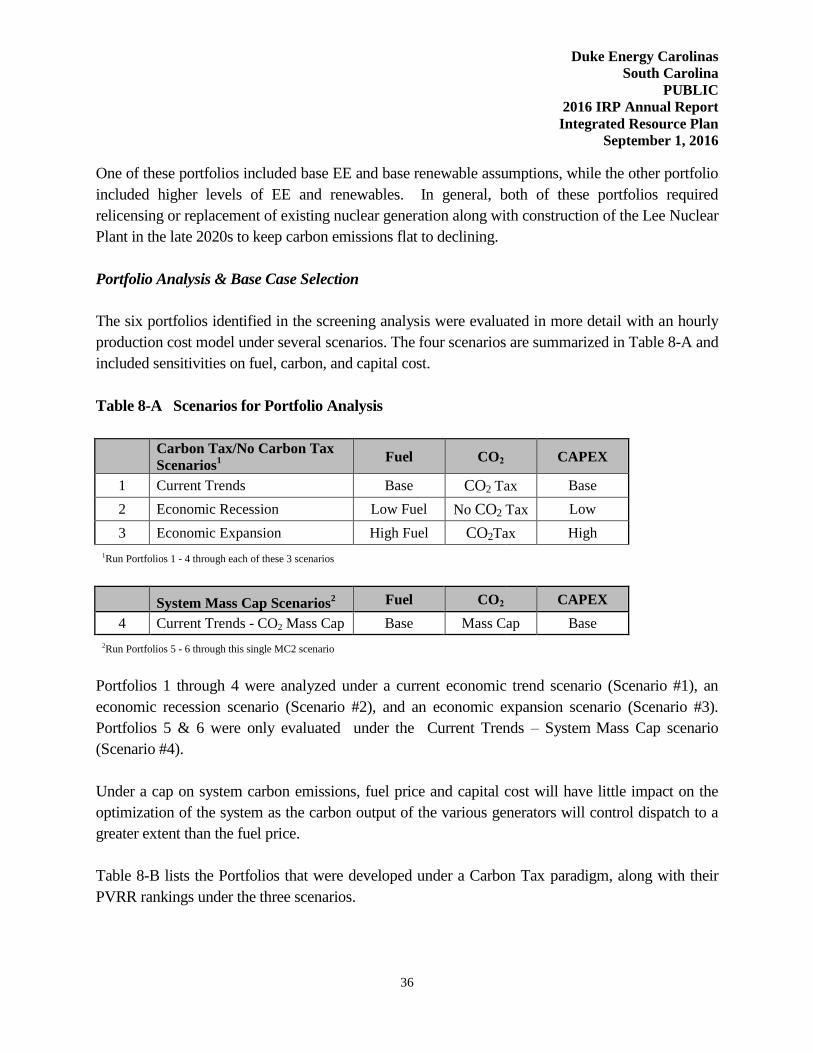
Duke Energy Carolinas
South Carolina
PUBLIC
2016 IRP Annual Report
Integrated Resource Plan
September 1, 2016
36
One of these portfolios included base EE and base renewable assumptions, while the other portfolio
included higher levels of EE and renewables. In general, both of these portfolios required
relicensing or replacement of existing nuclear generation along with construction of the Lee Nuclear
Plant in the late 2020s to keep carbon emissions flat to declining.
Portfolio Analysis & Base Case Selection
The six portfolios identified in the screening analysis were evaluated in more detail with an hourly
production cost model under several scenarios. The four scenarios are summarized in Table 8-A and
included sensitivities on fuel, carbon, and capital cost.
Table 8-A Scenarios for Portfolio Analysis
Carbon Tax/No Carbon Tax
Scenarios1
Fuel CO2 CAPEX
1 Current Trends Base CO2 Tax Base
2 Economic Recession Low Fuel No CO2 Tax Low
3 Economic Expansion High Fuel CO2Tax High
1Run Portfolios 1 - 4 through each of these 3 scenarios
System Mass Cap Scenarios
2 Fuel CO2 CAPEX
4 Current Trends - CO2 Mass Cap Base Mass Cap Base
2Run Portfolios 5 - 6 through this single MC2 scenario
Portfolios 1 through 4 were analyzed under a current economic trend scenario (Scenario #1), an
economic recession scenario (Scenario #2), and an economic expansion scenario (Scenario #3).
Portfolios 5 & 6 were only evaluated under the Current Trends – System Mass Cap scenario
(Scenario #4).
Under a cap on system carbon emissions, fuel price and capital cost will have little impact on the
optimization of the system as the carbon output of the various generators will control dispatch to a
greater extent than the fuel price.
Table 8-B lists the Portfolios that were developed under a Carbon Tax paradigm, along with their
PVRR rankings under the three scenarios.
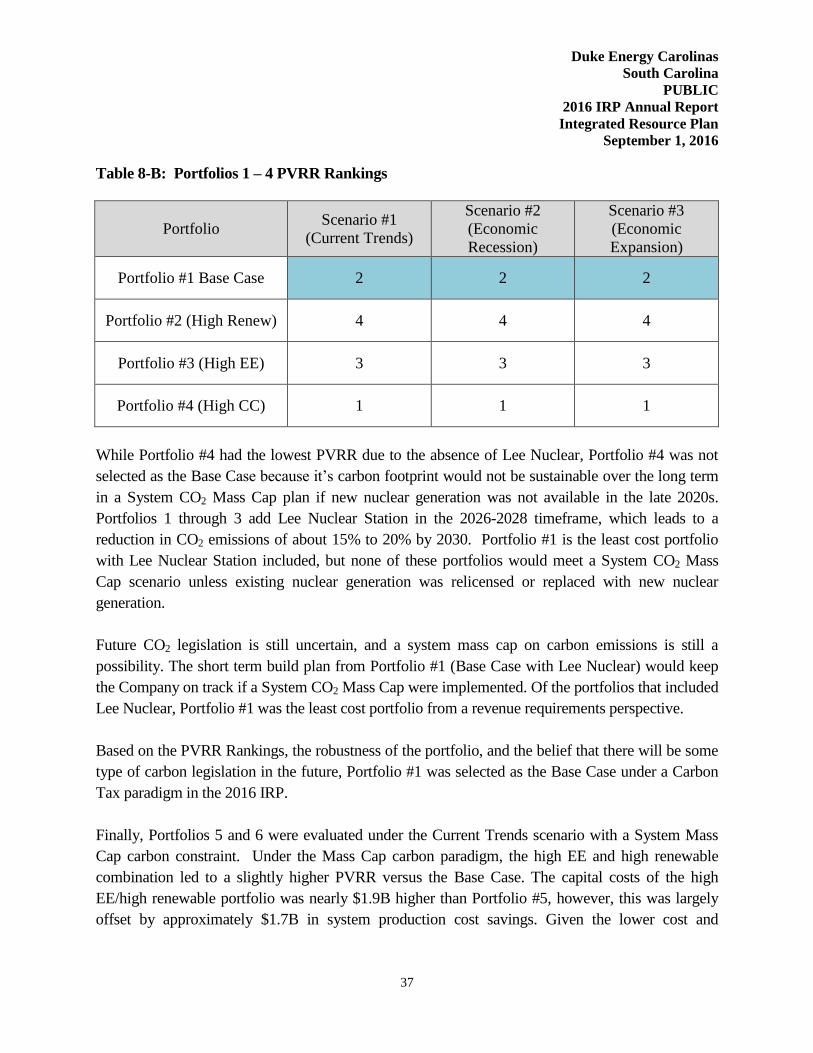
Duke Energy Carolinas
South Carolina
PUBLIC
2016 IRP Annual Report
Integrated Resource Plan
September 1, 2016
37
Table 8-B: Portfolios 1 – 4 PVRR Rankings
Portfolio Scenario #1
(Current Trends)
Scenario #2
(Economic
Recession)
Scenario #3
(Economic
Expansion)
Portfolio #1 Base Case 2 2 2
Portfolio #2 (High Renew) 4 4 4
Portfolio #3 (High EE) 3 3 3
Portfolio #4 (High CC) 1 1 1
While Portfolio #4 had the lowest PVRR due to the absence of Lee Nuclear, Portfolio #4 was not
selected as the Base Case because it’s carbon footprint would not be sustainable over the long term
in a System CO2 Mass Cap plan if new nuclear generation was not available in the late 2020s.
Portfolios 1 through 3 add Lee Nuclear Station in the 2026-2028 timeframe, which leads to a
reduction in CO2 emissions of about 15% to 20% by 2030. Portfolio #1 is the least cost portfolio
with Lee Nuclear Station included, but none of these portfolios would meet a System CO2 Mass
Cap scenario unless existing nuclear generation was relicensed or replaced with new nuclear
generation.
Future CO2 legislation is still uncertain, and a system mass cap on carbon emissions is still a
possibility. The short term build plan from Portfolio #1 (Base Case with Lee Nuclear) would keep
the Company on track if a System CO2 Mass Cap were implemented. Of the portfolios that included
Lee Nuclear, Portfolio #1 was the least cost portfolio from a revenue requirements perspective.
Based on the PVRR Rankings, the robustness of the portfolio, and the belief that there will be some
type of carbon legislation in the future, Portfolio #1 was selected as the Base Case under a Carbon
Tax paradigm in the 2016 IRP.
Finally, Portfolios 5 and 6 were evaluated under the Current Trends scenario with a System Mass
Cap carbon constraint. Under the Mass Cap carbon paradigm, the high EE and high renewable
combination led to a slightly higher PVRR versus the Base Case. The capital costs of the high
EE/high renewable portfolio was nearly $1.9B higher than Portfolio #5, however, this was largely
offset by approximately $1.7B in system production cost savings. Given the lower cost and
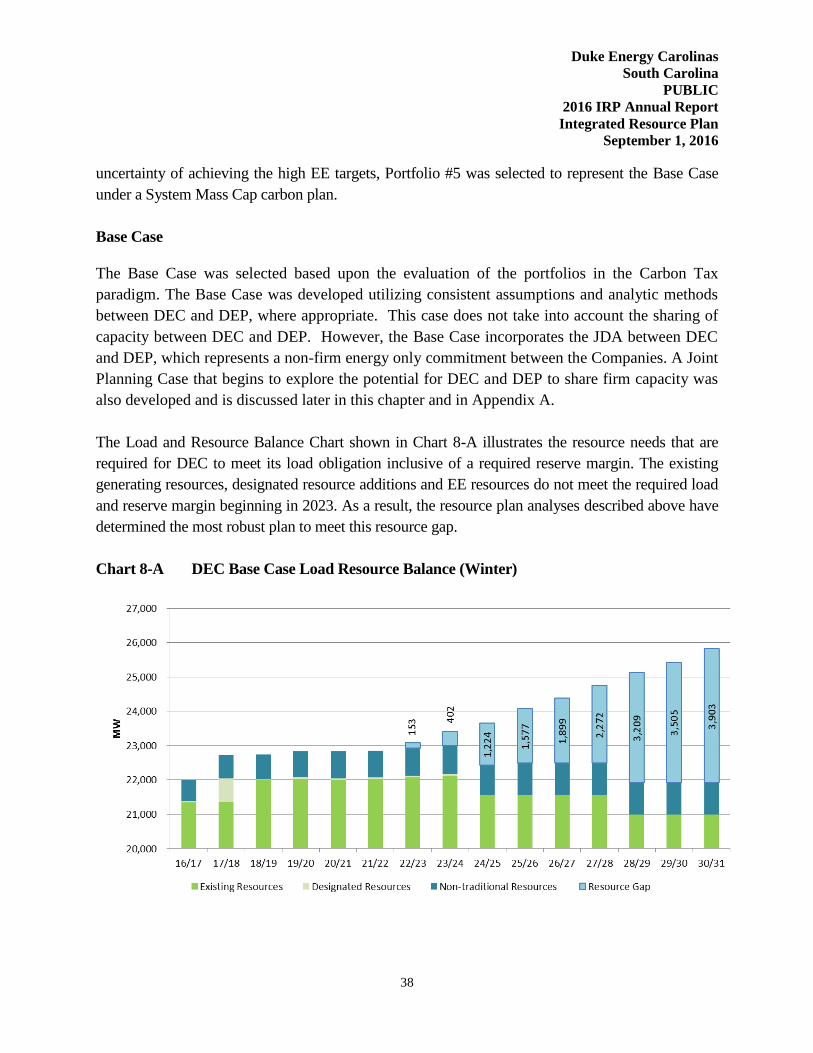
Duke Energy Carolinas
South Carolina
PUBLIC
2016 IRP Annual Report
Integrated Resource Plan
September 1, 2016
38
uncertainty of achieving the high EE targets, Portfolio #5 was selected to represent the Base Case
under a System Mass Cap carbon plan.
Base Case
The Base Case was selected based upon the evaluation of the portfolios in the Carbon Tax
paradigm. The Base Case was developed utilizing consistent assumptions and analytic methods
between DEC and DEP, where appropriate. This case does not take into account the sharing of
capacity between DEC and DEP. However, the Base Case incorporates the JDA between DEC
and DEP, which represents a non-firm energy only commitment between the Companies. A Joint
Planning Case that begins to explore the potential for DEC and DEP to share firm capacity was
also developed and is discussed later in this chapter and in Appendix A.
The Load and Resource Balance Chart shown in Chart 8-A illustrates the resource needs that are
required for DEC to meet its load obligation inclusive of a required reserve margin. The existing
generating resources, designated resource additions and EE resources do not meet the required load
and reserve margin beginning in 2023. As a result, the resource plan analyses described above have
determined the most robust plan to meet this resource gap.
Chart 8-A DEC Base Case Load Resource Balance (Winter)

Duke Energy Carolinas
South Carolina
PUBLIC
2016 IRP Annual Report
Integrated Resource Plan
September 1, 2016
39
Cumulative Resource Additions to Meet Winter Load Obligation and Reserve Margin (MW)
Tables 8-C and 8-D present the Load, Capacity and Reserves (LCR) tables for the Base Case
analysis that was completed for DEC’s 2016 IRP.
Year 16/17 17/18 18/19 19/20 20/21 21/22 22/23 23/24
Resource Need 0 0 0 0 0 0 153 402
Year 24/25 25/26 26/27 27/28 28/29 29/30 30/31
Resource Need 1,224 1,577 1,899 2,272 3,209 3,505 3,903

Duke Energy Carolinas
South Carolina
PUBLIC
2016 IRP Annual Report
Integrated Resource Plan
September 1, 2016
40
Table 8-C Load, Capacity and Reserves Table - Winter
16/17 17/18 18/19 19/20 20/21 21/22 22/23 23/24 24/25 25/26 26/27 27/28 28/29 29/30 30/31
Load Forecast
1 Duke System Peak 18,520 18,819 18,916 19,195 19,513 19,764 20,071 20,389 20,638 21,003 21,290 21,609 21,929 22,193 22,530
2 Firm Sale - - - - - - - - - - - - - - -
3 Cumulative New EE Programs (57) (107) (148) (191) (254) (298) (340) (379) (415) (433) (446) (447) (452) (459) (461)
4 Adjusted Duke System Peak 18,463 18,712 18,768 19,004 19,259 19,466 19,731 20,011 20,223 20,570 20,844 21,161 21,478 21,734 22,068
Existing and Designated Resources
5 Generating Capacity 21,132 21,141 21,824 21,834 21,900 21,946 21,993 22,039 22,085 21,481 21,481 21,481 21,481 20,924 20,924
6 Designated Additions / Uprates 25 683 10 66 46 46 46 46 - - - - - - -
7 Retirements / Derates (16) - - - - - - - (604) - - - (557) - -
8 Cumulative Generating Capacity 21,141 21,824 21,834 21,900 21,946 21,993 22,039 22,085 21,481 21,481 21,481 21,481 20,924 20,924 20,924
Purchase Contracts
9 Cumulative Purchase Contracts 251 261 232 231 141 118 119 120 121 122 117 118 105 106 107
Non-Compliance Renewable Purchases 33 34 38 39 39 40 40 40 40 40 34 34 34 34 34
Non-Renewables Purchases 217 227 195 192 101 79 79 80 81 82 83 84 71 72 73
Undesignated Future Resources
10 Nuclear 1,117 1,117
11 Combined Cycle 1,221
12 Combustion Turbine 468
Renewables
13 Cumulative Renewables Capacity 101 92 91 96 102 103 104 108 111 109 112 109 112 115 108
14 Combined Heat & Power - 43 22 22 22 - - - - - - - - - -
15 Cumulative Production Capacity 21,493 22,221 22,222 22,314 22,297 22,322 23,592 23,643 23,511 23,509 24,625 24,623 25,174 25,177 25,171
Demand Side Management (DSM)
16 Cumulative DSM Capacity 490 501 513 526 538 535 562 589 616 670 670 669 669 669 669
17 Cumulative Capacity w/ DSM 21,983 22,722 22,735 22,839 22,835 22,857 24,153 24,232 24,126 24,179 25,294 25,292 25,843 25,847 25,840
Reserves w/ DSM
18 Generating Reserves 3,520 4,010 3,967 3,836 3,577 3,391 4,422 4,221 3,903 3,609 4,450 4,131 4,365 4,113 3,772
19 % Reserve Margin 19% 21% 21% 20% 19% 17% 22% 21% 19% 18% 21% 20% 20% 19% 17%
Winter Projections of Load, Capacity, and Reserves
for Duke Energy Carolinas 2016 Annual Plan

Duke Energy Carolinas
South Carolina
PUBLIC
2016 IRP Annual Report
Integrated Resource Plan
September 1, 2016
41
Table 8-D Load, Capacity and Reserves Table – Summer
2017 2018 2019 2020 2021 2022 2023 2024 2025 2026 2027 2028 2029 2030 2031
Load Forecast
1 Duke System Peak 18,877 19,159 19,183 19,446 19,685 19,933 20,229 20,521 20,837 21,130 21,405 21,712 21,998 22,297 22,603
2 Firm Sale 0 0 0 0 0 0 0 0 0 0 0 0 0 0 0
3 Cumulative New EE Programs (102) (164) (220) (272) (323) (371) (425) (475) (516) (549) (564) (566) (572) (574) (575)
4 Adjusted Duke System Peak 18,776 18,995 18,963 19,174 19,362 19,562 19,804 20,046 20,321 20,581 20,842 21,146 21,427 21,723 22,028
Existing and Designated Resources
5 Generating Capacity 20,394 20,378 21,031 21,086 21,138 21,185 21,231 21,278 21,278 20,693 20,693 20,693 20,151 20,151 20,151
6 Designated Additions / Uprates 0 653 55 52 46 46 46 0 0 0 0 0 0 0 0
7 Retirements / Derates (16) 0 0 0 0 0 0 0 (585) 0 0 (542) 0 0 0
8 Cumulative Generating Capacity 20,378 21,031 21,086 21,138 21,185 21,231 21,278 21,278 20,693 20,693 20,693 20,151 20,151 20,151 20,151
Purchase Contracts
9 Cumulative Purchase Contracts 348 367 365 371 292 275 275 276 276 277 272 272 259 260 261
Non-Compliance Renewable Purchases 137 146 176 185 192 197 196 196 195 195 189 189 188 188 188
Non-Renewables Purchases 211 221 189 186 100 79 79 80 81 82 83 84 71 72 73
Undesignated Future Resources
10 Nuclear 1,117 1,117
11 Combined Cycle 1,123
12 Combustion Turbine 435
Renewables
13 Cumulative Renewables Capacity 299 353 398 460 530 578 621 659 694 722 753 777 804 830 843
14 Combined Heat & Power 0 40 20 20 20 0 0 0 0 0 0 0 0 0 0
15 Cumulative Production Capacity 21,025 21,791 21,909 22,049 22,107 22,184 23,397 23,435 23,321 23,349 24,492 25,092 25,106 25,132 25,147
Demand Side Management (DSM)
16 Cumulative DSM Capacity 1,057 1,090 1,119 1,148 1,156 1,154 1,181 1,208 1,235 1,289 1,290 1,290 1,290 1,290 1,290
17 Cumulative Capacity w/ DSM 22,082 22,880 23,028 23,197 23,263 23,339 24,578 24,644 24,556 24,639 25,782 26,381 26,396 26,422 26,436
Reserves w/ DSM
18 Generating Reserves 3,306 3,885 4,065 4,024 3,901 3,777 4,775 4,598 4,235 4,058 4,940 5,235 4,969 4,699 4,408
19 % Reserve Margin 18% 20% 21% 21% 20% 19% 24% 23% 21% 20% 24% 25% 23% 22% 20%
Summer Projections of Load, Capacity, and Reserves
for Duke Energy Carolinas 2016 Annual Plan
Duke Energy Carolinas
South Carolina
PUBLIC
2016 IRP Annual Report
Integrated Resource Plan
September 1, 2016
42
DEC - Assumptions of Load, Capacity, and Reserves Table
The following notes are numbered to match the line numbers on the Winter Projections of Load,
Capacity, and Reserves tables. All values are MW (winter ratings) except where shown as a
Percent.
1. Planning is done for the peak demand for the Duke Energy Carolinas System including
Nantahala.
A firm wholesale backstand agreement for 47 MW between Duke Energy Carolinas and
Piedmont Municipal Power Agency (PMPA) starts on 1/1/2014 and continues through the
end of 2020. This backstand is included in Line 1.
2. No additional firm sales are included.
3. Cumulative new energy efficiency and conservation programs (does not include demand
response programs).
4. Peak load adjusted for firm sales and cumulative energy efficiency.
5. Existing generating capacity reflecting designated additions, planned uprates, retirements
and derates as of January 1, 2016.
Includes 101 MW Nantahala hydro capacity, and total capacity for Catawba Nuclear Station
less 832 MW to account for North Carolina Municipal Power Agency #1 (NCMPA1) firm
capacity sale.
6. Capacity Additions include:
Includes runner upgrades on each of the four Bad Creek pumped storage units. Each
upgrade is expected to be 46.4 MW and are projected in the 2021 – 2024 timeframe. One
unit will be upgraded per year.
Lee Combined Cycle is reflected in 2018 (683 MW). This is the DEC capacity net of 100
MW to be owned by NCEMC.
Capacity Additions include Duke Energy Carolinas hydro units scheduled to be repaired and
returned to service. The units are returned to service in the 2017-2020 timeframe and total
16 MW.
Also included is a 85 MW capacity increase due to nuclear uprates at Catawba and Oconee.
Timing of these uprates is shown from 2017-2020.
Duke Energy Carolinas
South Carolina
PUBLIC
2016 IRP Annual Report
Integrated Resource Plan
September 1, 2016
43
DEC - Assumptions of Load, Capacity, and Reserves Table (cont.)
7. A planning assumption for coal retirements has been included in the 2016 IRP.
Allen Steam Station Units 1-3 (604 MW) are assumed to retire in December 2024.
Allen Steam Station Units 4-5 (557 MW) are assumed to retire in June 2028.
Nuclear Stations are assumed to retire at the end of their current license extension. However,
no nuclear facilities have license expiries in the 15 year study period.
The Hydro facilities for which Duke has submitted an application to Federal Energy
Regulatory Commission (FERC) for license renewal are assumed to continue operation
through the planning horizon.
All retirement dates are subject to review on an ongoing basis. Dates used in the 2016 IRP
are for planning purposes only.
8. Sum of lines 5 through 7.
9. Cumulative Purchase Contracts including purchased capacity from PURPA Qualifying
Facilities, an 86 MW Cherokee County Cogeneration Partners contract which began in June
1998 and expires June 2020 and miscellaneous other QF projects.
Additional line items are shown under the total line item to show the amounts of renewable
and traditional QF purchases.
Renewable resources in these line items are not used for NC REPS compliance.
10. New nuclear resources selected to meet load and minimum planning reserve margin.
Capacity must be on-line by June 1 to be included in available capacity for the summer peak
of that year and by December 1 to be included in available capacity for the winter peak of
the next year.
Addition of 1,117 MW Lee Nuclear Unit additions assumed in November 2026 and May
2028.
11. New combined cycle resources economically selected to meet load and minimum planning
reserve margin.

Duke Energy Carolinas
South Carolina
PUBLIC
2016 IRP Annual Report
Integrated Resource Plan
September 1, 2016
44
DEC - Assumptions of Load, Capacity, and Reserves Table (cont.)
Capacity must be on-line by June 1 to be included in available capacity for the summer peak
of that year and by December 1 to be included in available capacity for the winter peak of
the next year.
Addition of 1,221 MW of combined cycle capacity online December 2022.
12. New combustion turbine resources economically selected to meet load and minimum
planning reserve margin.
Capacity must be on-line by June 1 to be included in available capacity for the summer peak
of that year and by December 1 to be included in available capacity for the winter peak of
the next year.
Addition of 468 MW of combustion turbine capacity online December 2024.
13. Resources to comply with NC REPS along with solar customer product offerings such as
Green Source and SC DER were input as existing resources. Solar resources reflect 5%
of nameplate capacity contribution at the time of winter peak demand and 46% of
nameplate capacity contribution at the time of summer peak demand.
14. New 21.7 MW (winter) combined heat and power units included in 2018 (2x), 2019, 2020
and 2021. The 2016 IRP represents increased CHP resources as compared to the 2015 IRP.
15. Sum of lines 8 through 14.
16. Cumulative Demand Response programs including load control and DSDR.
17. Sum of lines 15 and 16.
18. The difference between lines 17 and 4.
19. Reserve Margin = (Cumulative Capacity-System Peak Demand)/System Peak Demand.
Line 18 divided by Line 4.
Minimum winter target planning reserve margin is 17%.
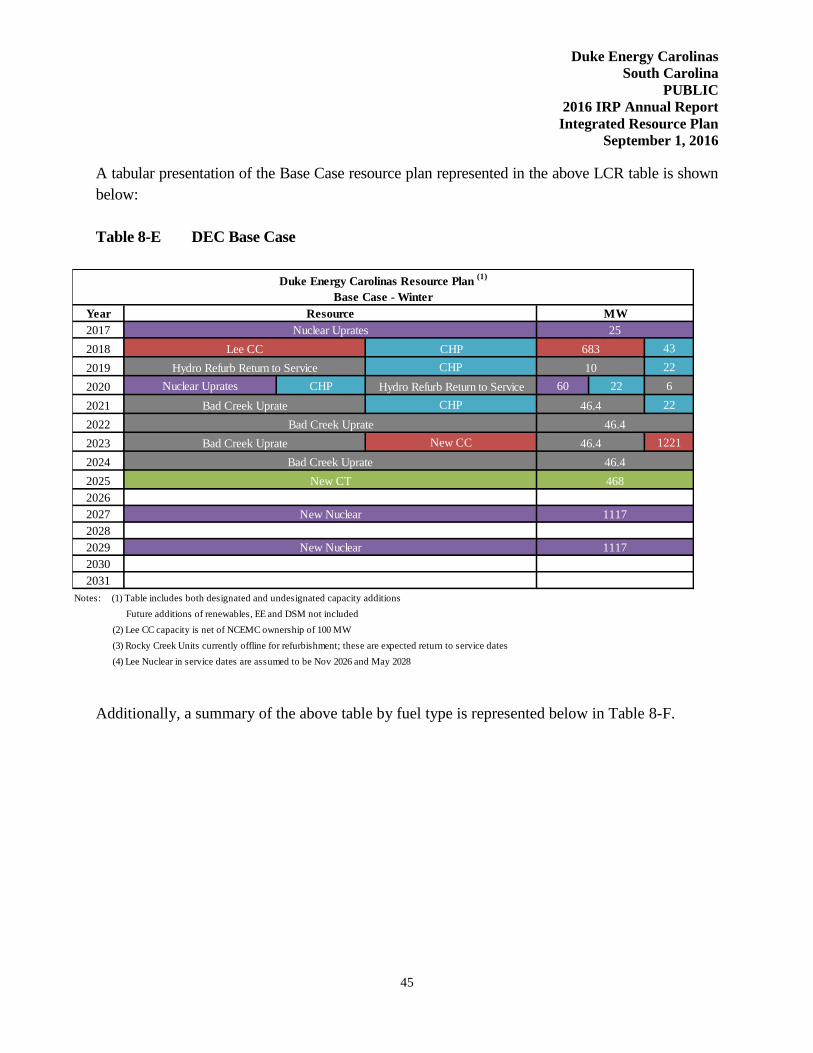
Duke Energy Carolinas
South Carolina
PUBLIC
2016 IRP Annual Report
Integrated Resource Plan
September 1, 2016
45
A tabular presentation of the Base Case resource plan represented in the above LCR table is shown
below:
Table 8-E DEC Base Case
Additionally, a summary of the above table by fuel type is represented below in Table 8-F.
Year
2017
2018 CHP 43
2019 CHP 22
2020 Nuclear Uprates CHP Hydro Refurb Return to Service 60 22 6
2021 CHP 22
2022
2023 New CC 1221
2024
2025
2026
2027
2028
2029
2030
2031
Notes: (1) Table includes both designated and undesignated capacity additions
Future additions of renewables, EE and DSM not included
(2) Lee CC capacity is net of NCEMC ownership of 100 MW
(3) Rocky Creek Units currently offline for refurbishment; these are expected return to service dates
(4) Lee Nuclear in service dates are assumed to be Nov 2026 and May 2028
Bad Creek Uprate
Bad Creek Uprate
New Nuclear
New Nuclear
1117
Duke Energy Carolinas Resource Plan (1)
Base Case - Winter
Resource MW
Nuclear Uprates 25
1117
683
Hydro Refurb Return to Service 10
Bad Creek Uprate 46.4
46.4
Lee CC
Bad Creek Uprate
46.4
46.4
468New CT
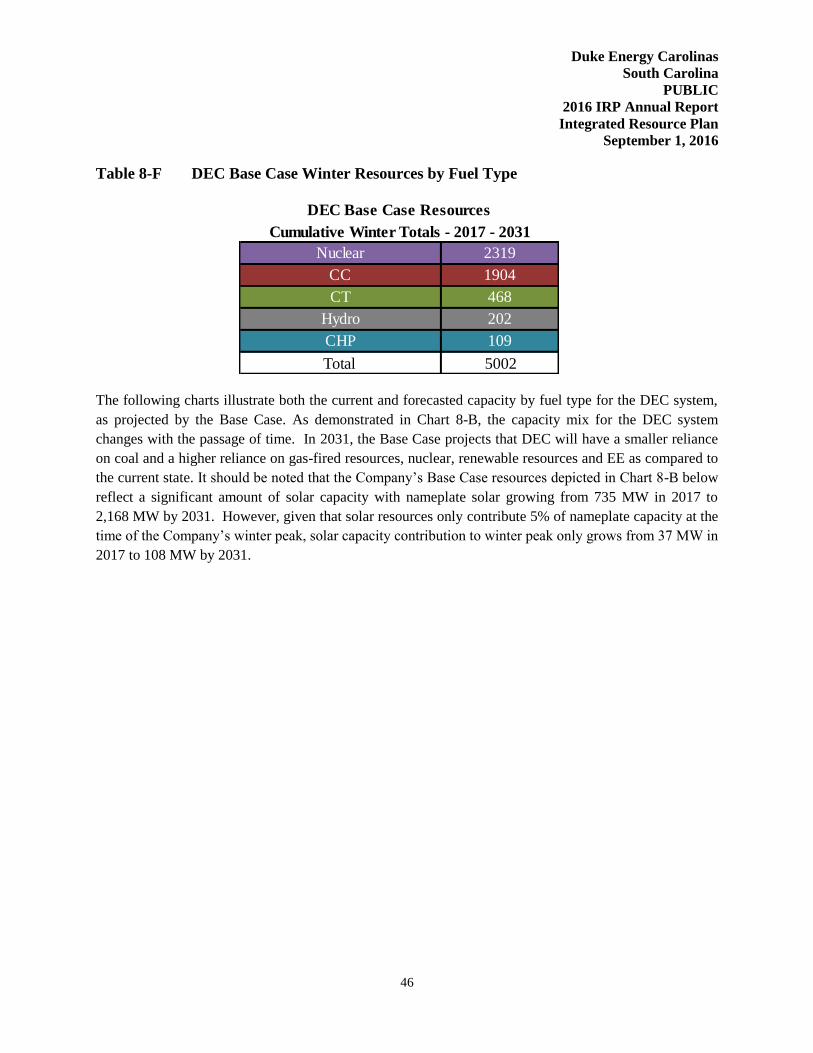
Duke Energy Carolinas
South Carolina
PUBLIC
2016 IRP Annual Report
Integrated Resource Plan
September 1, 2016
46
Table 8-F DEC Base Case Winter Resources by Fuel Type
The following charts illustrate both the current and forecasted capacity by fuel type for the DEC system,
as projected by the Base Case. As demonstrated in Chart 8-B, the capacity mix for the DEC system
changes with the passage of time. In 2031, the Base Case projects that DEC will have a smaller reliance
on coal and a higher reliance on gas-fired resources, nuclear, renewable resources and EE as compared to
the current state. It should be noted that the Company’s Base Case resources depicted in Chart 8-B below
reflect a significant amount of solar capacity with nameplate solar growing from 735 MW in 2017 to
2,168 MW by 2031. However, given that solar resources only contribute 5% of nameplate capacity at the
time of the Company’s winter peak, solar capacity contribution to winter peak only grows from 37 MW in
2017 to 108 MW by 2031.
Nuclear 2319
CC 1904
CT 468
Hydro 202
CHP 109
Total 5002
Cumulative Winter Totals - 2017 - 2031
DEC Base Case Resources
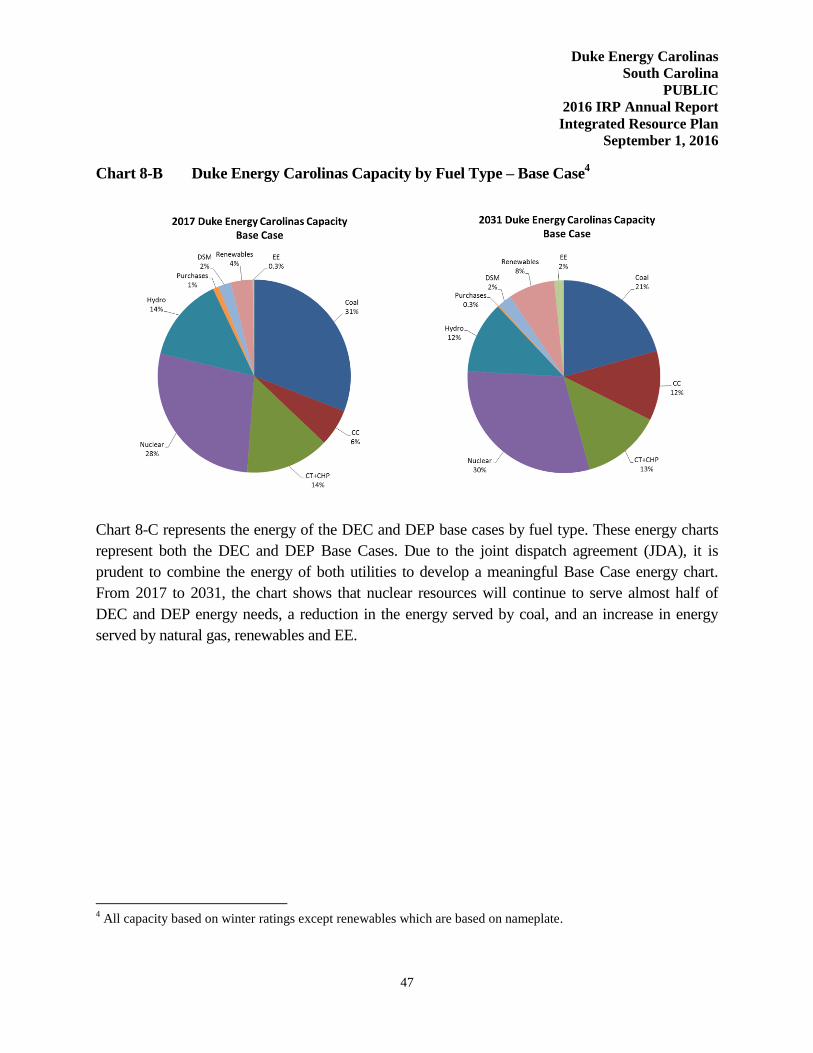
Duke Energy Carolinas
South Carolina
PUBLIC
2016 IRP Annual Report
Integrated Resource Plan
September 1, 2016
47
Chart 8-B Duke Energy Carolinas Capacity by Fuel Type – Base Case4
Chart 8-C represents the energy of the DEC and DEP base cases by fuel type. These energy charts
represent both the DEC and DEP Base Cases. Due to the joint dispatch agreement (JDA), it is
prudent to combine the energy of both utilities to develop a meaningful Base Case energy chart.
From 2017 to 2031, the chart shows that nuclear resources will continue to serve almost half of
DEC and DEP energy needs, a reduction in the energy served by coal, and an increase in energy
served by natural gas, renewables and EE.
4 All capacity based on winter ratings except renewables which are based on nameplate.
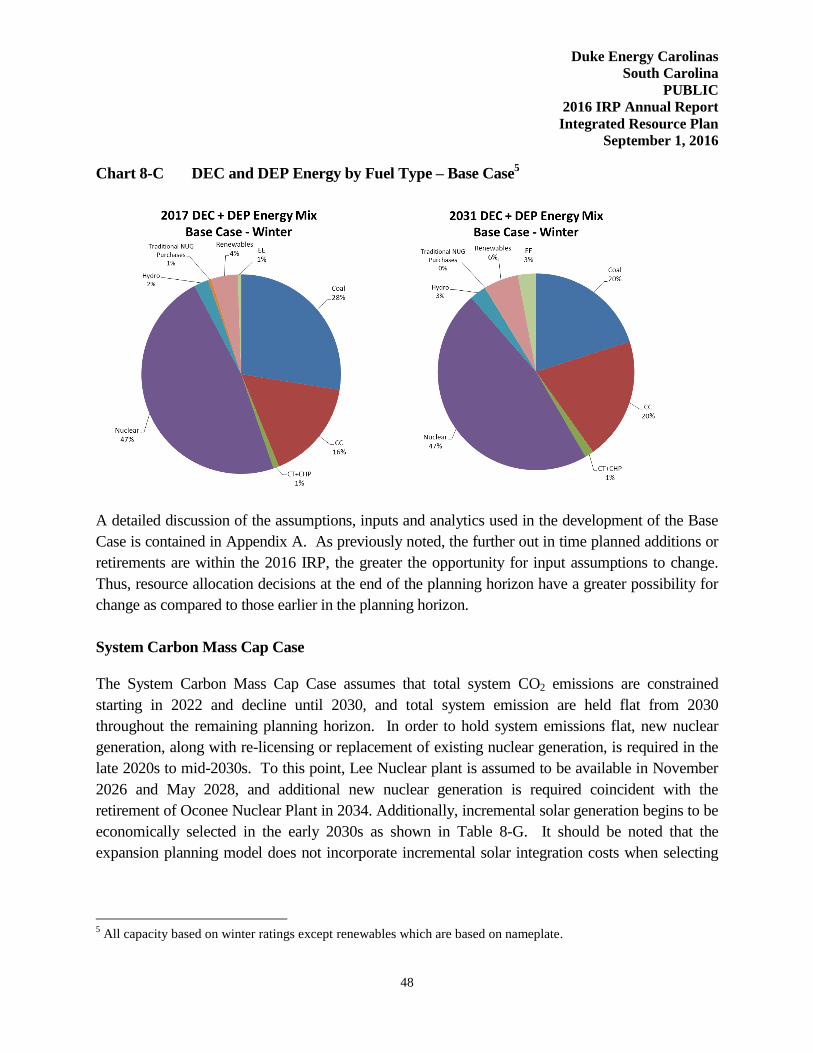
Duke Energy Carolinas
South Carolina
PUBLIC
2016 IRP Annual Report
Integrated Resource Plan
September 1, 2016
48
Chart 8-C DEC and DEP Energy by Fuel Type – Base Case5
A detailed discussion of the assumptions, inputs and analytics used in the development of the Base
Case is contained in Appendix A. As previously noted, the further out in time planned additions or
retirements are within the 2016 IRP, the greater the opportunity for input assumptions to change.
Thus, resource allocation decisions at the end of the planning horizon have a greater possibility for
change as compared to those earlier in the planning horizon.
System Carbon Mass Cap Case
The System Carbon Mass Cap Case assumes that total system CO2 emissions are constrained
starting in 2022 and decline until 2030, and total system emission are held flat from 2030
throughout the remaining planning horizon. In order to hold system emissions flat, new nuclear
generation, along with re-licensing or replacement of existing nuclear generation, is required in the
late 2020s to mid-2030s. To this point, Lee Nuclear plant is assumed to be available in November
2026 and May 2028, and additional new nuclear generation is required coincident with the
retirement of Oconee Nuclear Plant in 2034. Additionally, incremental solar generation begins to be
economically selected in the early 2030s as shown in Table 8-G. It should be noted that the
expansion planning model does not incorporate incremental solar integration costs when selecting
5 All capacity based on winter ratings except renewables which are based on nameplate.
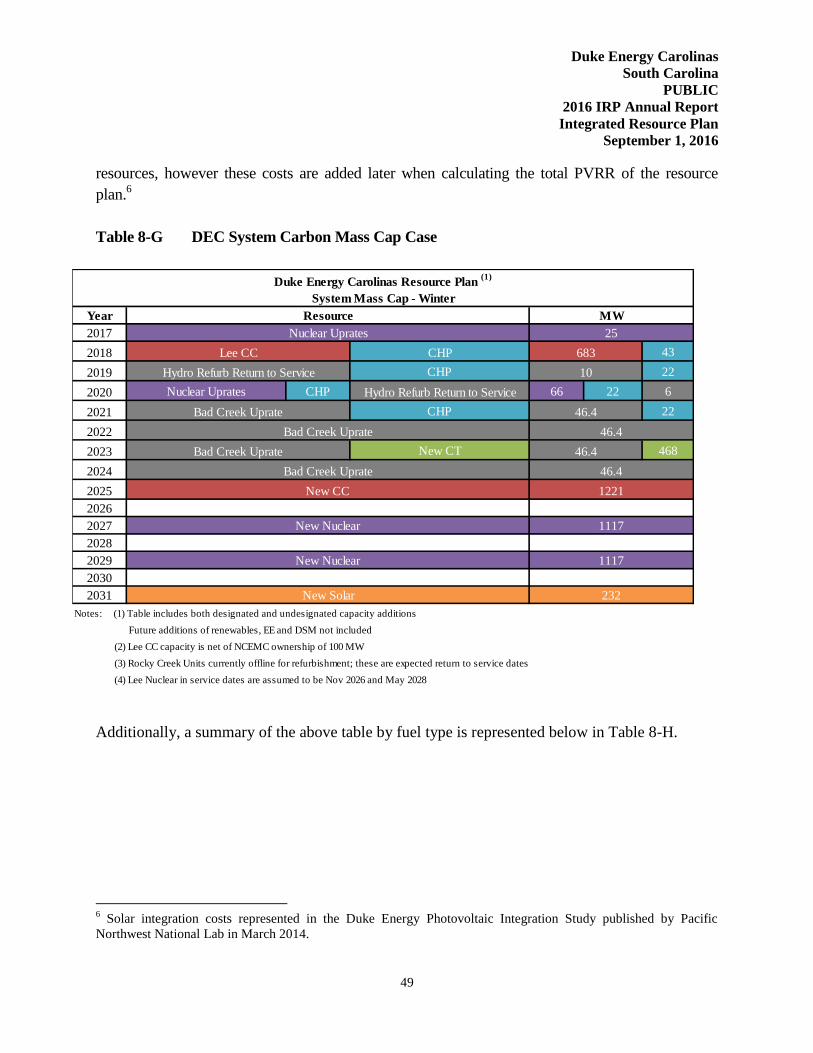
Duke Energy Carolinas
South Carolina
PUBLIC
2016 IRP Annual Report
Integrated Resource Plan
September 1, 2016
49
resources, however these costs are added later when calculating the total PVRR of the resource
plan.6
Table 8-G DEC System Carbon Mass Cap Case
Additionally, a summary of the above table by fuel type is represented below in Table 8-H.
6 Solar integration costs represented in the Duke Energy Photovoltaic Integration Study published by Pacific
Northwest National Lab in March 2014.
Year
2017
2018 CHP 43
2019 CHP 22
2020 Nuclear Uprates CHP Hydro Refurb Return to Service 66 22 6
2021 CHP 22
2022
2023 New CT 468
2024
2025
2026
2027
2028
2029
2030
2031
Notes: (1) Table includes both designated and undesignated capacity additions
Future additions of renewables, EE and DSM not included
(2) Lee CC capacity is net of NCEMC ownership of 100 MW
(3) Rocky Creek Units currently offline for refurbishment; these are expected return to service dates
(4) Lee Nuclear in service dates are assumed to be Nov 2026 and May 2028
Duke Energy Carolinas Resource Plan (1)
System Mass Cap - Winter
Resource MW
Nuclear Uprates 25
Lee CC 683
Hydro Refurb Return to Service 10
Bad Creek Uprate 46.4
Bad Creek Uprate 46.4
Bad Creek Uprate 46.4
New Nuclear 1117
Bad Creek Uprate 46.4
New CC 1221
New Nuclear 1117
New Solar 232

Duke Energy Carolinas
South Carolina
PUBLIC
2016 IRP Annual Report
Integrated Resource Plan
September 1, 2016
50
Table 8-H DEC System Carbon Mass Cap Case Winter Resources by Fuel Type
A detailed discussion of the assumptions, inputs and analytics used in the development of the
System Mass Cap Case is contained in Appendix A. As previously noted, the further out in time
planned additions or retirements are within the 2016 IRP, the greater the opportunity for input
assumptions to change. Thus, resource allocation decisions at the end of the planning horizon have
a greater possibility for change as compared to those earlier in the planning horizon.
Joint Planning Case
A Joint Planning Case that begins to explore the potential for DEC and DEP to share firm
capacity between the Companies was also developed. The focus of this case is to illustrate the
potential for the Utilities to collectively defer generation investment by utilizing each other’s
capacity when available and by jointly owning or purchasing new capacity additions. This case
does not address the specific implementation methods or issues required to implement shared
capacity. Rather, this case illustrates the benefits of joint planning between DEC and DEP with
the understanding that the actual execution of capacity sharing would require separate regulatory
proceedings and approvals.
Table 8-I below represents the annual non-renewable incremental additions reflected in the
combined DEC and DEP winter Base Cases as compared to the Joint Planning Case. The plan
contains the undesignated additions for DEC and DEP over the planning horizon. As presented in
Table 8-I, the Joint Planning Case allows for the delay of several blocks of CT resources through
the 15-year study period.
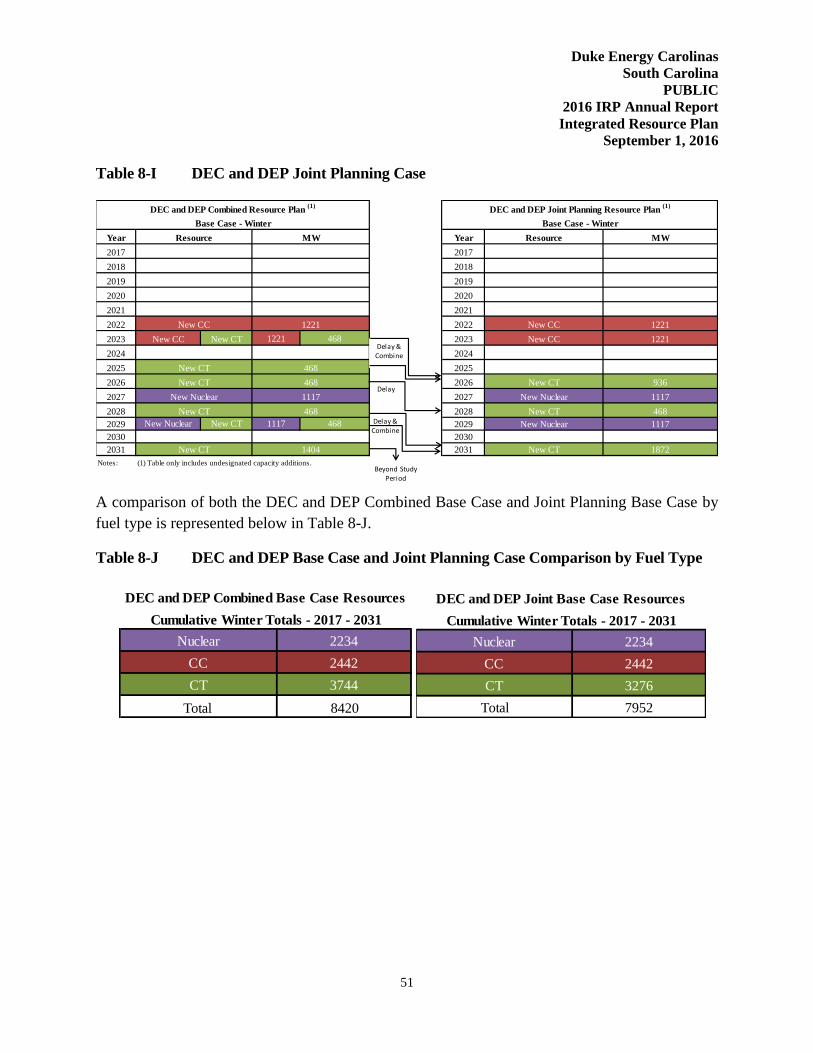
Duke Energy Carolinas
South Carolina
PUBLIC
2016 IRP Annual Report
Integrated Resource Plan
September 1, 2016
51
Table 8-I DEC and DEP Joint Planning Case
A comparison of both the DEC and DEP Combined Base Case and Joint Planning Base Case by
fuel type is represented below in Table 8-J.
Table 8-J DEC and DEP Base Case and Joint Planning Case Comparison by Fuel Type
Year Year
2017 2017
2018 2018
2019 2019
2020 2020
2021 2021
2022 2022
2023 New CC New CT 1221 468 2023
2024 2024
2025 2025
2026 2026
2027 2027
2028 2028
2029 New Nuclear New CT 1117 468 2029
2030 2030
2031 2031
Notes: (1) Table only includes undesignated capacity additions.
DEC and DEP Joint Planning Resource Plan (1)
MW
New Nuclear
New CT
New CC
Base Case - Winter
Resource
1872
1221
1221New CC
DEC and DEP Combined Resource Plan (1)
Base Case - Winter
Resource MW
New CT 468
1221New CC
New CT 1404
New Nuclear
New CT
New CT 468
1117
New CT 468
936
1117
468
New CT
New Nuclear 1117
Beyond Study Period
Delay
Delay & Combine
Delay & Combine
Nuclear 2234
CC 2442
CT 3744
Total 8420
DEC and DEP Combined Base Case Resources
Cumulative Winter Totals - 2017 - 2031
Nuclear 2234
CC 2442
CT 3276
Total 7952
DEC and DEP Joint Base Case Resources
Cumulative Winter Totals - 2017 - 2031
Duke Energy Carolinas
South Carolina
PUBLIC
2016 IRP Annual Report
Integrated Resource Plan
September 1, 2016
52
9. SHORT-TERM ACTION PLAN
The Company’s Short-Term Action Plan, which identifies accomplishments in the past year and
actions to be taken over the next five years, is summarized below:
Continued Planning to Include Consideration of Winter Reserve Margins
As the Company looks forward, the planning focus will include consideration of winter peak
demand based upon resource adequacy study results. As additional summer-oriented resources such
as solar are added to both the DEC and DEP systems, it will be important to maintain a focus on the
impacts of these resources to the winter peak and the operational requirements of the system.
Continued Reliance on EE and DSM Resources
The Company is committed to continuing to grow the amount of EE and DSM resources utilized to
meet customer growth. The following are the ways in which DEC will increase these resources:
Continue to execute the Company’s EE and DSM plan, which includes a diverse portfolio
of EE and DSM programs spanning the residential, commercial, and industrial classes.
Continue on-going collaborative work to develop and implement additional cost-effective
EE and DSM products and services.
Continue to seek enhancements to the Company’s EE/DSM portfolio by: (1) adding new
or expanding existing programs to include additional measures, (2) program
modifications to account for changing market conditions and new measurement and
verification (M&V) results and (3) other EE research & development pilots.
Continue to seek additional DSM programs that will specifically benefit during winter
peak situations.
Continued Focus on Renewable Energy Resources
DEC is committed to full compliance with NC REPS in North Carolina and is actively exploring
incremental renewable resource additions contemplated under the recently passed South Carolina
legislation. Due to Federal and State subsidies for solar developers, the Company is experiencing a
substantial increase in solar QFs in the interconnection queue. With this level of interest in solar
development, DEC continues to procure renewable purchase power resources, when economically
Duke Energy Carolinas
South Carolina
PUBLIC
2016 IRP Annual Report
Integrated Resource Plan
September 1, 2016
53
viable, as part of its Compliance Plan. DEC is also pursuing the addition of new utility-owned solar
on the DEC system.
In 2015, DEC received approval for SC DER which includes a portfolio of initiatives designed to
increase the capacity of renewable generation located in South Carolina’s service area. The program
contains three tiers; each is equivalent to 1% of the Company’s estimated average South Carolina
retail peak demand (or 40 MW of nameplate solar capacity). The first tier of SC DER is comprised
of a combination of utility scale PPAs and ~1 MW shared solar facilities. The second tier of SC
DER is met via behind-the-meter net rooftop solar for residential, commercial, and industrial
customers. Since tier 2 is behind the meter, the expected solar generation is embedded in the load
forecast as a reduction to expected load. Upon completion of tiers 1 and 2 (to occur no later than
2021), the legislation calls for the utility to directly invest in additional solar generation to complete
tier 3 which DEC contemplates doing in 2019.
DEC continues to evaluate market options for renewable generation and procure capacity, as
appropriate. PPAs have been signed with developers of solar PV, landfill gas and wind resources.
Also, REC purchase agreements have been executed for purchases of unbundled RECs from wind,
solar PV, solar thermal and hydroelectric facilities. Additionally, shared solar programs and utility-
owned solar continue to be considered.
Continue to Find Opportunities to Enhance Existing Clean Resources
DEC is committed to continually looking for opportunities to improve and enhance its existing
resources. DEC has committed to the replacement of the runners on each of its four Bad Creek
pumped storage units. Each replacement is expected to gain approximately 46 MW of capacity. The
first replacement is projected to be in 2020, available for the 2021 winter peak. The remaining units
will be replaced at the rate of one per year for availability in the winter peaks from 2022 – 2024.
Continue to Pursue New Nuclear
As part of the 2016 IRP, new nuclear resources continue to be supported in the resource plan in the
2024 to 2030 timeframe, depending on the scenario. Given the time it takes to receive a Combined
Construction and Operating License from the Nuclear Regulatory Commission (NRC) and the
significant reduction in lead time and risk to build a new nuclear facility with a COL in hand, Duke
Energy views the receipt of a COL as a valuable asset for its customers.
Duke Energy Carolinas
South Carolina
PUBLIC
2016 IRP Annual Report
Integrated Resource Plan
September 1, 2016
54
DEC remains on course to obtain the COL for the Lee Nuclear facility in 2016. The following is a
summary of the activities relative to the COL for the Lee Nuclear facility. There are three primary
milestones that a project must complete to receive a COL: Final Environmental Impact Statement
(FEIS), Final Safety Evaluation Report (FSER), and a Mandatory Hearing. On Dec. 23, 2013, the
NRC issued the FEIS for Lee Nuclear, and on Jan. 2, 2014, the South Carolina Department of
Health and Environmental Control (SC DHEC) issued the final Water Quality Certification. With
the National Pollutant Discharge Elimination System (NPDES)7 permit, which was issued in July
2013, all of the major, required environmental permits and certifications required for the COL have
been received. The NRC issued the FSER on August 1, 2016 and the Mandatory Hearing for the
Lee COL is scheduled for October 5, 2016. Receipt of the Lee COL is expected by December
2016. The schedule for receipt of the Lee COL supports the earliest projected need date for Lee Unit
1 in 2024 and Unit 2 in 2026.
Addition of Clean Natural Gas Resources
Continue construction of the Lee combined cycle plant at the Lee Steam Station site
located in Anderson, SC. As demonstrated in recent IRP plans, a capacity need was
identified in 2017/2018 to allow DEC to meet its customers’ load demands. After
evaluating multiple bids in an RFP to address the 2017/2018 capacity need, the Company
determined the most economical alternative to meet the need was to construct a new
natural gas combined cycle facility at the Lee Steam Station site in Anderson County SC.
The Company received a Certificate of Environmental Compatibility and Public
Convenience and Necessity (CECPCN) in an order dated May 2, 2014, to move forward
with the construction of the Lee CC.
Lee Steam Station Unit 3 was converted from coal to clean-burning natural gas fuel in
2015.
Continued Focus on Environmental Compliance and Wholesale
Retire older coal generation. As of April 2015, approximately 1,700 MW
(winter/summer) of older coal generation has been retired and replaced with clean-
burning natural gas, renewable energy resources or energy efficiency. The final older, un-
7 The Section 402 NPDES permit and the Section 401 Water Quality Certification are part of the Clean Water Act.
Duke Energy Carolinas
South Carolina
PUBLIC
2016 IRP Annual Report
Integrated Resource Plan
September 1, 2016
55
scrubbed coal units at Lee Steam Station were retired in November 2014. Currently,
Duke Energy Carolinas has no remaining older, un-scrubbed coal units in operation.8
Continue to investigate the future environmental control requirements and resulting
operational impacts associated with existing and potential environmental regulations such
as EPA’s Clean Power Plan (Section 111d of Clean Air Act regulating CO2 from existing
power plants), Mercury Air Toxics Standard (MATS), the Coal Combustion Residuals
(CCR) rule, the Cross-State Air Pollution Rule (CSAPR), and the new ozone National
Ambient Air Quality Standard (NAAQS).
Continue to pursue existing and potential opportunities for wholesale power sales
agreements within the Duke Energy balancing authority area.
Continue to monitor energy-related statutory and regulatory activities.
Continue to examine the benefits of joint capacity planning and pursue appropriate
regulatory actions.
A summarization of the capacity resource changes for the Base Case in the 2016 IRP is shown in
Table 9-A below. Capacity retirements and additions are presented as incremental values in the
year in which the change impacts the winter peak. The values shown for renewable resources,
EE and DSM represent cumulative totals.
8 The ultimate timing of unit retirements can be influenced by factors changing the economics of continued unit
operations. Such factors include changes in relative fuel prices, operations and maintenance costs and the costs
associated with compliance of evolving environmental regulations. As such, unit retirement schedules are expected
change over time as market conditions change.

Duke Energy Carolinas
South Carolina
PUBLIC
2016 IRP Annual Report
Integrated Resource Plan
September 1, 2016
56
Table 9-A DEC Short-Term Action Plan
Year Retirements Additions Solar (2)
Biomass/Hydro EE DSM (3)
2017 25 MW Nuc 483 77 57 490
2018 683 MW Lee CC(4)
635 60 107 501
2019 10 MW Hydro Refurb(5)
751 53 148 513
2020
60 MW Nuc
6 MW Hydro Refurb(5)
887 52 191 526
2021 46 MW Bad Creek 1044 50 254 538
Notes:
(1) Capacities are shown in winter ratings unless otherwise noted.
(2) Capacity is shown in nameplate ratings. For planning purposes, solar presents a 5% contribution to peak.
(3) Includes impacts of grid modernization.
(4) 683 MW is net of NCEMC portion of Lee CC
(5) Rocky Creek is currently offline for refurbishment. Hydro Refurb MW in table represent expected return to service date.
Compliance Renewable Resources
(Cumulative Nameplate MW)
Duke Energy Carolinas Short-Term Action Plan (1)

Duke Energy Carolinas
South Carolina
PUBLIC
2016 IRP Annual Report
Integrated Resource Plan
September 1, 2016
57
DEC Request for Proposal (RFP) Activity
Supply-Side
No supply-side RFPs have been issued since the filing of DEC’s 2015 IRP.
Renewable Energy
Duke Energy Distributed Energy Resource Solar RFP – South Carolina
A Shared Solar Program RFP was released on August 20, 2015, to solicit for up to 5 MWAC
(4 MWAC in DEC/1 MWAC in DEP) of solar PV facilities that would provide power and associated
energy certificates within the DEC and DEP service territories in the state of South Carolina.
Executed contracts in response to this RFP will be utilized to comply with the Duke Energy’s
“Shared Solar Program” under the South Carolina Distributed Energy Resource Program Act.
The RFP’s interest was in solar PPAs and turnkey asset purchase proposals with a nameplate
capacity sized > 250 kilowatts (kWAC) but no greater than 1 MWAC. Proposals must be directly
connected to the DEC or DEP transmission or distribution system in South Carolina. Projects must
be in-service and capable of delivering fully rated output by December 31, 2016. PPA contract
durations shall be a 10 year term.
Respondents were notified, February 22, 2016 of their proposal status and if they had been selected
as a proposal of interest.
Proposals of interest were allowed to refresh bid pricing following the completion of DEC/DEP
estimated interconnection costs. Proposals of interest are currently in varying stages of negotiations
and contract execution.
Duke Energy Carolinas – General Compliance RFP
Under this RFP, DEC will be soliciting proposals to procure renewable resources to meet the
general compliance under the North Carolina Renewable Energy and Energy Efficiency Portfolio
Standard (REPS) while expanding DECs emission free, diversified distributed generation portfolio.
This RFP will seek up to 750,000 megawatt-hours (MWh) of energy and associated renewable
energy certificates for projects that will achieve commercial operation within the 2017/2018
timeframe. Proposal structures allowed must be in the form of Purchased Power Agreements or
Engineering, Procurement & Construction/Turnkey projects. All projects must be located in DEC’s

Duke Energy Carolinas
South Carolina
PUBLIC
2016 IRP Annual Report
Integrated Resource Plan
September 1, 2016
58
retail service territory in the state of North Carolina. There will be a preference for operational
projects or projects in late stage of development.
59
Appendices

60
APPENDICES TABLE OF CONTENTS:
SECTION: PAGE:
APPENDIX A: QUANTITATIVE ANALYSIS ................................................................... 61
APPENDIX B: DUKE ENERGY CAROLINAS OWNED GENERATION ............................ 80
APPENDIX C: ELECTRIC LOAD FORECAST ...................................................................... 92
APPENDIX D: ENERGY EFFICIENCY AND DEMAND SIDE MANAGEMENT ............ 104
APPENDIX E: FUEL SUPPLY ............................................................................................... 130
APPENDIX F: SCREENING OF GENERATION ALTERNATIVES ................................... 135
APPENDIX G: ENVIRONMENTAL COMPLIANCE ........................................................... 148
APPENDIX H: NON-UTILITY GENERATION AND WHOLESALE ................................. 157
APPENDIX I: TRANSMISSION PLANNED OR UNDER CONSTRUCTION .................... 161
APPENDIX J: CROSS-REFERENCE OF IRP REQUIREMENTS AND .............................. 164
SUBSEQUENT ORDERS
Duke Energy Carolinas
South Carolina
PUBLIC
2016 IRP Annual Report
Integrated Resource Plan
September 1, 2016
61
APPENDIX A: QUANTITATIVE ANALYSIS
This appendix provides an overview of the Company’s quantitative analysis of the resource options
available to meet customers’ future energy needs. Sensitivities on major inputs resulted in multiple
portfolios that were then evaluated under several scenarios that varied fuel prices, capital costs, and
CO2 constraints. These portfolios were analyzed using a least cost analysis to determine the Base
Case for the 2016 IRP. The selection of this plan takes into account the cost to customers, resource
diversity and reliability and the long-term carbon intensity of the system.
The future resource needs were optimized for DEC and DEP independently. However, an additional
case representative of jointly planning future capacity on a DEC/DEP combined system basis using
the Base Case assumptions was also analyzed to demonstrate potential customer savings, if this
option was available in the future. Resource capacities discussed in this appendix reflect winter
ratings and new resource additions are assumed online in January of the year indicated unless
otherwise noted.
A. Overview of Analytical Process
The analytical process consists of four steps:
1. Assess resource needs
2. Identify and screen resource options for further consideration
3. Develop portfolio configurations
4. Perform portfolio analysis over various scenarios
1. Assess Resource Needs
The required load and generation resource balance needed to meet future customer demands was
assessed as outlined below:
Customer peak demand and energy load forecast – identified future customer aggregate
demands to determine system peak demands and developed the corresponding energy
load shape. Post-2020 consideration was also given to increased energy prices associated
with a carbon constrained future.
Existing supply-side resources – summarized each existing generation resource’s
operating characteristics including unit capability, potential operational constraints and
life expectancy.
Duke Energy Carolinas
South Carolina
PUBLIC
2016 IRP Annual Report
Integrated Resource Plan
September 1, 2016
62
Operating parameters – determined operational requirements including target planning
reserve margins and other regulatory considerations.
Customer load growth, the expiration of purchased power contracts and additional asset retirements
result in significant resource needs to meet energy and peak demands in the future. The following
assumptions impacted the 2016 resource plan:
Peak Demand and Energy Growth - The growth in winter customer peak demand including
the impacts of energy efficiency averaged 1.3% from 2017 through 2031. The forecasted
compound annual growth rate for energy consumption is 1.0% after the impacts of energy
efficiency programs are included.
Generation
o Completion of the 683 MW Lee CC in November of 2017
o Runner upgrades totaling 185 MW between 2020 and 2024 at Bad Creek
Pumped-Storage Generating Station
o Expected nuclear up-rates of 85 MW by 2020
Retirements - Retirement of 604 MW at Allen Steam Station (Units 1 – 3) in December
2024 and the remaining 557 MW at Allen Steam Station in June 2028 (Units 4 and 5)
Reserve Margin - A 17% minimum winter planning reserve margin for the planning horizon
2. Identify and Screen Resource Options for Further Consideration
The IRP process evaluated EE, DSM and traditional and non-traditional supply-side options to
meet customer energy and capacity needs. The Company developed EE and DSM projections
based on existing EE/DSM program experience, the most recent market potential study, input
from its EE/DSM collaborative and cost-effectiveness screening for use in the IRP. Supply-side
options reflect a diverse mix of technologies and fuel sources (gas, nuclear and renewable).
Supply-side options are initially screened based on the following attributes:
Technical feasibility and commercial availability in the marketplace
Compliance with all Federal and State requirements
Long-run reliability
Reasonableness of cost parameters
The Company compared the capacity size options and operational capabilities of each technology,
with the most cost-effective options of each being selected for inclusion in the portfolio analysis

Duke Energy Carolinas
South Carolina
PUBLIC
2016 IRP Annual Report
Integrated Resource Plan
September 1, 2016
63
phase. An overview of resources screened on technical basis and a levelized economic basis is
discussed in Appendix F.
Resource Options
Supply-Side
Based on the results of the screening analysis, the following technologies were included in the
quantitative analysis as potential supply-side resource options to meet future capacity needs (winter
ratings):
Baseload – 2 x 1,117 MW Nuclear units (AP1000)
Baseload – 1,221 MW – 2 x 1 Advanced Combined Cycle (Duct Fired)
Baseload – 22 MW – Combined heat and power
Peaking/Intermediate – 468 MW – 2 x 7FA.05 CTs
o (Based upon the cost to construct 4 units, available for brownfield sites only)
Peaking/Intermediate – 936 MW – 4 x 7FA.05 CTs
Renewable – 5 MW – Solar PV
Energy Efficiency and Demand-Side Management
EE and DSM programs continue to be an important part of Duke Energy Carolinas’ system mix.
The Company considered both EE and DSM programs in the IRP analysis. As described in
Appendix D, EE and DSM measures are compared to generation alternatives to identify
cost-effective EE and DSM programs.
The Base Case EE/DSM savings contained in this IRP were projected by blending near-term
program planning forecasts into the long-term achievable potential projections from the market
potential study
3. Develop Portfolio Configurations
Once the load and generation balance was assessed, and resource options were screened, the
portfolios and scenarios were developed, and the preferred Base Cases were selected, based on
the following simplified diagram.
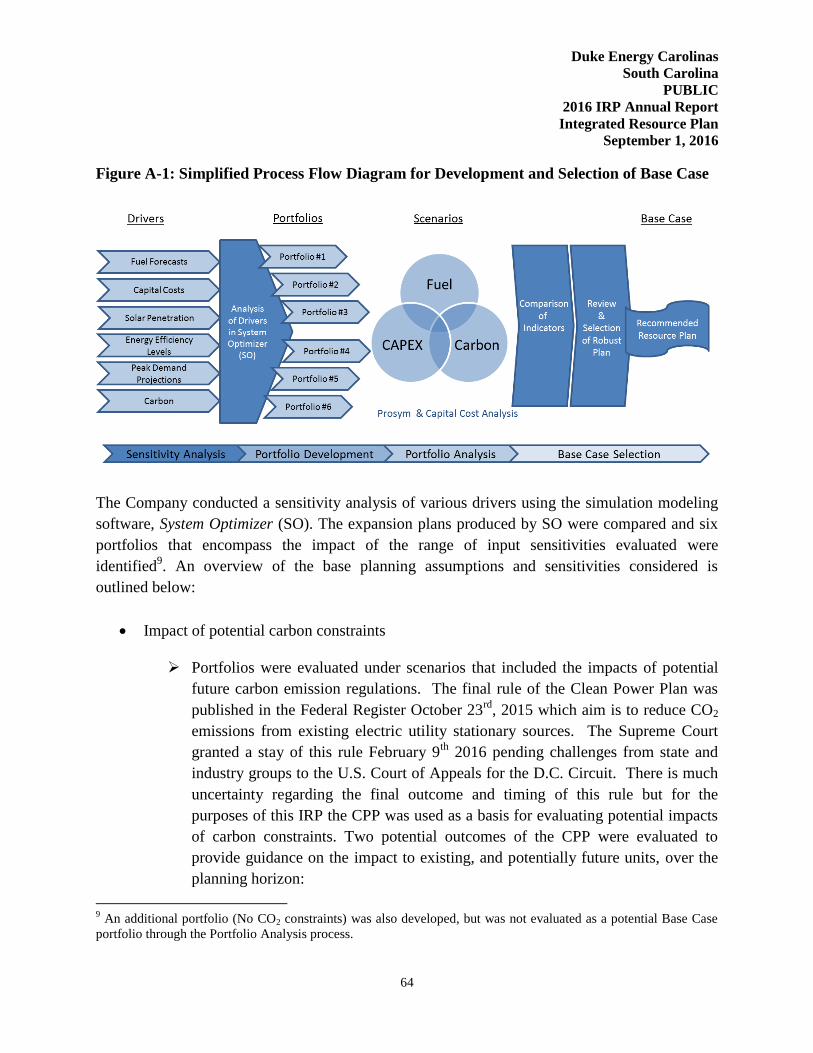
Duke Energy Carolinas
South Carolina
PUBLIC
2016 IRP Annual Report
Integrated Resource Plan
September 1, 2016
64
Figure A-1: Simplified Process Flow Diagram for Development and Selection of Base Case
The Company conducted a sensitivity analysis of various drivers using the simulation modeling
software, System Optimizer (SO). The expansion plans produced by SO were compared and six
portfolios that encompass the impact of the range of input sensitivities evaluated were
identified9. An overview of the base planning assumptions and sensitivities considered is
outlined below:
Impact of potential carbon constraints
Portfolios were evaluated under scenarios that included the impacts of potential
future carbon emission regulations. The final rule of the Clean Power Plan was
published in the Federal Register October 23rd
, 2015 which aim is to reduce CO2
emissions from existing electric utility stationary sources. The Supreme Court
granted a stay of this rule February 9th
2016 pending challenges from state and
industry groups to the U.S. Court of Appeals for the D.C. Circuit. There is much
uncertainty regarding the final outcome and timing of this rule but for the
purposes of this IRP the CPP was used as a basis for evaluating potential impacts
of carbon constraints. Two potential outcomes of the CPP were evaluated to
provide guidance on the impact to existing, and potentially future units, over the
planning horizon:
9 An additional portfolio (No CO2 constraints) was also developed, but was not evaluated as a potential Base Case
portfolio through the Portfolio Analysis process.

Duke Energy Carolinas
South Carolina
PUBLIC
2016 IRP Annual Report
Integrated Resource Plan
September 1, 2016
65
Carbon Constraint #1: Carbon Tax – Incorporated an intrastate CO2 tax
starting in 2022 that was applied to existing coal and gas units.
Carbon Constraint #2: System Mass Cap – An alternate means of
compliance for CPP in which total system CO2 emissions were constrained
starting in 2022 and declined until 2030. Total system emission were held
flat from 2030 throughout the planning horizon.
Retirements
Coal assets – For the purpose of this IRP, the depreciation book life was used as a
placeholder for future retirement dates for coal assets, unless otherwise noted.
Based on this assumption, Allen Steam Station Units 4 and 5 were retired in 2028.
Allen Steam Station Units 1-3 were retired in 2024 based on the New Source
Review (NSR) consent decree announced in September 2015.
Nuclear assets – Oconee Nuclear Station’s current operating license has been
extended to 60 years and expires in 2033. To date, no nuclear units in the United
States have received a license extension beyond 60 years. For the purpose of this
IRP, the Oconee Station is assumed to be retired in 2033.
A sensitivity was performed assuming an additional 20 year license
renewal of existing nuclear units at the end of the current license life of 60
years.
Coal and natural gas fuel prices
Short-term pricing: Natural gas prices were based on market observations from
2017 through 2026 transitioning to fundamental prices by 2032. Coal prices were
based on market observations from 2017 through 2021 transitioning to
fundamental prices by 2027.
Long-term pricing: Based on the Company’s fundamental fuel price projections.
Sensitivities - A high fuel sensitivity was performed where the average
Compound Annual Growth Rate (CAGR) for coal and gas was increased
by 0.5% through 2035 and a low fuel sensitivity where the average CAGR
for coal and gas was decreased by 1% CAGR through 2035.

Duke Energy Carolinas
South Carolina
PUBLIC
2016 IRP Annual Report
Integrated Resource Plan
September 1, 2016
66
Capital Costs
All Assets (Nuclear, CC/CT, Renewables)
High Capital – Increased the inflation rate from 2.5% to 4%.
Low Capital – Decreased the inflation rate from 2.5% to 1%.
Renewables Only: Solar facility costs continue to decrease through 2020 with a
30% Federal ITC through 2019, 26% ITC in 2020, 22% ITC in 2021 and 10%
ITC thereafter.
Low Cost - To determine if a lower cost would impacted the economic
selection of additional solar resources, a capital cost sensitivity was
performed where solar prices continue to decrease through 2025 with the
same ITC assumptions as in the Base Case.
Renewable Penetration
Base Penetration - Resources to comply with NC REPS along with solar
customer product offerings such as Green Source and SC DER were input as
existing resources. As described in Chapter 5, qualified facilities that the
Company is required to purchase under PURPA and who do not sell renewable
energy certificates to the Company are captured as non-compliance renewable
purchases in the IRP as well. Below is an overview of the solar base planning
assumptions and the sensitivities performed:
Higher Solar Penetration – To assess the impact if additional, non-
compliance solar resources were installed on the system beyond the Base
Case. The amount of base solar was increased by 789 MW by 2031.
Low Solar Penetration – To assess the potential impact of lower solar
penetration levels due to lower fuel prices for more traditional generation
technologies, higher solar installation and interconnection costs, lower
avoided costs, and/or less favorable PURPA terms. The amount of base
solar was decreased by 235 MW by 2031.
Under the System CO2 Mass Cap paradigm, additional economic solar
was allowed to be selected up to 10% of the total system energy.
Duke Energy Carolinas
South Carolina
PUBLIC
2016 IRP Annual Report
Integrated Resource Plan
September 1, 2016
67
Incremental solar integration costs were added as a capital cost based on
total solar added to the system after economic selection in SO.10
Energy Efficiency
Base EE corresponds to the Company’s current projections for achievable cost-
effective EE program acceptance.
High EE – The high case EE/DSM savings included in the IRP modeling
assumed a 50% increase in participation for the majority of the Base Case
programs as further explained in Appendix C. By 2031, this accounts for
an additional 262 MW reduction in total winter load.
Nuclear Selection – Three different options were evaluated with regards to the selection
of nuclear.
Carbon Tax - Lee Nuclear Station was assumed to be operational in November
2026 for Unit 1 and May 2028 for Unit 2. The model allowed additional nuclear
units to be economically selected through 2061.
A sensitivity was performed without Lee Nuclear fixed in the plan.
System Mass Cap - Lee Nuclear Station was assumed to be operational in
November 2026 for Unit 1 and May 2028 for Unit 2. The model allowed
additional nuclear units to be economically selected through 2061.
A sensitivity was performed assuming a combination of higher penetration
of solar (High Solar Penetration as described above) and a higher
penetration of EE (High EE as described above). The purpose of the
sensitivity was to determine the impact on additional economically
selected nuclear generation after Lee Nuclear.
No CO2 regulations – Lee Nuclear Station was assumed to be operational in
November 2026 for Unit 1 and May 2028 for Unit 2.
A sensitivity was performed without Lee Nuclear fixed in the plan.
10
Solar integration costs represented in the Duke Energy Photovoltaic Integration Study published by Pacific
Northwest National Lab in March 2014.
Duke Energy Carolinas
South Carolina
PUBLIC
2016 IRP Annual Report
Integrated Resource Plan
September 1, 2016
68
High and Low Load – Sensitivities were performed assuming changes in load of +6.5%
starting in 2021 for High Load and – 6.5% for Low Load on average through 2031.
A sensitivity was performed assuming joint planning with DEC and DEP to demonstrate
the benefits of shared resources and how new generation could be delayed.
Results
A review of the results from the sensitivity analysis yielded some common themes.
Initial Resource Needs
The first two resource needs after the Lee CC Station with base EE and renewable
assumptions are in 2023 and 2025. In the Carbon Tax paradigm, CC generation was selected
optimally in 2023 and CT generation was selected in 2025. The CC continued to be selected
in 2023 in the high fuel, high load, high capital, high EE and high renewable sensitivities.
However in the low fuel and low capital sensitivities, CT generation was selected in 2023
and the CC generation was selected in 2025. Only in the load low and no CO2 sensitivities
was CC generation not selected in the 2023 to 2025 timeframe.
One Balancing Authority - The first resource needs are CCs, one in DEP in 2022
and one in DEC in 2023. When planning as One Balancing Authority the DEC
and DEP CCs are not delayed but the 2023 CT need in DEP and the 2025 CT
need in DEC are delayed until 2026.
New Nuclear Selection – The Carbon Tax only applies to existing coal and gas generation
and new nuclear does not have a carbon advantage over new CC generation. Without a
carbon advantage new nuclear is not economically selected, however system carbon
emissions continue to increase into the future. Lee Nuclear Station was input in November
2026 and May 2028 to provide an option for base load carbon free generation in the 2030
timeframe in the event of more stringent carbon regulation or in the event license extensions
are not granted to existing nuclear generation. This is evident in the System Mass Cap
constrained cases where Lee Nuclear and additional generic nuclear is needed in the 2032
timeframe to maintain flat CO2 emissions after 2030. In the sensitivity with the inclusion of
higher EE and higher renewables the additional generic nuclear is still needed in that
timeframe.
Renewable Generation – In the cases developed under a Carbon Tax paradigm, no additional
solar generation in excess of the base assumptions was selected. This was due in part to the

Duke Energy Carolinas
South Carolina
PUBLIC
2016 IRP Annual Report
Integrated Resource Plan
September 1, 2016
69
significant level of solar already in the Base Case resource plan which reduces the value of
incremental solar on the system. In the low cost solar sensitivity, where prices continued to
decrease until 2026, additional economic solar was selected in several years beyond the study
period. In the System Mass Cap paradigm additional economic solar was selected beginning
in the early 2030s until 10% of the total energy was met with solar generation.
High Renewables - A sensitivity was performed using the High Renewables case in the
Carbon Tax paradigm. The inclusion of the increased implementation cost associated
with high renewables resulted in a higher revenue requirement than the base expansion
plan.
High EE – A sensitivity was performed using the High EE case in the Carbon Tax paradigm.
Within the 15 year planning horizon the only change to the expansion plan was a delay in the
2025 CT need to 2026. The inclusion of the increased implementation cost associated with
the high EE resulted in a higher revenue requirement than the base expansion plan.
High EE and Renewables – In the System Mass Cap paradigm a sensitivity was performed
with a combination of High EE and Renewables to test the impact on new nuclear generation.
Lee Nuclear was still needed by 2030 and additional generic nuclear generation was still
required in the early to mid-2030’s. The increased EE and Renewables did reduce the
number of CCs required over the planning horizon.
Gas Firing Technology Options – In general, the first need was shown best met with CC
generation, followed by CT generation through 2030. If Lee Nuclear Station is delayed
additional CC generation would be selected in the 2025 timeframe.
Portfolio Development
Using insights gleaned from the sensitivity analysis, six portfolios were developed. These
portfolios were developed in order to assess the relative value of various generating
technologies including CCs, CTs, Renewables, and Nuclear, as well as, EE under multiple
scenarios. Portfolios 1 – 4 were developed under a Carbon Tax paradigm where varying
levels of an intrastate CO2 tax were applied to existing coal and gas units as envisioned in
EPA’s CPP. Portfolios 5 and 6 were developed under a System CO2 Mass Cap that
represented an alternative outcome of the CPP. It should be noted that Portfolios 1 – 4 would
not meet a CO2 system mass cap. A description of the six portfolios follows:
Duke Energy Carolinas
South Carolina
PUBLIC
2016 IRP Annual Report
Integrated Resource Plan
September 1, 2016
70
Portfolio 1 (Base Case)
This portfolio represents the majority of expansions plans identified through the SO analysis.
While CCs are the preferred initial generating option in both DEP and DEC, CTs make up
the majority of additional resources added over the 15 year planning horizon. This portfolio
also includes Lee Nuclear in November 2026 and May 2028, along with base EE and
renewable assumptions.
Portfolio 2 (High Renewables, Lee Nuclear, Base EE)
This portfolio includes high renewables capacity through the planning period. In DEC, the
high renewables assumption has the effect of delaying the first CT need by one year in the 15
year planning horizon. Beyond the 15 year horizon, additional CTs are delayed by one to two
years with increased renewable capacity. This portfolio also includes Lee Nuclear in
November 2026 and May 2028, along with base EE assumptions.
Portfolio 3 (High EE, Lee Nuclear, Base Renewables)
This portfolio includes high EE targets through the planning period. Similar to Portfolio #2,
the high EE assumption has the effect of delaying the first CT need by one year in the 15
year planning horizon. Beyond the 15 year horizon, additional CTs are delayed by one to two
years with increased EE targets. This portfolio also includes Lee Nuclear in November 2026
and May 2028, along with base renewable assumptions.
Portfolio 4 (CC Centric, No Lee Nuclear, Base EE/Renewables)
This portfolio replaces Lee Nuclear with two CCs; the first in November 2026 and the
second in May 2028. This portfolio includes base renewable and base EE assumptions.
Portfolio 5 (System Mass Cap – Lee Nuclear + Additional nuclear generation, Base
EE/Renewables)
This portfolio was developed under a System Mass Cap carbon constraint. This expansion
plan is similar to Portfolio #1 through 2031, however from 2031 to 2040, one new nuclear
plant replaces Oconee in DEC and one new nuclear plant is also required in DEP.
Additionally, CT resources are replaced with CC resources in order to meet the carbon
constraint. This portfolio includes base renewable and base EE assumptions plus additional
economically selected solar in the 2030s.
Portfolio 6 (System Mass Cap – Lee Nuclear + Additional nuclear generation, High
EE/Renewables)
Similar to Portfolio #5, this portfolio was developed under a System Mass Cap carbon
constraint. This portfolio includes both high EE targets and high renewables assumptions.
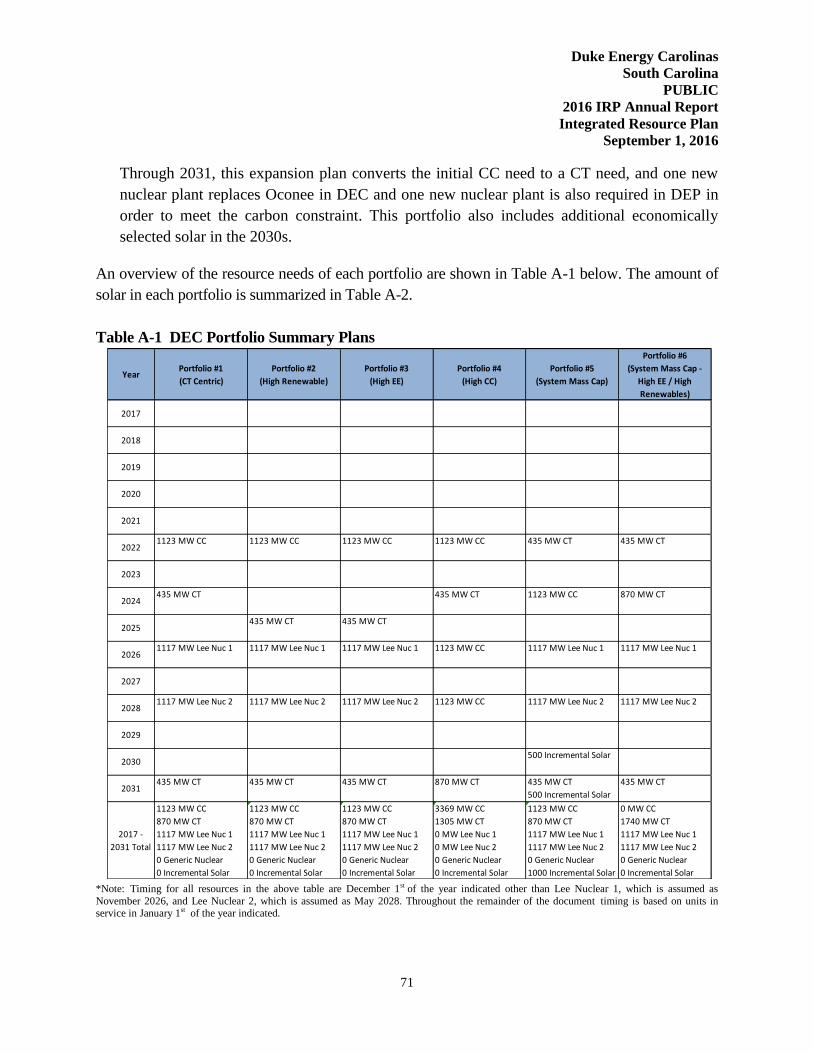
Duke Energy Carolinas
South Carolina
PUBLIC
2016 IRP Annual Report
Integrated Resource Plan
September 1, 2016
71
Through 2031, this expansion plan converts the initial CC need to a CT need, and one new
nuclear plant replaces Oconee in DEC and one new nuclear plant is also required in DEP in
order to meet the carbon constraint. This portfolio also includes additional economically
selected solar in the 2030s.
An overview of the resource needs of each portfolio are shown in Table A-1 below. The amount of
solar in each portfolio is summarized in Table A-2.
Table A-1 DEC Portfolio Summary Plans
*Note: Timing for all resources in the above table are December 1st of the year indicated other than Lee Nuclear 1, which is assumed as
November 2026, and Lee Nuclear 2, which is assumed as May 2028. Throughout the remainder of the document timing is based on units in service in January 1st of the year indicated.
YearPortfolio #1
(CT Centric)
Portfolio #2
(High Renewable)
Portfolio #3
(High EE)
Portfolio #4
(High CC)
Portfolio #5
(System Mass Cap)
Portfolio #6
(System Mass Cap -
High EE / High
Renewables)
2017
2018
2019
2020
2021
20221123 MW CC 1123 MW CC 1123 MW CC 1123 MW CC 435 MW CT 435 MW CT
2023
2024435 MW CT 435 MW CT 1123 MW CC 870 MW CT
2025435 MW CT 435 MW CT
20261117 MW Lee Nuc 1 1117 MW Lee Nuc 1 1117 MW Lee Nuc 1 1123 MW CC 1117 MW Lee Nuc 1 1117 MW Lee Nuc 1
2027
20281117 MW Lee Nuc 2 1117 MW Lee Nuc 2 1117 MW Lee Nuc 2 1123 MW CC 1117 MW Lee Nuc 2 1117 MW Lee Nuc 2
2029
2030500 Incremental Solar
2031435 MW CT 435 MW CT 435 MW CT 870 MW CT 435 MW CT
500 Incremental Solar
435 MW CT
2017 -
2031 Total
1123 MW CC
870 MW CT
1117 MW Lee Nuc 1
1117 MW Lee Nuc 2
0 Generic Nuclear
0 Incremental Solar
1123 MW CC
870 MW CT
1117 MW Lee Nuc 1
1117 MW Lee Nuc 2
0 Generic Nuclear
0 Incremental Solar
1123 MW CC
870 MW CT
1117 MW Lee Nuc 1
1117 MW Lee Nuc 2
0 Generic Nuclear
0 Incremental Solar
3369 MW CC
1305 MW CT
0 MW Lee Nuc 1
0 MW Lee Nuc 2
0 Generic Nuclear
0 Incremental Solar
1123 MW CC
870 MW CT
1117 MW Lee Nuc 1
1117 MW Lee Nuc 2
0 Generic Nuclear
1000 Incremental Solar
0 MW CC
1740 MW CT
1117 MW Lee Nuc 1
1117 MW Lee Nuc 2
0 Generic Nuclear
0 Incremental Solar

Duke Energy Carolinas
South Carolina
PUBLIC
2016 IRP Annual Report
Integrated Resource Plan
September 1, 2016
72
Table A-2 DEC Cumulative Solar Summary (Nameplate MWs)
4. Perform Portfolio Analysis
The six portfolios identified in the screening analysis were evaluated in more detail with an hourly
production cost model called PROSYM under several scenarios. The four scenarios are summarized
in Table A-3 and included sensitivities on fuel, carbon, and capital cost.
Year Portfolio #1 Portfolio #2 Portfolio #3 Portfolio #4 Portfolio #5 Portfolio #6
2017 735 805 735 735 735 805
2018 907 1,057 907 907 907 1,057
2019 1,088 1,249 1,088 1,088 1,088 1,249
2020 1,244 1,436 1,244 1,244 1,244 1,436
2021 1,416 1,609 1,416 1,416 1,416 1,609
2022 1,542 1,810 1,542 1,542 1,542 1,810
2023 1,641 1,990 1,641 1,641 1,641 1,990
2024 1,724 2,140 1,724 1,724 1,724 2,140
2025 1,801 2,281 1,801 1,801 1,801 2,281
2026 1,873 2,413 1,873 1,873 1,873 2,413
2027 1,941 2,537 1,941 1,941 1,941 2,537
2028 2,004 2,654 2,004 2,004 2,004 2,654
2029 2,063 2,763 2,063 2,063 2,063 2,763
2030 2,118 2,864 2,118 2,118 2,618 2,864
2031 2,168 2,957 2,168 2,168 3,168 2,957
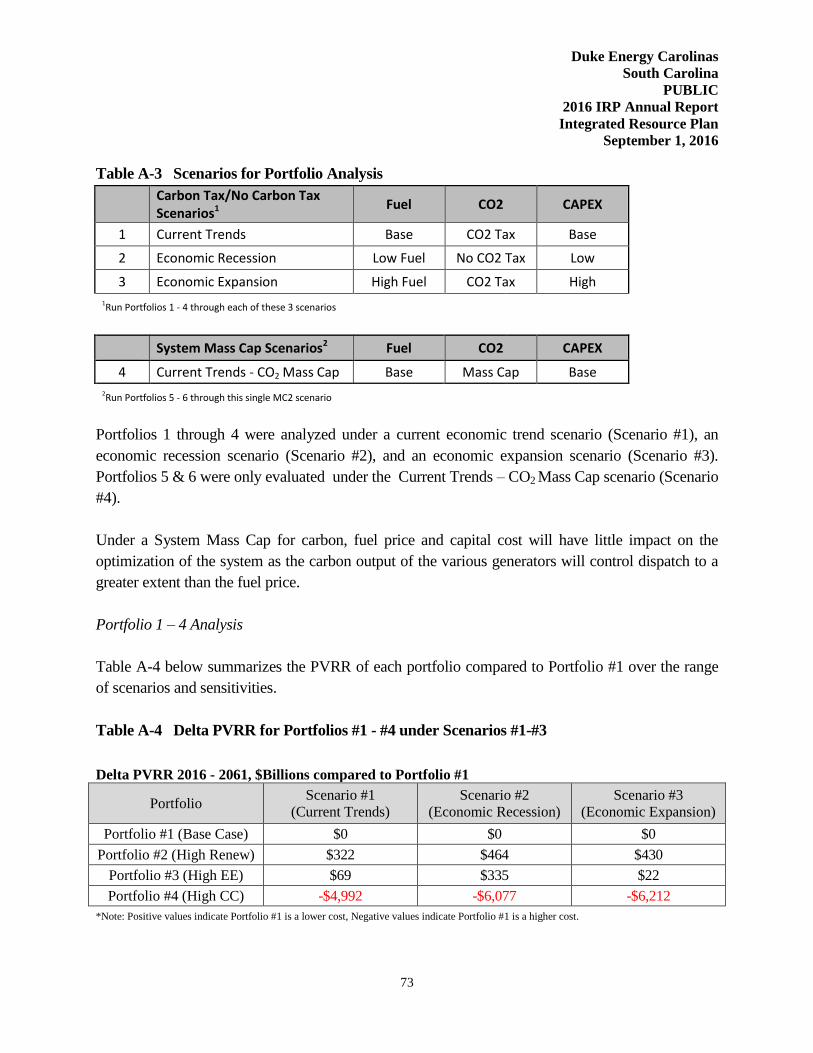
Duke Energy Carolinas
South Carolina
PUBLIC
2016 IRP Annual Report
Integrated Resource Plan
September 1, 2016
73
Table A-3 Scenarios for Portfolio Analysis
Carbon Tax/No Carbon Tax Scenarios1
Fuel CO2 CAPEX
1 Current Trends Base CO2 Tax Base
2 Economic Recession Low Fuel No CO2 Tax Low
3 Economic Expansion High Fuel CO2 Tax High
1Run Portfolios 1 - 4 through each of these 3 scenarios
System Mass Cap Scenarios2 Fuel CO2 CAPEX
4 Current Trends - CO2 Mass Cap Base Mass Cap Base
2Run Portfolios 5 - 6 through this single MC2 scenario
Portfolios 1 through 4 were analyzed under a current economic trend scenario (Scenario #1), an
economic recession scenario (Scenario #2), and an economic expansion scenario (Scenario #3).
Portfolios 5 & 6 were only evaluated under the Current Trends – CO2 Mass Cap scenario (Scenario
#4).
Under a System Mass Cap for carbon, fuel price and capital cost will have little impact on the
optimization of the system as the carbon output of the various generators will control dispatch to a
greater extent than the fuel price.
Portfolio 1 – 4 Analysis
Table A-4 below summarizes the PVRR of each portfolio compared to Portfolio #1 over the range
of scenarios and sensitivities.
Table A-4 Delta PVRR for Portfolios #1 - #4 under Scenarios #1-#3
Delta PVRR 2016 - 2061, $Billions compared to Portfolio #1
Portfolio
Scenario #1
(Current Trends)
Scenario #2
(Economic Recession)
Scenario #3
(Economic Expansion)
Portfolio #1 (Base Case) $0 $0 $0
Portfolio #2 (High Renew) $322 $464 $430
Portfolio #3 (High EE) $69 $335 $22
Portfolio #4 (High CC) -$4,992 -$6,077 -$6,212
*Note: Positive values indicate Portfolio #1 is a lower cost, Negative values indicate Portfolio #1 is a higher cost.
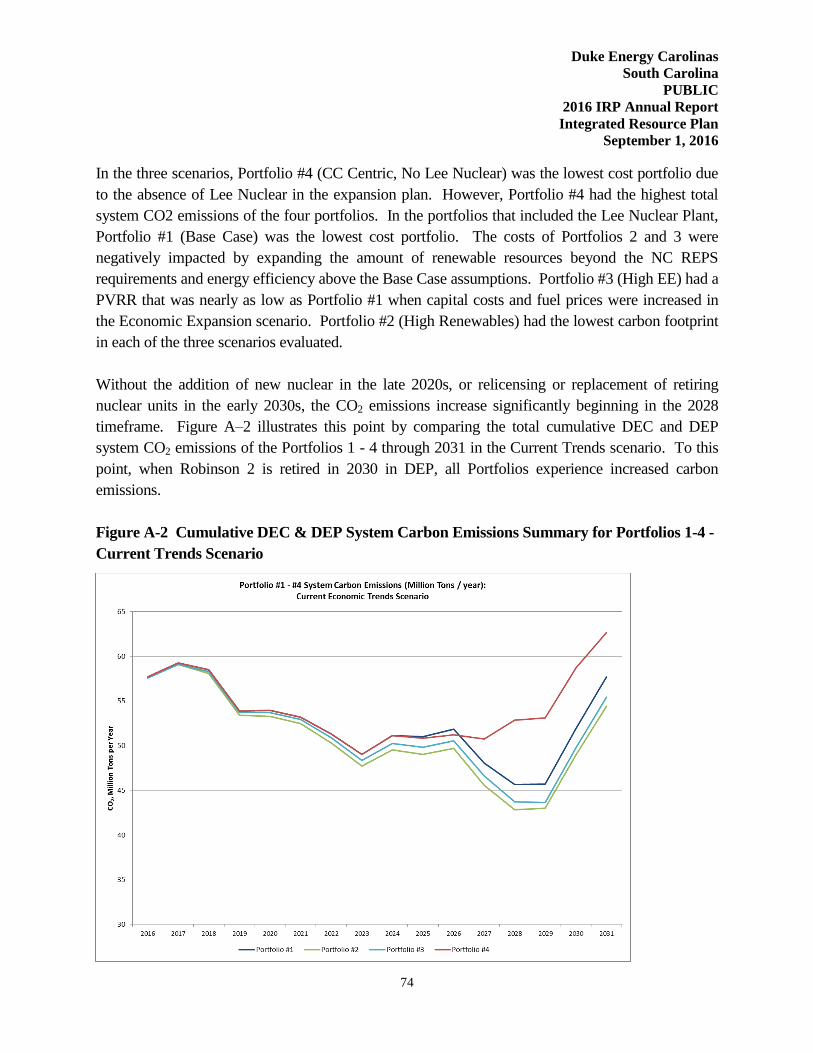
Duke Energy Carolinas
South Carolina
PUBLIC
2016 IRP Annual Report
Integrated Resource Plan
September 1, 2016
74
In the three scenarios, Portfolio #4 (CC Centric, No Lee Nuclear) was the lowest cost portfolio due
to the absence of Lee Nuclear in the expansion plan. However, Portfolio #4 had the highest total
system CO2 emissions of the four portfolios. In the portfolios that included the Lee Nuclear Plant,
Portfolio #1 (Base Case) was the lowest cost portfolio. The costs of Portfolios 2 and 3 were
negatively impacted by expanding the amount of renewable resources beyond the NC REPS
requirements and energy efficiency above the Base Case assumptions. Portfolio #3 (High EE) had a
PVRR that was nearly as low as Portfolio #1 when capital costs and fuel prices were increased in
the Economic Expansion scenario. Portfolio #2 (High Renewables) had the lowest carbon footprint
in each of the three scenarios evaluated.
Without the addition of new nuclear in the late 2020s, or relicensing or replacement of retiring
nuclear units in the early 2030s, the CO2 emissions increase significantly beginning in the 2028
timeframe. Figure A–2 illustrates this point by comparing the total cumulative DEC and DEP
system CO2 emissions of the Portfolios 1 - 4 through 2031 in the Current Trends scenario. To this
point, when Robinson 2 is retired in 2030 in DEP, all Portfolios experience increased carbon
emissions.
Figure A-2 Cumulative DEC & DEP System Carbon Emissions Summary for Portfolios 1-4 -
Current Trends Scenario

Duke Energy Carolinas
South Carolina
PUBLIC
2016 IRP Annual Report
Integrated Resource Plan
September 1, 2016
75
Portfolio 5 and 6 Analysis
Table A-5 below summarizes the revenue requirements of Portfolios #5 and #6 under Scenario #4.
Table A-5 Delta PVRR for Portfolios #5 & #6 under Scenario #4
Delta PVRR 2016 - 2061, $Millions compared to Portfolio #5
Portfolio Scenario #1
(Current Trends)
Portfolio #5 (System Mass Cap Base) $0
Portfolio #6 (High EE / Renew) $184
The high EE and high renewable combination led to a slightly higher PVRR versus the Base Case
under a System Mass Cap carbon plan. The capital cost of the high EE/high renewable portfolio
was nearly $1.9B higher than Portfolio #5, and this was mostly offset by approximately $1.7B in
system production cost savings.
Cumulative DEC and DEP system carbon emissions for both Portfolio #5 and Portfolio #6 average
less than 50 Million tons/year by the late-2020s and are projected to stay flat to declining beyond
the study period as shown in Figure A-3.
Figure A-3 Cumulative DEC & DEP System Carbon Emissions Summary for Portfolios 1-6 –
Current Trends Scenario
Duke Energy Carolinas
South Carolina
PUBLIC
2016 IRP Annual Report
Integrated Resource Plan
September 1, 2016
76
Conclusions
For planning purposes, Duke Energy considers the potential impact of a future where carbon
emissions are constrained as the base plan. Portfolio #4 is the least cost portfolio from a revenue
requirement basis in the Carbon Tax paradigm, however its carbon footprint would not be
sustainable in the long term in a System CO2 Mass Cap plan if new nuclear generation was not
available in the late 2020s to early 2030s. Portfolios 1 through 3 add Lee Nuclear Station in the
2026-2028 timeframe which leads to a reduction in CO2 emissions of about 15% to 20% by 2030.
Portfolio #1 is the least cost portfolio with Lee Nuclear Station included, but none of these
portfolios would meet a System CO2 Mass Cap scenario unless existing nuclear generation was
relicensed or replaced with new nuclear generation. By 2034, approximately 3,300 MW of existing
nuclear generation will be retired in DEC and DEP unless their licenses can be extended. To date,
no nuclear units in the United States have received a license extension beyond sixty years.
Duke Energy’s current modeling practice uses a proxy CO2 price forecast from a third party to
simulate compliance where carbon emissions are constrained under the now stayed EPA Clean
Power Plan. With the stay, the future of CO2 legislation is still uncertain, and a system mass cap on
carbon emissions is still a possibility. Portfolio #1 was chosen as the Base Case portfolio because
the short term build plan would keep the Company on track if a System CO2 Mass Cap were
implemented, and it was the least cost portfolio with Lee Nuclear included from a revenue
requirements perspective.
Value of Joint Planning
To demonstrate the value of sharing capacity with DEP, a Joint Planning Case was developed to
examine the impact of joint capacity planning on the resource plans. The impacts were determined
by comparing how the combined Base Cases of DEC and DEP would change if a 17% minimum
winter planning reserve margin was applied at the combined system level, rather than the individual
company level.
An evaluation was performed comparing the optimally selected Portfolio 1 for DEC and DEP to a
combined Joint Planning Case in which existing and future capacity resources could be shared
between DEC and DEP to meet the 17% minimum winter planning reserve margin. In this Joint
Planning Case, sharing the Lee Nuclear Station on a load ratio basis with DEP was the most
economic selection. Table A-4 shows the base expansion plans (Portfolio #1 for both DEC and
DEP) through 2031, if separately planned, compared to the Joint Planning Case. The sum total of

Duke Energy Carolinas
South Carolina
PUBLIC
2016 IRP Annual Report
Integrated Resource Plan
September 1, 2016
77
the two combined resource requirements is then compared to the amount of resources needed if
DEC and DEP were able to jointly plan for capacity.
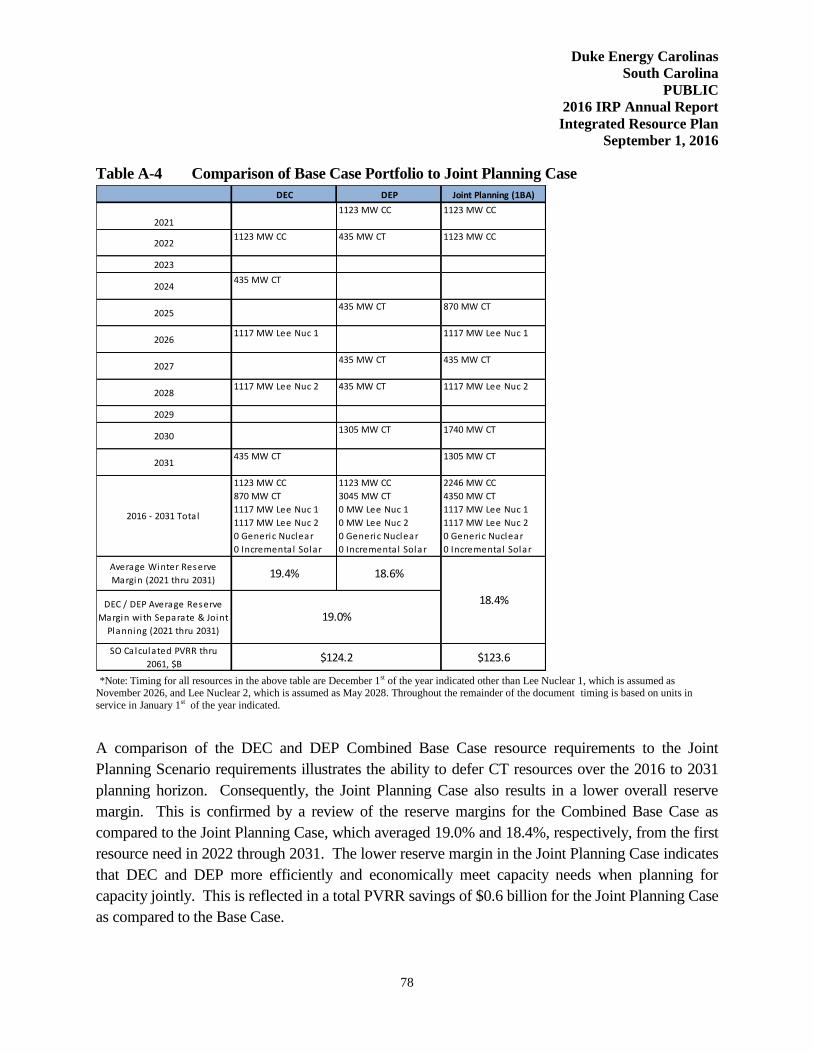
Duke Energy Carolinas
South Carolina
PUBLIC
2016 IRP Annual Report
Integrated Resource Plan
September 1, 2016
78
Table A-4 Comparison of Base Case Portfolio to Joint Planning Case
*Note: Timing for all resources in the above table are December 1st of the year indicated other than Lee Nuclear 1, which is assumed as November 2026, and Lee Nuclear 2, which is assumed as May 2028. Throughout the remainder of the document timing is based on units in
service in January 1st of the year indicated.
A comparison of the DEC and DEP Combined Base Case resource requirements to the Joint
Planning Scenario requirements illustrates the ability to defer CT resources over the 2016 to 2031
planning horizon. Consequently, the Joint Planning Case also results in a lower overall reserve
margin. This is confirmed by a review of the reserve margins for the Combined Base Case as
compared to the Joint Planning Case, which averaged 19.0% and 18.4%, respectively, from the first
resource need in 2022 through 2031. The lower reserve margin in the Joint Planning Case indicates
that DEC and DEP more efficiently and economically meet capacity needs when planning for
capacity jointly. This is reflected in a total PVRR savings of $0.6 billion for the Joint Planning Case
as compared to the Base Case.
DEC DEP Joint Planning (1BA)
20211123 MW CC 1123 MW CC
20221123 MW CC 435 MW CT 1123 MW CC
2023
2024435 MW CT
2025435 MW CT 870 MW CT
20261117 MW Lee Nuc 1 1117 MW Lee Nuc 1
2027435 MW CT 435 MW CT
20281117 MW Lee Nuc 2 435 MW CT 1117 MW Lee Nuc 2
2029
20301305 MW CT 1740 MW CT
2031435 MW CT 1305 MW CT
2016 - 2031 Total
1123 MW CC
870 MW CT
1117 MW Lee Nuc 1
1117 MW Lee Nuc 2
0 Generic Nuclear
0 Incremental Solar
1123 MW CC
3045 MW CT
0 MW Lee Nuc 1
0 MW Lee Nuc 2
0 Generic Nuclear
0 Incremental Solar
2246 MW CC
4350 MW CT
1117 MW Lee Nuc 1
1117 MW Lee Nuc 2
0 Generic Nuclear
0 Incremental Solar
Average Winter Reserve
Margin (2021 thru 2031)19.4% 18.6%
DEC / DEP Average Reserve
Margin with Separate & Joint
Planning (2021 thru 2031)
SO Calculated PVRR thru
2061, $B$123.6
19.0%
18.4%
$124.2

Duke Energy Carolinas
South Carolina
PUBLIC
2016 IRP Annual Report
Integrated Resource Plan
September 1, 2016
79
B. Quantitative Analysis Summary
The quantitative analysis resulted in several key takeaways that are important for near-term
decision-making, as well as in planning for the longer term.
1. The first undesignated resource need is in December of 2022 to meet the minimum
reserve margin requirement in the winter of 2023. The results of this analysis show that
this need is best met with CC generation.
2. The ability to jointly plan capacity with DEP provides customer savings by allowing for
the deferral of new generation resources over the 2017 through 2031 planning horizon.
3. New nuclear generation is selected as an economic resource in a System CO2 Mass Cap future as
identified in Portfolios 5 & 6. In the 15-year planning horizon, the addition of the Lee Nuclear
Station in the 2026 to 2028 timeframe and two additional generic nuclear units, one in DEC and
the other in DEP, were selected prior to 2040.
Portfolio 1 supports 100% ownership of Lee Nuclear Station by DEC. However, the Company
continues to consider the benefits of regional nuclear generation. Sharing new baseload generation
resources between multiple parties allows for resource additions to be better matched with load
growth and for new construction risk to be shared among the parties. This results in positive benefits
for the Company’s customers. The benefits of co-ownership of the Lee Nuclear Station with DEP
were also illustrated with the ability to jointly plan as represented in the Joint Planning Case.

Duke Energy Carolinas
South Carolina
PUBLIC
2016 IRP Annual Report
Integrated Resource Plan
September 1, 2016
80
APPENDIX B: DUKE ENERGY CAROLINAS OWNED GENERATION
Duke Energy Carolinas’ generation portfolio includes a balanced mix of resources with different
operating and fuel characteristics. This mix is designed to provide energy at the lowest
reasonable cost to meet the Company’s obligation to serve its customers. Duke Energy
Carolinas-owned generation, as well as purchased power, is evaluated on a real-time basis in
order to select and dispatch the lowest-cost resources to meet system load requirements. In 2015,
Duke Energy Carolinas’ nuclear, coal-fired and gas-fired generating units met the vast majority
of customer needs by providing 61%, 27% and 11%, respectively, of Duke Energy Carolinas’
energy from generation.Hydro-electric generation, solar generation, long term PPAs, and
economical purchases from the wholesale market supplied the remainder.
The tables below list the Duke Energy Carolinas’ plants in service in North Carolina (NC) and
South Carolina (SC) with plant statistics, and the system’s total generating capability.
Existing Generating Units and Ratings a, b, c, d
All Generating Unit Ratings are as of January 1, 2016
Coal
Unit Winter
(MW)
Summer
(MW)
Location Fuel Type Resource Type
Allen 1 167 162 Belmont, N.C. Coal Peaking
Allen 2 167 162 Belmont, N.C. Coal Peaking
Allen 3 270 261 Belmont, N.C. Coal Peaking
Allen 4 282 276 Belmont, N.C. Coal Peaking
Allen 5 275 266 Belmont, N.C. Coal Peaking
Belews Creek 1 1110 1110 Belews Creek, N.C. Coal Base
Belews Creek 2 1110 1110 Belews Creek, N.C. Coal Base
Cliffside 5 556 552 Cliffside, N.C. Coal Peaking
Cliffside 6 844 844 Cliffside, N.C. Coal Intermediate
Marshall 1 380 380 Terrell, N.C. Coal Intermediate
Marshall 2 380 380 Terrell, N.C. Coal Intermediate
Marshall 3 658 658 Terrell, N.C. Coal Base
Marshall 4 660 660 Terrell, N.C. Coal Base
Total Coal 6859 6821
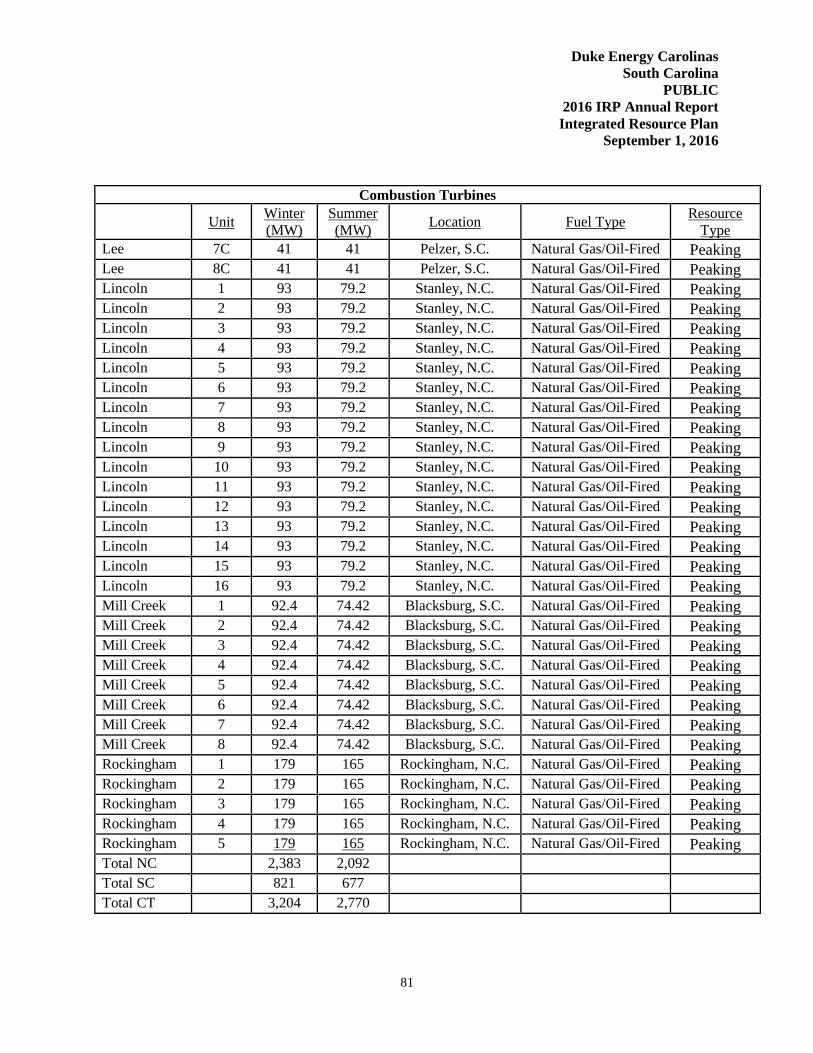
Duke Energy Carolinas
South Carolina
PUBLIC
2016 IRP Annual Report
Integrated Resource Plan
September 1, 2016
81
Combustion Turbines
Unit
Winter
(MW)
Summer
(MW) Location Fuel Type
Resource
Type
Lee 7C 41 41 Pelzer, S.C. Natural Gas/Oil-Fired Peaking
Lee 8C 41 41 Pelzer, S.C. Natural Gas/Oil-Fired Peaking
Lincoln 1 93 79.2 Stanley, N.C. Natural Gas/Oil-Fired Peaking
Lincoln 2 93 79.2 Stanley, N.C. Natural Gas/Oil-Fired Peaking
Lincoln 3 93 79.2 Stanley, N.C. Natural Gas/Oil-Fired Peaking
Lincoln 4 93 79.2 Stanley, N.C. Natural Gas/Oil-Fired Peaking
Lincoln 5 93 79.2 Stanley, N.C. Natural Gas/Oil-Fired Peaking
Lincoln 6 93 79.2 Stanley, N.C. Natural Gas/Oil-Fired Peaking
Lincoln 7 93 79.2 Stanley, N.C. Natural Gas/Oil-Fired Peaking
Lincoln 8 93 79.2 Stanley, N.C. Natural Gas/Oil-Fired Peaking
Lincoln 9 93 79.2 Stanley, N.C. Natural Gas/Oil-Fired Peaking
Lincoln 10 93 79.2 Stanley, N.C. Natural Gas/Oil-Fired Peaking
Lincoln 11 93 79.2 Stanley, N.C. Natural Gas/Oil-Fired Peaking
Lincoln 12 93 79.2 Stanley, N.C. Natural Gas/Oil-Fired Peaking
Lincoln 13 93 79.2 Stanley, N.C. Natural Gas/Oil-Fired Peaking
Lincoln 14 93 79.2 Stanley, N.C. Natural Gas/Oil-Fired Peaking
Lincoln 15 93 79.2 Stanley, N.C. Natural Gas/Oil-Fired Peaking
Lincoln 16 93 79.2 Stanley, N.C. Natural Gas/Oil-Fired Peaking
Mill Creek 1 92.4 74.42 Blacksburg, S.C. Natural Gas/Oil-Fired Peaking
Mill Creek 2 92.4 74.42 Blacksburg, S.C. Natural Gas/Oil-Fired Peaking
Mill Creek 3 92.4 74.42 Blacksburg, S.C. Natural Gas/Oil-Fired Peaking
Mill Creek 4 92.4 74.42 Blacksburg, S.C. Natural Gas/Oil-Fired Peaking
Mill Creek 5 92.4 74.42 Blacksburg, S.C. Natural Gas/Oil-Fired Peaking
Mill Creek 6 92.4 74.42 Blacksburg, S.C. Natural Gas/Oil-Fired Peaking
Mill Creek 7 92.4 74.42 Blacksburg, S.C. Natural Gas/Oil-Fired Peaking
Mill Creek 8 92.4 74.42 Blacksburg, S.C. Natural Gas/Oil-Fired Peaking
Rockingham 1 179 165 Rockingham, N.C. Natural Gas/Oil-Fired Peaking
Rockingham 2 179 165 Rockingham, N.C. Natural Gas/Oil-Fired Peaking
Rockingham 3 179 165 Rockingham, N.C. Natural Gas/Oil-Fired Peaking
Rockingham 4 179 165 Rockingham, N.C. Natural Gas/Oil-Fired Peaking
Rockingham 5 179 165 Rockingham, N.C. Natural Gas/Oil-Fired Peaking
Total NC 2,383 2,092
Total SC 821 677
Total CT 3,204 2,770

Duke Energy Carolinas
South Carolina
PUBLIC
2016 IRP Annual Report
Integrated Resource Plan
September 1, 2016
82
Natural Gas Fired Boiler
Winter
(MW)
Summer
(MW) Location Fuel Type Resource Type
Lee 3 170.0 170.0 Pelzer, N.C. Nat. Gas Peaking
Total Nat. Gas 170.0 170.0
Combined Cycle
Unit
Winter
(MW)
Summer
(MW) Location Fuel Type
Resource
Type
Buck CT11 190.7 176.3 Salisbury, N.C. Natural Gas Base
Buck CT12 189.8 175.1 Salisbury, N.C. Natural Gas Base
Buck ST10 316.8 316.8 Salisbury, N.C. Natural Gas Base
Buck CTCC 697.3 668.2
Dan River CT8 193.0 165.0 Eden, N.C. Natural Gas Base
Dan River CT9 193.0 166.0 Eden, N.C. Natural Gas Base
Dan River ST7 320.0 320.0 Eden, N.C. Natural Gas Base
Dan River CTCC 706.0 651.0
Total CTCC 1,403.3 1,319.2
Pumped Storage
Unit
Winter
(MW)
Summer
(MW) Location Fuel Type
Resource
Type
Jocassee 1 195 195 Salem, S.C. Pumped Storage Peaking
Jocassee 2 195 195 Salem, S.C. Pumped Storage Peaking
Jocassee 3 195 195 Salem, S.C. Pumped Storage Peaking
Jocassee 4 195 195 Salem, S.C. Pumped Storage Peaking
Bad Creek 1 340 340 Salem, S.C. Pumped Storage Peaking
Bad Creek 2 340 340 Salem, S.C. Pumped Storage Peaking
Bad Creek 3 340 340 Salem, S.C. Pumped Storage Peaking
Bad Creek 4 340 340 Salem, S.C. Pumped Storage Peaking
Total Pump Stor 2,140 2,140

Duke Energy Carolinas
South Carolina
PUBLIC
2016 IRP Annual Report
Integrated Resource Plan
September 1, 2016
83
Hydro
Unit
Winter
(MW)
Summer
(MW) Location Fuel Type
Resource
Type
99 Islands 1 2.4 2.4 Blacksburg, S.C. Hydro Peaking
99 Islands 2 2.4 2.4 Blacksburg, S.C. Hydro Peaking
99 Islands 3 2.4 2.4 Blacksburg, S.C. Hydro Peaking
99 Islands 4 2.4 2.4 Blacksburg, S.C. Hydro Peaking
99 Islands 5 0 0 Blacksburg, S.C. Hydro Peaking
99 Islands 6 0 0 Blacksburg, S.C. Hydro Peaking
Bear Creek 1 9.5 9.5 Tuckasegee, N.C. Hydro Peaking
Bridgewater 1 15 15 Morganton, N.C. Hydro Peaking
Bridgewater 2 15 15 Morganton, N.C. Hydro Peaking
Bridgewater 3 1.5 1.5 Morganton, N.C. Hydro Peaking
Bryson City 1 0 0 Whittier, N.C. Hydro Peaking
Bryson City 2 0 0 Whittier, N.C. Hydro Peaking
Cedar Cliff 1 6.4 6.4 Tuckasegee, N.C. Hydro Peaking
Cedar Cliff 2 0.4 0.4 Tuckasegee, N.C. Hydro Peaking
Cedar Creek 1 15 15 Great Falls, S.C. Hydro Peaking
Cedar Creek 2 15 15 Great Falls, S.C. Hydro Peaking
Cedar Creek 3 15 15 Great Falls, S.C. Hydro Peaking
Cowans Ford 1 81.3 81.3 Stanley, N.C. Hydro Peaking
Cowans Ford 2 81.3 81.3 Stanley, N.C. Hydro Peaking
Cowans Ford 3 81.3 81.3 Stanley, N.C. Hydro Peaking
Cowans Ford 4 81.3 81.3 Stanley, N.C. Hydro Peaking
Dearborn 1 14 14 Great Falls, S.C. Hydro Peaking
Dearborn 2 14 14 Great Falls, S.C. Hydro Peaking
Dearborn 3 14 14 Great Falls, S.C. Hydro Peaking
Fishing Creek 1 11 11 Great Falls, S.C. Hydro Peaking
Fishing Creek 2 9.5 9.5 Great Falls, S.C. Hydro Peaking
Fishing Creek 3 9.5 9.5 Great Falls, S.C. Hydro Peaking
Fishing Creek 4 11 11 Great Falls, S.C. Hydro Peaking
Fishing Creek 5 8 8 Great Falls, S.C. Hydro Peaking
Franklin 1 0.5 0.5 Franklin, N.C. Hydro Peaking
Franklin 2 0.5 0.5 Franklin, N.C. Hydro Peaking
Gaston Shoals 3 0 0 Blacksburg, S.C. Hydro Peaking
Gaston Shoals 4 1 1 Blacksburg, S.C. Hydro Peaking
Gaston Shoals 5 1 1 Blacksburg, S.C. Hydro Peaking
Gaston Shoals 6 0 0 Blacksburg, S.C. Hydro Peaking

Duke Energy Carolinas
South Carolina
PUBLIC
2016 IRP Annual Report
Integrated Resource Plan
September 1, 2016
84
Hydro cont.
Unit
Winter
(MW)
Summer
(MW) Location Fuel Type
Resource
Type
Great Falls 1 3 3 Great Falls, S.C. Hydro Peaking
Great Falls 2 3 3 Great Falls, S.C. Hydro Peaking
Great Falls 3 0 0 Great Falls, S.C. Hydro Peaking
Great Falls 4 0 0 Great Falls, S.C. Hydro Peaking
Great Falls 5 3 3 Great Falls, S.C. Hydro Peaking
Great Falls 6 3 3 Great Falls, S.C. Hydro Peaking
Great Falls 7 0 0 Great Falls, S.C. Hydro Peaking
Great Falls 8 0 0 Great Falls, S.C. Hydro Peaking
Keowee 1 76 76 Seneca, S.C. Hydro Peaking
Keowee 2 76 76 Seneca, S.C. Hydro Peaking
Lookout Shoals 1 9.3 9.3 Statesville, N.C. Hydro Peaking
Lookout Shoals 2 9.3 9.3 Statesville, N.C. Hydro Peaking
Lookout Shoals 3 9.3 9.3 Statesville, N.C. Hydro Peaking
Mission 1 0.6 0.6 Murphy, N.C. Hydro Peaking
Mission 2 0.6 0.6 Murphy, N.C. Hydro Peaking
Mission 3 0 0 Murphy, N.C. Hydro Peaking
Mountain Island 1 14 14 Mount Holly, N.C. Hydro Peaking
Mountain Island 2 14 14 Mount Holly, N.C. Hydro Peaking
Mountain Island 3 17 17 Mount Holly, N.C. Hydro Peaking
Mountain Island 4 17 17 Mount Holly, N.C. Hydro Peaking
Nantahala 1 50 50 Topton, N.C. Hydro Peaking
Oxford 1 20 20 Conover, N.C. Hydro Peaking
Oxford 2 20 20 Conover, N.C. Hydro Peaking
Queens Creek 1 1.4 1.4 Topton, N.C. Hydro Peaking
Rhodhiss 1 9.5 9.5 Rhodhiss, N.C. Hydro Peaking
Rhodhiss 2 11.5 11.5 Rhodhiss, N.C. Hydro Peaking
Rhodhiss 3 12.4 12.4 Rhodhiss, N.C. Hydro Peaking
Rocky Creek 1 0 0 Great Falls, S.C. Hydro Peaking
Rocky Creek 2 0 0 Great Falls, S.C. Hydro Peaking
Rocky Creek 3 0 0 Great Falls, S.C. Hydro Peaking
Rocky Creek 4 0 0 Great Falls, S.C. Hydro Peaking
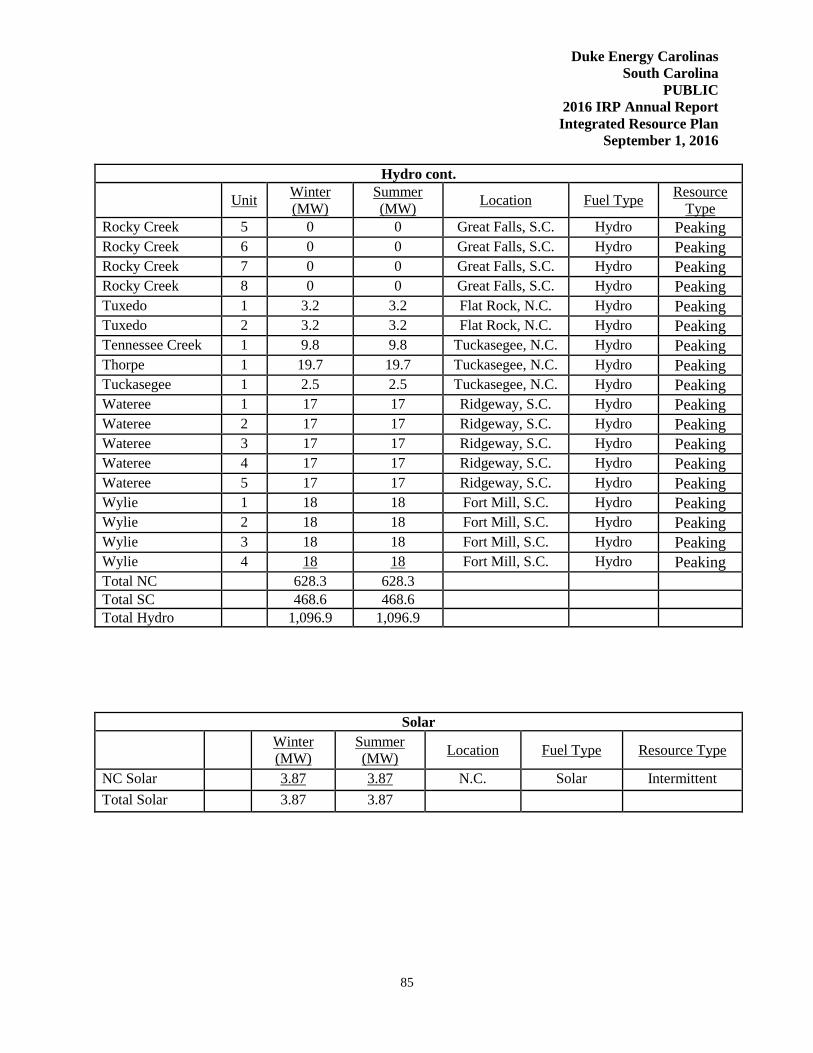
Duke Energy Carolinas
South Carolina
PUBLIC
2016 IRP Annual Report
Integrated Resource Plan
September 1, 2016
85
Hydro cont.
Unit
Winter
(MW)
Summer
(MW) Location Fuel Type
Resource
Type
Rocky Creek 5 0 0 Great Falls, S.C. Hydro Peaking
Rocky Creek 6 0 0 Great Falls, S.C. Hydro Peaking
Rocky Creek 7 0 0 Great Falls, S.C. Hydro Peaking
Rocky Creek 8 0 0 Great Falls, S.C. Hydro Peaking
Tuxedo 1 3.2 3.2 Flat Rock, N.C. Hydro Peaking
Tuxedo 2 3.2 3.2 Flat Rock, N.C. Hydro Peaking
Tennessee Creek 1 9.8 9.8 Tuckasegee, N.C. Hydro Peaking
Thorpe 1 19.7 19.7 Tuckasegee, N.C. Hydro Peaking
Tuckasegee 1 2.5 2.5 Tuckasegee, N.C. Hydro Peaking
Wateree 1 17 17 Ridgeway, S.C. Hydro Peaking
Wateree 2 17 17 Ridgeway, S.C. Hydro Peaking
Wateree 3 17 17 Ridgeway, S.C. Hydro Peaking
Wateree 4 17 17 Ridgeway, S.C. Hydro Peaking
Wateree 5 17 17 Ridgeway, S.C. Hydro Peaking
Wylie 1 18 18 Fort Mill, S.C. Hydro Peaking
Wylie 2 18 18 Fort Mill, S.C. Hydro Peaking
Wylie 3 18 18 Fort Mill, S.C. Hydro Peaking
Wylie 4 18 18 Fort Mill, S.C. Hydro Peaking
Total NC 628.3 628.3
Total SC 468.6 468.6
Total Hydro 1,096.9 1,096.9
Solar
Winter
(MW)
Summer
(MW) Location Fuel Type Resource Type
NC Solar 3.87 3.87 N.C. Solar Intermittent
Total Solar 3.87 3.87
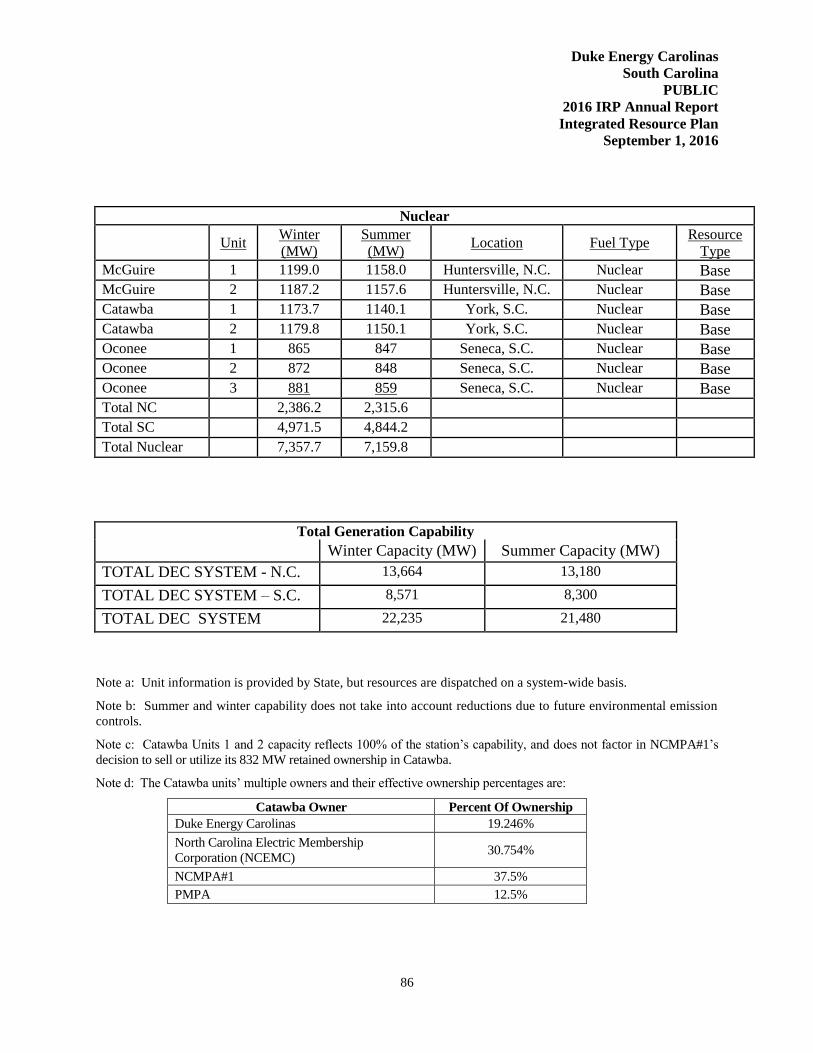
Duke Energy Carolinas
South Carolina
PUBLIC
2016 IRP Annual Report
Integrated Resource Plan
September 1, 2016
86
Nuclear
Unit
Winter
(MW)
Summer
(MW) Location Fuel Type
Resource
Type
McGuire 1 1199.0 1158.0 Huntersville, N.C. Nuclear Base
McGuire 2 1187.2 1157.6 Huntersville, N.C. Nuclear Base
Catawba 1 1173.7 1140.1 York, S.C. Nuclear Base
Catawba 2 1179.8 1150.1 York, S.C. Nuclear Base
Oconee 1 865 847 Seneca, S.C. Nuclear Base
Oconee 2 872 848 Seneca, S.C. Nuclear Base
Oconee 3 881 859 Seneca, S.C. Nuclear Base
Total NC 2,386.2 2,315.6
Total SC 4,971.5 4,844.2
Total Nuclear 7,357.7 7,159.8
Total Generation Capability
Winter Capacity (MW) Summer Capacity (MW)
TOTAL DEC SYSTEM - N.C. 13,664 13,180
TOTAL DEC SYSTEM – S.C. 8,571 8,300
TOTAL DEC SYSTEM 22,235 21,480
Note a: Unit information is provided by State, but resources are dispatched on a system-wide basis.
Note b: Summer and winter capability does not take into account reductions due to future environmental emission
controls.
Note c: Catawba Units 1 and 2 capacity reflects 100% of the station’s capability, and does not factor in NCMPA#1’s
decision to sell or utilize its 832 MW retained ownership in Catawba.
Note d: The Catawba units’ multiple owners and their effective ownership percentages are:
Catawba Owner Percent Of Ownership
Duke Energy Carolinas 19.246%
North Carolina Electric Membership
Corporation (NCEMC) 30.754%
NCMPA#1 37.5%
PMPA 12.5%
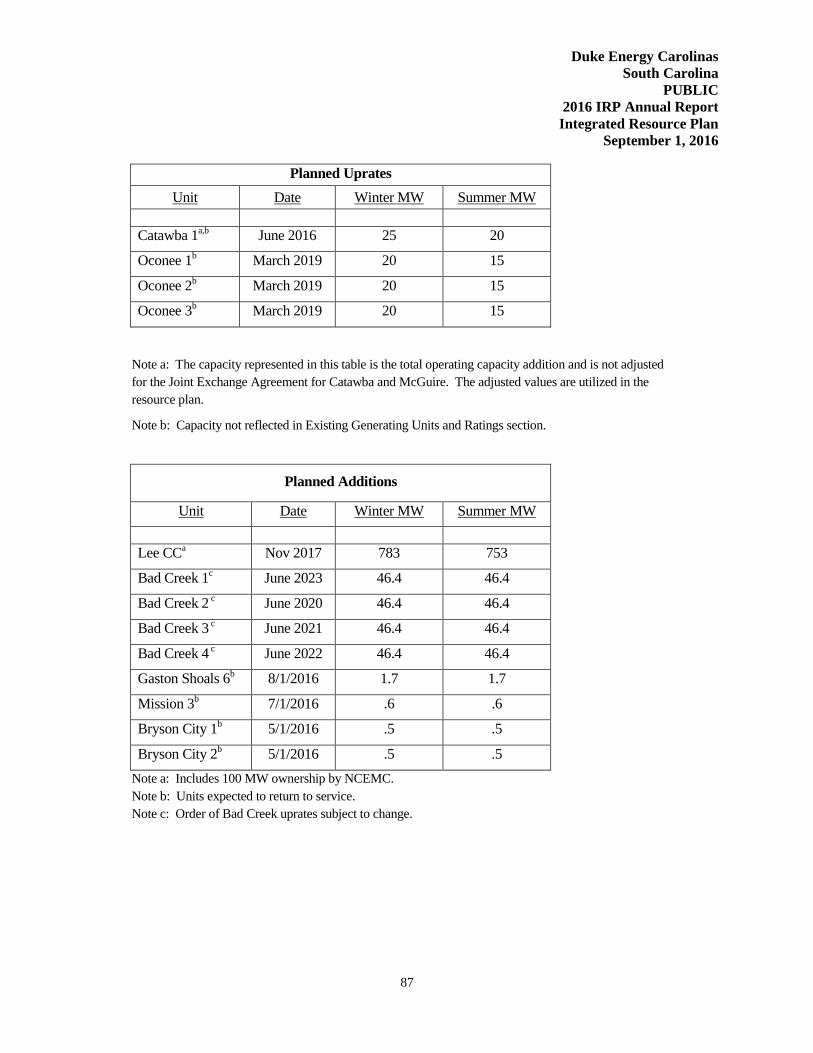
Duke Energy Carolinas
South Carolina
PUBLIC
2016 IRP Annual Report
Integrated Resource Plan
September 1, 2016
87
Planned Uprates
Unit Date Winter MW Summer MW
Catawba 1a,b
June 2016 25 20
Oconee 1b March 2019 20 15
Oconee 2b March 2019 20 15
Oconee 3b March 2019 20 15
Note a: The capacity represented in this table is the total operating capacity addition and is not adjusted
for the Joint Exchange Agreement for Catawba and McGuire. The adjusted values are utilized in the
resource plan.
Note b: Capacity not reflected in Existing Generating Units and Ratings section.
Planned Additions
Unit Date Winter MW Summer MW
Lee CCa Nov 2017 783 753
Bad Creek 1c June 2023 46.4 46.4
Bad Creek 2 c June 2020 46.4 46.4
Bad Creek 3 c June 2021 46.4 46.4
Bad Creek 4 c June 2022 46.4 46.4
Gaston Shoals 6b 8/1/2016 1.7 1.7
Mission 3b 7/1/2016 .6 .6
Bryson City 1b 5/1/2016 .5 .5
Bryson City 2b 5/1/2016 .5 .5
Note a: Includes 100 MW ownership by NCEMC.
Note b: Units expected to return to service.
Note c: Order of Bad Creek uprates subject to change.
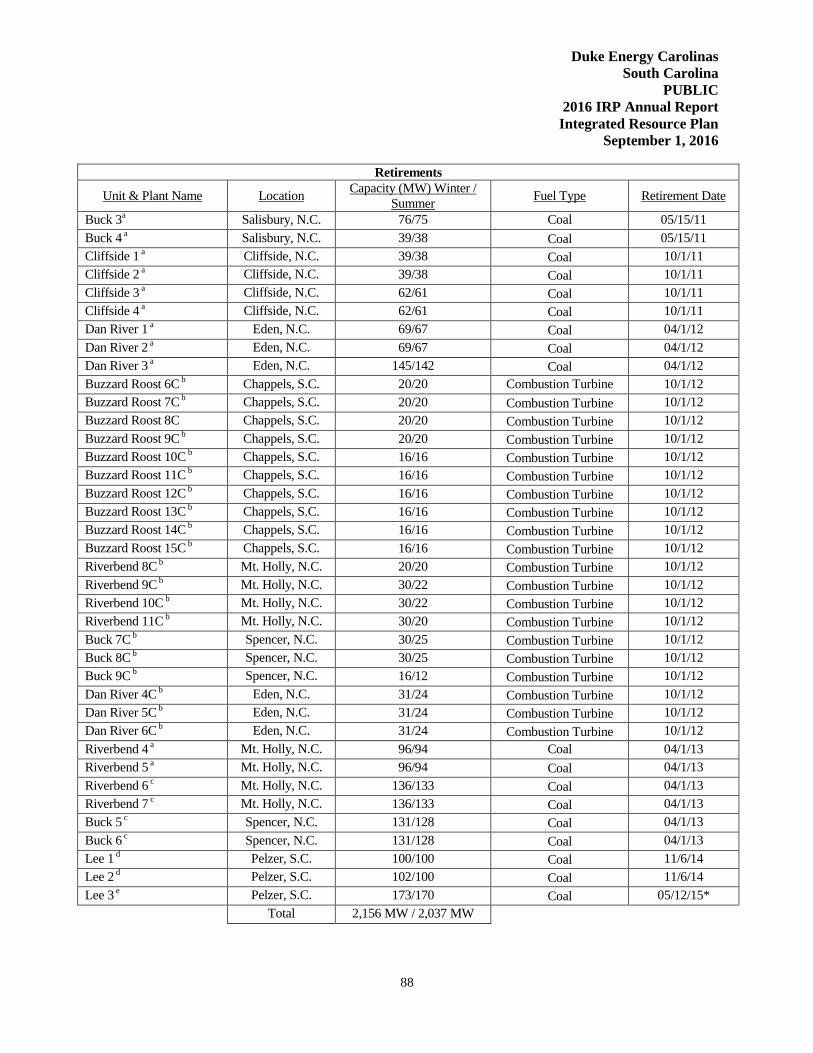
Duke Energy Carolinas
South Carolina
PUBLIC
2016 IRP Annual Report
Integrated Resource Plan
September 1, 2016
88
Retirements
Unit & Plant Name Location Capacity (MW) Winter /
Summer Fuel Type Retirement Date
Buck 3a Salisbury, N.C. 76/75 Coal 05/15/11
Buck 4 a Salisbury, N.C. 39/38 Coal 05/15/11
Cliffside 1 a Cliffside, N.C. 39/38 Coal 10/1/11
Cliffside 2 a Cliffside, N.C. 39/38 Coal 10/1/11
Cliffside 3 a Cliffside, N.C. 62/61 Coal 10/1/11
Cliffside 4 a Cliffside, N.C. 62/61 Coal 10/1/11
Dan River 1 a Eden, N.C. 69/67 Coal 04/1/12
Dan River 2 a Eden, N.C. 69/67 Coal 04/1/12
Dan River 3 a Eden, N.C. 145/142 Coal 04/1/12
Buzzard Roost 6C b Chappels, S.C. 20/20 Combustion Turbine 10/1/12
Buzzard Roost 7C b Chappels, S.C. 20/20 Combustion Turbine 10/1/12
Buzzard Roost 8C Chappels, S.C. 20/20 Combustion Turbine 10/1/12
Buzzard Roost 9C b Chappels, S.C. 20/20 Combustion Turbine 10/1/12
Buzzard Roost 10C b Chappels, S.C. 16/16 Combustion Turbine 10/1/12
Buzzard Roost 11C b Chappels, S.C. 16/16 Combustion Turbine 10/1/12
Buzzard Roost 12C b Chappels, S.C. 16/16 Combustion Turbine 10/1/12
Buzzard Roost 13C b Chappels, S.C. 16/16 Combustion Turbine 10/1/12
Buzzard Roost 14C b Chappels, S.C. 16/16 Combustion Turbine 10/1/12
Buzzard Roost 15C b Chappels, S.C. 16/16 Combustion Turbine 10/1/12
Riverbend 8C b Mt. Holly, N.C. 20/20 Combustion Turbine 10/1/12
Riverbend 9C b Mt. Holly, N.C. 30/22 Combustion Turbine 10/1/12
Riverbend 10C b Mt. Holly, N.C. 30/22 Combustion Turbine 10/1/12
Riverbend 11C b Mt. Holly, N.C. 30/20 Combustion Turbine 10/1/12
Buck 7C b Spencer, N.C. 30/25 Combustion Turbine 10/1/12
Buck 8C b Spencer, N.C. 30/25 Combustion Turbine 10/1/12
Buck 9C b Spencer, N.C. 16/12 Combustion Turbine 10/1/12
Dan River 4C b Eden, N.C. 31/24 Combustion Turbine 10/1/12
Dan River 5C b Eden, N.C. 31/24 Combustion Turbine 10/1/12
Dan River 6C b Eden, N.C. 31/24 Combustion Turbine 10/1/12
Riverbend 4 a Mt. Holly, N.C. 96/94 Coal 04/1/13
Riverbend 5 a Mt. Holly, N.C. 96/94 Coal 04/1/13
Riverbend 6 c Mt. Holly, N.C. 136/133 Coal 04/1/13
Riverbend 7 c Mt. Holly, N.C. 136/133 Coal 04/1/13
Buck 5 c Spencer, N.C. 131/128 Coal 04/1/13
Buck 6 c Spencer, N.C. 131/128 Coal 04/1/13
Lee 1 d Pelzer, S.C. 100/100 Coal 11/6/14
Lee 2 d Pelzer, S.C. 102/100 Coal 11/6/14
Lee 3 e Pelzer, S.C. 173/170 Coal 05/12/15*
Total 2,156 MW / 2,037 MW
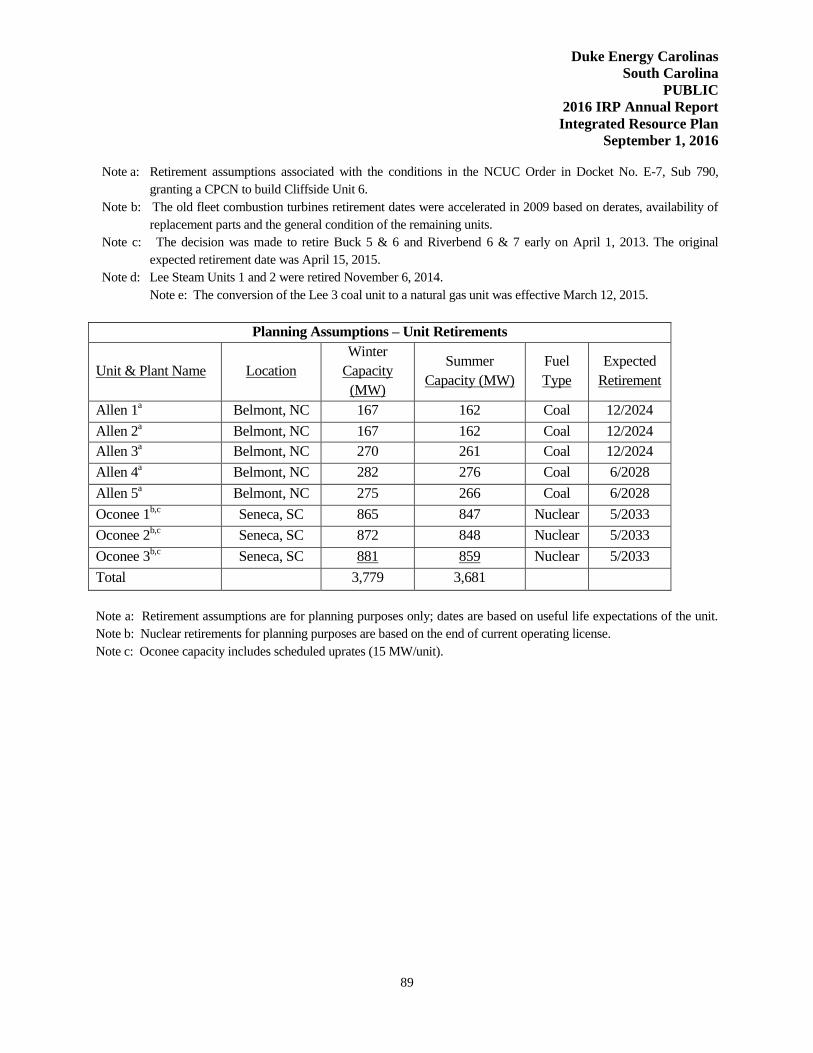
Duke Energy Carolinas
South Carolina
PUBLIC
2016 IRP Annual Report
Integrated Resource Plan
September 1, 2016
89
Note a: Retirement assumptions associated with the conditions in the NCUC Order in Docket No. E-7, Sub 790,
granting a CPCN to build Cliffside Unit 6.
Note b: The old fleet combustion turbines retirement dates were accelerated in 2009 based on derates, availability of
replacement parts and the general condition of the remaining units.
Note c: The decision was made to retire Buck 5 & 6 and Riverbend 6 & 7 early on April 1, 2013. The original
expected retirement date was April 15, 2015.
Note d: Lee Steam Units 1 and 2 were retired November 6, 2014.
Note e: The conversion of the Lee 3 coal unit to a natural gas unit was effective March 12, 2015.
Planning Assumptions – Unit Retirements
Unit & Plant Name Location
Winter
Capacity
(MW)
Summer
Capacity (MW)
Fuel
Type
Expected
Retirement
Allen 1a Belmont, NC 167 162 Coal 12/2024
Allen 2a Belmont, NC 167 162 Coal 12/2024
Allen 3a Belmont, NC 270 261 Coal 12/2024
Allen 4a Belmont, NC 282 276 Coal 6/2028
Allen 5a Belmont, NC 275 266 Coal 6/2028
Oconee 1b,c
Seneca, SC 865 847 Nuclear 5/2033
Oconee 2b,c
Seneca, SC 872 848 Nuclear 5/2033
Oconee 3b,c
Seneca, SC 881 859 Nuclear 5/2033
Total 3,779 3,681
Note a: Retirement assumptions are for planning purposes only; dates are based on useful life expectations of the unit.
Note b: Nuclear retirements for planning purposes are based on the end of current operating license.
Note c: Oconee capacity includes scheduled uprates (15 MW/unit).
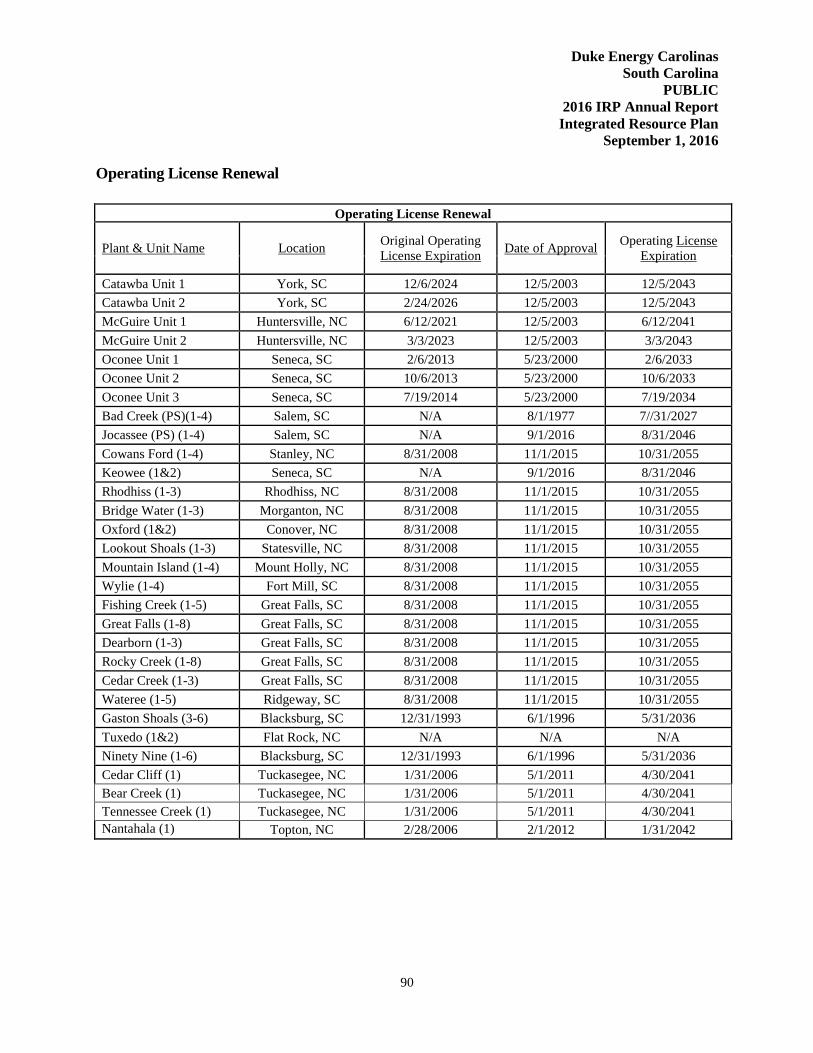
Duke Energy Carolinas
South Carolina
PUBLIC
2016 IRP Annual Report
Integrated Resource Plan
September 1, 2016
90
Operating License Renewal
Operating License Renewal
Plant & Unit Name Location Original Operating
License Expiration Date of Approval
Operating License
Expiration
Catawba Unit 1 York, SC 12/6/2024 12/5/2003 12/5/2043
Catawba Unit 2 York, SC 2/24/2026 12/5/2003 12/5/2043
McGuire Unit 1 Huntersville, NC 6/12/2021 12/5/2003 6/12/2041
McGuire Unit 2 Huntersville, NC 3/3/2023 12/5/2003 3/3/2043
Oconee Unit 1 Seneca, SC 2/6/2013 5/23/2000 2/6/2033
Oconee Unit 2 Seneca, SC 10/6/2013 5/23/2000 10/6/2033
Oconee Unit 3 Seneca, SC 7/19/2014 5/23/2000 7/19/2034
Bad Creek (PS)(1-4) Salem, SC N/A 8/1/1977 7//31/2027
Jocassee (PS) (1-4) Salem, SC N/A 9/1/2016 8/31/2046
Cowans Ford (1-4) Stanley, NC 8/31/2008 11/1/2015 10/31/2055
Keowee (1&2) Seneca, SC N/A 9/1/2016 8/31/2046
Rhodhiss (1-3) Rhodhiss, NC 8/31/2008 11/1/2015 10/31/2055
Bridge Water (1-3) Morganton, NC 8/31/2008 11/1/2015 10/31/2055
Oxford (1&2) Conover, NC 8/31/2008 11/1/2015 10/31/2055
Lookout Shoals (1-3) Statesville, NC 8/31/2008 11/1/2015 10/31/2055
Mountain Island (1-4) Mount Holly, NC 8/31/2008 11/1/2015 10/31/2055
Wylie (1-4) Fort Mill, SC 8/31/2008 11/1/2015 10/31/2055
Fishing Creek (1-5) Great Falls, SC 8/31/2008 11/1/2015 10/31/2055
Great Falls (1-8) Great Falls, SC 8/31/2008 11/1/2015 10/31/2055
Dearborn (1-3) Great Falls, SC 8/31/2008 11/1/2015 10/31/2055
Rocky Creek (1-8) Great Falls, SC 8/31/2008 11/1/2015 10/31/2055
Cedar Creek (1-3) Great Falls, SC 8/31/2008 11/1/2015 10/31/2055
Wateree (1-5) Ridgeway, SC 8/31/2008 11/1/2015 10/31/2055
Gaston Shoals (3-6) Blacksburg, SC 12/31/1993 6/1/1996 5/31/2036
Tuxedo (1&2) Flat Rock, NC N/A N/A N/A
Ninety Nine (1-6) Blacksburg, SC 12/31/1993 6/1/1996 5/31/2036
Cedar Cliff (1) Tuckasegee, NC 1/31/2006 5/1/2011 4/30/2041
Bear Creek (1) Tuckasegee, NC 1/31/2006 5/1/2011 4/30/2041
Tennessee Creek (1) Tuckasegee, NC 1/31/2006 5/1/2011 4/30/2041
Nantahala (1) Topton, NC 2/28/2006 2/1/2012 1/31/2042
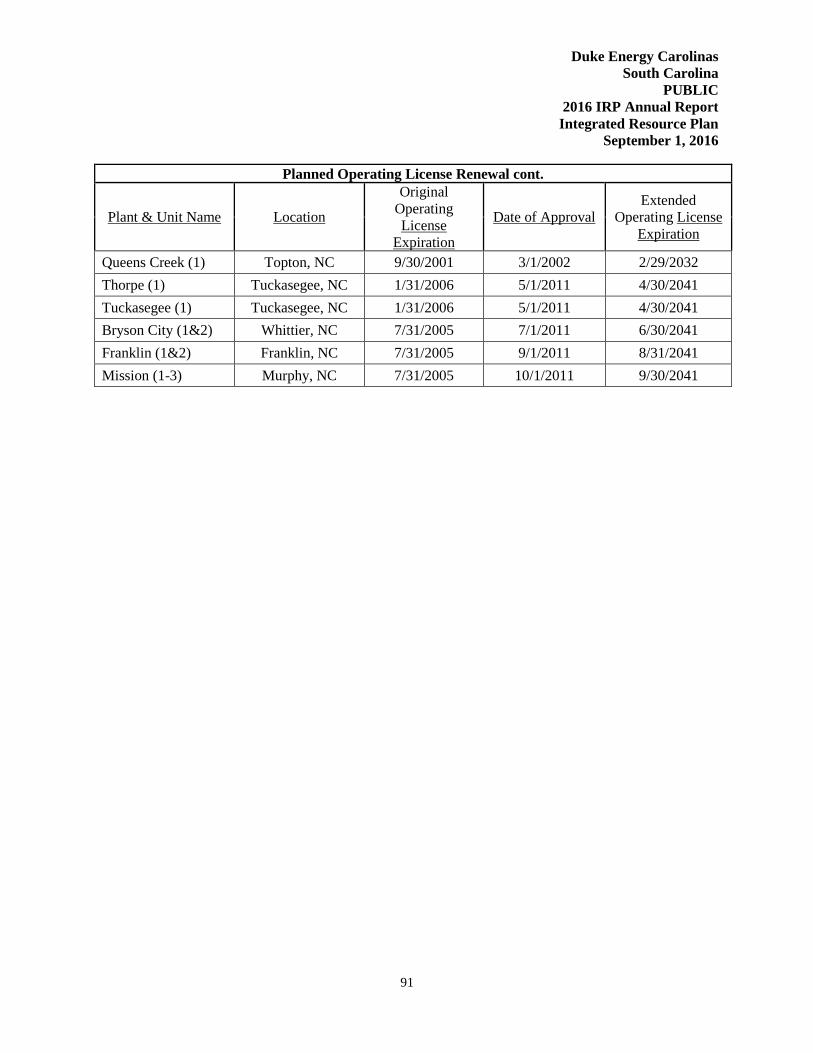
Duke Energy Carolinas
South Carolina
PUBLIC
2016 IRP Annual Report
Integrated Resource Plan
September 1, 2016
91
Planned Operating License Renewal cont.
Plant & Unit Name Location
Original
Operating
License
Expiration
Date of Approval
Extended
Operating License
Expiration
Queens Creek (1) Topton, NC 9/30/2001 3/1/2002 2/29/2032
Thorpe (1) Tuckasegee, NC 1/31/2006 5/1/2011 4/30/2041
Tuckasegee (1) Tuckasegee, NC 1/31/2006 5/1/2011 4/30/2041
Bryson City (1&2) Whittier, NC 7/31/2005 7/1/2011 6/30/2041
Franklin (1&2) Franklin, NC 7/31/2005 9/1/2011 8/31/2041
Mission (1-3) Murphy, NC 7/31/2005 10/1/2011 9/30/2041

Duke Energy Carolinas
South Carolina
PUBLIC
2016 IRP Annual Report
Integrated Resource Plan
September 1, 2016
92
APPENDIX C: ELECTRIC LOAD FORECAST
Methodology
The Duke Energy Carolinas’ Spring 2016 Forecast provides projections of the energy and peak
demand needs for its service area. The forecast covers the time period of 2017 – 2031 and represent
the needs of the following customer classes:
• Residential
• Commercial
• Industrial
• Other Retail
• Wholesale
Energy projections are developed with econometric models using key economic factors such as
income, electricity prices, industrial production indices, along with weather, appliance efficiency
trends, rooftop solar trends, and electric vehicle trends. Population is also used in the Residential
customer model. DEC has used regression analysis since 1979 and this technique has yielded
consistently reasonable results over the years.
The economic projections used in the Spring 2016 Forecast are obtained from Moody’s Analytics, a
nationally recognized economic forecasting firm, and include economic forecasts for the states of
North Carolina and South Carolina.
The Retail forecast consists of the three major classes: Residential, Commercial and Industrial.
The Residential class sales forecast is comprised of two projections. The first is the number of
residential customers, which is driven by population. The second is energy usage per customer,
which is driven by weather, regional economic and demographic trends, electric price and appliance
efficiencies.
The usage per customer forecast was derived using a Statistical Adjusted End-Use Model. This is a
regression based framework that uses projected appliance saturation and efficiency trends developed
by Itron using EIA data. It incorporates naturally occurring efficiency trends and government
mandates more explicitly than other models. The outlook for usage per customer is slightly negative
to flat through much of the forecast horizon, so most of the growth is primarily due to customer
Duke Energy Carolinas
South Carolina
PUBLIC
2016 IRP Annual Report
Integrated Resource Plan
September 1, 2016
93
increases. The projected growth rate of Residential in the Spring 2016 Forecast after all adjustments
for Utility Energy Efficiency programs, Solar and Electric Vehicles from 2017-2031 is 1.2%.
The Commercial forecast also uses an SAE model in an effort to reflect naturally occurring as well
as government mandated efficiency changes. The three largest sectors in the Commercial class are
Offices, Education and Retail. Commercial is expected to be the fastest growing Class, with a
projected growth rate of 1.3%, after all adjustments.
The Industrial class is forecasted by a standard econometric model, with drivers such as total
manufacturing output, textile output, and the price of electricity. Overall, Industrial sales are
expected to grow 0.9% over the forecast horizon, after all adjustments.
County population projections are obtained from the North Carolina Office of State Budget and
Management as well as the South Carolina Budget and Control Board. These are then used to derive
the total population forecast for the 51 counties that comprise the DEC service area.
Weather impacts are incorporated into the models by using Heating Degree Days and Cooling
Degree Days with a base temperature of 65. The forecast of degree days is based on a 30-year
average, which is updated every year.
The appliance saturation and efficiency rends are developed by Itron using data from the EIA. Itron
is a recognized firm providing forecasting services to the electric utility industry. These appliance
trends are used in the residential and commercial sales models.
Peak demands were projected using the SAE approach in the Spring 2016 Forecast. The peak
forecast was developed using a monthly SAE model, similar to the sales SAE models, which
includes monthly appliance saturations and efficiencies, interacted with weather and the fraction of
each appliance type that is in use at the time of monthly peak.
Assumptions
Below are the projected average annual growth rates of several key drivers from DEC’s Spring
2016 Forecast.

Duke Energy Carolinas
South Carolina
PUBLIC
2016 IRP Annual Report
Integrated Resource Plan
September 1, 2016
94
2017-2031
Real Income 2.9%
Mfg. IPI 1.8%
Population 1.0%
In addition to economic, demographic, and efficiency trends, the forecast also incorporates the
expected impacts of UEE, as well as projected effects of electric vehicles and behind the meter solar
technology.
Wholesale
For a description of the Wholesale forecast, please see Appendix H.
Historical Values
It should be noted that long-term structurally decline of the Textile industry and the recession of
2008-2009 have had an adverse impact on DEC sales. The worst of the Textile decline appears to
be over, and Moody’s Analytics expects the Carolina’s economy to show solid growth going
forward.
In tables C-1 and C-2 below the history of DEC customers and sales are given. As a note, the values
in Table C-2 are not weather adjusted.
Table C-1 Retail Customers (Thousands, Annual Average)
2006 2007 2008 2009 2010 2011 2012 2013 2014 2015
Residential 1,877 1,916 2,012 2,024 2,034 2,041 2,053 2,068 2,089 2,117
Commercial 317 322 334 331 333 335 337 339 342 345
Industrial 7 7 7 7 7 7 7 7 7 6
Other 13 13 14 14 14 14 14 14 15 15
Total 2,214 2,259 2,367 2,377 2,389 2,397 2,411 2,428 2,452 2,452
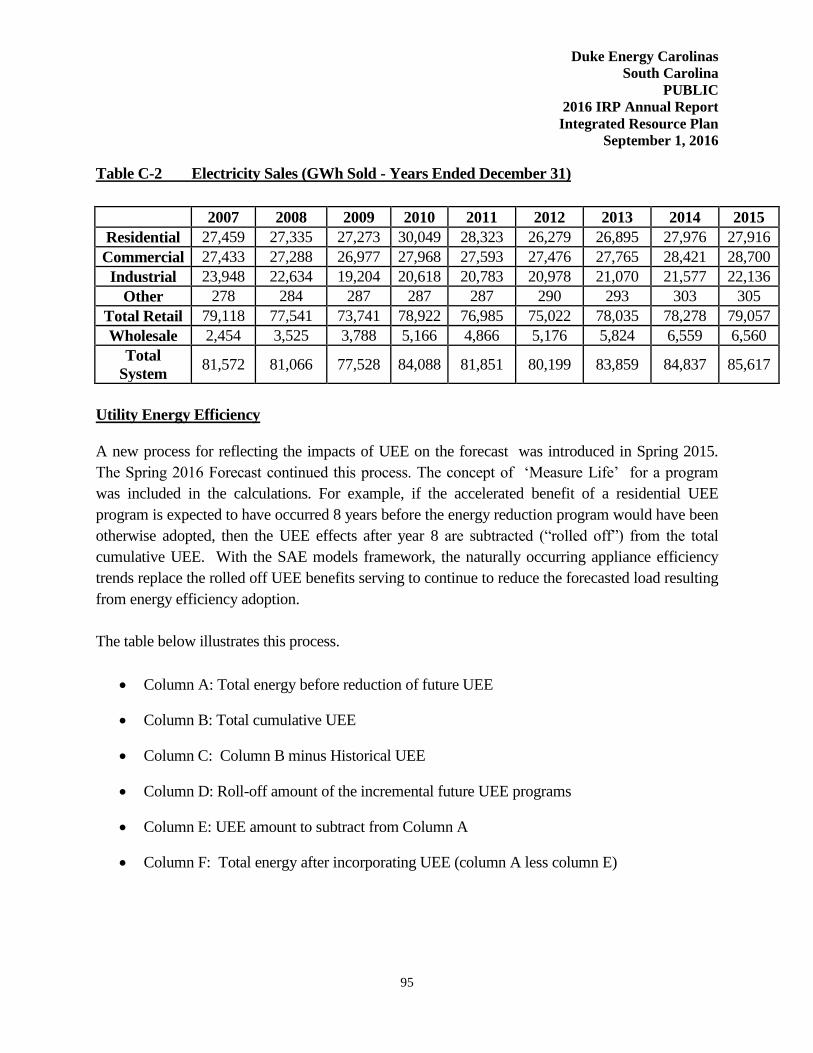
Duke Energy Carolinas
South Carolina
PUBLIC
2016 IRP Annual Report
Integrated Resource Plan
September 1, 2016
95
Table C-2 Electricity Sales (GWh Sold - Years Ended December 31)
2007 2008 2009 2010 2011 2012 2013 2014 2015
Residential 27,459 27,335 27,273 30,049 28,323 26,279 26,895 27,976 27,916
Commercial 27,433 27,288 26,977 27,968 27,593 27,476 27,765 28,421 28,700
Industrial 23,948 22,634 19,204 20,618 20,783 20,978 21,070 21,577 22,136
Other 278 284 287 287 287 290 293 303 305
Total Retail 79,118 77,541 73,741 78,922 76,985 75,022 78,035 78,278 79,057
Wholesale 2,454 3,525 3,788 5,166 4,866 5,176 5,824 6,559 6,560
Total
System 81,572 81,066 77,528 84,088 81,851 80,199 83,859 84,837 85,617
Utility Energy Efficiency
A new process for reflecting the impacts of UEE on the forecast was introduced in Spring 2015.
The Spring 2016 Forecast continued this process. The concept of ‘Measure Life’ for a program
was included in the calculations. For example, if the accelerated benefit of a residential UEE
program is expected to have occurred 8 years before the energy reduction program would have been
otherwise adopted, then the UEE effects after year 8 are subtracted (“rolled off”) from the total
cumulative UEE. With the SAE models framework, the naturally occurring appliance efficiency
trends replace the rolled off UEE benefits serving to continue to reduce the forecasted load resulting
from energy efficiency adoption.
The table below illustrates this process.
Column A: Total energy before reduction of future UEE
Column B: Total cumulative UEE
Column C: Column B minus Historical UEE
Column D: Roll-off amount of the incremental future UEE programs
Column E: UEE amount to subtract from Column A
Column F: Total energy after incorporating UEE (column A less column E)

Duke Energy Carolinas
South Carolina
PUBLIC
2016 IRP Annual Report
Integrated Resource Plan
September 1, 2016
96
Table C-3 UEE Program Life Process (MWh)
Results
A tabulation of class forecasts of customers and sales are given in Table C-4 and Table C-5. The
sales forecasts are after all adjustments for UEE, Solar and Electric Vehicles, and are at the
customer meter, excluding Wholesale.
A tabulation of the utility’s forecasts, including peak loads for summer and winter seasons of each
year and annual energy forecasts, both with and without the impact of UEE programs, are shown
below in Tables C-6 and C-7. These projections are at generation and include Wholesale. Load
duration curves, with and without UEE programs are shown as Charts C-1 and C-2.
The values in these tables reflect the loads that Duke Energy Carolinas is contractually obligated to
provide and cover the period from 2017 to 2031.
For the period 2017-2031, the Spring 2016 Forecast projects an average annual compound growth
rate of 1.3% for summer peaks and 1.4% for winter peaks. These rates do not reflect the impacts of
A B C D E F
Forecast Total Column B Roll-Off UEE to Subtract Forecast
Before UEE Cumulative UEE Less Historical UEE Forecasted UEE From Forecast After UEE
2017 98,044 3,148 573 0 573 97,470
2018 99,287 3,472 942 0 942 98,345
2019 99,409 3,782 1,278 0 1,278 98,131
2020 100,736 4,087 1,605 0 1,605 99,132
2021 101,902 4,392 1,929 0 1,929 99,973
2022 102,883 4,697 2,253 0 2,253 100,630
2023 104,249 5,002 2,576 3 2,573 101,676
2024 105,784 5,307 2,897 15 2,882 102,902
2025 107,033 5,613 3,205 62 3,143 103,890
2026 108,442 5,918 3,499 135 3,365 105,078
2027 109,734 6,223 3,793 314 3,480 106,255
2028 111,136 6,528 4,099 608 3,490 107,646
2029 112,299 6,833 4,404 899 3,504 108,794
2030 113,596 7,138 4,709 1,187 3,522 110,074
2031 114,949 7,444 5,014 1,472 3,542 111,407
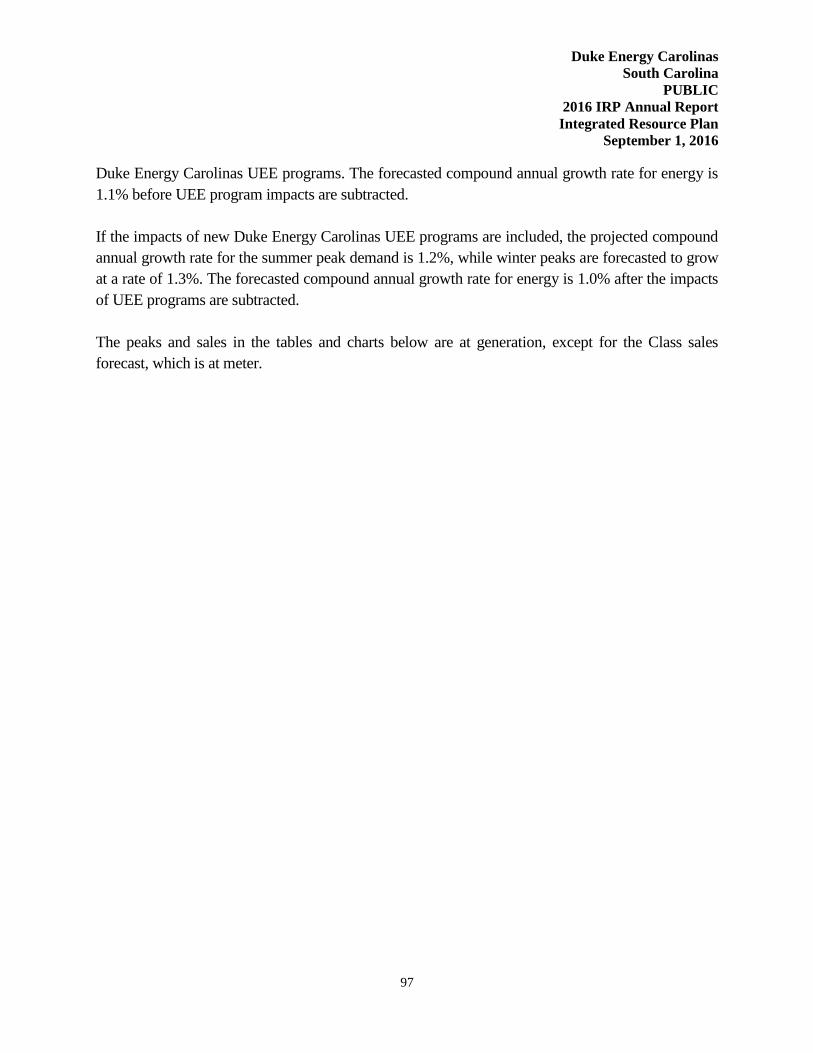
Duke Energy Carolinas
South Carolina
PUBLIC
2016 IRP Annual Report
Integrated Resource Plan
September 1, 2016
97
Duke Energy Carolinas UEE programs. The forecasted compound annual growth rate for energy is
1.1% before UEE program impacts are subtracted.
If the impacts of new Duke Energy Carolinas UEE programs are included, the projected compound
annual growth rate for the summer peak demand is 1.2%, while winter peaks are forecasted to grow
at a rate of 1.3%. The forecasted compound annual growth rate for energy is 1.0% after the impacts
of UEE programs are subtracted.
The peaks and sales in the tables and charts below are at generation, except for the Class sales
forecast, which is at meter.
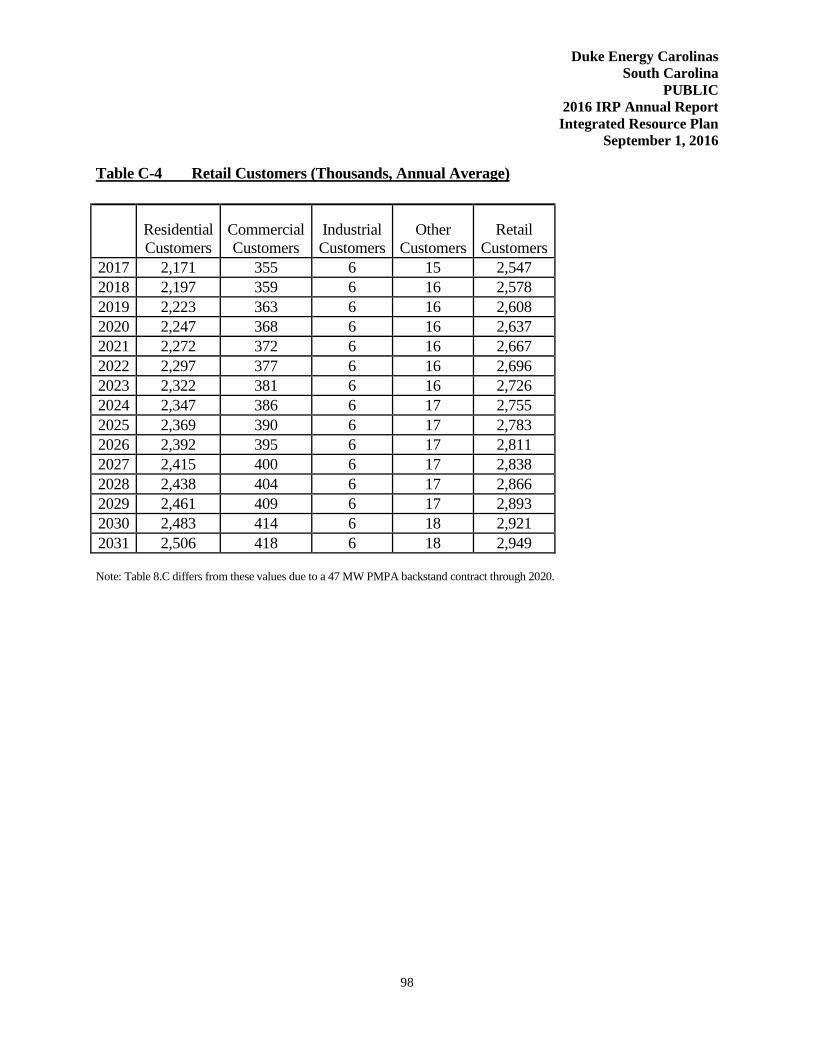
Duke Energy Carolinas
South Carolina
PUBLIC
2016 IRP Annual Report
Integrated Resource Plan
September 1, 2016
98
Table C-4 Retail Customers (Thousands, Annual Average)
Residential
Customers
Commercial
Customers
Industrial
Customers
Other
Customers
Retail
Customers
2017 2,171 355 6 15 2,547
2018 2,197 359 6 16 2,578
2019 2,223 363 6 16 2,608
2020 2,247 368 6 16 2,637
2021 2,272 372 6 16 2,667
2022 2,297 377 6 16 2,696
2023 2,322 381 6 16 2,726
2024 2,347 386 6 17 2,755
2025 2,369 390 6 17 2,783
2026 2,392 395 6 17 2,811
2027 2,415 400 6 17 2,838
2028 2,438 404 6 17 2,866
2029 2,461 409 6 17 2,893
2030 2,483 414 6 18 2,921
2031 2,506 418 6 18 2,949
Note: Table 8.C differs from these values due to a 47 MW PMPA backstand contract through 2020.
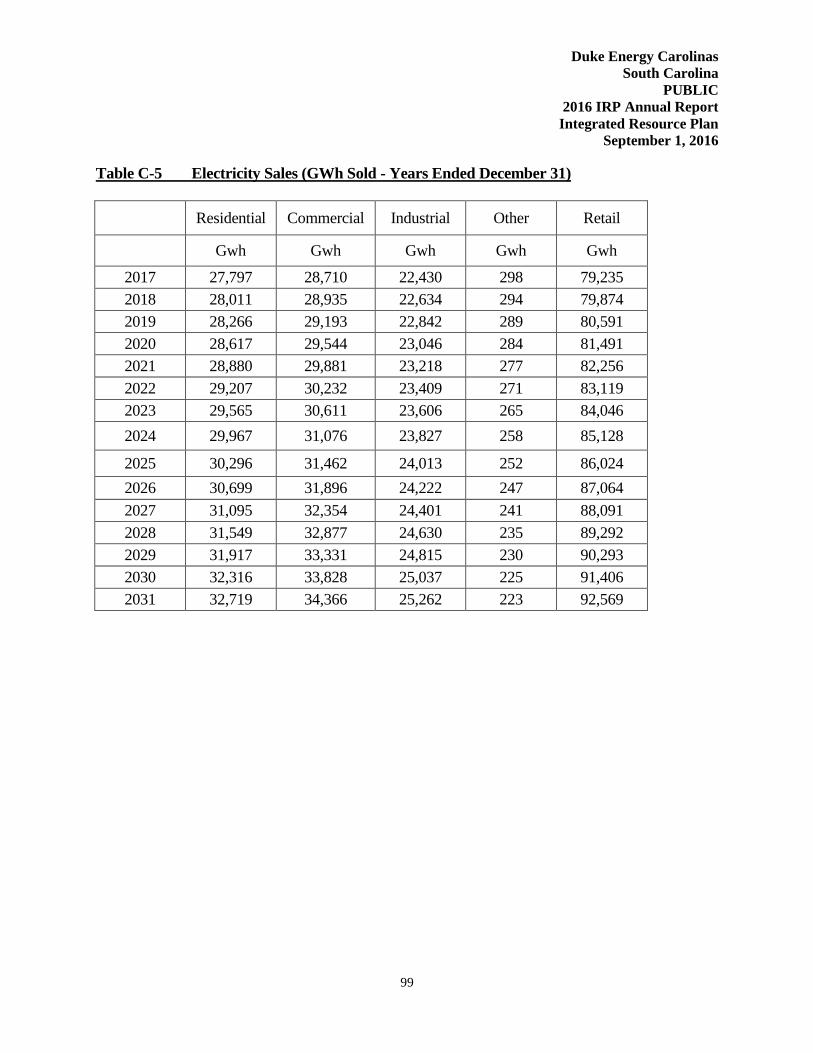
Duke Energy Carolinas
South Carolina
PUBLIC
2016 IRP Annual Report
Integrated Resource Plan
September 1, 2016
99
Table C-5 Electricity Sales (GWh Sold - Years Ended December 31)
Residential Commercial Industrial Other Retail
Gwh Gwh Gwh Gwh Gwh
2017 27,797 28,710 22,430 298 79,235
2018 28,011 28,935 22,634 294 79,874
2019 28,266 29,193 22,842 289 80,591
2020 28,617 29,544 23,046 284 81,491
2021 28,880 29,881 23,218 277 82,256
2022 29,207 30,232 23,409 271 83,119
2023 29,565 30,611 23,606 265 84,046
2024 29,967 31,076 23,827 258 85,128
2025 30,296 31,462 24,013 252 86,024
2026 30,699 31,896 24,222 247 87,064
2027 31,095 32,354 24,401 241 88,091
2028 31,549 32,877 24,630 235 89,292
2029 31,917 33,331 24,815 230 90,293
2030 32,316 33,828 25,037 225 91,406
2031 32,719 34,366 25,262 223 92,569
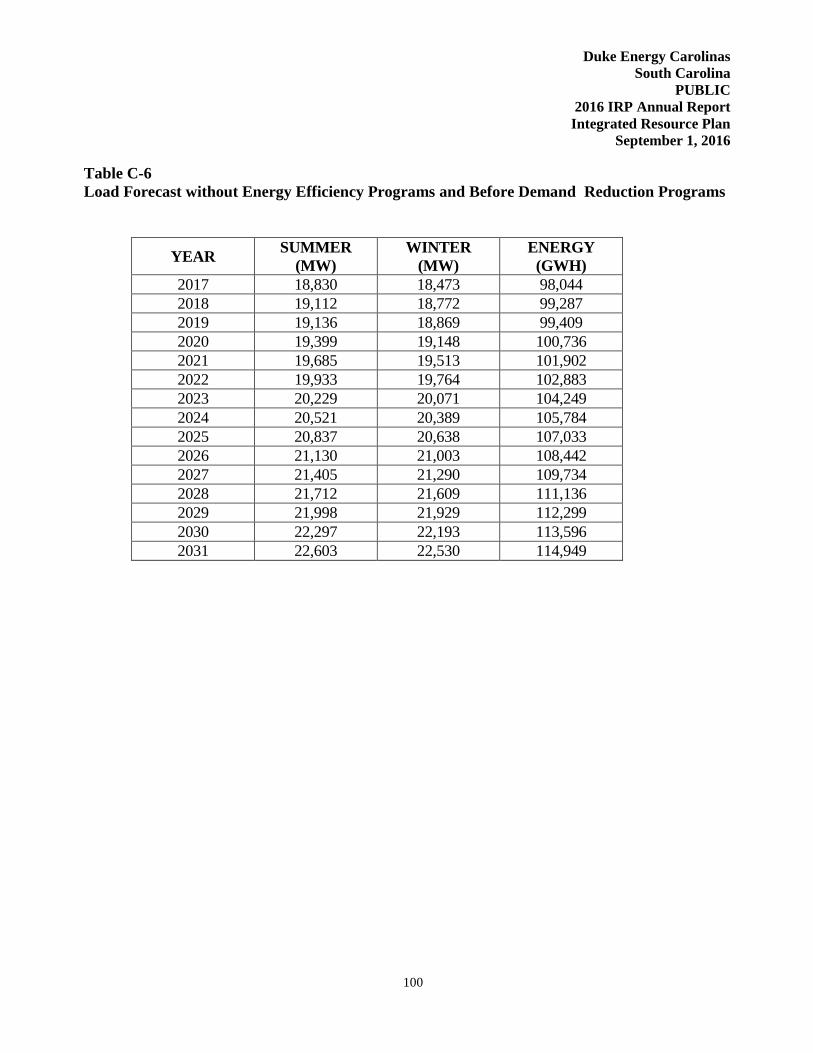
Duke Energy Carolinas
South Carolina
PUBLIC
2016 IRP Annual Report
Integrated Resource Plan
September 1, 2016
100
Table C-6
Load Forecast without Energy Efficiency Programs and Before Demand Reduction Programs
YEAR SUMMER
(MW)
WINTER
(MW)
ENERGY
(GWH)
2017 18,830 18,473 98,044
2018 19,112 18,772 99,287
2019 19,136 18,869 99,409
2020 19,399 19,148 100,736
2021 19,685 19,513 101,902
2022 19,933 19,764 102,883
2023 20,229 20,071 104,249
2024 20,521 20,389 105,784
2025 20,837 20,638 107,033
2026 21,130 21,003 108,442
2027 21,405 21,290 109,734
2028 21,712 21,609 111,136
2029 21,998 21,929 112,299
2030 22,297 22,193 113,596
2031 22,603 22,530 114,949

Duke Energy Carolinas
South Carolina
PUBLIC
2016 IRP Annual Report
Integrated Resource Plan
September 1, 2016
101
Chart C-1
Load Duration Curve without Energy Efficiency Programs and Before Demand Reduction Programs

Duke Energy Carolinas
South Carolina
PUBLIC
2016 IRP Annual Report
Integrated Resource Plan
September 1, 2016
102
Table C-7
Load Forecast with Energy Efficiency Programs and Before Demand Reduction Programs
YEAR SUMMER WINTER ENERGY
(MW) (MW) (GWH)
2017 18,729 18,416 97,470
2018 18,948 18,665 98,345
2019 18,916 18,721 98,131
2020 19,127 18,957 99,132
2021 19,362 19,259 99,973
2022 19,562 19,466 100,630
2023 19,804 19,731 101,676
2024 20,046 20,011 102,902
2025 20,321 20,223 103,890
2026 20,581 20,570 105,078
2027 20,842 20,844 106,255
2028 21,146 21,161 107,646
2029 21,427 21,478 108,794
2030 21,723 21,734 110,074
2031 22,028 22,068 111,407

Duke Energy Carolinas
South Carolina
PUBLIC
2016 IRP Annual Report
Integrated Resource Plan
September 1, 2016
103
Chart C-2
Load Duration Curve with Energy Efficiency Programs & Before Demand Reduction Programs

Duke Energy Carolinas
South Carolina
PUBLIC
2016 IRP Annual Report
Integrated Resource Plan
September 1, 2016
104
APPENDIX D: ENERGY EFFICIENCY AND DEMAND SIDE MANAGEMENT
Current Energy Efficiency and Demand-Side Management Programs
DEC uses EE and DSM programs in its IRP to efficiently and cost-effectively alter customer
demands and reduce the long-run supply costs for energy and peak demand. These programs can
vary greatly in their dispatch characteristics, size and duration of load response, certainty of load
response, and level and frequency of customer participation. In general, programs are offered in
two primary categories: EE programs that reduce energy consumption and DSM programs that
reduce peak demand (demand-side management or demand response programs and certain rate
structure programs). Following are the EE and DSM programs available through DEC as of
December 31, 2015:
Residential Customer Programs
Appliance Recycling Program
Energy Assessments Program
Energy Efficiency Education Program
Energy Efficient Appliances and Devices
Heating, Ventilation and Air Conditioning (HVAC) Energy Efficiency Program
Multi-Family Energy Efficiency Program
My Home Energy Report
Income-Qualified Energy Efficiency and Weatherization Program
Power Manager
Non-Residential Customer Programs
Non-Residential Smart $aver® Energy Efficient Food Service Products Program
Non-Residential Smart $aver® Energy Efficient HVAC Products Program
Non-Residential Smart $aver® Energy Efficient IT Products Program
Non-Residential Smart $aver ®Energy Efficient Lighting Products Program
Non-Residential Smart $aver® Energy Efficient Process Equipment Products Program
Non-Residential Smart $aver® Energy Efficient Pumps and Drives Products Program
Non-Residential Smart $aver® Custom Program
Non-Residential Smart $aver® Custom Energy Assessments Program
Small Business Energy Saver
Smart Energy in Offices
PowerShare®

Duke Energy Carolinas
South Carolina
PUBLIC
2016 IRP Annual Report
Integrated Resource Plan
September 1, 2016
105
PowerShare® CallOption
EnergyWiseSM
for Business
In addition, based on feedback from stakeholders, the Company has developed a pilot program
for non-residential customers that has received Commission approval and the expected impacts
are included in this IRP analysis.
Pilot Program
Business Energy Report Pilot
Energy Efficiency Programs
Energy Efficiency programs are typically non-dispatchable education or incentive-based programs.
Energy and capacity savings are achieved by changing customer behavior or through the installation
of more energy-efficient equipment or structures. All cumulative effects (gross of Free Riders, at
the Plant11
) since the inception of these existing programs through the end of 2015 are summarized
below. Please note that the cumulative impacts listed below include the impact of any Measurement
and Verification performed since program inception and also note that a “Participant” in the
information included below is based on the unit of measure for specific energy efficiency measure
(e.g. number of bulbs, kWh of savings, tons of refrigeration, etc.), and may not be the same as the
number of customers that actually participate in these programs. The following provides more detail
on DEC’s existing EE programs:
Residential Programs
Appliance Recycling Program promotes the removal and responsible disposal of operating
refrigerators and freezers from DEC residential customers. The refrigerator or freezer must have
a capacity of at least 10 cubic feet but not more than 30 cubic feet. The Program recycles
approximately 95% of the material from the harvested appliances.
The implementation vendor for this program abruptly discontinued operations in November
2015. As a result, the program is not currently being offered to customers and future potential
impacts associated with this program beyond 2016 were not included in this IRP analysis.
11
“Gross of Free Riders” means that the impacts associated with the EE programs have not been reduced for the
impact of Free Riders. “At the Plant” means that the impacts associated with the EE programs have been increased
to include line losses.
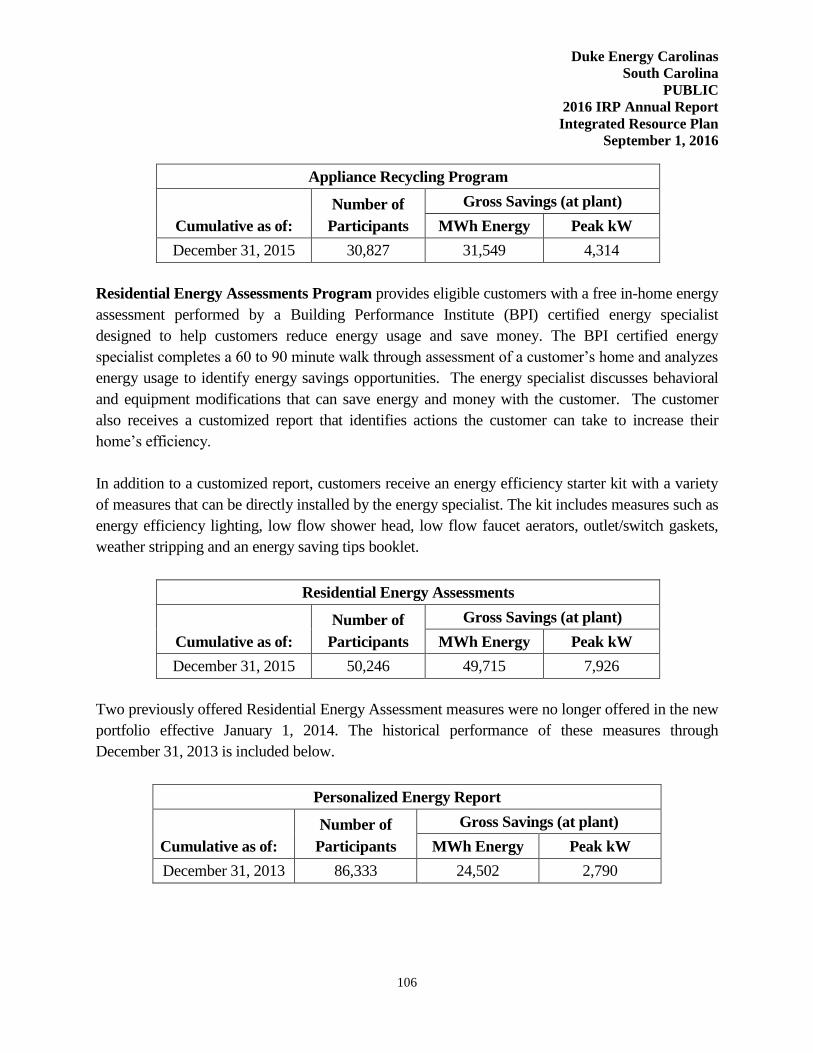
Duke Energy Carolinas
South Carolina
PUBLIC
2016 IRP Annual Report
Integrated Resource Plan
September 1, 2016
106
Appliance Recycling Program
Number of Gross Savings (at plant)
Cumulative as of: Participants MWh Energy Peak kW
December 31, 2015 30,827 31,549 4,314
Residential Energy Assessments Program provides eligible customers with a free in-home energy
assessment performed by a Building Performance Institute (BPI) certified energy specialist
designed to help customers reduce energy usage and save money. The BPI certified energy
specialist completes a 60 to 90 minute walk through assessment of a customer’s home and analyzes
energy usage to identify energy savings opportunities. The energy specialist discusses behavioral
and equipment modifications that can save energy and money with the customer. The customer
also receives a customized report that identifies actions the customer can take to increase their
home’s efficiency.
In addition to a customized report, customers receive an energy efficiency starter kit with a variety
of measures that can be directly installed by the energy specialist. The kit includes measures such as
energy efficiency lighting, low flow shower head, low flow faucet aerators, outlet/switch gaskets,
weather stripping and an energy saving tips booklet.
Residential Energy Assessments
Number of Gross Savings (at plant)
Cumulative as of: Participants MWh Energy Peak kW
December 31, 2015 50,246 49,715 7,926
Two previously offered Residential Energy Assessment measures were no longer offered in the new
portfolio effective January 1, 2014. The historical performance of these measures through
December 31, 2013 is included below.
Personalized Energy Report
Number of Gross Savings (at plant)
Cumulative as of: Participants MWh Energy Peak kW
December 31, 2013 86,333 24,502 2,790
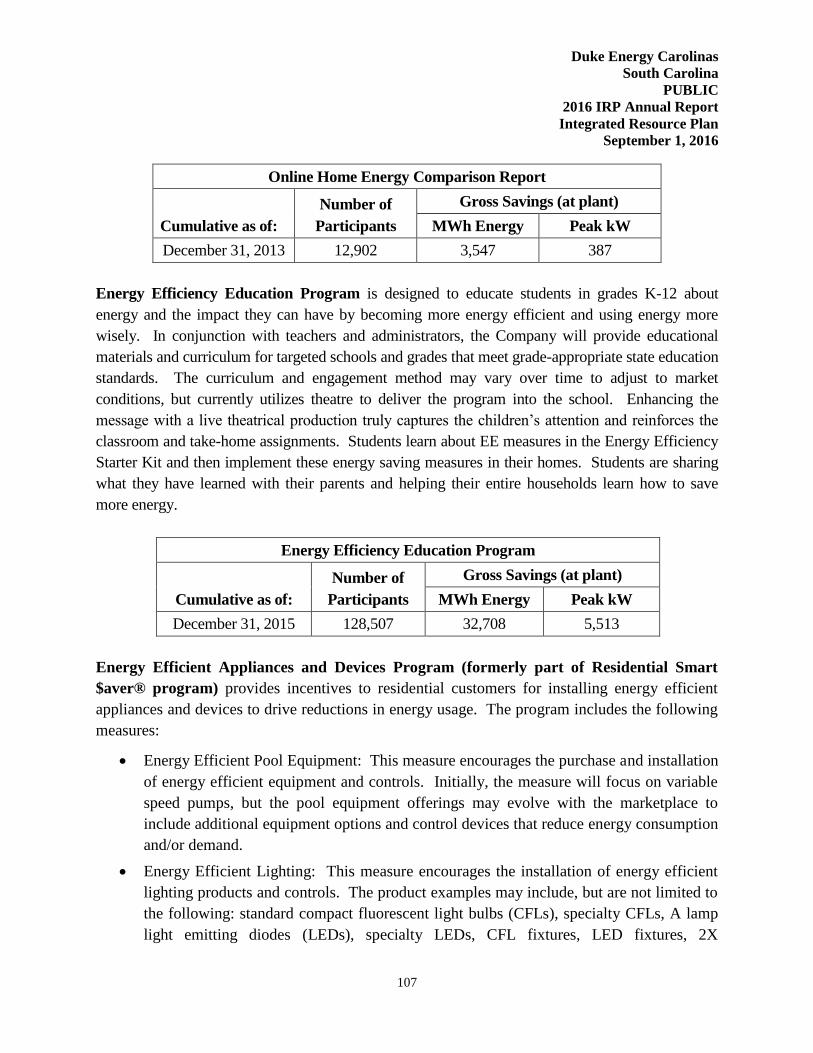
Duke Energy Carolinas
South Carolina
PUBLIC
2016 IRP Annual Report
Integrated Resource Plan
September 1, 2016
107
Online Home Energy Comparison Report
Number of Gross Savings (at plant)
Cumulative as of: Participants MWh Energy Peak kW
December 31, 2013 12,902 3,547 387
Energy Efficiency Education Program is designed to educate students in grades K-12 about
energy and the impact they can have by becoming more energy efficient and using energy more
wisely. In conjunction with teachers and administrators, the Company will provide educational
materials and curriculum for targeted schools and grades that meet grade-appropriate state education
standards. The curriculum and engagement method may vary over time to adjust to market
conditions, but currently utilizes theatre to deliver the program into the school. Enhancing the
message with a live theatrical production truly captures the children’s attention and reinforces the
classroom and take-home assignments. Students learn about EE measures in the Energy Efficiency
Starter Kit and then implement these energy saving measures in their homes. Students are sharing
what they have learned with their parents and helping their entire households learn how to save
more energy.
Energy Efficiency Education Program
Number of Gross Savings (at plant)
Cumulative as of: Participants MWh Energy Peak kW
December 31, 2015 128,507 32,708 5,513
Energy Efficient Appliances and Devices Program (formerly part of Residential Smart
$aver® program) provides incentives to residential customers for installing energy efficient
appliances and devices to drive reductions in energy usage. The program includes the following
measures:
Energy Efficient Pool Equipment: This measure encourages the purchase and installation
of energy efficient equipment and controls. Initially, the measure will focus on variable
speed pumps, but the pool equipment offerings may evolve with the marketplace to
include additional equipment options and control devices that reduce energy consumption
and/or demand.
Energy Efficient Lighting: This measure encourages the installation of energy efficient
lighting products and controls. The product examples may include, but are not limited to
the following: standard compact fluorescent light bulbs (CFLs), specialty CFLs, A lamp
light emitting diodes (LEDs), specialty LEDs, CFL fixtures, LED fixtures, 2X
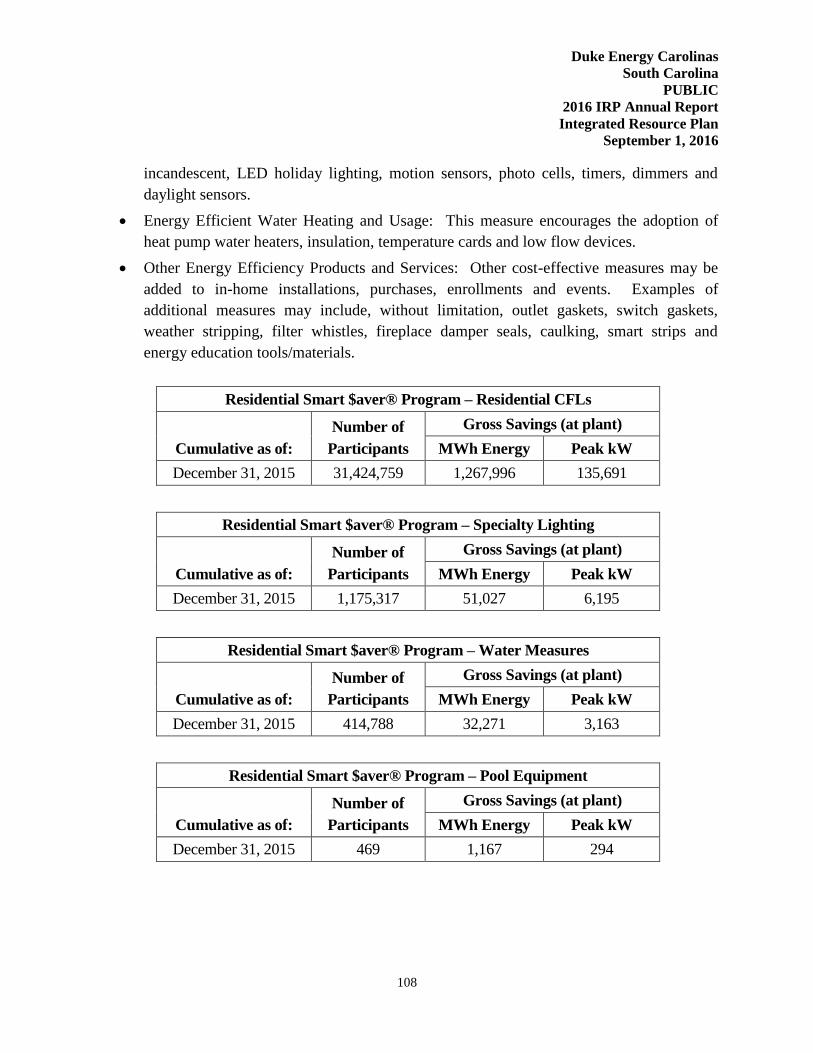
Duke Energy Carolinas
South Carolina
PUBLIC
2016 IRP Annual Report
Integrated Resource Plan
September 1, 2016
108
incandescent, LED holiday lighting, motion sensors, photo cells, timers, dimmers and
daylight sensors.
Energy Efficient Water Heating and Usage: This measure encourages the adoption of
heat pump water heaters, insulation, temperature cards and low flow devices.
Other Energy Efficiency Products and Services: Other cost-effective measures may be
added to in-home installations, purchases, enrollments and events. Examples of
additional measures may include, without limitation, outlet gaskets, switch gaskets,
weather stripping, filter whistles, fireplace damper seals, caulking, smart strips and
energy education tools/materials.
Residential Smart $aver® Program – Residential CFLs
Number of Gross Savings (at plant)
Cumulative as of: Participants MWh Energy Peak kW
December 31, 2015 31,424,759 1,267,996 135,691
Residential Smart $aver® Program – Specialty Lighting
Number of Gross Savings (at plant)
Cumulative as of: Participants MWh Energy Peak kW
December 31, 2015 1,175,317 51,027 6,195
Residential Smart $aver® Program – Water Measures
Number of Gross Savings (at plant)
Cumulative as of: Participants MWh Energy Peak kW
December 31, 2015 414,788 32,271 3,163
Residential Smart $aver® Program – Pool Equipment
Number of Gross Savings (at plant)
Cumulative as of: Participants MWh Energy Peak kW
December 31, 2015 469 1,167 294

Duke Energy Carolinas
South Carolina
PUBLIC
2016 IRP Annual Report
Integrated Resource Plan
September 1, 2016
109
Heating, Ventilation, and Air Conditioning (HVAC) Energy Efficiency Program (formerly
part of Residential Smart $aver® program) provides residential customers with opportunities
to lower their home’s electric use through maintenance and improvements to their central HVAC
system(s) as well as the structure of their home’s building envelope and duct system(s). This
program reaches Duke Energy Carolinas customers during the decision-making process for
measures included in the program. Each measure offered through the program will have a
prescribed incentive associated with successful completion by an approved contractor. The
prescriptive and a-la-carte design of the program allows customers to implement individual, high
priority measures in their homes without having to commit to multiple measures and higher price
tags. The measures eligible for incentives through the program are:
Central Air Conditioner
Heat Pump
Attic Insulation and Air Sealing
Duct Sealing
Duct Insulation
Central Air Conditioner Tune Up
Heat Pump Tune Up
As of the time of the analysis for this IRP, the cost effectiveness of this program had declined below
the allowable threshold and, as a result, projected impacts from this program were not included in
the analysis for this IRP. However, work is underway to improve the cost effectiveness and a
proposal was submitted and approved by the NC Public Staff (NCPS) and the SC Office of
Regulatory Staff (ORS) to implement a revised program design, subject to evaluation of the results
after the first year of the program.
Residential Smart $aver® Program -- HVAC
Number of Gross Savings (at plant)
Cumulative as of: Participants MWh Energy Peak kW
December 31, 2015 71,446 54,295 16,031
Residential Smart $aver® Program -- Tune and Seal
Number of Gross Savings (at plant)
Cumulative as of: Participants MWh Energy Peak kW
December 31, 2015 2,361 1,402 441
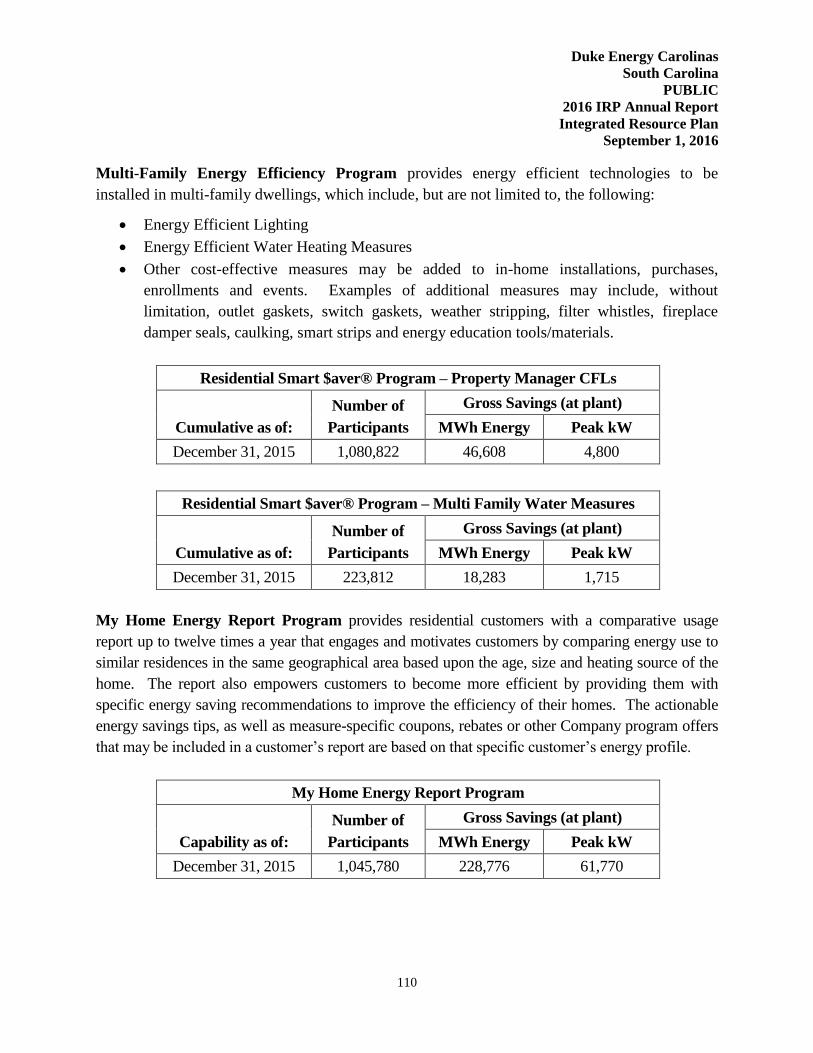
Duke Energy Carolinas
South Carolina
PUBLIC
2016 IRP Annual Report
Integrated Resource Plan
September 1, 2016
110
Multi-Family Energy Efficiency Program provides energy efficient technologies to be
installed in multi-family dwellings, which include, but are not limited to, the following:
Energy Efficient Lighting
Energy Efficient Water Heating Measures
Other cost-effective measures may be added to in-home installations, purchases,
enrollments and events. Examples of additional measures may include, without
limitation, outlet gaskets, switch gaskets, weather stripping, filter whistles, fireplace
damper seals, caulking, smart strips and energy education tools/materials.
Residential Smart $aver® Program – Property Manager CFLs
Number of Gross Savings (at plant)
Cumulative as of: Participants MWh Energy Peak kW
December 31, 2015 1,080,822 46,608 4,800
Residential Smart $aver® Program – Multi Family Water Measures
Number of Gross Savings (at plant)
Cumulative as of: Participants MWh Energy Peak kW
December 31, 2015 223,812 18,283 1,715
My Home Energy Report Program provides residential customers with a comparative usage
report up to twelve times a year that engages and motivates customers by comparing energy use to
similar residences in the same geographical area based upon the age, size and heating source of the
home. The report also empowers customers to become more efficient by providing them with
specific energy saving recommendations to improve the efficiency of their homes. The actionable
energy savings tips, as well as measure-specific coupons, rebates or other Company program offers
that may be included in a customer’s report are based on that specific customer’s energy profile.
My Home Energy Report Program
Number of Gross Savings (at plant)
Capability as of: Participants MWh Energy Peak kW
December 31, 2015 1,045,780 228,776 61,770

Duke Energy Carolinas
South Carolina
PUBLIC
2016 IRP Annual Report
Integrated Resource Plan
September 1, 2016
111
Income-Qualified Energy Efficiency and Weatherization Program consists of three distinct
components designed to provide EE to different segments of its low income customers:
The Residential Neighborhood Program (RNP) is available only to individually-metered
residences served by Duke Energy Carolinas in neighborhoods selected by the Company,
which are considered low-income based on third party and census data, which includes
income level and household size. Neighborhoods targeted for participation in this
program will typically have approximately 50% or more of the households with income
below 200% of the poverty level established by the U.S. Government. This approach
allows the Company to reach a larger audience of low income customers than traditional
government agency flow-through methods. The program provides customers with the
direct installation of measures into the home to increase the EE and comfort level of the
home. Additionally, customers receive EE education to encourage behavioral changes
for managing energy usage and costs.
The Company recognizes the existence of customers whose EE needs surpass the
standard low cost measure offerings provided through RNP. In order to accommodate
customers needing this more substantial assistance, the Company will also offer the
following two programs that are deployed in conjunction with the existing government-
funded North Carolina Weatherization Assistance Program when feasible. Collaborating
with these programs will result in a reduction of overhead and administration costs.
The Refrigerator Replacement Program (RRP) includes, but is not limited to, replacement
of inefficient operable refrigerators in low income households. The program will be
available to homeowners, renters, and landlords with income qualified tenants that own a
qualified appliance. Income eligibility for RRP will mirror the income eligibility
standards for the North Carolina Weatherization Assistance Program.
Income Qualified Energy Efficiency and Weatherization Program
Number of Gross Savings (at plant)
Cumulative as of: Participants MWh Energy Peak kW
December 31, 2015 32,122 14,343 2,341
Non-Residential
The Non-Residential Smart $aver® programs are listed separately below by technology but for
the purpose of reporting the historical performance, all of the historical impacts are combined
into a single Non-Residential Smart $aver® total.
Duke Energy Carolinas
South Carolina
PUBLIC
2016 IRP Annual Report
Integrated Resource Plan
September 1, 2016
112
Non-Residential Smart $aver® Energy Efficient Food Service Products Program provides
prescriptive incentive payments to non-residential customers to encourage and partially offset the
cost of the installation of new high efficiency food service equipment in new and existing non-
residential establishments and repairs to maintain or enhance efficiency levels in currently
installed equipment. Measures include, but are not limited to, commercial refrigerators and
freezers, steam cookers, pre-rinse sprayers, vending machine controllers, and anti-sweat heater
controls.
Non-Residential Smart $aver® Energy Efficient HVAC Products Program provides
prescriptive incentive payments to non-residential customers to encourage and partially offset the
cost of the installation of new high efficient HVAC equipment in new and existing non-
residential establishments and efficiency-directed repairs to maintain or enhance efficiency levels
in currently installed equipment. Measures include, but are not limited to, chillers, unitary and
rooftop air conditioners, programmable thermostats, and guest room energy management
systems.
Non-Residential Smart $aver® Energy Efficient Information Technologies (IT) Products
Program provides prescriptive incentive payments to non-residential customers to encourage
and partially offset the cost of the installation of high efficiency new IT equipment in new and
existing non-residential establishments and efficiency-directed repairs to maintain or enhance
efficiency levels in currently-installed equipment. Measures include, but are not limited to,
Energy Star-rated desktop computers and servers, PC power management from network, server
virtualization, variable frequency drives (VFD) for computer room air conditioners and VFD for
chilled water pumps.
Non-Residential Smart $aver® Energy Efficient Lighting Products Program provides
prescriptive incentive payments to non-residential customers to encourage and partially offset the
cost of the installation of new high efficiency lighting equipment in new and existing non-
residential establishments and the efficiency-directed repairs to maintain or enhance efficiency
levels in currently installed equipment. Measures include, but are not limited to, interior and
exterior LED lamps and fixtures, reduced wattage and high performance T8 systems, T8 and T5
high bay fixtures, and occupancy sensors.
Non-Residential Smart $aver® Energy Efficient Process Equipment Products Program
provides prescriptive incentive payments to non-residential customers to encourage and partially
offset the cost of the installation of new high efficiency equipment in new and existing non-
residential establishments and efficiency-directed repairs to maintain or enhance high efficiency
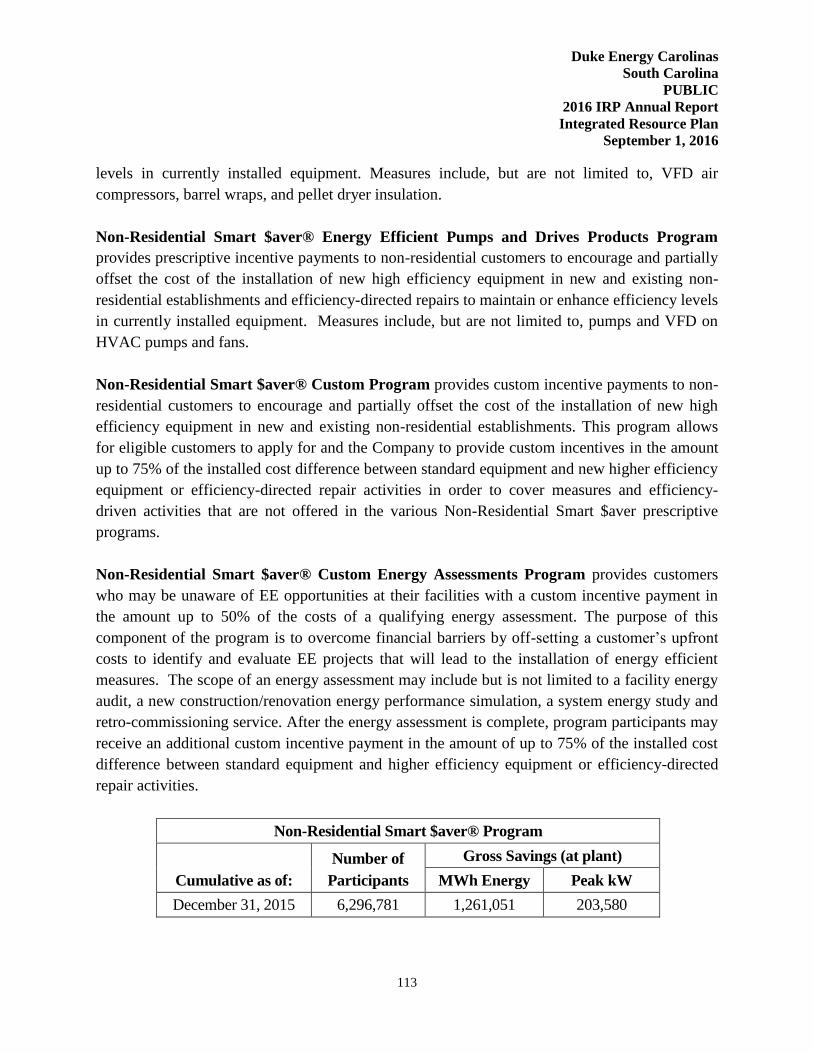
Duke Energy Carolinas
South Carolina
PUBLIC
2016 IRP Annual Report
Integrated Resource Plan
September 1, 2016
113
levels in currently installed equipment. Measures include, but are not limited to, VFD air
compressors, barrel wraps, and pellet dryer insulation.
Non-Residential Smart $aver® Energy Efficient Pumps and Drives Products Program
provides prescriptive incentive payments to non-residential customers to encourage and partially
offset the cost of the installation of new high efficiency equipment in new and existing non-
residential establishments and efficiency-directed repairs to maintain or enhance efficiency levels
in currently installed equipment. Measures include, but are not limited to, pumps and VFD on
HVAC pumps and fans.
Non-Residential Smart $aver® Custom Program provides custom incentive payments to non-
residential customers to encourage and partially offset the cost of the installation of new high
efficiency equipment in new and existing non-residential establishments. This program allows
for eligible customers to apply for and the Company to provide custom incentives in the amount
up to 75% of the installed cost difference between standard equipment and new higher efficiency
equipment or efficiency-directed repair activities in order to cover measures and efficiency-
driven activities that are not offered in the various Non-Residential Smart $aver prescriptive
programs.
Non-Residential Smart $aver® Custom Energy Assessments Program provides customers
who may be unaware of EE opportunities at their facilities with a custom incentive payment in
the amount up to 50% of the costs of a qualifying energy assessment. The purpose of this
component of the program is to overcome financial barriers by off-setting a customer’s upfront
costs to identify and evaluate EE projects that will lead to the installation of energy efficient
measures. The scope of an energy assessment may include but is not limited to a facility energy
audit, a new construction/renovation energy performance simulation, a system energy study and
retro-commissioning service. After the energy assessment is complete, program participants may
receive an additional custom incentive payment in the amount of up to 75% of the installed cost
difference between standard equipment and higher efficiency equipment or efficiency-directed
repair activities.
Non-Residential Smart $aver® Program
Number of Gross Savings (at plant)
Cumulative as of: Participants MWh Energy Peak kW
December 31, 2015 6,296,781 1,261,051 203,580
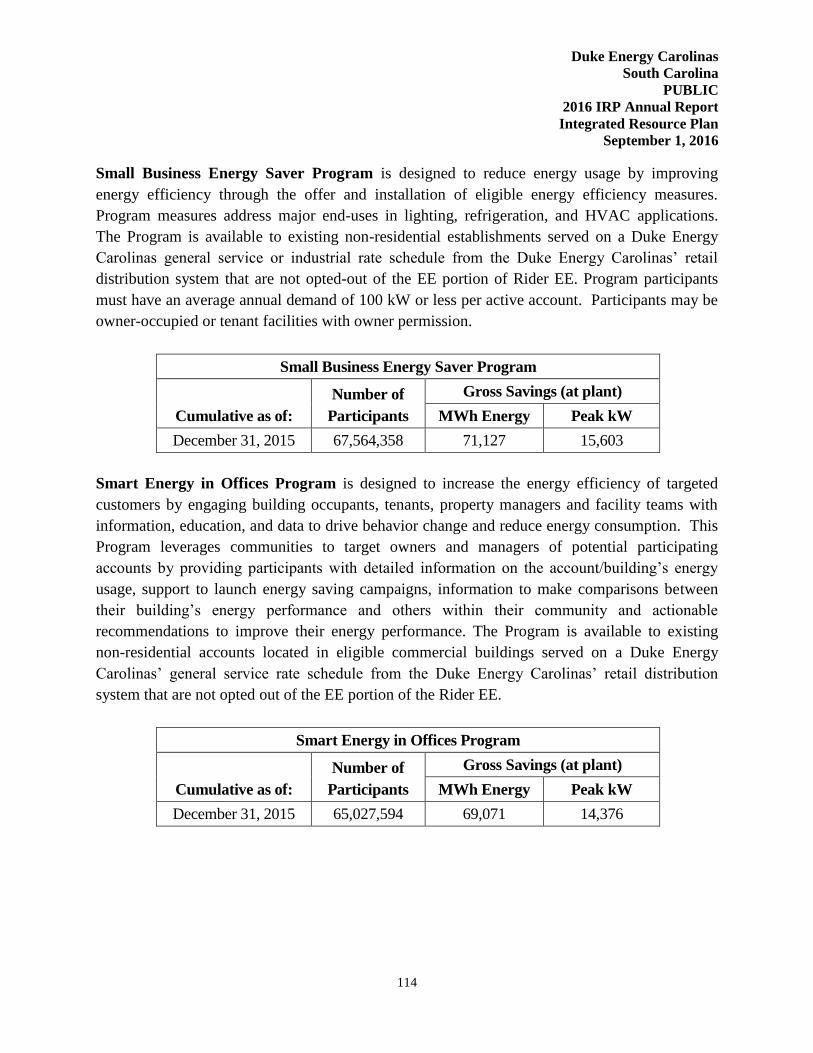
Duke Energy Carolinas
South Carolina
PUBLIC
2016 IRP Annual Report
Integrated Resource Plan
September 1, 2016
114
Small Business Energy Saver Program is designed to reduce energy usage by improving
energy efficiency through the offer and installation of eligible energy efficiency measures.
Program measures address major end-uses in lighting, refrigeration, and HVAC applications.
The Program is available to existing non-residential establishments served on a Duke Energy
Carolinas general service or industrial rate schedule from the Duke Energy Carolinas’ retail
distribution system that are not opted-out of the EE portion of Rider EE. Program participants
must have an average annual demand of 100 kW or less per active account. Participants may be
owner-occupied or tenant facilities with owner permission.
Small Business Energy Saver Program
Number of Gross Savings (at plant)
Cumulative as of: Participants MWh Energy Peak kW
December 31, 2015 67,564,358 71,127 15,603
Smart Energy in Offices Program is designed to increase the energy efficiency of targeted
customers by engaging building occupants, tenants, property managers and facility teams with
information, education, and data to drive behavior change and reduce energy consumption. This
Program leverages communities to target owners and managers of potential participating
accounts by providing participants with detailed information on the account/building’s energy
usage, support to launch energy saving campaigns, information to make comparisons between
their building’s energy performance and others within their community and actionable
recommendations to improve their energy performance. The Program is available to existing
non-residential accounts located in eligible commercial buildings served on a Duke Energy
Carolinas’ general service rate schedule from the Duke Energy Carolinas’ retail distribution
system that are not opted out of the EE portion of the Rider EE.
Smart Energy in Offices Program
Number of Gross Savings (at plant)
Cumulative as of: Participants MWh Energy Peak kW
December 31, 2015 65,027,594 69,071 14,376
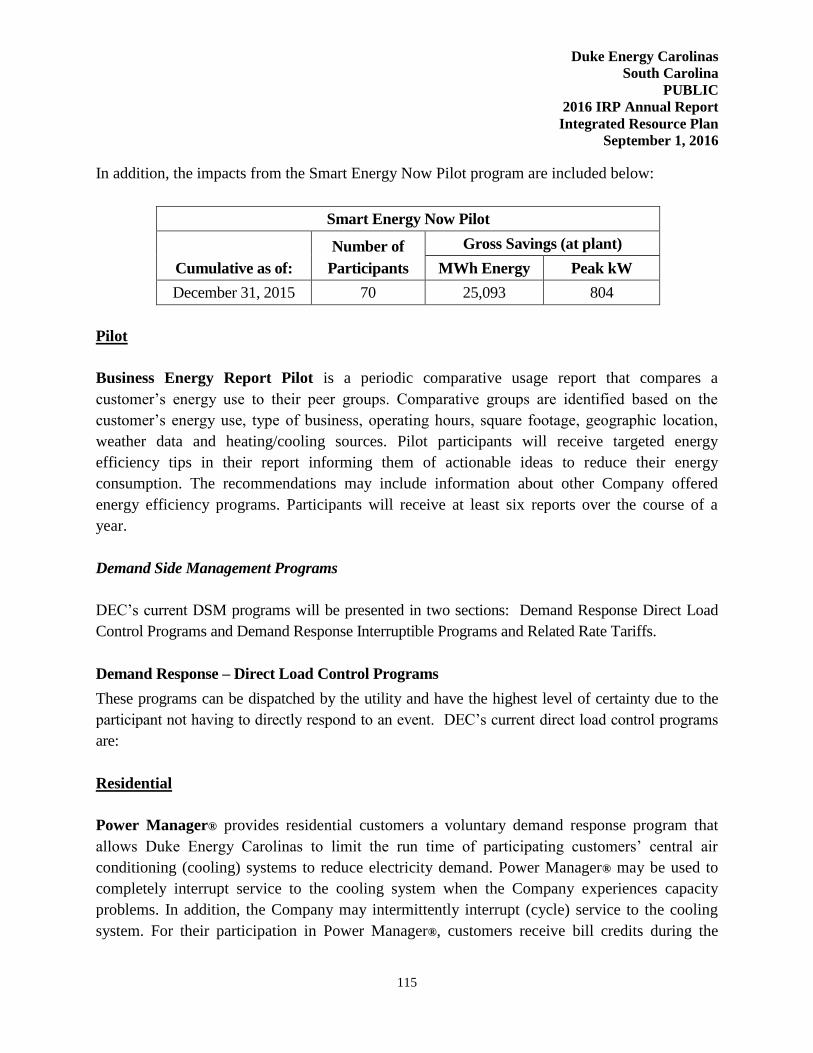
Duke Energy Carolinas
South Carolina
PUBLIC
2016 IRP Annual Report
Integrated Resource Plan
September 1, 2016
115
In addition, the impacts from the Smart Energy Now Pilot program are included below:
Smart Energy Now Pilot
Number of Gross Savings (at plant)
Cumulative as of: Participants MWh Energy Peak kW
December 31, 2015 70 25,093 804
Pilot
Business Energy Report Pilot is a periodic comparative usage report that compares a
customer’s energy use to their peer groups. Comparative groups are identified based on the
customer’s energy use, type of business, operating hours, square footage, geographic location,
weather data and heating/cooling sources. Pilot participants will receive targeted energy
efficiency tips in their report informing them of actionable ideas to reduce their energy
consumption. The recommendations may include information about other Company offered
energy efficiency programs. Participants will receive at least six reports over the course of a
year.
Demand Side Management Programs
DEC’s current DSM programs will be presented in two sections: Demand Response Direct Load
Control Programs and Demand Response Interruptible Programs and Related Rate Tariffs.
Demand Response – Direct Load Control Programs
These programs can be dispatched by the utility and have the highest level of certainty due to the
participant not having to directly respond to an event. DEC’s current direct load control programs
are:
Residential
Power Manager® provides residential customers a voluntary demand response program that
allows Duke Energy Carolinas to limit the run time of participating customers’ central air
conditioning (cooling) systems to reduce electricity demand. Power Manager® may be used to
completely interrupt service to the cooling system when the Company experiences capacity
problems. In addition, the Company may intermittently interrupt (cycle) service to the cooling
system. For their participation in Power Manager®, customers receive bill credits during the
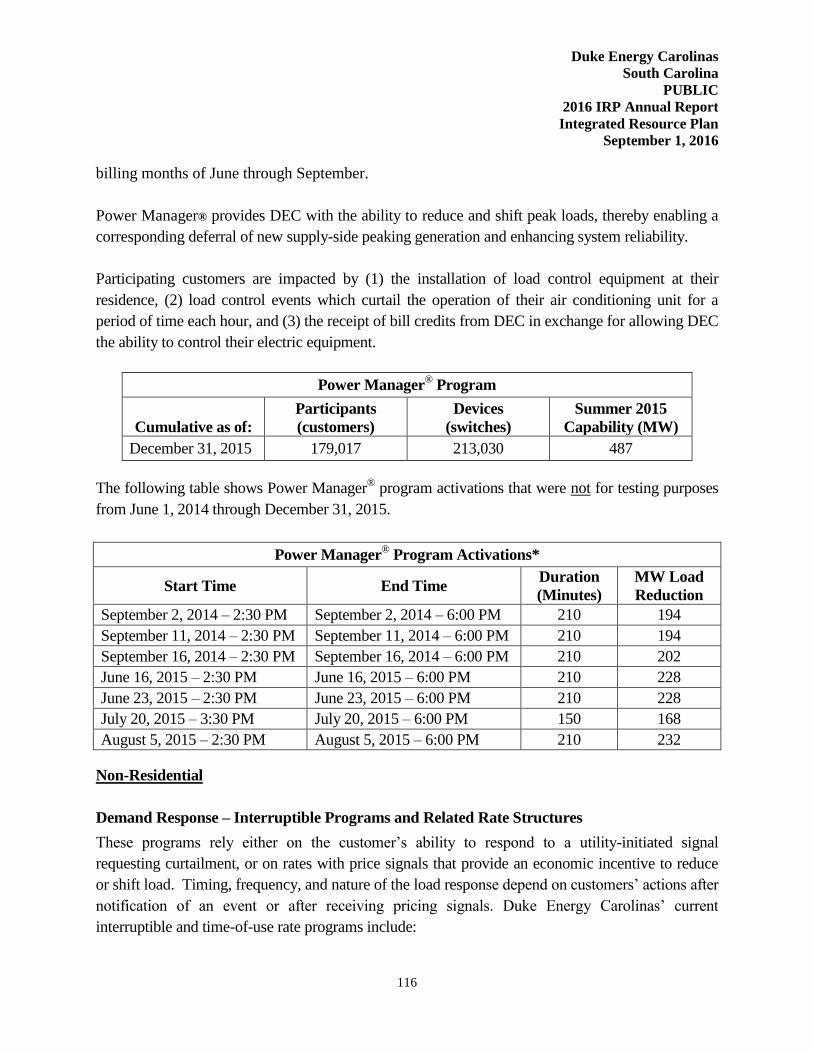
Duke Energy Carolinas
South Carolina
PUBLIC
2016 IRP Annual Report
Integrated Resource Plan
September 1, 2016
116
billing months of June through September.
Power Manager® provides DEC with the ability to reduce and shift peak loads, thereby enabling a
corresponding deferral of new supply-side peaking generation and enhancing system reliability.
Participating customers are impacted by (1) the installation of load control equipment at their
residence, (2) load control events which curtail the operation of their air conditioning unit for a
period of time each hour, and (3) the receipt of bill credits from DEC in exchange for allowing DEC
the ability to control their electric equipment.
Power Manager® Program
Cumulative as of:
Participants
(customers)
Devices
(switches)
Summer 2015
Capability (MW)
December 31, 2015 179,017 213,030 487
The following table shows Power Manager® program activations that were not for testing purposes
from June 1, 2014 through December 31, 2015.
Power Manager® Program Activations*
Start Time End Time Duration
(Minutes)
MW Load
Reduction
September 2, 2014 – 2:30 PM September 2, 2014 – 6:00 PM 210 194
September 11, 2014 – 2:30 PM September 11, 2014 – 6:00 PM 210 194
September 16, 2014 – 2:30 PM September 16, 2014 – 6:00 PM 210 202
June 16, 2015 – 2:30 PM June 16, 2015 – 6:00 PM 210 228
June 23, 2015 – 2:30 PM June 23, 2015 – 6:00 PM 210 228
July 20, 2015 – 3:30 PM July 20, 2015 – 6:00 PM 150 168
August 5, 2015 – 2:30 PM August 5, 2015 – 6:00 PM 210 232
Non-Residential
Demand Response – Interruptible Programs and Related Rate Structures
These programs rely either on the customer’s ability to respond to a utility-initiated signal
requesting curtailment, or on rates with price signals that provide an economic incentive to reduce
or shift load. Timing, frequency, and nature of the load response depend on customers’ actions after
notification of an event or after receiving pricing signals. Duke Energy Carolinas’ current
interruptible and time-of-use rate programs include:
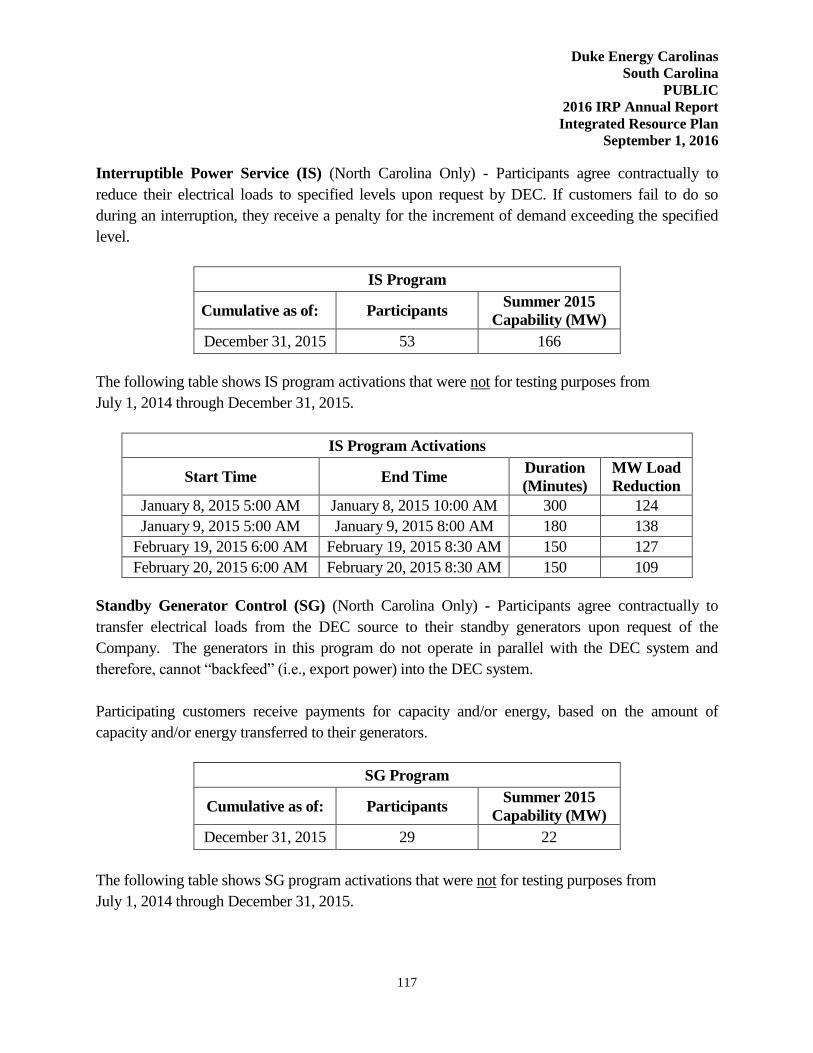
Duke Energy Carolinas
South Carolina
PUBLIC
2016 IRP Annual Report
Integrated Resource Plan
September 1, 2016
117
Interruptible Power Service (IS) (North Carolina Only) - Participants agree contractually to
reduce their electrical loads to specified levels upon request by DEC. If customers fail to do so
during an interruption, they receive a penalty for the increment of demand exceeding the specified
level.
IS Program
Cumulative as of: Participants Summer 2015
Capability (MW)
December 31, 2015 53 166
The following table shows IS program activations that were not for testing purposes from
July 1, 2014 through December 31, 2015.
IS Program Activations
Start Time End Time Duration
(Minutes)
MW Load
Reduction
January 8, 2015 5:00 AM January 8, 2015 10:00 AM 300 124
January 9, 2015 5:00 AM January 9, 2015 8:00 AM 180 138
February 19, 2015 6:00 AM February 19, 2015 8:30 AM 150 127
February 20, 2015 6:00 AM February 20, 2015 8:30 AM 150 109
Standby Generator Control (SG) (North Carolina Only) - Participants agree contractually to
transfer electrical loads from the DEC source to their standby generators upon request of the
Company. The generators in this program do not operate in parallel with the DEC system and
therefore, cannot “backfeed” (i.e., export power) into the DEC system.
Participating customers receive payments for capacity and/or energy, based on the amount of
capacity and/or energy transferred to their generators.
SG Program
Cumulative as of: Participants Summer 2015
Capability (MW)
December 31, 2015 29 22
The following table shows SG program activations that were not for testing purposes from
July 1, 2014 through December 31, 2015.
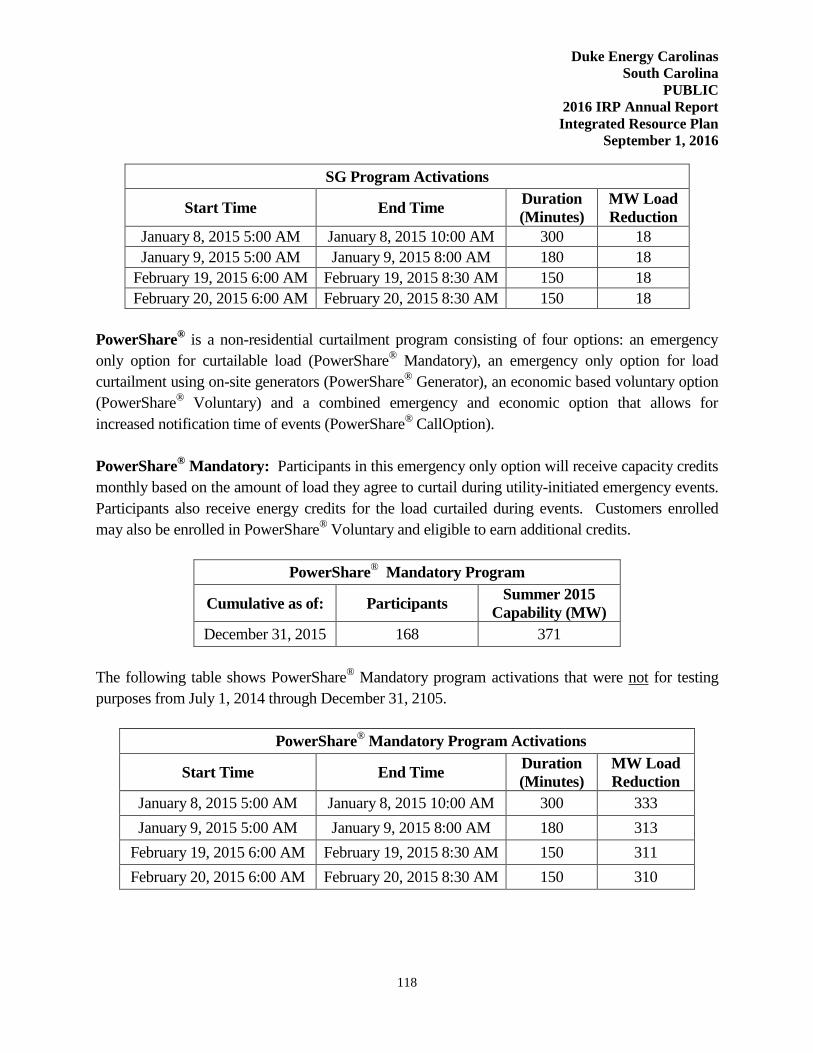
Duke Energy Carolinas
South Carolina
PUBLIC
2016 IRP Annual Report
Integrated Resource Plan
September 1, 2016
118
SG Program Activations
Start Time End Time Duration
(Minutes)
MW Load
Reduction
January 8, 2015 5:00 AM January 8, 2015 10:00 AM 300 18
January 9, 2015 5:00 AM January 9, 2015 8:00 AM 180 18
February 19, 2015 6:00 AM February 19, 2015 8:30 AM 150 18
February 20, 2015 6:00 AM February 20, 2015 8:30 AM 150 18
PowerShare® is a non-residential curtailment program consisting of four options: an emergency
only option for curtailable load (PowerShare® Mandatory), an emergency only option for load
curtailment using on-site generators (PowerShare® Generator), an economic based voluntary option
(PowerShare® Voluntary) and a combined emergency and economic option that allows for
increased notification time of events (PowerShare® CallOption).
PowerShare® Mandatory: Participants in this emergency only option will receive capacity credits
monthly based on the amount of load they agree to curtail during utility-initiated emergency events.
Participants also receive energy credits for the load curtailed during events. Customers enrolled
may also be enrolled in PowerShare® Voluntary and eligible to earn additional credits.
PowerShare® Mandatory Program
Cumulative as of: Participants Summer 2015
Capability (MW)
December 31, 2015 168 371
The following table shows PowerShare® Mandatory program activations that were not for testing
purposes from July 1, 2014 through December 31, 2105.
PowerShare® Mandatory Program Activations
Start Time End Time Duration
(Minutes)
MW Load
Reduction
January 8, 2015 5:00 AM January 8, 2015 10:00 AM 300 333
January 9, 2015 5:00 AM January 9, 2015 8:00 AM 180 313
February 19, 2015 6:00 AM February 19, 2015 8:30 AM 150 311
February 20, 2015 6:00 AM February 20, 2015 8:30 AM 150 310

Duke Energy Carolinas
South Carolina
PUBLIC
2016 IRP Annual Report
Integrated Resource Plan
September 1, 2016
119
PowerShare® Generator: Participants in this emergency only option will receive capacity credits
monthly based on the amount of load they agree to curtail (i.e. transfer to their on-site generator)
during utility-initiated emergency events and their performance during monthly test hours.
Participants also receive energy credits for the load curtailed during events.
PowerShare® Generator Statistics
As of: Participants Summer 2015
Capability (MW)
December 31, 2015 41 49
The following table shows PowerShare® Generator program activations that were not for testing
purposes from July 1, 2014 through December 31, 2015.
PowerShare® Generator Program Activations
Start Time End Time Duration
(Minutes)
MW Load
Reduction
February 20, 2015 6:00 AM February 20, 2015 8:00 AM 120 31
In response to EPA regulations finalized January 2013, the manner in which PowerShare®
Generator was dispatched was modified as of May 1, 2014 to allow customers with emergency
generators to continue participation in demand response programs. To comply with the new rule,
dispatch of the PowerShare® Generator program had to be limited to NERC Level II (EEA2) except
for the monthly readiness tests. More recently, on May 1, 2016, the DC Circuit Court of Appeals
mandated vacatur of the provision that included demand response participation in the rule’s 100
hour allowance. The vacatur resulted in the inability of a majority of existing PowerShare®
Generator participants to continue participation as of May 1, 2016.
PowerShare® Voluntary: Enrolled customers will be notified of pending emergency or economic
events and can log on to a website to view a posted energy price for that particular event.
Customers will then have the option to participate in the event and will be paid the posted energy
credit for load curtailed. Since this is a voluntary event program, no capacity benefit is recognized
for this program and no capacity incentive is provided. The values below represent participation in
PowerShare® Voluntary only and do not double count the participants in PowerShare
® Mandatory
that also participate in PowerShare® Voluntary.
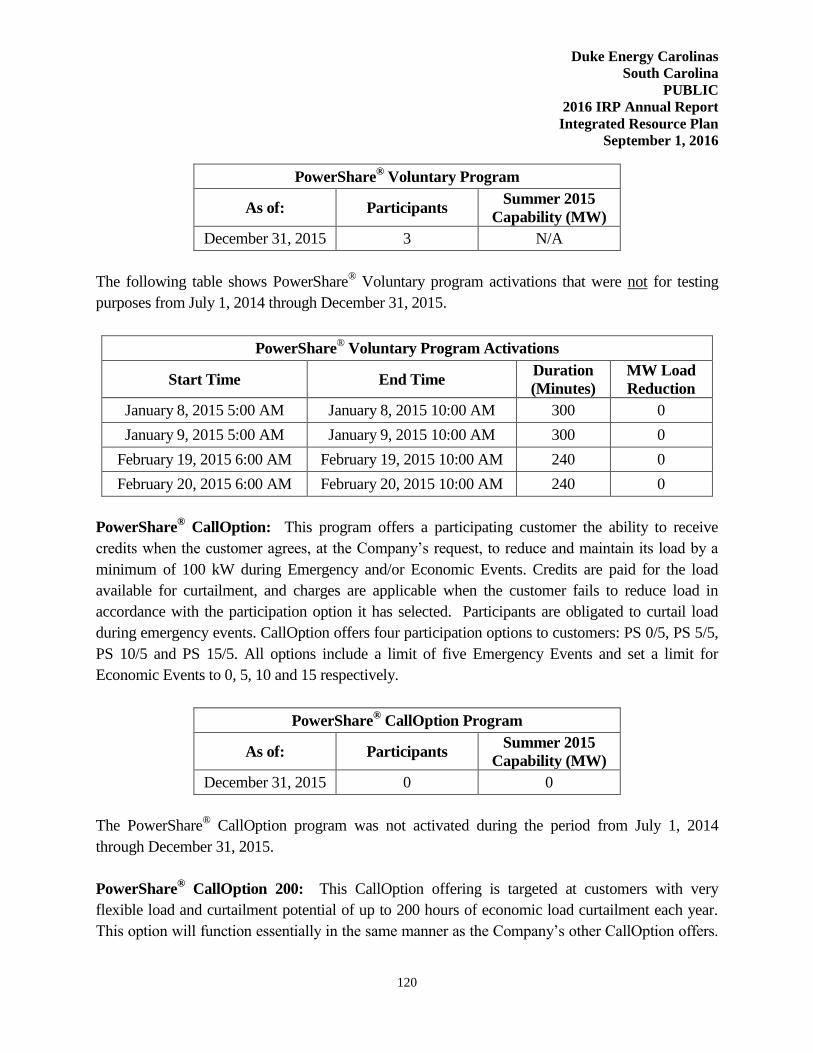
Duke Energy Carolinas
South Carolina
PUBLIC
2016 IRP Annual Report
Integrated Resource Plan
September 1, 2016
120
PowerShare® Voluntary Program
As of: Participants Summer 2015
Capability (MW)
December 31, 2015 3 N/A
The following table shows PowerShare® Voluntary program activations that were not for testing
purposes from July 1, 2014 through December 31, 2015.
PowerShare® Voluntary Program Activations
Start Time End Time Duration
(Minutes)
MW Load
Reduction
January 8, 2015 5:00 AM January 8, 2015 10:00 AM 300 0
January 9, 2015 5:00 AM January 9, 2015 10:00 AM 300 0
February 19, 2015 6:00 AM February 19, 2015 10:00 AM 240 0
February 20, 2015 6:00 AM February 20, 2015 10:00 AM 240 0
PowerShare® CallOption: This program offers a participating customer the ability to receive
credits when the customer agrees, at the Company’s request, to reduce and maintain its load by a
minimum of 100 kW during Emergency and/or Economic Events. Credits are paid for the load
available for curtailment, and charges are applicable when the customer fails to reduce load in
accordance with the participation option it has selected. Participants are obligated to curtail load
during emergency events. CallOption offers four participation options to customers: PS 0/5, PS 5/5,
PS 10/5 and PS 15/5. All options include a limit of five Emergency Events and set a limit for
Economic Events to 0, 5, 10 and 15 respectively.
PowerShare® CallOption Program
As of: Participants Summer 2015
Capability (MW)
December 31, 2015 0 0
The PowerShare® CallOption program was not activated during the period from July 1, 2014
through December 31, 2015.
PowerShare® CallOption 200: This CallOption offering is targeted at customers with very
flexible load and curtailment potential of up to 200 hours of economic load curtailment each year.
This option will function essentially in the same manner as the Company’s other CallOption offers.

Duke Energy Carolinas
South Carolina
PUBLIC
2016 IRP Annual Report
Integrated Resource Plan
September 1, 2016
121
However, customers who participate would experience considerably more requests for load
curtailment for economic purposes. Participants remain obligated to curtail load during up to 5
emergency events.
PowerShare® CallOption 200 Program
As of: Participants Summer 2015
Capability (MW)
December 31, 2015 0 0
The PowerShare® CallOption 200 program was not activated during the period from July 1, 2014
through December 31, 2015.
EnergyWiseSM
for Business: is both an energy efficiency and demand response program for non-
residential customers that allows DEC to reduce the operation of participants air conditioning units
to mitigate system capacity constraints and improve reliability of the power grid.
Program participants can choose between a Wi-Fi thermostat or load control switch that will be
professionally installed for free on each air conditioning or heat pump unit. In addition to
equipment choice, participants can also select the cycling level they prefer (i.e., a 30%, 50% or 75%
reduction of the normal on/off cycle of the unit). During a conservation period, DEC will send a
signal to the thermostat or switch to reduce the on time of the unit by the cycling percentage
selected by the participant. Participating customers will receive a $50 annual bill credit for each
unit at the 30% cycling level, $85 for 50% cycling, or $135 for 75% cycling. Participants that have
a heat pump unit with electric resistance emergency/back up heat and choose the thermostat can also
participate in a winter option that allows control of the emergency/back up heat at 100% cycling for
an additional $25 annual bill credit. Participants will also be allowed to override two conservation
periods per year.
Participants choosing the thermostat will be given access to a portal that will allow them to set
schedules, adjust the temperature set points, and receive energy conservation tips and
communications from DEC. In addition to the portal access, participants will also receive
conservation period notifications, so they can make adjustments to their schedules or notify their
employees of the upcoming conservation periods.
The DEC EnergyWiseSM
for Business program was implemented in South Carolina in December
2015, followed by North Carolina in January 2016.
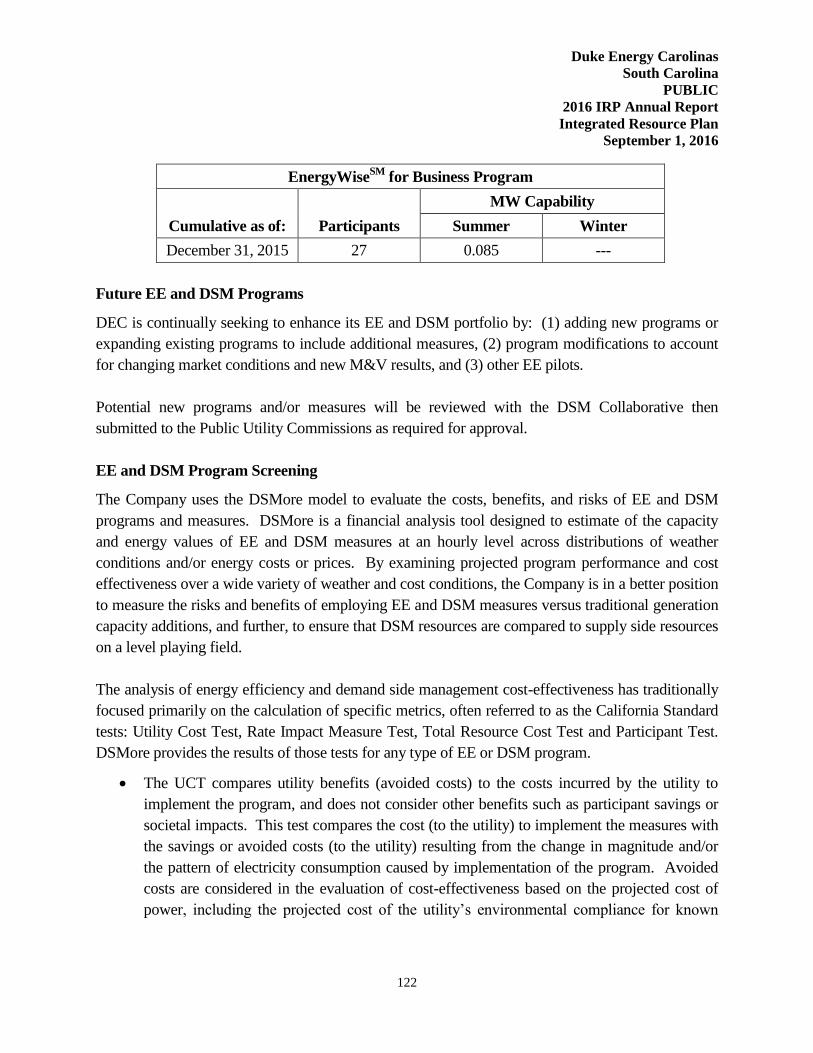
Duke Energy Carolinas
South Carolina
PUBLIC
2016 IRP Annual Report
Integrated Resource Plan
September 1, 2016
122
EnergyWiseSM
for Business Program
MW Capability
Cumulative as of: Participants Summer Winter
December 31, 2015 27 0.085 ---
Future EE and DSM Programs
DEC is continually seeking to enhance its EE and DSM portfolio by: (1) adding new programs or
expanding existing programs to include additional measures, (2) program modifications to account
for changing market conditions and new M&V results, and (3) other EE pilots.
Potential new programs and/or measures will be reviewed with the DSM Collaborative then
submitted to the Public Utility Commissions as required for approval.
EE and DSM Program Screening
The Company uses the DSMore model to evaluate the costs, benefits, and risks of EE and DSM
programs and measures. DSMore is a financial analysis tool designed to estimate of the capacity
and energy values of EE and DSM measures at an hourly level across distributions of weather
conditions and/or energy costs or prices. By examining projected program performance and cost
effectiveness over a wide variety of weather and cost conditions, the Company is in a better position
to measure the risks and benefits of employing EE and DSM measures versus traditional generation
capacity additions, and further, to ensure that DSM resources are compared to supply side resources
on a level playing field.
The analysis of energy efficiency and demand side management cost-effectiveness has traditionally
focused primarily on the calculation of specific metrics, often referred to as the California Standard
tests: Utility Cost Test, Rate Impact Measure Test, Total Resource Cost Test and Participant Test.
DSMore provides the results of those tests for any type of EE or DSM program.
The UCT compares utility benefits (avoided costs) to the costs incurred by the utility to
implement the program, and does not consider other benefits such as participant savings or
societal impacts. This test compares the cost (to the utility) to implement the measures with
the savings or avoided costs (to the utility) resulting from the change in magnitude and/or
the pattern of electricity consumption caused by implementation of the program. Avoided
costs are considered in the evaluation of cost-effectiveness based on the projected cost of
power, including the projected cost of the utility’s environmental compliance for known

Duke Energy Carolinas
South Carolina
PUBLIC
2016 IRP Annual Report
Integrated Resource Plan
September 1, 2016
123
regulatory requirements. The cost-effectiveness analyses also incorporate avoided
transmission and distribution costs, and load (line) losses.
The RIM Test, or non-participants test, indicates if rates increase or decrease over the long-
run as a result of implementing the program.
The TRC Test compares the total benefits to the utility and to participants relative to the
costs to the utility to implement the program along with the costs to the participant. The
benefits to the utility are the same as those computed under the UCT. The benefits to the
participant are the same as those computed under the Participant Test, however, customer
incentives are considered to be a pass-through benefit to customers. As such, customer
incentives or rebates are not included in the TRC.
The Participant Test evaluates programs from the perspective of the program’s participants.
The benefits include reductions in utility bills, incentives paid by the utility and any State,
Federal or local tax benefits received.
The use of multiple tests can ensure the development of a reasonable set of cost-effective DSM and
EE programs and indicate the likelihood that customers will participate.
Energy Efficiency and Demand-Side Management Program Forecasts
The NCUC, in their approval of the 2014 Integrated Resource Plans and REPS Compliance Plans
dated June 26, 2015 in Docket E-100, Sub141, issued the following Orders relative to EE/DSM
analysis and forecasts:
7. That the IOUs should continue to monitor and report any changes of more than 10% in
the energy and capacity savings derived from DSM and EE between successive IRPs, and
evaluate and discuss any changes on a program-specific basis. Any issues impacting
program deployment should be thoroughly explained and quantified in future IRPs.
8. That each IOU shall continue to include a discussion of the status of EE market potential
studies or updates in their future IRPs.
These two Orders that are specific to EE and DSM are addressed in the following sections.
Forecast Methodology
In 2011, DEC commissioned a new EE market potential study to obtain new estimates of the
technical, economic and achievable potential for EE savings within the DEC service area. The final
report was prepared by Forefront Economics Inc. and H. Gil Peach and Associates, LLC and was
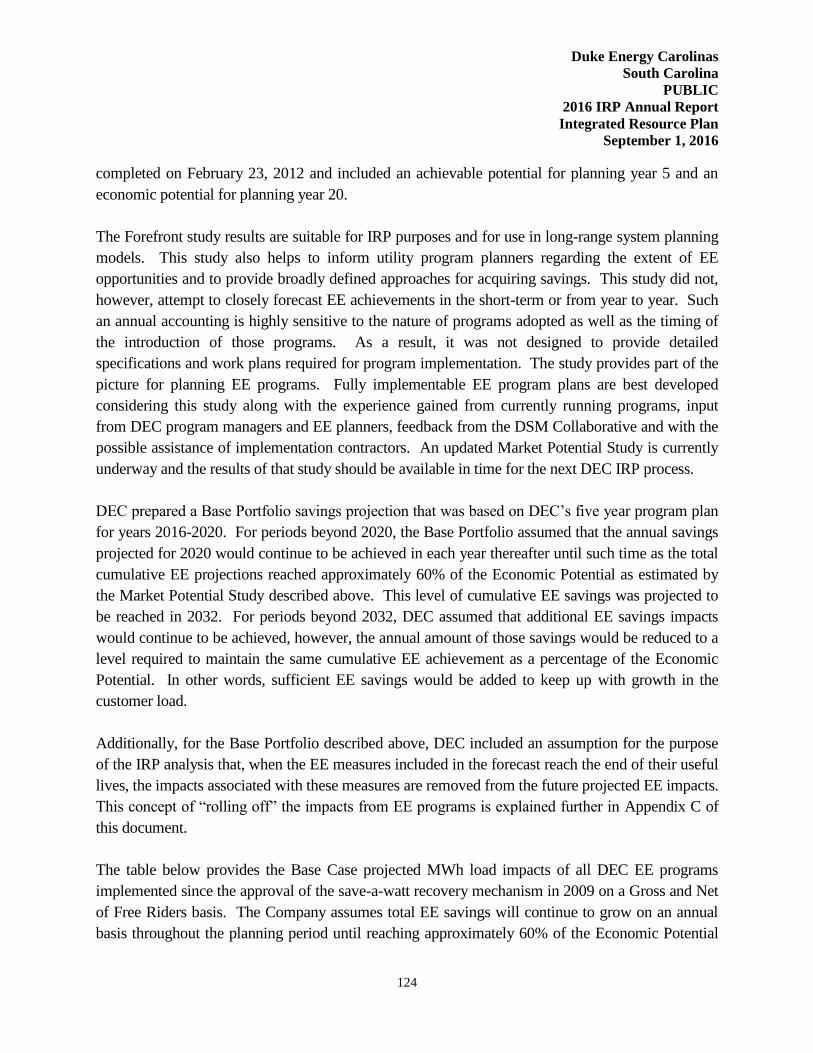
Duke Energy Carolinas
South Carolina
PUBLIC
2016 IRP Annual Report
Integrated Resource Plan
September 1, 2016
124
completed on February 23, 2012 and included an achievable potential for planning year 5 and an
economic potential for planning year 20.
The Forefront study results are suitable for IRP purposes and for use in long-range system planning
models. This study also helps to inform utility program planners regarding the extent of EE
opportunities and to provide broadly defined approaches for acquiring savings. This study did not,
however, attempt to closely forecast EE achievements in the short-term or from year to year. Such
an annual accounting is highly sensitive to the nature of programs adopted as well as the timing of
the introduction of those programs. As a result, it was not designed to provide detailed
specifications and work plans required for program implementation. The study provides part of the
picture for planning EE programs. Fully implementable EE program plans are best developed
considering this study along with the experience gained from currently running programs, input
from DEC program managers and EE planners, feedback from the DSM Collaborative and with the
possible assistance of implementation contractors. An updated Market Potential Study is currently
underway and the results of that study should be available in time for the next DEC IRP process.
DEC prepared a Base Portfolio savings projection that was based on DEC’s five year program plan
for years 2016-2020. For periods beyond 2020, the Base Portfolio assumed that the annual savings
projected for 2020 would continue to be achieved in each year thereafter until such time as the total
cumulative EE projections reached approximately 60% of the Economic Potential as estimated by
the Market Potential Study described above. This level of cumulative EE savings was projected to
be reached in 2032. For periods beyond 2032, DEC assumed that additional EE savings impacts
would continue to be achieved, however, the annual amount of those savings would be reduced to a
level required to maintain the same cumulative EE achievement as a percentage of the Economic
Potential. In other words, sufficient EE savings would be added to keep up with growth in the
customer load.
Additionally, for the Base Portfolio described above, DEC included an assumption for the purpose
of the IRP analysis that, when the EE measures included in the forecast reach the end of their useful
lives, the impacts associated with these measures are removed from the future projected EE impacts.
This concept of “rolling off” the impacts from EE programs is explained further in Appendix C of
this document.
The table below provides the Base Case projected MWh load impacts of all DEC EE programs
implemented since the approval of the save-a-watt recovery mechanism in 2009 on a Gross and Net
of Free Riders basis. The Company assumes total EE savings will continue to grow on an annual
basis throughout the planning period until reaching approximately 60% of the Economic Potential
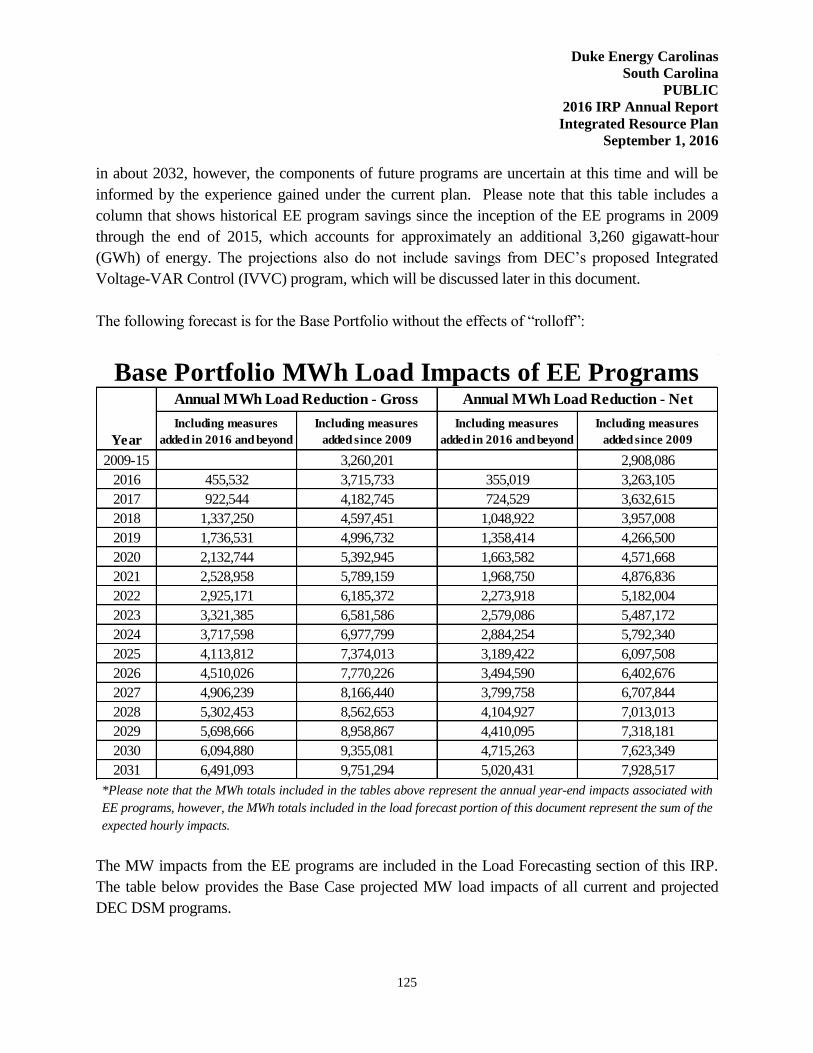
Duke Energy Carolinas
South Carolina
PUBLIC
2016 IRP Annual Report
Integrated Resource Plan
September 1, 2016
125
in about 2032, however, the components of future programs are uncertain at this time and will be
informed by the experience gained under the current plan. Please note that this table includes a
column that shows historical EE program savings since the inception of the EE programs in 2009
through the end of 2015, which accounts for approximately an additional 3,260 gigawatt-hour
(GWh) of energy. The projections also do not include savings from DEC’s proposed Integrated
Voltage-VAR Control (IVVC) program, which will be discussed later in this document.
The following forecast is for the Base Portfolio without the effects of “rolloff”:
*Please note that the MWh totals included in the tables above represent the annual year-end impacts associated with
EE programs, however, the MWh totals included in the load forecast portion of this document represent the sum of the
expected hourly impacts.
The MW impacts from the EE programs are included in the Load Forecasting section of this IRP.
The table below provides the Base Case projected MW load impacts of all current and projected
DEC DSM programs.
Including measures
added in 2016 and beyond
Including measures
added since 2009
Including measures
added in 2016 and beyond
Including measures
added since 2009
2009-15 3,260,201 2,908,086
2016 455,532 3,715,733 355,019 3,263,105
2017 922,544 4,182,745 724,529 3,632,615
2018 1,337,250 4,597,451 1,048,922 3,957,008
2019 1,736,531 4,996,732 1,358,414 4,266,500
2020 2,132,744 5,392,945 1,663,582 4,571,668
2021 2,528,958 5,789,159 1,968,750 4,876,836
2022 2,925,171 6,185,372 2,273,918 5,182,004
2023 3,321,385 6,581,586 2,579,086 5,487,172
2024 3,717,598 6,977,799 2,884,254 5,792,340
2025 4,113,812 7,374,013 3,189,422 6,097,508
2026 4,510,026 7,770,226 3,494,590 6,402,676
2027 4,906,239 8,166,440 3,799,758 6,707,844
2028 5,302,453 8,562,653 4,104,927 7,013,013
2029 5,698,666 8,958,867 4,410,095 7,318,181
2030 6,094,880 9,355,081 4,715,263 7,623,349
2031 6,491,093 9,751,294 5,020,431 7,928,517
Base Portfolio MWh Load Impacts of EE Programs
Year
Annual MWh Load Reduction - Gross Annual MWh Load Reduction - Net

Duke Energy Carolinas
South Carolina
PUBLIC
2016 IRP Annual Report
Integrated Resource Plan
September 1, 2016
126
Note: For DSM programs, Gross and Net are the same.
DEC’s approved EE plan is consistent with the requirement set forth in the Cliffside Unit 6 CPCN
Order to invest 1% of annual retail electricity revenues in EE and DSM programs, subject to the
results of ongoing collaborative workshops and appropriate regulatory treatment.
However, pursuing EE and DSM initiatives is not expected to meet all of the future incremental
peak demand for energy. DEC still envisions the need to secure additional generation, including
cost-effective renewable generation, but the EE and DSM programs offered by DEC will address a
significant portion of this need if such programs perform as expected.
EE Savings Variance since last IRP
In response to Order number 7 in the NCUC Order Approving Integrated Resource Plans and REPS
Compliance Plans regarding the 2014 Biennial IRPs, the Base Portfolio EE savings forecast of
MWh is within 10% of the forecast presented in the 2014 IRP when compared on the cumulative
achievements at year 2031 of the forecasts as shown in the table below.
IS SG PowerShare PowerManager
EnergyWise
for Business
Total Annual
Peak
2016 115 15 374 478 3 985
2017 109 15 380 502 9 1,015
2018 103 14 391 522 18 1,048
2019 98 13 401 540 27 1,079
2020 94 13 412 555 36 1,109
2021 89 12 416 555 45 1,117
2022 88 12 416 555 45 1,115
2023 88 12 416 555 45 1,115
2024 88 12 416 555 45 1,115
2025 88 12 416 555 45 1,115
2026 88 12 416 555 45 1,115
2027 88 12 416 555 45 1,115
2028 88 12 416 555 45 1,115
2029 88 12 416 555 45 1,115
2030 88 12 416 555 45 1,115
2031 88 12 416 555 45 1,115
Base Portfolio Load Impacts of DSM Programs
Year
Annual Peak MW Reduction
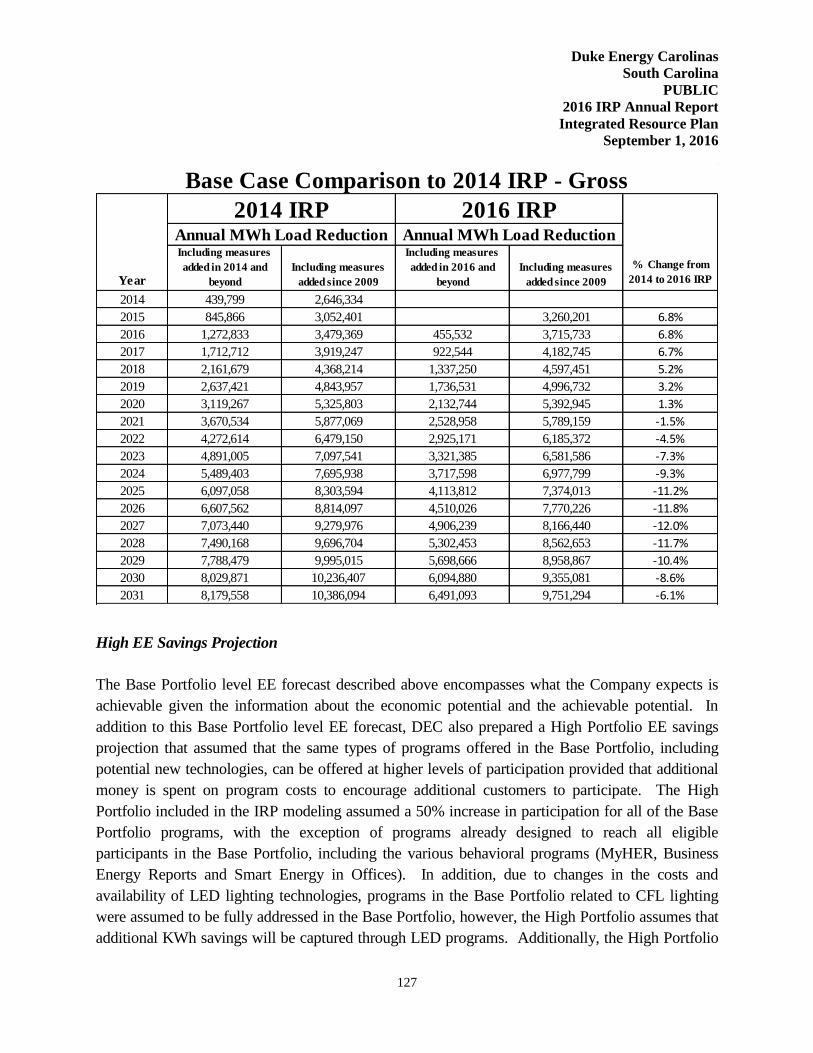
Duke Energy Carolinas
South Carolina
PUBLIC
2016 IRP Annual Report
Integrated Resource Plan
September 1, 2016
127
High EE Savings Projection
The Base Portfolio level EE forecast described above encompasses what the Company expects is
achievable given the information about the economic potential and the achievable potential. In
addition to this Base Portfolio level EE forecast, DEC also prepared a High Portfolio EE savings
projection that assumed that the same types of programs offered in the Base Portfolio, including
potential new technologies, can be offered at higher levels of participation provided that additional
money is spent on program costs to encourage additional customers to participate. The High
Portfolio included in the IRP modeling assumed a 50% increase in participation for all of the Base
Portfolio programs, with the exception of programs already designed to reach all eligible
participants in the Base Portfolio, including the various behavioral programs (MyHER, Business
Energy Reports and Smart Energy in Offices). In addition, due to changes in the costs and
availability of LED lighting technologies, programs in the Base Portfolio related to CFL lighting
were assumed to be fully addressed in the Base Portfolio, however, the High Portfolio assumes that
additional KWh savings will be captured through LED programs. Additionally, the High Portfolio
Including measures
added in 2014 and
beyond
Including measures
added since 2009
Including measures
added in 2016 and
beyond
Including measures
added since 2009
2014 439,799 2,646,334
2015 845,866 3,052,401 3,260,201 6.8%
2016 1,272,833 3,479,369 455,532 3,715,733 6.8%
2017 1,712,712 3,919,247 922,544 4,182,745 6.7%
2018 2,161,679 4,368,214 1,337,250 4,597,451 5.2%
2019 2,637,421 4,843,957 1,736,531 4,996,732 3.2%
2020 3,119,267 5,325,803 2,132,744 5,392,945 1.3%
2021 3,670,534 5,877,069 2,528,958 5,789,159 -1.5%
2022 4,272,614 6,479,150 2,925,171 6,185,372 -4.5%
2023 4,891,005 7,097,541 3,321,385 6,581,586 -7.3%
2024 5,489,403 7,695,938 3,717,598 6,977,799 -9.3%
2025 6,097,058 8,303,594 4,113,812 7,374,013 -11.2%
2026 6,607,562 8,814,097 4,510,026 7,770,226 -11.8%
2027 7,073,440 9,279,976 4,906,239 8,166,440 -12.0%
2028 7,490,168 9,696,704 5,302,453 8,562,653 -11.7%
2029 7,788,479 9,995,015 5,698,666 8,958,867 -10.4%
2030 8,029,871 10,236,407 6,094,880 9,355,081 -8.6%
2031 8,179,558 10,386,094 6,491,093 9,751,294 -6.1%
2032 8,249,151 10,455,686 6,887,307 10,147,508 -2.9%
2033 8,318,743 10,525,279 7,117,307 10,377,508 -1.4%
Base Case Comparison to 2014 IRP - Gross
Year
2014 IRP 2016 IRP
% Change from
2014 to 2016 IRP
Annual MWh Load Reduction Annual MWh Load Reduction

Duke Energy Carolinas
South Carolina
PUBLIC
2016 IRP Annual Report
Integrated Resource Plan
September 1, 2016
128
assumed the same “rolling-off” assumption that was included in the Base Portfolio. Specifically,
that when the EE measures included in the forecast reach the end of their useful lives, the impacts
associated with those measures are removed from the future projected EE impacts.
The High Portfolio EE savings projections are higher than the expected achievable savings based
on the Market Potential Study. The effort to achieve this High Portfolio would require a
substantial expansion of DEC’s current Commission-approved EE portfolio. More importantly,
significantly higher levels of customer participation would need to be generated.
The tables below show the projected High Portfolio savings on both Gross and Net of Free
Riders basis.
The following forecast is for the High Portfolio without the effects of “rolloff”:
Including measures
added in 2016 and beyond
Including measures
added since 2009
Including measures
added in 2016 and beyond
Including measures
added since 2009
2009-15 3,260,201 2,908,086
2016 685,166 3,945,367 537,272 3,445,358
2017 1,381,813 4,642,014 1,089,036 3,997,122
2018 2,026,153 5,286,354 1,595,682 4,503,768
2019 2,655,067 5,915,268 2,087,427 4,995,513
2020 3,280,915 6,541,116 2,574,848 5,482,934
2021 3,906,763 7,166,964 3,062,270 5,970,356
2022 4,532,611 7,792,812 3,549,691 6,457,777
2023 5,158,458 8,418,659 4,037,113 6,945,199
2024 5,784,306 9,044,507 4,524,534 7,432,620
2025 6,410,154 9,670,355 5,011,956 7,920,042
2026 7,036,002 10,296,203 5,499,377 8,407,463
2027 7,661,849 10,922,050 5,986,799 8,894,885
2028 8,287,697 11,547,898 6,474,220 9,382,306
2029 8,913,545 12,173,746 6,961,641 9,869,727
2030 9,539,393 12,799,593 7,449,063 10,357,149
2031 10,165,240 13,425,441 7,936,484 10,844,570
High Portfolio MWh Load Impacts of EE Programs
Year
Annual MWh Load Reduction - Gross Annual MWh Load Reduction - Net
Duke Energy Carolinas
South Carolina
PUBLIC
2016 IRP Annual Report
Integrated Resource Plan
September 1, 2016
129
At this time, there is significant uncertainty in the development of new technologies that will
impact the level of EE achievement from future programs and/or enhancements to existing
programs, as well as in the ability to secure high levels of customer participation, to risk
including the high EE savings projection in the base assumptions for developing the 2016 IRP.
DEC expects that over time, as EE programs are implemented, the Company will continue to
gain experience and evidence on the viability of the level of EE achieved given actual customer
participation. As information becomes available on actual participation, technology changes, and
EE achievement, then the EE savings forecast used for integrated resource planning purposes
will be revised in future IRP’s to reflect the most realistic projection of EE savings.
Programs Evaluated but Rejected
Duke Energy Carolinas has not rejected any cost-effective programs as a result of its EE and DSM
program screening.
Looking to the Future - Grid Modernization (Smart Grid Impacts)
Duke Energy Carolinas is reviewing an Integrated Volt-Var Control project that will better manage
the application and operation of voltage regulators (the Volt) and capacitors (the VAR) on the Duke
Energy Carolinas distribution system. In general, the project tends to optimize the operation of these
devices, resulting in a "flattening" of the voltage profile across an entire circuit, starting at the
substation and continuing out to the farthest endpoint on that circuit. This flattening of the voltage
profile is accomplished by automating the substation level voltage regulation and capacitors, line
capacitors and line voltage regulators while integrating them into a single control system. This
control system continuously monitors and operates the voltage regulators and capacitors to maintain
the desired "flat" voltage profile. Once the system is operating with a relatively flat voltage profile
across an entire circuit, the resulting circuit voltage at the substation can then be operated at a lower
overall level. Lowering the circuit voltage at the substation results in an immediate reduction of
system loading.
The deployment of an IVVC program for Duke Energy Carolinas is anticipated to take
approximately four years following project approval. The proposed project timeline was adjusted to
reflect current strategic priorities and moved out approximately five years. Therefore, the IVVC
program is projected to reduce future distribution-only peak needs by 0.20% in 2023, 0.4% in 2024,
0.6% in 2025, 1.0% in 2026 and beyond.

Duke Energy Carolinas
South Carolina
PUBLIC
2016 IRP Annual Report
Integrated Resource Plan
September 1, 2016
130
APPENDIX E: FUEL SUPPLY
Duke Energy Carolinas’ current fuel usage consists primarily of coal and uranium. Oil and gas
have traditionally been used for peaking generation, but natural gas has begun to play a more
important role in the fuel mix due to lower pricing and the addition of a significant amount of
combined cycle generation. These additions will further increase the importance of gas to the
Company’s generation portfolio. A brief overview and issues pertaining to each fuel type are
discussed below.
Natural Gas
During 2015, spot Henry Hub natural gas prices averaged approximately $2.60 per million BTU
(MMBtu) and U.S. lower-48 net dry production averaged approximately 72 billion cubic feet per
day (BCF/day). For 2016, natural gas spot prices at the Henry Hub averaged approximately $2.27 in
January 2016. Henry Hub spot pricing decreased throughout the remaining winter months and
reached a low of approximately $1.485 per MMBtu on March 5, 2016. The decline in short-term
spot prices during the first quarter of 2016 were driven by both fundamental supply and demand
factors.
Average daily U.S. net dry production levels of approximately 72.7 BCF/day in the first quarter of
2016 were relatively comparable with 2015 net dry production. Storage ended the winter
withdrawal season at a record high of 2.47 per trillion cubic feet (TCF) on March 31, 2016. Lower-
48 U.S. demand in the first quarter of 2016 was lower than normal due to the mild winter weather
which lowered residential heating needs.
Summer 2016 spot natural gas prices have increased from the March 2016 lows outlined previously.
The Henry Hub spot price settled in a range between approximately $2.65 to $2.85 per MMBtu in
mid-July 2016. Working gas in storage remains above the 5 year average and storage balances from
a year ago, although the surplus has declined over the last few months with higher gas generation
burns and declining overall net dry gas production which as of August 15, 2016 is approximately
71.4 BCF/day. Observed average NYMEX Henry Hub prices for the winter period November 2016
through March 2017 have increased along with the overall market to approximately $3.09 per
MMBtu from the lows observed in late February 2016. Although predicting actual storage balances
at the end of the typical injection season is not possible, current projections are roughly 3.8 to 3.9
TCF of working gas in storage at the end of the injection season.
Natural gas consumption is expected to remain strong through the remainder of 2016 and 2017, due
primarily to increases in electric power usage. Per the EIA’s short-term energy outlook released on
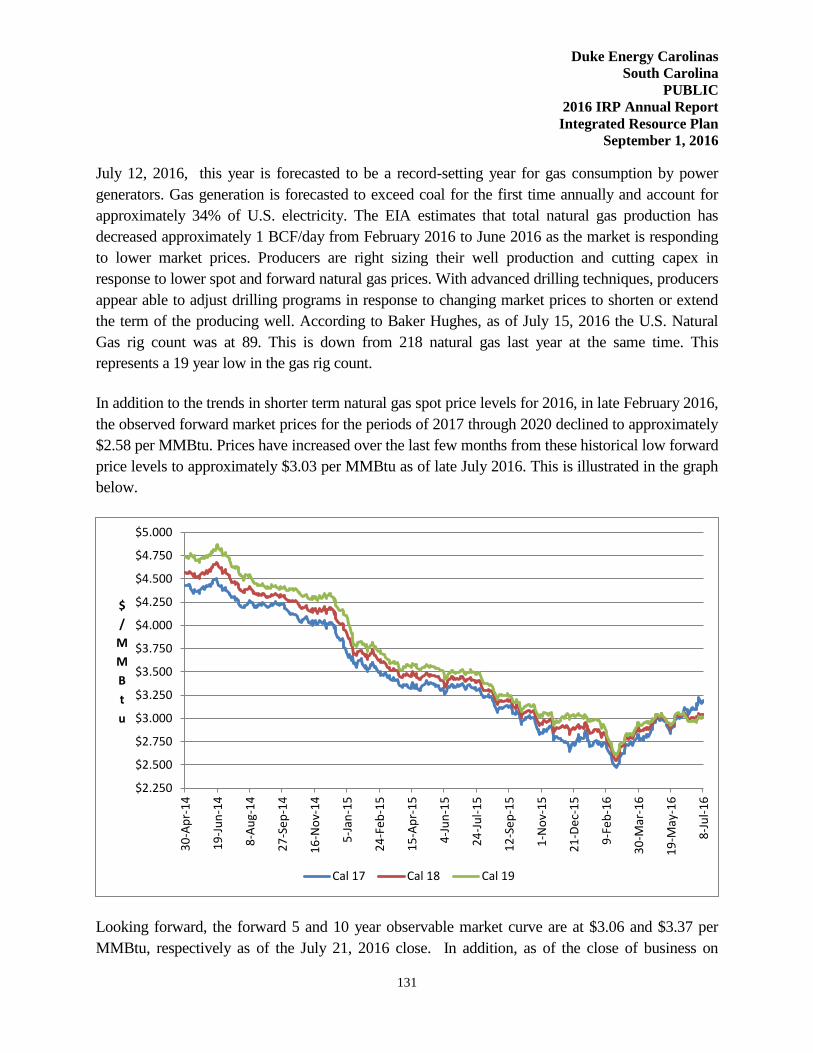
Duke Energy Carolinas
South Carolina
PUBLIC
2016 IRP Annual Report
Integrated Resource Plan
September 1, 2016
131
July 12, 2016, this year is forecasted to be a record-setting year for gas consumption by power
generators. Gas generation is forecasted to exceed coal for the first time annually and account for
approximately 34% of U.S. electricity. The EIA estimates that total natural gas production has
decreased approximately 1 BCF/day from February 2016 to June 2016 as the market is responding
to lower market prices. Producers are right sizing their well production and cutting capex in
response to lower spot and forward natural gas prices. With advanced drilling techniques, producers
appear able to adjust drilling programs in response to changing market prices to shorten or extend
the term of the producing well. According to Baker Hughes, as of July 15, 2016 the U.S. Natural
Gas rig count was at 89. This is down from 218 natural gas last year at the same time. This
represents a 19 year low in the gas rig count.
In addition to the trends in shorter term natural gas spot price levels for 2016, in late February 2016,
the observed forward market prices for the periods of 2017 through 2020 declined to approximately
$2.58 per MMBtu. Prices have increased over the last few months from these historical low forward
price levels to approximately $3.03 per MMBtu as of late July 2016. This is illustrated in the graph
below.
Looking forward, the forward 5 and 10 year observable market curve are at $3.06 and $3.37 per
MMBtu, respectively as of the July 21, 2016 close. In addition, as of the close of business on
$2.250
$2.500
$2.750
$3.000
$3.250
$3.500
$3.750
$4.000
$4.250
$4.500
$4.750
$5.000
30
-Ap
r-1
4
19
-Ju
n-1
4
8-A
ug-
14
27
-Se
p-1
4
16
-No
v-1
4
5-J
an-1
5
24
-Fe
b-1
5
15
-Ap
r-1
5
4-J
un
-15
24
-Ju
l-1
5
12
-Se
p-1
5
1-N
ov-
15
21
-De
c-1
5
9-F
eb
-16
30
-Mar
-16
19
-May
-16
8-J
ul-
16
$
/
M
M
B
t
u
Cal 17 Cal 18 Cal 19

Duke Energy Carolinas
South Carolina
PUBLIC
2016 IRP Annual Report
Integrated Resource Plan
September 1, 2016
132
July 8, 2016, the one(1), three(3) and five(5) years strips were all approximately $3.07 per MMBtu.
As illustrated with these price levels and relationships, the forward NYMEX Henry Hub price curve
is extremely flat with the periods of 2018 and 2019 currently trading at discounts to 2017 prices.
The gas market is expected to remain relatively stable due to a improving economic picture which
may provide supply and demand to further come into balance. As noted above, demand from the
power sector for 2016 is expected to be higher than coal generation due to coal retirements, which
are tied to the implementation of the EPA’s MATS rule covering mercury and acid gasses. This
increase is expected to be followed by new demand in the industrial and LNG export sectors, which
both ramp up in the 2016 through 2020 timeframe. Lastly, although the outcome and timing is
uncertain given the current legal status of the Clean Power Plan, there could be additional gas
demand as a result of the implementation of the previously announced EPA requirement to reduce
carbon emissions.
The long-term fundamental gas price outlook continues to be little changed from previous forecast
even though it includes higher overall demand. The North American gas resource picture is a story
of unconventional gas production dominating the gas industry. Shale gas now accounts for
approximately 60% of net natural gas production today, which has increased from approximately
38% in 2014. Per the Short-Term EIA outlook dated July 12, 2016, the EIA expects production to
rise in the second half of 2016 and 2017 in response to forecasted increases in prices and liquefied
natural gas (LNG) exports. Additionally, the EIA forecasts the United States transitioning from a
net importer of 1.3 Tcf of natural gas in 2013 to a net exporter in 2017. Overall, the EIA expects
marketed natural gas to rise by approximately 1.7% for the balance of 2016 and by 4.3% by the end
of 2017.
The US power sector still represents the largest area of potential new gas demand, but increased
usage is expected to be somewhat volatile as generation dispatch is sensitive to price. Looking
forward, economic dispatch competition is expected to continue between gas and coal, although
there has been some permanent loss in overall coal generation due to the number of coal unit
retirements. Overall declines in energy consumption tend to result from the adoption of more
energy-efficient technologies and policies that promote energy efficiency.
In order to ensure adequate natural gas supplies, transportation and storage, the company has gas
procurement strategies that include periodic RFPs, market solicitations, and short-term market
engagement activities to procure a reliable, flexible, diverse, and competitively priced natural gas
supply that supports DEC’s CT and CC facilities. With respect to storage and transportation needs,
the company has continued to add incremental firm pipeline capacity and gas storage as it gas
Duke Energy Carolinas
South Carolina
PUBLIC
2016 IRP Annual Report
Integrated Resource Plan
September 1, 2016
133
generation fleet as grown. The company will continue to evaluate competitive options to meet its
growing need for gas pipeline infrastructure as the gas generation fleet grows.
Coal
On average, the 2016 Duke fundamental outlook for coal prices is lower than the 2015 outlook.
The power sector accounted for 90.5% of total demand for coal in 2015, equivalent to 772 million
tons of burn. The main determinants of power sector coal demand are natural gas prices, electricity
demand growth, and non-fossil electric generation, namely nuclear, hydro, and renewables.
Low natural gas prices continue to exert extreme pressure on the coal fleet resulting in the reduction
of coal’s competitiveness across virtually all basins and caused generator coal stocks to reach near-
term highs. Coal shipments to generators will be even lower than actual burn as these high
inventory levels are worked down, a process that could take about two years.
Annual electric load growth, inclusive of energy efficiency impacts, is roughly 1%. The U.S.
Supreme Court granted a stay, halting implementation of the EPA’s Clean Power Plan pending the
resolution of legal challenges to the program in court. Though stayed, the CPP makes retention of
coal capacity less desirable. The fundamental outlook anticipates the eventual implementation of
CPP beginning in 2022, resulting in a long-term decline in power generation from coal. The coal
fired power plants projected to retire during the forecast period burned almost 60 million tons of
coal during 2015 which represents approximately 8% of the total 2015 burn. Growth in renewable
generation also contributes to the decline in coal demand.
Exports of both thermal and metallurgical coals have been hurt by the strength of the US dollar
coupled with the slowing growth of the Chinese economy. In addition, China has implemented
import tariffs to protect their domestic coal production.
Finally, the coal industry is in the midst of unprecedented restructuring. It is uncertain how
responsive either producers or transporters of coal will be if faced with unexpected periods of
increased demand.
Nuclear Fuel
To provide fuel for Duke Energy’s nuclear fleet, the Company maintains a diversified portfolio
of natural uranium and downstream services supply contracts from around the world.
Duke Energy Carolinas
South Carolina
PUBLIC
2016 IRP Annual Report
Integrated Resource Plan
September 1, 2016
134
Requirements for uranium concentrates, conversion services and enrichment services are
primarily met through a portfolio of long-term supply contracts. The contracts are diversified by
supplier, country of origin and pricing. In addition, DEC staggers its contracting so that its
portfolio of long-term contracts covers the majority of fleet fuel requirements in the near-term
and decreasing portions of the fuel requirements over time thereafter. By staggering long-term
contracts over time, the Company’s purchase price for deliveries within a given year consists of a
blend of contract prices negotiated at many different periods in the markets, which has the effect
of smoothing out the Company’s exposure to price volatility. Diversifying fuel suppliers reduces
the Company’s exposure to possible disruptions from any single source of supply. Near-term
requirements not met by long-term supply contracts have been and are expected to be fulfilled
with spot market purchases.
Due to the technical complexities of changing suppliers of fuel fabrication services, DEC
generally sources these services to a single domestic supplier on a plant-by-plant basis using
multi-year contracts.
As fuel with a low cost basis is used and lower-priced legacy contracts are replaced with contracts at
higher market prices, nuclear fuel expense is expected to increase in the future. Although the costs
of certain components of nuclear fuel are expected to increase in future years, nuclear fuel costs are
expected to be competitive with alternate generation and customers will continue to benefit from the
Company’s diverse generation mix.
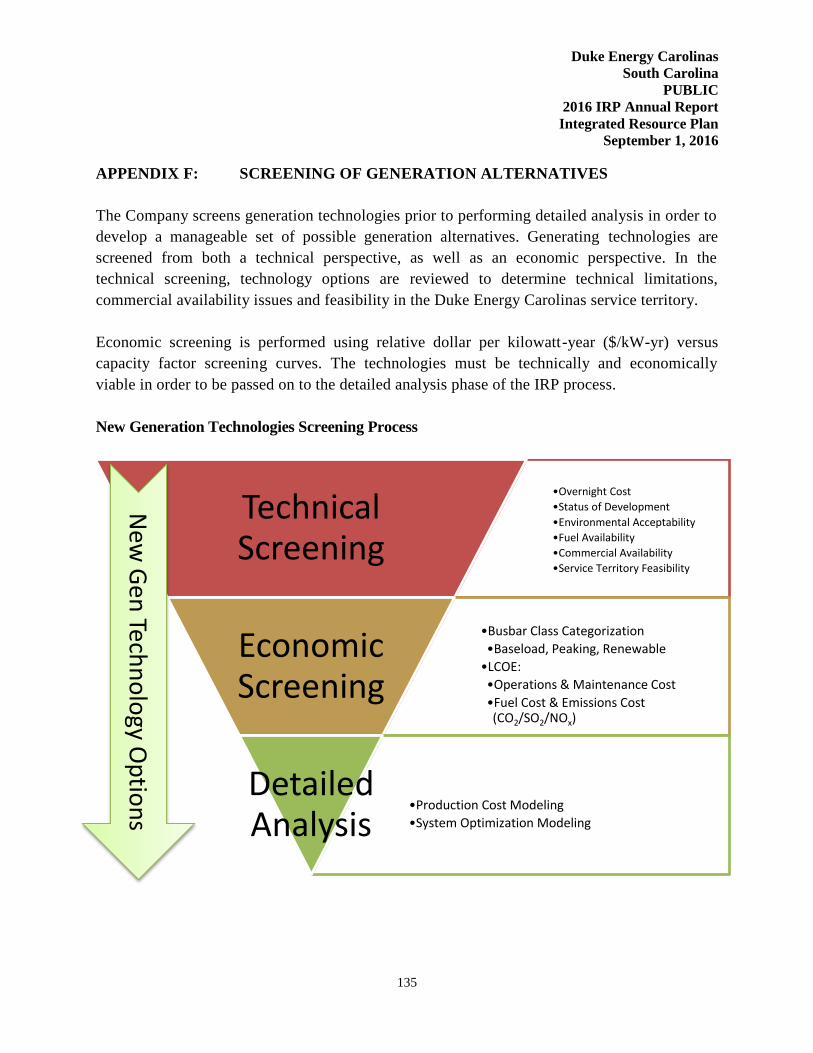
Duke Energy Carolinas
South Carolina
PUBLIC
2016 IRP Annual Report
Integrated Resource Plan
September 1, 2016
135
APPENDIX F: SCREENING OF GENERATION ALTERNATIVES
The Company screens generation technologies prior to performing detailed analysis in order to
develop a manageable set of possible generation alternatives. Generating technologies are
screened from both a technical perspective, as well as an economic perspective. In the
technical screening, technology options are reviewed to determine technical limitations,
commercial availability issues and feasibility in the Duke Energy Carolinas service territory.
Economic screening is performed using relative dollar per kilowatt-year ($/kW-yr) versus
capacity factor screening curves. The technologies must be technically and economically
viable in order to be passed on to the detailed analysis phase of the IRP process.
New Generation Technologies Screening Process
•Overnight Cost
•Status of Development
•Environmental Acceptability
•Fuel Availability
•Commercial Availability
•Service Territory Feasibility
Technical Screening
•Busbar Class Categorization
•Baseload, Peaking, Renewable
•LCOE:
•Operations & Maintenance Cost
•Fuel Cost & Emissions Cost (CO2/SO2/NOx)
Economic Screening
•Production Cost Modeling
•System Optimization Modeling
Detailed Analysis
New
Gen
Techn
olo
gy Op
tion
s
Duke Energy Carolinas
South Carolina
PUBLIC
2016 IRP Annual Report
Integrated Resource Plan
September 1, 2016
136
Technical Screening
The first step in the Company’s supply-side screening process for the IRP is a technical screening of
the technologies to eliminate those that have technical limitations, commercial availability issues, or
are not feasible in the Duke Energy Carolinas service territory. A brief explanation of the
technologies excluded at this point and the basis for their exclusion follows:
Geothermal was eliminated because there are no suitable geothermal resources in the
region to develop into a power generation project.
Pumped Storage Hydropower (PSH) is the only conventional, mature, commercial,
utility-scale electricity storage option available currently. This technology consumes
off-peak electricity by pumping water from a lower reservoir to an upper reservoir.
When the electric grid needs more electricity and when electricity prices are higher,
water is released from the upper reservoir. As the water flows from the upper
reservoir to the lower reservoir, it goes through a hydroelectric turbine to generate
electricity. Many operational pumped storage hydropower plants are providing
electric reliability and reserves for the electric grid in high demand situations. PSH
can provide a high amount of power because its only limitation is the capacity of the
upper reservoir. Typically, these plants can be as large as 4,000 MW, and have an
efficiency of 76% - 85% Electric Power Research Institute (EPRI, 2012). Therefore,
this technology is effective at meeting electric demand and transmission overload by
shifting, storing, and producing electricity. This is important because an increasing
supply of intermittent renewable energy generation such as solar will cause
challenges to the electric grid. PSH installations are greatly dependent on regional
geography and face several challenges including: environmental impact concerns, a
long permitting process, and a relatively high initial capital cost. Duke Energy
currently has two PSH assets, Bad Creek Reservoir and Jocassee Hydro with an
approximate combined generating capacity of 2,140 MW.
Compressed Air Energy Storage (CAES), although demonstrated on a utility scale
and generally commercially available, is not a widely applied technology and remains
relatively expensive. Traditional systems require a suitable storage site, commonly
underground where the compressed air is used to boost the output of a gas turbine.
The high capital requirements for these resources arise from the fact that suitable sites
that possess the proper geological formations and conditions necessary for the
Duke Energy Carolinas
South Carolina
PUBLIC
2016 IRP Annual Report
Integrated Resource Plan
September 1, 2016
137
compressed air storage reservoir are relatively scarce, especially in the Carolinas.
However, above-ground compressed air energy storage (AGCAES) technologies are
under development but at a much smaller scale, approximately 0.5 - 20MW. Several
companies have attempted to develop cost effective CAES systems using above
ground storage tanks. Most attempts to date have not been commercially successful,
but their development is being monitored.
Small Modular Nuclear Reactors (SMR) are generally defined as having
capabilities of less than 300 MW. In 2012, the U.S. Department of Energy (DOE)
solicited bids for companies to participate in a small modular reactor grant program
with the intent to “promote the accelerated commercialization of SMR technologies
to help meet the nation’s economic energy security and climate change
objectives.” SMRs are still conceptual in design and are developmental in nature.
Licensing for SMR’s has not been approved by the NRC at present. Currently, there is no
industry experience with developing this technology outside of the conceptual phase.
Duke Energy will be monitoring the progress of the SMR projects for potential
consideration and evaluation for future resource plans as they provide an emission
free source of fuel diverse, flexible generation.
Fuel Cells, although originally envisioned as being a competitor for combustion
turbines and central power plants, are now targeted to mostly distributed power
generation systems. The size of the distributed generation applications ranges from a
few kW to tens of MW in the long-term. Cost and performance issues have generally
limited their application to niche markets and/or subsidized installations. While a
medium level of research and development continues, this technology is not
commercially viable/available for utility-scale application.
Supercritical CO2 Brayton Cycle is of increasing interest; however, the technology
is not mature or ready for commercialization. Several pilots are underway and Duke
Energy will continue to monitor their development as a potential source of future
generation needs.
Poultry waste and swine waste digesters remain relatively expensive and are often
faced with operational and/or permitting challenges. Research, development, and
demonstration continue, but these technologies remain generally too expensive or
face obstacles that make them impractical energy choices outside of specific
mandates calling for use of these technologies.
Duke Energy Carolinas
South Carolina
PUBLIC
2016 IRP Annual Report
Integrated Resource Plan
September 1, 2016
138
Off-shore Wind, although demonstrated on a utility scale and commercially
available, is not a widely applied technology and not easily permitted in the United
States. This technology remains expensive even with the five year tax credit
extension granted in December 2015 and has yet to actually be constructed anywhere
in the United States. Pioneer wind farm is the first to “break water” off the coast of
Rhode Island. Federal waters have not yet been released for wind turbine farm siting;
however, state waters are within the rights of the State to exercise jurisdiction. Rhode
Island’s Block Island is within the 3-mile State waters jurisdiction but strategically
located in a manner to gain enough available wind resource to support its economic
feasibility. Pioneer is a 30MW demonstration that will utilize five, 6 MW Alstom
wind turbines and is expected to by operational by year end 2016. The U.S.
Department of the Interior’s Bureau of Ocean Energy Management (BOEM) has held
several auctions for offshore lease. These sites will be utilized to collect marine and
wind data for potential future development of an offshore wind farm.
Solar Steam Augmentation systems utilize solar thermal energy to supplement a
Rankine steam cycle such as that in a fossil generating plant. The supplemental steam
could be integrated into the steam cycle and support additional MW generation
similar in concept to the purpose of duct firing a heat recovery steam generator. This
technology, although attractive has several hurdles yet to clear, including a clean
operating history and initial capital cost reductions. This technology is very site
specific and Duke Energy will continue to monitor developments in the area of steam
augmentation.
A brief explanation of the technology additions for 2016 and the basis for their inclusion follows:
Addition of Combined Heat & Power (CHP) to the IRP
Combined Heat and Power systems, also known as cogeneration, generate electricity
and useful thermal energy in a single, integrated system. CHP is not a new technology,
but an approach to applying existing technologies. Heat that is normally wasted in
conventional power generation is recovered as useful energy, which avoids the losses
that would otherwise be incurred from separate generation of heat and power. CHP
incorporating a CT and heat recovery steam generator (HRSG) is more efficient than the
conventional method of producing usable heat and power separately via a gas package
boiler.
Duke Energy Carolinas
South Carolina
PUBLIC
2016 IRP Annual Report
Integrated Resource Plan
September 1, 2016
139
Duke Energy is exploring and working with potential customers with good base thermal
loads on a regulated Combined Heat and Power offer. The CHP asset will be included
as part of Duke Energy’s IRP as a placeholder for future projects as described below.
The steam sales are credited back to the revenue requirement of the projects to reduce
the total cost of this generation grid resource, making this a low cost grid asset. Along
with the potential to be a competitive cost generation resource, CHP can result in CO2
emission reductions, deferral of T&D expenses, and present economic development
opportunities for the state.
Duke Energy has publically announced its first CHP project, a 20 MW investment at
Duke University. We are currently working with other industrial, military and
Universities for future project expansions.
Addition of Battery Storage to the IRP
Energy storage solutions are becoming an ever growing necessity in support of grid
stability at peak demand times and in support of energy shifting and smoothing from
renewable sources. Energy Storage in the form of battery storage is becoming more
feasible with the advances in battery technology (Tesla low-cost Lithium-ion battery
technology) and the reduction in battery cost; however, their uses (even within Duke
Energy) have been concentrated on frequency regulation, solar smoothing, and/or
energy shifting from localized renewable energy sources with a high incidence of
intermittency (i.e. solar and wind applications).
Duke Energy has several projects in operation since 2011, mainly in support of
regulating output voltages/frequencies from renewable energy sources to the grid. This
includes projects as large as the Notrees Battery Storage project (36 MW) which
supports a wind farm down to the smaller 250 kW Marshall Battery Storage Project
which supports a 1.2 MW solar array. Additional examples include the Rankin Battery
Storage Project (402 kW), the McAlpine Community Energy Storage Project (24 kW),
McAlpine Substation Energy Storage Project (200 kW), and a 2 MW facility on Ohio’s
former Beckjord Station grounds. Each of these applications supports frequency
regulation, solar smoothing, or energy shifting from a local solar array. These examples
are only a few in support of a growing trend of coupling Battery Storage with an
intermittent renewable energy source such as solar or wind in an effort to stabilize
output and increase a facility's (renewable plus storage) net capacity factor.
Duke Energy Carolinas
South Carolina
PUBLIC
2016 IRP Annual Report
Integrated Resource Plan
September 1, 2016
140
Beginning in 2016, Distributed Energy Resources (DER), formed an Energy Storage
(ES) team to develop a fifteen year battery storage prediction model and begin the
development of battery storage deployment plans for the next five year budget
cycle. The ES team will focus their five year plan across multiple jurisdictions,
however, the first two areas that will most likely provide deployment sites are Duke
Energy Indiana (DEI) (substation utility scale application) and western NC, Asheville
Regional area (130kV distribution circuit assessment) in DEP. Regional battery storage
modeling is proceeding in 2016 to establish battery system sites, use case designs and
cost/benefit analysis. Regulatory approvals and cost recovery development will play a
key role in the timing of full operational battery system deployment.
Economic Screening
The Company screens all technologies using relative dollar per kilowatt-year ($/kW-yr) versus
capacity factor screening curves. The screening within each general class (Baseload,
Peaking/Intermediate, and Renewables), as well as the final screening across the general classes
uses a spreadsheet-based screening curve model developed by Duke Energy. This model is
considered proprietary, confidential and competitive information by Duke Energy.
This screening curve analysis model includes the total costs associated with owning and
maintaining a technology type over its lifetime and computes a levelized $/kW-year value over a
range of capacity factors. The Company repeats this process for each supply technology to be
screened resulting in a family of lines (curves). The lower envelope along the curves represents the
least costly supply options for various capacity factors or unit utilizations. Some technologies have
screening curves limited to their expected operating range on the individual graphs. Lines that
never become part of the lower envelope, or those that become part of the lower envelope only at
capacity factors outside of their relevant operating ranges, have a very low probability of being part
of the least cost solution, and generally can be eliminated from further analysis.
The Company selected the technologies listed below for the screening curve analysis. While Clean
Power Plan regulation may effectively preclude new coal-fired generation, Duke Energy Carolinas
has included ultra-supercritical pulverized coal with carbon capture sequestration and integrated
gasification combined cycle technologies with CCS of 1400 pounds/net MWh capture rate as
options for base load analysis consistent with the pending version of the EPA Clean Power Plan for
new coal plants. Additional detail on the expected impacts from EPA regulations to new coal-fired
options is included in Appendix G. 2016 additions include Combined Heat and Power as a base
load technology and Lithium ion Battery Storage as a renewable technology.
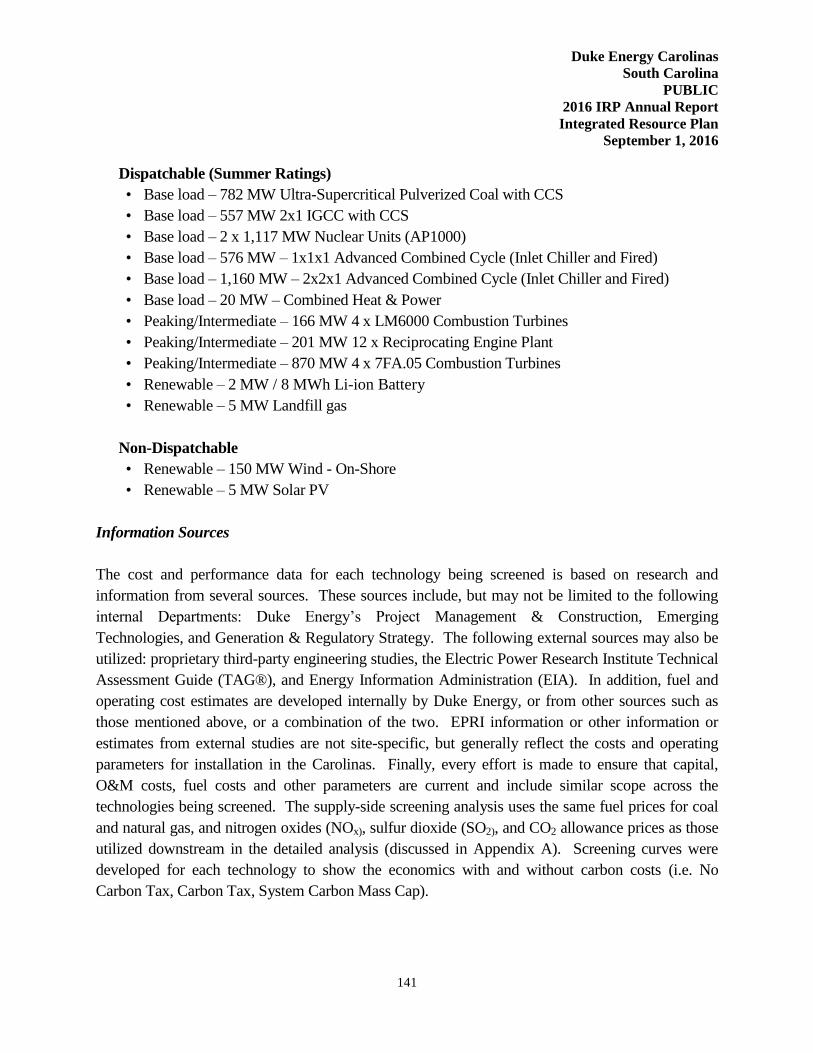
Duke Energy Carolinas
South Carolina
PUBLIC
2016 IRP Annual Report
Integrated Resource Plan
September 1, 2016
141
Dispatchable (Summer Ratings)
• Base load – 782 MW Ultra-Supercritical Pulverized Coal with CCS
• Base load – 557 MW 2x1 IGCC with CCS
• Base load – 2 x 1,117 MW Nuclear Units (AP1000)
• Base load – 576 MW – 1x1x1 Advanced Combined Cycle (Inlet Chiller and Fired)
• Base load – 1,160 MW – 2x2x1 Advanced Combined Cycle (Inlet Chiller and Fired)
• Base load – 20 MW – Combined Heat & Power
• Peaking/Intermediate – 166 MW 4 x LM6000 Combustion Turbines
• Peaking/Intermediate – 201 MW 12 x Reciprocating Engine Plant
• Peaking/Intermediate – 870 MW 4 x 7FA.05 Combustion Turbines
• Renewable – 2 MW / 8 MWh Li-ion Battery
• Renewable – 5 MW Landfill gas
Non-Dispatchable
• Renewable – 150 MW Wind - On-Shore
• Renewable – 5 MW Solar PV
Information Sources
The cost and performance data for each technology being screened is based on research and
information from several sources. These sources include, but may not be limited to the following
internal Departments: Duke Energy’s Project Management & Construction, Emerging
Technologies, and Generation & Regulatory Strategy. The following external sources may also be
utilized: proprietary third-party engineering studies, the Electric Power Research Institute Technical
Assessment Guide (TAG®), and Energy Information Administration (EIA). In addition, fuel and
operating cost estimates are developed internally by Duke Energy, or from other sources such as
those mentioned above, or a combination of the two. EPRI information or other information or
estimates from external studies are not site-specific, but generally reflect the costs and operating
parameters for installation in the Carolinas. Finally, every effort is made to ensure that capital,
O&M costs, fuel costs and other parameters are current and include similar scope across the
technologies being screened. The supply-side screening analysis uses the same fuel prices for coal
and natural gas, and nitrogen oxides (NOx), sulfur dioxide (SO2), and CO2 allowance prices as those
utilized downstream in the detailed analysis (discussed in Appendix A). Screening curves were
developed for each technology to show the economics with and without carbon costs (i.e. No
Carbon Tax, Carbon Tax, System Carbon Mass Cap).
Duke Energy Carolinas
South Carolina
PUBLIC
2016 IRP Annual Report
Integrated Resource Plan
September 1, 2016
142
Screening Results
The results of the screening within each category are shown in the figures below. Results of the
baseload screening show that natural gas combined cycle generation is the least-cost base load
resource. With lower gas prices, larger capacities and increased efficiency, natural gas combined
cycle units have become more cost-effective at higher capacity factors in all carbon scenario
screening cases (i.e. No Carbon Tax, Carbon Tax, System Carbon Mass Cap). Although CHP is
competitive with CC at the upper end of the capacity range, it is site specific, requiring a local steam
and electrical load. The baseload curves also show that nuclear generation may be a cost effective
option at high capacity factors with CO2 costs included. Carbon capture systems have been
demonstrated to reduce coal-fired CO2 emissions to levels similar to natural gas and will continue to
be monitored as they mature; however, their current cost and uncertainty of safe, reliable storage
options has limited the technical viability of this technology.
The peaking/intermediate technology screening included F-frame combustion turbines, fast start
aero-derivative combustion turbines, and fast start reciprocating engines. The screening curves
show the F-frame CTs to be the most economic peaking resource unless there is a special
application that requires the fast start capability of the aero-derivative CTs or reciprocating engines.
Reciprocating engine plants offer the lowest heat rates and fastest start times among simple cycle
options. In addition, the recent strength of the U.S. dollar compared to the Euro has led to
reduced costs for reciprocating engines imported from Europe. However, the volatility of the
exchange rates should be considered for the generic selection of this technology, especially with
the potential British withdrawal from the European Union (EU).
The renewable screening curves show solar is a more economical alternative than wind and landfill
gas generation. Solar and wind projects are technically constrained from achieving high capacity
factors making them unsuitable for intermediate or baseload duty cycles. Landfill gas projects are
limited based on site availability but are dispatchable. Solar projects, like wind, are not dispatchable
and therefore less suited to provide consistent peaking capacity. Aside from their technical
limitations, solar and wind technologies are not currently economically competitive generation
technologies without State and Federal subsidies. These renewable resources do play an important
role in meeting the Company’s NC REPS requirements.
Centralized generation, as depicted above, will remain the backbone of the grid for Duke Energy in
the long term; however, in addition it is likely that distributed generation will begin to share more
and more grid responsibilities over time as technologies such as energy storage increase our grid’s
flexibility.
Duke Energy Carolinas
South Carolina
PUBLIC
2016 IRP Annual Report
Integrated Resource Plan
September 1, 2016
143
The screening curves are useful for comparing costs of resource types at various capacity factors but
cannot be solely utilized for determining a long term resource plan because future units must be
optimized with an existing system containing various resource types. Results from the screening
curve analysis provide guidance for the technologies to be further considered in the more detailed
quantitative analysis phase of the planning process.

Duke Energy Carolinas
South Carolina
PUBLIC
2016 IRP Annual Report
Integrated Resource Plan
September 1, 2016
144
C
O
N
F
I
D
E
N
T
I
A
L
C
O
N
F
I
D
E
N
T
I
A
L

Duke Energy Carolinas
South Carolina
PUBLIC
2016 IRP Annual Report
Integrated Resource Plan
September 1, 2016
145
C
O
N
F
I
D
E
N
T
I
A
L
C
O
N
F
I
D
E
N
T
I
A
L

Duke Energy Carolinas
South Carolina
PUBLIC
2016 IRP Annual Report
Integrated Resource Plan
September 1, 2016
146
C
O
N
F
I
D
E
N
T
I
A
L
C
O
N
F
I
D
E
N
T
I
A
L

Duke Energy Carolinas
South Carolina
PUBLIC
2016 IRP Annual Report
Integrated Resource Plan
September 1, 2016
147
C
O
N
F
I
D
E
N
T
I
A
L

Duke Energy Carolinas
South Carolina
PUBLIC
2016 IRP Annual Report
Integrated Resource Plan
September 1, 2016
148
APPENDIX G: ENVIRONMENTAL COMPLIANCE
Legislative and Regulatory Issues
Duke Energy Carolinas, which is subject to the jurisdiction of Federal agencies including the
Federal Energy Regulatory Commission, EPA, and the NRC, as well as State commissions and
agencies, is potentially impacted by State and Federal legislative and regulatory actions. This
section provides a high-level description of several issues Duke Energy Carolinas is actively
monitoring or engaged in that could potentially influence the Company’s existing generation
portfolio and choices for new generation resources.
Air Quality
Duke Energy Carolinas is required to comply with numerous State and Federal air emission
regulations, including the current Clean Air Interstate Rule (CAIR) NOX and SO2 cap-and-trade
program and the 2002 North Carolina Clean Smokestacks Act (NC CSA).
As a result of complying with the NC CSA, Duke Energy Carolinas reduced SO2 emissions by
approximately 95% from 2000 to 2013. The law also required additional reductions in NOX
emissions in 2007 and 2009, beyond those required by CAIR, which Duke Energy Carolinas has
achieved. This landmark legislation, which was passed by the North Carolina General Assembly
in June of 2002, calls for some of the lowest state-mandated emission levels in the nation, and
was passed with Duke Energy Carolinas’ input and support.
The chart below show the significant downward trend in both NOx and SO2 emissions through
2015 as a result of actions taken at DEC facilities.
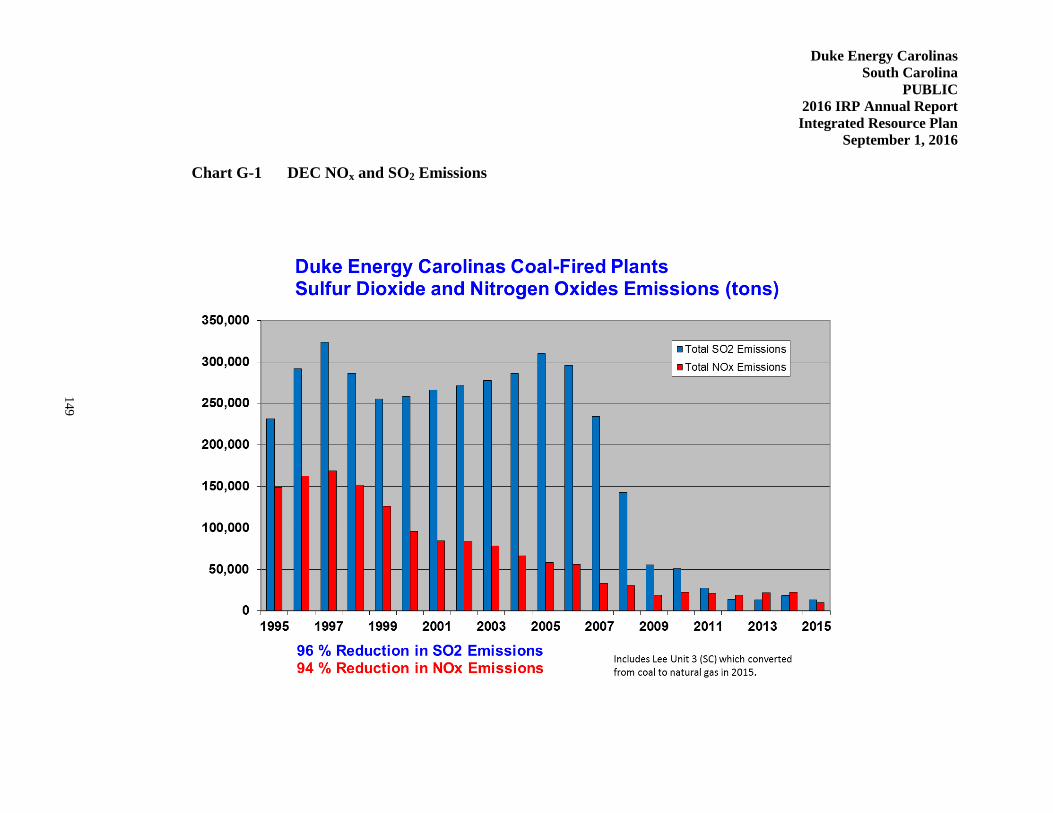
Duke Energy Carolinas
South Carolina
PUBLIC
2016 IRP Annual Report
Integrated Resource Plan
September 1, 2016
149
Chart G-1 DEC NOx and SO2 Emissions
Duke Energy Carolinas
South Carolina
PUBLIC
2016 IRP Annual Report
Integrated Resource Plan
September 1, 2016
150
The following is brief summary of the major air related federal regulatory programs that are
currently impacting or that could impact Duke Energy Carolinas operations in North Carolina.
Cross-State Air Pollution Rule (CSAPR)
In August, 2011 the EPA finalized the Cross-State Air Pollution Rule. The CSAPR established
state-level caps on annual SO2 and NOx emissions and ozone season NOx emissions from electric
generating units (EGUs) across the Eastern U.S., including North Carolina. The CSAPR was set up
as a two-phase program with Phase I taking effect in 2012 and Phase II taking effect in 2014. Legal
challenges to the rule resulted in Phase I implementation being delayed until 2015 and Phase II
implementation being delayed until 2017. Duke Energy Carolinas has been complying with Phase I
of the CSAPR and is well positioned to comply with the Phase II annual programs beginning in
2017.
The CSAPR ozone season NOx program was designed to address interstate transport for the 80
parts per billion (ppb) ozone standard that was established in 1997. In 2008 the EPA lowered the
ozone standard to 75 ppb. In late 2015 the EPA proposed a rule, referred to as the CSAPR Update
Rule, to revise Phase II of the CSAPR ozone season NOx program to address interstate transport for
the 75 ppb standard. EPA proposed to lower the Phase II ozone season NOx emission caps for most
affected states, including North Carolina, with the lower caps taking effect on May 1, 2017. The
EPA has indicated that it plans to finalize the rule in the summer of 2016. Duke Energy Carolinas
cannot predict the outcome of this rulemaking so it does not know at this time what, if any impact it
may have on operations in North Carolina.
Mercury and Air Toxics Standards (MATS) Rule
In March 2011 the EPA proposed the Mercury and Air Toxics Standards rule to regulate
emissions of mercury and other hazardous air pollutants from coal-fired EGUs. The rule
establishing unit-level emission limits for mercury, acid gases, and non-mercury metals, was
finalized in February, 2012. Compliance with the emission limits was required by April 16, 2015,
or April 16, 2016 if the state permitting authority granted up to a 1-year compliance extension.
Duke Energy Carolinas is complying with all rule requirements.

Duke Energy Carolinas
South Carolina
PUBLIC
2016 IRP Annual Report
Integrated Resource Plan
September 1, 2016
151
National Ambient Air Quality Standards (NAAQS)
8-Hour Ozone NAAQS
In October, 2015, EPA finalized a revision to the 8-Hour Ozone NAAQS, lowering it from 75 to 70
ppb. State recommendations to EPA regarding area designations under the 70 ppb standard are due
to EPA by October 1, 2016. The EPA expects to finalize area designations by October 1, 2017
based on 2014-2016 air quality. Attainment dates for any areas designated nonattainment will
depend on the area’s nonattainment classification, but will not be earlier than October, 2020.
The 70 ppb ozone standard is being challenged in court by numerous parties. Some are challenging
the standard as being too low, while others are challenging the standard as not being low enough.
Duke Energy Carolinas cannot predict the outcome of the litigation or assess the potential impact of
the lower standard on future operations in North Carolina at this time given the uncertainty
surrounding area designations.
SO2 NAAQS
On June 22, 2010, EPA finalized a rule establishing a 75 ppb 1-hour SO2 NAAQS. Since then,
EPA has completed two rounds of area designations, neither of which resulted in any areas in North
Carolina being designated nonattainment.
In August, 2015, the EPA finalized its Data Requirements Rule which established requirements for
state air agencies to characterize SO2 air quality levels around certain EGUs using ambient air
quality monitoring or air quality modeling. The Data Requirements Rule also laid out the timeline
for state air agencies to complete air quality characterizations and submit the information to EPA,
and for EPA to finalize area designations.
The North Carolina Department of Environmental Quality is characterizing SO2 air quality around
the Duke Energy Carolinas Belews Creek, Marshall, and Allen stations using air quality modeling.
The modeling analyses must be submitted to EPA by January 13, 2017, and EPA must complete
designations of the areas surrounding these three stations by December 31, 2017. For any area
designated nonattainment, the North Carolina Department of Environmental Quality would be
required to submit a state implementation plan to EPA within 18 months of the area’s designation
that establishes the requirements for bringing the area into attainment within 5 years of its
nonattainment designation.

Duke Energy Carolinas
South Carolina
PUBLIC
2016 IRP Annual Report
Integrated Resource Plan
September 1, 2016
152
Fine Particulate Matter (PM2.5) NAAQS
On December 14, 2012, the EPA finalized a rule establishing a 12 microgram per cubic meter
annual PM2.5 NAAQS. The EPA finalized area designations for this standard in December 2014.
That designation process did not result in any areas in North Carolina being designated as a
nonattainment area.
Greenhouse Gas Regulation
On August 3, 2015, the EPA finalized a rule establishing CO2 new source performance standards
for pulverized coal (PC) and natural gas combined cycle EGUs that initiated or that initiates
construction after January 8, 2014. The EPA finalized emission standards of 1,400 lb CO2 per gross
MWh of electricity generation for PC units and 1,000 lb CO2 per gross MWh for NGCC units. The
standard for PC units can only be achieved with carbon capture and sequestration technology. Duke
Energy Carolinas views the EPA rule as barring the development of new coal-fired generation
because CCS is not a demonstrated and available technology for applying to PC units. Duke
Energy Carolinas considers the standard for NGCC units to be achievable. Numerous parties have
filed petitions with the U.S. Court of Appeals for the District of Columbia (D.C. Circuit)
challenging the EPA’s final emission standard for new PC units.
On August 3, 2015, the EPA finalized the Clean Power Plan, a rule to limit CO2 emissions from
existing fossil fuel-fired EGUs (existing EGUs are units that commenced construction prior to
January 8, 2014). The CPP requires states to develop and submit to EPA for approval a state
implementation plan designed to achieve the required CO2 emission limitations. The CPP required
states to submit an initial plan by September 6, 2016, and a final plan by September 6, 2018. The
CPP established two rate-based compliance pathways and two mass-based compliance pathways for
states to choose from when developing their state implementation plans. At this time it is unknown
which approach the state of North Carolina might select for its implementation plan. The EPA
would review and approve or disapprove state plans within 12 months of receipt. The CPP required
emission limitations to take effect beginning in 2022 and get gradually more stringent through 2030.
The CPP does not directly impose regulatory requirements on Duke Energy Carolinas. An approved
North Carolina state implementation plan would establish the regulatory requirements that would
apply to Duke Energy Carolinas. If North Carolina were not to submit an approvable plan, EPA
would impose a federal implementation plan on affected Duke Energy Carolinas EGUs to achieve
the required CO2 emission limitations.
Duke Energy Carolinas
South Carolina
PUBLIC
2016 IRP Annual Report
Integrated Resource Plan
September 1, 2016
153
Numerous legal challenges to the CPP were filed with the DC Circuit. Many petitioners also asked
the DC Circuit to stay the rule until questions about its legal status get resolved. The DC Circuit
denied motions to stay the CPP, but shortly thereafter the Supreme Court granted a stay of the rule,
halting implementation of the CPP through any final decision in the case by the Supreme Court.
This means the CPP has no legal effect, and EPA cannot enforce any of the deadlines or rule
requirements while the stay is in place.
Briefing of the case before the D.C. Circuit was completed in April, 2016. Oral arguments before
the full D.C. Circuit are scheduled for September 27, 2016. A decision by the D.C. Circuit will
most likely be issued in early 2017. It is expected that the losing parties in that decision will seek
Supreme Court review, and it is likely that the Supreme Court will grant review. In this event, final
resolution of the case might not occur until sometime in 2018.
Generally, the CPP is designed to cause the replacement of coal-fired generation with generation
from natural gas and renewable energy sources. If the CPP is ultimately upheld by the courts and
implementation goes forward, Duke Energy Carolinas could incur increased fuel, purchased power,
operation and maintenance and other costs for replacement generation. However, Duke Energy
Carolinas is unable to assess the specific impact of the CPP on its operations at this time due to the
many uncertainties currently surrounding the rule’s potential implementation.
One of the uncertainties surrounding the CPP is the implementation schedule that would apply if the
CPP is found to be lawful. In prior instances where a final rule has been stayed but eventually
found to be lawful, all implementation dates have been delayed by at least the number of days the
stay was in place. While an exact implementation schedule for the CPP under such an outcome is
uncertain, what does seem certain is that if the CPP is found to be lawful, the schedule for
implementation will be delayed from what is in the final rule.
Water Quality and By-product Issues
CWA 316(b) Cooling Water Intake Structures
Federal regulations implementing §316(b) of the Clean Water Act (CWA) for existing facilities
were published in the Federal Register on August 15, 2014 with an effective date of October 14,
2014. The rule regulates cooling water intake structures at existing facilities to address
environmental impacts from fish being impinged (pinned against cooling water intake structures)
and entrained (being drawn into cooling water systems and affected by heat, chemicals or physical
stress). The final rule establishes aquatic protection requirements at existing facilities and new on-
site generation that withdraw 2 million gallons per day (MGD) or more from rivers, streams, lakes,

Duke Energy Carolinas
South Carolina
PUBLIC
2016 IRP Annual Report
Integrated Resource Plan
September 1, 2016
154
reservoirs, estuaries, oceans, or other waters of the United States. All Duke Energy nuclear fueled,
coal-fired and combined cycle stations, in North Carolina and South Carolina are affected sources,
with the exception of Smith Energy 12
.
The rule establishes two standards, one for impingement and one for entrainment. To demonstrate
compliance with the impingement standard, facilities must choose and implement one of the
following options:
Closed cycle re-circulating cooling system; or
Demonstrate the maximum design through screen velocity is less than 0.5 feet per second
(fps) under all conditions; or
Demonstrate the actual through screen velocity, based on measurement, is less than 0.5
fps; or
Install modified traveling water screens and optimize performance through a two-year
study; or
Demonstrate a system of technologies, practices, and operational measures are optimized
to reduce impingement mortality; or
Demonstrate the impingement latent mortality is reduced to no more than 24% annually
based on monthly monitoring.
In addition to these options, the final rule allows the state permitting agency to establish less
stringent standards if the capacity utilization rate is less than 8% averaged over a 24-month
contiguous period. The rule, also, allows the state permitting agency to determine no further action
warranted if impingement is considered de minimis. Compliance with the impingement standard is
not required until requirements for entrainment are established.
The entrainment standard does not mandate the installation of a technology but rather establishes a
process for the state permitting agency to determine necessary controls, if any, required to reduce
entrainment mortality on a site-specific basis. Facilities that withdraw greater than 125 MGD are
required to submit information to characterize the entrainment and assess the engineering feasibility,
costs, and benefits of closed-cycle cooling, fine mesh screens and other technological and
operational controls. The state permitting agency can determine no further action is required, or
require the installation of fine mesh screens, or conversion to closed-cycle cooling.
12
Richmond County(a public water supply system) supplies cooling water to Smith Energy; therefore the rule is not
applicable.
Duke Energy Carolinas
South Carolina
PUBLIC
2016 IRP Annual Report
Integrated Resource Plan
September 1, 2016
155
The rule requires facilities with a NPDES permit that expires after July 14, 2018 to submit all
necessary 316(b) reports with the renewal application. For facilities with a NPDES permit that
expire prior to July 14, 2018 or are in the renewal process, the state permitting agency is allowed to
establish an alternate submittal schedule. We expect submittals to be due in the 2018 to 2021
timeframe and intake modifications, if necessary to be required in the 2019 to 2022 timeframe,
depending on the NPDES permit renewal date and compliance schedule developed by the state
permitting agency.
Steam Electric Effluent Guidelines
Federal regulations revising the Effluent Limitations Guidelines and Standards for the Steam
Electric Power Generating Point Source Category (ELG Rule) were published in the Federal
Register on November 3, 2015 with an effective date of January 4, 2016. While the ELG Rule is
applicable to all steam electric generating units, waste streams affected by these revisions are
generated at DEC’s coal-fired facilities. The revisions prohibit the discharge of bottom and fly ash
transport water, and flue gas mercury control wastewater, and establish technology based limits on
the discharge of wastewater generated by Flue Gas Desulfurization (FGD) systems, and leachate
from coal combustion residual landfills and impoundments. The rule, also, establishes technology
based limits on gasification wastewater, but this waste stream is not generated at any of the DEC
facilities. The new limits must be incorporated into the applicable stations’ National Pollutant
Discharge Elimination System permit based on a date determined by the permitting authority that is
as soon as possible beginning November 1, 2018, but no later than December 31, 2023, with the
exception of limits for CCR leachate, which are effective upon issuance of the permit after the
effective date of the rule. For discharges to publically owned treatment works (POTW), the limits
must be met by November 1, 2018.
The extent to which the rule will affect a particular steam electric generating unit will depend on the
treatment technology currently installed at the station. A summary of the impacts are as follows:
Fly Ash Transport Water: All DEC coal-fired units either handling fly ash dry during normal
operation or are in the process of converting to dry fly ash handling. However, to ensure fly ash is
handled dry without disruptions to generation, dry fly ash reliability projects are being completed.
Bottom Ash Transport Water: All DEC coal-fired units, except for Rogers / Cliffside 6, will be
required to install a closed-loop or a dry bottom ash handling system.
FGD Wastewater: All DEC coal-fired units, except for Rogers / Cliffside 6 will be required to
upgrade or completely replace the existing FGD wastewater treatment system. Even though Allen
Duke Energy Carolinas
South Carolina
PUBLIC
2016 IRP Annual Report
Integrated Resource Plan
September 1, 2016
156
and Belews Creek Steam Stations utilize the model technology, which was the basis for the
limits, additional treatment is expected to be required to ensure compliance.
CCR Leachate: The revised limits for CCR leachate from impoundments and landfills are same as
the existing limits for low volume waste. Potential impacts are being evaluated on a facility basis.
Coal Combustion Residuals
In January 2009, following Tennessee Valley Authority’s Kingston ash pond dike failure December
2008, Congress issued a mandate to EPA to develop federal regulations for the disposal of coal
combustion residuals. CCR includes fly ash, bottom ash, and flue gas desulfurization solids. In the
interim, EPA conducted structural integrity inspections of all the surface impoundments nationwide
that were used for disposal of CCR. In June 2010 EPA proposed the CCR rule for notice and
comment and then published the final rule on April 17, 2015. The CCR rule regulates CCR as a
nonhazardous waste under Subtitle D of RCRA and allows for beneficial use of CCR with some
restrictions. The effective date of the rule was October 19, 2015.
The CCR rule applies to all new and existing landfills, new and existing surface impoundments
receiving CCR and existing surface impoundments that are no longer receiving CCR but contain
liquid located at stations currently generating electricity (regardless of fuel source). The rule
establishes requirements regarding landfill design, structural integrity design and assessment criteria
for surface impoundments, groundwater monitoring and protection procedures and other operational
and reporting procedures to ensure the safe disposal and management of CCR.
In addition to the requirements of the federal CCR regulation, CCR landfills and surface
impoundments will continue to be independently regulated by the state. On September 20, 2014,
the North Carolina Coal Ash Management Act of 2014 (CAMA) became law and was amended on
June 24, 2015 and amended a second time on July 15, 2016.
CAMA establishes requirements regarding the use of CCR, the closure of existing CCR surface
impoundments, the disposal of CCR at active coal plants, and the handling of surface and
groundwater impacts from CCR surface impoundments. CAMA requires eight CCR surface
impoundments in North Carolina to be closed no later than August 1, 2019. It also required state
regulators to provide risk ranking classifications to determine the method and timing for closing the
remaining CCR surface impoundments. North Carolina Department of Environmental Quality
(NCDEQ) has categorized all remaining CCR surface impoundments as intermediate risk. CAMA
also grants NCDEQ the authority to change a impoundment’s classification based on dam safety
repairs completed or the removal of any threat to drinking water. The impact from both state and
federal CCR regulations to Duke Energy Carolinas is significant.

Duke Energy Carolinas
South Carolina
PUBLIC
2016 IRP Annual Report
Integrated Resource Plan
September 1, 2016
157
APPENDIX H: NON-UTILITY GENERATION AND WHOLESALE
This appendix contains wholesale sales contracts, firm wholesale purchased power contracts and
non-utility generation contracts.

Duke Energy Carolinas
South Carolina
PUBLIC
2016 IRP Annual Report
Integrated Resource Plan
September 1, 2016
158
Table H-1 Wholesale Sales Contracts CONFIDENTIAL
Notes:
- Backstand contract values represent the reserve margin amount. For example, for NCEMC Backstand of Catawba 1, 15% * 630 = 95 MWs
- For wholesale contracts, Duke Carolinas/Duke Progress assumes all wholesale contracts will renew unless there is an indication that the contract will not be
renewed.
- For the period that the wholesale load is undesignated, contract volumes are projected using the same methodology as was assumed in the original contract
(e.g. econometric modeling, past volumes with weather normalization and growth rates, etc.).
Wholesale Contracts
Customer Product Term
Commitment (MW)
2016 2017 2018 2019 2020 2021 2022 2023 2024 2025
Concord Partial Requirements 2009-2018 176 178 181 0 0 0 0 0 0 0
Dallas Partial Requirements 2009-2028 11 12 12 12 12 12 12 13 13 13
Due West Partial Requirements 2009-2028 2 3 3 3 3 3 3 3 3 3
Forest City Partial Requirements 2009-2028 19 19 19 19 20 20 20 20 21 21
Greenwood Full Requirements 2010-2018 59 59 60 0 0 0 0 0 0 0
Highlands Full Requirements 2010-2029 8 8 8 8 8 8 9 9 9 9
Kings Mountain Partial Requirements 2009-2018 22 22 22 0 0 0 0 0 0 0
Lockhart Partial Requirements 2009-2028 38 38 38 39 39 37 38 38 37 34
Prosperity Partial Requirements 2009-2028 2 2 2 2 2 2 2 2 2 2
Western Carolina Full Requirements 2010-2021 6 6 6 6 6 6 6 6 6 6
Blue Ridge EMC Full Requirements 2010-2031 213 215 217 219 222 224 226 229 231 234
Central EPC Partial Requirements 2013-2030 456 562 686 777 793 811 829 845 859 878
Haywood EMC Full Requirements 2009-2031 22 22 22 22 23 23 23 24 24 24
NCEMC Fixed Load Shape 2009-2038 72 72 72 72 72 72 72 72 72 72
NCEMC Backstand 1985-2043 95 95 87 87 87 87 87 87 87 87
Piedmont EMC Full Requirements 2010-2031 83 84 85 86 87 87 88 89 90 91
PMPA Backstand 2014-2020 47 47 47 47 47 0 0 0 0 0
Rutherford EMC Partial Requirements 2010-2031 222 225 228 231 234 237 240 244 247 251

Duke Energy Carolinas
South Carolina
PUBLIC
2016 IRP Annual Report
Integrated Resource Plan
September 1, 2016
159
Table H-2 Firm Wholesale Purchased Power Contracts CONFIDENTIAL
Purchased Power Contract
Primary
Fuel Type
Summer
Capacity
(MW)
Capacity
Designation
Location
Term
Volume of
Purchases
(MWh)
Jul 15-Jun 16
Cherokee County
Cogeneration Partners, LLC 1 Gas 86 Peaking Gaffney, SC 12/31/2020
Blue Ridge EMC Hydro 7 Peaking GA-AL-SC system EOP 17,603
Blue Ridge EMC Nuclear 32 Base Boone, NC EOP 280,920
Blue Ridge EMC Fuel Oil 5 Peaking Boone, NC 12/31/2021 21,240
City of Concord, NC Fuel Oil 29 Peaking Concord, NC 12/31/2018 154,314
City of Dallas, NC Fuel Oil 3 Peaking Dallas, NC 12/31/2018 17
City of Forest City, NC Fuel Oil 11 Peaking Forest City, NC 12/31/2018 9
City of Kings Mountain, NC Fuel Oil 10 Peaking Kings Mountain, NC 12/31/2018 56
Lockhart Power Hydro 3 Peaking Lockhart, SC 12/31/2018 0
Haywood EMC Gas 4 Peaking Waynesville, NC 12/31/2021 2,776
Haywood EMC Nuclear 3 Base Waynesville, NC EOP 26,328
Haywood EMC Gas 1 Peaking Waynesville, NC 12/31/2021 21
Haywood EMC Hydro 1 Peaking GA-AL-SC system EOP 2,207
Haywood EMC System 3 Base Waynesville, NC 12/31/2019 24,052
Haywood EMC System 2 Base Waynesville, NC 12/31/2021 17,568
Haywood EMC System 2 Intermediate Waynesville, NC 12/31/2021 7,732
Piedmont EMC Nuclear 16 Base Hillsborough, NC EOP 140,472
Notes: EOP: End of study period
The capacities shown are delivered to the DEC system and may differ from the contracted amount.
Renewables purchases are listed in the NC REPS Compliance Plan in the Attachment to this IRP.
Data represented above represents contractual agreements. These resources may be modeled differently in our analyses.
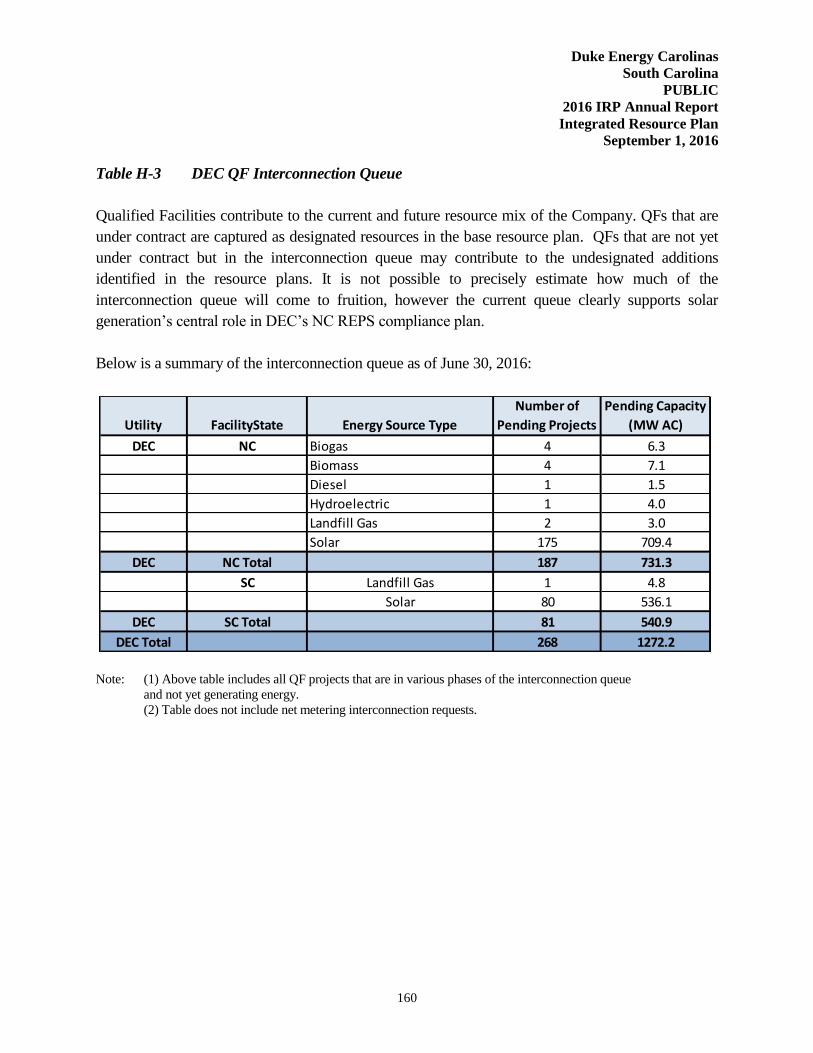
Duke Energy Carolinas
South Carolina
PUBLIC
2016 IRP Annual Report
Integrated Resource Plan
September 1, 2016
160
Table H-3 DEC QF Interconnection Queue
Qualified Facilities contribute to the current and future resource mix of the Company. QFs that are
under contract are captured as designated resources in the base resource plan. QFs that are not yet
under contract but in the interconnection queue may contribute to the undesignated additions
identified in the resource plans. It is not possible to precisely estimate how much of the
interconnection queue will come to fruition, however the current queue clearly supports solar
generation’s central role in DEC’s NC REPS compliance plan.
Below is a summary of the interconnection queue as of June 30, 2016:
Note: (1) Above table includes all QF projects that are in various phases of the interconnection queue
and not yet generating energy.
(2) Table does not include net metering interconnection requests.
Utility FacilityState Energy Source Type
Number of
Pending Projects
Pending Capacity
(MW AC)
DEC NC Biogas 4 6.3
Biomass 4 7.1
Diesel 1 1.5
Hydroelectric 1 4.0
Landfill Gas 2 3.0
Solar 175 709.4
DEC NC Total 187 731.3
SC Landfill Gas 1 4.8
Solar 80 536.1
DEC SC Total 81 540.9
DEC Total 268 1272.2
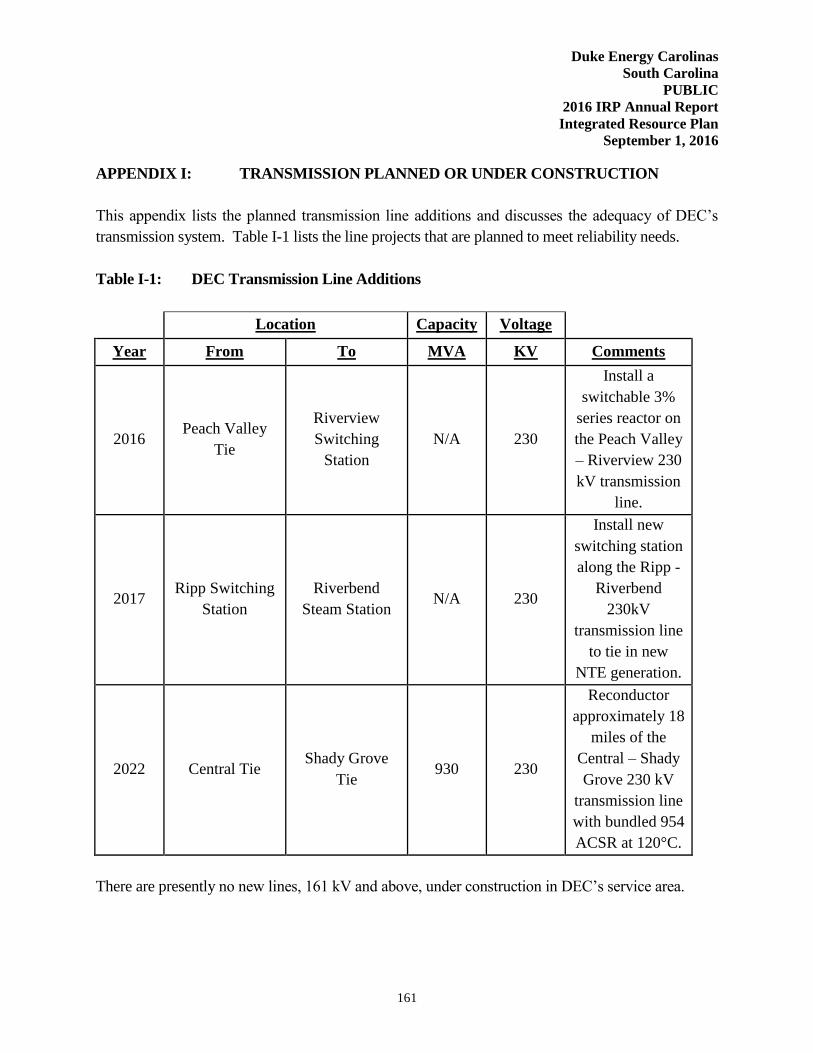
Duke Energy Carolinas
South Carolina
PUBLIC
2016 IRP Annual Report
Integrated Resource Plan
September 1, 2016
161
APPENDIX I: TRANSMISSION PLANNED OR UNDER CONSTRUCTION
This appendix lists the planned transmission line additions and discusses the adequacy of DEC’s
transmission system. Table I-1 lists the line projects that are planned to meet reliability needs.
Table I-1: DEC Transmission Line Additions
Location Capacity Voltage
Year From To MVA KV Comments
2016 Peach Valley
Tie
Riverview
Switching
Station
N/A 230
Install a
switchable 3%
series reactor on
the Peach Valley
– Riverview 230
kV transmission
line.
2017 Ripp Switching
Station
Riverbend
Steam Station N/A 230
Install new
switching station
along the Ripp -
Riverbend
230kV
transmission line
to tie in new
NTE generation.
2022 Central Tie Shady Grove
Tie 930 230
Reconductor
approximately 18
miles of the
Central – Shady
Grove 230 kV
transmission line
with bundled 954
ACSR at 120°C.
There are presently no new lines, 161 kV and above, under construction in DEC’s service area.
Duke Energy Carolinas
South Carolina
PUBLIC
2016 IRP Annual Report
Integrated Resource Plan
September 1, 2016
162
DEC Transmission System Adequacy
Duke Energy Carolinas monitors the adequacy and reliability of its transmission system and
interconnections through internal analysis and participation in regional reliability groups. Internal
transmission planning looks 10 years ahead at available generating resources and projected load to
identify transmission system upgrade and expansion requirements. Corrective actions are planned
and implemented in advance to ensure continued cost-effective and high-quality service. The DEC
transmission model is incorporated into models used by regional reliability groups in developing
plans to maintain interconnected transmission system reliability. DEC works with DEP, NCEMC
and ElectriCities to develop an annual NC Transmission Planning Collaborative (NCTPC) plan for
the DEC and DEP systems in both North and South Carolina. In addition, transmission planning is
coordinated with neighboring systems including South Carolina Electric & Gas (SCE&G) and
Santee Cooper under a number of mechanisms including legacy interchange agreements between
SCE&G, Santee Cooper, DEP, and DEC.
The Company monitors transmission system reliability by evaluating changes in load, generating
capacity, transactions and topography. A detailed annual screening ensures compliance with DEC’s
Transmission Planning Guidelines for voltage and thermal loading. The annual screening uses
methods that comply with SERC policy and NERC Reliability Standards and the screening results
identify the need for future transmission system expansion and upgrades.
Transmission planning and requests for transmission service and generator interconnection are
interrelated to the resource planning process. DEC currently evaluates all transmission reservation
requests for impact on transfer capability, as well as compliance with the Company’s Transmission
Planning Guidelines and the FERC Open Access Transmission Tariff (OATT). The Company
performs studies to ensure transfer capability is acceptable to meet reliability needs and customers’
expected use of the transmission system. Generator interconnection requests are studied in
accordance with the Large and Small Generator Interconnection Procedures in the OATT.
Southeastern Reliability Corporation (SERC) audits DEC every three years for compliance with
NERC Reliability Standards. Specifically, the audit requires DEC to demonstrate that its
transmission planning practices meet NERC standards and to provide data supporting the
Company’s annual compliance filing certifications. SERC conducted a NERC Reliability Standards
compliance audit of DEC in May 2014. The scope of this audit included standards impacting the
Transmission Planning area. DEC received “No Findings” from the audit team in the Transmission
Planning area.
Duke Energy Carolinas
South Carolina
PUBLIC
2016 IRP Annual Report
Integrated Resource Plan
September 1, 2016
163
DEC participates in a number of regional reliability groups to coordinate analysis of regional, sub-
regional and inter-balancing authority area transfer capability and interconnection reliability. The
reliability groups’ purpose is to:
Assess the interconnected system’s capability to handle large firm and non-firm
transactions for purposes of economic access to resources and system reliability;
Ensure that planned future transmission system improvements do not adversely
affect neighboring systems; and
Ensure interconnected system compliance with NERC Reliability Standards.
Regional reliability groups evaluate transfer capability and compliance with NERC Reliability
Standards for the upcoming peak season and five- and ten-year periods. The groups also perform
computer simulation tests for high transfer levels to verify satisfactory transfer capability.
Application of the practices and procedures described above have ensured DEC’s transmission
system is expected to continue to provide reliable service to its native load and firm transmission
customers.
Duke Energy Carolinas
South Carolina
PUBLIC
2016 IRP Annual Report
Integrated Resource Plan
September 1, 2016
164
APPENDIX J: CROSS-REFERENCE OF IRP REQUIREMENTS AND SUBSEQUENT
ORDERS
The following table cross-references IRP regulatory requirements for SC Code Ann. § 58-37-10 in
South Carolina and identifies where those requirements are discussed in the IRP.
Requirement Location Reference Updated
B. REQUIREMENTS FOR THE DEVELOPMENT AND COMPOSITION OF THE IRP FILING (Cont.)
1. Environmental costs are to be considered on a monetized
basis where sufficient data is available. Those
environmental costs that cannot be monetized must be
addressed on a qualitative basis within the planning
process. Environmental costs are to be considered within
the IRP to the extent that they impact. the utility's specific
system costs such as meeting existing regulatory standards
and such standards as ran be reasonably anticipated to
occur. The term "reasonably anticipated to occur" refers to
standards that are in the process of being developed and
are known to be forthcoming but are not finalized at the
time of analysis. This does not mean that. the utility is
prohibited from incorporating factors which go beyond the
above definition. Should the utility feel that other factors
(environmental or other) are important and need to be
incorporated within the planning process, it needs to
justify within the IRP the basis for inclusion.
a. Environmental costs should be monetized and
included within the planning process whenever
possible. To the extent that environmental costs cannot
be monetized the utility must consider them on a
qualitative basis in developing the plan. The same
guideline applies to relevant utility and customer
costs.
b. Each utility must provide the general environmental
standards applicable to each supply-side option and
explain the impact of each supply-side option on
compliance with the standards. To the extent feasible
each utility should seek to identify on a quantitative
basis the impact of demand-side options on the
environment (i.e. reduced pollutant emissions, reduced
waste disposal, increased noise pollution, etc. ) Such
impacts ran be reflected on a qualitative basis when
quantitative information is not available.
c. Each utility should identify and monetize, to the extent
possible, the cost of compliance for existing and
projected supply-side options.
Ch. 8, App A SC § 58-37-
10
Yes

Duke Energy Carolinas
South Carolina
PUBLIC
2016 IRP Annual Report
Integrated Resource Plan
September 1, 2016
165
Requirement Location Reference Updated
2. Each utility must. provide a demand forecast (to include
both summer and winter peak demand) and an energy
forecast. Forecasting requirements for the IRP filing:
a. Forecast must incorporate explicit treatment of
demand-side resources.
b. Forecasting methodologies should seek to incorporate
"end-use" modeling techniques where they are
appropriate. End-use and econometric modeling
techniques can be combined where appropriate to seek
accuracy while being able to address the impacts of
demand-side options.
c. The IRP filing must incorporate energy and peak
demand forecasts that include an explanation of the
forecasting methodology and modeling procedures.
d. The IRP filing must incorporate summary statistics for
major models; assumptions followed within the
forecasting process; projected energy usage by
customer class; load factors by customer class; and
total system sales. The utility must file this
information, either as part of the IRP or as
supplemental material to the IRP.
e. An analysis must be performed to assess forecast
uncertainty. This can consist of a high, most likely,
low scenario analysis.
f. The utility should periodically test its forecasting
methodology for historical accuracy.
g. The utility must identify significant changes in
forecasting methodology.
Ch. 3, App C SC § 58-37-
10
Yes
3. The IRP filing must include a discussion of the risk
associated with the plan (risk assessment). Where feasible
the impacts of potential deviations from the plan should be
identified.
Ch. 8, App A SC § 58-37-
10
Yes
4. The transmission improvements and/or additions
necessary to support the IRP will also be provided within
the plan. This includes listing the transmission lines and
other associated facilities (125 kv or more) which are
under construction or proposed, including the capacity and
volt. age levels, locations, and schedules for completion
and operation.
App I SC § 58-37-
10
Yes
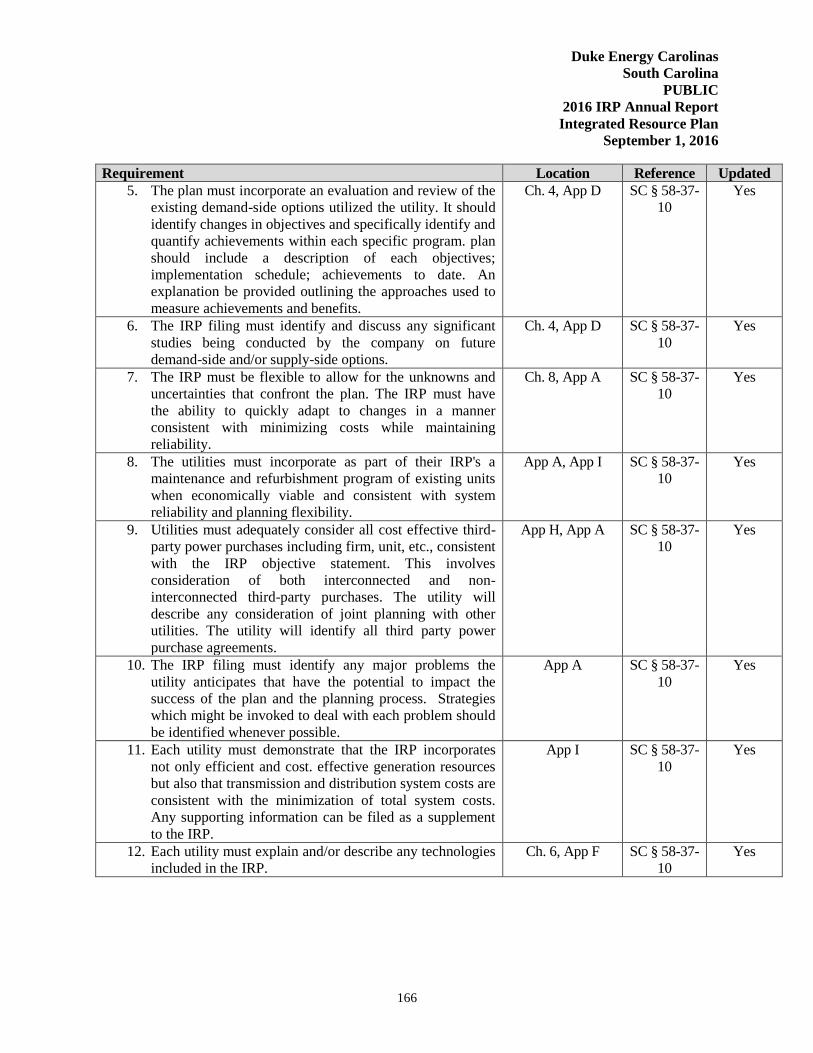
Duke Energy Carolinas
South Carolina
PUBLIC
2016 IRP Annual Report
Integrated Resource Plan
September 1, 2016
166
Requirement Location Reference Updated
5. The plan must incorporate an evaluation and review of the
existing demand-side options utilized the utility. It should
identify changes in objectives and specifically identify and
quantify achievements within each specific program. plan
should include a description of each objectives;
implementation schedule; achievements to date. An
explanation be provided outlining the approaches used to
measure achievements and benefits.
Ch. 4, App D SC § 58-37-
10
Yes
6. The IRP filing must identify and discuss any significant
studies being conducted by the company on future
demand-side and/or supply-side options.
Ch. 4, App D SC § 58-37-
10
Yes
7. The IRP must be flexible to allow for the unknowns and
uncertainties that confront the plan. The IRP must have
the ability to quickly adapt to changes in a manner
consistent with minimizing costs while maintaining
reliability.
Ch. 8, App A SC § 58-37-
10
Yes
8. The utilities must incorporate as part of their IRP's a
maintenance and refurbishment program of existing units
when economically viable and consistent with system
reliability and planning flexibility.
App A, App I SC § 58-37-
10
Yes
9. Utilities must adequately consider all cost effective third-
party power purchases including firm, unit, etc., consistent
with the IRP objective statement. This involves
consideration of both interconnected and non-
interconnected third-party purchases. The utility will
describe any consideration of joint planning with other
utilities. The utility will identify all third party power
purchase agreements.
App H, App A SC § 58-37-
10
Yes
10. The IRP filing must identify any major problems the
utility anticipates that have the potential to impact the
success of the plan and the planning process. Strategies
which might be invoked to deal with each problem should
be identified whenever possible.
App A SC § 58-37-
10
Yes
11. Each utility must demonstrate that the IRP incorporates
not only efficient and cost. effective generation resources
but also that transmission and distribution system costs are
consistent with the minimization of total system costs.
Any supporting information can be filed as a supplement
to the IRP.
App I SC § 58-37-
10
Yes
12. Each utility must explain and/or describe any technologies
included in the IRP.
Ch. 6, App F SC § 58-37-
10
Yes

Duke Energy Carolinas
South Carolina
PUBLIC
2016 IRP Annual Report
Integrated Resource Plan
September 1, 2016
167
Requirement Location Reference Updated
13. Each future supply-side option incorporated within the
identified. fuel source; anticipated generating capacity;
anticipated date of initial construction; anticipated date of
commercial operation; etc. provided for each option.
Utility shall identify the anticipated location of future
supply-side option it is consistent with the utility's
proprietary interests.
Exec Summary,
Ch. 8, App A
SC § 58-37-
10
Yes
14. The IRP must demonstrate that each utility is pursuing
those resource options available for less than the avoided
costs of new supply-side alternatives. Demand-side
options will included in the IRP to the extent they are
cost-effective are consistent with the Commission
objective statement for the IRP. Utility DSM plans shall
give attention to capturing lost opportunity resources.
They include those cost effective energy efficiency
savings that can only be realized during a narrow time
period, such as in new construction, renovation, and in
routine replacement of existing equipment.
App D SC § 58-37-
10 Yes
Duke Energy Carolinas
South Carolina 2016 Integrated Resource Plan (Annual PlanBiennial Report)
September 1, 2016
ConfidentialPUBLIC

Duke Energy Carolinas
South Carolina
PUBLIC
2016 IRP Annual Report
Integrated Resource Plan
September 1, 2016
13
2. SYSTEM OVERVIEW
DEC provides electric service to an approximately 24,088-square-mile service area in central and
western North Carolina and western South Carolina. In addition to retail sales to approximately
2.48 million customers, the Company also sells wholesale electricity to incorporated
municipalities and to public and private utilities. Recent historical values for the number of
customers and sales of electricity by customer groupings may be found in Appendix C.
DEC currently meets energy demand, in part, by purchases from the open market, through longer-
term purchased power contracts and from the following electric generation assets:
Three nuclear generating stations with a combined capacity of 7,358 MW/7,160 MW
(winter/summer)
Four coal-fired stations with a combined capacity of 6,859 MW/ 6,821 MW
(winter/summer)
29 hydroelectric stations (including two pumped-storage facilities) with a combined
capacity of 3,238 MW (winter/summer)
Four CT stations and two CC stations with a combined capacity of 4,607 MW/4,089 MW
(winter/summer)
18 utility-owned solar facilities with a combined firm capacity of 3.9 MW
One natural gas boiler with a capacity of 170 MW (winter/summer)
The Company’s power delivery system consists of approximately 103,140 miles of distribution
lines and 13,087 miles of transmission lines. The transmission system is directly connected to all of
the Transmission Operators that surround the DEC service territory. There are 36 tie-line circuits
connecting with nine different Transmission Operators: DEP, PJM Interconnection, LLC (PJM),
Tennessee Valley Authority (TVA), Smokey Mountain Transmission, Southern Company, Yadkin,
Southeastern Power Administration (SEPA), South Carolina Electric & Gas (SCE&G) and Santee
Cooper. These interconnections allow utilities to work together to provide an additional level of
reliability. The strength of the system is also reinforced through coordination with other electric
service providers in the Virginia-Carolinas (VACAR) sub-region, SERC Reliability Corporation
(SERC) (formerly Southeastern Electric Reliability Council) and North American Electric
Reliability Corporation (NERC).
The map on the following page provides a high-level view of the DEC service area.
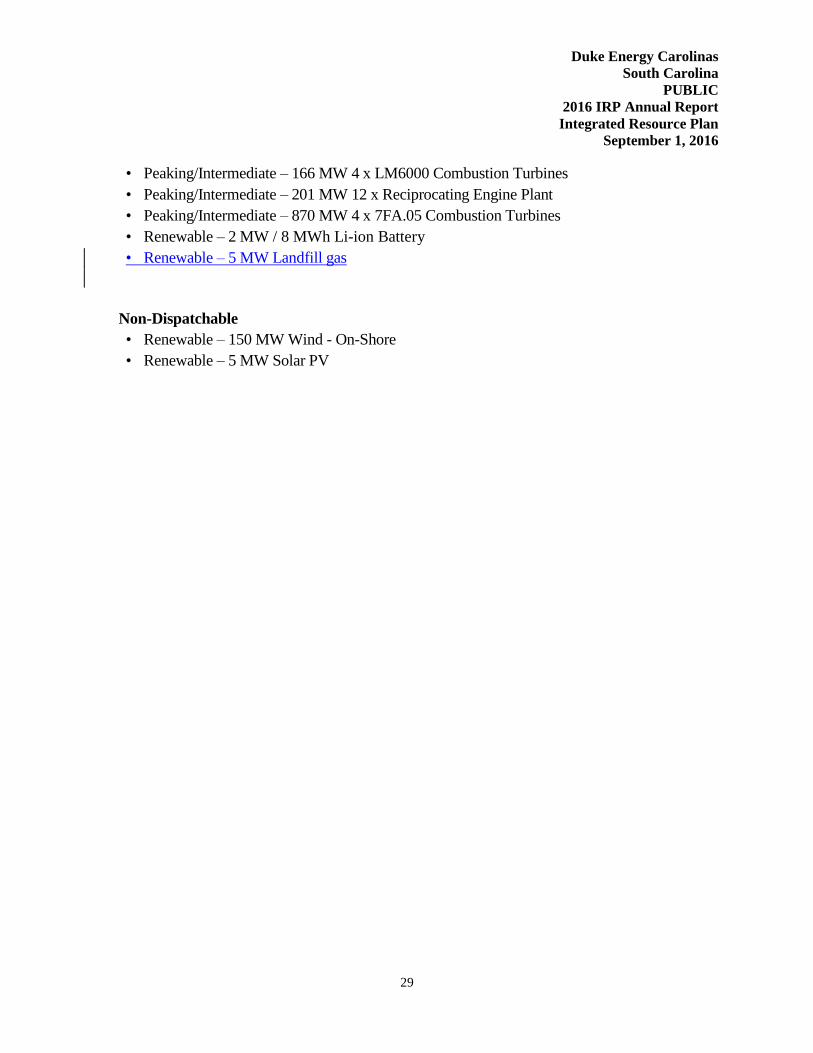
Duke Energy Carolinas
South Carolina
PUBLIC
2016 IRP Annual Report
Integrated Resource Plan
September 1, 2016
29
• Peaking/Intermediate – 166 MW 4 x LM6000 Combustion Turbines
• Peaking/Intermediate – 201 MW 12 x Reciprocating Engine Plant
• Peaking/Intermediate – 870 MW 4 x 7FA.05 Combustion Turbines
• Renewable – 2 MW / 8 MWh Li-ion Battery
• Renewable – 5 MW Landfill gas
Non-Dispatchable
• Renewable – 150 MW Wind - On-Shore
• Renewable – 5 MW Solar PV

Duke Energy Carolinas
South Carolina
PUBLIC
2016 IRP Annual Report
Integrated Resource Plan
September 1, 2016
42
DEC - Assumptions of Load, Capacity, and Reserves Table
The following notes are numbered to match the line numbers on the Winter Projections of Load,
Capacity, and Reserves tables. All values are MW (winter ratings) except where shown as a
Percent.
1. Planning is done for the peak demand for the Duke Energy Carolinas System including
Nantahala.
A firm wholesale backstand agreement for 47 MW between Duke Energy Carolinas and
Piedmont Municipal Power Agency (PMPA) starts on 1/1/2014 and continues through the
end of 2020. This backstand is included in Line 1.
2. No additional firm sales are included.
3. Cumulative new energy efficiency and conservation programs (does not include demand
response programs).
4. Peak load adjusted for firm sales and cumulative energy efficiency.
5. Existing generating capacity reflecting designated additions, planned uprates, retirements
and derates as of January 1, 2016.
Includes 101 MW Nantahala hydro capacity, and total capacity for Catawba Nuclear Station
less 832 MW to account for North Carolina Municipal Power Agency #1 (NCMPA1) firm
capacity sale.
6. Capacity Additions include:
Includes runner upgrades on each of the four Bad Creek pumped storage units. Each
upgrade is expected to be 46.4 MW and are projected in the 2021 – 2024 timeframe. One
unit will be upgraded per year.
Lee Combined Cycle is reflected in 2018 (683 MW). This is the DEC capacity net of 100
MW to be owned by NCEMC.
Capacity Additions include Duke Energy Carolinas hydro units scheduled to be repaired and
returned to service. The units are returned to service in the 2017-2020 timeframe and total
16 MW.
Also included is a 9185 MW capacity increase due to nuclear uprates at Catawba and
Oconee. Timing of these uprates is shown from 2017-2020.

Duke Energy Carolinas
South Carolina
PUBLIC
2016 IRP Annual Report
Integrated Resource Plan
September 1, 2016
50
Table 8-H DEC System Carbon Mass Cap Case Winter Resources by Fuel Type
A detailed discussion of the assumptions, inputs and analytics used in the development of the
System Mass Cap Case is contained in Appendix A. As previously noted, the further out in time
planned additions or retirements are within the 2016 IRP, the greater the opportunity for input
assumptions to change. Thus, resource allocation decisions at the end of the planning horizon have
a greater possibility for change as compared to those earlier in the planning horizon.
Joint Planning Case
A Joint Planning Case that begins to explore the potential for DEC and DEP to share firm
capacity between the Companies was also developed. The focus of this case is to illustrate the
potential for the Utilities to collectively defer generation investment by utilizing each other’s
capacity when available and by jointly owning or purchasing new capacity additions. This case
does not address the specific implementation methods or issues required to implement shared
capacity. Rather, this case illustrates the benefits of joint planning between DEC and DEP with
Nuclear 2325
CC 1904
CT 700
Hydro 202
CHP 109
Solar 232
Total 5240
DEC System Mass Cap Resources
Cumulative Winter Totals - 2017 - 2031
(Original)
(Revised)
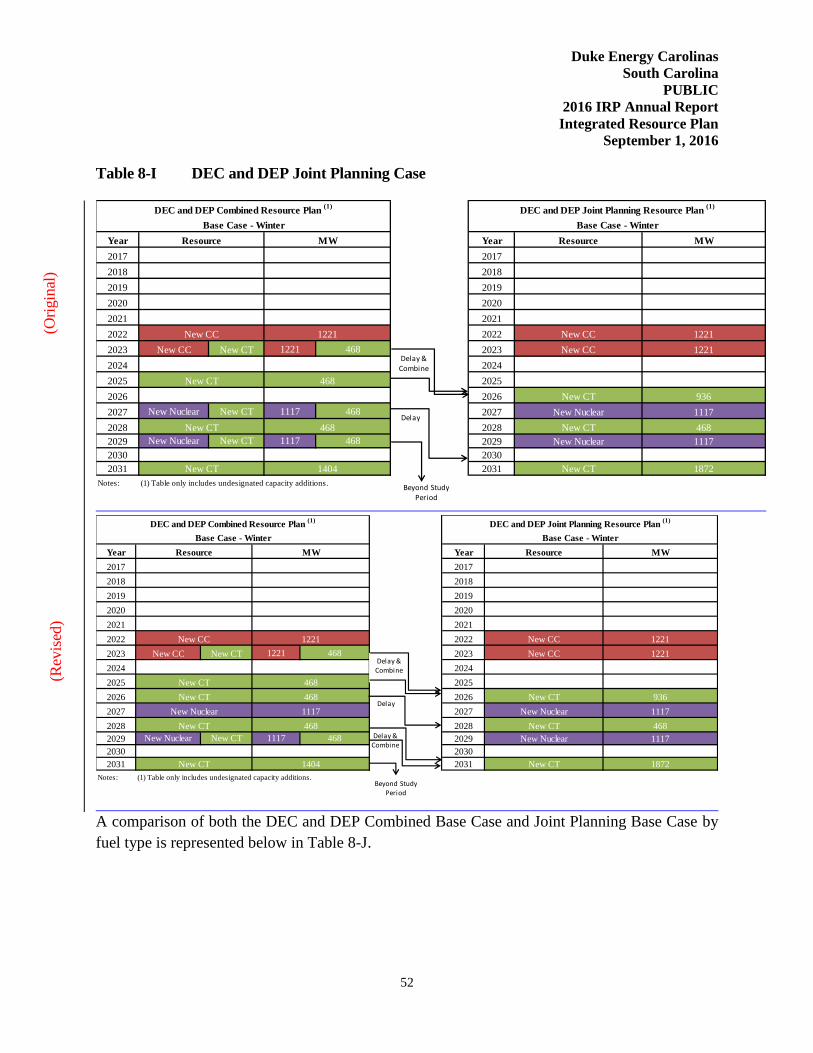
Duke Energy Carolinas
South Carolina
PUBLIC
2016 IRP Annual Report
Integrated Resource Plan
September 1, 2016
52
Table 8-I DEC and DEP Joint Planning Case
A comparison of both the DEC and DEP Combined Base Case and Joint Planning Base Case by
fuel type is represented below in Table 8-J.
Year Year
2017 2017
2018 2018
2019 2019
2020 2020
2021 2021
2022 2022
2023 New CC New CT 1221 468 2023
2024 2024
2025 2025
2026 2026
2027 New Nuclear New CT 1117 468 2027
2028 2028
2029 New Nuclear New CT 1117 468 2029
2030 2030
2031 2031
Notes: (1) Table only includes undesignated capacity additions.
New CT 468
1117
New CT 468
936
1117
468
New CT
New CT 1404
New Nuclear
New CT
DEC and DEP Combined Resource Plan (1)
Base Case - Winter
Resource MW
1221New CC
Base Case - Winter
Resource
1872
1221
1221New CC
DEC and DEP Joint Planning Resource Plan (1)
MW
New Nuclear
New CT
New CC
Beyond Study Period
Delay
Delay & Combine
Year Year
2017 2017
2018 2018
2019 2019
2020 2020
2021 2021
2022 2022
2023 New CC New CT 1221 468 2023
2024 2024
2025 2025
2026 2026
2027 2027
2028 2028
2029 New Nuclear New CT 1117 468 2029
2030 2030
2031 2031
Notes: (1) Table only includes undesignated capacity additions.
DEC and DEP Joint Planning Resource Plan (1)
MW
New Nuclear
New CT
New CC
Base Case - Winter
Resource
1872
1221
1221New CC
DEC and DEP Combined Resource Plan (1)
Base Case - Winter
Resource MW
New CT 468
1221New CC
New CT 1404
New Nuclear
New CT
New CT 468
1117
New CT 468
936
1117
468
New CT
New Nuclear 1117
Beyond Study Period
Delay
Delay & Combine
Delay & Combine
(Ori
gin
al)
(Rev
ised
)
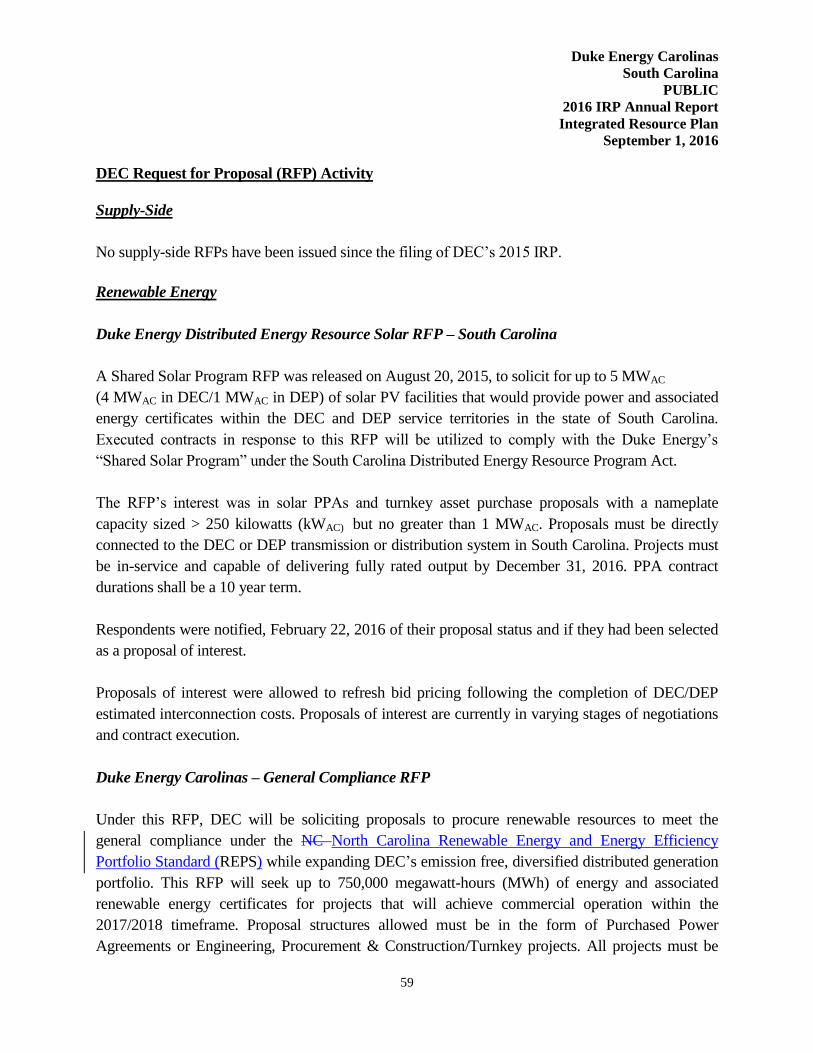
Duke Energy Carolinas
South Carolina
PUBLIC
2016 IRP Annual Report
Integrated Resource Plan
September 1, 2016
59
DEC Request for Proposal (RFP) Activity
Supply-Side
No supply-side RFPs have been issued since the filing of DEC’s 2015 IRP.
Renewable Energy
Duke Energy Distributed Energy Resource Solar RFP – South Carolina
A Shared Solar Program RFP was released on August 20, 2015, to solicit for up to 5 MWAC
(4 MWAC in DEC/1 MWAC in DEP) of solar PV facilities that would provide power and associated
energy certificates within the DEC and DEP service territories in the state of South Carolina.
Executed contracts in response to this RFP will be utilized to comply with the Duke Energy’s
“Shared Solar Program” under the South Carolina Distributed Energy Resource Program Act.
The RFP’s interest was in solar PPAs and turnkey asset purchase proposals with a nameplate
capacity sized > 250 kilowatts (kWAC) but no greater than 1 MWAC. Proposals must be directly
connected to the DEC or DEP transmission or distribution system in South Carolina. Projects must
be in-service and capable of delivering fully rated output by December 31, 2016. PPA contract
durations shall be a 10 year term.
Respondents were notified, February 22, 2016 of their proposal status and if they had been selected
as a proposal of interest.
Proposals of interest were allowed to refresh bid pricing following the completion of DEC/DEP
estimated interconnection costs. Proposals of interest are currently in varying stages of negotiations
and contract execution.
Duke Energy Carolinas – General Compliance RFP
Under this RFP, DEC will be soliciting proposals to procure renewable resources to meet the
general compliance under the NC North Carolina Renewable Energy and Energy Efficiency
Portfolio Standard (REPS) while expanding DEC’s emission free, diversified distributed generation
portfolio. This RFP will seek up to 750,000 megawatt-hours (MWh) of energy and associated
renewable energy certificates for projects that will achieve commercial operation within the
2017/2018 timeframe. Proposal structures allowed must be in the form of Purchased Power
Agreements or Engineering, Procurement & Construction/Turnkey projects. All projects must be
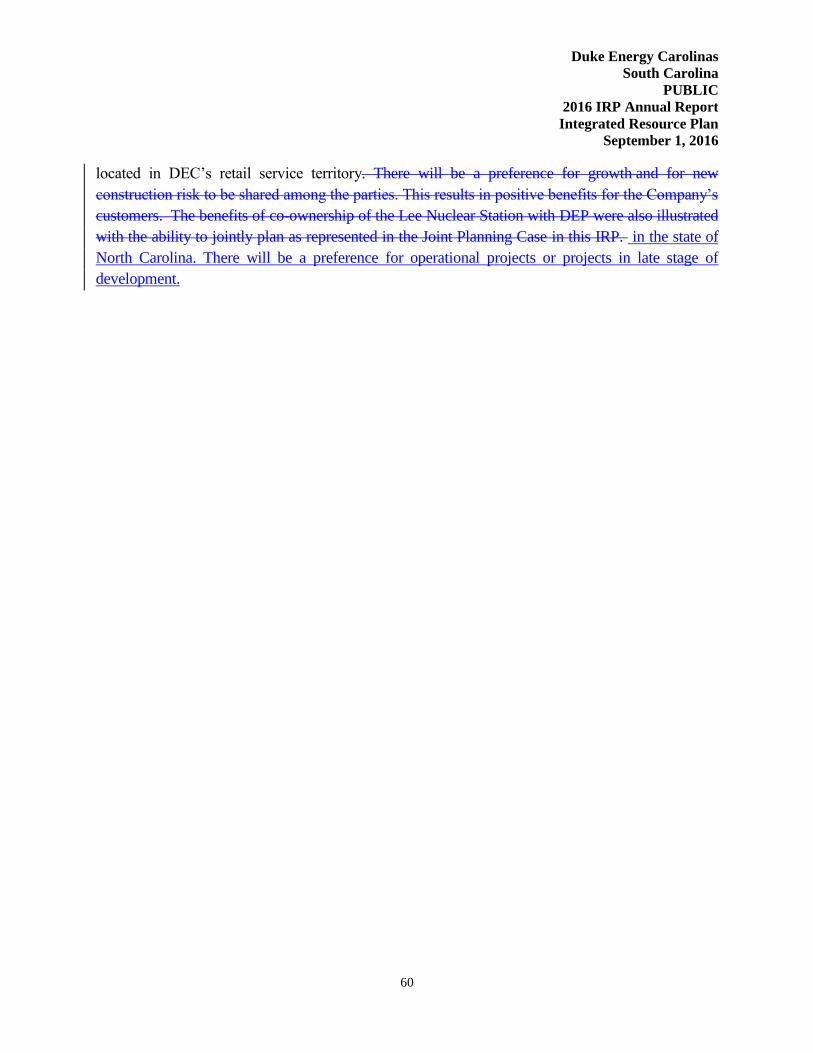
Duke Energy Carolinas
South Carolina
PUBLIC
2016 IRP Annual Report
Integrated Resource Plan
September 1, 2016
60
located in DEC’s retail service territory. There will be a preference for growth and for new
construction risk to be shared among the parties. This results in positive benefits for the Company’s
customers. The benefits of co-ownership of the Lee Nuclear Station with DEP were also illustrated
with the ability to jointly plan as represented in the Joint Planning Case in this IRP. in the state of
North Carolina. There will be a preference for operational projects or projects in late stage of
development.
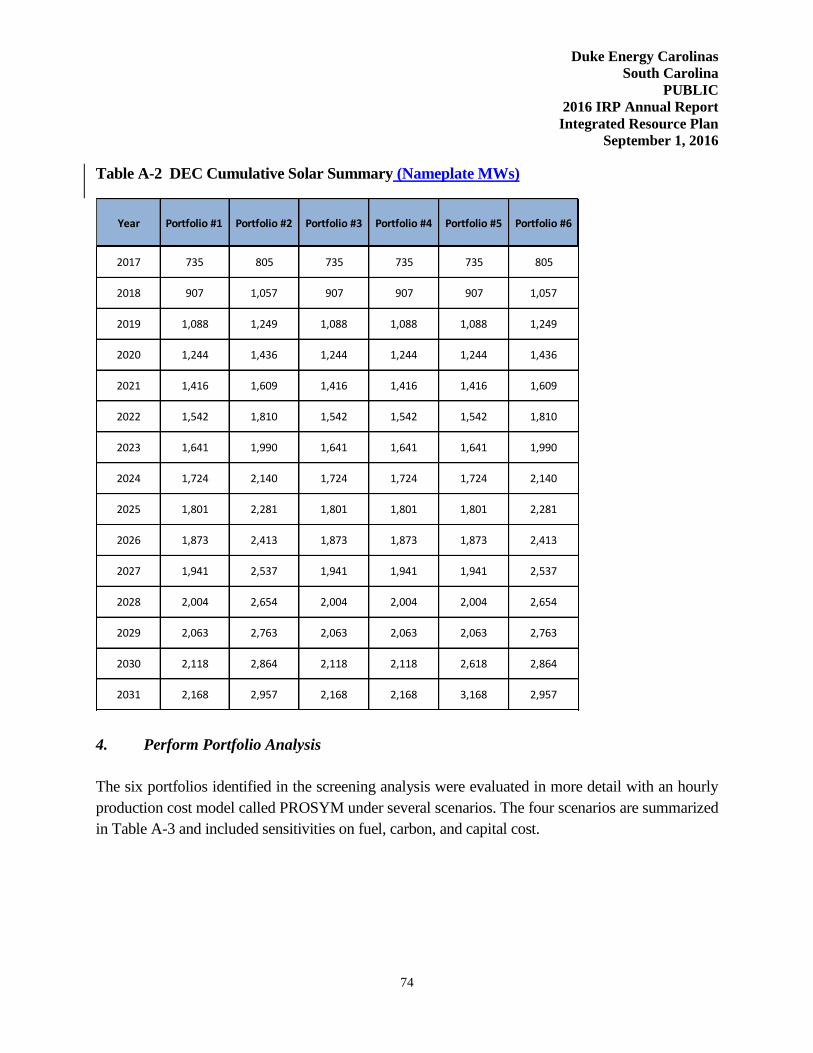
Duke Energy Carolinas
South Carolina
PUBLIC
2016 IRP Annual Report
Integrated Resource Plan
September 1, 2016
74
Table A-2 DEC Cumulative Solar Summary (Nameplate MWs)
4. Perform Portfolio Analysis
The six portfolios identified in the screening analysis were evaluated in more detail with an hourly
production cost model called PROSYM under several scenarios. The four scenarios are summarized
in Table A-3 and included sensitivities on fuel, carbon, and capital cost.
Year Portfolio #1 Portfolio #2 Portfolio #3 Portfolio #4 Portfolio #5 Portfolio #6
2017 735 805 735 735 735 805
2018 907 1,057 907 907 907 1,057
2019 1,088 1,249 1,088 1,088 1,088 1,249
2020 1,244 1,436 1,244 1,244 1,244 1,436
2021 1,416 1,609 1,416 1,416 1,416 1,609
2022 1,542 1,810 1,542 1,542 1,542 1,810
2023 1,641 1,990 1,641 1,641 1,641 1,990
2024 1,724 2,140 1,724 1,724 1,724 2,140
2025 1,801 2,281 1,801 1,801 1,801 2,281
2026 1,873 2,413 1,873 1,873 1,873 2,413
2027 1,941 2,537 1,941 1,941 1,941 2,537
2028 2,004 2,654 2,004 2,004 2,004 2,654
2029 2,063 2,763 2,063 2,063 2,063 2,763
2030 2,118 2,864 2,118 2,118 2,618 2,864
2031 2,168 2,957 2,168 2,168 3,168 2,957
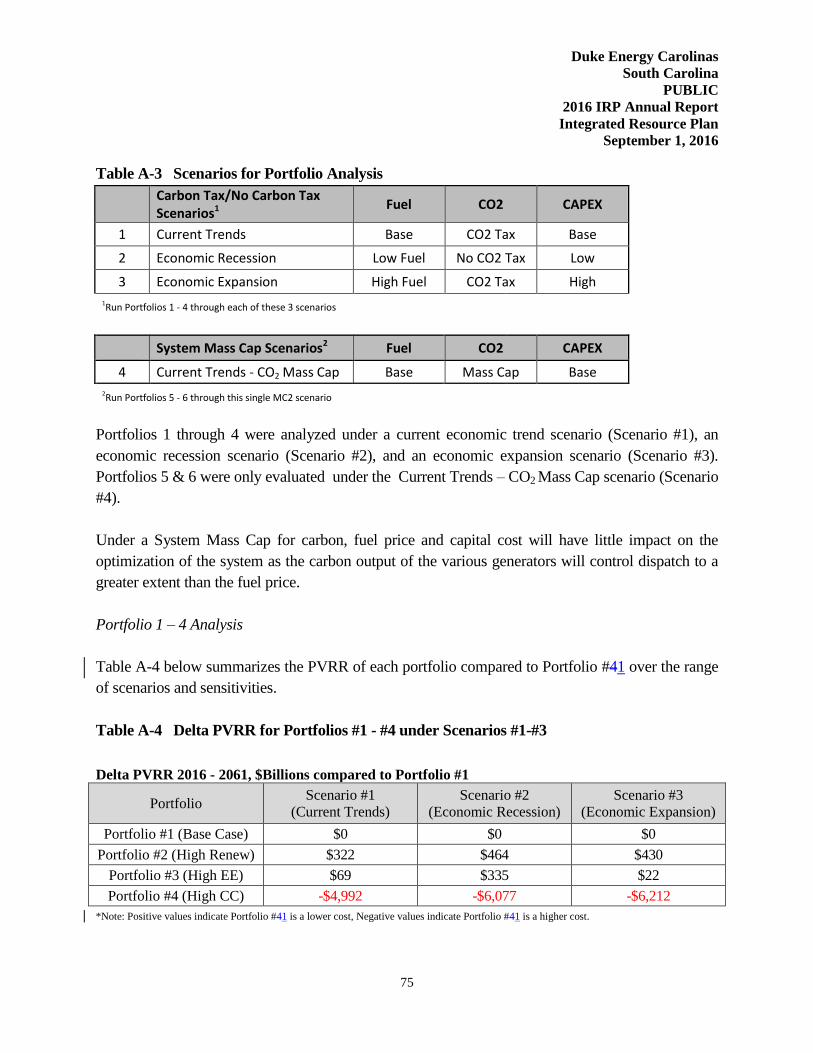
Duke Energy Carolinas
South Carolina
PUBLIC
2016 IRP Annual Report
Integrated Resource Plan
September 1, 2016
75
Table A-3 Scenarios for Portfolio Analysis
Carbon Tax/No Carbon Tax Scenarios1
Fuel CO2 CAPEX
1 Current Trends Base CO2 Tax Base
2 Economic Recession Low Fuel No CO2 Tax Low
3 Economic Expansion High Fuel CO2 Tax High
1Run Portfolios 1 - 4 through each of these 3 scenarios
System Mass Cap Scenarios2 Fuel CO2 CAPEX
4 Current Trends - CO2 Mass Cap Base Mass Cap Base
2Run Portfolios 5 - 6 through this single MC2 scenario
Portfolios 1 through 4 were analyzed under a current economic trend scenario (Scenario #1), an
economic recession scenario (Scenario #2), and an economic expansion scenario (Scenario #3).
Portfolios 5 & 6 were only evaluated under the Current Trends – CO2 Mass Cap scenario (Scenario
#4).
Under a System Mass Cap for carbon, fuel price and capital cost will have little impact on the
optimization of the system as the carbon output of the various generators will control dispatch to a
greater extent than the fuel price.
Portfolio 1 – 4 Analysis
Table A-4 below summarizes the PVRR of each portfolio compared to Portfolio #41 over the range
of scenarios and sensitivities.
Table A-4 Delta PVRR for Portfolios #1 - #4 under Scenarios #1-#3
Delta PVRR 2016 - 2061, $Billions compared to Portfolio #1
Portfolio Scenario #1
(Current Trends)
Scenario #2
(Economic Recession)
Scenario #3
(Economic Expansion)
Portfolio #1 (Base Case) $0 $0 $0
Portfolio #2 (High Renew) $322 $464 $430
Portfolio #3 (High EE) $69 $335 $22
Portfolio #4 (High CC) -$4,992 -$6,077 -$6,212
*Note: Positive values indicate Portfolio #41 is a lower cost, Negative values indicate Portfolio #41 is a higher cost.

Duke Energy Carolinas
South Carolina
PUBLIC
2016 IRP Annual Report
Integrated Resource Plan
September 1, 2016
128
Note: For DSM programs, Gross and Net are the same.
DEC’s approved EE plan is consistent with the requirement set forth in the Cliffside Unit 6 CPCN
Order to invest 1% of annual retail electricity revenues in EE and DSM programs, subject to the
results of ongoing collaborative workshops and appropriate regulatory treatment.
However, pursuing EE and DSM initiatives is not expected to meet all of the future incremental
peak demand for energy. DEC still envisions the need to secure additional generation, including
cost-effective renewable generation, but the EE and DSM programs offered by DEC will address a
significant portion of this need if such programs perform as expected.
EE Savings Variance since last IRP
In response to Order number 7 in the NCUC Order Approving Integrated Resource Plans and REPS
Compliance Plans regarding the 2014 Biennial IRPs, the Base Portfolio EE savings forecast of
MWh is within 10% of the forecast presented in the 2014 IRP when compared on the cumulative
achievements at year 20332031 of the forecasts as shown in the table below.
IS SG PowerShare PowerManager
EnergyWise
for Business
Total Annual
Peak
2016 115 15 374 478 3 985
2017 109 15 380 502 9 1,015
2018 103 14 391 522 18 1,048
2019 98 13 401 540 27 1,079
2020 94 13 412 555 36 1,109
2021 89 12 416 555 45 1,117
2022 88 12 416 555 45 1,115
2023 88 12 416 555 45 1,115
2024 88 12 416 555 45 1,115
2025 88 12 416 555 45 1,115
2026 88 12 416 555 45 1,115
2027 88 12 416 555 45 1,115
2028 88 12 416 555 45 1,115
2029 88 12 416 555 45 1,115
2030 88 12 416 555 45 1,115
2031 88 12 416 555 45 1,115
Base Portfolio Load Impacts of DSM Programs
Year
Annual Peak MW Reduction
Duke Energy Carolinas
South Carolina
PUBLIC
2016 IRP Annual Report
Integrated Resource Plan
September 1, 2016
141
Duke Energy is exploring and working with potential customers with good base thermal
loads on a regulated Combined Heat and Power offer. The CHP asset will be included
as part of Duke Energy’s IRP as a placeholder for future projects as described below.
The steam sales are credited back to the revenue requirement of the projects to reduce
the total cost of this generation grid resource, making this a low cost grid asset. Along
with the potential to be a competitive cost generation resource, CHP can result in CO2
emission reductions, deferral of T&D expenses, and present economic development
opportunities for the state.
Duke Energy has publically announced its first CHP project, a 20 MW investment at
Duke University. We are currently working with other industrial, military and
Universities for future project expansions.
Addition of Battery Storage to the IRP
Energy storage solutions are becoming an ever growing necessity in support of grid
stability at peak demand times and in support of energy shifting and smoothing from
renewable sources. Energy Storage in the form orof battery storage is becoming more
feasible with the advances in battery technology (Tesla low-cost Lithium-ion battery
technology) and the reduction in battery cost; however, their uses (even within Duke
Energy) have been concentrated on frequency regulation, solar smoothing, and/or
energy shifting from localized renewable energy sources with a high incidence of
intermittency (i.e. solar and wind applications).
Duke Energy has several projects in operation since 2011, mainly in support of
regulating output voltages/frequencies from renewable energy sources to the grid. This
includes projects as large as the Notrees Battery Storage project (36 MW) which
supports a wind farm down to the smaller 250 kW Marshall Battery Storage Project
which supports a 1.2 MW solar array. Additional examples include the Rankin Battery
Storage Project (402 kW), the McAlpine Community Energy Storage Project (24 kW),
McAlpine Substation Energy Storage Project (200 kW), and a 2 MW facility on Ohio’s
former Beckjord Station grounds. Each of these applications supports frequency
regulation, solar smoothing, or energy shifting from a local solar array. These examples
are only a few in support of a growing trend of coupling Battery Storage with an
intermittent renewable energy source such as solar or wind in an effort to stabilize
output and increase a facility's (renewable plus storage) net capacity factor.
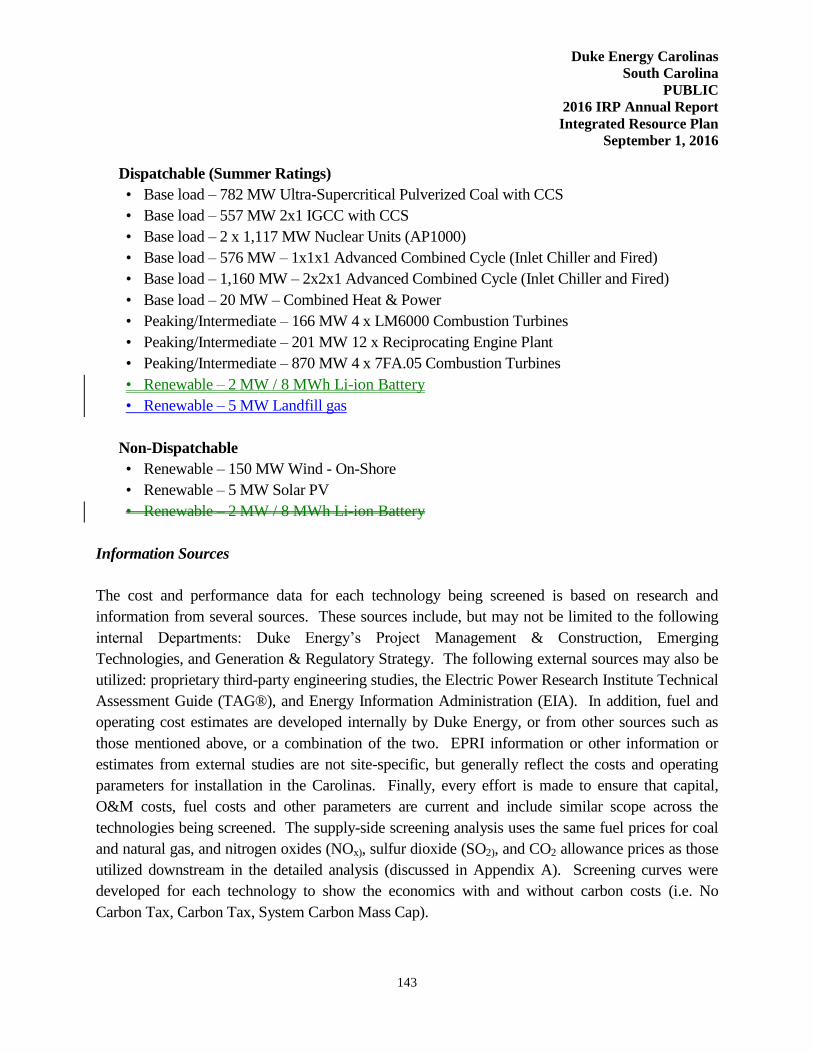
Duke Energy Carolinas
South Carolina
PUBLIC
2016 IRP Annual Report
Integrated Resource Plan
September 1, 2016
143
Dispatchable (Summer Ratings)
• Base load – 782 MW Ultra-Supercritical Pulverized Coal with CCS
• Base load – 557 MW 2x1 IGCC with CCS
• Base load – 2 x 1,117 MW Nuclear Units (AP1000)
• Base load – 576 MW – 1x1x1 Advanced Combined Cycle (Inlet Chiller and Fired)
• Base load – 1,160 MW – 2x2x1 Advanced Combined Cycle (Inlet Chiller and Fired)
• Base load – 20 MW – Combined Heat & Power
• Peaking/Intermediate – 166 MW 4 x LM6000 Combustion Turbines
• Peaking/Intermediate – 201 MW 12 x Reciprocating Engine Plant
• Peaking/Intermediate – 870 MW 4 x 7FA.05 Combustion Turbines
• Renewable – 2 MW / 8 MWh Li-ion Battery
• Renewable – 5 MW Landfill gas
Non-Dispatchable
• Renewable – 150 MW Wind - On-Shore
• Renewable – 5 MW Solar PV
• Renewable – 2 MW / 8 MWh Li-ion Battery
Information Sources
The cost and performance data for each technology being screened is based on research and
information from several sources. These sources include, but may not be limited to the following
internal Departments: Duke Energy’s Project Management & Construction, Emerging
Technologies, and Generation & Regulatory Strategy. The following external sources may also be
utilized: proprietary third-party engineering studies, the Electric Power Research Institute Technical
Assessment Guide (TAG®), and Energy Information Administration (EIA). In addition, fuel and
operating cost estimates are developed internally by Duke Energy, or from other sources such as
those mentioned above, or a combination of the two. EPRI information or other information or
estimates from external studies are not site-specific, but generally reflect the costs and operating
parameters for installation in the Carolinas. Finally, every effort is made to ensure that capital,
O&M costs, fuel costs and other parameters are current and include similar scope across the
technologies being screened. The supply-side screening analysis uses the same fuel prices for coal
and natural gas, and nitrogen oxides (NOx), sulfur dioxide (SO2), and CO2 allowance prices as those
utilized downstream in the detailed analysis (discussed in Appendix A). Screening curves were
developed for each technology to show the economics with and without carbon costs (i.e. No
Carbon Tax, Carbon Tax, System Carbon Mass Cap).