Embed Size (px)
Citation preview
sensors
Article
Differential Microfluidic Sensors Based onDumbbell-Shaped Defect Ground Structures inMicrostrip Technology: Analysis, Optimization,and Applications
Paris Vélez 1,* , Jonathan Muñoz-Enano 1 , Marta Gil 2, Javier Mata-Contreras 3 andFerran Martín 1
1 CIMITEC, Departament d’Enginyeria Electrònica, Universitat Autònoma de Barcelona,08193 Bellaterra, Spain
2 Departamento de Ingenieria Audiovisual y Comunicaciones, Universidad Politécnica de Madrid,28031 Madrid, Spain
3 Departamento de Ingeniería de Comunicaciones, Universidad de Málaga, 29016 Málaga, Spain* Correspondence: [email protected]; Tel.: +34-93-581-3513
Received: 17 June 2019; Accepted: 17 July 2019; Published: 19 July 2019
Abstract: A microstrip defect ground structure (DGS) based on a pair of dumbbell-shaped slots isused for sensing. The device is a differential sensor consisting of a pair of mirrored lines loadedwith a dumbbell-shaped DGS, and the output variable is the cross-mode transmission coefficient.Such a variable is very sensitive to asymmetries in the line pair, e.g., caused by an asymmetricdielectric load in the dumbbell-shaped DGSs. Therefore, the sensor is of special interest for thedielectric characterization of solids and liquids, or for the measurement of variables related tocomplex permittivity changes. It is shown in this work that by adding fluidic channels on top ofthe dumbbell-shaped DGSs, the device is useful for liquid characterization, particularly for themeasurement of solute concentration in very diluted solutions. A sensitivity analysis useful for sensordesign is carried out in this paper.
Keywords: microwave sensors; differential sensors; fluidic sensors; dielectric characterization;microstrip technology; defect ground structure (DGS)
1. Introduction
Defect ground structures (DGSs) are slot patterns of different shapes that have been exhaustivelyused in microwave engineering in applications as diverse as filters, antennas, and sensors [1–6]. In thiswork, the focus is on dumbbell-shaped DGSs [1] and their application to the design of novel differentialsensors sensitive to changes in the complex dielectric constant of the so-called sample under test(typically a solid slab or a liquid). The proposed sensor consists of a pair of mirrored microstriplines, each one loaded with a dumbbell-shaped DGS transversally oriented to the axis of the lines.The dumbbell-shaped DGS behaves as a series-connected parallel resonant tank, providing a notch inthe transmission coefficient of each line, with the position and depth being dependent on the complexpermittivity of the region surrounding the resonator. However, in the proposed sensor, the workingprinciple is symmetry disruption [7–26], rather than frequency variation (the most usual workingprinciple in resonator-based sensors [27–35]).
The advantage of using symmetry disruption for sensing is the major robustness against crosssensitivities caused by environmental changes (e.g., temperature or moisture) [8]. Most sensors basedon symmetry properties utilize coupling modulation [7–16] or frequency splitting [15–22]. Recently,
Sensors 2019, 19, 3189; doi:10.3390/s19143189 www.mdpi.com/journal/sensors
Sensors 2019, 19, 3189 2 of 18
it has been demonstrated that the cross-mode transmission coefficient is very useful for detectingtiny alterations of symmetry in a pair of lines [24,25], and differential sensors based on severaltypes of resonant elements have been reported [24–26]. In [24–26,36,37], the resonant elements aremetamaterial-inspired resonators coupled to the pair of lines, and fluidic channels are located on topof the most sensitive region of such resonant elements, in order to detect changes in the dielectricproperties of liquids (liquid under test, LUT), as compared to a reference (REF) liquid. The method hasbeen demonstrated to be useful for the measurement of the complex dielectric constant of liquids [25],as well as for the determination of solute content in extremely diluted solutions. For instance, in [37],the measurement of NaCl concentrations in deionized (DI) water with a resolution as small as 0.125 g/Land sensitivity of 0.034 (g/L)−1 was reported in a complementary split ring resonator (CSRR)-basedsensor. It is also worth mentioning the application of the split ring resonator (SRR)-based differentialsensor of [26], used for the measurement of the total electrolyte concentration in urine samples.
Despite the fact that a good sensor performance was achieved in [26,37], a sensitivity analysis,providing design guidelines for the resonant elements, is not straightforward when considering eitherSRRs or CSRRs. By contrast, in [25,36], where the open complementary split ring resonators (OCSRRs)and open split ring resonators (OSRRs) were the considered resonant elements, such analysis wasachieved, and important hints for sensor design were obtained. For example, it was concluded in [36]that for sensitivity optimization, high inductance and small capacitance of the resonant element (OSRR)were required.
In the present paper, we focus on a differential sensor where the output variable is also thecross-mode transmission coefficient, but based on a pair of lines loaded with dumbbell-shaped DGSs.Such DGS can be modeled by a series-connected parallel resonator, and a simple sensitivity analysiscan be carried out, as it will be shown. On the basis of this analysis, the dumbbell-shaped DGS has beendesigned for sensitivity optimization. Then, by adding fluidic channels, the structure has been appliedto the measurement of the electrolyte concentration in very diluted solutions, and to the determinationof the complex dielectric constant in mixtures of deionized (DI) water and isopropanol.
2. The Proposed Sensor, Functionality, Circuit Model, and Analysis
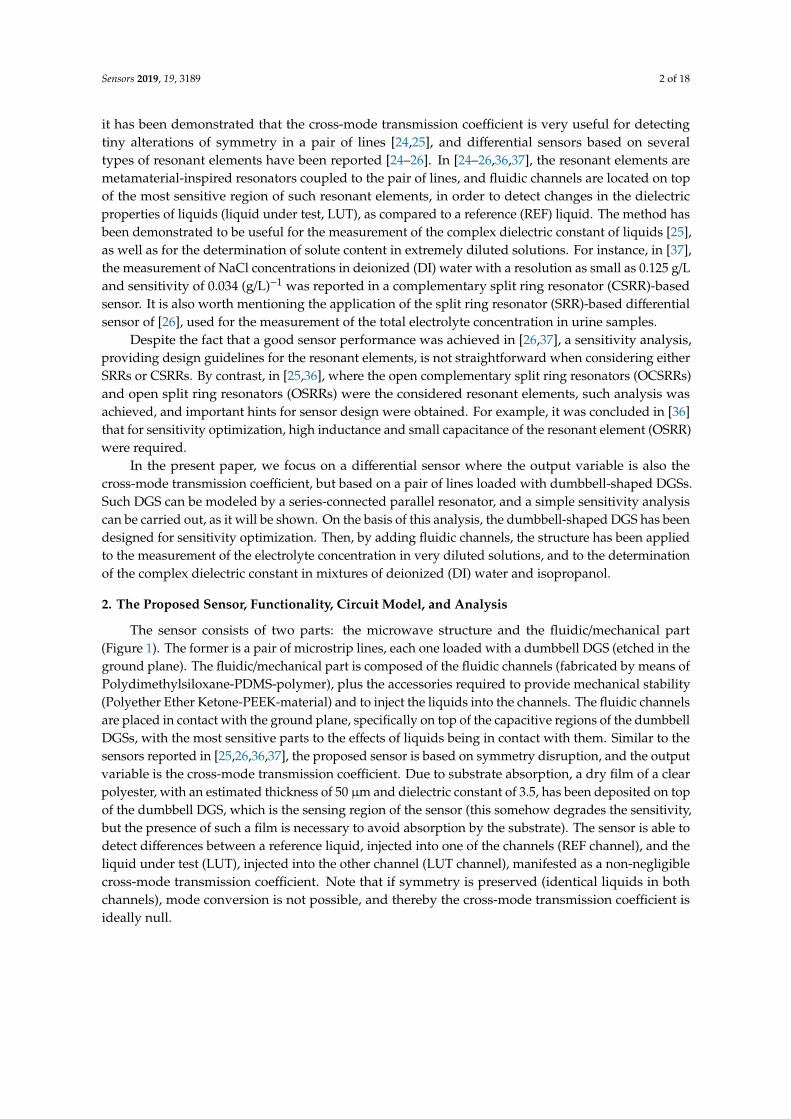
The sensor consists of two parts: the microwave structure and the fluidic/mechanical part(Figure 1). The former is a pair of microstrip lines, each one loaded with a dumbbell DGS (etched in theground plane). The fluidic/mechanical part is composed of the fluidic channels (fabricated by means ofPolydimethylsiloxane-PDMS-polymer), plus the accessories required to provide mechanical stability(Polyether Ether Ketone-PEEK-material) and to inject the liquids into the channels. The fluidic channelsare placed in contact with the ground plane, specifically on top of the capacitive regions of the dumbbellDGSs, with the most sensitive parts to the effects of liquids being in contact with them. Similar to thesensors reported in [25,26,36,37], the proposed sensor is based on symmetry disruption, and the outputvariable is the cross-mode transmission coefficient. Due to substrate absorption, a dry film of a clearpolyester, with an estimated thickness of 50 µm and dielectric constant of 3.5, has been deposited on topof the dumbbell DGS, which is the sensing region of the sensor (this somehow degrades the sensitivity,but the presence of such a film is necessary to avoid absorption by the substrate). The sensor is able todetect differences between a reference liquid, injected into one of the channels (REF channel), and theliquid under test (LUT), injected into the other channel (LUT channel), manifested as a non-negligiblecross-mode transmission coefficient. Note that if symmetry is preserved (identical liquids in bothchannels), mode conversion is not possible, and thereby the cross-mode transmission coefficient isideally null.
Sensors 2019, 19, 3189 3 of 18Sensors 2019, 19 FOR PEER REVIEW 3
(a) (b)
(c)
Figure 1. The proposed dumbbell defect ground structure (DGS)-based sensor. (a) Topology of the microwave part; (b) lateral and top views of the mechanical and fluidic parts; (c) complete three-dimensional view. Relevant dimensions are (in mm): w1 = w2 = 2, wTL = 1.14, lLT = 50, ld = 28, gd = 0.2, and Sd = 44. Channel dimensions are (in mm): hch = 1.5, lch = 26, wch = 4.6, lf = 46, wf = 12.6, h1 = 3, and h2 = 9. The considered substrate is Rogers RO3010 with a dielectric constant εr = 10.2, thickness h = 1.27 mm, and loss tangent tanδ = 0.0035. In (a), the ground plane is depicted in light grey.
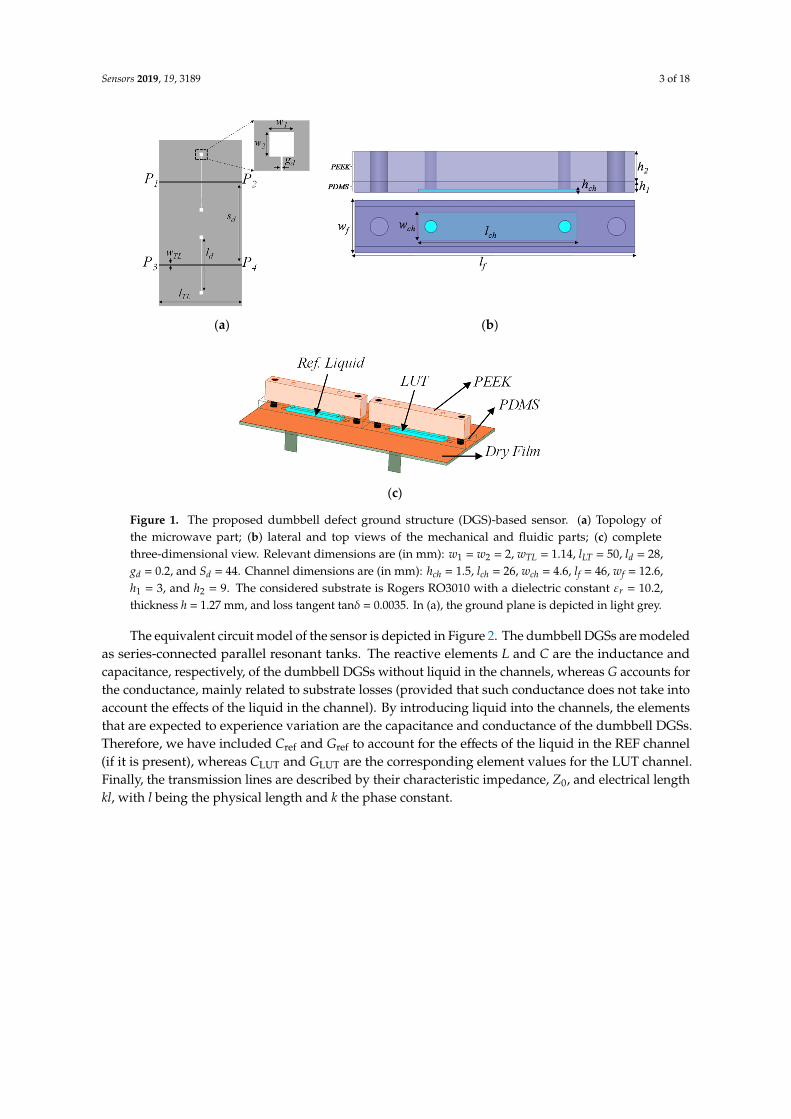
The equivalent circuit model of the sensor is depicted in Figure 2. The dumbbell DGSs are modeled as series-connected parallel resonant tanks. The reactive elements L and C are the inductance and capacitance, respectively, of the dumbbell DGSs without liquid in the channels, whereas G accounts for the conductance, mainly related to substrate losses (provided that such conductance does not take into account the effects of the liquid in the channel). By introducing liquid into the channels, the elements that are expected to experience variation are the capacitance and conductance of the dumbbell DGSs. Therefore, we have included Cref and Gref to account for the effects of the liquid in the REF channel (if it is present), whereas CLUT and GLUT are the corresponding element values for the LUT channel. Finally, the transmission lines are described by their characteristic impedance, Z0, and electrical length kl, with l being the physical length and k the phase constant.
Figure 1. The proposed dumbbell defect ground structure (DGS)-based sensor. (a) Topology ofthe microwave part; (b) lateral and top views of the mechanical and fluidic parts; (c) completethree-dimensional view. Relevant dimensions are (in mm): w1 = w2 = 2, wTL = 1.14, lLT = 50, ld = 28,gd = 0.2, and Sd = 44. Channel dimensions are (in mm): hch = 1.5, lch = 26, wch = 4.6, lf = 46, wf = 12.6,h1 = 3, and h2 = 9. The considered substrate is Rogers RO3010 with a dielectric constant εr = 10.2,thickness h = 1.27 mm, and loss tangent tanδ = 0.0035. In (a), the ground plane is depicted in light grey.
The equivalent circuit model of the sensor is depicted in Figure 2. The dumbbell DGSs are modeledas series-connected parallel resonant tanks. The reactive elements L and C are the inductance andcapacitance, respectively, of the dumbbell DGSs without liquid in the channels, whereas G accounts forthe conductance, mainly related to substrate losses (provided that such conductance does not take intoaccount the effects of the liquid in the channel). By introducing liquid into the channels, the elementsthat are expected to experience variation are the capacitance and conductance of the dumbbell DGSs.Therefore, we have included Cref and Gref to account for the effects of the liquid in the REF channel(if it is present), whereas CLUT and GLUT are the corresponding element values for the LUT channel.Finally, the transmission lines are described by their characteristic impedance, Z0, and electrical lengthkl, with l being the physical length and k the phase constant.
Sensors 2019, 19, 3189 4 of 18
Sensors 2019, 19 FOR PEER REVIEW 4
Figure 2. Equivalent circuit model of the proposed sensor.
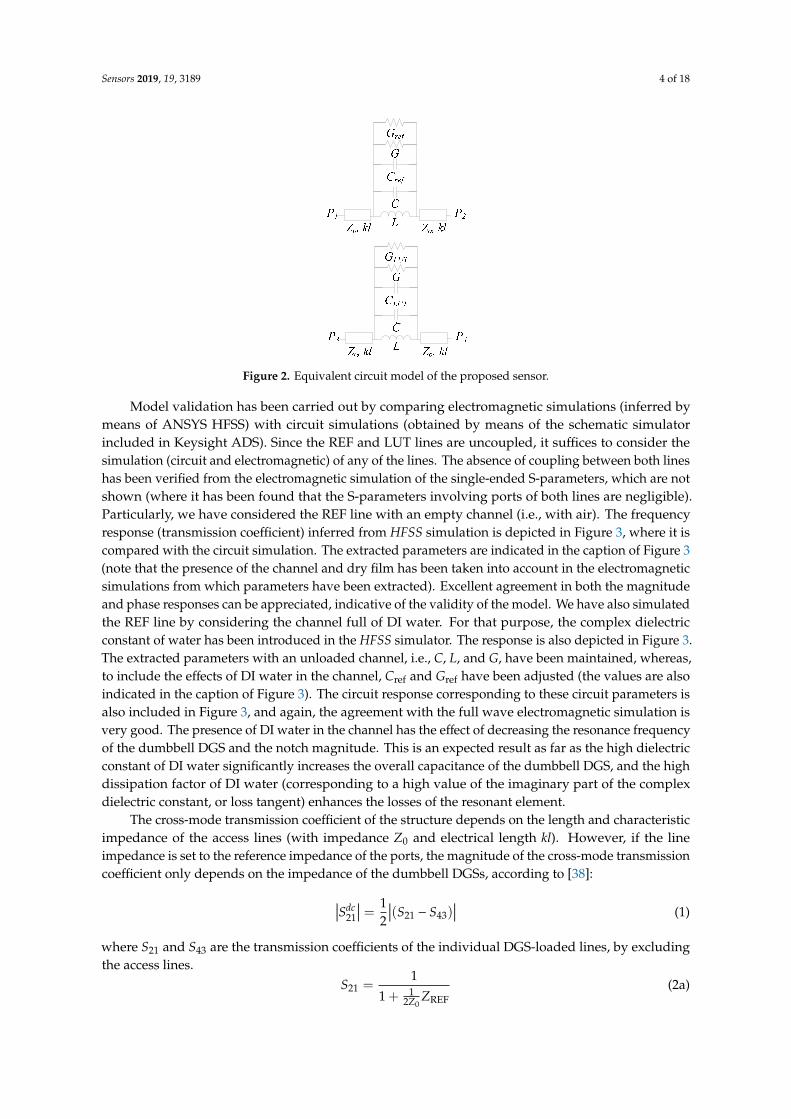
Model validation has been carried out by comparing electromagnetic simulations (inferred by means of ANSYS HFSS) with circuit simulations (obtained by means of the schematic simulator included in Keysight ADS). Since the REF and LUT lines are uncoupled, it suffices to consider the simulation (circuit and electromagnetic) of any of the lines. The absence of coupling between both lines has been verified from the electromagnetic simulation of the single-ended S-parameters, which are not shown (where it has been found that the S-parameters involving ports of both lines are negligible). Particularly, we have considered the REF line with an empty channel (i.e., with air). The frequency response (transmission coefficient) inferred from HFSS simulation is depicted in Figure 3, where it is compared with the circuit simulation. The extracted parameters are indicated in the caption of Figure 3 (note that the presence of the channel and dry film has been taken into account in the electromagnetic simulations from which parameters have been extracted). Excellent agreement in both the magnitude and phase responses can be appreciated, indicative of the validity of the model. We have also simulated the REF line by considering the channel full of DI water. For that purpose, the complex dielectric constant of water has been introduced in the HFSS simulator. The response is also depicted in Figure 3. The extracted parameters with an unloaded channel, i.e., C, L, and G, have been maintained, whereas, to include the effects of DI water in the channel, Cref and Gref have been adjusted (the values are also indicated in the caption of Figure 3). The circuit response corresponding to these circuit parameters is also included in Figure 3, and again, the agreement with the full wave electromagnetic simulation is very good. The presence of DI water in the channel has the effect of decreasing the resonance frequency of the dumbbell DGS and the notch magnitude. This is an expected result as far as the high dielectric constant of DI water significantly increases the overall capacitance of the dumbbell DGS, and the high dissipation factor of DI water (corresponding to a high value of the imaginary part of the complex dielectric constant, or loss tangent) enhances the losses of the resonant element.
(a) (b)
0.5 1.0 1.5 2.0 2.5 3.0-40
-30
-20
-10
0
HFSS EM Sim. Eq. circuit Sim.
|S21
| (dB)
Frequency (GHz)
-180
-90
0
90
180
phas
e S 21
(deg
ree
)
0.5 1.0 1.5 2.0-20
-15
-10
-5
0
HFSS EM Sim. Eq. circuit Sim.
|S21
| (dB)
Frequency (GHz)
-180
-90
0
90
180
phas
e S 21
(deg
ree
)
Figure 2. Equivalent circuit model of the proposed sensor.
Model validation has been carried out by comparing electromagnetic simulations (inferred bymeans of ANSYS HFSS) with circuit simulations (obtained by means of the schematic simulatorincluded in Keysight ADS). Since the REF and LUT lines are uncoupled, it suffices to consider thesimulation (circuit and electromagnetic) of any of the lines. The absence of coupling between both lineshas been verified from the electromagnetic simulation of the single-ended S-parameters, which are notshown (where it has been found that the S-parameters involving ports of both lines are negligible).Particularly, we have considered the REF line with an empty channel (i.e., with air). The frequencyresponse (transmission coefficient) inferred from HFSS simulation is depicted in Figure 3, where it iscompared with the circuit simulation. The extracted parameters are indicated in the caption of Figure 3(note that the presence of the channel and dry film has been taken into account in the electromagneticsimulations from which parameters have been extracted). Excellent agreement in both the magnitudeand phase responses can be appreciated, indicative of the validity of the model. We have also simulatedthe REF line by considering the channel full of DI water. For that purpose, the complex dielectricconstant of water has been introduced in the HFSS simulator. The response is also depicted in Figure 3.The extracted parameters with an unloaded channel, i.e., C, L, and G, have been maintained, whereas,to include the effects of DI water in the channel, Cref and Gref have been adjusted (the values are alsoindicated in the caption of Figure 3). The circuit response corresponding to these circuit parameters isalso included in Figure 3, and again, the agreement with the full wave electromagnetic simulation isvery good. The presence of DI water in the channel has the effect of decreasing the resonance frequencyof the dumbbell DGS and the notch magnitude. This is an expected result as far as the high dielectricconstant of DI water significantly increases the overall capacitance of the dumbbell DGS, and the highdissipation factor of DI water (corresponding to a high value of the imaginary part of the complexdielectric constant, or loss tangent) enhances the losses of the resonant element.
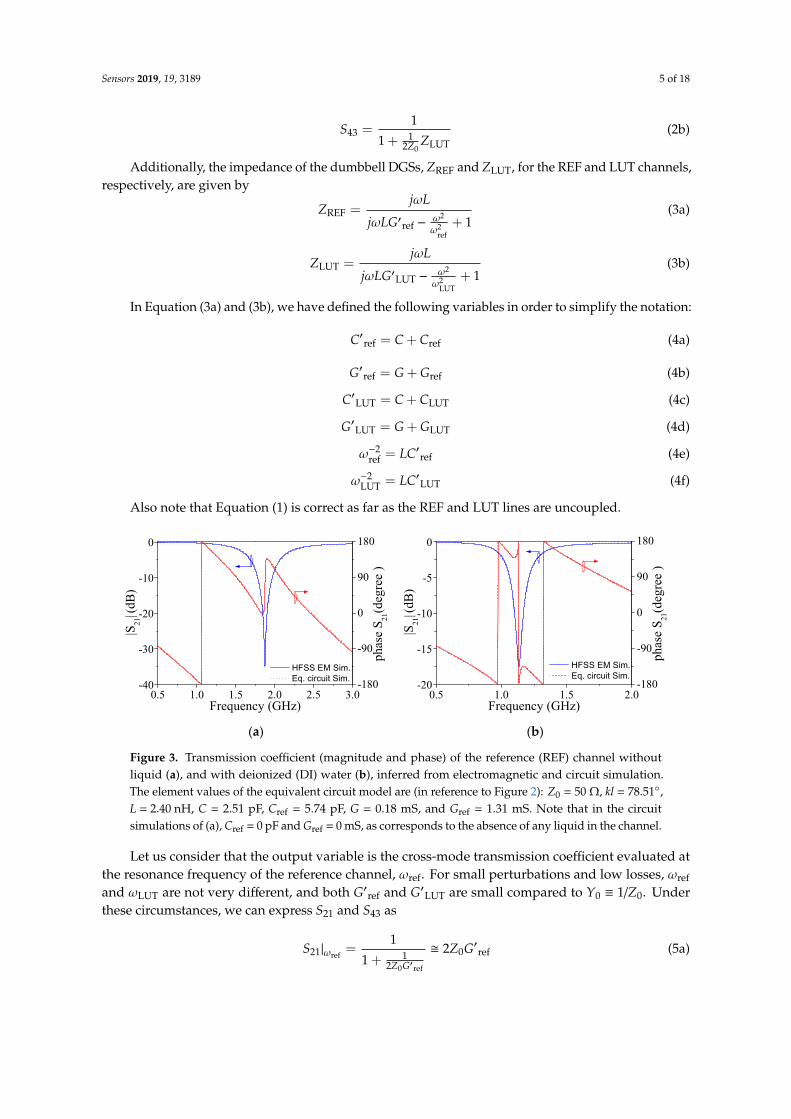
The cross-mode transmission coefficient of the structure depends on the length and characteristicimpedance of the access lines (with impedance Z0 and electrical length kl). However, if the lineimpedance is set to the reference impedance of the ports, the magnitude of the cross-mode transmissioncoefficient only depends on the impedance of the dumbbell DGSs, according to [38]:∣∣∣Sdc
21
∣∣∣ = 12
∣∣∣(S21 − S43)∣∣∣ (1)
where S21 and S43 are the transmission coefficients of the individual DGS-loaded lines, by excludingthe access lines.
S21 =1
1 + 12Z0
ZREF(2a)
Sensors 2019, 19, 3189 5 of 18
S43 =1
1 + 12Z0
ZLUT(2b)
Additionally, the impedance of the dumbbell DGSs, ZREF and ZLUT, for the REF and LUT channels,respectively, are given by
ZREF =jωL
jωLG′ref −ω2
ω2ref
+ 1(3a)
ZLUT =jωL
jωLG′LUT −ω2
ω2LUT
+ 1(3b)
In Equation (3a) and (3b), we have defined the following variables in order to simplify the notation:
C′ref = C + Cref (4a)
G′ref = G + Gref (4b)
C′LUT = C + CLUT (4c)
G′LUT = G + GLUT (4d)
ω−2ref = LC′ref (4e)
ω−2LUT = LC′LUT (4f)
Also note that Equation (1) is correct as far as the REF and LUT lines are uncoupled.
Sensors 2019, 19 FOR PEER REVIEW 4
Figure 2. Equivalent circuit model of the proposed sensor.
Model validation has been carried out by comparing electromagnetic simulations (inferred by means of ANSYS HFSS) with circuit simulations (obtained by means of the schematic simulator included in Keysight ADS). Since the REF and LUT lines are uncoupled, it suffices to consider the simulation (circuit and electromagnetic) of any of the lines. The absence of coupling between both lines has been verified from the electromagnetic simulation of the single-ended S-parameters, which are not shown (where it has been found that the S-parameters involving ports of both lines are negligible). Particularly, we have considered the REF line with an empty channel (i.e., with air). The frequency response (transmission coefficient) inferred from HFSS simulation is depicted in Figure 3, where it is compared with the circuit simulation. The extracted parameters are indicated in the caption of Figure 3 (note that the presence of the channel and dry film has been taken into account in the electromagnetic simulations from which parameters have been extracted). Excellent agreement in both the magnitude and phase responses can be appreciated, indicative of the validity of the model. We have also simulated the REF line by considering the channel full of DI water. For that purpose, the complex dielectric constant of water has been introduced in the HFSS simulator. The response is also depicted in Figure 3. The extracted parameters with an unloaded channel, i.e., C, L, and G, have been maintained, whereas, to include the effects of DI water in the channel, Cref and Gref have been adjusted (the values are also indicated in the caption of Figure 3). The circuit response corresponding to these circuit parameters is also included in Figure 3, and again, the agreement with the full wave electromagnetic simulation is very good. The presence of DI water in the channel has the effect of decreasing the resonance frequency of the dumbbell DGS and the notch magnitude. This is an expected result as far as the high dielectric constant of DI water significantly increases the overall capacitance of the dumbbell DGS, and the high dissipation factor of DI water (corresponding to a high value of the imaginary part of the complex dielectric constant, or loss tangent) enhances the losses of the resonant element.
(a) (b)
0.5 1.0 1.5 2.0 2.5 3.0-40
-30
-20
-10
0
HFSS EM Sim. Eq. circuit Sim.
|S21
| (dB)
Frequency (GHz)
-180
-90
0
90
180
phas
e S 21
(deg
ree
)
0.5 1.0 1.5 2.0-20
-15
-10
-5
0
HFSS EM Sim. Eq. circuit Sim.
|S21
| (dB)
Frequency (GHz)
-180
-90
0
90
180
phas
e S 21
(deg
ree
)
Figure 3. Transmission coefficient (magnitude and phase) of the reference (REF) channel withoutliquid (a), and with deionized (DI) water (b), inferred from electromagnetic and circuit simulation.The element values of the equivalent circuit model are (in reference to Figure 2): Z0 = 50 Ω, kl = 78.51,L = 2.40 nH, C = 2.51 pF, Cref = 5.74 pF, G = 0.18 mS, and Gref = 1.31 mS. Note that in the circuitsimulations of (a), Cref = 0 pF and Gref = 0 mS, as corresponds to the absence of any liquid in the channel.
Let us consider that the output variable is the cross-mode transmission coefficient evaluated atthe resonance frequency of the reference channel, ωref. For small perturbations and low losses, ωref
and ωLUT are not very different, and both G′ref and G′LUT are small compared to Y0 ≡ 1/Z0. Underthese circumstances, we can express S21 and S43 as
S21|ωref=
1
1 + 12Z0G′ref
2Z0G′ref (5a)
Sensors 2019, 19, 3189 6 of 18
S43|ωref=
1
1 + 1
2Z0G′LUT− jωref
L
(1
ω2ref−
1ω2
LUT
) 2Z0G′LUT − jωref
L
1ω2
ref
−1
ω2LUT
(5b)
and the modulus of the cross-mode transmission coefficient is found to be∣∣∣Sdc21
∣∣∣ωref Z0
∣∣∣Gref −GLUT + jωref(Cref −CLUT)∣∣∣ (6)
Since Z0 is not a design parameter, the sensitivity of the output variable, |S21DC|ωref, with the
differential conductance, Gref−GLUT, cannot be controlled. On the other hand, it follows from (6) thatthe sensitivity of the output variable with the differential capacitance, Cref−CLUT, increases with theresonance frequency of the REF channel, ωref. It also follows from (6) that if Gref = GLUT, the magnitudeof the cross-mode transmission coefficient should not depend on L and C, provided these elementsand Cref give a constant value of ωref. This is corroborated in Figure 4, where the magnitude of thecross-mode transmission coefficient for different cases is depicted. In all the cases, ωref = 1.13 GHz,but different combinations of L and C have been considered in order to obtain the above cited valueof ωref with the same value of Cref = 5.74 pF. Nevertheless, rather than the differential capacitanceor conductance, the input variables in a real scenario are, typically, material (liquid in our case)parameters, such as the dielectric constant and the loss tangent, or other variables related to them(e.g., the electrolyte concentration). Therefore, a further step is necessary in order to determine thedependence of the cross-mode transmission coefficient with these material parameters, which will bediscussed next.
Sensors 2019, 19 FOR PEER REVIEW 6
𝑆43| = 11 + 12𝑍0𝐺′𝐿𝑈𝑇 − 𝑗𝑟𝑒𝑓𝐿 1𝑟𝑒𝑓2 − 1
𝐿𝑈𝑇2≅ 2𝑍0𝐺′𝐿𝑈𝑇 − 𝑗𝑟𝑒𝑓𝐿 1𝑟𝑒𝑓2 − 1
𝐿𝑈𝑇2
(5b)
and the modulus of the cross-mode transmission coefficient is found to be 𝑆21𝑑𝑐
≅ 𝑍0 𝐺𝑟𝑒𝑓 − 𝐺𝐿𝑈𝑇 + 𝑗𝑟𝑒𝑓(𝐶𝑟𝑒𝑓 − 𝐶𝐿𝑈𝑇) (6)
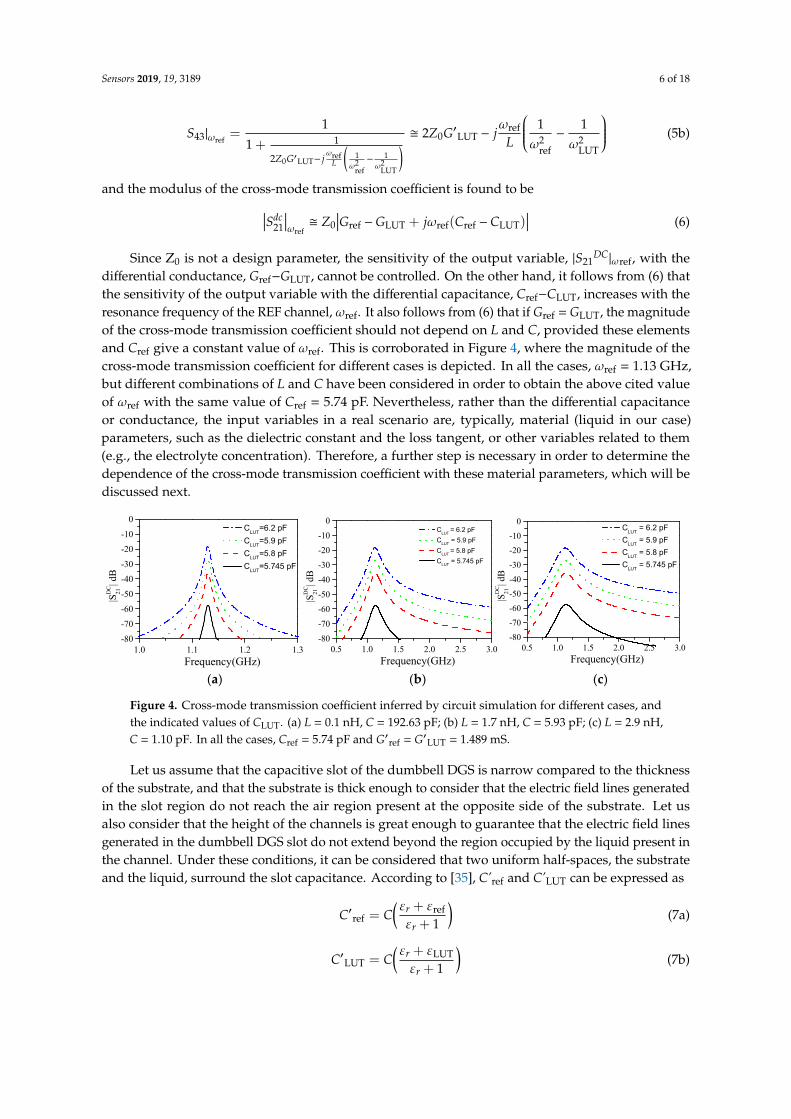
Since Z0 is not a design parameter, the sensitivity of the output variable, |S21DC|ωref, with the differential conductance, Gref−GLUT, cannot be controlled. On the other hand, it follows from (6) that the sensitivity of the output variable with the differential capacitance, Cref−CLUT, increases with the resonance frequency of the REF channel, ωref. It also follows from (6) that if Gref = GLUT, the magnitude of the cross-mode transmission coefficient should not depend on L and C, provided these elements and Cref give a constant value of ωref. This is corroborated in Figure 4, where the magnitude of the cross-mode transmission coefficient for different cases is depicted. In all the cases, ωref = 1.13 GHz, but different combinations of L and C have been considered in order to obtain the above cited value of ωref with the same value of Cref = 5.74 pF. Nevertheless, rather than the differential capacitance or conductance, the input variables in a real scenario are, typically, material (liquid in our case) parameters, such as the dielectric constant and the loss tangent, or other variables related to them (e.g., the electrolyte concentration). Therefore, a further step is necessary in order to determine the dependence of the cross-mode transmission coefficient with these material parameters, which will be discussed next.
(a) (b) (c)
Figure 4. Cross-mode transmission coefficient inferred by circuit simulation for different cases, and the indicated values of CLUT. (a) L = 0.1 nH, C = 192.63 pF; (b) L = 1.7 nH, C = 5.93 pF; (c) L = 2.9 nH, C = 1.10 pF. In all the cases, Cref = 5.74 pF and G’ref = G’LUT = 1.489 mS.
Let us assume that the capacitive slot of the dumbbell DGS is narrow compared to the thickness of the substrate, and that the substrate is thick enough to consider that the electric field lines generated in the slot region do not reach the air region present at the opposite side of the substrate. Let us also consider that the height of the channels is great enough to guarantee that the electric field lines generated in the dumbbell DGS slot do not extend beyond the region occupied by the liquid present in the channel. Under these conditions, it can be considered that two uniform half-spaces, the substrate and the liquid, surround the slot capacitance. According to [35], C’ref and C’LUT can be expressed as 𝐶′ = 𝐶 +
+ 1 (7a)
𝐶′ = 𝐶 + + 1 (7b)
Therefore, the differential capacitance that appears in the imaginary part of Equation (6) is
1.0 1.1 1.2 1.3-80-70-60-50-40-30-20-10
0 CLUT=6.2 pF CLUT=5.9 pF CLUT=5.8 pF CLUT=5.745 pF
|SD
C21
| dB
Frequency(GHz)0.5 1.0 1.5 2.0 2.5 3.0
-80-70-60-50-40-30-20-10
0 CLUT = 6.2 pF CLUT = 5.9 pF CLUT = 5.8 pF CLUT = 5.745 pF
|SD
C21
| dB
Frequency(GHz)0.5 1.0 1.5 2.0 2.5 3.0
-80-70-60-50-40-30-20-10
0 CLUT = 6.2 pF CLUT = 5.9 pF CLUT = 5.8 pF CLUT = 5.745 pF
|SD
C21
| dB
Frequency(GHz)
Figure 4. Cross-mode transmission coefficient inferred by circuit simulation for different cases, andthe indicated values of CLUT. (a) L = 0.1 nH, C = 192.63 pF; (b) L = 1.7 nH, C = 5.93 pF; (c) L = 2.9 nH,C = 1.10 pF. In all the cases, Cref = 5.74 pF and G′ref = G′LUT = 1.489 mS.
Let us assume that the capacitive slot of the dumbbell DGS is narrow compared to the thicknessof the substrate, and that the substrate is thick enough to consider that the electric field lines generatedin the slot region do not reach the air region present at the opposite side of the substrate. Let usalso consider that the height of the channels is great enough to guarantee that the electric field linesgenerated in the dumbbell DGS slot do not extend beyond the region occupied by the liquid present inthe channel. Under these conditions, it can be considered that two uniform half-spaces, the substrateand the liquid, surround the slot capacitance. According to [35], C’ref and C’LUT can be expressed as
C′ref = C(εr + εref
εr + 1
)(7a)
C′LUT = C(εr + εLUT
εr + 1
)(7b)
Sensors 2019, 19, 3189 7 of 18
Therefore, the differential capacitance that appears in the imaginary part of Equation (6) is
Cref −CLUT = C′ref −C′LUT =C
εr + 1(εref − εLUT) (8)
If we now express C as the contribution of the substrate and air capacitance, i.e.,
C = Csubs + Cair (9)
and we take into account that Csubs = εr·Cair, it follows that
C = Csubsεr + 1εr
(10)
Therefore, Equation (8) can be expressed as
Cref −CLUT =Csubsεr
(εref − εLUT) (11)
Since Csubs is proportional to the dielectric constant of the substrate, εr, it follows that the sensitivityof the output variable with the differential dielectric constant, εref−εLUT, is proportional to ωref, anddetermined by the geometry of the slot, particularly by its length and width. Note that Csubs is roughlyproportional to the slot length and it increases by decreasing the slot width. Hence, for sensitivityoptimization with regard to the differential permittivity, narrow and long slots for the dumbbell DGSare required.
The relation between the conductance of the REF or LUT liquid and the corresponding losstangents is given by [35]
tan δref =Gref
(Cair + Cref)ωref=
Gref(εr + 1)Cεrefωref
(12a)
tan δLUT =GLUT
(Cair + CLUT)ωLUT=
GLUT(εr + 1)CεLUTωLUT
(12b)
Therefore,
Gref −GLUT =Csubsωref
εr(εreftan δref − εLUTtan δLUT) (13)
where the approximation ωref ≈ ωLUT has been used. In this case, it is not possible to express thedifferential conductance, Gref − GLUT, as proportional to the differential loss tangent. Nevertheless,the inspection of Equation (13) reveals that the differential conductance is proportional to ωref
and it is also determined by the slot dimensions (through Csubs), with identical dependence to thedifferential capacitance.
Introducing Equations (11) and (13) into Equation (6), the cross-mode transmission coefficient isfound to be ∣∣∣Sdc
21
∣∣∣ωref Z0
Csubsωref
εr
∣∣∣εreftan δref − εLUTtan δLUT + j(εref − εLUT)∣∣∣ (14)
Let us analyze Equation (14) more carefully, or, more precisely, the relevant term providing thesensitivity of the output variable with the differential dielectric constant and loss tangent. Such a termcan be expressed as
Csubsωref
εr=
Csubsεr
[L(Csubs + Cair)
εr + εref
εr + 1
]−1/2(15)
and after some straightforward calculation, one obtains
Csubsωref
εr=
1√εr + εref
√Cair
L(16)
Sensors 2019, 19, 3189 8 of 18
That is, for sensitivity optimization, it is convenient to choose a substrate with a small value of thedielectric constant. Nevertheless, if the dielectric constant of the REF liquid, εref, is high, (as is usual inliquids), it follows that the dependence of the sensitivity on εr is small (since εr is obscured by εref).On the other hand, sensitivity optimization depends on the ratio Cair/L. Increasing the slot length, ld,has the effect of increasing both Cair and L. However, whereas Cair increases roughly proportionallywith the length of the slot, L does not (it has been corroborated by extracting parameters in severalstructures where the geometry of the slots has been modified). The result is that the sensitivity increaseswith the slot length, and for this reason, a dumbbell DGS with a long slot has been considered inthe designed sensor. On the other hand, the width of the slot, gd, does not have any influence on L,whereas, by reducing it, Cair increases, thereby enhancing the sensitivity. For this reason, we have setgd to the minimum value of the available fabrication technology (0.2 mm).
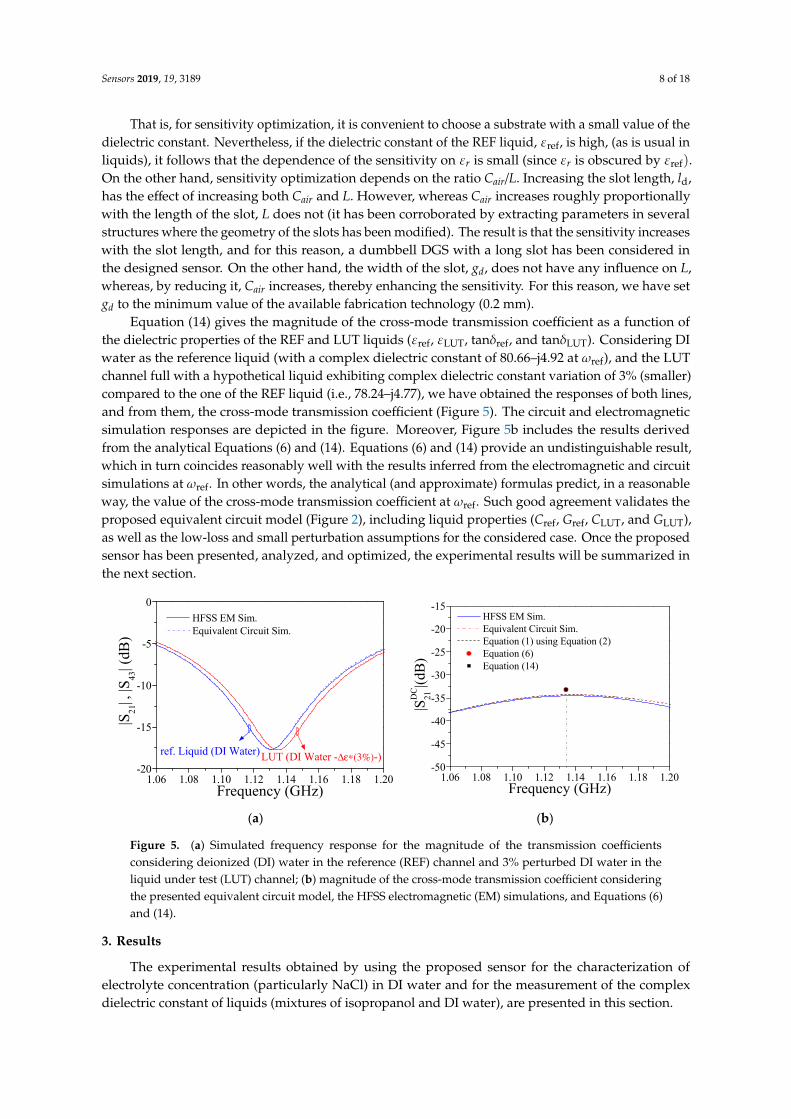
Equation (14) gives the magnitude of the cross-mode transmission coefficient as a function ofthe dielectric properties of the REF and LUT liquids (εref, εLUT, tanδref, and tanδLUT). Considering DIwater as the reference liquid (with a complex dielectric constant of 80.66–j4.92 at ωref), and the LUTchannel full with a hypothetical liquid exhibiting complex dielectric constant variation of 3% (smaller)compared to the one of the REF liquid (i.e., 78.24–j4.77), we have obtained the responses of both lines,and from them, the cross-mode transmission coefficient (Figure 5). The circuit and electromagneticsimulation responses are depicted in the figure. Moreover, Figure 5b includes the results derivedfrom the analytical Equations (6) and (14). Equations (6) and (14) provide an undistinguishable result,which in turn coincides reasonably well with the results inferred from the electromagnetic and circuitsimulations at ωref. In other words, the analytical (and approximate) formulas predict, in a reasonableway, the value of the cross-mode transmission coefficient at ωref. Such good agreement validates theproposed equivalent circuit model (Figure 2), including liquid properties (Cref, Gref, CLUT, and GLUT),as well as the low-loss and small perturbation assumptions for the considered case. Once the proposedsensor has been presented, analyzed, and optimized, the experimental results will be summarized inthe next section.
Sensors 2019, 19 FOR PEER REVIEW 8
That is, for sensitivity optimization, it is convenient to choose a substrate with a small value of the dielectric constant. Nevertheless, if the dielectric constant of the REF liquid, , is high, (as is usual in liquids), it follows that the dependence of the sensitivity on is small (since is obscured by ). On the other hand, sensitivity optimization depends on the ratio Cair/L. Increasing the slot length, ld, has the effect of increasing both Cair and L. However, whereas Cair increases roughly proportionally with the length of the slot, L does not (it has been corroborated by extracting parameters in several structures where the geometry of the slots has been modified). The result is that the sensitivity increases with the slot length, and for this reason, a dumbbell DGS with a long slot has been considered in the designed sensor. On the other hand, the width of the slot, gd, does not have any influence on L, whereas, by reducing it, Cair increases, thereby enhancing the sensitivity. For this reason, we have set gd to the minimum value of the available fabrication technology (0.2 mm).
Equation (14) gives the magnitude of the cross-mode transmission coefficient as a function of the dielectric properties of the REF and LUT liquids (εref, εLUT, tanδref, and tanδLUT). Considering DI water as the reference liquid (with a complex dielectric constant of 80.66–j4.92 at ωref), and the LUT channel full with a hypothetical liquid exhibiting complex dielectric constant variation of 3% (smaller) compared to the one of the REF liquid (i.e., 78.24–j4.77), we have obtained the responses of both lines, and from them, the cross-mode transmission coefficient (Figure 5). The circuit and electromagnetic simulation responses are depicted in the figure. Moreover, Figure 5b includes the results derived from the analytical Equations (6) and (14). Equations (6) and (14) provide an undistinguishable result, which in turn coincides reasonably well with the results inferred from the electromagnetic and circuit simulations at ωref. In other words, the analytical (and approximate) formulas predict, in a reasonable way, the value of the cross-mode transmission coefficient at ωref. Such good agreement validates the proposed equivalent circuit model (Figure 2), including liquid properties (Cref, Gref, CLUT, and GLUT), as well as the low-loss and small perturbation assumptions for the considered case. Once the proposed sensor has been presented, analyzed, and optimized, the experimental results will be summarized in the next section.
(a) (b)
Figure 5. (a) Simulated frequency response for the magnitude of the transmission coefficients considering deionized (DI) water in the reference (REF) channel and 3% perturbed DI water in the liquid under test (LUT) channel; (b) magnitude of the cross-mode transmission coefficient considering the presented equivalent circuit model, the HFSS electromagnetic (EM) simulations, and Equations (6) and (14).
3. Results
The experimental results obtained by using the proposed sensor for the characterization of electrolyte concentration (particularly NaCl) in DI water and for the measurement of the complex dielectric constant of liquids (mixtures of isopropanol and DI water), are presented in this section.
1.06 1.08 1.10 1.12 1.14 1.16 1.18 1.20-20
-15
-10
-5
0
LUT (DI Water -Δε∗(3%)-)
HFSS EM Sim. Equivalent Circuit Sim.
|S21
| , |S 43
| (dB
)
Frequency (GHz)
ref. Liquid (DI Water)
1.06 1.08 1.10 1.12 1.14 1.16 1.18 1.20-50
-45
-40
-35
-30
-25
-20
-15 HFSS EM Sim. Equivalent Circuit Sim. Equation (1) using Equation (2) Equation (6) Equation (14)
|SD
C21
|(dB)
Frequency (GHz)
Figure 5. (a) Simulated frequency response for the magnitude of the transmission coefficientsconsidering deionized (DI) water in the reference (REF) channel and 3% perturbed DI water in theliquid under test (LUT) channel; (b) magnitude of the cross-mode transmission coefficient consideringthe presented equivalent circuit model, the HFSS electromagnetic (EM) simulations, and Equations (6)and (14).
3. Results
The experimental results obtained by using the proposed sensor for the characterization ofelectrolyte concentration (particularly NaCl) in DI water and for the measurement of the complexdielectric constant of liquids (mixtures of isopropanol and DI water), are presented in this section.
Sensors 2019, 19, 3189 9 of 18
3.1. Electrolyte (NaCl) Concentration Measurements in DI Water
The measurement of electrolyte concentration in urine and/or blood can be used as an indicator ofcertain pathologies. Electrolytes are cations (e.g., Na+, K+, and Ca2+) and anions (e.g., Cl− and HCO3
−)that result from the dissociation of polar solvents, e.g., NaCl. In this work, the experimental study isfocused on the determination of NaCl concentration (the solute) in DI water (the solvent), through themeasurement of the maximum value of the cross-mode transmission coefficient. The pure DI wateracts as the REF liquid, whereas the LUT is the solution of NaCl in DI water (different levels of NaClconcentration are considered). The proposed sensor is able to detect very small concentrations of NaCl,as it will be shown, thereby providing a very good resolution.
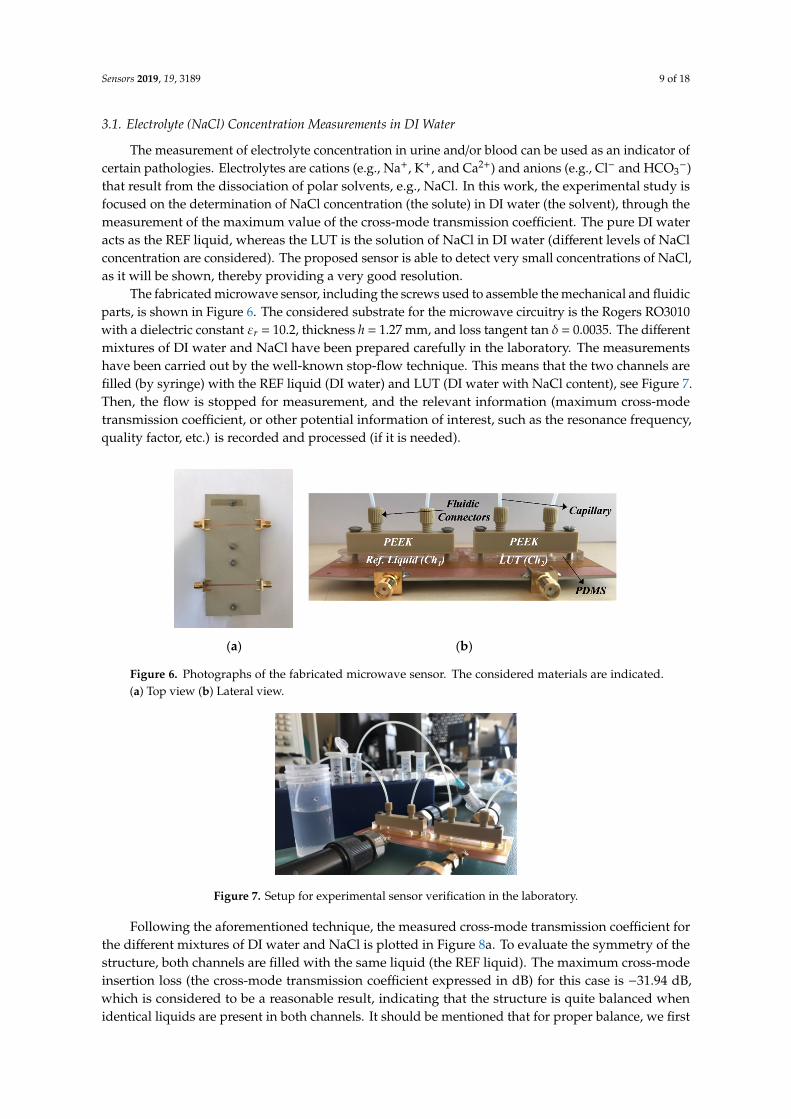
The fabricated microwave sensor, including the screws used to assemble the mechanical and fluidicparts, is shown in Figure 6. The considered substrate for the microwave circuitry is the Rogers RO3010with a dielectric constant εr = 10.2, thickness h = 1.27 mm, and loss tangent tan δ = 0.0035. The differentmixtures of DI water and NaCl have been prepared carefully in the laboratory. The measurementshave been carried out by the well-known stop-flow technique. This means that the two channels arefilled (by syringe) with the REF liquid (DI water) and LUT (DI water with NaCl content), see Figure 7.Then, the flow is stopped for measurement, and the relevant information (maximum cross-modetransmission coefficient, or other potential information of interest, such as the resonance frequency,quality factor, etc.) is recorded and processed (if it is needed).
Sensors 2019, 19 FOR PEER REVIEW 9
3.1. Electrolyte (NaCl) Concentration Measurements in DI Water
The measurement of electrolyte concentration in urine and/or blood can be used as an indicator of certain pathologies. Electrolytes are cations (e.g., Na+, K+, and Ca2+) and anions (e.g., Cl− and HCO3−) that result from the dissociation of polar solvents, e.g., NaCl. In this work, the experimental study is focused on the determination of NaCl concentration (the solute) in DI water (the solvent), through the measurement of the maximum value of the cross-mode transmission coefficient. The pure DI water acts as the REF liquid, whereas the LUT is the solution of NaCl in DI water (different levels of NaCl concentration are considered). The proposed sensor is able to detect very small concentrations of NaCl, as it will be shown, thereby providing a very good resolution.
The fabricated microwave sensor, including the screws used to assemble the mechanical and fluidic parts, is shown in Figure 6. The considered substrate for the microwave circuitry is the Rogers RO3010 with a dielectric constant εr = 10.2, thickness h = 1.27 mm, and loss tangent tan δ = 0.0035. The different mixtures of DI water and NaCl have been prepared carefully in the laboratory. The measurements have been carried out by the well-known stop-flow technique. This means that the two channels are filled (by syringe) with the REF liquid (DI water) and LUT (DI water with NaCl content), see Figure 7. Then, the flow is stopped for measurement, and the relevant information (maximum cross-mode transmission coefficient, or other potential information of interest, such as the resonance frequency, quality factor, etc.) is recorded and processed (if it is needed).
(a) (b)
Figure 6. Photographs of the fabricated microwave sensor. The considered materials are indicated. (a) Top view (b) Lateral view.
Figure 7. Setup for experimental sensor verification in the laboratory.
Following the aforementioned technique, the measured cross-mode transmission coefficient for the different mixtures of DI water and NaCl is plotted in Figure 8a. To evaluate the symmetry of the structure, both channels are filled with the same liquid (the REF liquid). The maximum cross-mode insertion loss (the cross-mode transmission coefficient expressed in dB) for this case is −31.94 dB, which is considered to be a reasonable result, indicating that the structure is quite balanced when
Figure 6. Photographs of the fabricated microwave sensor. The considered materials are indicated.(a) Top view (b) Lateral view.
Sensors 2019, 19 FOR PEER REVIEW 9
3.1. Electrolyte (NaCl) Concentration Measurements in DI Water
The measurement of electrolyte concentration in urine and/or blood can be used as an indicator of certain pathologies. Electrolytes are cations (e.g., Na+, K+, and Ca2+) and anions (e.g., Cl− and HCO3−) that result from the dissociation of polar solvents, e.g., NaCl. In this work, the experimental study is focused on the determination of NaCl concentration (the solute) in DI water (the solvent), through the measurement of the maximum value of the cross-mode transmission coefficient. The pure DI water acts as the REF liquid, whereas the LUT is the solution of NaCl in DI water (different levels of NaCl concentration are considered). The proposed sensor is able to detect very small concentrations of NaCl, as it will be shown, thereby providing a very good resolution.
The fabricated microwave sensor, including the screws used to assemble the mechanical and fluidic parts, is shown in Figure 6. The considered substrate for the microwave circuitry is the Rogers RO3010 with a dielectric constant εr = 10.2, thickness h = 1.27 mm, and loss tangent tan δ = 0.0035. The different mixtures of DI water and NaCl have been prepared carefully in the laboratory. The measurements have been carried out by the well-known stop-flow technique. This means that the two channels are filled (by syringe) with the REF liquid (DI water) and LUT (DI water with NaCl content), see Figure 7. Then, the flow is stopped for measurement, and the relevant information (maximum cross-mode transmission coefficient, or other potential information of interest, such as the resonance frequency, quality factor, etc.) is recorded and processed (if it is needed).
(a) (b)
Figure 6. Photographs of the fabricated microwave sensor. The considered materials are indicated. (a) Top view (b) Lateral view.
Figure 7. Setup for experimental sensor verification in the laboratory.
Following the aforementioned technique, the measured cross-mode transmission coefficient for the different mixtures of DI water and NaCl is plotted in Figure 8a. To evaluate the symmetry of the structure, both channels are filled with the same liquid (the REF liquid). The maximum cross-mode insertion loss (the cross-mode transmission coefficient expressed in dB) for this case is −31.94 dB, which is considered to be a reasonable result, indicating that the structure is quite balanced when
Figure 7. Setup for experimental sensor verification in the laboratory.
Following the aforementioned technique, the measured cross-mode transmission coefficient forthe different mixtures of DI water and NaCl is plotted in Figure 8a. To evaluate the symmetry of thestructure, both channels are filled with the same liquid (the REF liquid). The maximum cross-modeinsertion loss (the cross-mode transmission coefficient expressed in dB) for this case is −31.94 dB,which is considered to be a reasonable result, indicating that the structure is quite balanced whenidentical liquids are present in both channels. It should be mentioned that for proper balance, we first
Sensors 2019, 19, 3189 10 of 18
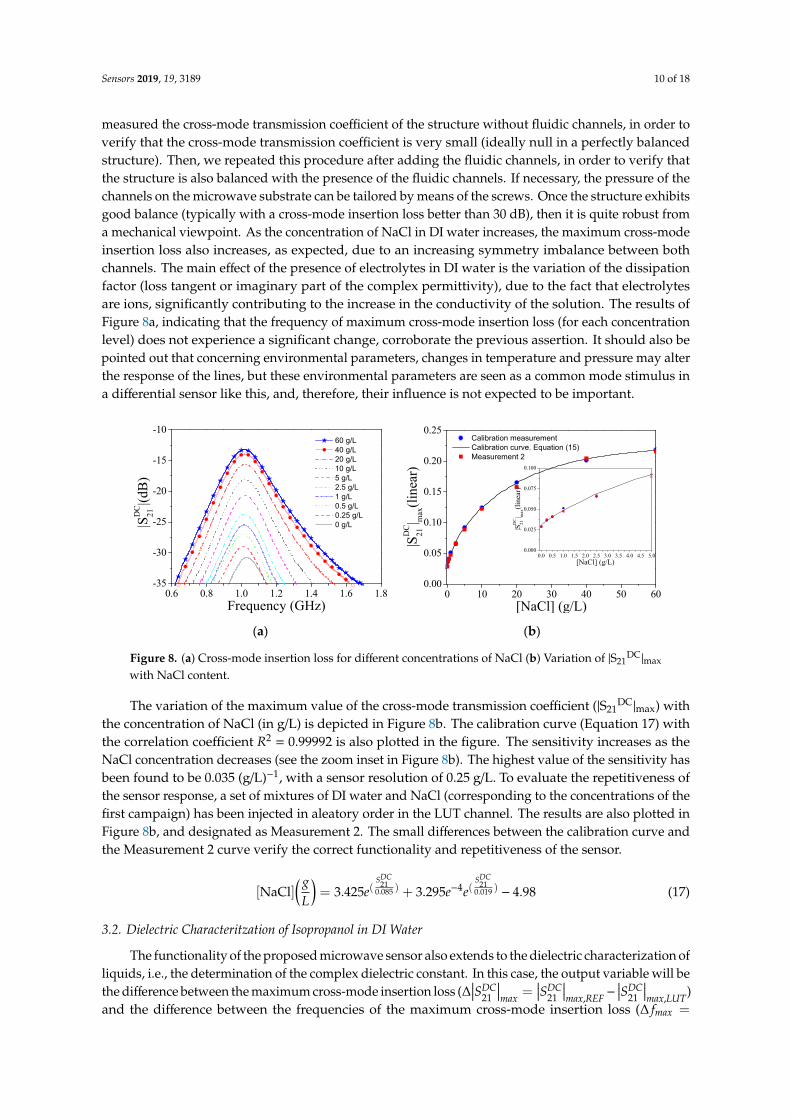
measured the cross-mode transmission coefficient of the structure without fluidic channels, in order toverify that the cross-mode transmission coefficient is very small (ideally null in a perfectly balancedstructure). Then, we repeated this procedure after adding the fluidic channels, in order to verify thatthe structure is also balanced with the presence of the fluidic channels. If necessary, the pressure of thechannels on the microwave substrate can be tailored by means of the screws. Once the structure exhibitsgood balance (typically with a cross-mode insertion loss better than 30 dB), then it is quite robust froma mechanical viewpoint. As the concentration of NaCl in DI water increases, the maximum cross-modeinsertion loss also increases, as expected, due to an increasing symmetry imbalance between bothchannels. The main effect of the presence of electrolytes in DI water is the variation of the dissipationfactor (loss tangent or imaginary part of the complex permittivity), due to the fact that electrolytesare ions, significantly contributing to the increase in the conductivity of the solution. The results ofFigure 8a, indicating that the frequency of maximum cross-mode insertion loss (for each concentrationlevel) does not experience a significant change, corroborate the previous assertion. It should also bepointed out that concerning environmental parameters, changes in temperature and pressure may alterthe response of the lines, but these environmental parameters are seen as a common mode stimulus ina differential sensor like this, and, therefore, their influence is not expected to be important.
Sensors 2019, 19 FOR PEER REVIEW 10
identical liquids are present in both channels. It should be mentioned that for proper balance, we first measured the cross-mode transmission coefficient of the structure without fluidic channels, in order to verify that the cross-mode transmission coefficient is very small (ideally null in a perfectly balanced structure). Then, we repeated this procedure after adding the fluidic channels, in order to verify that the structure is also balanced with the presence of the fluidic channels. If necessary, the pressure of the channels on the microwave substrate can be tailored by means of the screws. Once the structure exhibits good balance (typically with a cross-mode insertion loss better than 30 dB), then it is quite robust from a mechanical viewpoint. As the concentration of NaCl in DI water increases, the maximum cross-mode insertion loss also increases, as expected, due to an increasing symmetry imbalance between both channels. The main effect of the presence of electrolytes in DI water is the variation of the dissipation factor (loss tangent or imaginary part of the complex permittivity), due to the fact that electrolytes are ions, significantly contributing to the increase in the conductivity of the solution. The results of Figure 8a, indicating that the frequency of maximum cross-mode insertion loss (for each concentration level) does not experience a significant change, corroborate the previous assertion. It should also be pointed out that concerning environmental parameters, changes in temperature and pressure may alter the response of the lines, but these environmental parameters are seen as a common mode stimulus in a differential sensor like this, and, therefore, their influence is not expected to be important.
(a) (b)
Figure 8. (a) Cross-mode insertion loss for different concentrations of NaCl (b) Variation of |S21DC|max with NaCl content.
The variation of the maximum value of the cross-mode transmission coefficient (|S21DC|max) with the concentration of NaCl (in g/L) is depicted in Figure 8b. The calibration curve (Equation 17) with the correlation coefficient R2 = 0.99992 is also plotted in the figure. The sensitivity increases as the NaCl concentration decreases (see the zoom inset in Figure 8b). The highest value of the sensitivity has been found to be 0.035 (g/L)-1, with a sensor resolution of 0.25 g/L. To evaluate the repetitiveness of the sensor response, a set of mixtures of DI water and NaCl (corresponding to the concentrations of the first campaign) has been injected in aleatory order in the LUT channel. The results are also plotted in Figure 8b, and designated as Measurement 2. The small differences between the calibration curve and the Measurement 2 curve verify the correct functionality and repetitiveness of the sensor.
[NaCl] 𝑔𝐿 = 3.425𝑒 . + 3.295𝑒 𝑒 . − 4.98 (17)
0.6 0.8 1.0 1.2 1.4 1.6 1.8-35
-30
-25
-20
-15
-10 60 g/L 40 g/L 20 g/L 10 g/L 5 g/L 2.5 g/L 1 g/L 0.5 g/L 0.25 g/L 0 g/L|S
DC
21|(d
B)
Frequency (GHz)0 10 20 30 40 50 60
0.00
0.05
0.10
0.15
0.20
0.25 Calibration measurement Calibration curve. Equation (15) Measurement 2
|SD
C21
| max
(line
ar)
[NaCl] (g/L)
0.0 0.5 1.0 1.5 2.0 2.5 3.0 3.5 4.0 4.5 5.00.000
0.025
0.050
0.075
0.100
|SD
C21
| max
(line
ar)
[NaCl] (g/L)
Figure 8. (a) Cross-mode insertion loss for different concentrations of NaCl (b) Variation of |S21DC|max
with NaCl content.
The variation of the maximum value of the cross-mode transmission coefficient (|S21DC|max) with
the concentration of NaCl (in g/L) is depicted in Figure 8b. The calibration curve (Equation 17) withthe correlation coefficient R2 = 0.99992 is also plotted in the figure. The sensitivity increases as theNaCl concentration decreases (see the zoom inset in Figure 8b). The highest value of the sensitivity hasbeen found to be 0.035 (g/L)−1, with a sensor resolution of 0.25 g/L. To evaluate the repetitiveness ofthe sensor response, a set of mixtures of DI water and NaCl (corresponding to the concentrations of thefirst campaign) has been injected in aleatory order in the LUT channel. The results are also plotted inFigure 8b, and designated as Measurement 2. The small differences between the calibration curve andthe Measurement 2 curve verify the correct functionality and repetitiveness of the sensor.
[NaCl]( g
L
)= 3.425e(
SDC21
0.085 ) + 3.295e−4e(SDC
210.019 ) − 4.98 (17)
3.2. Dielectric Characteritzation of Isopropanol in DI Water
The functionality of the proposed microwave sensor also extends to the dielectric characterization ofliquids, i.e., the determination of the complex dielectric constant. In this case, the output variable will bethe difference between the maximum cross-mode insertion loss (∆
∣∣∣SDC21
∣∣∣max =
∣∣∣SDC21
∣∣∣max,REF−
∣∣∣SDC21
∣∣∣max,LUT)
and the difference between the frequencies of the maximum cross-mode insertion loss (∆ fmax =
Sensors 2019, 19, 3189 11 of 18
fmax,LUT − fmax,REF) for each measurement. The reason for this is that the complex dielectric constant iscomposed of real and imaginary parts, thereby requiring two independent output variables for itsunivocal determination.
The dielectric characterization of liquids proceeds as follows. First of all, the maximum cross-modeinsertion loss and its frequency position when both channels are loaded with pure DI water (the REFliquid) are recorded. These values correspond to the reference level, namely
∣∣∣SDC21
∣∣∣max,REF and fmax,REF,
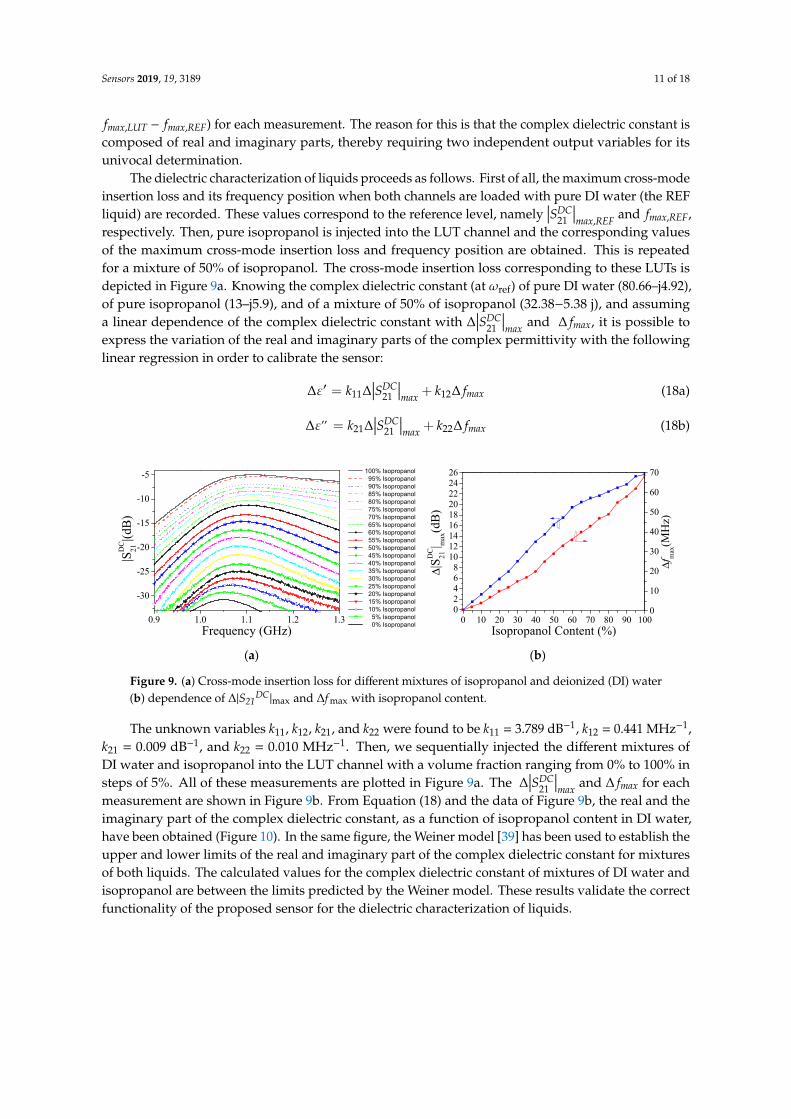
respectively. Then, pure isopropanol is injected into the LUT channel and the corresponding valuesof the maximum cross-mode insertion loss and frequency position are obtained. This is repeatedfor a mixture of 50% of isopropanol. The cross-mode insertion loss corresponding to these LUTs isdepicted in Figure 9a. Knowing the complex dielectric constant (at ωref) of pure DI water (80.66–j4.92),of pure isopropanol (13–j5.9), and of a mixture of 50% of isopropanol (32.38−5.38 j), and assuminga linear dependence of the complex dielectric constant with ∆
∣∣∣SDC21
∣∣∣max and ∆ fmax, it is possible to
express the variation of the real and imaginary parts of the complex permittivity with the followinglinear regression in order to calibrate the sensor:
∆ε′ = k11∆∣∣∣SDC
21
∣∣∣max + k12∆ fmax (18a)
∆ε′′ = k21∆∣∣∣SDC
21
∣∣∣max + k22∆ fmax (18b)
Sensors 2019, 19 FOR PEER REVIEW 11
3.2. Dielectric Characteritzation of Isopropanol in DI Water
The functionality of the proposed microwave sensor also extends to the dielectric characterization of liquids, i.e., the determination of the complex dielectric constant. In this case, the output variable will be the difference between the maximum cross-mode insertion loss ( ∆|𝑆 | = |𝑆 | , − |𝑆 | , ) and the difference between the frequencies of the maximum cross-mode insertion loss (∆𝑓 = 𝑓 , − 𝑓 , ) for each measurement. The reason for this is that the complex dielectric constant is composed of real and imaginary parts, thereby requiring two independent output variables for its univocal determination.
The dielectric characterization of liquids proceeds as follows. First of all, the maximum cross-mode insertion loss and its frequency position when both channels are loaded with pure DI water (the REF liquid) are recorded. These values correspond to the reference level, namely |𝑆 | , and𝑓 , , respectively. Then, pure isopropanol is injected into the LUT channel and the corresponding values of the maximum cross-mode insertion loss and frequency position are obtained. This is repeated for a mixture of 50% of isopropanol. The cross-mode insertion loss corresponding to these LUTs is depicted in Figure 9a. Knowing the complex dielectric constant (at ωref) of pure DI water (80.66–j4.92), of pure isopropanol (13–j5.9), and of a mixture of 50% of isopropanol (32.38−5.38 j), and assuming a linear dependence of the complex dielectric constant with ∆|𝑆 | and ∆𝑓 , it is possible to express the variation of the real and imaginary parts of the complex permittivity with the following linear regression in order to calibrate the sensor: ∆𝜀 = 𝑘 ∆|𝑆 | + 𝑘 ∆𝑓 (18a) ∆𝜀 = 𝑘 ∆|𝑆 | + 𝑘 ∆𝑓 (18b)
(a) (b)
Figure 9. (a) Cross-mode insertion loss for different mixtures of isopropanol and deionized (DI) water (b) dependence of Δ|S21DC|max and Δfmax with isopropanol content.
The unknown variables k11, k12, k21, and k22 were found to be k11 = 3.789 dB−1, k12 = 0.441 MHz−1, k21 = 0.009 dB−1, and k22 = 0.010 MHz−1. Then, we sequentially injected the different mixtures of DI water and isopropanol into the LUT channel with a volume fraction ranging from 0% to 100% in steps of 5%. All of these measurements are plotted in Figure 9a. The ∆|𝑆 | and ∆𝑓 for each measurement are shown in Figure 9b. From Equation (18) and the data of Figure 9b, the real and the imaginary part of the complex dielectric constant, as a function of isopropanol content in DI water, have been obtained (Figure 10). In the same figure, the Weiner model [44] has been used to establish the upper and lower limits of the real and imaginary part of the complex dielectric constant for mixtures of both liquids. The calculated values for the complex dielectric constant of mixtures of DI water and isopropanol are between the limits predicted by the Weiner model. These results validate the correct functionality of the proposed sensor for the dielectric characterization of liquids.
0.9 1.0 1.1 1.2 1.3
-30
-25
-20
-15
-10
-5 100% Isopropanol 95% Isopropanol 90% Isopropanol 85% Isopropanol 80% Isopropanol 75% Isopropanol 70% Isopropanol 65% Isopropanol 60% Isopropanol 55% Isopropanol 50% Isopropanol 45% Isopropanol 40% Isopropanol 35% Isopropanol 30% Isopropanol 25% Isopropanol 20% Isopropanol 15% Isopropanol 10% Isopropanol 5% Isopropanol 0% Isopropanol
|SD
C21
|(dB)
Frequency (GHz)0 10 20 30 40 50 60 70 80 90 100
02468
101214161820222426
Δfm
ax(M
Hz)
Δ|SD
C21
| max
(dB)
Isopropanol Content (%)
0
10
20
30
40
50
60
70
Figure 9. (a) Cross-mode insertion loss for different mixtures of isopropanol and deionized (DI) water(b) dependence of ∆|S21
DC|max and ∆f max with isopropanol content.
The unknown variables k11, k12, k21, and k22 were found to be k11 = 3.789 dB−1, k12 = 0.441 MHz−1,k21 = 0.009 dB−1, and k22 = 0.010 MHz−1. Then, we sequentially injected the different mixtures ofDI water and isopropanol into the LUT channel with a volume fraction ranging from 0% to 100% insteps of 5%. All of these measurements are plotted in Figure 9a. The ∆
∣∣∣SDC21
∣∣∣max and ∆ fmax for each
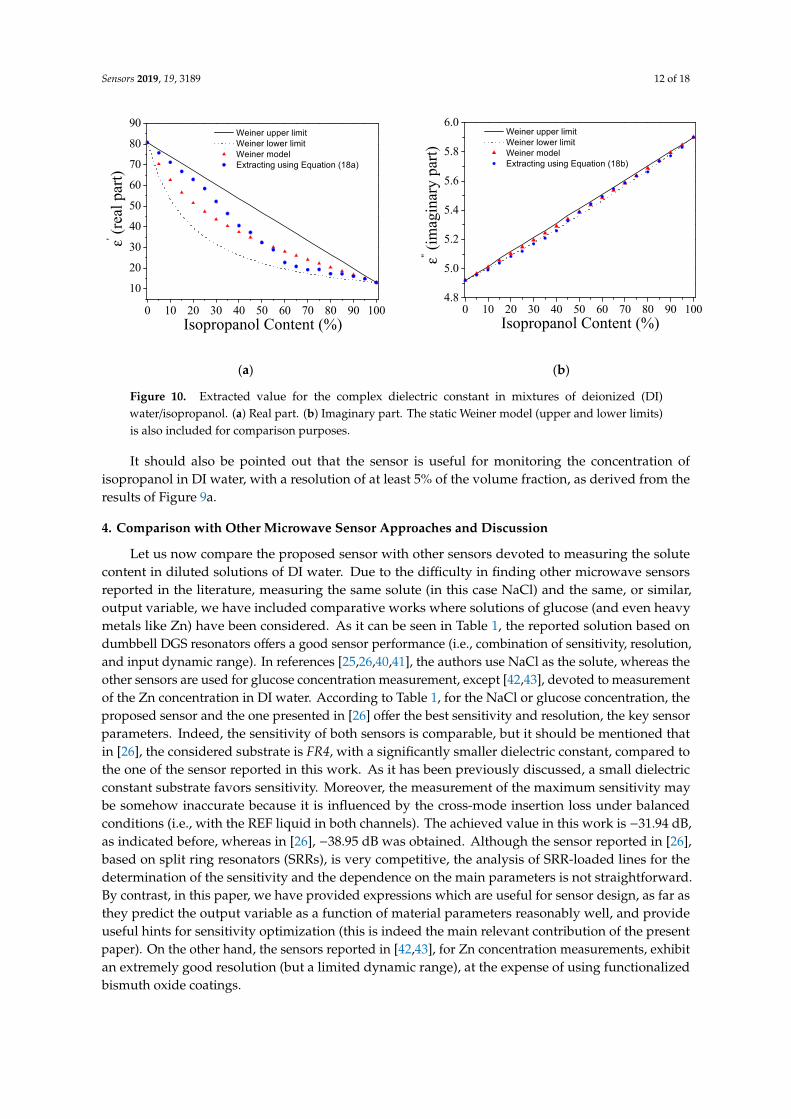
measurement are shown in Figure 9b. From Equation (18) and the data of Figure 9b, the real and theimaginary part of the complex dielectric constant, as a function of isopropanol content in DI water,have been obtained (Figure 10). In the same figure, the Weiner model [39] has been used to establish theupper and lower limits of the real and imaginary part of the complex dielectric constant for mixturesof both liquids. The calculated values for the complex dielectric constant of mixtures of DI water andisopropanol are between the limits predicted by the Weiner model. These results validate the correctfunctionality of the proposed sensor for the dielectric characterization of liquids.
Sensors 2019, 19, 3189 12 of 18
Sensors 2019, 19 FOR PEER REVIEW 12
(a) (b)
Figure 10. Extracted value for the complex dielectric constant in mixtures of deionized (DI) water/isopropanol. (a) Real part. (b) Imaginary part. The static Weiner model (upper and lower limits) is also included for comparison purposes.
It should also be pointed out that the sensor is useful for monitoring the concentration of isopropanol in DI water, with a resolution of at least 5% of the volume fraction, as derived from the results of Figure 9a.
4. Comparison with Other Microwave Sensor Approaches and Discussion
Let us now compare the proposed sensor with other sensors devoted to measuring the solute content in diluted solutions of DI water. Due to the difficulty in finding other microwave sensors reported in the literature, measuring the same solute (in this case NaCl) and the same, or similar, output variable, we have included comparative works where solutions of glucose (and even heavy metals like Zn) have been considered. As it can be seen in Table 1, the reported solution based on dumbbell DGS resonators offers a good sensor performance (i.e., combination of sensitivity, resolution, and input dynamic range). In references [25,26,39,47], the authors use NaCl as the solute, whereas the other sensors are used for glucose concentration measurement, except [48,49], devoted to measurement of the Zn concentration in DI water. According to Table 1, for the NaCl or glucose concentration, the proposed sensor and the one presented in [26] offer the best sensitivity and resolution, the key sensor parameters. Indeed, the sensitivity of both sensors is comparable, but it should be mentioned that in [26], the considered substrate is FR4, with a significantly smaller dielectric constant, compared to the one of the sensor reported in this work. As it has been previously discussed, a small dielectric constant substrate favors sensitivity. Moreover, the measurement of the maximum sensitivity may be somehow inaccurate because it is influenced by the cross-mode insertion loss under balanced conditions (i.e., with the REF liquid in both channels). The achieved value in this work is −31.94 dB, as indicated before, whereas in [26], −38.95 dB was obtained. Although the sensor reported in [26], based on split ring resonators (SRRs), is very competitive, the analysis of SRR-loaded lines for the determination of the sensitivity and the dependence on the main parameters is not straightforward. By contrast, in this paper, we have provided expressions which are useful for sensor design, as far as they predict the output variable as a function of material parameters reasonably well, and provide useful hints for sensitivity optimization (this is indeed the main relevant contribution of the present paper). On the other hand, the sensors reported in [48,49], for Zn concentration measurements, exhibit an extremely good resolution (but a limited dynamic range), at the expense of using functionalized bismuth oxide coatings.
0 10 20 30 40 50 60 70 80 90 100
10
20
30
40
50
60
70
80
90 Weiner upper limit Weiner lower limit Weiner model Extracting using Equation (18a)
ε' (rea
l par
t)
Isopropanol Content (%)0 10 20 30 40 50 60 70 80 90 100
4.8
5.0
5.2
5.4
5.6
5.8
6.0 Weiner upper limit Weiner lower limit Weiner model Extracting using Equation (18b)
ε'' (im
agin
ary
part)
Isopropanol Content (%)
Figure 10. Extracted value for the complex dielectric constant in mixtures of deionized (DI)water/isopropanol. (a) Real part. (b) Imaginary part. The static Weiner model (upper and lower limits)is also included for comparison purposes.
It should also be pointed out that the sensor is useful for monitoring the concentration ofisopropanol in DI water, with a resolution of at least 5% of the volume fraction, as derived from theresults of Figure 9a.
4. Comparison with Other Microwave Sensor Approaches and Discussion
Let us now compare the proposed sensor with other sensors devoted to measuring the solutecontent in diluted solutions of DI water. Due to the difficulty in finding other microwave sensorsreported in the literature, measuring the same solute (in this case NaCl) and the same, or similar,output variable, we have included comparative works where solutions of glucose (and even heavymetals like Zn) have been considered. As it can be seen in Table 1, the reported solution based ondumbbell DGS resonators offers a good sensor performance (i.e., combination of sensitivity, resolution,and input dynamic range). In references [25,26,40,41], the authors use NaCl as the solute, whereas theother sensors are used for glucose concentration measurement, except [42,43], devoted to measurementof the Zn concentration in DI water. According to Table 1, for the NaCl or glucose concentration, theproposed sensor and the one presented in [26] offer the best sensitivity and resolution, the key sensorparameters. Indeed, the sensitivity of both sensors is comparable, but it should be mentioned thatin [26], the considered substrate is FR4, with a significantly smaller dielectric constant, compared tothe one of the sensor reported in this work. As it has been previously discussed, a small dielectricconstant substrate favors sensitivity. Moreover, the measurement of the maximum sensitivity maybe somehow inaccurate because it is influenced by the cross-mode insertion loss under balancedconditions (i.e., with the REF liquid in both channels). The achieved value in this work is −31.94 dB,as indicated before, whereas in [26], −38.95 dB was obtained. Although the sensor reported in [26],based on split ring resonators (SRRs), is very competitive, the analysis of SRR-loaded lines for thedetermination of the sensitivity and the dependence on the main parameters is not straightforward.By contrast, in this paper, we have provided expressions which are useful for sensor design, as far asthey predict the output variable as a function of material parameters reasonably well, and provideuseful hints for sensitivity optimization (this is indeed the main relevant contribution of the presentpaper). On the other hand, the sensors reported in [42,43], for Zn concentration measurements, exhibitan extremely good resolution (but a limited dynamic range), at the expense of using functionalizedbismuth oxide coatings.
Sensors 2019, 19, 3189 13 of 18
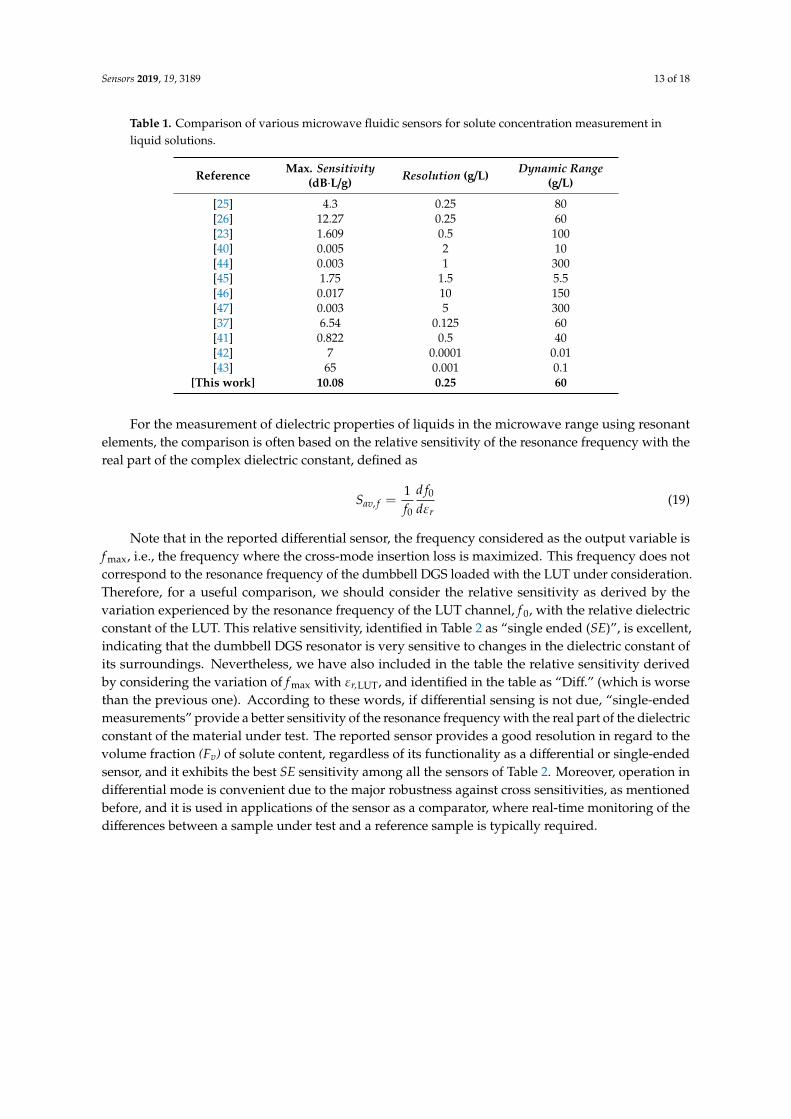
Table 1. Comparison of various microwave fluidic sensors for solute concentration measurement inliquid solutions.
Reference Max. Sensitivity(dB·L/g) Resolution (g/L) Dynamic Range
(g/L)
[25] 4.3 0.25 80[26] 12.27 0.25 60[23] 1.609 0.5 100[40] 0.005 2 10[44] 0.003 1 300[45] 1.75 1.5 5.5[46] 0.017 10 150[47] 0.003 5 300[37] 6.54 0.125 60[41] 0.822 0.5 40[42] 7 0.0001 0.01[43] 65 0.001 0.1
[This work] 10.08 0.25 60
For the measurement of dielectric properties of liquids in the microwave range using resonantelements, the comparison is often based on the relative sensitivity of the resonance frequency with thereal part of the complex dielectric constant, defined as
Sav, f =1f0
d f0dεr
(19)
Note that in the reported differential sensor, the frequency considered as the output variable isf max, i.e., the frequency where the cross-mode insertion loss is maximized. This frequency does notcorrespond to the resonance frequency of the dumbbell DGS loaded with the LUT under consideration.Therefore, for a useful comparison, we should consider the relative sensitivity as derived by thevariation experienced by the resonance frequency of the LUT channel, f 0, with the relative dielectricconstant of the LUT. This relative sensitivity, identified in Table 2 as “single ended (SE)”, is excellent,indicating that the dumbbell DGS resonator is very sensitive to changes in the dielectric constant ofits surroundings. Nevertheless, we have also included in the table the relative sensitivity derivedby considering the variation of f max with εr,LUT, and identified in the table as “Diff.” (which is worsethan the previous one). According to these words, if differential sensing is not due, “single-endedmeasurements” provide a better sensitivity of the resonance frequency with the real part of the dielectricconstant of the material under test. The reported sensor provides a good resolution in regard to thevolume fraction (Fv) of solute content, regardless of its functionality as a differential or single-endedsensor, and it exhibits the best SE sensitivity among all the sensors of Table 2. Moreover, operation indifferential mode is convenient due to the major robustness against cross sensitivities, as mentionedbefore, and it is used in applications of the sensor as a comparator, where real-time monitoring of thedifferences between a sample under test and a reference sample is typically required.
Sensors 2019, 19, 3189 14 of 18
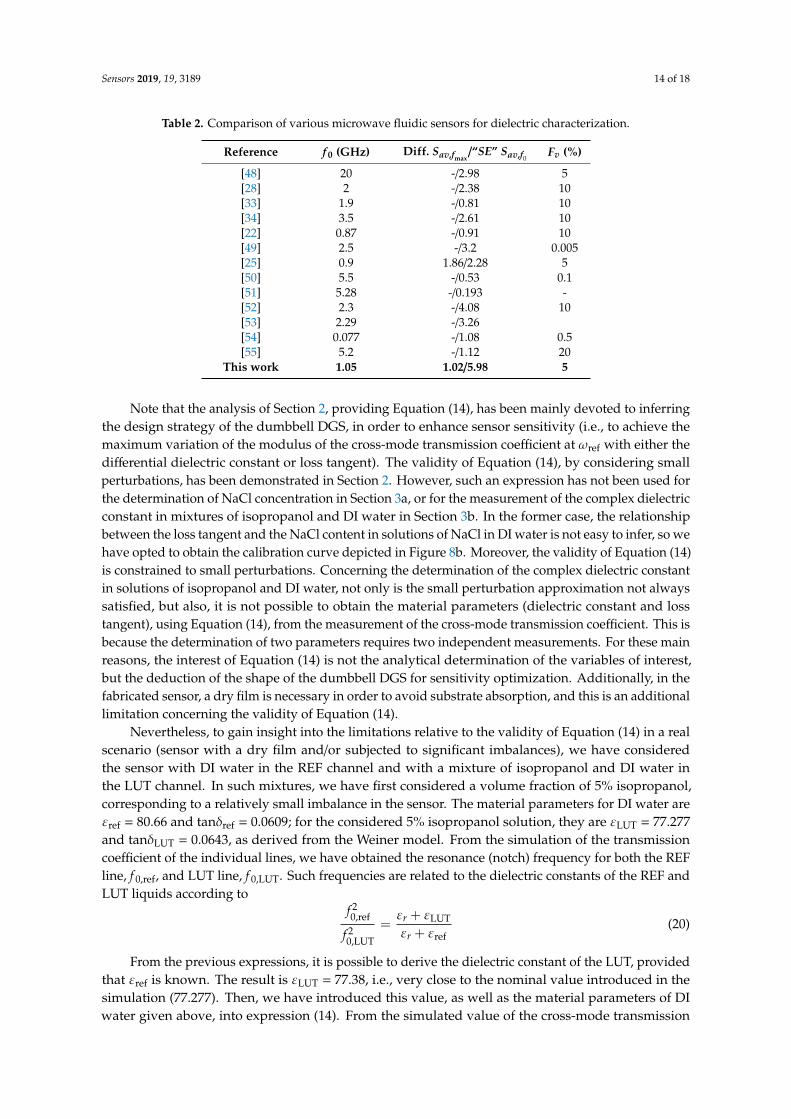
Table 2. Comparison of various microwave fluidic sensors for dielectric characterization.
Reference f 0 (GHz) Diff. Sav,fmax/“SE” Sav,f0
Fv (%)
[48] 20 -/2.98 5[28] 2 -/2.38 10[33] 1.9 -/0.81 10[34] 3.5 -/2.61 10[22] 0.87 -/0.91 10[49] 2.5 -/3.2 0.005[25] 0.9 1.86/2.28 5[50] 5.5 -/0.53 0.1[51] 5.28 -/0.193 -[52] 2.3 -/4.08 10[53] 2.29 -/3.26[54] 0.077 -/1.08 0.5[55] 5.2 -/1.12 20
This work 1.05 1.02/5.98 5
Note that the analysis of Section 2, providing Equation (14), has been mainly devoted to inferringthe design strategy of the dumbbell DGS, in order to enhance sensor sensitivity (i.e., to achieve themaximum variation of the modulus of the cross-mode transmission coefficient at ωref with either thedifferential dielectric constant or loss tangent). The validity of Equation (14), by considering smallperturbations, has been demonstrated in Section 2. However, such an expression has not been used forthe determination of NaCl concentration in Section 3a, or for the measurement of the complex dielectricconstant in mixtures of isopropanol and DI water in Section 3b. In the former case, the relationshipbetween the loss tangent and the NaCl content in solutions of NaCl in DI water is not easy to infer, so wehave opted to obtain the calibration curve depicted in Figure 8b. Moreover, the validity of Equation (14)is constrained to small perturbations. Concerning the determination of the complex dielectric constantin solutions of isopropanol and DI water, not only is the small perturbation approximation not alwayssatisfied, but also, it is not possible to obtain the material parameters (dielectric constant and losstangent), using Equation (14), from the measurement of the cross-mode transmission coefficient. This isbecause the determination of two parameters requires two independent measurements. For these mainreasons, the interest of Equation (14) is not the analytical determination of the variables of interest,but the deduction of the shape of the dumbbell DGS for sensitivity optimization. Additionally, in thefabricated sensor, a dry film is necessary in order to avoid substrate absorption, and this is an additionallimitation concerning the validity of Equation (14).
Nevertheless, to gain insight into the limitations relative to the validity of Equation (14) in a realscenario (sensor with a dry film and/or subjected to significant imbalances), we have consideredthe sensor with DI water in the REF channel and with a mixture of isopropanol and DI water inthe LUT channel. In such mixtures, we have first considered a volume fraction of 5% isopropanol,corresponding to a relatively small imbalance in the sensor. The material parameters for DI water areεref = 80.66 and tanδref = 0.0609; for the considered 5% isopropanol solution, they are εLUT = 77.277and tanδLUT = 0.0643, as derived from the Weiner model. From the simulation of the transmissioncoefficient of the individual lines, we have obtained the resonance (notch) frequency for both the REFline, f 0,ref, and LUT line, f 0,LUT. Such frequencies are related to the dielectric constants of the REF andLUT liquids according to
f 20,ref
f 20,LUT
=εr + εLUT
εr + εref(20)
From the previous expressions, it is possible to derive the dielectric constant of the LUT, providedthat εref is known. The result is εLUT = 77.38, i.e., very close to the nominal value introduced in thesimulation (77.277). Then, we have introduced this value, as well as the material parameters of DIwater given above, into expression (14). From the simulated value of the cross-mode transmission
Sensors 2019, 19, 3189 15 of 18
coefficient at ωref, we have isolated the loss tangent of the considered LUT liquid, and the resultingvalue has been found to be tanδLUT = 0.0630, i.e., in good agreement with the nominal value (0.0643).By repeating the simulation with a dry film with the thickness and dielectric constant indicated inSection 2, the material parameters are found to be εLUT = 78.11 and tanδLUT = 0.0682. That is, thediscrepancies are higher, and such discrepancies are even higher when the material parameters areobtained from the measured data (εLUT = 79.63 and tanδLUT = 0.0687). These results indicate that witha 5% volume fraction of isopropanol, the small perturbation approximation is valid, and the substrate,the REF liquid, and the LUT liquid can be considered to be semi-infinite. In other words, for thislevel of isopropanol content (5%), Equation (14) is valid, provided the sensor is not equipped witha dry film. However, the presence of the dry film limits the validity of Equation (14), providing onlyapproximate values.
By considering values of the isopropanol content above 10%, Equation (20) provides good resultsconcerning the dielectric constant of the LUT liquid, provided a dry film is not used. The reason forthis is that this expression is valid, regardless of the sensor imbalance. However, the determination ofthe loss tangent of the LUT is not as accurate, compared to the 5% case, since the imbalance cannotbe considered small. In addition, the discrepancies further increase by considering the presence ofthe dry film. Therefore, the determination of material (liquid) parameters through Equation (14) islimited to small perturbations and REF and LUT liquids in direct contact with the sensitive element(the dumbbell DGS). Although we have added a dry film in order to avoid absorption (as justifiedbefore), there are substrates that prevent absorption. In those cases, Equation (14) can be used topredict liquid parameters, provided that the REF and LUT liquids are not very different. Nevertheless,the determination of εLUT through Equation (20) is first required. Then, this parameter is introduced inEquation (14), and from this expression, and the measured cross-mode transmission coefficient, theloss tangent of the LUT can be obtained.
5. Conclusions
In conclusion, a real-time differential microwave sensor based on a pair of transmission lines loadedwith dumbbell-shaped DGS resonators has been presented, analyzed, and validated. The sensingmethod is based on symmetry disruption, produced by the presence of two different materialsin the sensing regions, the capacitive slots of the dumbbell DGSs. This work has focused on thecharacterization of liquid solutions, where the reference (REF) material has been deionized (DI) water,and the liquid under test (LUT) has included different solutions of either NaCl or isopropanol (thesolutes) in DI water (the solvent). For that purpose, the sensor has been equipped with a pair of fluidicchannels: one for the REF liquid and the other one for the LUT. The sensor has been optimized inorder to detect tiny differences between the REF liquid and the LUT, measured through the cross-modetransmission coefficient, the output variable. For sensitivity optimization, the circuit model andan accurate analysis, from which we have derived the dependence of the output variable with thematerial parameters, have been the key aspects, and the main relevant contribution of this paper.It has been found that the sensitivity is optimized by designing a dumbbell DGS with narrow andlong slots. The sensor has been used for the measurement of NaCl concentrations in DI water, wherea resolution as good as 0.25 g/L, with a maximum sensitivity of 10.08 (dB·L/g), has been achieved.Then, the functionality of the sensor for the measurement of the complex dielectric constant of liquids(particularly solutions of isopropanol in DI water), has been demonstrated. The sensor can be usedfor the characterization of many other types of liquids and solutions, and it is especially useful formonitoring real-time changes in an LUT compared to an REF liquid.
Author Contributions: P.V. developed and designed the methodology and the creation of the models, as well asthe validation of the experimental results. He also participated in the writing of the article. J.M.-E. analyzed thedata and was involved in the writing of the paper. M.G. simulated the different models in the 3D Electromagneticsolver software (HFSS). J.M.-C. contributed with his knowledge on the sensors field and checked the paper.F.M. conceived the work and wrote the article.
Sensors 2019, 19, 3189 16 of 18
Funding: This work was supported by MINECO-Spain (project TEC2016-75650-R), by Generalitat de Catalunya(project 2017SGR-1159), by Institució Catalana de Recerca i Estudis Avançats (who awarded Ferran Martín), andby FEDER funds.
Acknowledgments: J. Muñoz-Enano thanks Secretaria d’Universitats i Recerca (Gen. Cat.) and European SocialFund for the FI grant. Paris Vélez thanks the Juan de la Cierva Program for supporting him through ProjectIJCI-2017-31339. M. Gil thanks the Universidad Politécnica de Madrid Young Researchers Support Program(VJIDOCUPM18MGB) for its support.
Conflicts of Interest: The authors declare no conflicts of interest.
References
1. Ahn, D.; Park, J.S.; Kim, C.S.; Qian, Y.; Itoh, T. A Design of the Lowpass Filter Using the Novel MicrostripDefected Ground Structure. IEEE Trans. Microw. Theory Tech. 2001, 49, 86–93. [CrossRef]
2. Kumar, A.; Kartikeyan, A. Design and realization of microstrip filters with new defected ground structure(DGS). Eng. Sci. Technol. Int. J. 2017, 20, 679–686. [CrossRef]
3. Kumar-Khandelwal, M.; Kumar-Kanaujia, B.; Kumar, S. Defected Ground Structure: Fundamentals, Analysis,and Applications in Modern Wireless Trends. Int. J. Antennas Propag. 2017, 2017, 22.
4. Arya, A.K.; Kartikeyan, M.V.; Patnaik, A. Defected Ground Structure in the perspective of MicrostripAntennas: A Review. Frequenz 2010, 64, 79–84. [CrossRef]
5. Zainud-Deen, H.; Badr, M.E.; El-Deen, E.; Awadallaand, K.H.; Sharshar, H.A. Microstrip antenna withdefected ground plane structure as a sensor for landmines detection. Prog. Electromagn. Res. B 2008, 4, 27–39.[CrossRef]
6. Rezaee, M.; Joodaki, M. Two-Dimensional Displacement Sensor Based on CPW Line Loaded by DefectedGround Structure with Two Separated Transmission Zeroes. IEEE Sens. J. 2017, 17, 994–999. [CrossRef]
7. Naqui, J.; Durán-Sindreu, M.; Martín, F. Novel sensors based on the symmetry properties of split ringresonators (SRRs). Sensors 2011, 11, 7545–7553. [CrossRef] [PubMed]
8. Naqui, J. Symmetry Properties in Transmission Lines Loaded with Electrically Small Resonators: Circuit Modelingand Applications; Springer: Heidelberg, Germany, 2016.
9. Naqui, J.; Durán-Sindreu, M.; Martín, F. Alignment and position sensors based on split ring resonators.Sensors 2012, 12, 11790–11797. [CrossRef]
10. Horestani, A.K.; Fumeaux, C.; Al-Sarawi, S.F.; Abbott, D. Displacement sensor based on diamond-shapedtapered split ring resonator. IEEE Sens. J. 2013, 13, 1153–1160. [CrossRef]
11. Horestani, A.K.; Abbott, D.; Fumeaux, C. Rotation sensor based on horn-shaped split ring resonator.IEEE Sens. J. 2013, 13, 3014–3015. [CrossRef]
12. Naqui, J.; Martín, F. Transmission lines loaded with bisymmetric resonators and their application to angulardisplacement and velocity sensors. IEEE Trans. Microw. Theory Tech. 2013, 61, 4700–4713. [CrossRef]
13. Naqui, J.; Martín, F. Angular displacement and velocity sensors based on electric-LC (ELC) loaded microstriplines. IEEE Sens. J. 2014, 14, 939–940. [CrossRef]
14. Horestani, A.K.; Naqui, J.; Abbott, D.; Fumeaux, C.; Martín, F. Two-dimensional displacement and alignmentsensor based on reflection coefficients of open microstrip lines loaded with split ring resonators. Electron.Lett. 2014, 50, 620–622. [CrossRef]
15. Naqui, J.; Martín, F. Microwave sensors based on symmetry properties of resonator-loaded transmissionlines: A review. Sensors 2015, 2015, 10. [CrossRef]
16. Naqui, J.; Coromina, J.; Karami-Horestani, A.; Fumeaux, C.; Martín, F. Angular displacement and velocitysensors based on coplanar waveguides (CPWs) loaded with S-shaped split ring resonator (S-SRR). Sensors2015, 15, 9628–9650. [CrossRef] [PubMed]
17. Horestani, A.K.; Naqui, J.; Shaterian, Z.; Abbott, D.; Fumeaux, C.; Martín, F. Two-dimensional alignment anddisplacement sensor based on movable broadside-coupled split ring resonators. Sens. Actuators A 2014, 210,18–24. [CrossRef]
18. Su, L.; Naqui, J.; Mata-Contreras, J.; Martín, F. Modeling metamaterial transmission lines loaded with pairsof coupled split ring resonators. IEEE Antennas Wirel. Propag. Lett. 2015, 14, 68–71. [CrossRef]
19. Su, L.; Naqui, J.; Mata-Contreras, J.; Martín, F. Modeling and applications of metamaterial transmission linesloaded with pairs of coupled complementary split ring resonators (CSRRs). IEEE Antennas Wirel. Propag.Lett. 2016, 15, 154–157. [CrossRef]
Sensors 2019, 19, 3189 17 of 18
20. Naqui, J.; Damm, C.; Wiens, A.; Jakoby, R.; Su, L.; Mata-Contreras, J.; Martín, F. Transmission LinesLoaded with Pairs of Stepped Impedance Resonators: Modeling and Application to Differential PermittivityMeasurements. IEEE Trans. Microw. Theory Tech. 2016, 64, 3864–3877. [CrossRef]
21. Su, L.; Mata-Contreras, J.; Naqui, J.; Martín, F. Splitter/combiner microstrip sections loaded with pairs ofcomplementary split ring resonators (CSRRs): Modeling and optimization for differential sensing applications.IEEE Trans. Microw. Theory Tech. 2016, 64, 4362–4370. [CrossRef]
22. Vélez, P.; Su, L.; Grenier, K.; Mata-Contreras, J.; Dubuc, D.; Martín, F. Microwave microfluidic sensor basedon a microstrip splitter/combiner configuration and split ring resonators (SRR) for dielectric characterizationof liquids. IEEE Sens. J. 2017, 17, 6589–6598. [CrossRef]
23. Vélez, P.; Mata-Contreras, J.; Dubuc, D.; Grenier, K.; Martín, F. Solute Concentration Measurements in DilutedSolutions by means of Split Ring Resonators. In Proceedings of the 48th European Microwave Conference,Madrid, Spain, 25–27 September 2018.
24. Vélez, P.; Mata-Contreras, J.; Su, L.; Dubuc, D.; Grenier, K.; Martín, F. Modeling and Analysis of Pairs ofOpen Complementary Split Ring Resonators (OCSRRs) for Differential Permittivity Sensing. In Proceedingsof the 2017 IEEE MTT-S International Microwave Workshop Series Advanced Materials and Processes for RFand THz Applications (IMWS-AMP 2017), Pavia, Italy, 20–22 September 2017.
25. Vélez, P.; Grenier, K.; Mata-Contreras, J.; Dubuc, D.; Martín, F. Highly-sensitive microwave sensors based onopen complementary split ring resonators (OCSRRs) for dielectric characterization and solute concentrationmeasurements in liquids. IEEE Access 2018, 6, 48324–48338. [CrossRef]
26. Vélez, P.; Muñoz-Enano, J.; Grenier, K.; Mata-Contreras, J.; Dubuc, D.; Martín, F. Split ring resonator (SRR)based microwave fluidic sensor for electrolyte concentration measurements. IEEE Sens. J. 2019, 19, 2562–2569.[CrossRef]
27. Puentes, M. Planar Metamaterial Based Microwave Sensor Arrays for Biomedical Analysis and Treatment; Springer:Heidelberg, Germany, 2014.
28. Ebrahimi, A.; Withayachumnankul, W.; Al-Sarawi, S.; Abbott, D. High-sensitivity metamaterial-inspiredsensor for microfluidic dielectric characterization. IEEE Sens. J. 2014, 14, 1345–1351. [CrossRef]
29. Schueler, M.; Mandel, C.; Puentes, M.; Jakoby, R. Metamaterial inspired microwave sensors. IEEE Microw.Mag. 2012, 13, 57–68. [CrossRef]
30. Boybay, M.S.; Ramahi, O.M. Material characterization using complementary split-ring resonators. IEEE Trans.Instrum. Meas. 2012, 61, 3039–3046. [CrossRef]
31. Lee, C.S.; Yang, C.L. Complementary split-ring resonators for measuring dielectric constants and losstangents. IEEE Microw. Wirel. Compon. Lett. 2014, 24, 563–565. [CrossRef]
32. Yang, C.L.; Lee, C.S.; Chen, K.W.; Chen, K.Z. Noncontact measurement of complex permittivity and thicknessby using planar resonators. IEEE Trans. Microw. Theory Tech. 2016, 64, 247–257. [CrossRef]
33. Withayachumnankul, W.; Jaruwongrungsee, K.; Tuantranont, A.; Fumeaux, C.; Abbott, D. Metamaterial-basedmicrofluidic sensor for dielectric characterization. Sens. Actuators A Phys. 2013, 189, 233–237. [CrossRef]
34. Salim, A.; Lim, S. Complementary split-ring resonator-loaded microfluidic ethanol chemical sensor. Sensors2016, 16, 1802. [CrossRef]
35. Su, L.; Mata-Contreras, J.; Vélez, P.; Fernández-Prieto, A.; Martín, F. Analytical method to estimate thecomplex permittivity of oil samples. Sensors 2018, 18, 984. [CrossRef] [PubMed]
36. Muñoz-Enano, J.; Vélez, P.; Mata-Contreras, J.; Gil, M.; Dubuc, D.; Grenier, K.; Martín, F. Microwavesensors/comparators with optimized sensitivity based on microstrip lines loaded with open split ringresonators (OSRRs). In Proceedings of the 49th European Microwave Conference, Paris, France,1–3 October 2019.
37. Vélez, P.; Muñoz-Enano, J.; Martín, F. Electrolyte concentration measurements in DI water with 0. In 125g/Lresolution by means of CSRR-based structures. In Proceedings of the 49th European Microwave Conference,Paris, France, 1–3 October 2019.
38. Martín, F.; Zhu, L.; Hong, J.; Medina, F. Balanced Microwave Filters; Wiley/IEEE-Press: Hoboken, NJ, USA, 2018.39. Weiner, O. Die theorie des Mischkorpers für das Feld des statonare Stromung i. die mittelwertsatze für kraft
polarisation und energie. Der Abhandlungen der Mathematisch-Physischen Klasse der Konigl. Sachs. Ges.Wiss. 1912, 32, 509–604. (In German)
40. Babajanyan, A.; Kim, J.; Kim, S.; Lee, K.; Friedman, B. Sodium chloride sensing by using a near-fieldmicrowave microprobe. Appl. Phys. Lett. 2006, 89, 183504. [CrossRef]
Sensors 2019, 19, 3189 18 of 18
41. Soffiatti, A.; Max, Y.; Silva, S.G.; de Mendonça, L.M. Microwave metamaterial-based sensor for dielectriccharacterization of liquids. Sensors 2018, 18, 1513. [CrossRef] [PubMed]
42. Frau, I.; Wylie, S.; Byrne, P.A.; Cullen, J.; Korostynska, O.; Mason, A. New sensing system based onelectromagnetic waves and functionalised EM sensors for continuous monitoring of Zn in freshwater.In Proceedings of the 11th ICARD-IMWA-MWD Conference—Risk to Opportunity, Pretoria, South Africa,10–14 September 2018.
43. Ilaria, F.; Korostynska, O.; Byrne, P.; Mason, A. Feasibility of in-situ quality assessment of zinc contaminationin water. In Proceedings of the 2017 IEEE First Ukraine Conference on Electrical and Computer Engineering(UKRCON), Kiev, Ukraine, 29 May–2 June 2017.
44. Babajanyan, A.; Melikyan, H.; Kim, S.; Kim, J.; Lee, K.; Friedman, B. Real-time noninvasive measurement ofglucose concentration using microwave biosensors. J. Sens. 2010, 2010. [CrossRef]
45. Kim, S.; Melikyan, H.; Kim, J.; Babajanyan, A.; Lee, J.H.; Enkhtur, L.; Friedman, B.; Lee, K. Noninvasivein vitro measurement of pig blood D-glucose by using a microwave cavity sensor. Diabetes Res. Clin. Pract.2012, 96, 379–384. [CrossRef] [PubMed]
46. Sharafadinzadeh, N.; Abdolrazzaghi1, M.; Daneshmand, M. Highly sensitive microwave split ring resonatorsensor using gap extension for glucose sensing. In Proceedings of the 2017 IEEE MTT-S InternationalMicrowave Workshop Series on Advanced Materials and Processes (IMWSAMP 2017), Pavia, Italy,20–22 September 2017.
47. Kim, J.; Babajanyan, A.; Hovsepyan, A.; Lee, K.; Friedman, B. Microwave dielectric resonator biosensor foraqueous glucose solution. Rev. Sci. Instrum. 2008, 79. [CrossRef] [PubMed]
48. Chretiennot, T.; Dubuc, D.; Grenier, K. A microwave and microfluidic planar resonator for efficient andaccurate complex permittivity characterization of aqueous solution. IEEE Trans. Microw. Theory Tech. 2013,61, 972–978. [CrossRef]
49. Abdolrazzaghi, M.; Daneshmand, M.; Iyer, A.K. Strongly enhanced sensitivity in planar microwave sensorsbased on metamaterial coupling. IEEE Trans. Microw. Theory Tech. 2018, 66, 1843–1855. [CrossRef]
50. Wiltshire, B.D.; Zarifi, M.H. 3-D Printing Microfluidic Channels with Embedded Planar Microwave Resonatorsfor RFID and Liquid Detection. IEEE Microw. Wirel. Compon. Lett. 2019, 29, 65–67. [CrossRef]
51. Abdolrazzaghi, M.; Zarifi, M.H.; Daneshmand, M. Sensitivity enhancement of split ring resonator basedliquid sensors. In Proceedings of the 2016 IEEE Sensors, Orlando, FL, USA, 30 October–3 November 2016;pp. 1–3.
52. Zhang, X.; Ruan, C.; Chen, K. High-Sensitivity Microwave Sensor for Liquid Characterization Usinga Complementary Circular Spiral Resonator. Sensors 2019, 19, 787. [CrossRef] [PubMed]
53. Ruan, C.; Zhang, X.; Ullah, S. Complementary Metamaterial Sensor for Nondestructive Evaluation ofDielectric Substrates. Sensors 2019, 19, 2100.
54. Liang, Y.; Ma, M.; Zhang, F.; Liu, F.; Liu, Z.; Wang, D.; Li, Y. An LC Wireless Microfluidic Sensor Based onLow Temperature Co-Fired Ceramic (LTCC) Technology. Sensors 2019, 19, 1189. [CrossRef] [PubMed]
55. Kilpijärvi, J.; Halonen, N.; Juuti, J.; Hannu, J. Microfluidic Microwave Sensor for Detecting Saline in BiologicalRange. Sensors 2019, 19, 819.
© 2019 by the authors. Licensee MDPI, Basel, Switzerland. This article is an open accessarticle distributed under the terms and conditions of the Creative Commons Attribution(CC BY) license (http://creativecommons.org/licenses/by/4.0/).


![General Disclaimer One or more of the Following Statements ... · Dumbbell-shaped specimens are often used for tensile properties of polymers and multidirectional composites [2],](https://img.pdfslide.net/doc/110x75/5f05029c7e708231d410cffe/general-disclaimer-one-or-more-of-the-following-statements-dumbbell-shaped-specimens.jpg)