Embed Size (px)
Citation preview
Durability Properties and Microstructure of Ground Granulated BlastFurnace Slag Cement Concrete
Bahador Sabet Divsholi*, Tze Yang Darren Lim, and Susanto Teng
(Received April 29, 2013, Accepted December 4, 2013)
Abstract: Ground granulated blast-furnace slag (GGBS) is a green construction material used to produce durable concrete. The
secondary pozzolanic reactions can result in reduced pore connectivity; therefore, replacing partial amount of Portland cement
(PC) with GGBS can significantly reduce the risk of sulfate attack, alkali–silica reactions and chloride penetration. However, it
may also reduce the concrete resistance against carbonation. Due to the time consuming process of concrete carbonation, many
researchers have used accelerated carbonation test to shorten the experimental time. However, there are always some uncertainties
in the accelerated carbonation test results. Most importantly, the moisture content and moisture profile of the concrete before the
carbonation test can significantly affect the test results. In this work, more than 200 samples with various water–cementitious
material ratios and various replacement percentages of GGBS were cast. The compressive strength, electrical resistivity, chloride
permeability and carbonation tests were conducted. The moisture loss and microstructure of concrete were studied. The partial
replacement of PC with GGBS produced considerable improvement on various properties of concrete.
Keywords: blended cement, durability, GGBS, chloride penetration, concrete, carbonation, durability.
1. Introduction
Manufacturing Portland cement (PC) is a major contrib-utor of greenhouse gases, responsible for about 5 % of allglobal carbon dioxide emissions (Habert and Roussel 2009).In comparison, the production of ground granulated blast-furnace slag (GGBS) requires less than a fifth of the energyand produces less than a tenth of the carbon dioxide emis-sions. It is well known that blast furnace slag cement (BFSC)has been manufactured by integrating GGBS with cementclinker or by separate grinding (Wang et al. 2005). For along period of time, the application of GGBS was limited tothe production of BFSC. Due to its less grindability, thesurface area of the produced BFSC was even lower than thatof commercial PC and its reactivity was limited. Withadvancement in technology, finer GGBS (particle size lessthan 10 lm) with increased reactivity was produced. Thesecondary pozzolanic reactions can result in reduced poreconnectivity in the concrete. Therefore, partial replacementof PC with GGBS can significantly reduce the risk of sulfateattack, alkali–silica reactions and chloride penetration andincrease compressive strength (Guneyisi and Gesoglu 2008;Hadj-Sadok et al. 2010; Nazari and Riahi 2011; Shi et al.
2011, 2012; Teng et al. 2013). However, it may reduce theresistance of the concrete against carbonation (Harrison et al.2012; Shi et al. 2009; Jia et al. 2011).Concrete carbonation is one of the most important phe-
nomena affecting the durability of concrete. Concrete car-bonation has been studied extensively over the last fewdecades. However, due to the time consuming process ofcarbonation, many researchers have used accelerated car-bonation test to shorten the experimental time. Consideringthe complex process of carbonation and the number ofparameters involved, there are always some uncertainties inthe accelerated carbonation test results. Most importantly,the moisture content and moisture profile of the concretebefore the carbonation test can significantly affect the testresults. The CO2 from the environment will dissolve in thepore solution through the partially filled pore system andwill react with the cement hydration products. If the concreteis fully saturated, carbonation will be slow (Lagerblad 2005).Based on the quality of concrete and the environmentalconditions, concrete will achieve equilibrium moisture pro-file status after several months (Sabet and Jong 2006). Toshorten this time, various preconditioning techniques wereemployed before the carbonation test. Oven drying is one ofthe most popular methods. However, the high temperaturedrying can damage the pore structure of concrete (Galle2001). Partial replacement of PC with supplementarycementitious materials (SCM) is known to reduce theresistance against carbonation due to consumption of cal-cium hydroxide during pozzolanic reactions. On the otherhand, the finer pore structure and lower permeability due toSCM replacement results in higher degree of internal
School of Civil and Environmental Engineering, Nanyang
Technological University, Singapore 639798, Singapore.
*Corresponding Author; E-mail: [email protected]
Copyright � The Author(s) 2014. This article is published
with open access at Springerlink.com
International Journal of Concrete Structures and MaterialsVol.8, No.2, pp.157–164, June 2014DOI 10.1007/s40069-013-0063-yISSN 1976-0485 / eISSN 2234-1315
157
saturation which may slow down the carbonation rate. Thisimprovement may diminish as a result of artificial precon-ditioning which could damage the pore structure and lowerthe degree of internal saturation below the natural equilib-rium for blended cement concrete. Therefore, the increasedcarbonation rate measured in accelerated carbonation testmay not be the correct natural carbonation rate of blendedcement concrete. Jia et al. (2011) also suggested that theaccelerated carbonation method sometimes may ‘enlarge’the influence of the mineral admixture content and changethe dynamics of concrete in carbonation.In this work, more than 200 samples with various water–
cementitious material ratios (0.4, 0.5 and 0.6) and variousreplacement percentages of GGBS were cast. The com-pressive strength, electrical resistivity, chloride permeabilityand carbonation tests were conducted during 4 years ofexperimental study. The moisture loss was recorded bygravimetric technique and the microstructure of the concretewas investigated using the mercury intrusion porosimetry(MIP). The results showed that partial replacement of PCwith GGBS contributed considerable improvement on vari-ous properties of concrete.
2. Experimental Work
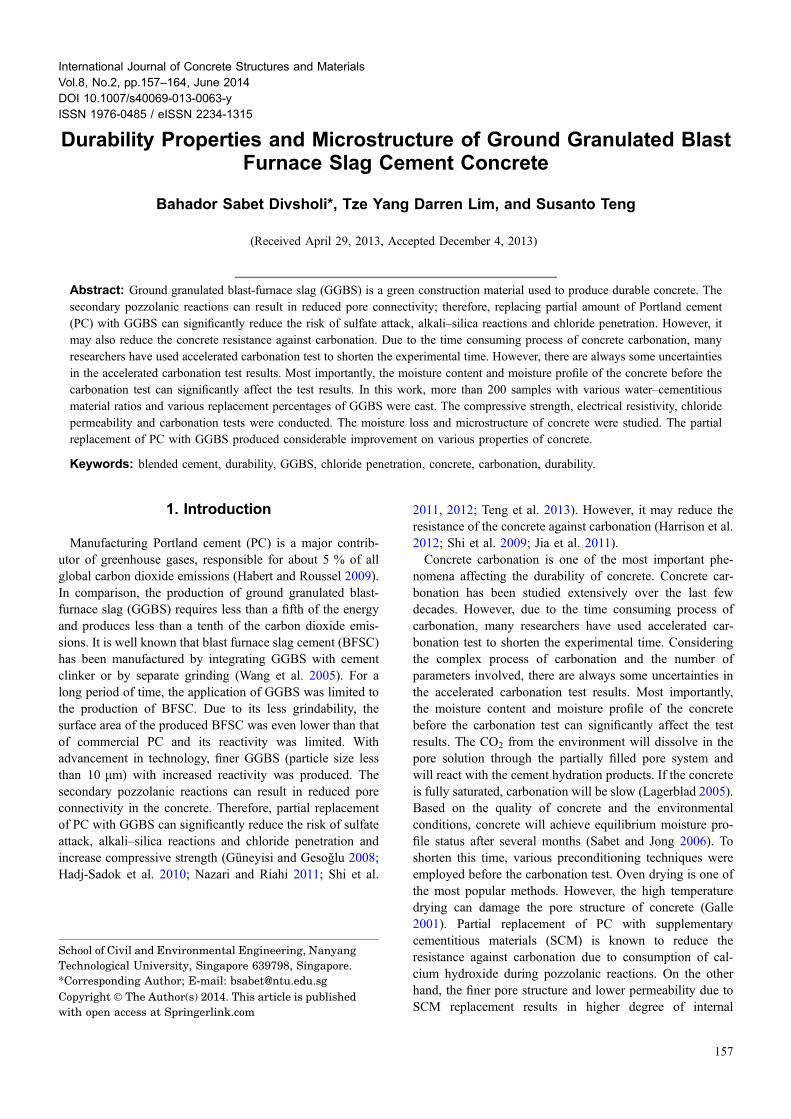
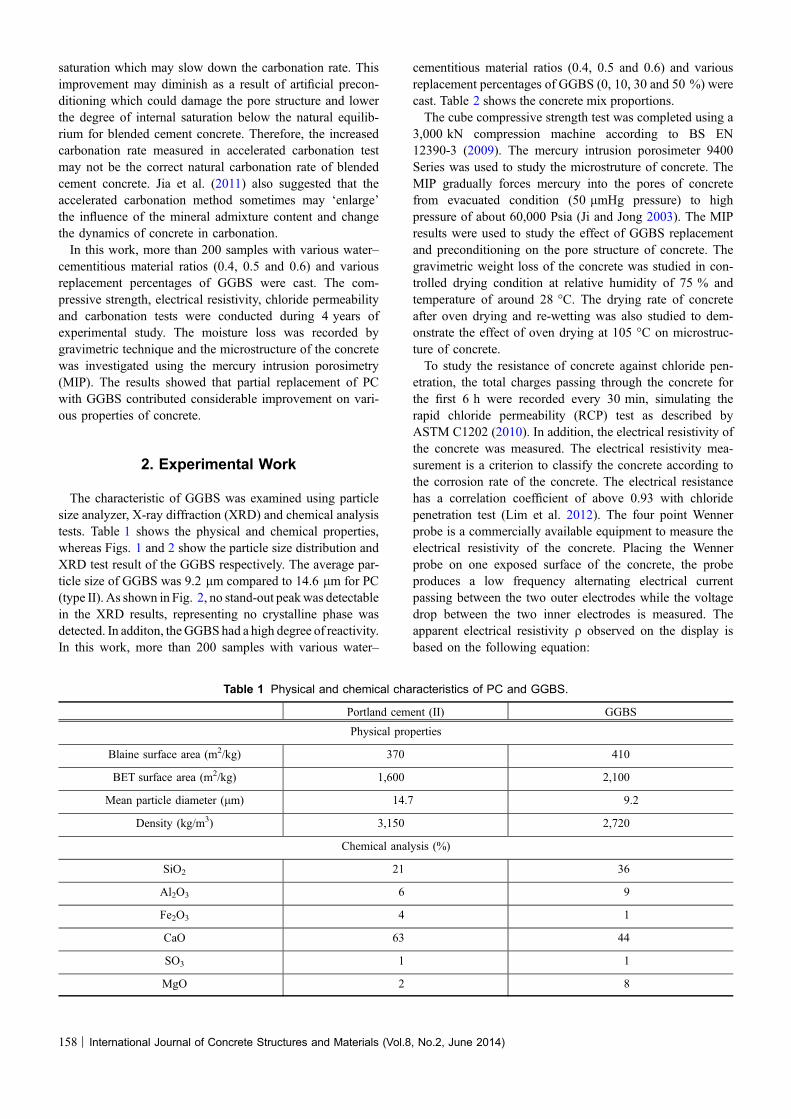
The characteristic of GGBS was examined using particlesize analyzer, X-ray diffraction (XRD) and chemical analysistests. Table 1 shows the physical and chemical properties,whereas Figs. 1 and 2 show the particle size distribution andXRD test result of the GGBS respectively. The average par-ticle size of GGBS was 9.2 lm compared to 14.6 lm for PC(type II). As shown in Fig. 2, no stand-out peakwas detectablein the XRD results, representing no crystalline phase wasdetected. In additon, theGGBShad a high degree of reactivity.In this work, more than 200 samples with various water–
cementitious material ratios (0.4, 0.5 and 0.6) and variousreplacement percentages of GGBS (0, 10, 30 and 50 %) werecast. Table 2 shows the concrete mix proportions.The cube compressive strength test was completed using a
3,000 kN compression machine according to BS EN12390-3 (2009). The mercury intrusion porosimeter 9400Series was used to study the microstruture of concrete. TheMIP gradually forces mercury into the pores of concretefrom evacuated condition (50 lmHg pressure) to highpressure of about 60,000 Psia (Ji and Jong 2003). The MIPresults were used to study the effect of GGBS replacementand preconditioning on the pore structure of concrete. Thegravimetric weight loss of the concrete was studied in con-trolled drying condition at relative humidity of 75 % andtemperature of around 28 �C. The drying rate of concreteafter oven drying and re-wetting was also studied to dem-onstrate the effect of oven drying at 105 �C on microstruc-ture of concrete.To study the resistance of concrete against chloride pen-
etration, the total charges passing through the concrete forthe first 6 h were recorded every 30 min, simulating therapid chloride permeability (RCP) test as described byASTM C1202 (2010). In addition, the electrical resistivity ofthe concrete was measured. The electrical resistivity mea-surement is a criterion to classify the concrete according tothe corrosion rate of the concrete. The electrical resistancehas a correlation coefficient of above 0.93 with chloridepenetration test (Lim et al. 2012). The four point Wennerprobe is a commercially available equipment to measure theelectrical resistivity of the concrete. Placing the Wennerprobe on one exposed surface of the concrete, the probeproduces a low frequency alternating electrical currentpassing between the two outer electrodes while the voltagedrop between the two inner electrodes is measured. Theapparent electrical resistivity q observed on the display isbased on the following equation:
Table 1 Physical and chemical characteristics of PC and GGBS.
Portland cement (II) GGBS
Physical properties
Blaine surface area (m2/kg) 370 410
BET surface area (m2/kg) 1,600 2,100
Mean particle diameter (lm) 14.7 9.2
Density (kg/m3) 3,150 2,720
Chemical analysis (%)
SiO2 21 36
Al2O3 6 9
Fe2O3 4 1
CaO 63 44
SO3 1 1
MgO 2 8
158 | International Journal of Concrete Structures and Materials (Vol.8, No.2, June 2014)
q ¼ 2paV=I ð1Þ
where a is the spacing between the electrodes, V is thevoltage drop, and I is the current passing through the twoouter electrodes. This equation is valid for a homogenous
semi finite volume of the material (Gjørv 2009). Both RCPand electrical resistivity tests are very sensitive to moisturecontent, therefore the samples were fully saturated beforetesting (Polder 2001). Finally, natural carbonation test wascarried out in the span of 4 years to study the natural car-bonation rate of GGBS-blended concrete. The carbonbationdepth was measured with spraying phenolphetalein indicatorto freshly cutted concrete surface.
3. Results and Discussions
Increased slump and fluidity was measured with theincrease in GGBS replacement percentage. For water–cementitious material ratio (w/c) = 0.5 and aggregate/cementitious material ratio (a/c) = 3, the slump wasincreased by 20, 35 and 55 % for 10, 30 and 50 % GGBSreplacement, respectively. Similar improvement was repor-ted elsewhere (Gao et al. 2005) for the partial replacement ofPC with GGBS.
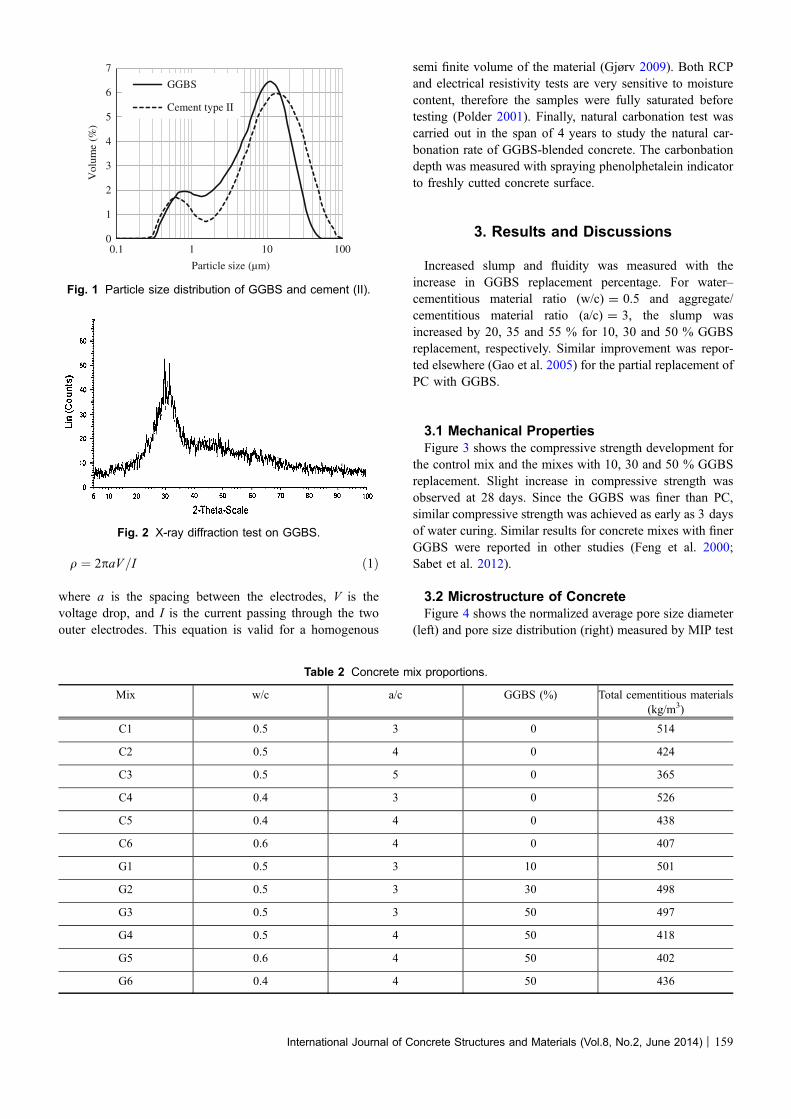
3.1 Mechanical PropertiesFigure 3 shows the compressive strength development for
the control mix and the mixes with 10, 30 and 50 % GGBSreplacement. Slight increase in compressive strength wasobserved at 28 days. Since the GGBS was finer than PC,similar compressive strength was achieved as early as 3 daysof water curing. Similar results for concrete mixes with finerGGBS were reported in other studies (Feng et al. 2000;Sabet et al. 2012).
3.2 Microstructure of ConcreteFigure 4 shows the normalized average pore size diameter
(left) and pore size distribution (right) measured by MIP test
0
1
2
3
4
5
6
7
0.1 1 10 100
Vol
ume
(%)
Particle size (µm)
GGBS
Cement type II
Fig. 1 Particle size distribution of GGBS and cement (II).
Fig. 2 X-ray diffraction test on GGBS.
Table 2 Concrete mix proportions.
Mix w/c a/c GGBS (%) Total cementitious materials(kg/m3)
C1 0.5 3 0 514
C2 0.5 4 0 424
C3 0.5 5 0 365
C4 0.4 3 0 526
C5 0.4 4 0 438
C6 0.6 4 0 407
G1 0.5 3 10 501
G2 0.5 3 30 498
G3 0.5 3 50 497
G4 0.5 4 50 418
G5 0.6 4 50 402
G6 0.4 4 50 436
International Journal of Concrete Structures and Materials (Vol.8, No.2, June 2014) | 159
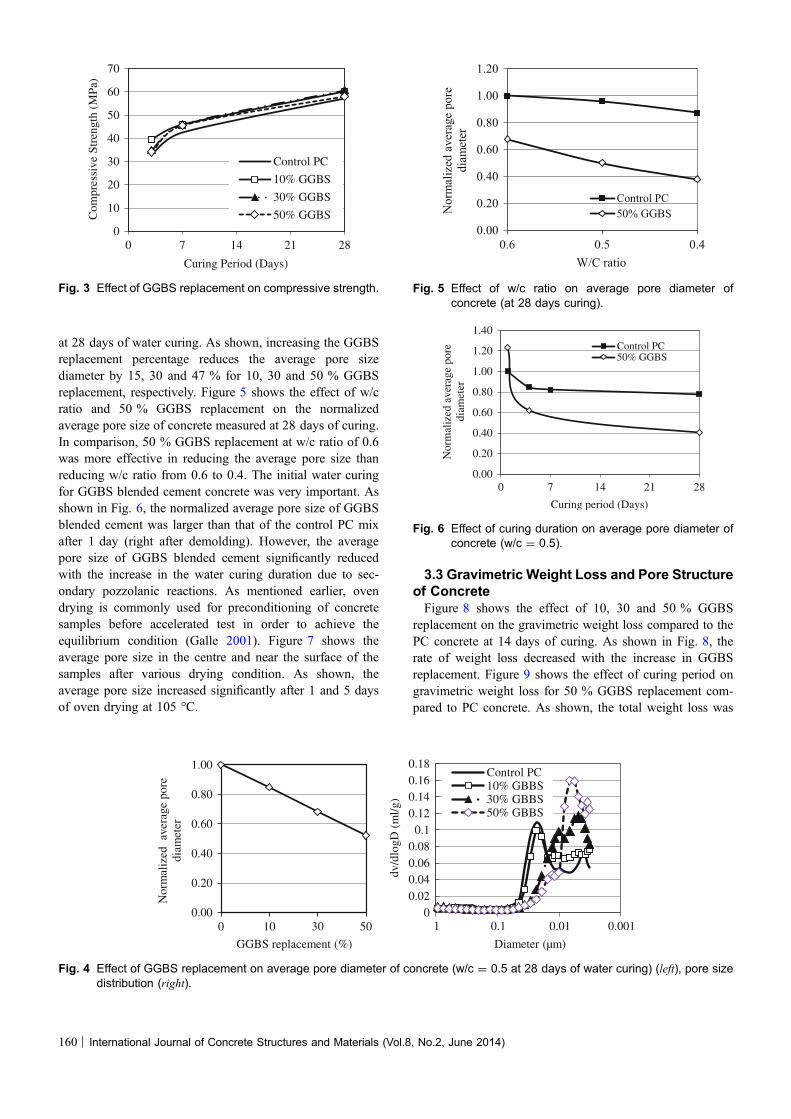
at 28 days of water curing. As shown, increasing the GGBSreplacement percentage reduces the average pore sizediameter by 15, 30 and 47 % for 10, 30 and 50 % GGBSreplacement, respectively. Figure 5 shows the effect of w/cratio and 50 % GGBS replacement on the normalizedaverage pore size of concrete measured at 28 days of curing.In comparison, 50 % GGBS replacement at w/c ratio of 0.6was more effective in reducing the average pore size thanreducing w/c ratio from 0.6 to 0.4. The initial water curingfor GGBS blended cement concrete was very important. Asshown in Fig. 6, the normalized average pore size of GGBSblended cement was larger than that of the control PC mixafter 1 day (right after demolding). However, the averagepore size of GGBS blended cement significantly reducedwith the increase in the water curing duration due to sec-ondary pozzolanic reactions. As mentioned earlier, ovendrying is commonly used for preconditioning of concretesamples before accelerated test in order to achieve theequilibrium condition (Galle 2001). Figure 7 shows theaverage pore size in the centre and near the surface of thesamples after various drying condition. As shown, theaverage pore size increased significantly after 1 and 5 daysof oven drying at 105 �C.
3.3 Gravimetric Weight Loss and Pore Structureof ConcreteFigure 8 shows the effect of 10, 30 and 50 % GGBS
replacement on the gravimetric weight loss compared to thePC concrete at 14 days of curing. As shown in Fig. 8, therate of weight loss decreased with the increase in GGBSreplacement. Figure 9 shows the effect of curing period ongravimetric weight loss for 50 % GGBS replacement com-pared to PC concrete. As shown, the total weight loss was
0
10
20
30
40
50
60
70
0 7 14 21 28
Control PC
10% GGBS
30% GGBS
50% GGBS
Curing Period (Days)
Com
pres
sive
Stre
ngth
(M
Pa)
Fig. 3 Effect of GGBS replacement on compressive strength.
0.00
0.20
0.40
0.60
0.80
1.00
0 10 30 50
Nor
mal
ized
ave
rage
por
e di
amet
er
GGBS replacement (%)
00.020.040.060.08
0.10.120.140.160.18
0.0010.010.11
Control PC10% GBBS30% GBBS50% GBBS
dv/d
logD
(m
l/g)
Diameter (µm)
Fig. 4 Effect of GGBS replacement on average pore diameter of concrete (w/c = 0.5 at 28 days of water curing) (left), pore sizedistribution (right).
0.00
0.20
0.40
0.60
0.80
1.00
1.20
0.40.50.6
Nor
mal
ized
ave
rage
por
e di
amet
er
W/C ratio
Control PC50% GGBS
Fig. 5 Effect of w/c ratio on average pore diameter ofconcrete (at 28 days curing).
0.00
0.20
0.40
0.60
0.80
1.00
1.20
1.40
0 7 14 21 28
Nor
mal
ized
ave
rage
por
e di
amet
er
Curing period (Days)
Control PC50% GGBS
Fig. 6 Effect of curing duration on average pore diameter ofconcrete (w/c = 0.5).
160 | International Journal of Concrete Structures and Materials (Vol.8, No.2, June 2014)
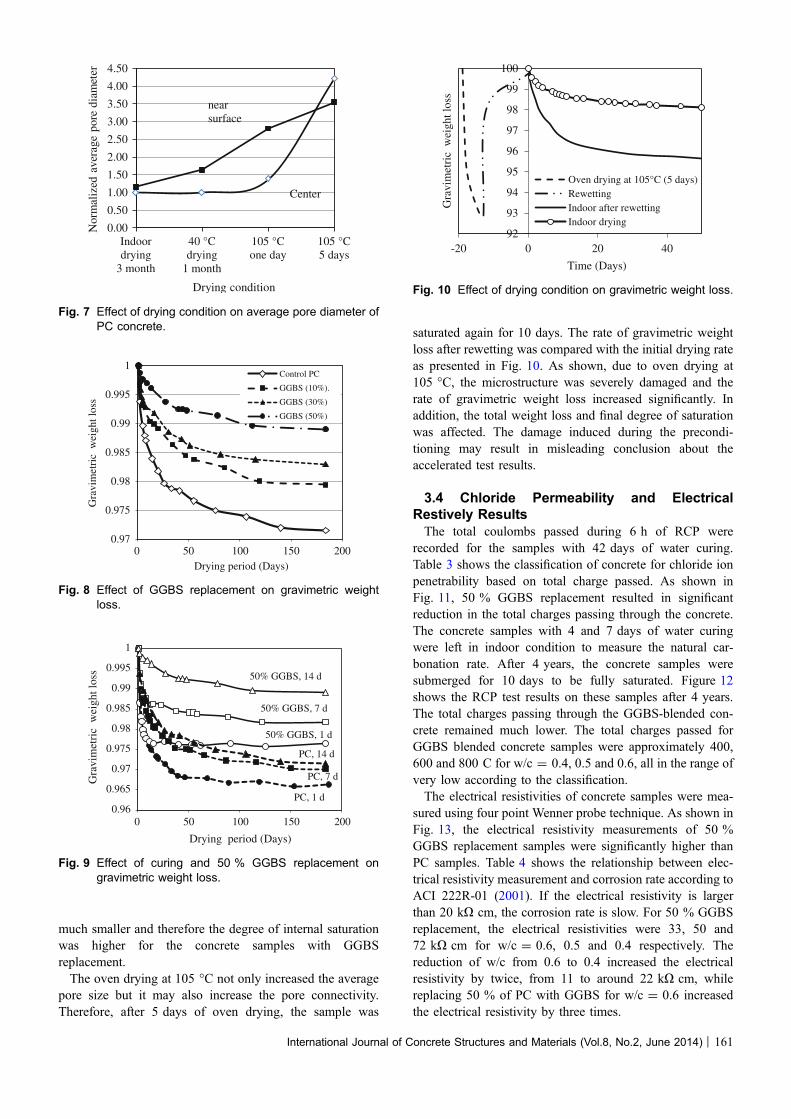
much smaller and therefore the degree of internal saturationwas higher for the concrete samples with GGBSreplacement.The oven drying at 105 �C not only increased the average
pore size but it may also increase the pore connectivity.Therefore, after 5 days of oven drying, the sample was
saturated again for 10 days. The rate of gravimetric weightloss after rewetting was compared with the initial drying rateas presented in Fig. 10. As shown, due to oven drying at105 �C, the microstructure was severely damaged and therate of gravimetric weight loss increased significantly. Inaddition, the total weight loss and final degree of saturationwas affected. The damage induced during the precondi-tioning may result in misleading conclusion about theaccelerated test results.
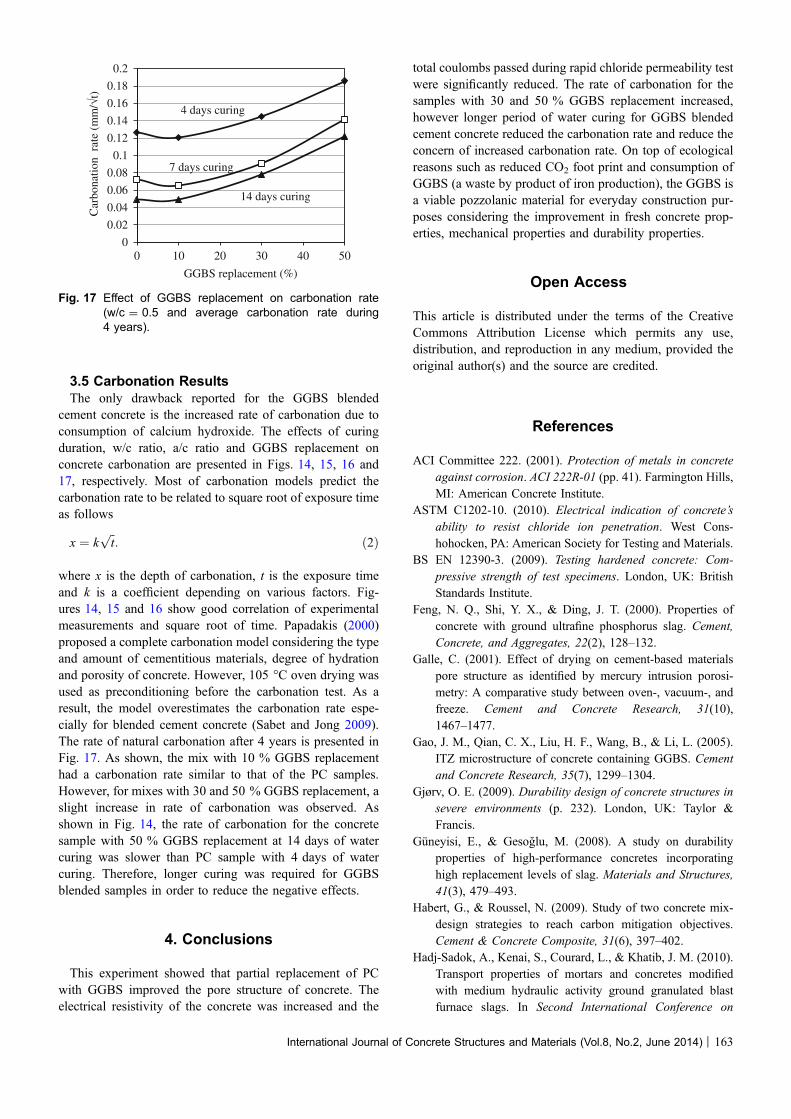
3.4 Chloride Permeability and ElectricalRestively ResultsThe total coulombs passed during 6 h of RCP were
recorded for the samples with 42 days of water curing.Table 3 shows the classification of concrete for chloride ionpenetrability based on total charge passed. As shown inFig. 11, 50 % GGBS replacement resulted in significantreduction in the total charges passing through the concrete.The concrete samples with 4 and 7 days of water curingwere left in indoor condition to measure the natural car-bonation rate. After 4 years, the concrete samples weresubmerged for 10 days to be fully saturated. Figure 12shows the RCP test results on these samples after 4 years.The total charges passing through the GGBS-blended con-crete remained much lower. The total charges passed forGGBS blended concrete samples were approximately 400,600 and 800 C for w/c = 0.4, 0.5 and 0.6, all in the range ofvery low according to the classification.The electrical resistivities of concrete samples were mea-
sured using four point Wenner probe technique. As shown inFig. 13, the electrical resistivity measurements of 50 %GGBS replacement samples were significantly higher thanPC samples. Table 4 shows the relationship between elec-trical resistivity measurement and corrosion rate according toACI 222R-01 (2001). If the electrical resistivity is largerthan 20 kX cm, the corrosion rate is slow. For 50 % GGBSreplacement, the electrical resistivities were 33, 50 and72 kX cm for w/c = 0.6, 0.5 and 0.4 respectively. Thereduction of w/c from 0.6 to 0.4 increased the electricalresistivity by twice, from 11 to around 22 kX cm, whilereplacing 50 % of PC with GGBS for w/c = 0.6 increasedthe electrical resistivity by three times.
0.00
0.50
1.00
1.50
2.00
2.50
3.00
3.50
4.00
4.50
Indoordrying
3 month
40 °Cdrying
1 month
105 °Cone day
105 °C5 days
Nor
mal
ized
ave
rage
por
e di
amet
er
Drying condition
Center
near surface
Fig. 7 Effect of drying condition on average pore diameter ofPC concrete.
0.97
0.975
0.98
0.985
0.99
0.995
1
0 50 100 150 200
Control PC
GGBS (10%).
GGBS (30%)
GGBS (50%)
Drying period (Days)
Gra
vim
etri
c w
eigh
t los
s
Fig. 8 Effect of GGBS replacement on gravimetric weightloss.
0.96
0.965
0.97
0.975
0.98
0.985
0.99
0.995
1
0 50 100 150 200
Drying period (Days)
50% GGBS, 14 d
50% GGBS, 7 d
50% GGBS, 1 d
PC, 14 d
PC, 7 d
PC, 1 d
Gra
vim
etri
c w
eigh
t los
s
Fig. 9 Effect of curing and 50 % GGBS replacement ongravimetric weight loss.
92
93
94
95
96
97
98
99
100
-20 0 20 40
Gra
vim
etri
c w
eigh
t los
s
Time (Days)
Oven drying at 105°C (5 days)RewettingIndoor after rewettingIndoor drying
Fig. 10 Effect of drying condition on gravimetric weight loss.
International Journal of Concrete Structures and Materials (Vol.8, No.2, June 2014) | 161
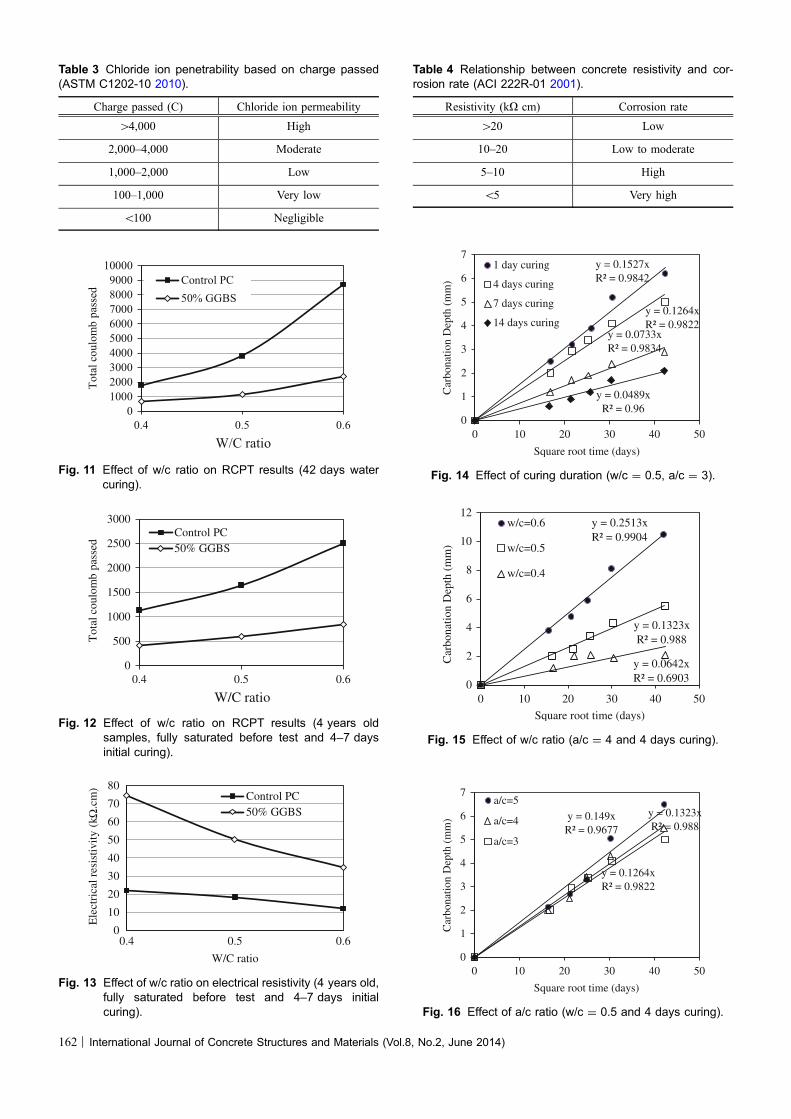
Table 3 Chloride ion penetrability based on charge passed(ASTM C1202-10 2010).
Charge passed (C) Chloride ion permeability
[4,000 High
2,000–4,000 Moderate
1,000–2,000 Low
100–1,000 Very low
\100 Negligible
0100020003000400050006000700080009000
10000
0.4 0.5 0.6
Control PC50% GGBS
Tota
lcou
lom
b pa
ssed
W/C ratio
Fig. 11 Effect of w/c ratio on RCPT results (42 days watercuring).
0
500
1000
1500
2000
2500
3000
0.4 0.5 0.6
Control PC50% GGBS
Tot
alco
ulom
b pa
ssed
W/C ratio
Fig. 12 Effect of w/c ratio on RCPT results (4 years oldsamples, fully saturated before test and 4–7 daysinitial curing).
0
10
20
30
40
50
60
70
80
0.4 0.5 0.6
Control PC50% GGBS
W/C ratio
Ele
ctri
cal r
esis
tivit
y (k
.cm
)Ω
Fig. 13 Effect of w/c ratio on electrical resistivity (4 years old,fully saturated before test and 4–7 days initialcuring).
Table 4 Relationship between concrete resistivity and cor-rosion rate (ACI 222R-01 2001).
Resistivity (kX cm) Corrosion rate
[20 Low
10–20 Low to moderate
5–10 High
\5 Very high
y = 0.1527xR² = 0.9842
y = 0.1264xR² = 0.9822
y = 0.0733xR² = 0.9834
y = 0.0489xR² = 0.96
0
1
2
3
4
5
6
7
0 10 20 30 40 50
1 day curing
4 days curing
7 days curing
14 days curing
Square root time (days)C
arbo
natio
nD
epth
(m
m)
Fig. 14 Effect of curing duration (w/c = 0.5, a/c = 3).
y = 0.2513xR² = 0.9904
y = 0.1323xR² = 0.988
y = 0.0642xR² = 0.6903
0
2
4
6
8
10
12
0 10 20 30 40 50
w/c=0.6
w/c=0.5
w/c=0.4
Square root time (days)
Car
bona
tion
Dep
th (
mm
)
Fig. 15 Effect of w/c ratio (a/c = 4 and 4 days curing).
y = 0.149xR² = 0.9677
y = 0.1323xR² = 0.988
y = 0.1264xR² = 0.9822
0
1
2
3
4
5
6
7
0 10 20 30 40 50
a/c=5
a/c=4
a/c=3
Square root time (days)
Car
bona
tion
Dep
th (
mm
)
Fig. 16 Effect of a/c ratio (w/c = 0.5 and 4 days curing).
162 | International Journal of Concrete Structures and Materials (Vol.8, No.2, June 2014)
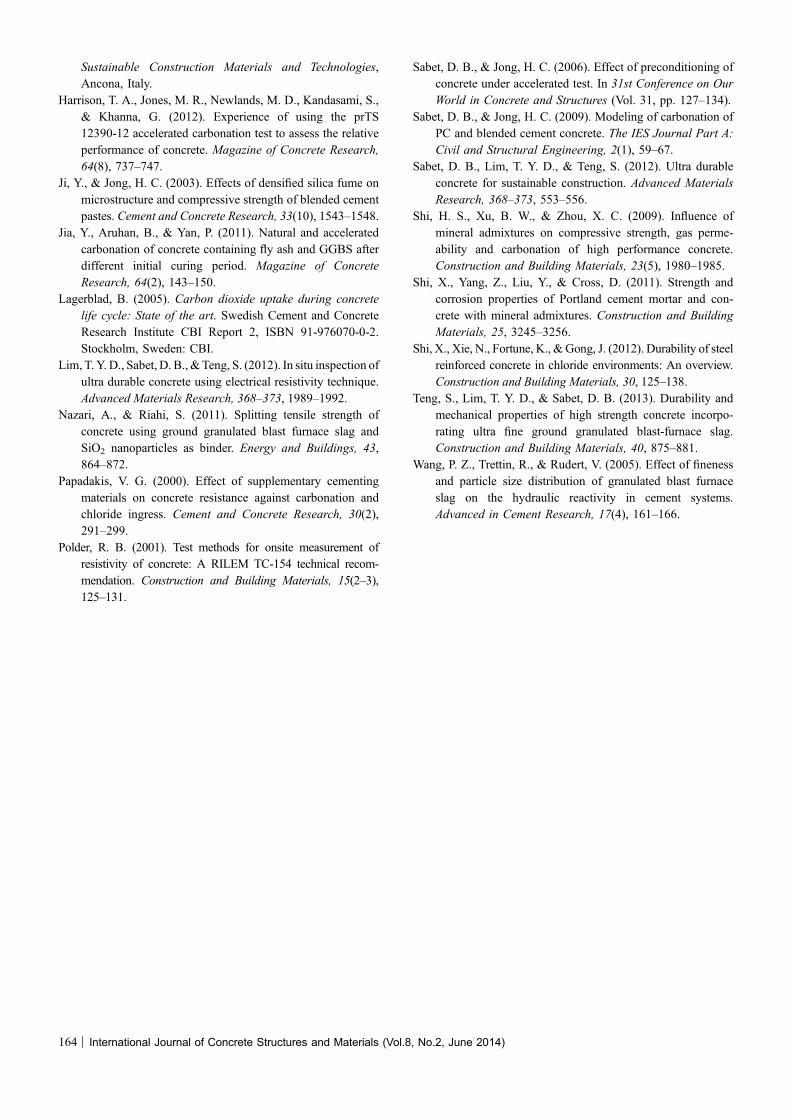
3.5 Carbonation ResultsThe only drawback reported for the GGBS blended
cement concrete is the increased rate of carbonation due toconsumption of calcium hydroxide. The effects of curingduration, w/c ratio, a/c ratio and GGBS replacement onconcrete carbonation are presented in Figs. 14, 15, 16 and17, respectively. Most of carbonation models predict thecarbonation rate to be related to square root of exposure timeas follows
x ¼ kffiffi
tp: ð2Þ
where x is the depth of carbonation, t is the exposure timeand k is a coefficient depending on various factors. Fig-ures 14, 15 and 16 show good correlation of experimentalmeasurements and square root of time. Papadakis (2000)proposed a complete carbonation model considering the typeand amount of cementitious materials, degree of hydrationand porosity of concrete. However, 105 �C oven drying wasused as preconditioning before the carbonation test. As aresult, the model overestimates the carbonation rate espe-cially for blended cement concrete (Sabet and Jong 2009).The rate of natural carbonation after 4 years is presented inFig. 17. As shown, the mix with 10 % GGBS replacementhad a carbonation rate similar to that of the PC samples.However, for mixes with 30 and 50 % GGBS replacement, aslight increase in rate of carbonation was observed. Asshown in Fig. 14, the rate of carbonation for the concretesample with 50 % GGBS replacement at 14 days of watercuring was slower than PC sample with 4 days of watercuring. Therefore, longer curing was required for GGBSblended samples in order to reduce the negative effects.
4. Conclusions
This experiment showed that partial replacement of PCwith GGBS improved the pore structure of concrete. Theelectrical resistivity of the concrete was increased and the
total coulombs passed during rapid chloride permeability testwere significantly reduced. The rate of carbonation for thesamples with 30 and 50 % GGBS replacement increased,however longer period of water curing for GGBS blendedcement concrete reduced the carbonation rate and reduce theconcern of increased carbonation rate. On top of ecologicalreasons such as reduced CO2 foot print and consumption ofGGBS (a waste by product of iron production), the GGBS isa viable pozzolanic material for everyday construction pur-poses considering the improvement in fresh concrete prop-erties, mechanical properties and durability properties.
Open Access
This article is distributed under the terms of the CreativeCommons Attribution License which permits any use,distribution, and reproduction in any medium, provided theoriginal author(s) and the source are credited.
References
ACI Committee 222. (2001). Protection of metals in concrete
against corrosion. ACI 222R-01 (pp. 41). Farmington Hills,
MI: American Concrete Institute.
ASTM C1202-10. (2010). Electrical indication of concrete’s
ability to resist chloride ion penetration. West Cons-
hohocken, PA: American Society for Testing and Materials.
BS EN 12390-3. (2009). Testing hardened concrete: Com-
pressive strength of test specimens. London, UK: British
Standards Institute.
Feng, N. Q., Shi, Y. X., & Ding, J. T. (2000). Properties of
concrete with ground ultrafine phosphorus slag. Cement,
Concrete, and Aggregates, 22(2), 128–132.
Galle, C. (2001). Effect of drying on cement-based materials
pore structure as identified by mercury intrusion porosi-
metry: A comparative study between oven-, vacuum-, and
freeze. Cement and Concrete Research, 31(10),
1467–1477.
Gao, J. M., Qian, C. X., Liu, H. F., Wang, B., & Li, L. (2005).
ITZ microstructure of concrete containing GGBS. Cement
and Concrete Research, 35(7), 1299–1304.
Gjørv, O. E. (2009). Durability design of concrete structures in
severe environments (p. 232). London, UK: Taylor &
Francis.
Guneyisi, E., & Gesoglu, M. (2008). A study on durability
properties of high-performance concretes incorporating
high replacement levels of slag. Materials and Structures,
41(3), 479–493.
Habert, G., & Roussel, N. (2009). Study of two concrete mix-
design strategies to reach carbon mitigation objectives.
Cement & Concrete Composite, 31(6), 397–402.
Hadj-Sadok, A., Kenai, S., Courard, L., & Khatib, J. M. (2010).
Transport properties of mortars and concretes modified
with medium hydraulic activity ground granulated blast
furnace slags. In Second International Conference on
0
0.02
0.04
0.06
0.08
0.1
0.12
0.14
0.16
0.18
0.2
0 10 20 30 40 50
GGBS replacement (%)
Car
bona
tion
rat
e (m
m/
t)
4 days curing
7 days curing
14 days curing
Fig. 17 Effect of GGBS replacement on carbonation rate(w/c = 0.5 and average carbonation rate during4 years).
International Journal of Concrete Structures and Materials (Vol.8, No.2, June 2014) | 163
Sustainable Construction Materials and Technologies,
Ancona, Italy.
Harrison, T. A., Jones, M. R., Newlands, M. D., Kandasami, S.,
& Khanna, G. (2012). Experience of using the prTS
12390-12 accelerated carbonation test to assess the relative
performance of concrete. Magazine of Concrete Research,
64(8), 737–747.
Ji, Y., & Jong, H. C. (2003). Effects of densified silica fume on
microstructure and compressive strength of blended cement
pastes. Cement and Concrete Research, 33(10), 1543–1548.
Jia, Y., Aruhan, B., & Yan, P. (2011). Natural and accelerated
carbonation of concrete containing fly ash and GGBS after
different initial curing period. Magazine of Concrete
Research, 64(2), 143–150.
Lagerblad, B. (2005). Carbon dioxide uptake during concrete
life cycle: State of the art. Swedish Cement and Concrete
Research Institute CBI Report 2, ISBN 91-976070-0-2.
Stockholm, Sweden: CBI.
Lim, T. Y.D., Sabet, D. B., &Teng, S. (2012). In situ inspection of
ultra durable concrete using electrical resistivity technique.
Advanced Materials Research, 368–373, 1989–1992.
Nazari, A., & Riahi, S. (2011). Splitting tensile strength of
concrete using ground granulated blast furnace slag and
SiO2 nanoparticles as binder. Energy and Buildings, 43,
864–872.
Papadakis, V. G. (2000). Effect of supplementary cementing
materials on concrete resistance against carbonation and
chloride ingress. Cement and Concrete Research, 30(2),
291–299.
Polder, R. B. (2001). Test methods for onsite measurement of
resistivity of concrete: A RILEM TC-154 technical recom-
mendation. Construction and Building Materials, 15(2–3),
125–131.
Sabet, D. B., & Jong, H. C. (2006). Effect of preconditioning of
concrete under accelerated test. In 31st Conference on Our
World in Concrete and Structures (Vol. 31, pp. 127–134).
Sabet, D. B., & Jong, H. C. (2009). Modeling of carbonation of
PC and blended cement concrete. The IES Journal Part A:
Civil and Structural Engineering, 2(1), 59–67.
Sabet, D. B., Lim, T. Y. D., & Teng, S. (2012). Ultra durable
concrete for sustainable construction. Advanced Materials
Research, 368–373, 553–556.
Shi, H. S., Xu, B. W., & Zhou, X. C. (2009). Influence of
mineral admixtures on compressive strength, gas perme-
ability and carbonation of high performance concrete.
Construction and Building Materials, 23(5), 1980–1985.
Shi, X., Yang, Z., Liu, Y., & Cross, D. (2011). Strength and
corrosion properties of Portland cement mortar and con-
crete with mineral admixtures. Construction and Building
Materials, 25, 3245–3256.
Shi, X., Xie, N., Fortune, K., &Gong, J. (2012). Durability of steel
reinforced concrete in chloride environments: An overview.
Construction and Building Materials, 30, 125–138.
Teng, S., Lim, T. Y. D., & Sabet, D. B. (2013). Durability and
mechanical properties of high strength concrete incorpo-
rating ultra fine ground granulated blast-furnace slag.
Construction and Building Materials, 40, 875–881.
Wang, P. Z., Trettin, R., & Rudert, V. (2005). Effect of fineness
and particle size distribution of granulated blast furnace
slag on the hydraulic reactivity in cement systems.
Advanced in Cement Research, 17(4), 161–166.
164 | International Journal of Concrete Structures and Materials (Vol.8, No.2, June 2014)