Embed Size (px)
Citation preview
F3-02-04a (Replaces R-02-04)
DURANGO PUMPING PLANT 1 :I2 SCALE PHYSICAL MODEL STUDY
December 2002 (Revisecl January 2003)
U.S. DEPARTMENT OF THE INTERIOR Bureau of Reclamation
Technicall Service Center Water Resources Services
Water Resources Research Laboratory Group

I Revised January 2003 I 4. TITLE AND SUBTITLE 15. FUNDING NUMBERS I
REPORT DOCUMENTATION PAGE I ~ o r m Approved OM8 NO. 0704-0188 Public reponing burden for this collection of information is estimated to average 1 hour Per response, including the tlme for reviewing instructions, search~ng existing data sources, gathering and maintaining the data needed. and completing and reviewing the collection of information. Send comments regarding thls burden estimate or any other aspect of thus collection of information, includ~ng suggestions for reducing this burden to Washington Headquaners Services. Directorate for lnformat~on Operations and Repons. 121 5 Jefferson Davis Highway, Suit 1204. Arlington VA 22202-4302, and to the Office of Management and Budget. Paperwork Reduction Report 10704-01881, Washington DC 20503.
Durango Pumping Plant 1 : 12 Scale Physical Model Study
1. AGENCY USE ONLY (Leave Blank)
6. AUTHORIS)
2. REPORT DATE 3. REPORT TYPE AND DATES COVERED
I Tom Gill and Connie DeMoyer, Bureau of Reclamation, TSC. D-8560 I I Denver Federal Center P. 0. Box 25007 Denver, CO 80225-0007
7. PERFORMING ORGANIZATION NAMEIS) AND ADDRESSIES) Bureau of Reclamation
9. SPONSORlNGlMONlTORlNG AGENCY NAMEIS) AND ADDRESS(ES)
8. PERFORMING ORGANIZATION REPORT NUMBER
R-02-04a (Replaces R-02-04)
10. SPONSORlNGlMONlTORlNG AGENCY REPORT NUMBER
I
11. SUPPLEMENTARY NOTES
I 13. ABSTRACT (Maximum 200 words)
123. DISTRIBUTIONIAVAILABILITY STATEMENT Available from the National Technical Information Service, Operations Division, 5285 Port Royal Road, Springfield, Virginia 22161
As part of the design process for the Durango Pumping Plant of the Animas - La Plata Project, a 1: 12 scale physical model study of the intake structure was conducted at the Bureau of Reclamation, Water Resources Research Laboratory at the Technical Service center in Denver, Colorado. Objectives of the study include: detennination of intake capacity at various stream flow rates; identifying approach and sweeping velocity distributions along the f& screen; characterization of flow conditions in the pump intake forebay; and 0bSe~ation of pumping impacts on current patterns in the Animas River near the intake mouth. Data collection included: water surface elevations at locations along the Animas river as well as in the intake structure; measurement of discharges upstream of the division; delivered to the pump intake conduit, and flowing through the f ~ h bypass; two-dimensional velocity measurements along the f ~ h screen and in front of the debris screen at the intake mouth, and video documentation of dy injected into flows.
12b. DISTRIBUTION CODE
14. SUBJECT TERMS- - pumping plant, intake structure, fish screen, fish bypass, debris screen, pump intake forebay, intake capacity, Durango, Animas - La Plata
15. NUMBER OF PAGES
27 16. PRICE CODE
20. LIMITATION OF ABSTRACT
UL
NSN 7540-01 -280-5500 Standard Form 298 (Rev. 2-89] Prescribed by ANSI Std. 239-18
19. SECURITY CLASSIFICATION OF ABSTRACT
UL
17. SECURITY CLASSIFICATION OF REPORT
UL
18. SECURITY CLASSIFICATION OF THIS PAGE
UL
R-02-04a (Replaces R-02-04)
DURANGO PUMPING PLANT 1 :I2 SCALE PHYSICAL MODEL STUDY
Tom Gill Connie DeMoyer
Deliver Technical Service Center Water Resources Services
Water Resources Research Laboratory Denver, Colorado
December 2002 (Revised January 2003)
UNITED STATES DEPARTMENT OF THE INTERIOR + BUREAU OF RECLAMATION

Acknowledgements
This hydraulic model study was conducted by the authors under the supervision of Al Bernstein, Durango Pumping Plant Design Team Leader; of Cliff Pugh, Manager of the Water Resources Research Laboratory Group; and in accordance with directions from Rick Ehat, Farmington Construction Office, Upper Colorado Region. The modeling effort was accomplished in cooperation with the Civil Engineering Services Branch, Structural and Architectural, and Water Conveyance Groups; and Infrastructure Services Branch, Hydraulic Equipment Group. The contributions of Morris “Rudy” Campbell, for efforts in instrumentation, calibration, surveying and data acquisition; of the laboratory shop craftsmen for model construction; and of Cheryl Rieniets, for getting this report printed and distributed are greatly appreciated. Tony Wahl was instrumental in providing conceptual framework for the modeling program and model construction layout, and in performing a Peer Review of this report.
Mission Statements
U.S. Department of the Interior
The mission of the Department of the Interior is to protect and provide access to our Nation’s natural and cultural heritage and honor our trust responsibilities to Indian tribes and our commitments to island communities.
Bureau of Reclamation
The mission of the Bureau of Reclamation is to manage, develop and protect water and related resources in an environmentally and economically sound manner in the interest of the American public.
Federal Disclaimer
The information contained in this report regarding commercial products or firms may not be used for advertising or promotional purposes and is not to be construed as an endorsement of any product or firm by the Bureau of Reclamation.
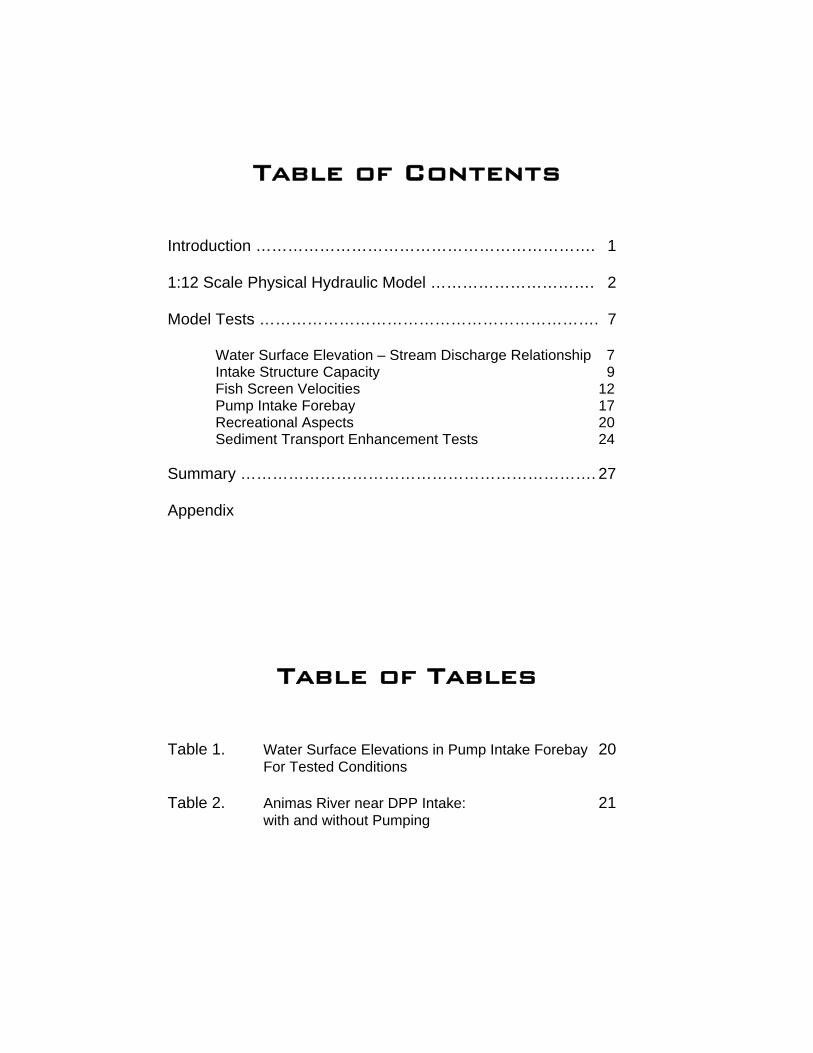
Table of Contents
Introduction ………………………………………………………. 1
1:12 Scale Physical Hydraulic Model …………………………. 2
Model Tests ………………………………………………………. 7
Water Surface Elevation – Stream Discharge Relationship 7 Intake Structure Capacity 9 Fish Screen Velocities 12 Pump Intake Forebay 17 Recreational Aspects 20 Sediment Transport Enhancement Tests 24
Summary …………………………………………………………. 27
Appendix
Table of Tables
Table 1. Water Surface Elevations in Pump Intake Forebay 20 For Tested Conditions Table 2. Animas River near DPP Intake: 21
with and without Pumping
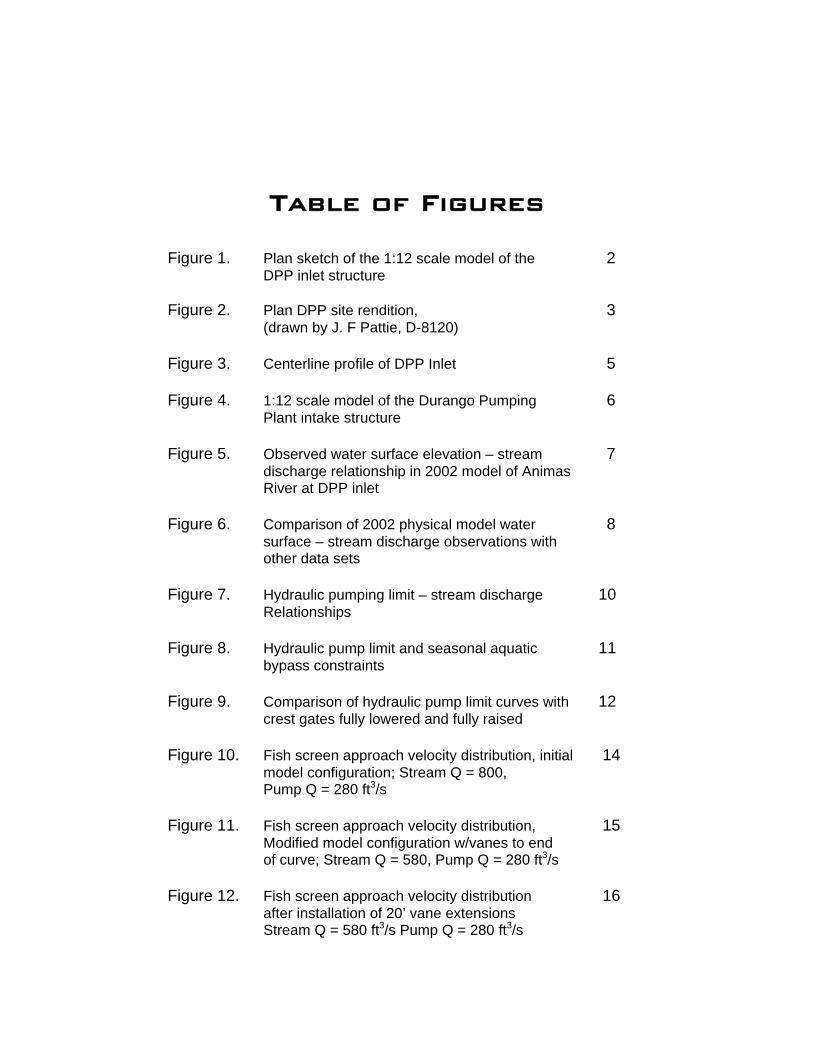
Table of Figures
Figure 1. Plan sketch of the 1:12 scale model of the 2 DPP inlet structure
Figure 2. Plan DPP site rendition, 3
(drawn by J. F Pattie, D-8120) Figure 3. Centerline profile of DPP Inlet 5 Figure 4. 1:12 scale model of the Durango Pumping 6
Plant intake structure Figure 5. Observed water surface elevation – stream 7
discharge relationship in 2002 model of Animas River at DPP inlet
Figure 6. Comparison of 2002 physical model water 8 surface – stream discharge observations with other data sets
Figure 7. Hydraulic pumping limit – stream discharge 10 Relationships
Figure 8. Hydraulic pump limit and seasonal aquatic 11 bypass constraints
Figure 9. Comparison of hydraulic pump limit curves with 12 crest gates fully lowered and fully raised
Figure 10. Fish screen approach velocity distribution, initial 14 model configuration; Stream Q = 800, Pump Q = 280 ft3/s
Figure 11. Fish screen approach velocity distribution, 15 Modified model configuration w/vanes to end of curve; Stream Q = 580, Pump Q = 280 ft3/s
Figure 12. Fish screen approach velocity distribution 16
after installation of 20’ vane extensions Stream Q = 580 ft3/s Pump Q = 280 ft3/s
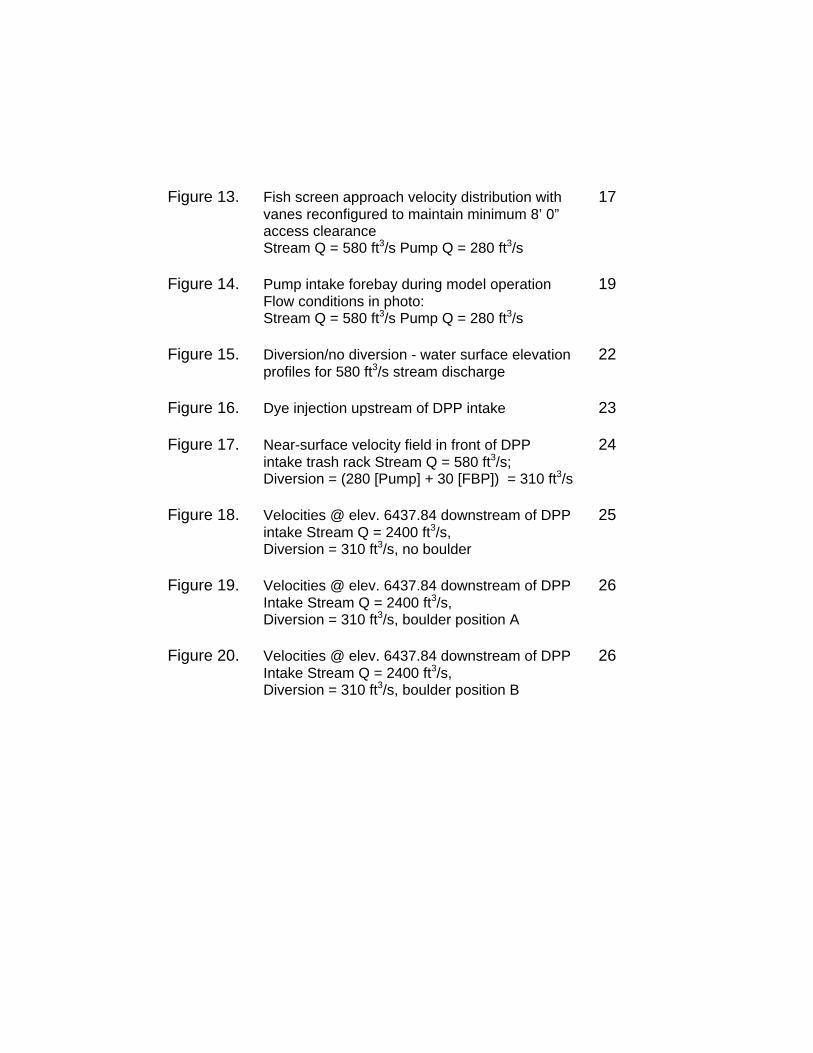
Figure 13. Fish screen approach velocity distribution with 17
vanes reconfigured to maintain minimum 8’ 0” access clearance Stream Q = 580 ft3/s Pump Q = 280 ft3/s
Figure 14. Pump intake forebay during model operation 19 Flow conditions in photo: Stream Q = 580 ft3/s Pump Q = 280 ft3/s
Figure 15. Diversion/no diversion - water surface elevation 22 profiles for 580 ft3/s stream discharge
Figure 16. Dye injection upstream of DPP intake 23 Figure 17. Near-surface velocity field in front of DPP 24
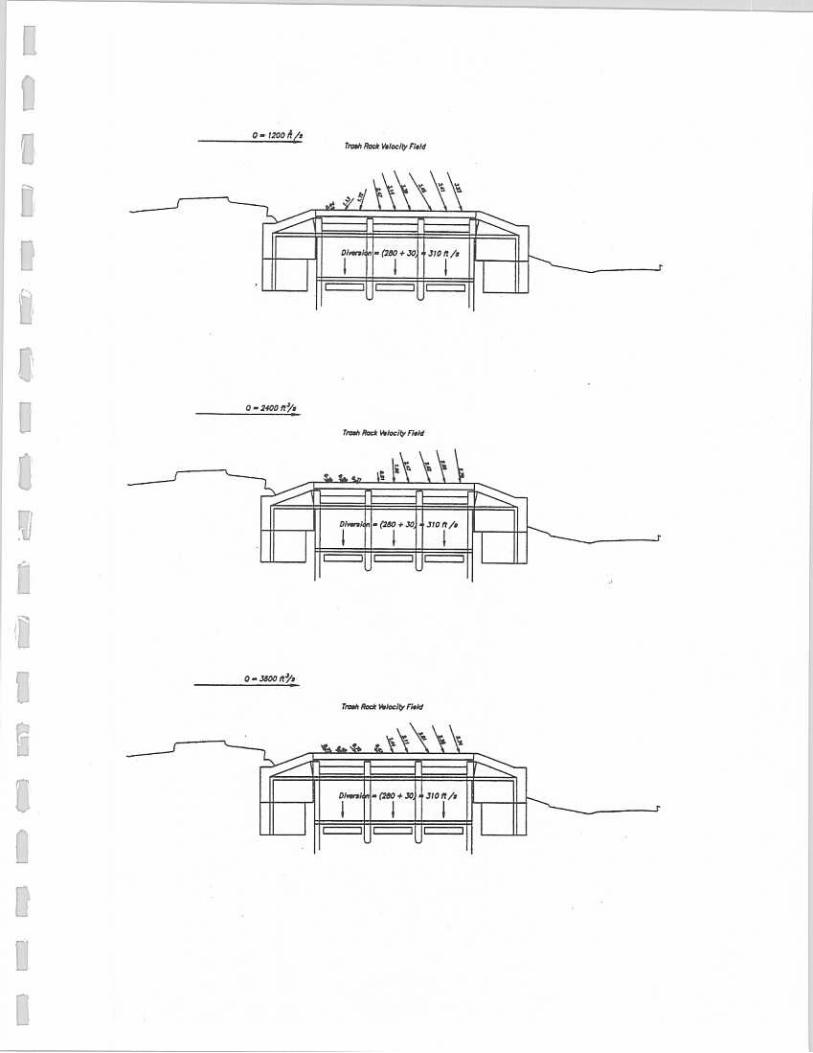
intake trash rack Stream Q = 580 ft3/s; Diversion = (280 [Pump] + 30 [FBP]) = 310 ft3/s
Figure 18. Velocities @ elev. 6437.84 downstream of DPP 25 intake Stream Q = 2400 ft3/s, Diversion = 310 ft3/s, no boulder
Figure 19. Velocities @ elev. 6437.84 downstream of DPP 26 Intake Stream Q = 2400 ft3/s, Diversion = 310 ft3/s, boulder position A
Figure 20. Velocities @ elev. 6437.84 downstream of DPP 26 Intake Stream Q = 2400 ft3/s, Diversion = 310 ft3/s, boulder position B
1
INTRODUCTION
A 1:12 scale physical model study was conducted from December of 2001 through
August of 2002 for the Durango Pumping Plant (DPP) inlet structure of the Animas – La
Plata (ALP) project at the U.S. Bureau of Reclamation’s Water Resources Research
Laboratory at the Denver Technical Service Center. The open channel portion of the
intake structure, along with approximately 450 ft of the Animas River was modeled,
beginning 98 ft upstream of the proposed inlet site. Primary objectives – as outlined at
the Concept C briefing prior to initial testing – were to investigate the following aspects:
• Intake structure capacity
• Fish screen velocities
• Pump intake forebay
• Recreational aspects
The design process of this twice-revived project was on an accelerated, or “fast track”
schedule in an effort to minimize the design time prior to initiation of construction. This
decision was apparently based on the fact that much work – including physical modeling
– had been done on previous, larger versions of the project. The fast track schedule
resulted in a less than ideal chronology. Model construction was initiated despite the
fact that a Value Engineering (VE) study hadn’t yet been conducted.
The initial model construction was completed simultaneously with the VE team
recommending significant changes. Thus the first configuration was obsolete upon
completion. While changes were pending, preliminary testing was done with the initial
model configuration in March and early April. By early May, design modifications that
addressed issues raised in the VE study had been made to the model and testing
resumed. Further design modifications were made in an effort to improve observed
hydraulic performance. By mid June, tests of design-critical performance were
essentially complete. Modifications to provide structural support for an access deck, to
address sedimentation concerns, and to improve maintenance access were made late in
the design process. These changes were tested to verify that they would not negatively
impact hydraulic performance.
2
.
1:12 SCALE PHYSICAL HYDRAULIC MODEL
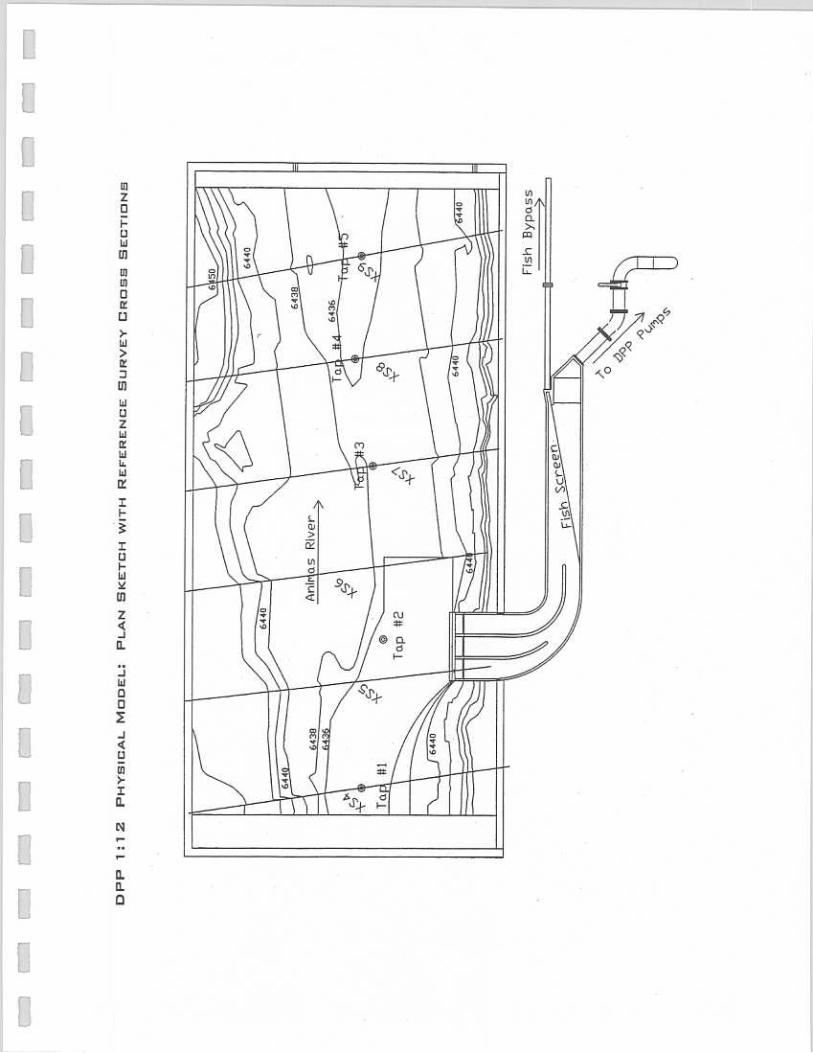
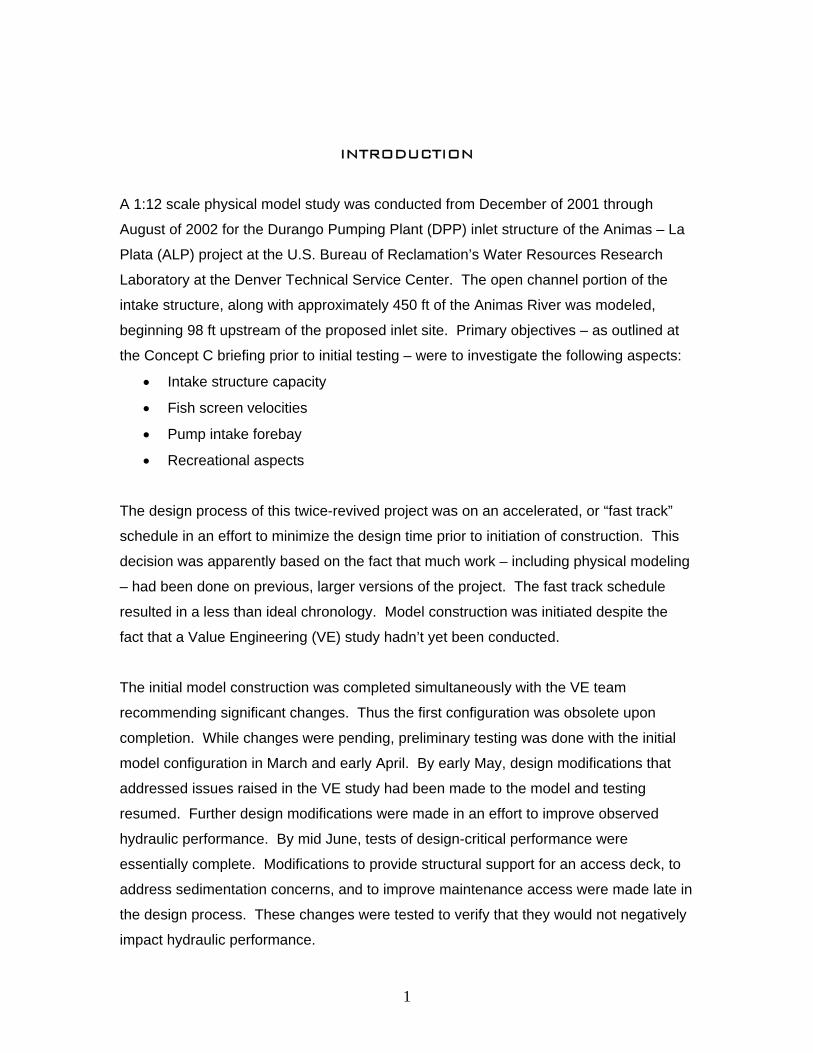
Figure 1 is a plan sketch of the modeled section of the Animas River and the Durango
Pumping Plant inlet structure in its final model configuration. Shown are contours on two
foot intervals and the location of five streambed taps that were used to identify the water
surface profile along the Animas River for modeled flow conditions. Flow delivered to
the model was measured using venturi meters in the lab pipe system. Fish bypass
discharge was measured using a flat plate orifice that was calibrated in the model. Flow
to the DPP pumps was measured using a broad crested weir.
Figure 1. Plan sketch of the 1:12 scale model of the DPP inlet structure
The inlet mouth is 46’ 9” wide. This width is configured as three bays, each 14’ 3” wide,
separated by two piers each 2’ 0” wide. Vanes extend from these piers to improve flow
distribution along the fish screen. A secondary function of the vanes is support for an
access deck that covers this section. Vanes are configured such that there is a
minimum of 8’ 0” clearance between vanes for maintenance access in the intake.
3
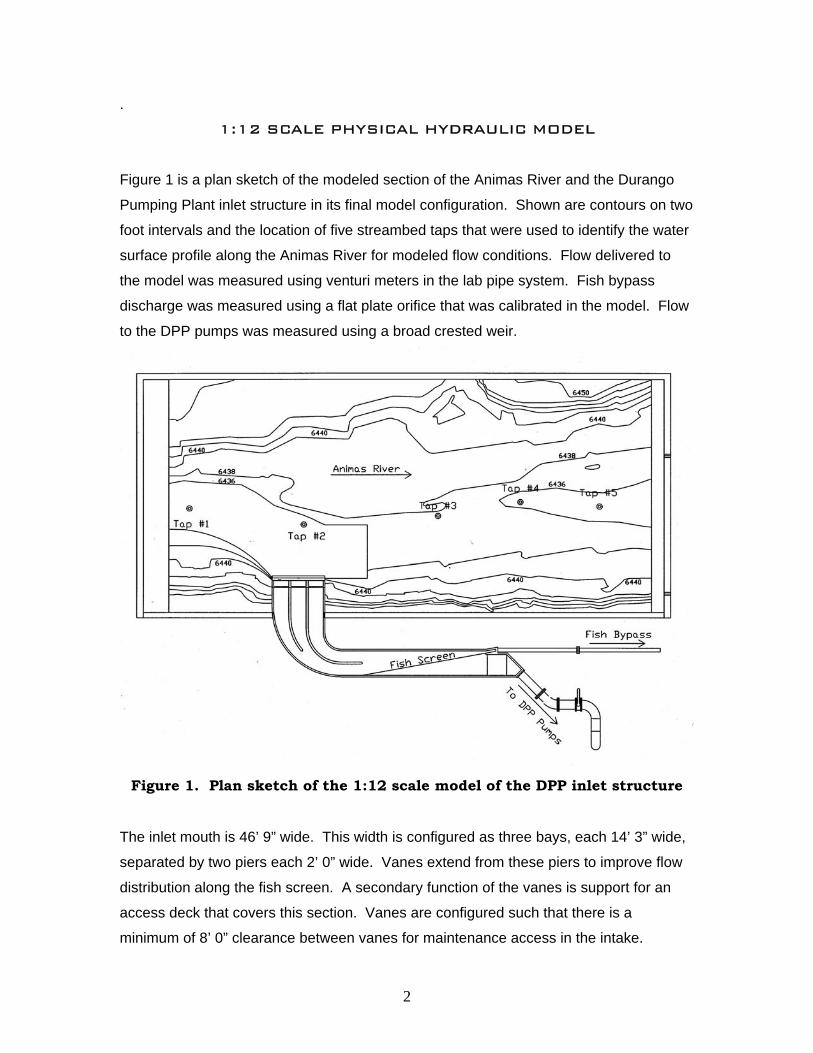
Figure 2 is an overhead rendition showing the intake structure and pump building drawn
by J. F. Pattie. The access deck above the vanes in the curved section is seen in this
view. The pump inlet conduit, (underground), follows a straight path from the upper right
portion of the inlet structure to what is the upper side of the pump building in this picture.
Figure 2. Plan DPP site rendition, (drawn by J. F Pattie, D-8120)
Downstream of the curved section, the inlet structure width is 23’ 0”. Twenty feet
downstream from the end of the curve, a diagonal wall that supports the fish screen
begins, oriented at an angle of 10o with the right side of the channel. This diagonal wall
crosses the channel from right to left as viewed in the direction of flow. The actual
screen is 100’ 0” long by 8’ 0” high with an open area of approximately 40%.
At the point beyond the fish screen section where the diagonal wall is 2’ 0” from the left
wall of the intake structure, the left wall angles at 10o. It then parallels the fish screen
wall, forming a 2’ 0” wide channel approximately 8’ 10” long. At the downstream end of
4
this channel is the entrance to the fish bypass conduit. On the downstream side of the
fish screen, (right side of the channel), the channel width beyond the end of the screen is
19’ 6”. The channel walls are parallel at this width for approximately 19’ 8” in the
direction of flow. The invert elevation transitions down from 6429.75 to 6418.67 in this
reach. The lower invert section is the forebay to the 84” diameter pump intake conduit.
NOTE: The point in the Animas River where the fish bypass conduit returns is beyond
the downstream extent of the model. Hence, it was not possible to examine the
hydraulics of the fish bypass conduit in this study. In the prototype, discharge through
the fish bypass conduit will be a function of the head differential between the water
surface elevation in the intake at the conduit entrance and the water surface elevation of
the Animas River at the conduit outlet. In the model, flow through the fish bypass was
controlled by adjusting a butterfly valve. For this study, fish bypass discharge was held
constant at 30 ft3/s for all tests modeling pump diversions.
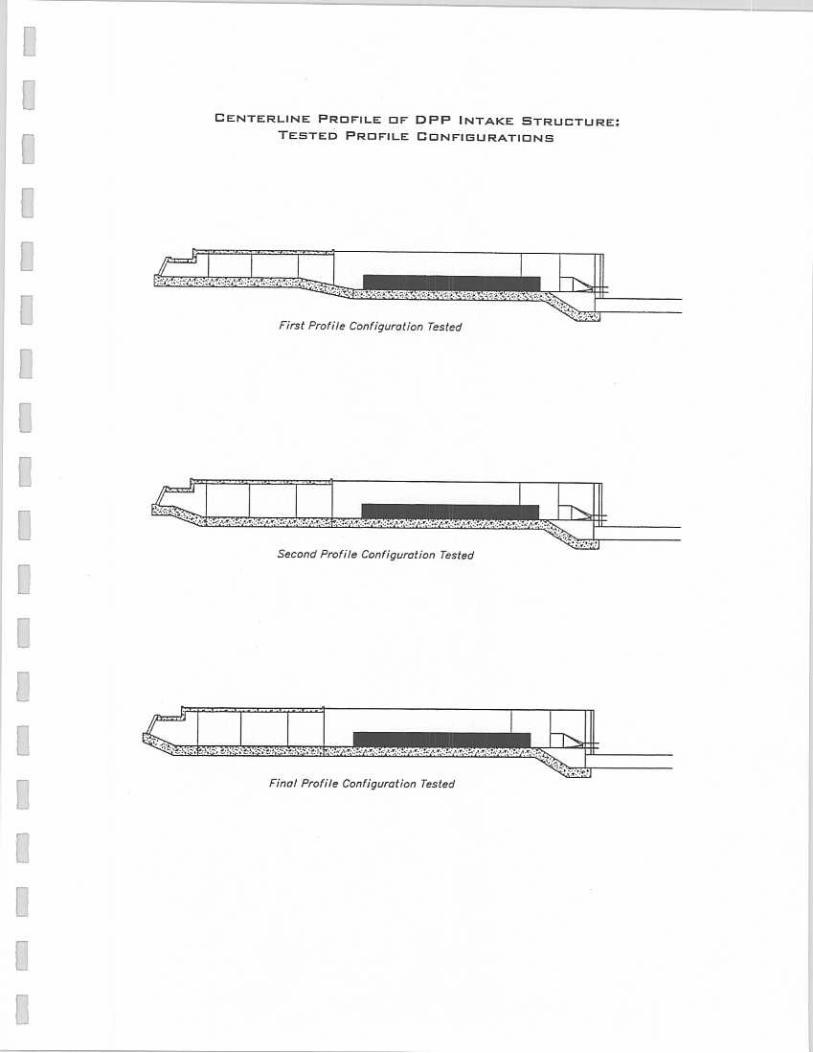
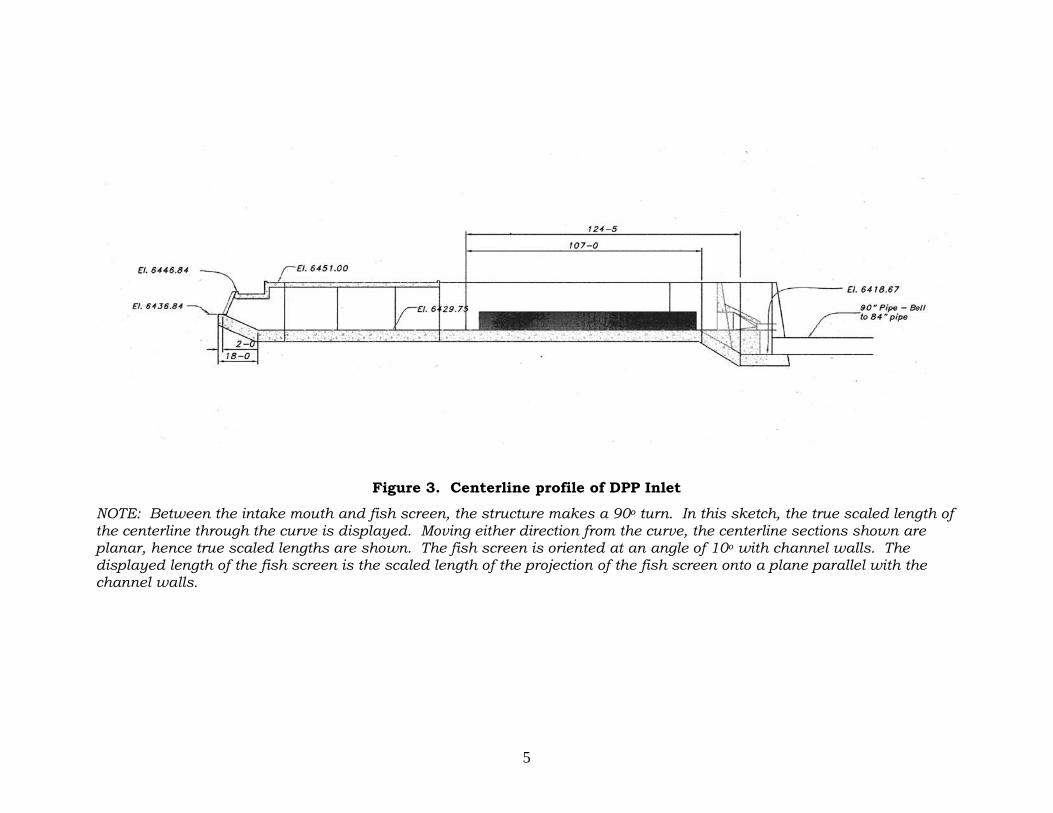
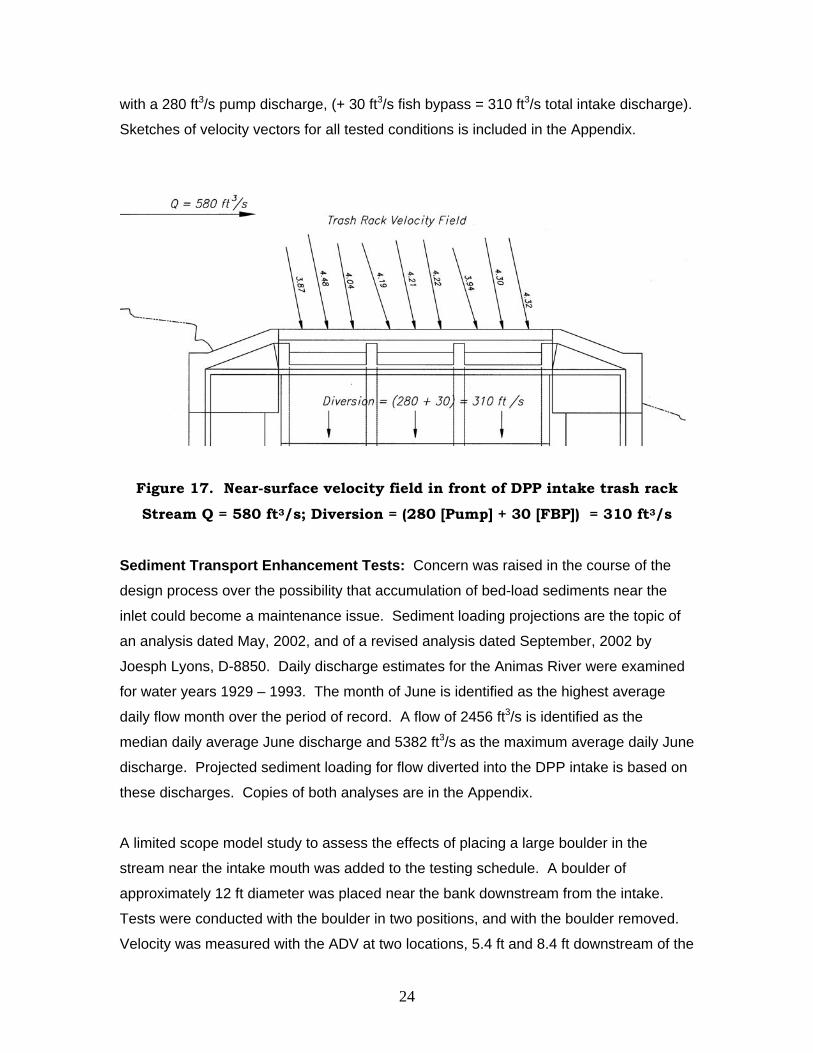
Figure 3 is a sketch of the intake profile, showing the centerline of the structure as if laid
out on a flat plane. The fish screen is displayed as it projects on a vertical plane running
parallel to the inlet channel sides. Invert elevation at the mouth of the inlet is 6436.84.
Invert elevation in the fish screen section is 6429.75, and sump elevation at the suction
intake for the 84” conduit leading to the DPP pumps is 6418.67. The transition from
6436.84 to 6429.75 covers a 16’ 0” horizontal distance immediately downstream of the
trash racks. The sediment excluding crest gates are mounted at the upper end of this
transition.
Figure 3 shows the third profile configuration tested. An initial modification was made to
improve hydraulic performance of the model. The second modification was made to
reduce potential for sediment accumulation both upstream and immediately behind the
crest gates. Profile sketches of all tested profile configurations are included in the
Appendix.
5
Figure 3. Centerline profile of DPP Inlet
NOTE: Between the intake mouth and fish screen, the structure makes a 90o turn. In this sketch, the true scaled length of the centerline through the curve is displayed. Moving either direction from the curve, the centerline sections shown are planar, hence true scaled lengths are shown. The fish screen is oriented at an angle of 10o with channel walls. The displayed length of the fish screen is the scaled length of the projection of the fish screen onto a plane parallel with the channel walls.
6
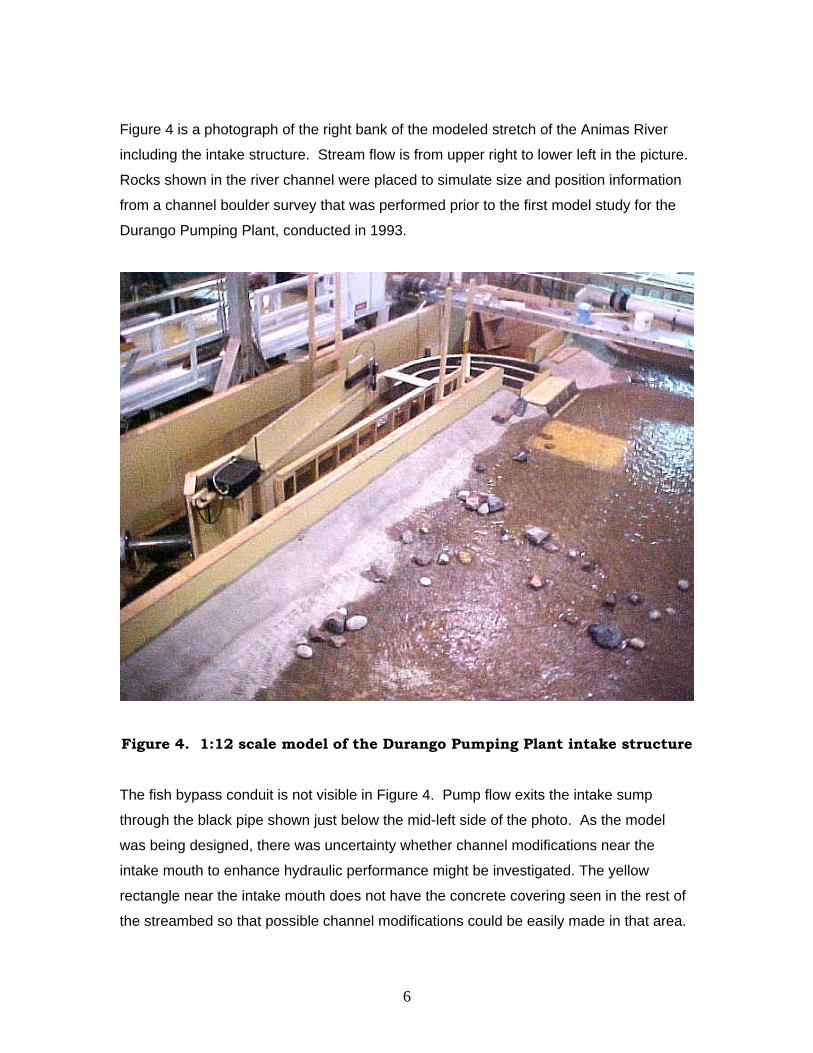
Figure 4 is a photograph of the right bank of the modeled stretch of the Animas River
including the intake structure. Stream flow is from upper right to lower left in the picture.
Rocks shown in the river channel were placed to simulate size and position information
from a channel boulder survey that was performed prior to the first model study for the
Durango Pumping Plant, conducted in 1993.
Figure 4. 1:12 scale model of the Durango Pumping Plant intake structure
The fish bypass conduit is not visible in Figure 4. Pump flow exits the intake sump
through the black pipe shown just below the mid-left side of the photo. As the model
was being designed, there was uncertainty whether channel modifications near the
intake mouth to enhance hydraulic performance might be investigated. The yellow
rectangle near the intake mouth does not have the concrete covering seen in the rest of
the streambed so that possible channel modifications could be easily made in that area.
7
MODEL TESTS
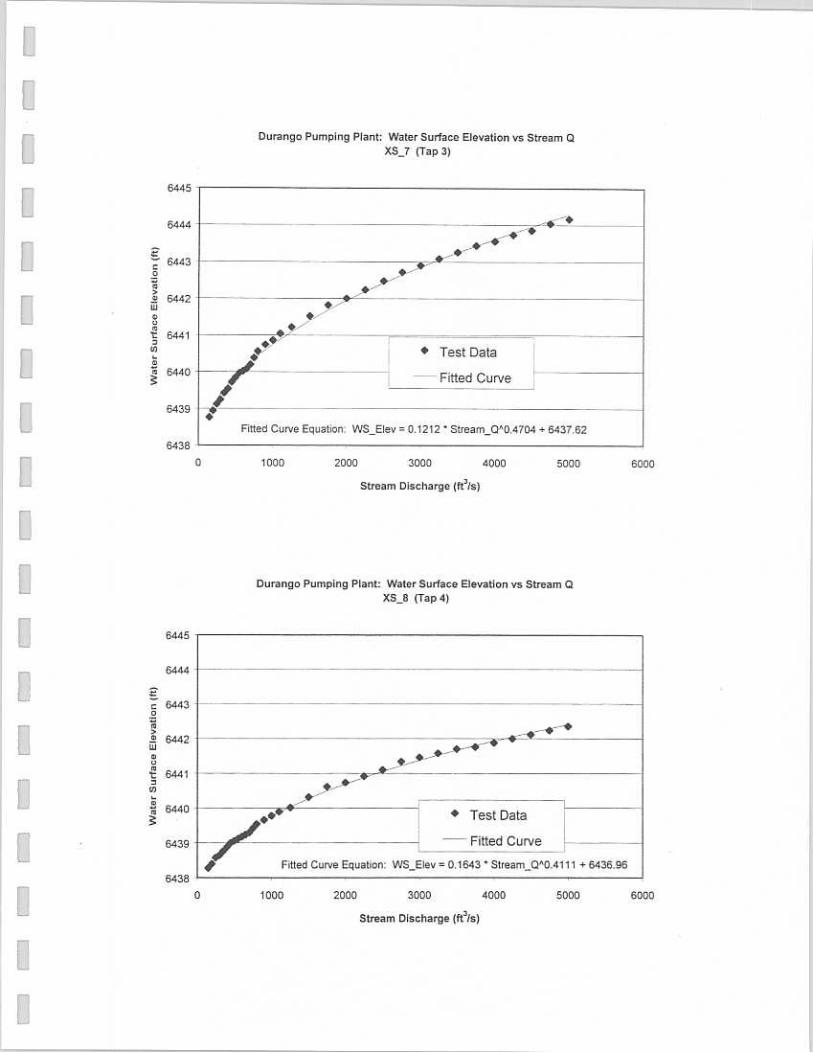
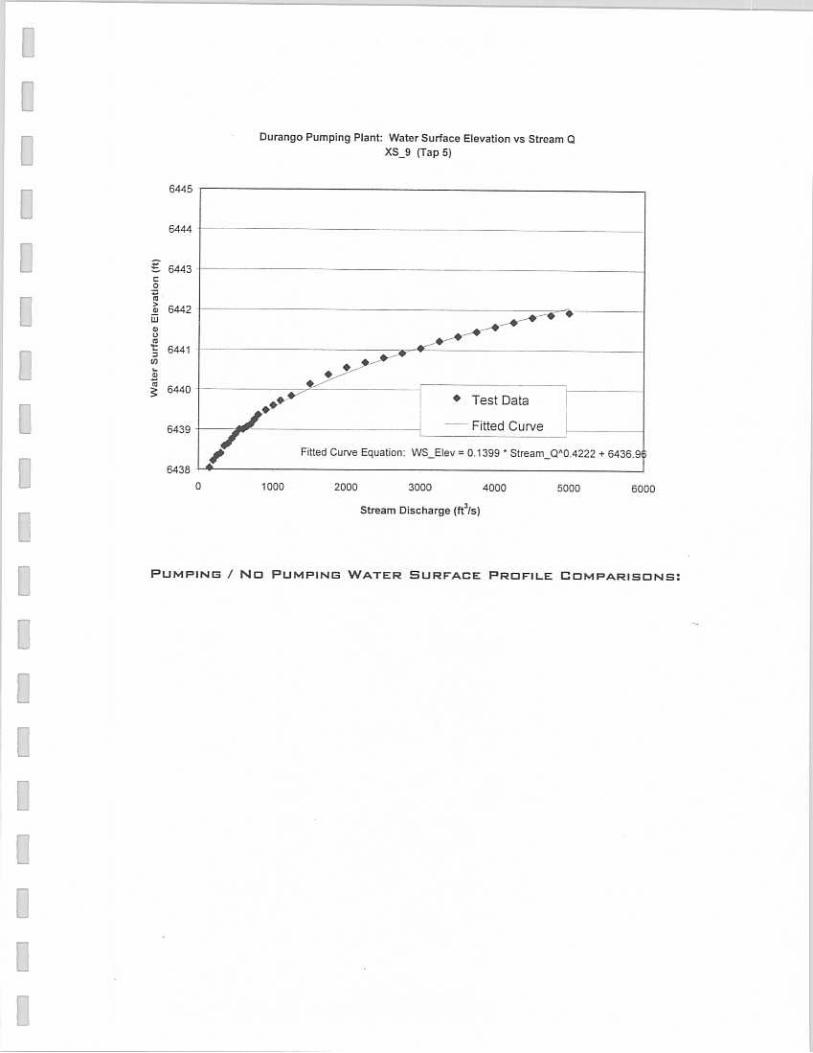
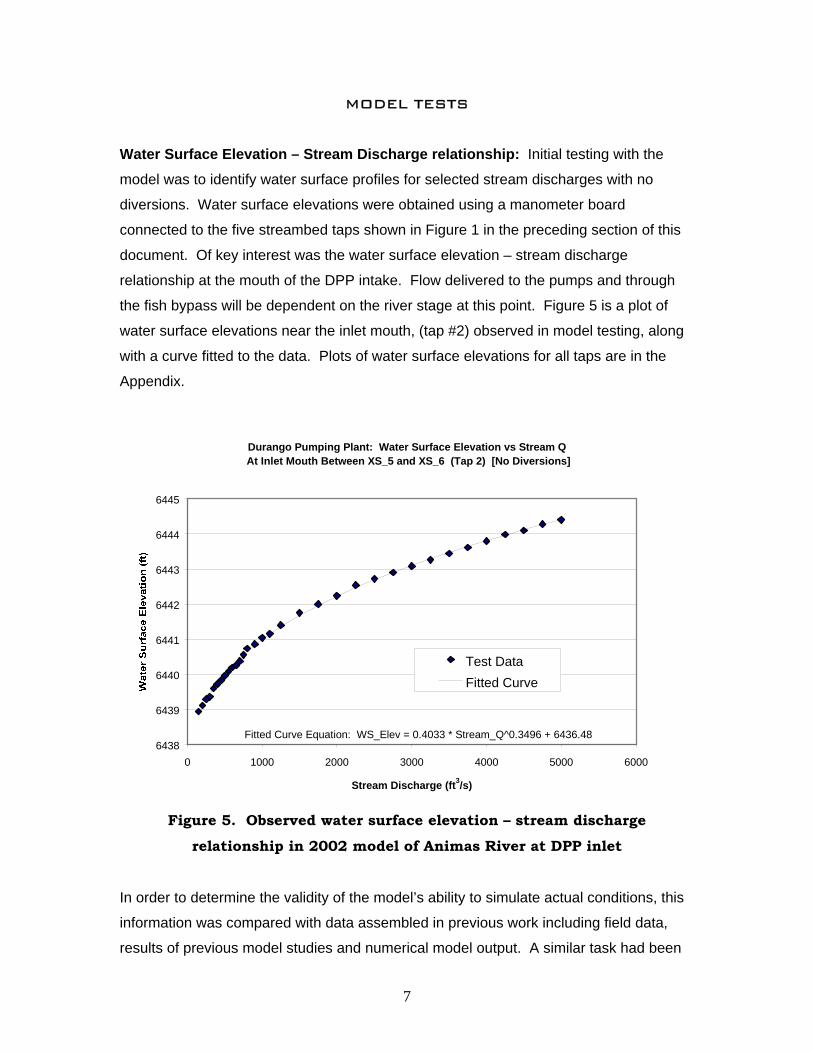
Water Surface Elevation – Stream Discharge relationship: Initial testing with the
model was to identify water surface profiles for selected stream discharges with no
diversions. Water surface elevations were obtained using a manometer board
connected to the five streambed taps shown in Figure 1 in the preceding section of this
document. Of key interest was the water surface elevation – stream discharge
relationship at the mouth of the DPP intake. Flow delivered to the pumps and through
the fish bypass will be dependent on the river stage at this point. Figure 5 is a plot of
water surface elevations near the inlet mouth, (tap #2) observed in model testing, along
with a curve fitted to the data. Plots of water surface elevations for all taps are in the
Appendix.
Durango Pumping Plant: Water Surface Elevation vs Stream Q At Inlet Mouth Between XS_5 and XS_6 (Tap 2) [No Diversions]
6438
6439
6440
6441
6442
6443
6444
6445
0 1000 2000 3000 4000 5000 6000
Stream Discharge (ft3/s)
Test DataFitted Curve
Fitted Curve Equation: WS_Elev = 0.4033 * Stream_Q^0.3496 + 6436.48
Figure 5. Observed water surface elevation – stream discharge
relationship in 2002 model of Animas River at DPP inlet
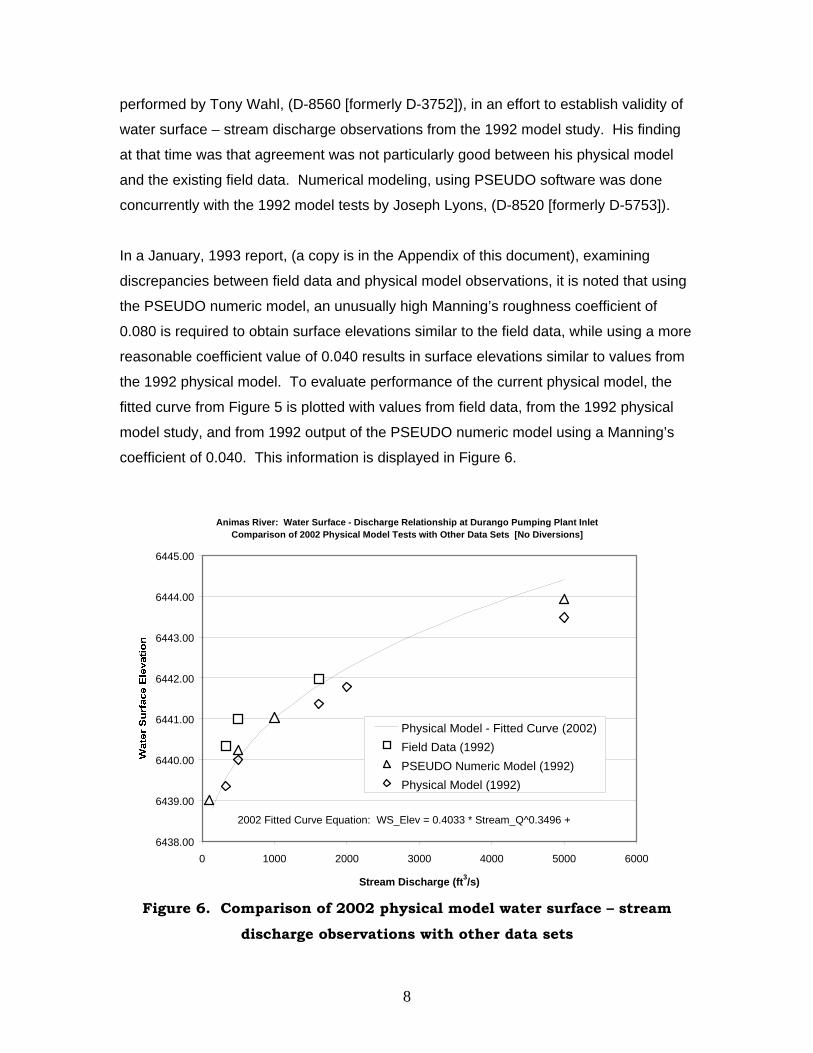
In order to determine the validity of the model’s ability to simulate actual conditions, this
information was compared with data assembled in previous work including field data,
results of previous model studies and numerical model output. A similar task had been
8
performed by Tony Wahl, (D-8560 [formerly D-3752]), in an effort to establish validity of
water surface – stream discharge observations from the 1992 model study. His finding
at that time was that agreement was not particularly good between his physical model
and the existing field data. Numerical modeling, using PSEUDO software was done
concurrently with the 1992 model tests by Joseph Lyons, (D-8520 [formerly D-5753]).
In a January, 1993 report, (a copy is in the Appendix of this document), examining
discrepancies between field data and physical model observations, it is noted that using
the PSEUDO numeric model, an unusually high Manning’s roughness coefficient of
0.080 is required to obtain surface elevations similar to the field data, while using a more
reasonable coefficient value of 0.040 results in surface elevations similar to values from
the 1992 physical model. To evaluate performance of the current physical model, the
fitted curve from Figure 5 is plotted with values from field data, from the 1992 physical
model study, and from 1992 output of the PSEUDO numeric model using a Manning’s
coefficient of 0.040. This information is displayed in Figure 6.
Animas River: Water Surface - Discharge Relationship at Durango Pumping Plant Inlet Comparison of 2002 Physical Model Tests with Other Data Sets [No Diversions]
6438.00
6439.00
6440.00
6441.00
6442.00
6443.00
6444.00
6445.00
0 1000 2000 3000 4000 5000 6000
Stream Discharge (ft3/s)
Physical Model - Fitted Curve (2002)Field Data (1992)PSEUDO Numeric Model (1992)Physical Model (1992)
2002 Fitted Curve Equation: WS_Elev = 0.4033 * Stream_Q^0.3496 +
Figure 6. Comparison of 2002 physical model water surface – stream
discharge observations with other data sets
9
At lower stream flows, diversion discharge will be hydraulically limited by the water
surface elevation at the inlet mouth. As seen in Figure 6, there is reasonable agreement
in water surface elevation at stream discharges below 1000 ft3/s among both the current
and 1992 physical model studies as well as with the numeric model output, (using a
0.040 roughness coefficient). These three data sets predict water surface elevations
significantly below that indicated by the limited body of field data available.
The degree of agreement of the non-field data information was accepted as a suitable
level of validation for the model’s ability to simulate the prototype conditions. Since the
water surface elevations observed with the current physical model for stream discharge
less than 1000 ft3/s are lower that those indicated by the field data, using the current
physical model data would be conservative from a design perspective.
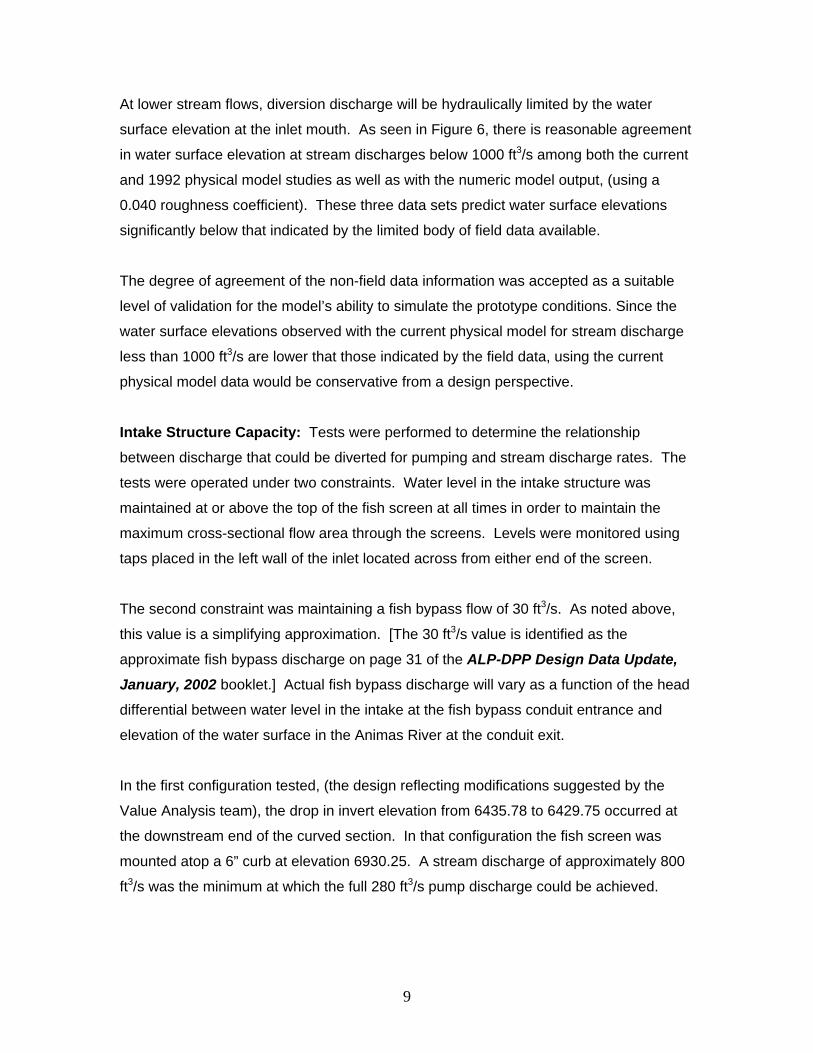
Intake Structure Capacity: Tests were performed to determine the relationship
between discharge that could be diverted for pumping and stream discharge rates. The
tests were operated under two constraints. Water level in the intake structure was
maintained at or above the top of the fish screen at all times in order to maintain the
maximum cross-sectional flow area through the screens. Levels were monitored using
taps placed in the left wall of the inlet located across from either end of the screen.
The second constraint was maintaining a fish bypass flow of 30 ft3/s. As noted above,
this value is a simplifying approximation. [The 30 ft3/s value is identified as the
approximate fish bypass discharge on page 31 of the ALP-DPP Design Data Update,
January, 2002 booklet.] Actual fish bypass discharge will vary as a function of the head
differential between water level in the intake at the fish bypass conduit entrance and
elevation of the water surface in the Animas River at the conduit exit.
In the first configuration tested, (the design reflecting modifications suggested by the
Value Analysis team), the drop in invert elevation from 6435.78 to 6429.75 occurred at
the downstream end of the curved section. In that configuration the fish screen was
mounted atop a 6” curb at elevation 6930.25. A stream discharge of approximately 800
ft3/s was the minimum at which the full 280 ft3/s pump discharge could be achieved.
10
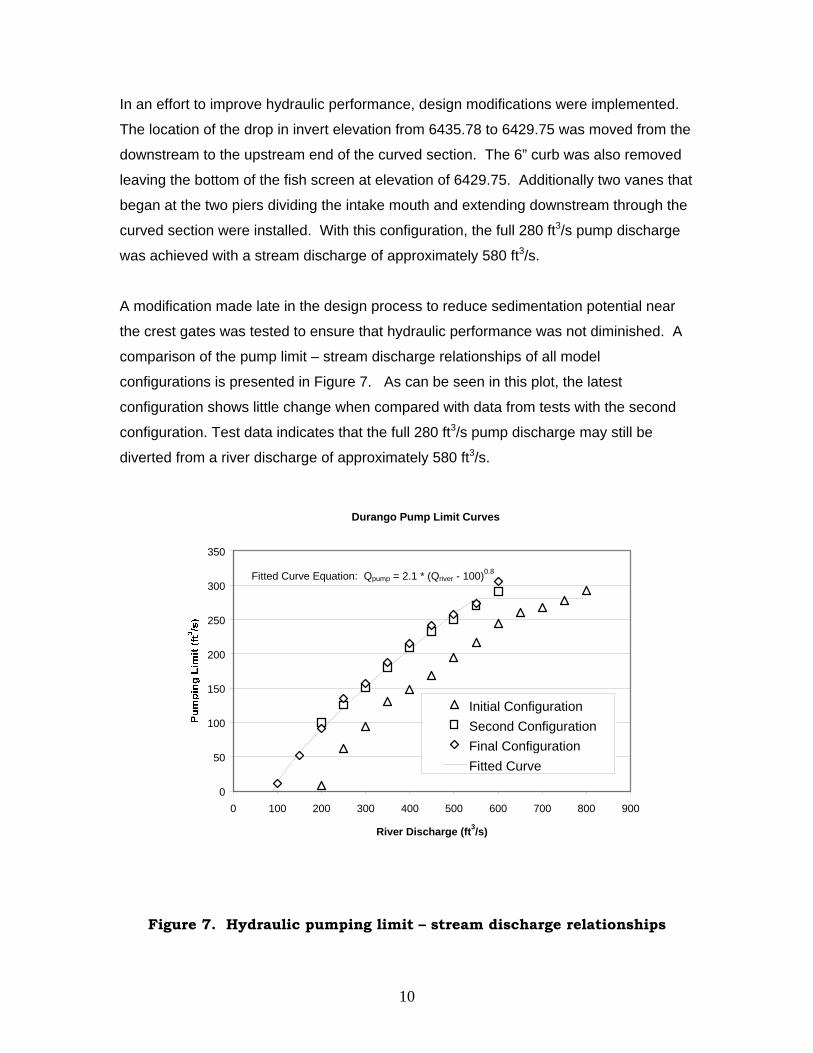
In an effort to improve hydraulic performance, design modifications were implemented.
The location of the drop in invert elevation from 6435.78 to 6429.75 was moved from the
downstream to the upstream end of the curved section. The 6” curb was also removed
leaving the bottom of the fish screen at elevation of 6429.75. Additionally two vanes that
began at the two piers dividing the intake mouth and extending downstream through the
curved section were installed. With this configuration, the full 280 ft3/s pump discharge
was achieved with a stream discharge of approximately 580 ft3/s.
A modification made late in the design process to reduce sedimentation potential near
the crest gates was tested to ensure that hydraulic performance was not diminished. A
comparison of the pump limit – stream discharge relationships of all model
configurations is presented in Figure 7. As can be seen in this plot, the latest
configuration shows little change when compared with data from tests with the second
configuration. Test data indicates that the full 280 ft3/s pump discharge may still be
diverted from a river discharge of approximately 580 ft3/s.
Durango Pump Limit Curves
0
50
100
150
200
250
300
350
0 100 200 300 400 500 600 700 800 900
River Discharge (ft3/s)
Initial ConfigurationSecond ConfigurationFinal ConfigurationFitted Curve
Fitted Curve Equation: Qpump = 2.1 * (Qriver - 100)0.8
Figure 7. Hydraulic pumping limit – stream discharge relationships
11
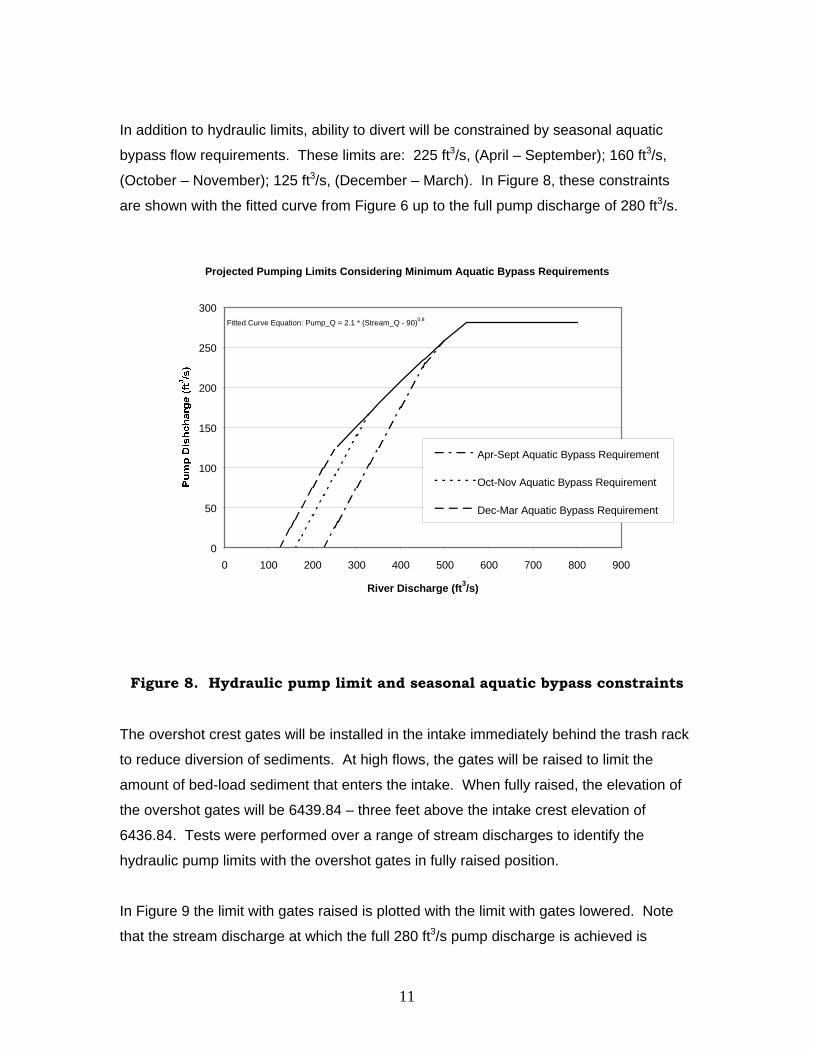
In addition to hydraulic limits, ability to divert will be constrained by seasonal aquatic
bypass flow requirements. These limits are: 225 ft3/s, (April – September); 160 ft3/s,
(October – November); 125 ft3/s, (December – March). In Figure 8, these constraints
are shown with the fitted curve from Figure 6 up to the full pump discharge of 280 ft3/s.
Projected Pumping Limits Considering Minimum Aquatic Bypass Requirements
0
50
100
150
200
250
300
0 100 200 300 400 500 600 700 800 900
River Discharge (ft3/s)
Apr-Sept Aquatic Bypass Requirement
Oct-Nov Aquatic Bypass Requirement
Dec-Mar Aquatic Bypass Requirement
Fitted Curve Equation: Pump_Q = 2.1 * (Stream_Q - 90)0.8
Figure 8. Hydraulic pump limit and seasonal aquatic bypass constraints
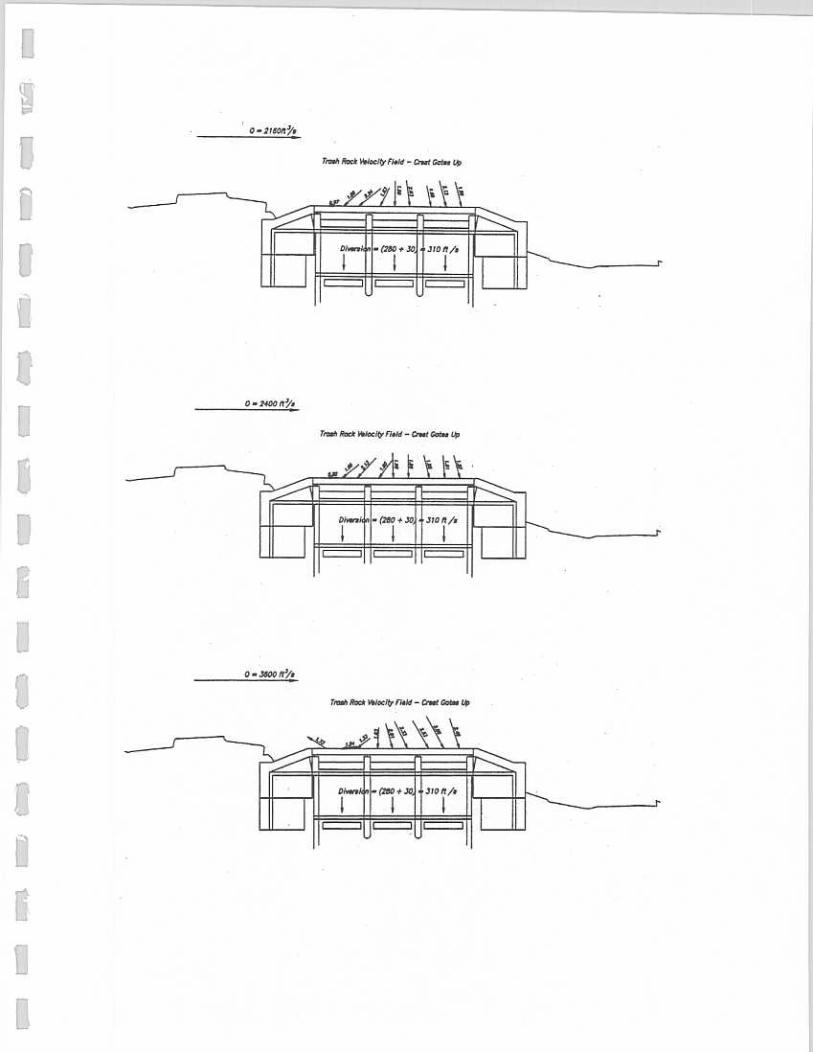
The overshot crest gates will be installed in the intake immediately behind the trash rack
to reduce diversion of sediments. At high flows, the gates will be raised to limit the
amount of bed-load sediment that enters the intake. When fully raised, the elevation of
the overshot gates will be 6439.84 – three feet above the intake crest elevation of
6436.84. Tests were performed over a range of stream discharges to identify the
hydraulic pump limits with the overshot gates in fully raised position.
In Figure 9 the limit with gates raised is plotted with the limit with gates lowered. Note
that the stream discharge at which the full 280 ft3/s pump discharge is achieved is
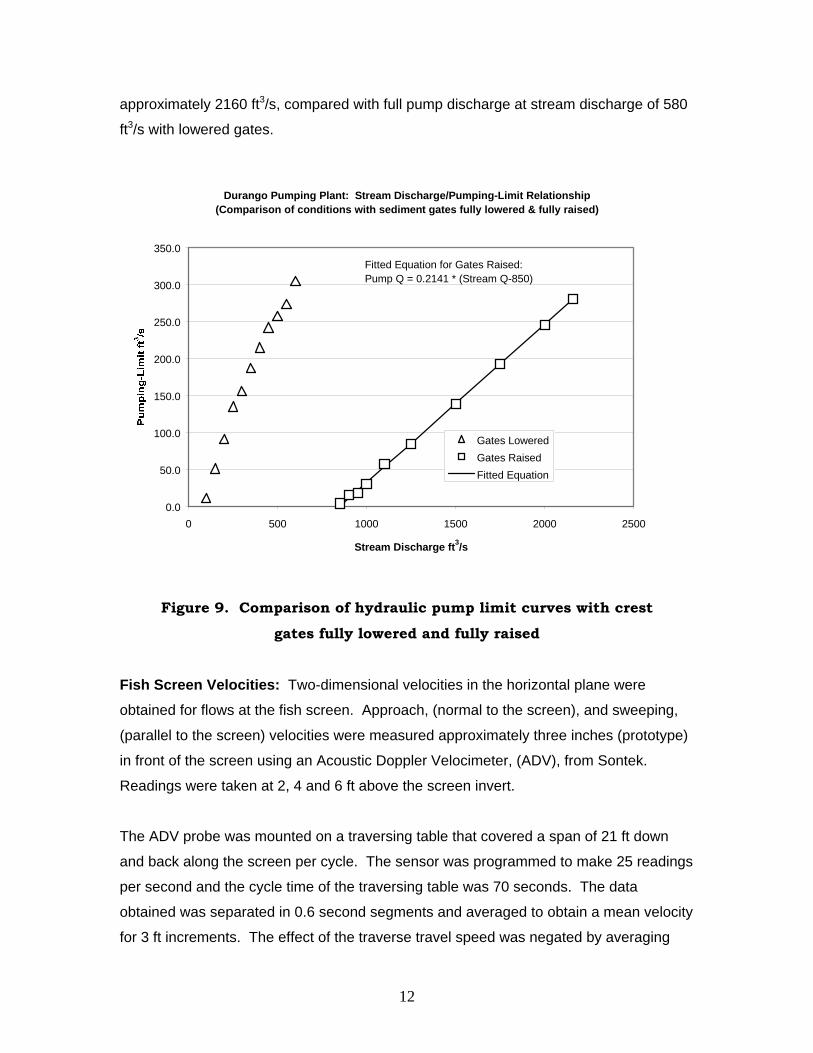
12
approximately 2160 ft3/s, compared with full pump discharge at stream discharge of 580
ft3/s with lowered gates.
Durango Pumping Plant: Stream Discharge/Pumping-Limit Relationship(Comparison of conditions with sediment gates fully lowered & fully raised)
0.0
50.0
100.0
150.0
200.0
250.0
300.0
350.0
0 500 1000 1500 2000 2500
Stream Discharge ft3/s
Gates LoweredGates RaisedFitted Equation
Fitted Equation for Gates Raised: Pump Q = 0.2141 * (Stream Q-850)
Figure 9. Comparison of hydraulic pump limit curves with crest
gates fully lowered and fully raised
Fish Screen Velocities: Two-dimensional velocities in the horizontal plane were
obtained for flows at the fish screen. Approach, (normal to the screen), and sweeping,
(parallel to the screen) velocities were measured approximately three inches (prototype)
in front of the screen using an Acoustic Doppler Velocimeter, (ADV), from Sontek.
Readings were taken at 2, 4 and 6 ft above the screen invert.
The ADV probe was mounted on a traversing table that covered a span of 21 ft down
and back along the screen per cycle. The sensor was programmed to make 25 readings
per second and the cycle time of the traversing table was 70 seconds. The data
obtained was separated in 0.6 second segments and averaged to obtain a mean velocity
for 3 ft increments. The effect of the traverse travel speed was negated by averaging
13
the values obtained as the probe traveled in each direction past each 3 ft increment
along the screen. Confined space prevented making velocity measurements over the
furthest downstream 8.5 ft of the fish screen.
In order to obtain an acceptable approach velocity distribution, the mechanical design
group, [Rick Christensen, D-8410], indicated that louvers would be installed on the
downstream side of the fish screens. The design criteria used for this screen is an
approach velocity of 0.5 ft/s or less.
The critical condition is at the minimum stream discharge for which the full pump
discharge is possible. Under this condition, flow through the screen is at the maximum,
and the depth of flow in the intake is equal to the height of the fish screen – the minimum
operational flow depth. During testing, the most uneven approach velocity was observed
for this flow condition. Additionally, a minimum amount of head would be available for
using the louvers to adjust approach velocity distribution.
To verify accuracy of values obtained with the ADV, a crude check of continuity was
performed by integrating the individual approach velocity values over the area segments
where each value was observed. Averaged values for the furthest downstream 10 ft for
which readings could be obtained were extrapolated across the 8.5 ft at the end of the
screen where readings could not be taken. For test conditions discussed below,
calculated pump discharges fell within a range of 86% to 115%, indicating a reasonable
degree of accuracy in observed approach velocity values.
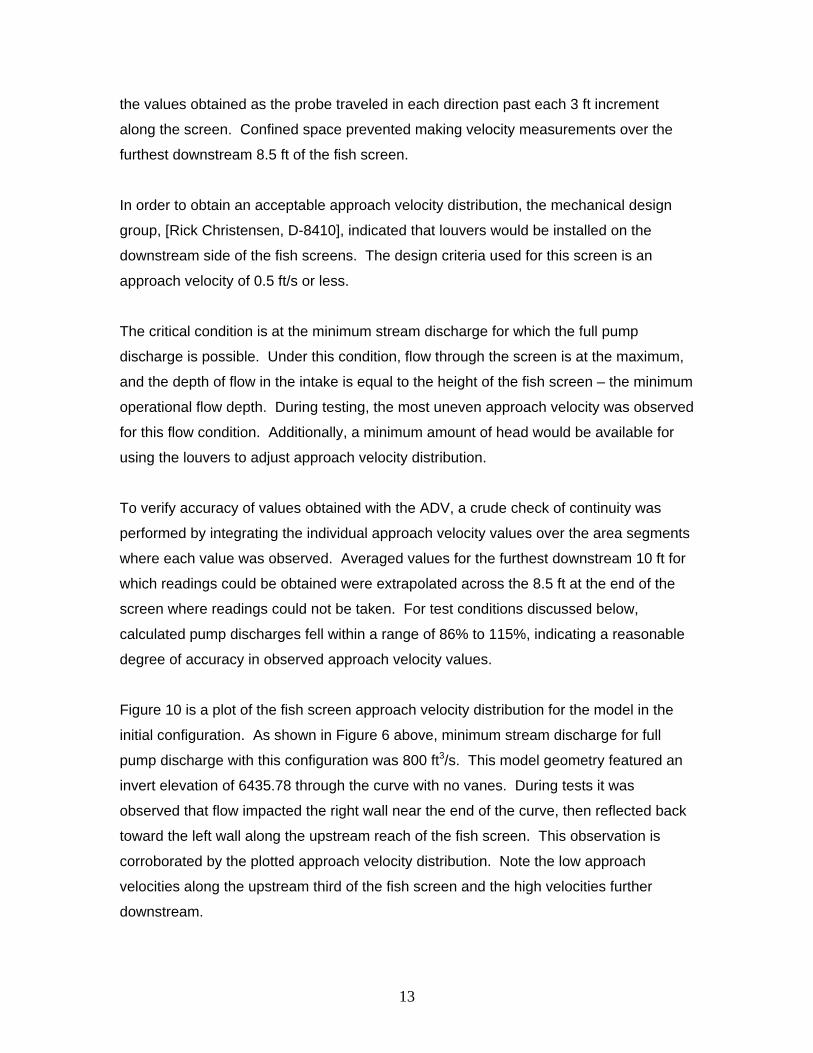
Figure 10 is a plot of the fish screen approach velocity distribution for the model in the
initial configuration. As shown in Figure 6 above, minimum stream discharge for full
pump discharge with this configuration was 800 ft3/s. This model geometry featured an
invert elevation of 6435.78 through the curve with no vanes. During tests it was
observed that flow impacted the right wall near the end of the curve, then reflected back
toward the left wall along the upstream reach of the fish screen. This observation is
corroborated by the plotted approach velocity distribution. Note the low approach
velocities along the upstream third of the fish screen and the high velocities further
downstream.
14
Durango Pumping Plant Fish Screen Approach Velocity05/08/02 Tests: River Q = 800 cfs; Pump Q = 280 cfs
0.00
0.10
0.20
0.30
0.40
0.50
0.60
0.70
0.80
0 10 20 30 40 50 60 70 80 90 100
Distance From Upstream End of Screen (ft)
2' 4' 6'
Figure 10. Fish screen approach velocity distribution, initial model
configuration; Stream Q = 800, Pump Q = 280 ft3/s
With the initial model configuration, as Figure 10 shows, there was poor distribution of
the approach velocity along the fish screen and velocities well in excess of 0.5 ft/s were
observed. As noted in the Intake Structure Capacity section, the original configuration of
the model was modified by moving the location of the drop in invert from 6435.78 to
6429.75 from the downstream end of the curve to a position upstream of the curve. A 6”
curb at the base of the fish screen was removed. At the same time, vanes were installed
that extended through the curved section to improve distribution of flow in the inlet.
Improvements were seen both in reduced energy loss and improved distribution of flow
through the fish screen. As previously noted, full pump discharge was achieved with the
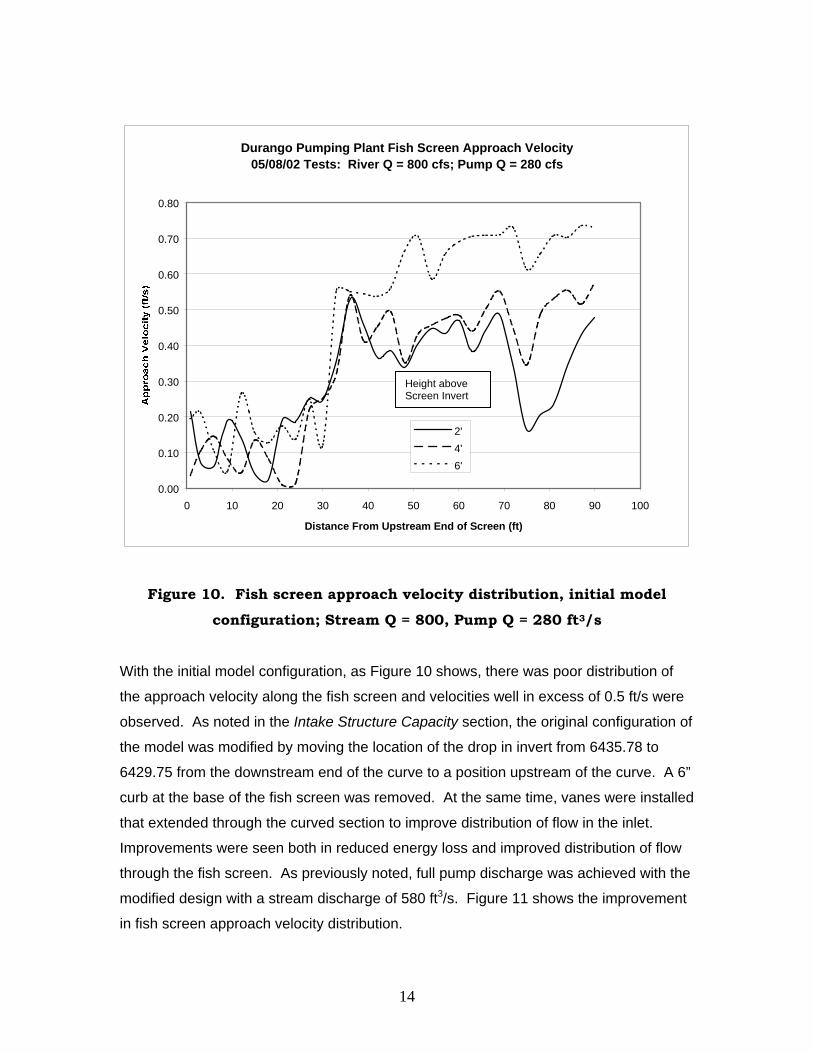
modified design with a stream discharge of 580 ft3/s. Figure 11 shows the improvement
in fish screen approach velocity distribution.
Height above Screen Invert
15
Durango Pumping Plant Fish Screen Approach Velocity05/29/02 Tests: River Q = 580 cfs; Pump Q = 280 cfs; Vanes in Inlet
0.00
0.10
0.20
0.30
0.40
0.50
0.60
0.70
0.80
0 10 20 30 40 50 60 70 80 90 100
Screen Station (ft)
2' 4' 6'
Figure 11. Fish screen approach velocity distribution,
Modified model configuration w/vanes to end of curve;
Stream Q = 580, Pump Q = 280 ft3/s
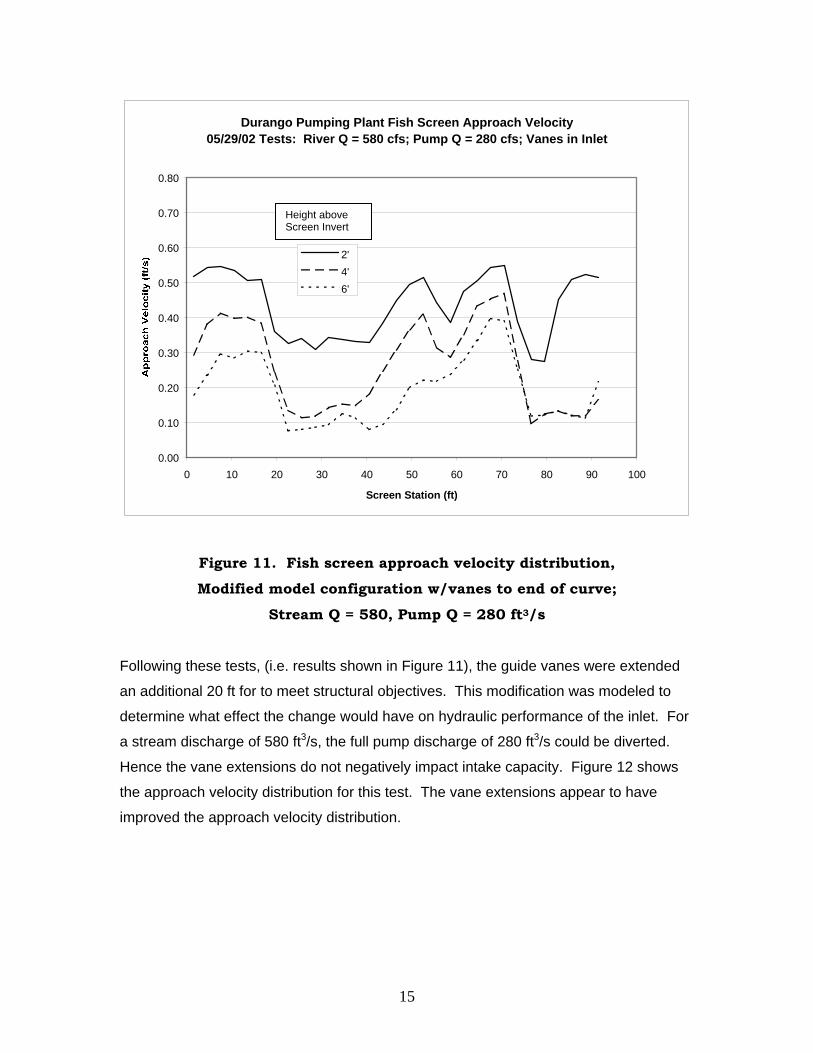
Following these tests, (i.e. results shown in Figure 11), the guide vanes were extended
an additional 20 ft for to meet structural objectives. This modification was modeled to
determine what effect the change would have on hydraulic performance of the inlet. For
a stream discharge of 580 ft3/s, the full pump discharge of 280 ft3/s could be diverted.
Hence the vane extensions do not negatively impact intake capacity. Figure 12 shows
the approach velocity distribution for this test. The vane extensions appear to have
improved the approach velocity distribution.
Height above Screen Invert
16
Durango Pumping Plant Fish Screen Approach Velocity06/25/02 Tests: River Q = 580 cfs; Pump Q = 280 cfs; Extended Vanes
0.00
0.10
0.20
0.30
0.40
0.50
0.60
0.70
0.80
0 10 20 30 40 50 60 70 80 90 100
Screen Station (ft)
2' 4' 6'
Figure 12. Fish screen approach velocity distribution
after installation of 20’ vane extensions
Stream Q = 580 ft3/s Pump Q = 280 ft3/s
A late modification was made to the vane configuration. To address maintenance
concerns, the vanes were reconfigured to maintain a minimum of 8’ 0” clearance
between vanes/walls at all locations upstream from the fish screen wall. In this
orientation, the left vane begins at the left pier in the inlet mouth and ends in the center
of the channel at a point normal to the upstream end of the fish screen wall. The right
vane begins at the right pier in the inlet mouth and extends downstream through the
curve bisecting the channel width between the left vane and the right wall. The right
vane ends where clearances between the right wall, the right vane and the left vane are
8’0”. Results of tests with this guide vane configuration, shown in Figure 13, indicate a
further improvement in approach velocity distribution along the fish screen.
Height aboveScreen invert
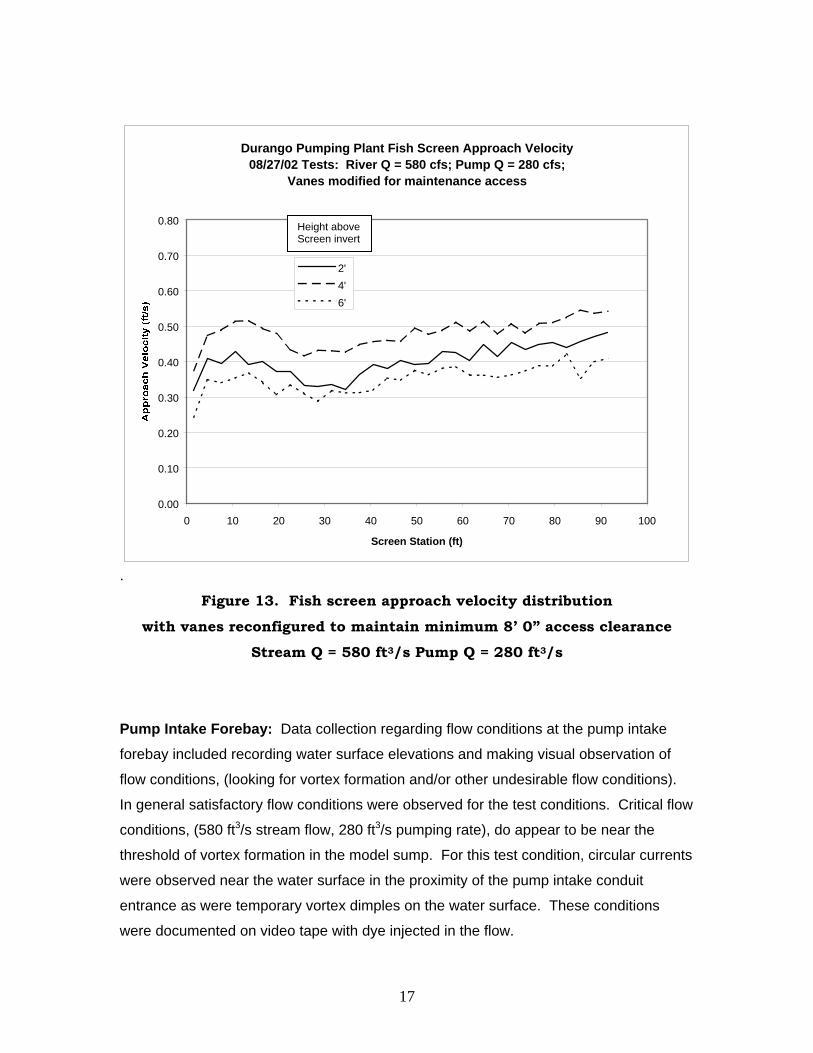
17
Durango Pumping Plant Fish Screen Approach Velocity08/27/02 Tests: River Q = 580 cfs; Pump Q = 280 cfs;
Vanes modified for maintenance access
0.00
0.10
0.20
0.30
0.40
0.50
0.60
0.70
0.80
0 10 20 30 40 50 60 70 80 90 100
Screen Station (ft)
2' 4' 6'
. Figure 13. Fish screen approach velocity distribution
with vanes reconfigured to maintain minimum 8’ 0” access clearance
Stream Q = 580 ft3/s Pump Q = 280 ft3/s
Pump Intake Forebay: Data collection regarding flow conditions at the pump intake
forebay included recording water surface elevations and making visual observation of
flow conditions, (looking for vortex formation and/or other undesirable flow conditions).
In general satisfactory flow conditions were observed for the test conditions. Critical flow
conditions, (580 ft3/s stream flow, 280 ft3/s pumping rate), do appear to be near the
threshold of vortex formation in the model sump. For this test condition, circular currents
were observed near the water surface in the proximity of the pump intake conduit
entrance as were temporary vortex dimples on the water surface. These conditions
were documented on video tape with dye injected in the flow.
Height aboveScreen invert
18
Observations made while adjusting to critical flow conditions provide additional
indications that critical flow conditions are near the vortex formation threshold. Small
temporary vortices was observed for near capacity pump discharge with water surface
level in the intake below the top of the fish screens, and for pump discharge greater than
280 ft3/s with intake water surface level at the top of the fish screens.
Corresponding performance between a prototype and model is a function of the degree
of similitude present. Complete similitude is a condition rarely possible to achieve due to
unavailability of modeling fluids with suitable properties, (including density, surface
tension, viscosity and elastic compressibility), to meet the scaling ratios. For free-
surface turbulent flow, accurate modeling is normally possible for geometrically similar
models if the Froude number ratio of model and prototype are equal and if the model has
a sufficiently high Reynolds number. [The Froude number is a dimensionless ratio
comparing gravity forces with inertial forces while the Reynolds number is a
dimensionless ratio comparing viscous forces with inertial forces.]
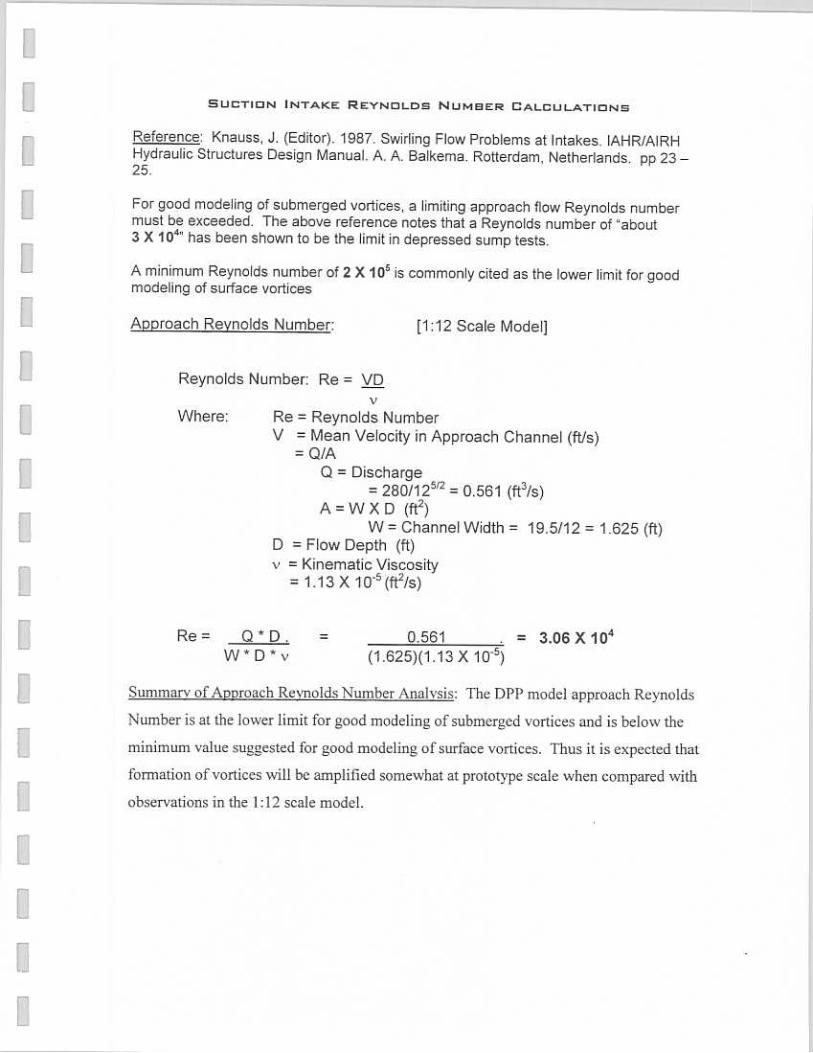
Near a pump intake entrance, the approach Reynolds number is of interest for modeling
possible formation of vortices. Values for approach Reynolds number that have been
identified as lower limits for good modeling are: 2 X 10⁵ for modeling surface vortices
and 3 X 10⁴ for modeling submerged vortices. The approach Reynolds number in the
pump intake forebay of the DPP model for critical flow conditions, (maximum pump
discharge and minimum operating water level in the intake), is 3.06 X 10⁴. This value is
near the lower limit for modeling submerged vortices and below the limit for modeling
surface vortices. Thus vortex formation in the prototype may be amplified compared
with observations with the DPP model. Calculation of the approach Reynolds number at
the pump intake forebay is included in the Appendix.
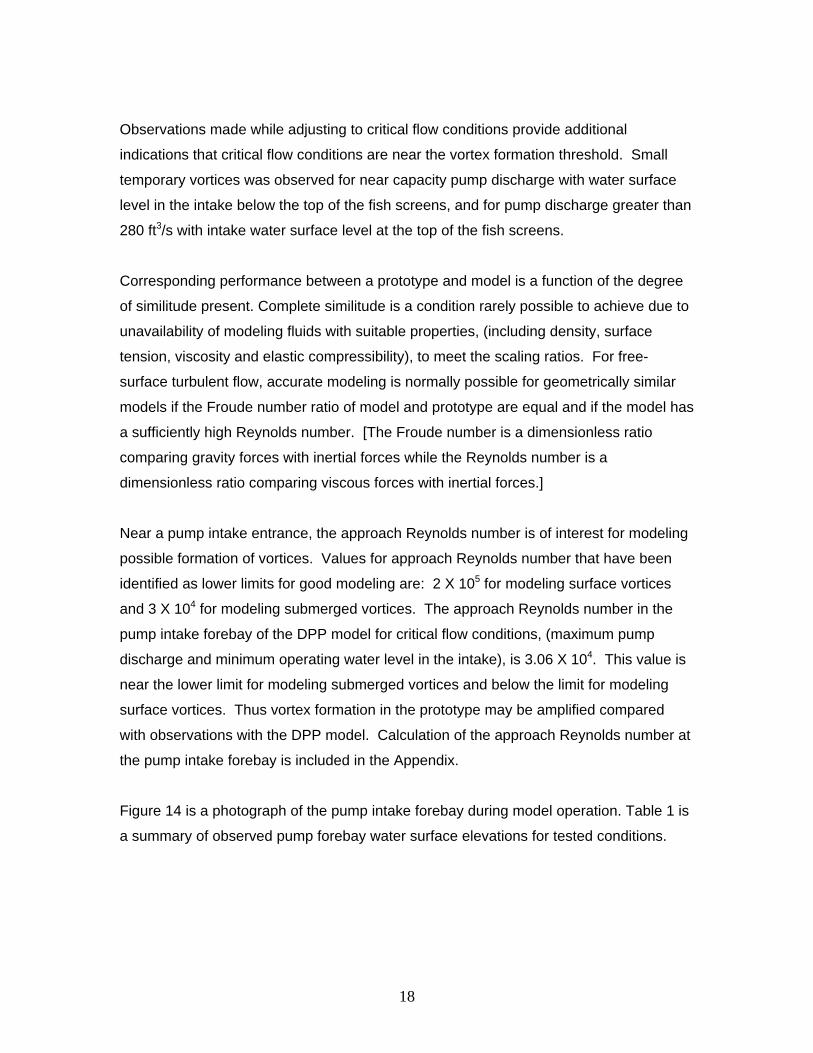
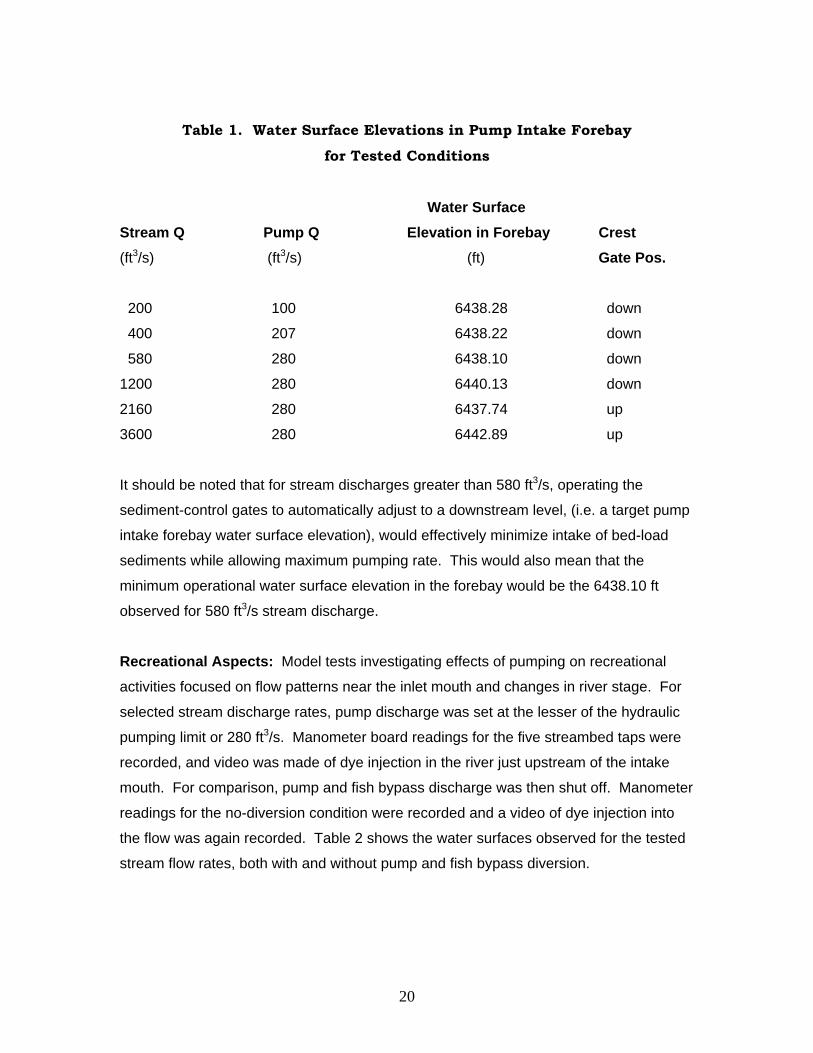
Figure 14 is a photograph of the pump intake forebay during model operation. Table 1 is
a summary of observed pump forebay water surface elevations for tested conditions.
19
Figure 14. Pump intake forebay during model operation
Flow conditions in photo: Stream Q = 580 ft3/s Pump Q = 280 ft3/s
20
Table 1. Water Surface Elevations in Pump Intake Forebay
for Tested Conditions
Water Surface Stream Q Pump Q Elevation in Forebay Crest (ft3/s) (ft3/s) (ft) Gate Pos.
200 100 6438.28 down
400 207 6438.22 down
580 280 6438.10 down
1200 280 6440.13 down
2160 280 6437.74 up
3600 280 6442.89 up
It should be noted that for stream discharges greater than 580 ft3/s, operating the
sediment-control gates to automatically adjust to a downstream level, (i.e. a target pump
intake forebay water surface elevation), would effectively minimize intake of bed-load
sediments while allowing maximum pumping rate. This would also mean that the
minimum operational water surface elevation in the forebay would be the 6438.10 ft
observed for 580 ft3/s stream discharge.
Recreational Aspects: Model tests investigating effects of pumping on recreational
activities focused on flow patterns near the inlet mouth and changes in river stage. For
selected stream discharge rates, pump discharge was set at the lesser of the hydraulic
pumping limit or 280 ft3/s. Manometer board readings for the five streambed taps were
recorded, and video was made of dye injection in the river just upstream of the intake
mouth. For comparison, pump and fish bypass discharge was then shut off. Manometer
readings for the no-diversion condition were recorded and a video of dye injection into
the flow was again recorded. Table 2 shows the water surfaces observed for the tested
stream flow rates, both with and without pump and fish bypass diversion.
21
Table 2. Animas River near DPP Intake: Water Surface Elevation Differential, with and without Pumping
Observed Water Surface Elevations
Streambed Tap # 1 2 3 4 5 Distance along stream from center of intake (ft) -103.6 4.9 131.9 210.8 285.1
Stream Q (ft3/s) Diversion (ft3/s) Gate Pos.
200 130 down 6438.45 6438.45 6438.21 6437.85 6437.67
200 0 n/a 6438.99 6438.99 6438.81 6438.33 6438.09
400 237 down 6438.93 6438.87 6438.69 6438.27 6438.09
400 0 n/a 6439.71 6439.65 6439.53 6438.81 6438.69
580 310 down 6439.29 6439.17 6439.05 6438.57 6438.33
580 0 n/a 6440.19 6440.13 6440.01 6439.17 6438.99
1200 310 down 6440.73 6440.73 6440.61 6439.53 6439.41
1200 0 n/a 6441.33 6441.33 6441.15 6440.01 6439.83
2160 310 up 6442.05 6442.05 6441.87 6440.67 6440.49
2160 0 n/a 6442.41 6442.41 6442.17 6440.91 6440.67
3600 310 up 6443.25 6443.25 6443.07 6441.57 6441.21
3600 0 n/a 6443.49 6443.49 6443.25 6441.63 6441.39
22
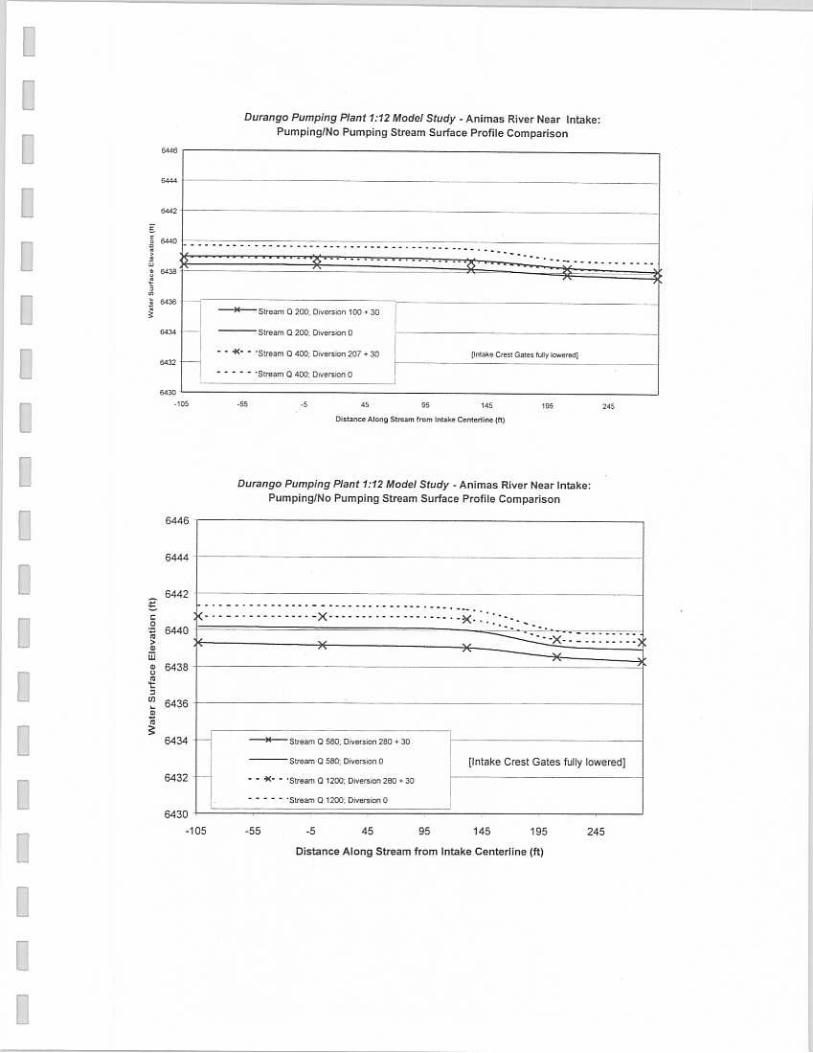
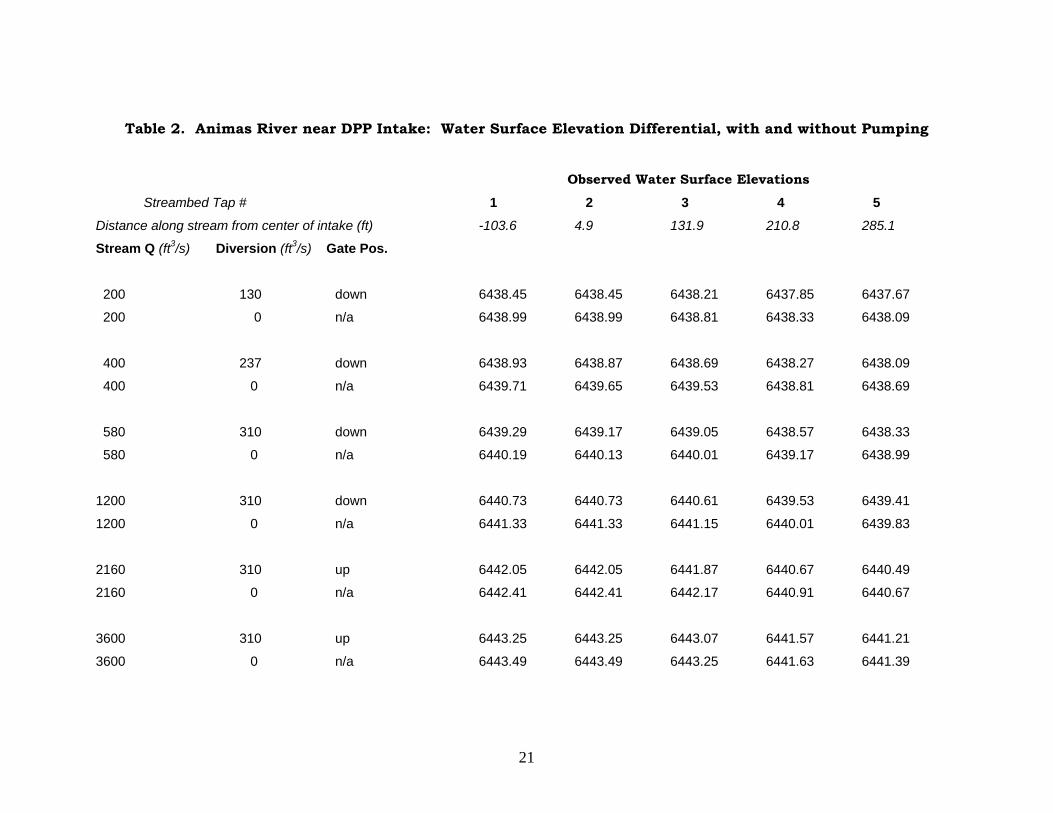
The greatest drop in water surface elevation was observed for a 580 ft3/s stream
discharge with a 280 ft3/s pump discharge. For this test condition, drop in surface
elevation near the intake was almost one foot. Figure 15 is a plot comparing water
surface elevations with and without diversion for a 580 ft3/s stream flow. Plots for all
tested conditions are included in the Appendix.
Durango Pumping Plant 1:12 Model Study - Animas River Near DPP Intake:Pumping/No Pumping - Stream Surface Profile Comparison
6430
6432
6434
6436
6438
6440
6442
6444
6446
-105 -55 -5 45 95 145 195 245
Distance Along Stream from Intake Centerline (ft)
Stream Q 580; Diversion 280 + 30
Stream Q 580; Diversion 0[Sediment weir gates fully lowered]
Figure 15. Diversion/no diversion - water surface elevation
profiles for 580 ft3/s stream discharge
Potential backwater effects due to outflow from the fish bypass conduit – not seen in the
model – should be considered. The returning fish bypass flow would comprise
approximately 10% of the downstream flow. This reach of the Animas River appears to
be a pool and riffle sequence with a riffle zone between 100 and 250 feet downstream
from the inlet. At lower stream discharge rates flow through the riffle would typically be
near critical or supercritical. Thus fish bypass backwater effects that would be observed
at the inlet for flow conditions shown in Figure 15 will likely be negligible.
23
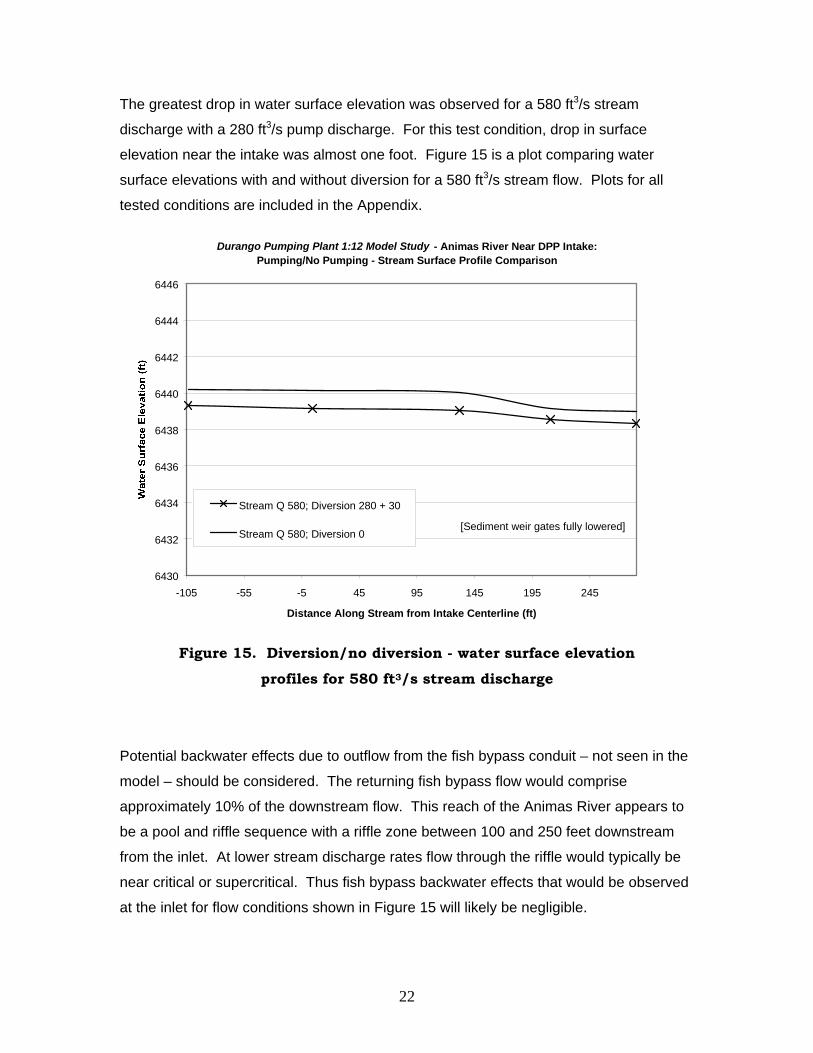
A copy of video of these tests has been forwarded to Barry Longwell of the Project Team
in Durango. Figure 16 is a photograph showing dye injection typical of the videoed tests.
(Flow in the Animas River is right to left as shown.)
Figure 16. Dye injection upstream of DPP intake
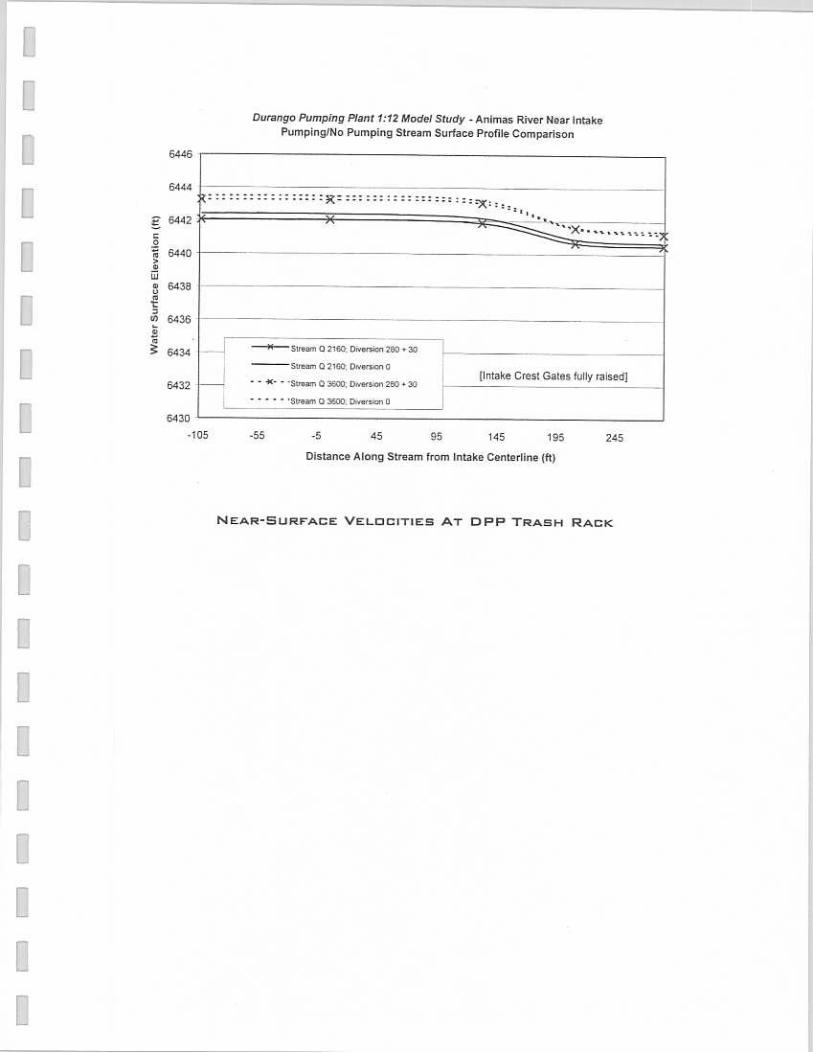
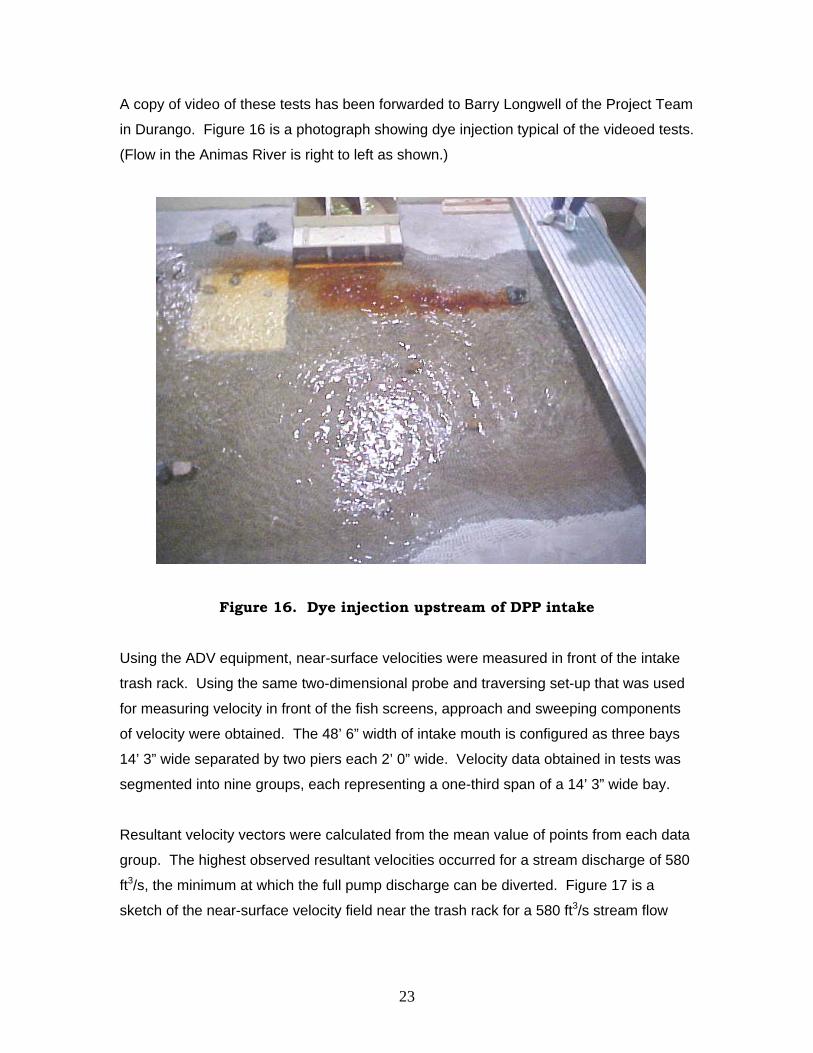
Using the ADV equipment, near-surface velocities were measured in front of the intake
trash rack. Using the same two-dimensional probe and traversing set-up that was used
for measuring velocity in front of the fish screens, approach and sweeping components
of velocity were obtained. The 48’ 6” width of intake mouth is configured as three bays
14’ 3” wide separated by two piers each 2’ 0” wide. Velocity data obtained in tests was
segmented into nine groups, each representing a one-third span of a 14’ 3” wide bay.
Resultant velocity vectors were calculated from the mean value of points from each data
group. The highest observed resultant velocities occurred for a stream discharge of 580
ft3/s, the minimum at which the full pump discharge can be diverted. Figure 17 is a
sketch of the near-surface velocity field near the trash rack for a 580 ft3/s stream flow
24
with a 280 ft3/s pump discharge, (+ 30 ft3/s fish bypass = 310 ft3/s total intake discharge).
Sketches of velocity vectors for all tested conditions is included in the Appendix.
Figure 17. Near-surface velocity field in front of DPP intake trash rack
Stream Q = 580 ft3/s; Diversion = (280 [Pump] + 30 [FBP]) = 310 ft3/s
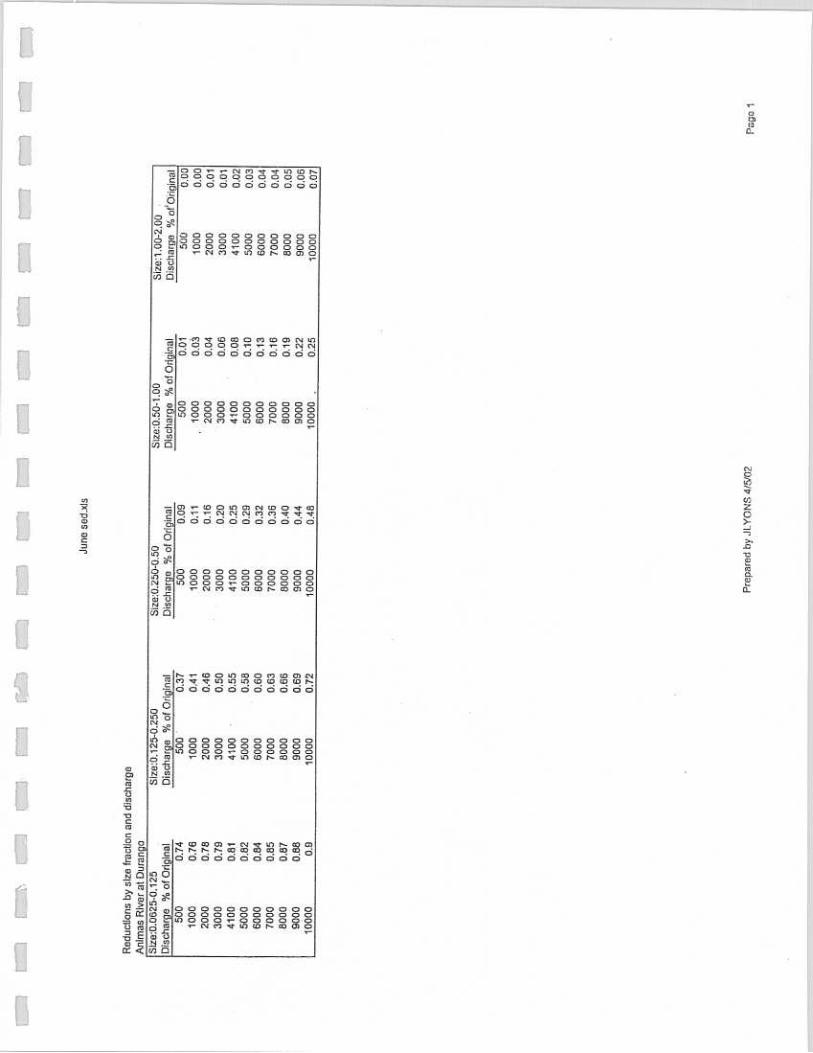
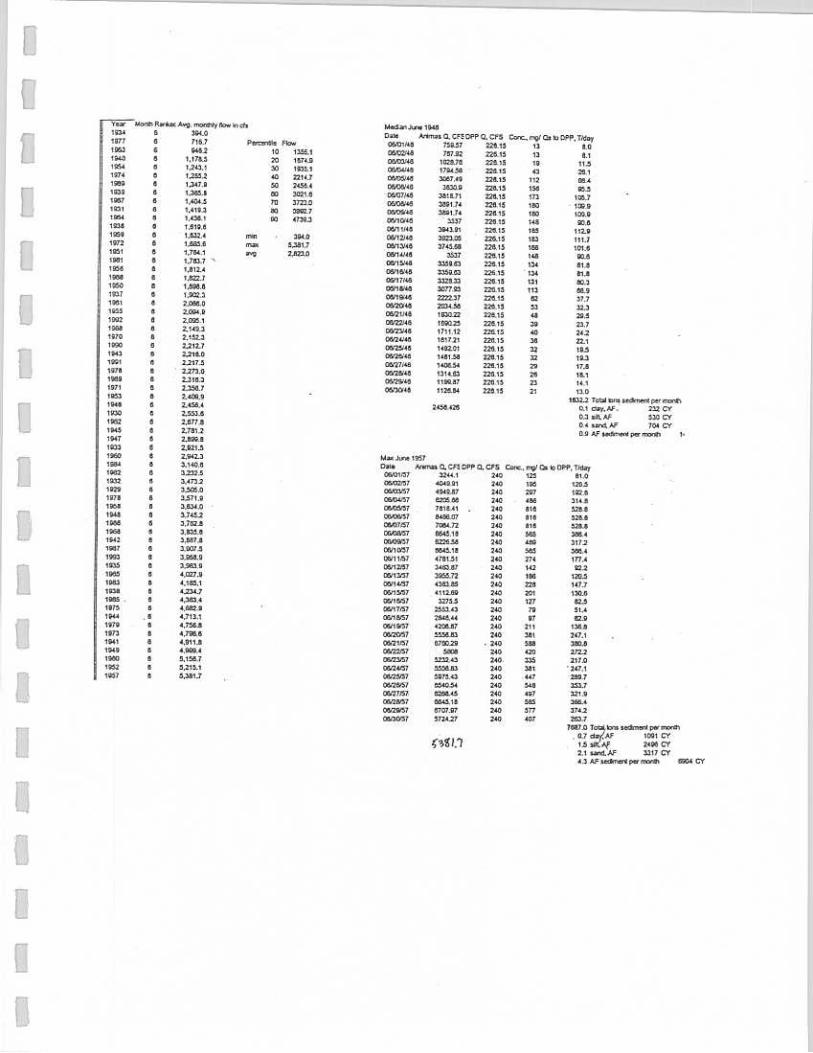
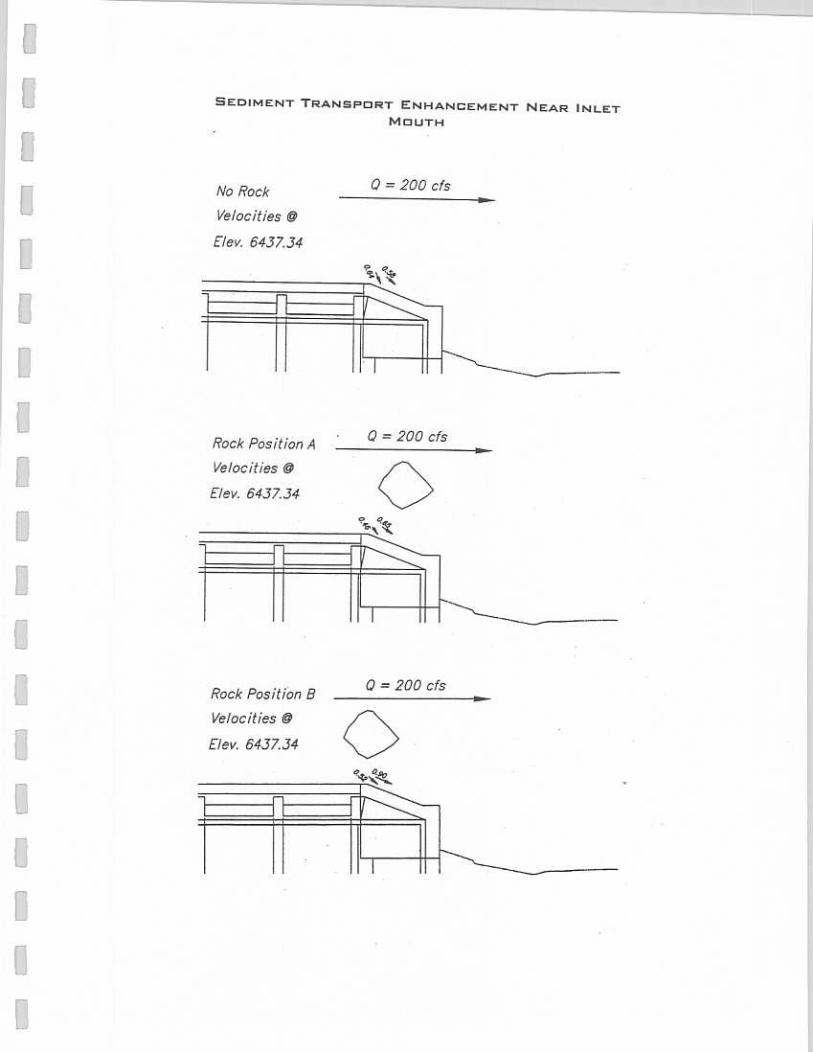
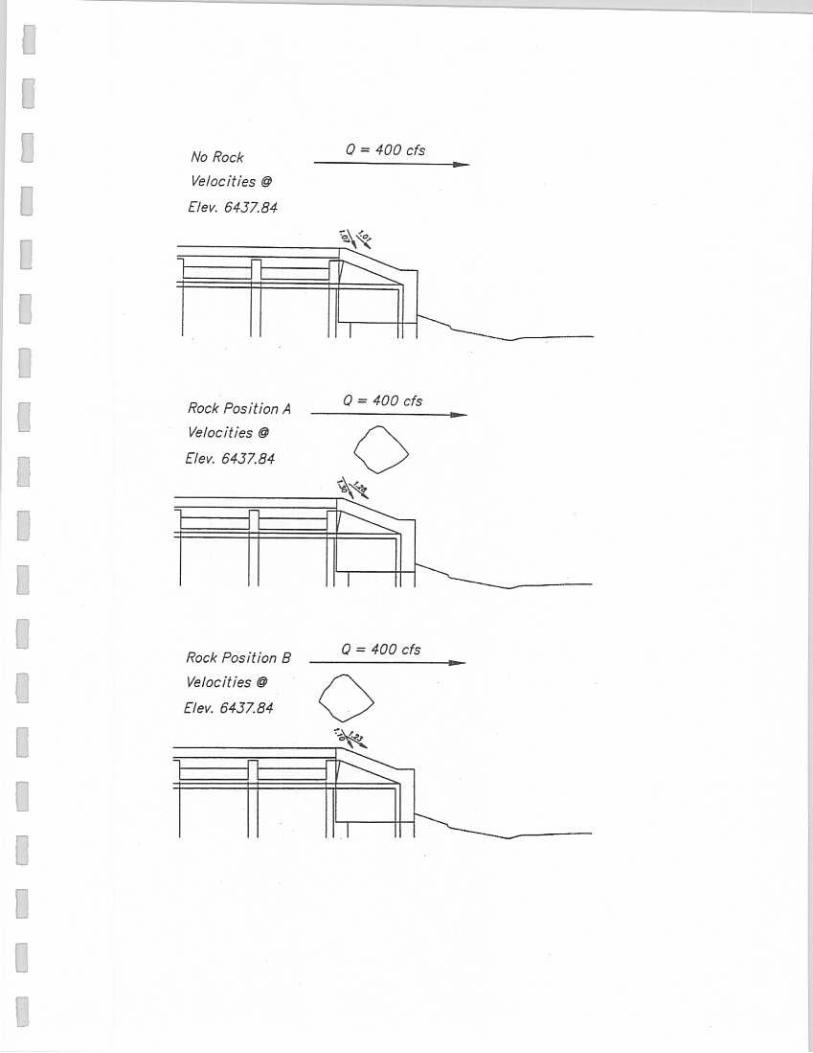
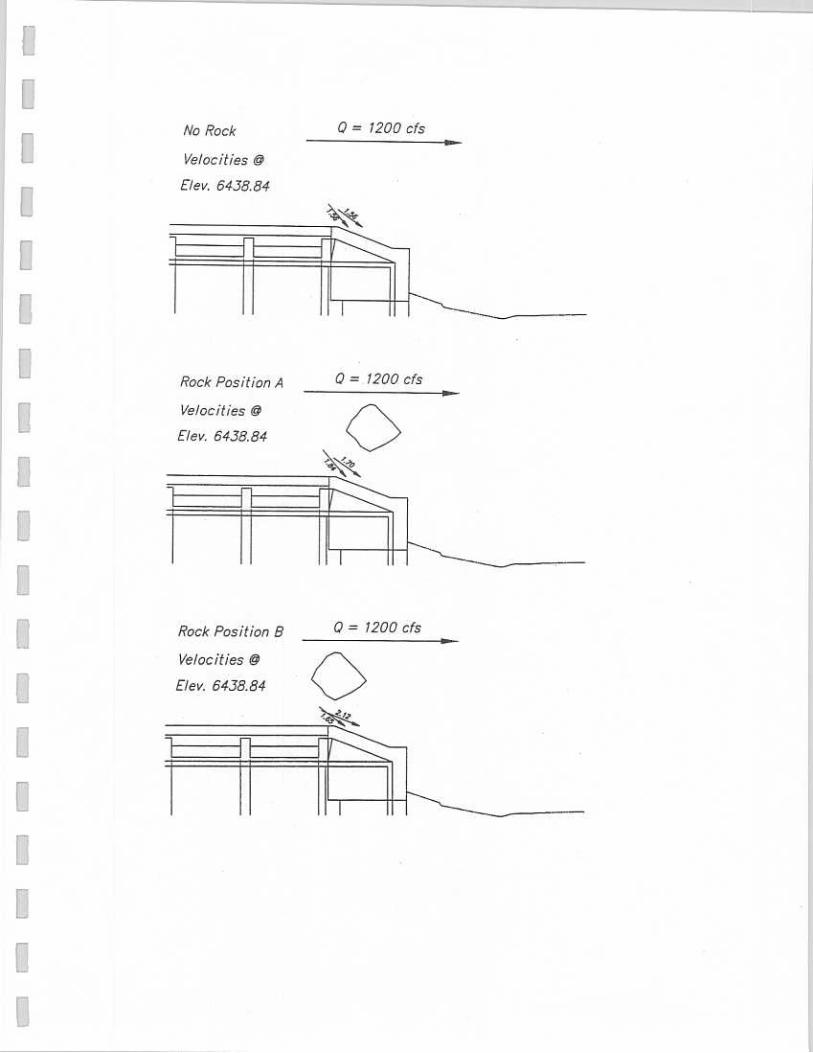
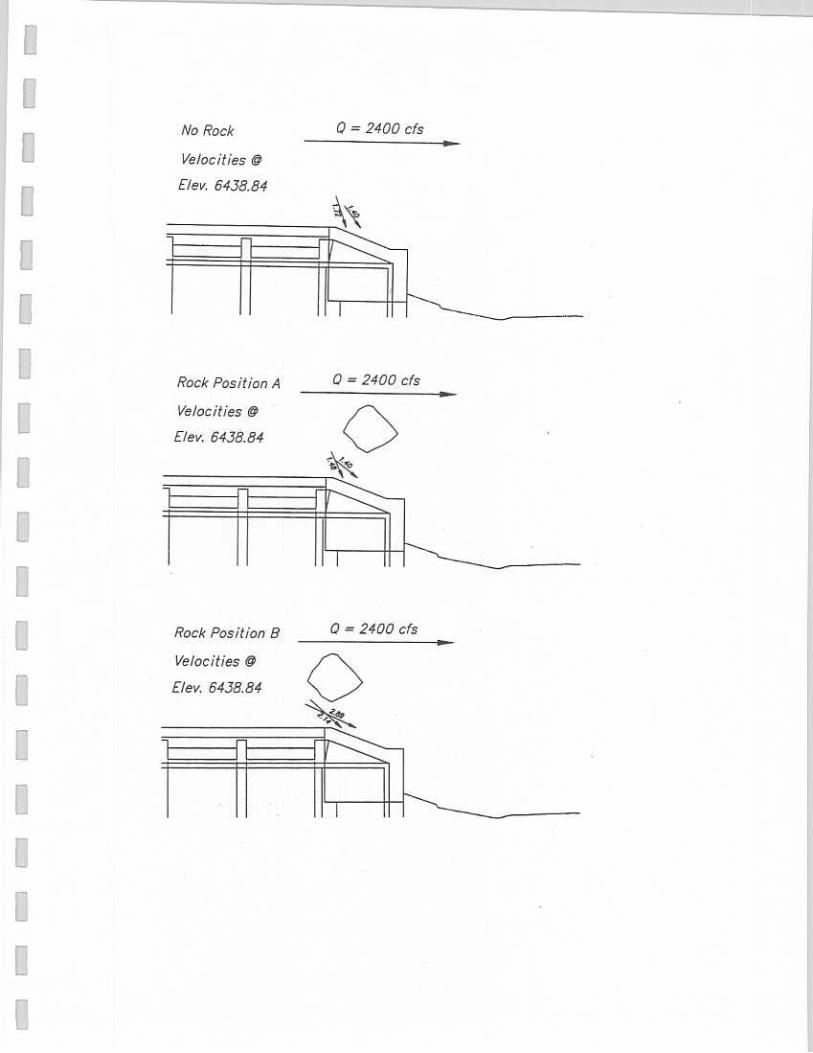
Sediment Transport Enhancement Tests: Concern was raised in the course of the
design process over the possibility that accumulation of bed-load sediments near the
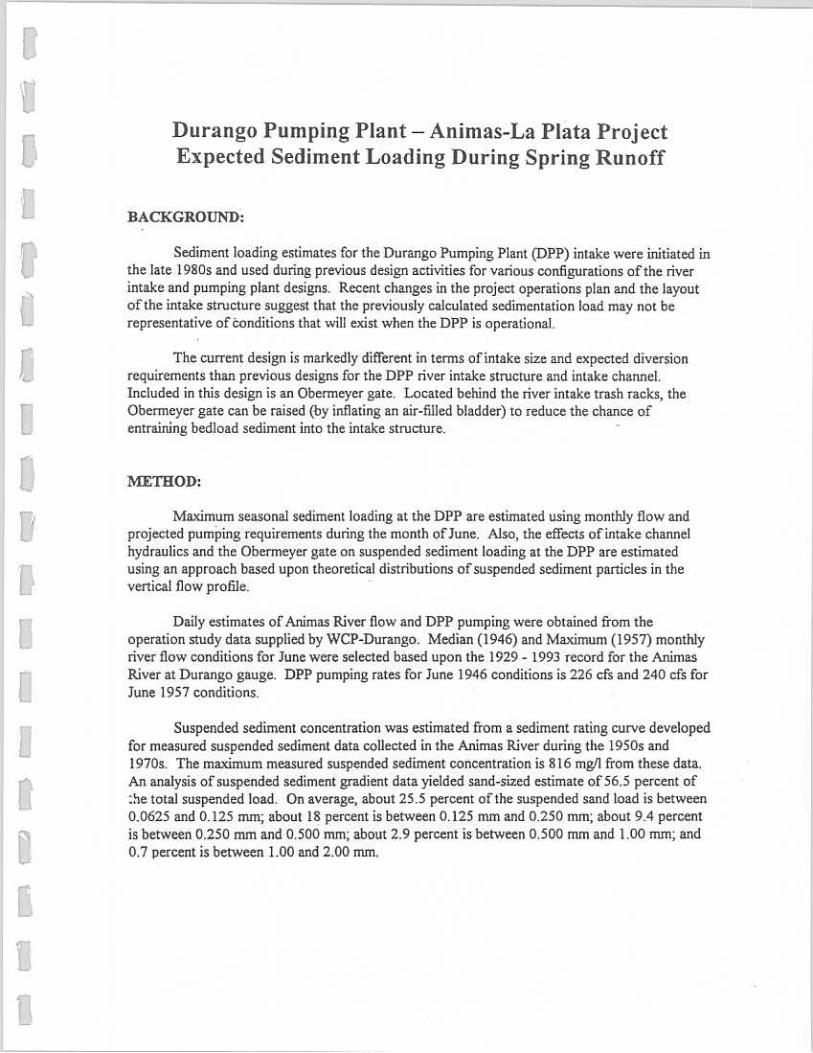
inlet could become a maintenance issue. Sediment loading projections are the topic of
an analysis dated May, 2002, and of a revised analysis dated September, 2002 by
Joesph Lyons, D-8850. Daily discharge estimates for the Animas River were examined
for water years 1929 – 1993. The month of June is identified as the highest average
daily flow month over the period of record. A flow of 2456 ft3/s is identified as the
median daily average June discharge and 5382 ft3/s as the maximum average daily June
discharge. Projected sediment loading for flow diverted into the DPP intake is based on
these discharges. Copies of both analyses are in the Appendix.
A limited scope model study to assess the effects of placing a large boulder in the
stream near the intake mouth was added to the testing schedule. A boulder of
approximately 12 ft diameter was placed near the bank downstream from the intake.
Tests were conducted with the boulder in two positions, and with the boulder removed.
Velocity was measured with the ADV at two locations, 5.4 ft and 8.4 ft downstream of the
25
left side of the intake opening, in line with the leading edge of the intake crest. Tests
were conducted with the maximum pump diversion allowable for the respective stream
discharges, with the crest gates fully lowered.
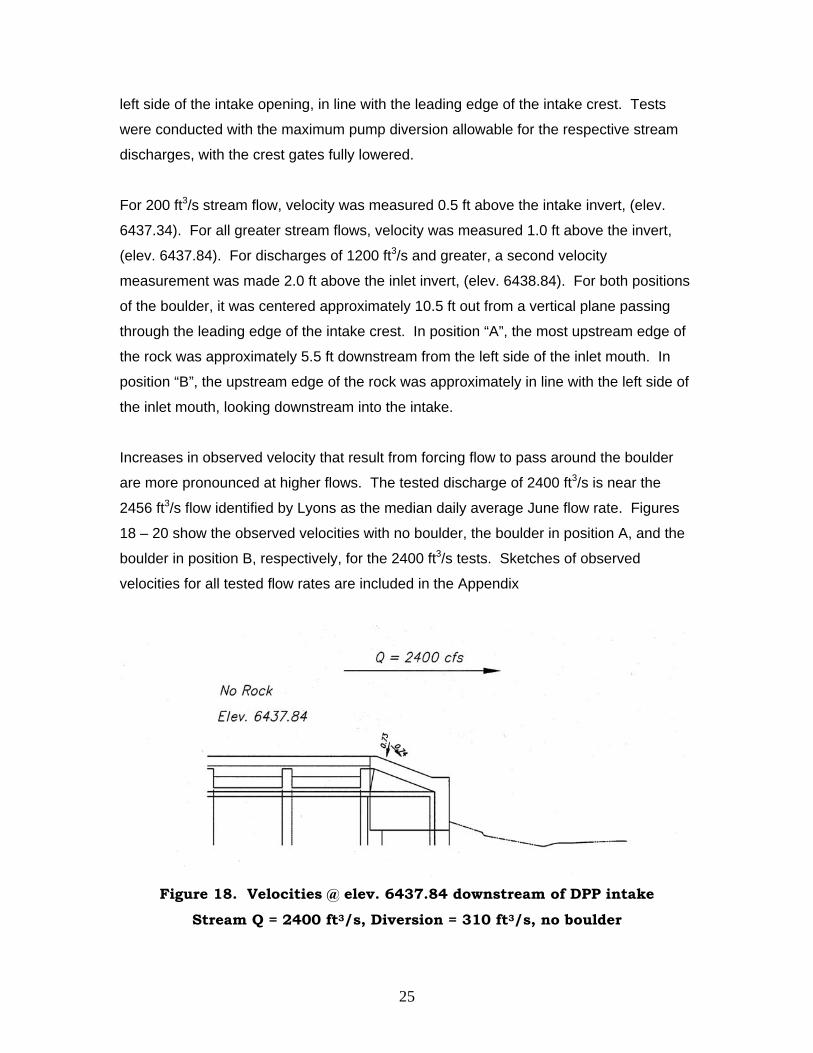
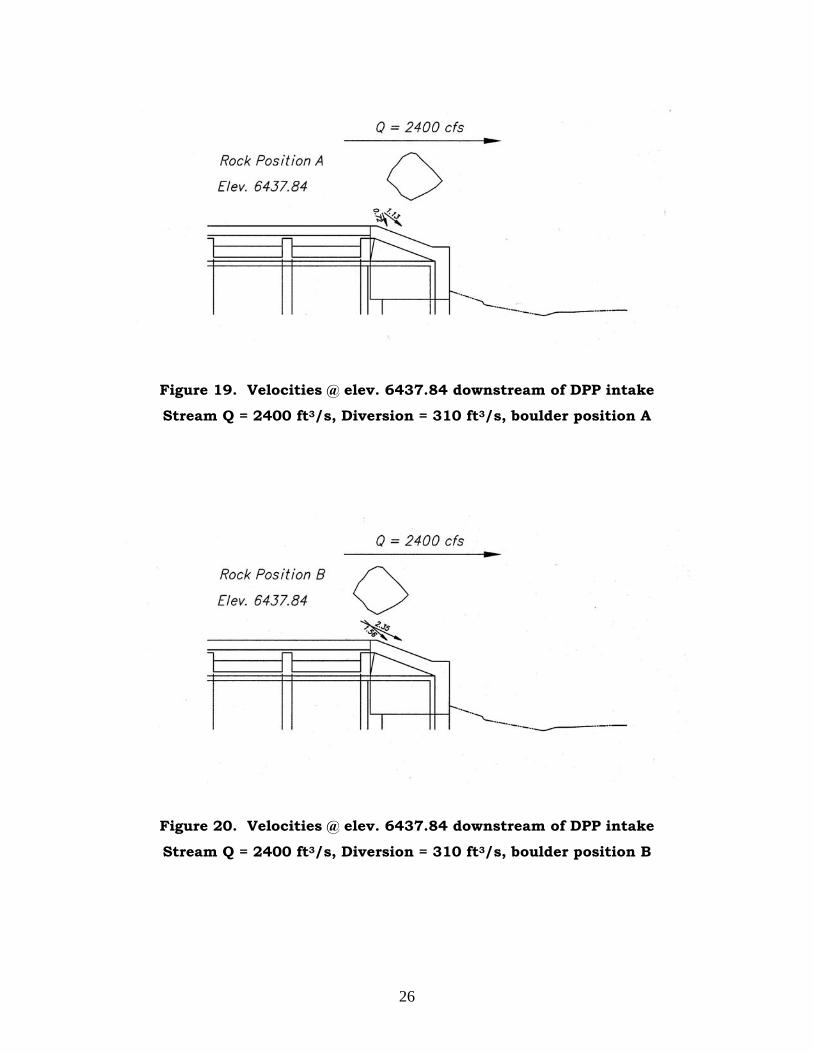
For 200 ft3/s stream flow, velocity was measured 0.5 ft above the intake invert, (elev.
6437.34). For all greater stream flows, velocity was measured 1.0 ft above the invert,
(elev. 6437.84). For discharges of 1200 ft3/s and greater, a second velocity
measurement was made 2.0 ft above the inlet invert, (elev. 6438.84). For both positions
of the boulder, it was centered approximately 10.5 ft out from a vertical plane passing
through the leading edge of the intake crest. In position “A”, the most upstream edge of
the rock was approximately 5.5 ft downstream from the left side of the inlet mouth. In
position “B”, the upstream edge of the rock was approximately in line with the left side of
the inlet mouth, looking downstream into the intake.
Increases in observed velocity that result from forcing flow to pass around the boulder
are more pronounced at higher flows. The tested discharge of 2400 ft3/s is near the
2456 ft3/s flow identified by Lyons as the median daily average June flow rate. Figures
18 – 20 show the observed velocities with no boulder, the boulder in position A, and the
boulder in position B, respectively, for the 2400 ft3/s tests. Sketches of observed
velocities for all tested flow rates are included in the Appendix
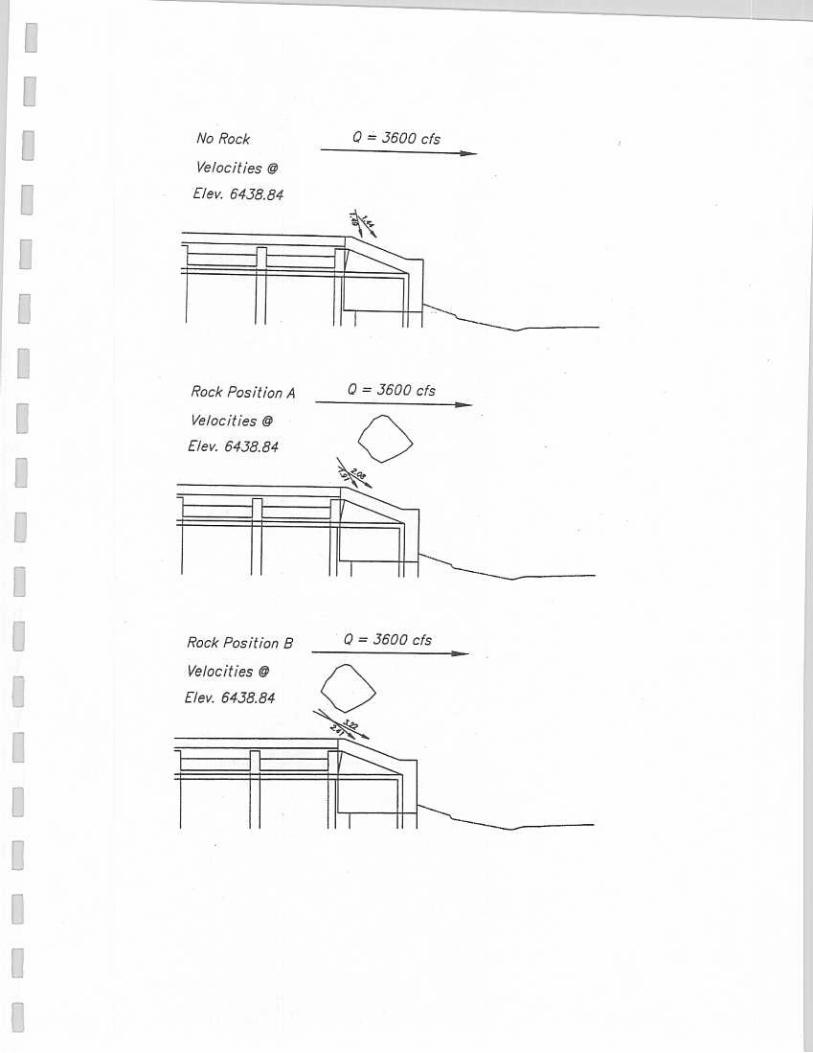
Figure 18. Velocities @ elev. 6437.84 downstream of DPP intake
Stream Q = 2400 ft3/s, Diversion = 310 ft3/s, no boulder
26
Figure 19. Velocities @ elev. 6437.84 downstream of DPP intake
Stream Q = 2400 ft3/s, Diversion = 310 ft3/s, boulder position A
Figure 20. Velocities @ elev. 6437.84 downstream of DPP intake
Stream Q = 2400 ft3/s, Diversion = 310 ft3/s, boulder position B
27
As indicated in Figures 18-20, an appreciable increase in local velocity was observed at
the points of measurement with the boulder placed in the stream for a 2400 ft3/s stream
discharge. A more expansive modeling program may be warranted to accurately assess
the potential of using a boulder placed near the intake to enhance sediment transport
past the intake.
SUMMARY
In the model testing that has been completed, investigations were carried out in the four
focus areas identified at the outset of the project. Design modifications that improve
intake capacity and distribution of flow through the fish screen are direct results of the
modeling program being an integral part of the design process. Suitability of the design
of the pump intake forebay was confirmed as a concurrent activity with tests focusing on
other facets of the project. A body of information was compiled documenting impacts of
diversion on stream flow and stream currents that potentially impact recreational uses of
the Animas River. In an additional activity, a mechanism that may have potential for
enhancement of sediment transport past the intake was studied in a limited-scope
investigation.
Two modifications proposed late in the design process were tested to determine whether
either would cause negative impact when compared with previous test results. Results
of these tests, (see Figures 7 and 13) indicate no negative impacts on performance
would result from the modifications. Due to time limits in the project schedule, it wasn’t
possible to repeat the full spectrum of tests with the late modifications. The similarity of
data sets generated before and after the late modifications were incorporated indicates
that information produced with the model as configured prior to these two changes
represents model performance with the modifications with reasonable accuracy.
The 1:12 scale physical model has played an integral role in the “fast track” design
process employed for the Durango Pumping Plant component of the Animas – La Plata
project. It may have significant additional utility to the project should additional studies
be undertaken to examine issues such as sediment accumulation in the river near the
intake mouth and within the intake itself.

APPENDIX