Embed Size (px)
Citation preview
Durham Research Online
Deposited in DRO:
08 November 2011
Version of attached �le:
Published Version
Peer-review status of attached �le:
Peer-reviewed
Citation for published item:
Tymms, P. and Merrell, C. and Thurston, A. and Andor, J. and Topping, K. and Miller, D. (2011) 'Improvingattainment across a whole district : school reform through peer tutoring in a randomized controlled trial.',School e�ectiveness and school improvement., 22 (3). pp. 265-289.
Further information on publisher's website:
http://dx.doi.org/10.1080/09243453.2011.589859
Publisher's copyright statement:
This is an electronic version of an article published in Tymms, P. and Merrell, C. and Thurston, A. and Andor, J. andTopping, K. and Miller, D. (2011) 'Improving attainment across a whole district : school reform through peer tutoringin a randomized controlled trial.', School e�ectiveness and school improvement., 22 (3). pp. 265-289. Schoole�ectiveness and school improvement is available online at:http://www.tandfonline.com/openurl?genre=articleissn=0924-3453volume=22issue=3spage=265
Additional information:
Use policy
The full-text may be used and/or reproduced, and given to third parties in any format or medium, without prior permission or charge, forpersonal research or study, educational, or not-for-pro�t purposes provided that:
• a full bibliographic reference is made to the original source
• a link is made to the metadata record in DRO
• the full-text is not changed in any way
The full-text must not be sold in any format or medium without the formal permission of the copyright holders.
Please consult the full DRO policy for further details.
Durham University Library, Stockton Road, Durham DH1 3LY, United KingdomTel : +44 (0)191 334 3042 | Fax : +44 (0)191 334 2971
http://dro.dur.ac.uk
1
Improving attainment across a whole district: school reform through peer
tutoring in a randomized controlled trial
Peter Tymmsa*
,Christine Merrellb, Allen Thurston
c, John Andor
b, Keith Topping
d and
David Millerd
a School of Education, Durham University
bCentre for Evaluation and Monitoring,
Durham University; cInstitute for Effective Education, University of York;
dSchool of
Education, Dundee University
*Corresponding Author. Email [email protected]

1
Improving attainment across a whole district: school reform through peer
tutoring in a randomized controlled trial
Abstract
Districts are an important unit for administrative purposes but they vary little in
their impact on students‟ attainment, at least in the UK. Further, government
attempts to raise attainment are often disappointing. This project aimed to engage
schools in reform to change students‟ attainment and attitudes in schools across a
whole district. The intervention, peer tutoring, has a good research pedigree in
small scale studies but scaling it up to district-level implementation has not been
rigorously evaluated. Over a two years, 129 elementary schools in one Scottish
district were randomly assigned to different interventions. The implementation
was not perfect but the results were positive with respect to cross age tutoring
which had Effect Sizes of about 0.2.
Despite limitations the study demonstrates that it is possible to carry out a
clustered RCT on a large scale working with districts and suggests that peer
tutoring has promise when scaled up.
Keywords: peer tutoring; learning; reading; maths; school reform
2
Introduction
Two issues motivated the work behind this study. Firstly, evidence suggests that it is
hard for large-scale top-down reform to improve students‟ attainment. Expensive
policy initiatives often have little impact (see for example Haney, 2000; Tymms,
2004a). Tymms and Merrell (2007) reviewed evidence of standards and quality in
English primary schools from the introduction of the Education Reform Act in 1988
up to 2007. They concluded that despite the Act and many initiatives introduced
nationally since that time, including national literacy and numeracy strategies, there
was virtually no improvement in reading standards and a small improvement in maths.
Despite considerable variation in raw data, evidence points to little variation in
students‟ attainment across districts once controls are made for prior attainment
(Tymms et al., 2008) or backgrounds (Willms, 1987). Secondly, while randomized
controlled trials (RCTs) conducted at the student level are common enough to have
generated valuable systematic reviews, policy is made at a higher level (often at
district, state or national level) and it would be premature to assume that interventions
with an established evidence base at the student level will be effective if introduced as
policy for school reform (Tymms, Merrell and Coe, 2008). Following Slavin and
Smith (2009) it is anticipated that implementing a programme at policy level is likely
to produce smaller gains than in the optimum conditions usually encountered on a
smaller scale.
This paper describes an RCT introduced at the level of a Scottish Education
Authority (school district). The technique held the promise of large-scale cost-
effective impact and had not previously been evaluated on such a scale in the UK.
Why was a district in Scotland chosen?
At the time of the study, the curriculum in Scotland was not as prescriptive as in many
countries and schools were given a reasonable amount of freedom. Additionally,
Scottish district educational officers tended to work closely with their schools and
their support was an important factor for successfully implementing the RCT.
3
Peer tutoring
Topping and Ehly (1998) provide a theoretical model of how peer tutoring promotes
cognitive gains. The model addresses organizational/structural features of the learning
interaction, such as: maximising time on/engaged with task; the need for tutor and
tutee to elaborate goals/plans; the individualization of learning and immediacy of
feedback; the excitement and variety of a different kind of learning interaction. In the
model peer tutoring involves support and scaffolding from a peer tutor, necessitating
management of activities within the „Zone of Proximal Development‟. This results in
co-construction (the tutor acts as co-learner and any potential damaging excess of
challenge is minimized). Tutors manage and modulate the information processing
demands upon the learner. The tutor provides a cognitive model of competent
performance. The cognitive demands upon the tutor are great. They have to monitor
learner performance and detect, diagnose, correct and manage misconceptions/errors.
Heavy demands are made upon the communication skills of peers in this relationship,
both the tutors and tutees.
For the tutee a trusting relationship with a peer tutor who holds no position of
authority might facilitate self-disclosure of ignorance/misconception. Trust is reported
to be very important to allow learners to take risks and expose their learning and
misconceptions to each other (Lahno, 2001). This should facilitate diagnosis and
correction. These sub-processes feed into a larger onward process of extending
declarative knowledge, procedural skill, and conditional and selective application of
knowledge and skills, by, adding to and extending current capabilities (accretion),
modifying current capabilities (re-tuning), and rebuilding new understanding
(restructuring in areas of completely new learning or cases of gross misconception)
(Rumelhart & Norman,1983). This should lead to the joint construction of a shared
understanding between tutor and tutee.
4
Peer tutoring might facilitate a greater volume of engaged and successful
practice, leading to consolidation, fluency and automaticity of core skills. In particular
this may occur for the tutor as they have to prepare and deliver teaching to the tutee
(Thurston & Topping, 2007). As this occurs, both tutor and tutee give feedback to
each other. Spontaneous feedback that may be less focused on the actual outcomes of
learning is likely to occur in the earlier stages. As the learning relationship develops,
both tutor and tutee should begin to become more consciously aware of what is
happening in their learning interaction, and consequently more able to monitor and
regulate the effectiveness of their own learning strategies. This development into fully
conscious explicit and strategic meta-cognition is likely to promote more effective
onward learning. It should also make both tutor and tutee more confident that they can
achieve even more, and that success is the result of their own efforts. The conclusion
of this is that the process is not linear, but cyclical and represents a „reflect and
connect‟ process. The affective and cognitive outcomes feed back into the originating
sub-processes to form a positive reinforcement loop.
Peer tutoring is a specific form of peer learning. It generally involves one
student teaching another where pairs are typically of differing academic standing and
sometimes differing ages. They can be distinguished from „collaborative learning‟
which implies a more symmetrical relationship in terms of the academic levels of the
peers. Peer tutoring normally refers to two pupils working in a dyad as tutor and tutee,
within which each individual has defined roles with protocols for interaction.
There have been a number of systematic reviews and meta-analyses in the
area. Cohen, Kulik and Kulik (1982), reported moderate academic gains overall and
larger effects in more structured programs and programs of shorter duration. Effects
were also larger when lower level skills were taught and tested on examinations, and
for mathematics rather than reading. Effects were larger on locally developed than on
nationally standardized tests. Other studies reiterated these positive outcomes
(Kalkowski, 1995; Rohrbeck, Ginsburg-Block, Fantuzzo, & Miller, 2003). Rohrbeck
5
et al. (2003) found more positive results for younger students and for those coming
from lower income families, urban setting and minorities. Fitz-Gibbon (1992) noted
greater gains for tutors. Evaluations of peer tutoring programs for mathematics have
shown positive impacts on attainment (Fantuzzo, Polite & Grayson, 1990;
Greenwood, Delquadri & Hall, 1989; Gyanani & Pahuja, 1995,) and also on student‟s
self-reported levels of mathematics ability (Fantuzzo, King & Heller, 1992).
The claims for positive outcomes for both the tutors and the tutees extend
beyond the academic. Ginsburg-Block, Rohrbeck and Fantuzzo (2006) indicated that
peer assisted learning which focused on academic outcomes could also improve social
and self-concept outcomes in elementary schools, although the ESs were small to
moderate. Foot, Shute, Morgan and Barron (1990), and Utley and Mortweet (1997)
found that cross-age tutoring enhanced the social skills of the students involved in the
sessions. Studies by Gaustad (1993), Kalkowski (2001), Topping (1988), and Utley
and Mortweet (1997) suggested that cross-age tutoring enhanced self-esteem and
social interaction and resulted in a more cooperative classroom and an improved
school atmosphere.
In a small-scale study it was reported that low-income underachieving school
students in three elementary school settings increased their arithmetic performance
with same-age peer tutoring. Students doubled their test scores during the intervention
(Fantuzzo, Polite & Grayson, 1990). Significant gains in spatial ability were reported
in a sample of 214 eleven to sixteen-year-old pupils in a three-month same-age peer
learning intervention (Gyanani & Pahuja, 1995). Same-age peer tutoring in
mathematics was reported to have a positive impact on mathematical ability and
student self-reported levels of maths ability when compared to control groups in a
randomized trial of 64 nine-year-old pupils (Fantuzzo, King & Heller, 1992).
Significant gains in mathematics were reported for a sample of 175 six to ten-year-old
children for socio-economically disadvantaged children compared to control children
in a class wide peer tutoring initiative (Greenwood, Delquadri & Hall, 1989).
6
Fixed role cross-age tutoring has also been shown to be effective in raising
pupil achievement. One finding associated with cross-age tutoring reported by
researchers is that, in the process of tutoring, tutors reinforce their own knowledge
base and skills. That is, tutors learn the material thoroughly and in a way that is more
easily remembered (Fitz-Gibbon, 1978). Results presented in previous meta-analyses
of Randomized Controlled Trials (RCTs) of Peer Learning (Cohen, Kulik & Kulik,
1982; Cook, Scruggs, Mastropieri & Casto, 1986) showed positive effect sizes (ES) in
the range of 0.40 and 0.80. Cohen et al. (1982) reported in a meta-analysis of 52
cross-age tutoring studies that tutors generally exhibited a small, but significant
improvement in academic performance; they found the average effect size for the
tutors to be 0.33. Tutoring effects were larger in more structured programs, and in
tutoring programs of shorter duration. The effects were also larger when lower level
skills were taught and tested on examinations. Effects were larger on locally
developed tests and smaller on nationally standardized tests. In 33 of the 38 studies
investigating effects in this area, students who served as tutors performed better than
did control students on examinations in the subject being taught.
Some studies have found positive effects for use of high intensity studies of
peer tutoring of 30 minutes per day, five days per week. However, as intensity
increases so do the time and resources required to implement an intervention. One
consequence of this is reported to be that it can become difficult to support students in
a typical classroom (Barnett, Daly, Jones, & Lentz, 2004). In a class-wide peer
tutoring initiative with five volunteer elementary school teachers running peer tutoring
over 19 weeks, increased spelling outcomes were positively associated with higher
levels of „intensity‟ of treatment. Analysis consisted of post-hoc comparison of
implementation intensity data with outcomes (Greenwood, Terry, Arreaga-Mayer &
Finney, 1992). Higher intensity peer tutoring was reported to raise attainment levels in
children with additional support needs, but to have a less pronounced effect on those
without (Beirne-Smith, 1991). One issue for previous studies of peer tutoring is that
levels of intensity of intervention often vary between studies (Fuchs, Fuchs, Mathes &
7
Simmons, 1997). Few studies have specifically set out to examine intensity as a
dependent variable in a randomized trial of peer tutoring.
This study used specific techniques. The first was Paired Reading, which is
characterized by specific role taking as tutor or tutee, with high focus on error
correction and clear procedures for interaction, in which participants receive training.
Peer tutoring with explicit reading strategy instruction has been reported to raise
reading attainment levels (Van Keer, 2004; Van Keer, & Verhaeghe, 2005). When
Paired Reading is implemented with reasonably high integrity, results are typically
good (Topping, 1987, 1998). Paired Reading focuses the contact and feedback from
tutor to tutee on error correction (Topping, 1998). For optimal success during peer
tutoring in literacy it seems that there needs to be an attainment differential between
tutors and tutees (Duran & Monereo, 2005). Without the appropriate gap both tutor
and tutee can be under stimulated (Greenwood, Terry, Arreaga-Mayer & Finney,
1992). In terms of the amount of time required, Fuchs, Fuchs, Mathes and Simmons
(1997) indicated positive effects for Peer-Assisted Learning Strategies techniques
using class wide reciprocal peer tutoring in reading amongst grade 2-6 students in
elementary and middle schools when implemented for 35 minutes per day, 3 days a
week over a 15 week period.
The second technique was Duolog mathematics, which requires the tutor to
encourage the tutee to solve the mathematics questions with high emphasis on
developing metacognitive awareness of the processes and strategies being utilized
(Topping, Kearney, McGee,& Pugh, 2004). In a small-scale study it was reported that
low-income underachieving school students in three elementary school settings
increased their arithmetic performance due to reciprocal peer tutoring. Students
doubled their test scores during the intervention (Fantuzzo, Polite & Grayson, 1990).
Significant gains in spatial ability were reported in a sample of 214, eleven to sixteen-
year-old students in a three-month reciprocal role peer learning intervention (Gyanani
& Pahuja, 1995). Significant gains in mathematics were reported for a sample of 175
six to ten-year-old children for socio-economically disadvantaged children compared

8
to control children in a class wide peer tutoring initiative (Greenwood, Delquadri &
Hall, 1989). However, the specific technique of cross-age fixed role Duolog maths
was less well researched than Paired Reading prior to this study.
Evidence of School reform
Ways to achieve systematic school reform have been well researched. A study
involving the implementation of 395 high schools in the USA found that it was often
difficult to change pupil instruction during school reform. One of the major issues in
determining the ability of school reform to change student instruction was whether or
not the school has systemically subscribed to the proposed reform model (Ravitz,
2010). To aid this process, feedback from school reform partners to schools was
reported to be important in a study of ten schools undertaking reform in the aftermath
of hurricane Katrina in the USA (Beabout, 2010). This feedback was also reported to
be important in a study of four middle and high schools in the Southern USA. In this
study, performance management feedback methods were reported to be important in
making explicit links between school reform aims and changes in classroom
instruction practices. Methods utilised included observations and assessment feedback
to teachers (Kaufman, 2010).
The importance of school leaders and funders of reform integrating structural
arrangements and instructional practices has been previously reported to lead to
accelerated rapid and dramatic improvement in school performance (Kuo, 2010).
School district support was reported to be essential to effective school reform in a
USA school. In addition the importance of not having too many new initiatives going
on at the same time was also highlighted. It appeared better to keep the focus of both
the school district and the school on a small and focused initiative (Bronson, 2010). In
a study focusing on a school district wide initiative to engage learners at risk in school
it was concluded that four issues influence the effectiveness of school district wide
reform: (1) There needed to be coherence of a collective moral purpose and
compelling conceptualization regarding the theory of action; (2) There must be
alignment and interconnectedness of the organizational constructs and structures

9
between the school district and what is required to support schools; (3) Building
capacity needed to be seen as a core function throughout the district by district
managers; (4) There was an emerging understanding of the 'defined autonomy'
between the district expectations and each school's unique local circumstances
(Gifford, 2010). Head teachers can play a pivotal role in facilitating school reform. It
was reported that head teachers who ensured broad participation and representation
helped facilitate school reform (Muijs & Harris, 2006). However, whilst the effect of
school leadership was reported to have a significant effect on 2290 teachers‟
classroom practice in a 4-year evaluation of England‟s National Literacy and
Numeracy Strategies in 665 English primary schools, it did not ultimately influence
pupil attainment during the same period (Leithwood & Jantzi, 2006).
The school context within which reform is taking place can have a significant
influence on whether school reform is successful. A study reporting data from 57
schools undertaking school-wide reading reform indicated significant differences
between successes at the school level. The factor that appeared to account for this
variance was implementation integrity. It was reported that although self-report of
implementation integrity could not account for differences at the school level
(questioning the validity of such a measure) the external tools to assess validity were
important (Fien, Kame‟enui & Good, 2009). The educational context within which
school reform takes place can influence outcomes. Factors that influence the reform
outcomes have been reported to include improvement culture and improvement
processes (Reezigt & Creemers, 2005). The way in which schools adopt reform has
been developed into a taxonomy for change agents. This taxonomy identifies four
stages to school reform (Wetherill & Applefield, 2005). Firstly schools are in a
premature change state, there is an absence of readiness for change. After time schools
may move to a hesitant change state during which they can begin the process of
change. At this point the school is in a developing change state and sustained progress
towards school reform can be made. Finally schools enter an established change state
and continued growth is facilitated through the new reforms.
10
School reform in large scale projects is not only about systemic features of change.
Engagement of parents has been reported to be useful as partners in school reform
(Martinez-Cosio, 2010). The important role that practitioners play in facilitating
school reform was reported in a school reform initiative in an Ohio City school. Here
practitioners (referred to as agents of school reform) reported that aspects of the
process that were positive in helping school reform included hearing what was
important from other practitioners and bringing together people to share ideas and
experiences (Magolda & Ebben, 2007). The importance of ensuring that teachers
interpret reform meanings in alignment with the vision and goals of a new curriculum
was reported as important in a school district wide implementation of a new primary
school science curriculum in South Africa (Bantwini, 2010). Professional
development has an important role to play in driving school reform. In a literacy
reform study involving 41 primary-grade teachers from five high-poverty schools in
the USA it was concluded that professional development must be embedded within
school contexts, have clear goals and outcomes, and must be readily available to the
recipient population in an on-demand fashion (Nielsen, Barry & Staab, 2008).
The false-dualism between top-down and bottom-up school reform was explored
during a study of school reform in 25 elementary schools in Memphis, USA. In this
study the inter-connect between school district based „outside-in‟ support for reform
whilst reform was also built by practitioners within school was highlighted as being
important in raising attainment at the school level (Ross, Sanders, Wright, Stringfield,
Wang & Alberg, 2001). Despite the many reported studies of school reform, the data
reported from the Fife Peer Learning Project would represent the largest attempt to
systematically conduct an experimental project on school reform with clear research
aims and independent measures ever undertaken in the Scottish school system.

11
The research aims of the Fife Peer Learning Project
The project investigated the following key questions, with the aim of evaluating the
impact of scaling up a range of systematically implemented peer learning conditions.
Specifically:
Which works best in practice: Same age or cross age tutoring? Cross age
tutoring involves an older student tutoring a younger one. Same-age tutoring
is usually easier to organize but previous studies show cross-age tutoring to be
more effective. This question is addressed separately for reading and
mathematics.
Is an intensive or a lighter approach most effective? Although three
sessions of peer-tutoring have been found to be effective (for example Fuchs et
al., 1997), it might be too difficult to sustain in practice, especially with cross-
age interventions. Intensive interventions might also lead to boredom. Perhaps
a lighter approach with fewer sessions per week is more successful. This
question is addressed separately for reading and mathematics.
Is it more beneficial for students to participate in only reading or
mathematics peer tutoring or for them to participate in both? Involving
two subjects could help to reinforce a positive experience across areas.
Methods
Design
A factorial clustered randomised controlled design was employed in which schools
were either allocated to cross or same age tutoring; light or intensive tutoring; maths,
reading or maths & reading, and they either worked with pupils aged 8 years (the year-
group termed „Primary 4‟ in Scotland) or pupils aged 10 years (the year-group termed
12
„Primary 6‟ in Scotland). The design is illustrated in Table 1, and involved twelve
different intervention groups.
Insert Table 1 here
Fife Authority is a large district within Scotland supporting 145 primary
(elementary) schools, ensuring a sufficiently large sample. The random allocation was
carried out by the provider of the assessments (Centre for Evaluation and Monitoring
(CEM), Durham University). The Centre runs large-scale monitoring systems
covering the 3–18 age range which enable schools and colleges to track the progress
and attitudes of their students (www.cemcentre.org). The participants agreed to being
involved in the random allocation before it was carried out and all were told their
allocation. The administration of the tests designed to generate the outcome measures
was carried out by the schools which were not blind to group allocation. Marking was
carried out independently by personnel who were blind to the allocation. None of the
researchers working in the schools were blind to the allocations. The number of
schools per group is summarized in Table 2.
Insert Table 2 here
NB The figures are not symmetrically distributed for two reasons: i) Nine
schools joined the project after the initial allocation; ii) the process adopted to assign
the Primary 4/Primary 6 intervention groups. One hundred and twenty nine schools
(88% of the elementary schools in the district) agreed to be randomly assigned to an
intervention. From the participating schools, two cohorts of students were selected,
the younger were aged 8 years (Primary 4) at the start of the project and the older were
aged 10 years (Primary 6). In all, around 8,847 students were involved. The numbers
of girls and boys were very similar (50.9% male) as were the numbers of students in
the younger and older cohorts (54% older).

13
Involving the schools
Prior to the start of the project, school Principals attended a meeting at which the
plans were outlined. As a result, 120 out of 145 schools immediately agreed to be
involved and 9 subsequently agreed. The project began with an in-service training day
for staff teaching in Primary 4 and Primary 6 from all participating schools. This is
described later.
Inevitably, changes occurred during the two years of the project which might
have threatened to compromise the original design. These are itemised below:
a) Students moved schools; 286 students (6.8% of the sample). This was felt to
be beyond the influence of the project, but represented modest attrition.
b) Schools dropped out or changed their intervention group; 26 schools (about
20% of the sample). These were mostly small schools or schools where the head
teacher was changing. Great efforts were made by the researchers to prevent such
changes by personal approaches to those involved and they were kept to a minimum.
c) The project was originally designed such that for cross-age interventions the
younger pupils in Primary 4 would tutor students two years younger. However, in the
first year of the project just prior to implementation, for logistical reasons a decision
was taken that the Primary 4 students would not act as tutors but would be the tutees
for Primary 6 students. This change continued for the second year of the interventions.
The Participant Flow Diagrams shown in Figures 1a and 1b summarise the
numbers of schools and pupils in the project at key points. They can be summarised as
follows: For the Younger Cohort, from the 145 schools in the authority, 129 agreed to
be involved and the project finished with data from 119 (92% of those agreeing to
take part). For the older cohort, from the same total number of schools and number
agreeing to participate, data and were finally available from 93 schools (72% of those
agreeing to take part). The larger fall in numbers for the older cohort was because
some schools were not willing to collect data at the very end.
Insert Figures 1a and 1b here

14
In the results section any bias due to drop out is assessed by comparing the
maths and reading scores of pupils who were assessed prior to the interventions in
schools agreeing to participate and who were not assessed at the end with those for
whom there was complete data.
Interventions
The interventions were implemented between Christmas and the Summer vacation
with the participating cohorts for two consecutive years. In Scotland the School year
starts in early August. Students are in school for about six weeks and have a two-week
holiday. They return to school until Christmas, when they have another two-week
holiday. After Christmas they return to school again until Easter. The Scottish school
holidays are always taken to include the Easter weekend. After another two-week
holiday students return and remain in school until the end of June when the school
summer-holiday begins. There are no half-term holidays in these periods, but there are
bank-holidays and five planned professional development days for teachers when
schools are closed. This meant that the students started either in Primary 4 or Primary
6 and moved up to Primary 5 and Primary 7 respectively for the second year of the
project. The cross-age interventions involved the Primary 6/7 students tutoring the
Primary 4/5 tutees. The same-age interventions involved either the Primary 4/5
students or the Primary 6/7 students tutoring students of the same age. The intensive
interventions took place three times a week, light once a week. Each session lasted for
thirty minutes. All participating schools were randomly assigned to an intervention.
Those schools assigned to the reading intervention acted as a comparison group for
those assigned to the maths intervention. Those schools whose Primary 4 cohort was
assigned to an intervention served as a comparison group for those schools whose
Primary 6 cohort was assigned to an intervention, and so on.
15
Implementation
Prior to the project, the Centre for Peer Learning at Dundee University had developed
and field-tested suitable peer-learning packages in reading and mathematics. These
were described in more detail in the section Evidence for peer learning.
Matching of pairs
Pairs were matched on the basis of previous reading or mathematics attainment
(depending on the subject being tutored). In the cross-age condition students within
classes were ordered from highest to lowest in reading/mathematics attainment. The
top-attaining tutor in the older class tutored the top-attaining tutee in the younger
class; the second top tutor tutored the second top tutee in the younger class, and so on.
In the same-age condition the class was ordered from highest to lowest attainment in
reading/mathematics. All above the mid-point became tutors, all below became tutees.
The top-attaining tutor tutored the top attaining tutee; second top tutored the second
top tutee, and so on. Once matched, the advice given to teachers was that pairs stayed
together for the duration of the intervention period. At the beginning of the
intervention period, teachers were allowed some latitude to switch pairs who were
clearly not able to form a working partnership. These processes were adopted on the
basis that previous research indicated that an attainment gap was preferable to
optimise the interactions and benefit within pairs (Duran & Moreneo, 2005). The
matching technique was originally reported and described in some detail by Fuchs et
al. (1997). It had also been piloted for reading in a number of previous design
experiments (Topping, 1987).
Paired Reading technique
The Paired Reading technique involved switching between the tutor and tutee reading
together and the tutee reading alone. The book chosen by pairs had to be above the
independent readability level of the tutee, but below that of the tutor and appropriate
to their interest. This facilitated the tutor helping the tutee through the error correction

16
process. Readability level was decided by using a simple test. Tutees randomly
selected twenty words from the book from four different pages. They did this by
closing their eyes and placing their outstretched fingers on the book. They read the
word underneath their fingers. If the tutee could read between thirteen and nineteen
words the book was deemed to be at the right level of readability. Teachers also
checked the appropriateness of readability of books during observations. The tutor and
tutee started by reading together. The tutee signalled to read alone. Upon an error the
tutor waited 4-5 seconds and if the tutee did not self correct, was corrected by the
tutor. The tutee repeated the error word correctly and the pair read together again until
the tutee signalled to read alone. The tutee read alone until the next error.
Duolog mathematics technique
Duolog Mathematics involved discussion between tutor and tutee to help solve
mathematics problems. Student interactions adopted the following structure. First they
read the mathematics problem together. Then the tutor would contextualise the
problem for the tutee. The tutor would question the tutee as to how they would
approach solving the problem. The tutee talked out loud as they solved the problem.
Tutor and tutee checked answers, and summarised the nature of learning on that
problem. Finally, the tutor generalised that learning to related but new contexts.
Problems attempted by students were drawn from a variety of sources including those
developed by the school district educational development service.
Continuing professional development (CPD) for teachers
Teachers attended two CPD sessions per year starting in November of the first
academic year of the intervention. The first day provided an overview of the
techniques and research design. Demonstrations of the Paired Reading and Duolog
maths techniques were given. A manual to support teachers was provided for each
school. Finally, the teachers were allowed to forward plan with other teachers from

17
the same „experimental condition‟ and start to consider the issues that may arise for
them when implementing the project. Separate training was provided to staff
implementing Paired Reading and Duolog maths. Those implementing both had
access to both sessions. A second day in May towards the end of the first year of the
intervention focused on sharing successes with teachers and having teachers evaluate
year one of the project. The majority of teachers attended these events. For those
teachers not able to attend, research fellows visited schools on request offering
support and further training. Further support involved classroom visits and twilight
meetings for clusters of schools. In year two of the intervention, similar training was
provided for teachers who were new to the project. All teachers were invited to attend
the final CPD event in May as this was also used to celebrate achievements and
evaluate the project from the teachers‟ perspective. In year one of the study 188
teachers attended CPD day one and 182 attended CPD day two. In year two of the
study a number of the teachers were continuing to teach the same class and so did not
attend the CPD session (they had been trained in the previous year and had already
been running the intervention for a year). Therefore, 71 teachers who were new to the
technique, attended CPD day three at the start of the second year of the intervention.
Training of pupils
Training videos were provided for both interventions. In maths the training and advice
manual provided differentiated problems specifically designed for the training of
pupils. Teachers were advised to model the techniques for students with another staff
member.
Length and duration of intervention
The intervention took place over a period of 18 months. This spanned a period from
January in one school year, to June in the following school year. The intervention
lasted for 15 weeks in year one and 15 weeks in year two.
18
Measures
Prior to the project, and for its duration, the district had an assessment system in place
(the Performance Indicators in Primary Schools (PIPS) project) provided by CEM that
enabled the progress of students to be monitored on a regular basis. At the time of
the study, PIPS assessments were used by all schools in one-third of Scottish districts.
Schools and districts paid an annual registration fee. CEM provided the assessments,
marked and analysed the data and fed back standardized pupil-level results (PIPS,
2011). This system was used to evaluate the impact of the interventions. The
assessments were group pencil and paper tests of mathematics, reading, science
(Primary 7 only), vocabulary, non-verbal ability and attitudes to mathematics and
reading. They were administered by the school staff and took approximately three
half-hour sessions to complete (4 for Primary 7, which included an assessment of
science). The curriculum-based assessments of maths, reading and science were
aligned to the Scottish 5–14 Curriculum, which was in use across all elementary
schools involved the study. The assessments had good psychometric properties
(Tymms, 1999). The PIPS system administers assessments at fixed times. The timing
of the assessments in relation to the implementation of the interventions is shown in
Table 3.
Insert Table 3 here.
Analyses
Students are nested within schools and to take account of this clustering the data were
analysed using two level multi-level models. This is essentially a sophisticated form
of regression analysis in which the interventions were identified with dummies. A
code of one was used for the dummies and a zero identified those not involved with
the intervention. The outcomes and controls were normalised at the student level and
given a mean of 0 and a standard deviation of 1. The models deal with each of the
research questions noted above and compare those involved in an intervention with all
of the rest of the students and schools in the year group for whom data were available.

19
For example in one model the maths results of students involved with same age and
cross age peer tutoring in maths in the older cohort are compared with the maths
results of all other students.
For the Picture Vocabulary outcome the analysis focussed on the reading
interventions whereas for Science and Non-verbal measures the analyses focussed on
the maths interventions.
In further analyses, which are not reported in detail, explanatory variables in
the form of achievement and attitude measures collected from before the interventions
were introduced into the models at the student level.
The Effect Sizes (ESs) were calculated using the formula for school level
intervention using multi-level models given in Tymms (2004b).
e
SizeEffect _
Where is the coefficient for the dummy representing the intervention and
e is the square root of the variance at the student level from the null model.
This measure of Effect Size is equivalent to Cohen‟s d and Cohen (1992)
suggests that an effect size of 0.2 to 0.3 is taken to be a small effect, 0.5 as a medium
effect and greater than 0.8 as a large effect although he acknowledges that
interpretation must be dependent on context.
In the analyses schools were treated as the unit of analysis and the dummies
were applied to whole schools, even though in larger schools the advice was to
concentrate on specific classes. This is a conservative approach. The thinking being
that it is virtually impossible to isolate practice to one class within a year group over
two years when teachers, pupils and ideas were able to move but it is acknowledged
that it is quite possible that some classes did not get involved with the project.
The two cohorts are analysed separately. Technically, the random assignment
controls for bias and no statistical controls are necessary, but including controls for
prior measures increases the power of the investigation. However, it also decreases the
sample size because not all pupils were present on the two occasions. Because of this
20
attrition the analyses reported here were carried out without controls although the
alternative approach was used and the results are noted.
The comparisons between interventions are as follows:
Same age and cross age peer tutoring were compared with no allocation to
peer tutoring.
Light frequency of sessions and intensive peer tutoring were compared with no
allocation to peer tutoring.
Mathematics alone and reading alone and with mathematics plus reading peer
tutoring were compared with no allocation to peer tutoring.
The analyses for each of the above comparisons were carried out separately for
each outcome for both cohorts
Fidelity of treatment
The implementation of the peer tutoring interventions was investigated through
observations of a randomly selected sample of participating schools (Thurston,
Conlin, Merrell, Miller, Topping & Tymms, 2009). For reading these visits took place
between 8-11 weeks into the implementation phase of the project in both years one
and two. Implementation integrity in respect of compliance to the Paired Reading
technique was very high across all conditions with the error correction process
occurring correctly in 86.9% of instances when errors in reading were observed
(Thurston et al., 2009). Similarly observations took place in classrooms implementing
Duolog maths. These observations gathered data regarding the classroom processes
occurring in the selected classes. Observation notes were made in respect of how
successful each stage of the Duolog maths technique was being implemented. Data
indicated that there was successful implementation of the Duolog maths process and
that there was reasonably good adherence to the Duolog maths process (Topping &
Thurston, 2007).
21
Implementation was also assessed by using an 8-item multiple-choice
questionnaire covering the key features of the project. The latter was completed by
participating Primary 7 and Primary 5 teachers. There were responses from 48 of the
65 schools (a total of 81 teachers). The full questionnaire is shown in Appendix 1. The
questions required respondents to indicate which of the 4 options best described how
smoothly particular aspects of peer tutoring were implemented in their school. The
responses were scored 1 (always smoothly) to 4 (problematic). The results are shown
in Table 10.
Insert Table 10 here
A high proportion of the teachers indicated that the peer tutoring interventions
had been implemented without any problems for most or all of the time, and that the
pairs of students worked reasonably well together without requiring attention from the
teacher (Questions 1, 3, 5 and 8). Seventy four of the teachers who responded (92.5%)
reported that they had followed the guidance on how to implement peer tutoring all or
most of the time.
Results
Participant flow
As noted earlier there was some attrition so bias was assessed amongst the drop outs
for schools that had agreed to take part. For both cohorts the reading and maths scores
of the pupils collected in the year before the interventions started were used to
compute the differences between pupils for whom data was collected at the end of the
project and those who were not present. The results are summarised in Table 4.
Insert Table 4 here
The differences, reported in Effect Sizes were very small being around 0.1 standard
deviation units or smaller. There was very little bias.
Multi-level models
22
By way of example, the null models for the younger cohort for cognitive outcomes are
shown in Table 5 together with the first model which aimed to assess the impact of
same and cross age tutoring.
Insert Table 5 here
Table 5 shows four null models (one for each outcome) and gives the mean
result for each in the row named “constant”. The standard errors on the means are
given in parenthesis. As expected all the means are very close to zero. The last two
rows in the table show the variance of the scores partitioned between schools and
students. Between 80 and 90 per cent of the total variance was associated with
students and it is this student level variance which is used in the calculation of Effect
Sizes.
Table five also shows four “1st models”. The rows for “same age” and “cross
age” record the coefficients for the dummies identifying those interventions for maths.
These dummies are then used to calculate the Effect Sizes (ESs) using the formula
given earlier. For example, the ES for Cross age tutoring in maths is given by (0.195/
0.891). This gives an ES of 0.207 which is recorded in Table 5 together with the
Standard Error which has been similarly adjusted.
Tables 6 to 8 show the summaries of all ESs for all the interventions for both
cohorts for cognitive and attitudinal outcomes. Many results are presented in these
tables and if each were treated in isolation then a number of coefficients in the tables
would be significant at the 5% level. It would be possible to apply the Bonferroni
correction to take in to account the number of comparisons which are made and if this
is done none of the individual results are significant at the 5% level.
But the interest is in the consistency and size of impact of the interventions
and in summarising the results, attention is drawn to ESs where they are equal or
greater to the lowest figure which Cohen suggested was a small effect (0.2).
23
Insert Tables 6 & 7 here
The results displayed in Tables 6 and 7 for the cognitive outcomes are
summarised by row.
Same age peer tutoring: No results had Effect Sizes as large as 0.2.
Cross age peer tutoring: All nine results were positive and all but one (non-
verbal for the older cohort) had Effect Sizes of greater than 0.2.
Light peer tutoring: No results had Effect Sizes as large as 0.2.
Intensive peer tutoring: No results had Effect Sizes as large as 0.2.
Mathematics or reading peer tutoring alone: No results had Effect Sizes as
large as 0.2.
Mathematics and reading peer tutoring together: Of the nine comparisons
three had Effect Sizes of 0.2 or above and had Standard Errors substantially smaller
than the coefficients. They were non-verbal ability for the younger cohort (ES=0.27)
and, for the older cohort, reading and picture vocabulary (ES=0.28 & 0.21
respectively).
Results for the attitudinal outcomes are shown in Tables 8 and 9.
Insert Tables 8 & 9 here
None of results for the younger cohort had Effect Sizes as large as 0.2.
For the older cohort no Effect Sizes close to 0.2 were seen for mathematics.
However, for reading peer tutoring, there was a negative (-0.23) Effect Size for same
age tutoring. There was also a negative (-0.31) Effect Size for tutoring in reading
alone. This contrasted was a positive impact (0.27) Effect Size for the use of reading
and mathematics together. In all three cases the Standard Errors were less than half the
size of the coefficients.
24
The analyses did not look at possible interactions because the random
assignment at the school level did not leave sufficient numbers in each cell to give
sufficient power to the investigation.
Summary of results
The interventions focussed on reading and mathematics and the analyses produced a
clear conclusion. Cross age peer tutoring had a consistent impact (ES=0.2) on
attainment in these subjects for both the younger and older cohorts. The results were
also positive (ES=0.2) for Picture Vocabulary in both cohorts and for Science in the
older cohort, (Science was not assessed for the younger cohort.) For non-verbal ability
the impact was positive at the same level for the younger cohort but not the older
cohort.
No other interventions had impacts with Effect Sizes as large as 0.2 on
attainment in reading or maths. The use of maths and reading tutoring programs
together had Effect Sizes as large as 0.2 on 3 of the possible 9 outcomes but there was
no clear pattern and they were not in reading or maths.
For the attitude measures the interventions produced no impacts on the 21 out
of the 24 interventions with ESs as great as 0.2. Three exceed 0.2 but two were
negative and one was positive for the older cohort providing no clear pattern.
Cross age peer tutoring was consistent in its impact on attainment in reading
and mathematics and no other clear pattern was identified. The analyses which used
controls for prior measures confirmed this conclusion.
Discussion
The clustered randomised control trial reported in this paper was not perfect.
Participants and researchers were not blind to allocations and there was loss of
schools and pupils during the project. Further, the fidelity to implementation could
have been more assiduously investigated. For these reasons alone any conclusions
must be tentative. But the study has shown that it is possible to work with a whole
25
district to implement a large scale clustered randomized controlled trial and maintain a
reasonable degree of implementation fidelity. Our conclusion, whilst noting the
limitations, is that the process improved the learning of students through cross age
peer tutoring.
Although this paper sought to evaluate the value of peer tutoring in various
forms on a large scale, it inevitably evaluated a range of other factors. In addition to
the technique of peer tutoring per se, the approach to peer tutoring adopted by the
project is under scrutiny as is the implementation (fidelity to treatment) and the extent
to which the approach was being used by controls. Further, peer tutoring was set up
against „business as usual‟ classroom teaching and so its efficacy is being judged not
just against various forms of peer tutoring or no teaching but against teaching in its
various forms. In this respect the classes not assigned to reading or mathematics
interventions were able to act as comparison groups to those which were assigned to
them. This is due to the fact that whilst the new pedagogy was adopted in the subject
of intervention, the teaching of reading and mathematics (i.e. the subject in which no
new pedagogy was adopted) followed the pedagogy and format normally adopted by
the teacher. It is also useful to keep in mind that the intervention was carried out in
two specific years and consequently encompassed generalisation from one teacher to
another. In addition the research took place within a particular curriculum in a
particular authority.
Despite the threats to validity, the fact that cross-age peer tutoring stood out as
positively enhancing cognitive attainment for both reading and mathematics in two
differently aged cohorts, for both tutors and tutees, is persuasive evidence of its value.
It suggests that the approach is robust against the vagaries of implementation. Its
modest impact might be improved through attention to detail, for example in
extending or improving the continued professional development for teachers. The
modest impact of Duolog maths might highlight a potential limitation. The
provenance and probity of cross-ability Duolog maths was not that well established
prior to undertaking this study. It would have to be acknowledged that the Duolog

26
maths might not have been ready for scale up in a randomized trial. In contrast the
Paired Reading technique was well established in a UK context and had a robust
research literature to support it.
A number of important conclusions can be drawn in respect of school district
wide school reform in the UK from the Fife Peer Learning Project. Many of these
relate to the process of school reform. Many of the reported school reform initiatives
of a similar size and nature to the Fife Peer Learning Project stem from work in the
USA. In an RCT of paired reading in 20 classrooms, Effect Sizes of growth on self-
designed comprehension scores ranged from 0.10 for middle achievers in reading to
0.44 for low achieving students. It is important to note that previous research has
reported that Effect Sizes tend to be of greater magnitude when self-designed, rather
than standardized tests are used (albeit that this may often be due to treatment
enhanced test performance). Cohen et al. (1982) reported in a meta-analysis of 52
cross-age tutoring studies that tutors generally exhibited average effect sizes for the
tutors of 0.33. This Effect Size is higher than that reported for the Fife Peer Learning
Project, but included data from projects that utilized self-designed tests, rather than
standardized measures. In a study of 25 „Memphis Restructuring Schools‟ enhanced
reading gains were reported when compared to a group of 34 „demographically
matched‟ control schools (Effect Size 0.38 on standardized Comprehensive Tests of
Basic Skills). However, direct comparisons between this study and the Fife Peer
Learning Project may be problematic. The Memphis Restructuring Schools study did
not have a randomized design. Effect Sizes were based on gains (leading to the
possibility of Type I error) and the sample size of reform and control schools differed
(Ross et al., 2010). The need for using randomized controlled trials to establish the
true extent of literacy school reform initiatives was highlighted by data from
hierarchical linear multi-level modeling analysis of 3652 Kindergarten students nested
within 57 Hawaiian Island schools. Significant school effects were observed on
literacy outcome measures (Fien et al., 2009). Whilst randomization to condition does

27
not guarantee that school effects will not skew data, it does mean that the potential
effects have equal probability of occurring within each experimental condition.
School management in Scotland has become more devolved to the school level
since 1993 (Scottish Office Education Department, 1993). Devolved school
management has resulted in Scottish schools having responsibility for dealing with
development issues at the school level (Scottish Borders Council, 2003). This could
be one reason why school district wide reform studies from Scotland are less well
established and more difficult to plan. A feature of the Fife Peer Learning Project was
the ability of the project team to engage school district managers, head teachers,
teachers and parents from the school district as partners in the school reform process.
The manner in which the sample was generated for the study was vital to this. The
school district was a partner in the research/school reform process. The continuing
professional development days were coordinated and funded in partnership with the
school district. The Director of Education in the school district introduced each
professional development event and affirmed the school district‟s commitment to the
initiative. Head teachers included the school reform process into their individual
school development plans and prioritised teacher attendance at the CPD events
providing the leadership and participation required for effective school reform (Mujis
& Harris, 2006). The CPD events also facilitated the establishment and development
of networks of teachers. Teachers from similar experimental cells met during twilight
sessions to discuss issues related to the school reform. The establishment of such
networks was reported to be essential for effective school reform during a ten year
study in one English local authority (Ainscow, 2010). This sort of systematic
subscription to the school reform process is reported to be vital to promoting change
within USA schools (Ravitz, 2010; Beabout, 2010). It would appear that similar
systemic commitment would make for favourable conditions for school reform in
Scotland. It is possible that the schools previous non-systematic experience of using
peer learning techniques and the collective aspiration of potentially raising literacy
and numeracy levels across the school district provided the schools with the collective
28
moral purpose and shared theory of action required for effective school reform. The
theoretical model proposed by Gifford (2010) would appear to be reflected in the
experiences of the Scottish school district. In Fife the high level involvement of the
school district and the professional development of teachers gave a collective purpose
and shared conceptualization regarding the aims and purposes of the project. As a
result of this there was alignment of the organizational constructs of the school district
and the support provided for schools. This process was probably further facilitated by
close liaison between the research fellows supporting school and the school district.
Having school district managers from Fife on the research planning board helped
ensure that capacity was built within Fife to allow the intervention to flourish after the
research was finished. Finally, there was close alignment between the individual
schools‟, and the school districts‟ desire to increase literacy and numeracy levels.
Using well established methods of changing classroom practice were probably
important in effecting changes in classroom interactions. In addition the use of other
self-report as well as external measures of implementation validity during the project
will probably have aided the school reform process in literacy (Fien, Kame‟enui &
Good, 2009). The less strong results in numeracy may reflect the fact that protocols
for interaction were less firmly established in the Duolog Maths intervention. In
addition a more qualitative method of observation and feedback was adopted for the
Duolog maths observations. This resulted in feedback being less quantifiable and clear
in terms of adherence to interaction protocols. Using teachers from schools within the
school district during the second wave of CPD days facilitated the use of authentic
voices of the school reform from amongst the teachers‟ own ranks. This has been
reported as vital to the school reform process in the USA and appears to have similar
benefits in Scotland (Magolda & Ebben, 2007).
Conclusion

29
The challenge for school reform in the Scotland and wider within the UK will be to
find ways of facilitating systematic change at the school district level in a climate of
increasing devolution of school management and power. This is particularly prevalent
in England where the establishment of the new „Academy‟ status for schools may
result in barriers to systematic school reform at the school district level (Department
for Education, 2010). In Scotland with a strong professional body of teachers, the Fife
Peer Learning Project has demonstrated that school reform at the district level is
systemically possible. However, for this to happen the teachers would need to „buy
into‟ the proposed reform and therefore any proposed reform must have credibility
with the teaching profession.
The project has established a model which can be used to further investigate the
wide-scale systematic use of school reform, progressively focussing on factors which
may enhance its efficacy. More broadly the project shows how a major large scale
intervention designed to make changes to the working practice of schools can be
successfully implemented in the UK. It also provided proof of concept. It is possible
to randomly assign and work with more than 100 schools, and to learn collectively
through large scale trials. Finally the study has contributed to the body of knowledge
about a well established intervention (peer tutoring) by implementation school reform
at the district level.
30
References
Ainscow, M. (2010). Achieveing excellence and equity: Reflections on the
development of practices in one local district over 10 years. School Effectiveness
and School Improvement, 21, 75-92.
Bantwini, B. D. (2010). How teachers perceive the new curriculum reform: Lessons
from a school district in the Eastern Cape Province, South Africa. International
Journal of Educational Development, 30, 83-90.
Barnett, D. W., Daly, E. J., III, Jones, K. M., & Lentz, F. E. (2004).Response to
intervention: Empirically based special service decisions from single-case designs
of increasing and decreasing intensity. Journal of Special Education, 32, 66-79.
Beabout, B. R. (2010). Urban school reform and the strange attractor of low-risk
relationships. The School Community Journal, 20, 9-30.
Beirne-Smith, M. (1991). Peer Tutoring in Arithmetic for Children with Learning
Disabilities. Exceptional Children, 57, 330-337.
Bronson, C. E. (2010). The mosaic of small high school reform: A case study of one
urban high school. Dissertation Abstracts International Section A: Humanities
and Social Sciences. 70(11-A), 4127.
CEM (2009). www.cemcentre.org (web page accessed 17th
February 2010).
Cohen, J. (1992) A power primer. Psychological Bulletin, 112, 155–159.
Cohen, P. A., Kulik, J. A., & Kulik, C. C. (1982). Educational outcomes of tutoring:
A meta-analysis of findings. American Educational Research Journal, 19, 237-
248.
Cook, S. B., Scruggs, T. E., Mastropieri, M. A., & Casto, G. C. (1986). Handicapped
students as tutors. The Journal of Special Education, 19, 483-492.
Department for Education (2010). Michael Gove invites all schools to become
academies. Retrieved from:
www.education.gov.uk/inthenews/inthenews/a0061072/michael-gove-invites-all-
schools-to-become-academies (1st November 2010).
Duran, D., & Monereo, C. (2005). Styles and sequence of cooperative interaction
in fixed and reciprocal peer tutoring. Learning & Instruction, 15, 179-199.
Fantuzzo, J. W., King, A. M., & Heller, L. R. (1992). Effects of reciprocal peer
tutoring on mathematics and school adjustment: A component analysis. Journal of
Educational Psychology, 84, 331-339.
31
Fantuzzo, J. W., Polite, K., & Grayson, N. (1990). An Evaluation of reciprocal
peer tutoring across elementary school settings. Journal of School Psychology, 28,
309-323.
Fien, H., Kame‟enui, E.J., & Good, R. (2009). Schools engaged in school-wide
reading reform: An examination of the school and individual student predictors of
kindergarten early reading outcomes. School Effectiveness and School Improvement,
20, 1-25.
Foot, H. C., Shute, R.H., Morgan, M.J., & Barron, A. (1990). Theoretical issues in
peer tutoring. In H. C. Foot, M. J. Morgan, & R. H. Shute (Eds.) Children helping
children. (pp 65-92) New York: John Wiley & Sons.
Fitz-Gibbon, C. T. (1992). Peer and Cross-Age Tutoring. In M. C. Alkin (Ed.),
Encyclopedia of Educational Research (Sixth edition) (pp. 980-984). New York:
Macmillan Publishing Company.
Fuchs, D., Fuchs, L. S., Mathes, P. G., & Simmons, D. C. (1997). Peer-assisted
learning strategies: Making classrooms more responsive to diversity. American
Educational Research Journal, 34, 174-206.
Gifford, B. K. (2010). “School reform is like cleaning out your garage": A case
study of one school district's influence on student achievement. Dissertation Abstracts
International Section A: Humanities and Social Sciences. 70(11-A), 4133.
Ginsburg-Block, M. D., Rohrbeck, C. A., & Fantuzzo, J. W. (2006). A meta-
analytic review of social, self-concept, and behavioral outcomes of peer-assisted
learning. Journal of Educational Psychology, 98, 732-749.
Greenwood, C. R., Delquadri, J. C., & Hall, R.V. (1989). Longitudinal effects of
classwide peer tutoring. Journal of Educational Psychology, 81, 371-383.
Greenwood, C. R., Terry, B., Arreaga-Mayer, C., & Finney, R. (1992). The
classide peer tutoring program: Implementation factors moderating students‟
achievement. Journal of Applied Behavior Analysis, 25, 101-116.
Gyanani, T. C., & Pahuja, P. (1995). Effects of peer tutoring on abilities and
achievement. Contemporary Educational Psychology, 20, 469-475.
Haney, W. (2000). The myth of the Texas miracle in education. Education Policy
Analysis Archives, 8, 1-51.
Kalkowski, P. (1995). Peer and cross-age tutoring. School Improvement Research
Series, 1, 8 1-27
Kaufman, T. E.(2010). Performance management and school reform: A multi-case
study of middle and high school performance management for instructional
improvement. Dissertation Abstracts International Section A: Humanities and Social
Sciences. 70(11-A), 4136.
32
Kuo, V. (2010). Transforming American high schools: Possibilities for the next
phase of high school reform. Peabody Journal of Education, 85, 389-401.
Leithwood, K., & Jantzi,D. ( 2006). Transformational school leadership forlarge
scale reform: Effects on students, teachers, and their classroom practices. School
Effectiveness and School Improvement, 17, 201-227.
Hartley, S. S. (1977). A meta-analysis of effects of individually paced instruction
in mathematics. Unpublished doctoral dissertation. University of Colorado.
Lahno, B. (2001). On the emotional character of trust. Ethical Theory and Moral
Practice, 4, 171-189
Magdola, P., & Ebben, K. (2007). From schools to community learning centres: A
program evaluation of a school reform process. Evaluation and Program Planning,
30, 351-363.
Martinez-Cosio, M. (2010). Parents' roles in mediating and buffering the
implementation of an urban school reform. Education and Urban Society, 42, 283-
306.
Muijs, D., & Harris, A. (2006). Teacher led school improvement: Teacher
leadership in the UK. Teaching and Teacher Education. 22, 961-972.
Nielsen, D. C., Barry, A.L., & Staab, P.T. (2008). Teachers‟ reflections of
professional change during a literacy reform initiative. Teaching and Teacher
Education, 24, 1288-1303.
PIPS (2011) www.pipsproject.org website accessed 22/02/11.
Ravitz, J. (2010). Beyond changing culture in small high schools: Reform models
and changing instruction with project-based learning. Peabody Journal of Education,
85, 290-312.
Reezigt, G. J., & Creemers, B.P.M. (2005). A comprehensive framework for
effective school improvement. School Effectiveness and School Improvement, 16,
407-424.
Rohrbeck, C. A., Ginsburg-Block, M. D., Fantuzzo, J. W., & Miller, T. R. (2003).
Peer-assisted learning interventions with elementary school students: A meta-analytic
review. Journal of Educational Psychology, 95, 240-257.
Ross, S. M., Sanders, W.L., Wright, P., Stringfield, S., Wang, L.W., & Alberg, M.
(2001). Two- and three-year achievement results from the Memphis restructuring
initiative. School Effectiveness and School Improvement, 12, 323-346.
Rumelhart, D. E., & Norman, D. A. (1983). Representation in memory. San
Diego, CA: Center for Human Information Processing, University of California.
33
Scottish Borders Council (2003). Devolved school management: General
principles. Retrieved from:
http://www.scotborders.gov.uk/council/specialinterest/tcs/tcs_appendices/AppendixE
4/AppendixE4-1Sec3.pdf (1st November 2010).
Scottish Office Education Department (1993). Devolved School Management.
Guidelines for Schemes. Edinburgh: Scottish Office Education Department.
Slavin, R. E., & Smith, D. (2009). Effects of sample size on ES in systematic
reviews in education. Educational Evaluation and Policy Analysis, 31, 500-506.
Steiner, K. (1977). Peer Tutoring in the Reading. Journal of Reading, 21, 266-
269.
Thurston, A., Conlin, N., Merrell, C., Miller, D., Topping, K. J., & Tymms, P.
(2009). A randomized trial of paired reading in elementary schools. Conference of
European Association of Research on Learning & Instruction Amsterdam 24th
-30th
August 2009.
Thurston, A., & Topping, K. J. (2007). Peer tutoring in schools: Cognitive models
and organisational typography. Journal of Cognitive Educational Psychology, 6, 356-
372.
Topping, K. J. (1987). Peer tutored paired reading: Outcome data from ten
projects. Educational Psychology, 7, 133-45.
Topping, K. J. (1997). Duolog reading. A video training pack. Masison, WI:
Institute for Academic Excellence.
Topping, K. J. (1998). Paired learning in literacy. In K. J. Topping, & S. Ehly,
(Eds.). (1998). Peer-assisted learning (pp 87-104). Mahwah NJ & London UK:
Lawrence Erlbaum.
Topping, K. J., & Ehly, S. (Eds.) (1998). Peer-assisted learning. Mahwah NJ &
London UK: Lawrence Erlbaum.
Topping, K. J. (1988). The peer tutoring handbook: Promoting cooperative
learning. London and Sydney; Cambridge, Mass: Croom Helm; Brookline Books.
Topping, K. J. (2001). Peer assisted learning: A practical guide for teachers.
Cambridge MA: Brookline Books.
Topping, K. J., & Bamford, J. (1998). The paired maths handbook: Parental
involvement and tutoring in mathematics. London: Fulton.
Topping, K. J., Kearney, M., McGee, E., & Pugh, J. (2004). Tutoring in
mathematics: A generic method. Mentoring and Tutoring, 12, 353-370
34
Topping, K.J., & Thurston, A. (2007). Fife peer learning project: Intensity and
type of tutoring. Conference of European Association of Research on Learning &
Instruction Budapest, Hungary, August 2007.
Tymms, P. (1999). Baseline assessment and monitoring in primary schools:
Achievements, attitudes and value-added indicators. David Fulton: London.
Tymms, P. (2004). Are standards rising in English primary schools? British
Educational Research Journal, 30, 477-494.
Tymms, P. (2004b). Effect Sizes in multilevel models. In I. Schagen & K. Elliot
(Eds.). But what does it mean? (pp. 55-66). Slough: National Foundation for
Educational Research.
Tymms, P., Merrell, C., Heron, T., Jones, P., Albone, S. & Henderson, B. (2008).
The importance of districts. School Effectiveness and School Improvement, 19, 261-
274.
Tymms, P., Merrell, C., & Coe, R. (2008). Open dialogue: Educational policies
and randomized controlled trials. The Psychology of Education Review, 32, 3-7.
Tymms, P. and Merrell, C. (2007) Standards and Quality in English Primary
Schools Over Time: the national evidence (Primary Review Research Survey 4/1),
Cambridge: University of Cambridge Faculty of Education.
Utley, C. A., & Mortweet, S.L. (1997). Peer-mediated instruction and
interventions. Focus on Exceptional Children, 29, 1-23.
Van Keer, H. (2004). Fostering reading comprehension in fifth grade by explicit
instruction in reading strategies and peer tutoring. British Journal of Educational
Psychology, 74, 37–70.
Van Keer, H., & Verhaeghe, J. P. (2005). Effects of explicit reading strategies
instruction and peer tutoring in second and fifth graders' reading comprehension and
self-efficacy perceptions. The Journal of Experimental Education, 73, 291-329.
Wetherill, K.S., & Applefield, J.M.(2005). Using school change state to analyze
comprehensive school reform. School Effectiveness and School Improvement, 16, 197-
215.
Willms, J. D. (1987). Differences between Scottish educational authorities in their
examinations attainment. Oxford Review of Education, 13, 211-232.

35
Appendix 1
Fife Peer Learning Project: Questionnaire for Teachers
School:_________________Teacher:_______________Class:________________
1) How well have you been able to implement peer learning?
It has worked well with no problems
It worked well most of the time although some sessions were problematic
There were significant problems
It was not possible to implement peer learning this year
If you have ticked answer b, c, or d, please explain the nature and extent of the difficulties
………………………………………………………………………………………......
2) How closely did you follow the guidance given by Dundee University and the resource
packs?
Always Mostly Occasionally Never
3) Did you manage to sustain the required number of sessions of peer learning per week?
Always Mostly Occasionally Never
4) Did you incorporate peer learning within curriculum time? E.g. Duolog Mathematics
during the Mathematics session / Paired Reading during the time assigned for literacy.
36
Always Mostly Occasionally Never
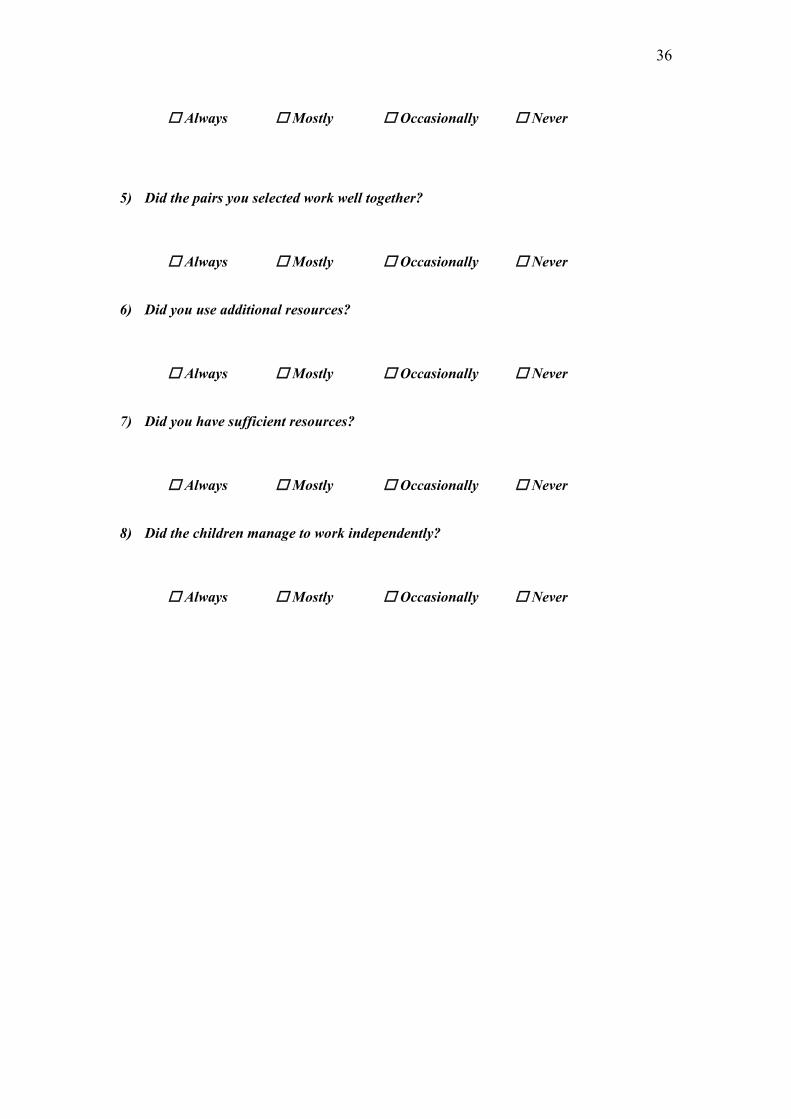
5) Did the pairs you selected work well together?
Always Mostly Occasionally Never
6) Did you use additional resources?
Always Mostly Occasionally Never
7) Did you have sufficient resources?
Always Mostly Occasionally Never
8) Did the children manage to work independently?
Always Mostly Occasionally Never
Notes on Contributors
PETER B. TYMMS (Corresponding Author) is a Professor of Education at the
Department of Education, Durham University, and Head of the School of Education.
Leazes Rd. DURHAM, DH1 1TA; e-mail: [email protected].
Fax: +44 (0) 191 33 44 180, Phone: +44 (0) 191 33 44 182.
His research interests are: Monitoring, Assessment, Peer Learning, ADHD, Rasch
measurement and Research Methodology.
CHRISTINE MERRELL is the Director of Research and Development at the Centre
for Evaluation and Monitoring (CEM), Block 4, Mountjoy Research Centre, Durham
University, Stockton Road, DURHAM, DH1 3UZ; e-mail:
[email protected] . Her research interests are assessment development
and monitoring the progress of children through primary school.
ALLEN THURSTON is a Reader at the Department of Education, Durham
University, Leazes Rd. DURHAM, DH1 1TA; e-mail: [email protected] .
His research interests are peer tutoring, cooperative learning, science education,
learning with information and communications technology and elementary education.
JOHN B. ANDOR is an Assistant Registrar at the Examination Development and
Production Division (EDPD), Caribbean Examinations Council (CXC),
Headquarters, The Garrrison, St Michael, BB 14038, Barbados, West Indies.
e-mail: [email protected]

His research interests are school-based assessment, measurement and evaluation.
KEITH J. TOPPING is a Professor of Educational and Social Research, School of
Education, University of Dundee and Director of the Centre for Peer Learning,
Nethergate, DUNDEE, DD1 4HN, Scotland, UK; e-mail: [email protected].
His research interests are peer learning, parents as educators, social and behavioural
competence, and computer assessment.
DAVID MILLER is Senior Lecturer in Education at the School of Education,
University of Dundee, Nethergate, DUNDEE, DD1 4HN, Scotland, UK; e-mail
[email protected]. His research interests are self-esteem, peer learning and
game-based learning.
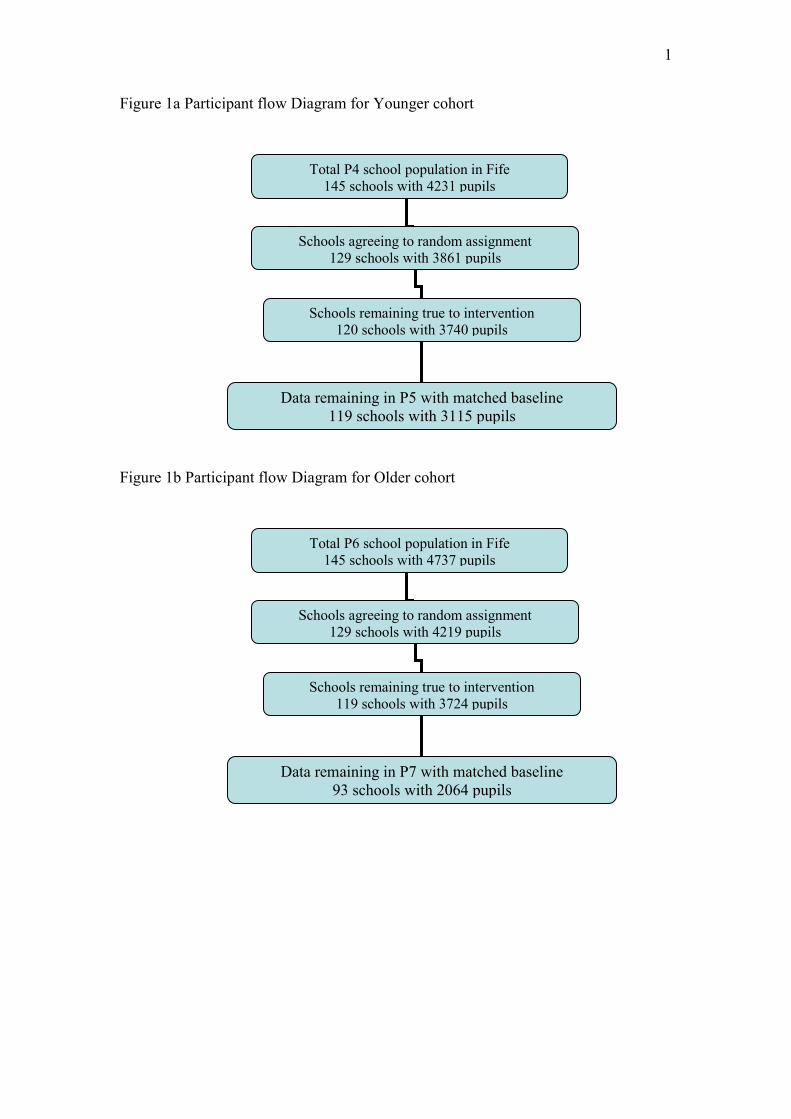
1
Figure 1a Participant flow Diagram for Younger cohort
Figure 1b Participant flow Diagram for Older cohort
Total P6 school population in Fife
145 schools with 4737 pupils
Schools agreeing to random assignment
129 schools with 4219 pupils
Schools remaining true to intervention
119 schools with 3724 pupils
Data remaining in P7 with matched baseline
93 schools with 2064 pupils
Total P4 school population in Fife
145 schools with 4231 pupils
Schools agreeing to random assignment
129 schools with 3861 pupils
Schools remaining true to intervention
120 schools with 3740 pupils
Data remaining in P5 with matched baseline
119 schools with 3115 pupils

1
Table 1 Summary of intervention design
Same AgeP4/5 Cross Age P6/7
Maths Intensive.
. Light
Intensive.
. Light
Reading Intensive.
. Light
Intensive.
. Light
Maths and Reading Intensive.
. Light
Intensive.
. Light
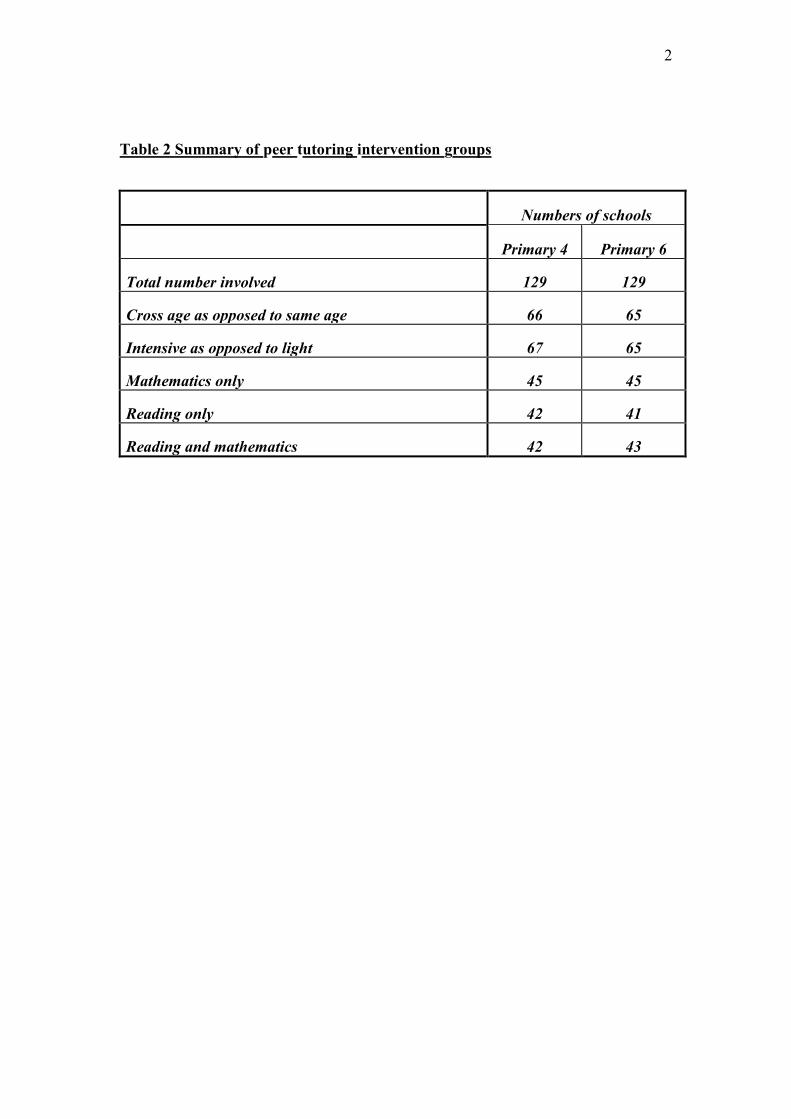
2
Table 2 Summary of peer tutoring intervention groups
Numbers of schools
Primary 4 Primary 6
Total number involved 129 129
Cross age as opposed to same age 66 65
Intensive as opposed to light 67 65
Mathematics only 45 45
Reading only 42 41
Reading and mathematics 42 43

3
Table 3 Summary of timing of assessments
Younger
cohort
Primary 3 Primary 4 Primary 5 Primary 6 Primary 7
Baseline
assessment
administered
in March of
the academic
year
Interventions
implemented
in January –
June
Interventions
implemented
in January –
June
Outcome
assessment
administered
in March
Older
cohort
Baseline
assessment
administered
in March of
the academic
year
Interventions
implemented
in January -
June
Interventions
implemented
in January –
June
Outcome
assessment
administered
in June
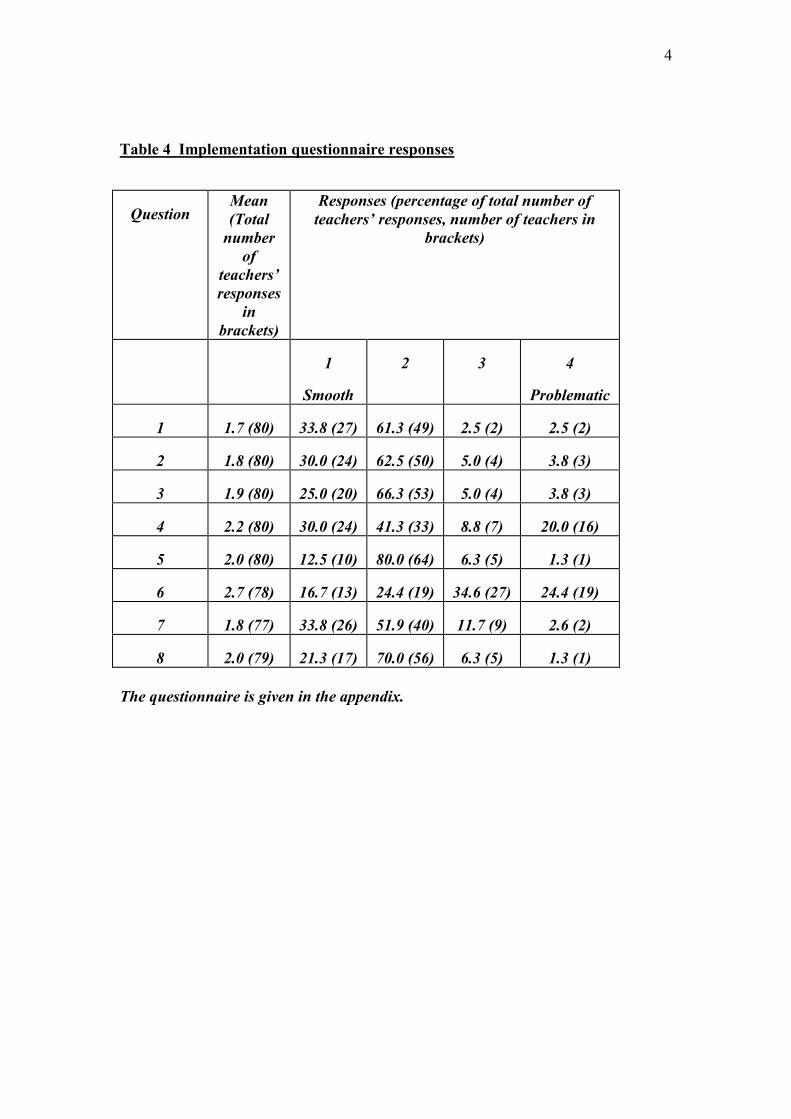
4
Table 4 Implementation questionnaire responses
Question Mean
(Total
number
of
teachers’
responses
in
brackets)
Responses (percentage of total number of
teachers’ responses, number of teachers in
brackets)
1
Smooth
2 3 4
Problematic
1 1.7 (80) 33.8 (27) 61.3 (49) 2.5 (2) 2.5 (2)
2 1.8 (80) 30.0 (24) 62.5 (50) 5.0 (4) 3.8 (3)
3 1.9 (80) 25.0 (20) 66.3 (53) 5.0 (4) 3.8 (3)
4 2.2 (80) 30.0 (24) 41.3 (33) 8.8 (7) 20.0 (16)
5 2.0 (80) 12.5 (10) 80.0 (64) 6.3 (5) 1.3 (1)
6 2.7 (78) 16.7 (13) 24.4 (19) 34.6 (27) 24.4 (19)
7 1.8 (77) 33.8 (26) 51.9 (40) 11.7 (9) 2.6 (2)
8 2.0 (79) 21.3 (17) 70.0 (56) 6.3 (5) 1.3 (1)
The questionnaire is given in the appendix.
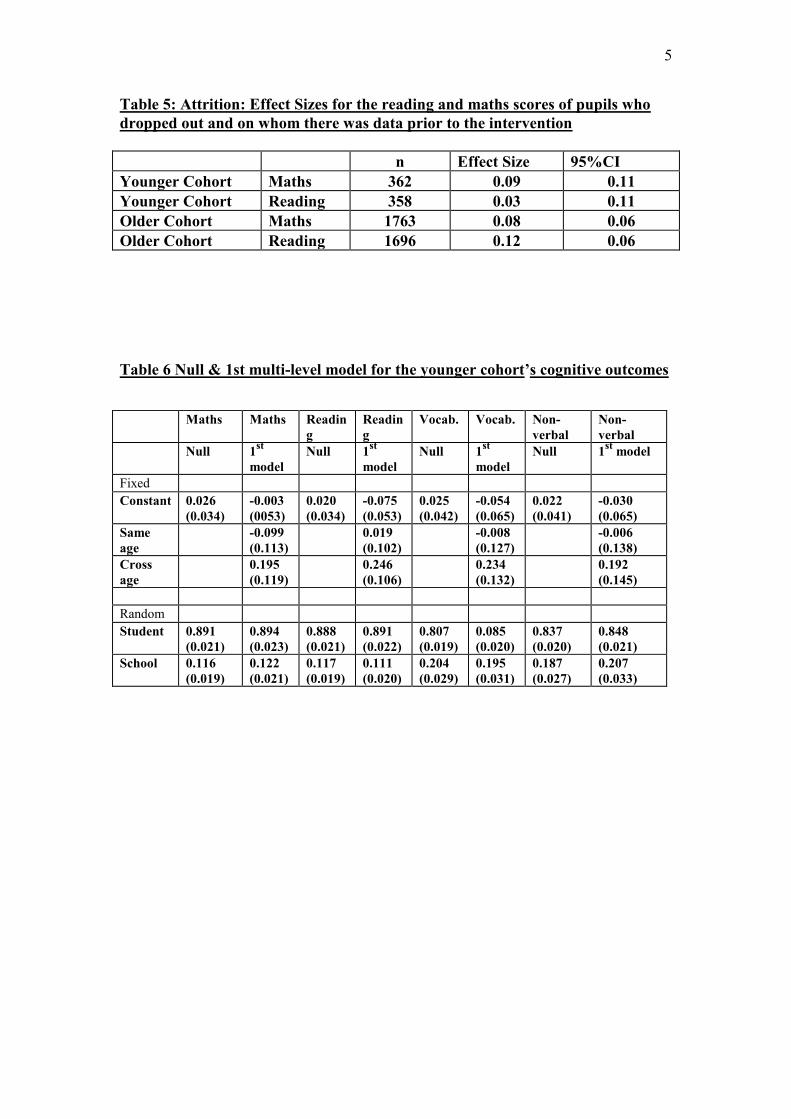
5
Table 5: Attrition: Effect Sizes for the reading and maths scores of pupils who
dropped out and on whom there was data prior to the intervention
n Effect Size 95%CI
Younger Cohort Maths 362 0.09 0.11
Younger Cohort Reading 358 0.03 0.11
Older Cohort Maths 1763 0.08 0.06
Older Cohort Reading 1696 0.12 0.06
Table 6 Null & 1st multi-level model for the younger cohort’s cognitive outcomes
Maths Maths Readin
g
Readin
g
Vocab. Vocab. Non-
verbal
Non-
verbal
Null 1st
model
Null 1st
model
Null 1st
model
Null 1st
model
Fixed
Constant 0.026
(0.034)
-0.003
(0053)
0.020
(0.034)
-0.075
(0.053)
0.025
(0.042)
-0.054
(0.065)
0.022
(0.041)
-0.030
(0.065)
Same
age
-0.099
(0.113) 0.019
(0.102) -0.008
(0.127)
-0.006
(0.138) Cross
age
0.195
(0.119) 0.246
(0.106) 0.234
(0.132)
0.192
(0.145)
Random
Student 0.891
(0.021)
0.894
(0.023)
0.888
(0.021)
0.891
(0.022)
0.807
(0.019)
0.085
(0.020)
0.837
(0.020)
0.848
(0.021)
School 0.116
(0.019)
0.122
(0.021)
0.117
(0.019)
0.111
(0.020)
0.204
(0.029)
0.195
(0.031)
0.187
(0.027)
0.207
(0.033)
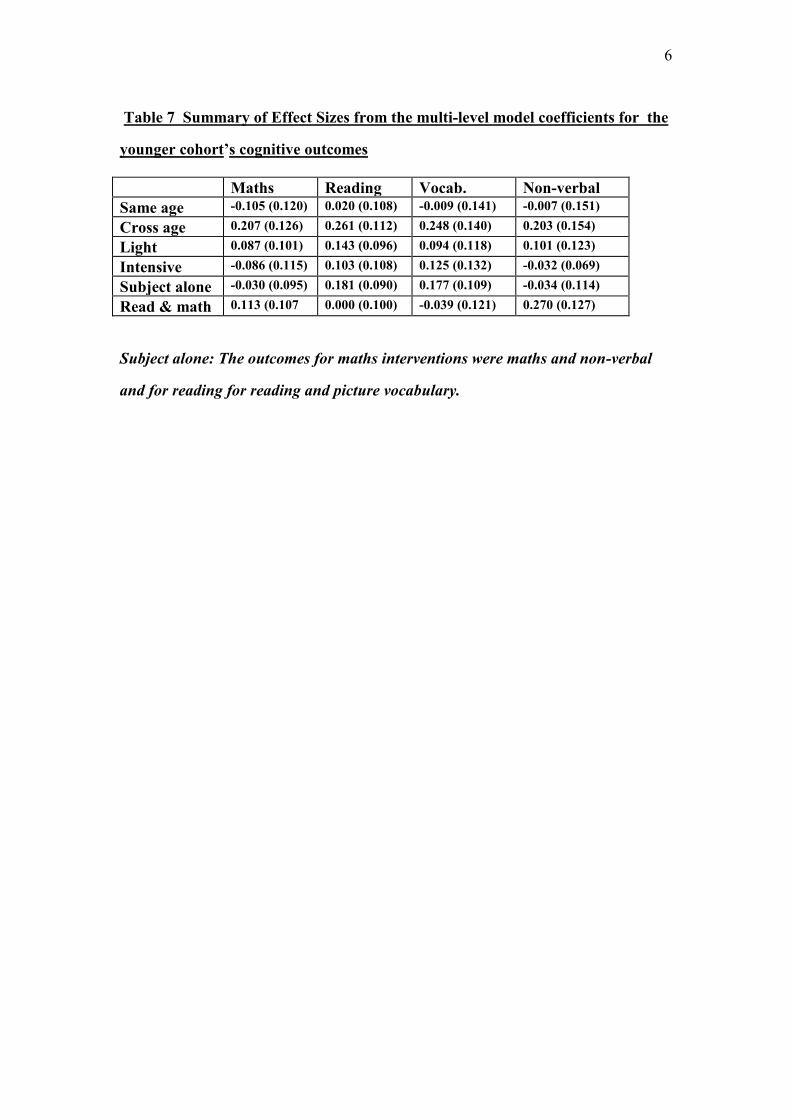
6
Table 7 Summary of Effect Sizes from the multi-level model coefficients for the
younger cohort’s cognitive outcomes
Maths Reading Vocab. Non-verbal
Same age -0.105 (0.120) 0.020 (0.108) -0.009 (0.141) -0.007 (0.151)
Cross age 0.207 (0.126) 0.261 (0.112) 0.248 (0.140) 0.203 (0.154)
Light 0.087 (0.101) 0.143 (0.096) 0.094 (0.118) 0.101 (0.123)
Intensive -0.086 (0.115) 0.103 (0.108) 0.125 (0.132) -0.032 (0.069)
Subject alone -0.030 (0.095) 0.181 (0.090) 0.177 (0.109) -0.034 (0.114)
Read & math 0.113 (0.107 0.000 (0.100) -0.039 (0.121) 0.270 (0.127)
Subject alone: The outcomes for maths interventions were maths and non-verbal
and for reading for reading and picture vocabulary.

7
Table 8 Summary of Effect Sizes from the multi-level model coefficients for the
older cohort’s cognitive outcomes
Maths Reading Science Vocab. Non-verbal
Same age 0.001 (0.119) -0.056 (0.127) -0.064 (0.117) -0.096 (0.142) -0.070 (0.162)
Cross age 0.221 (0.120) 0.253 (0.131) 0.236 (0.120) 0.284 (0.143) 0.053 (0.154)
Light 0.184 (0.106) 0.102 (0.114) 0.081 (0.107) 0.033 (0.125) 0.047 (0.135)
Intensive -0.086 (0.105) 0.003 (0.129) 0.002 (0.119) 0.104 (0.142) -0.170 (0.148)
Subject alone 0.106 (0.110) -0.033 (0.114) 0.036 (0.108) 0.005 (0.131) -0.051 (0.137)
Read &
maths
0.101 (0.118) 0.280 (0.125) 0.100 (0.115) 0.208 (0.143) 0.032 (0.146)
Subject alone: The outcomes for maths interventions were maths, science and non-
verbal and for reading and Picture vocabulary.
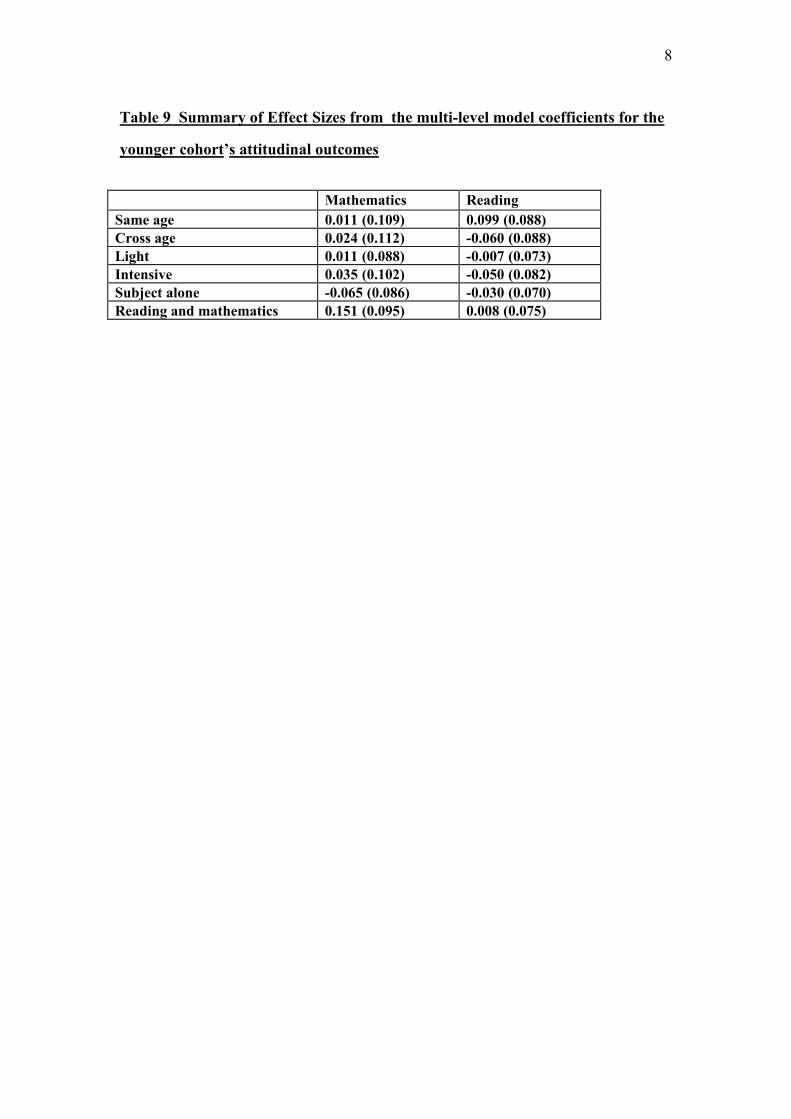
8
Table 9 Summary of Effect Sizes from the multi-level model coefficients for the
younger cohort’s attitudinal outcomes
Mathematics Reading
Same age 0.011 (0.109) 0.099 (0.088)
Cross age 0.024 (0.112) -0.060 (0.088)
Light 0.011 (0.088) -0.007 (0.073)
Intensive 0.035 (0.102) -0.050 (0.082)
Subject alone -0.065 (0.086) -0.030 (0.070)
Reading and mathematics 0.151 (0.095) 0.008 (0.075)
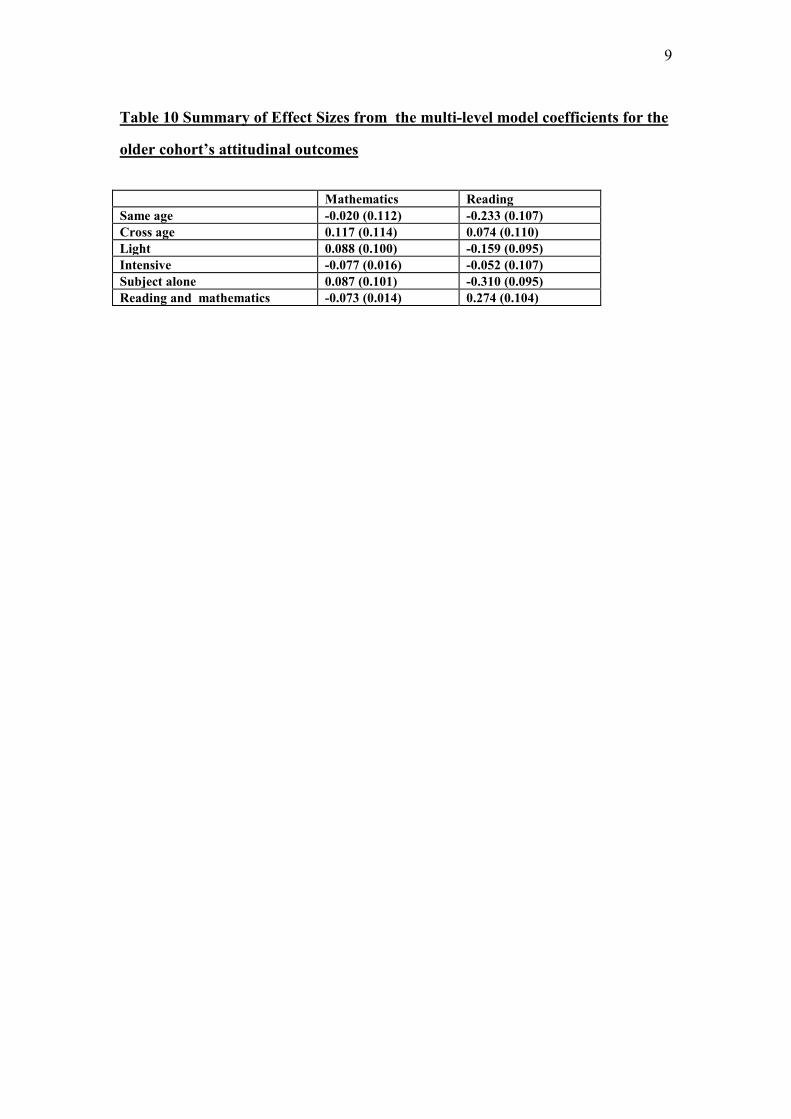
9
Table 10 Summary of Effect Sizes from the multi-level model coefficients for the
older cohort’s attitudinal outcomes
Mathematics Reading
Same age -0.020 (0.112) -0.233 (0.107)
Cross age 0.117 (0.114) 0.074 (0.110)
Light 0.088 (0.100) -0.159 (0.095)
Intensive -0.077 (0.016) -0.052 (0.107)
Subject alone 0.087 (0.101) -0.310 (0.095)
Reading and mathematics -0.073 (0.014) 0.274 (0.104)