Embed Size (px)
Citation preview
Durham Research Online
Deposited in DRO:
10 July 2014
Version of attached �le:
Accepted Version
Peer-review status of attached �le:
Peer-reviewed
Citation for published item:
Dra�c��nsk�y, M. and �S�ala, M. and Hodgkinson, P. (2014) 'Dynamics of water molecules and sodium ions in solidhydrates of nucleotides.', CrystEngComm., 16 (29). pp. 6756-6764.
Further information on publisher's website:
http://dx.doi.org/10.1039/c4ce00727a
Publisher's copyright statement:
Additional information:
Use policy
The full-text may be used and/or reproduced, and given to third parties in any format or medium, without prior permission or charge, forpersonal research or study, educational, or not-for-pro�t purposes provided that:
• a full bibliographic reference is made to the original source
• a link is made to the metadata record in DRO
• the full-text is not changed in any way
The full-text must not be sold in any format or medium without the formal permission of the copyright holders.
Please consult the full DRO policy for further details.
Durham University Library, Stockton Road, Durham DH1 3LY, United KingdomTel : +44 (0)191 334 3042 | Fax : +44 (0)191 334 2971
http://dro.dur.ac.uk
1
Dynamics of water molecules and sodium ions in solid hydrates of nucleotides
Martin Dračínský,a,b,* Michal Šála,b Paul Hodgkinsona,*
aDepartment of Chemistry, Durham University, South Road, DH1 3LE, Durham, UK
bInstitute of Organic Chemistry and Biochemistry, Flemingovo nám. 2, 16610, Prague, Czech Republic
Abstract
Nuclear magnetic resonance experiments together with molecular dynamics simulations and
NMR calculations are used to investigate mobility of water molecules and sodium ions in solid
hydrates of two nucleotides. The structure of guanosine monophosphate system (GMP) is relatively
rigid, with a well-ordered solvation shell of the nucleotide, while the water molecules in the uridine
monophosphate system (UMP) are shown to be remarkably mobile even at –80 °C. The disorder of
water molecules is observed in the 13C, 31P, and 23Na solid-state NMR experiments as multiple signals
for equivalent sites of the nucleotide corresponding to different local arrangements of the solvation
shell. Deuterium NMR spectra of the samples recrystallized from D2O also confirm differences in
water mobility between the two systems. The experiments were complemented with NMR
calculations on an ensemble of structures obtained from DFT molecular dynamics (MD) simulations.
The MD simulations confirmed higher water mobility in the UMP system and the calculated chemical
shifts and quadrupolar couplings were consistent with the experimental data. The disordered
solvation shell in UMP is likely to be a good model for solvated nucleotides in general, with fast
reorientation of water molecules and fluctuations in the hydrogen-bond network.
Introduction
A thorough description of the structure of the solvent shells surrounding nucleic acid (NA)
systems is important for understanding most molecular recognition processes, ranging from the
sequence-specific DNA recognition1-4 to drug-nucleic acid interactions5-7 and DNA conduction. The
stability and conformational flexibility of nucleic acids are due largely to interactions with the
aqueous surroundings,8-9 while localized structural water molecules effectively extend specific
nucleic acid structures around the groove regions of multistranded nucleic acids.8, 10 The
development of an adequate description of the hydration and electrostatic properties of the highly
charged nucleic acids is thus essential for future modelling of nucleic acid structures.8
Because RNA and DNA are polyanions, their structure and biological function depends
strongly on their association with metal ions. However, the dynamic non-covalent nature of these
interactions has continually presented challenges to the development of accurate and quantitative
descriptions.11 Metal ions are involved in almost every aspect of nucleic acid chemistry, ranging from
neutralization of the anionic nucleic acids12 through specific stabilization of three-dimensional
structures of NA molecules up to their effect as cofactors in RNA-mediated catalysis.13
Several spectroscopic methods have been employed in recent years to study the structures
of hydrated ions and their aqueous environment.14 Although hydration patterns are difficult to study
directly, techniques such as dielectric15 and terahertz16 spectroscopy, fluorescence labelling,17 optical
spectroscopies,18-19 and nuclear magnetic resonance20 have revealed important information about
the interaction of biomolecules with water in solutions, such as the number of water molecules in
2
the first solvation shell, the affinity of water molecules for different groups, and the strength of the
intermolecular hydrogen-bond interactions. However, the solvation shell dynamics are difficult to
assess by these techniques.
The three-dimensional structure determinations of biological macromolecules, such as
proteins and nucleic acids, by X-ray crystallography have significantly improved our understanding of
biological processes. However, since it is very hard to identify hydrogen atoms accurately using X-ray
diffraction, a detailed discussion of protonation and hydration sites can only be speculated upon so
far.21 Direct detection of light alkali metal ions by diffraction techniques is also challenging, especially
for sodium cations, because their X-ray scattering contributions are virtually identical to those of
water, and Na+···O distances are only slightly shorter than strong hydrogen bonds between well-
ordered water molecules.22 This often renders it impossible to identify Na+ ions even with state-of-
the-art diffraction techniques.
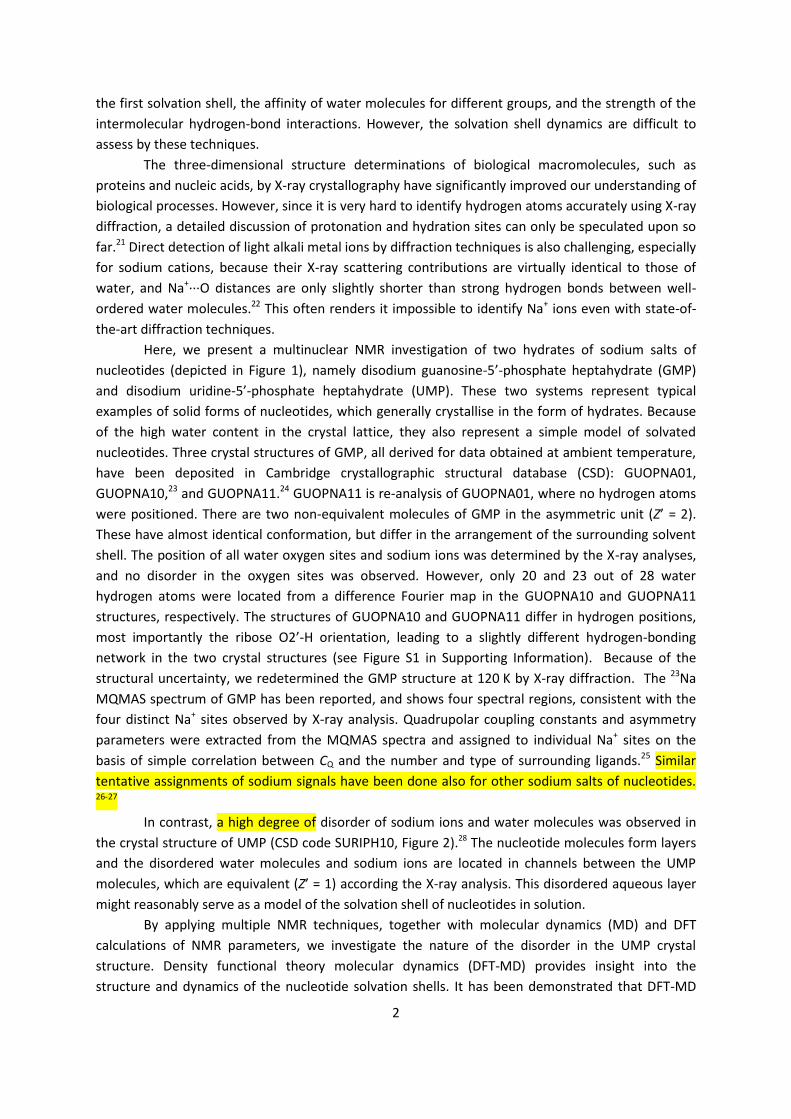
Here, we present a multinuclear NMR investigation of two hydrates of sodium salts of
nucleotides (depicted in Figure 1), namely disodium guanosine-5’-phosphate heptahydrate (GMP)
and disodium uridine-5’-phosphate heptahydrate (UMP). These two systems represent typical
examples of solid forms of nucleotides, which generally crystallise in the form of hydrates. Because
of the high water content in the crystal lattice, they also represent a simple model of solvated
nucleotides. Three crystal structures of GMP, all derived for data obtained at ambient temperature,
have been deposited in Cambridge crystallographic structural database (CSD): GUOPNA01,
GUOPNA10,23 and GUOPNA11.24 GUOPNA11 is re-analysis of GUOPNA01, where no hydrogen atoms
were positioned. There are two non-equivalent molecules of GMP in the asymmetric unit (Z’ = 2).
These have almost identical conformation, but differ in the arrangement of the surrounding solvent
shell. The position of all water oxygen sites and sodium ions was determined by the X-ray analyses,
and no disorder in the oxygen sites was observed. However, only 20 and 23 out of 28 water
hydrogen atoms were located from a difference Fourier map in the GUOPNA10 and GUOPNA11
structures, respectively. The structures of GUOPNA10 and GUOPNA11 differ in hydrogen positions,
most importantly the ribose O2’-H orientation, leading to a slightly different hydrogen-bonding
network in the two crystal structures (see Figure S1 in Supporting Information). Because of the
structural uncertainty, we redetermined the GMP structure at 120 K by X-ray diffraction. The 23Na
MQMAS spectrum of GMP has been reported, and shows four spectral regions, consistent with the
four distinct Na+ sites observed by X-ray analysis. Quadrupolar coupling constants and asymmetry
parameters were extracted from the MQMAS spectra and assigned to individual Na+ sites on the
basis of simple correlation between CQ and the number and type of surrounding ligands.25 Similar
tentative assignments of sodium signals have been done also for other sodium salts of nucleotides. 26-27
In contrast, a high degree of disorder of sodium ions and water molecules was observed in
the crystal structure of UMP (CSD code SURIPH10, Figure 2).28 The nucleotide molecules form layers
and the disordered water molecules and sodium ions are located in channels between the UMP
molecules, which are equivalent (Z’ = 1) according the X-ray analysis. This disordered aqueous layer
might reasonably serve as a model of the solvation shell of nucleotides in solution.
By applying multiple NMR techniques, together with molecular dynamics (MD) and DFT
calculations of NMR parameters, we investigate the nature of the disorder in the UMP crystal
structure. Density functional theory molecular dynamics (DFT-MD) provides insight into the
structure and dynamics of the nucleotide solvation shells. It has been demonstrated that DFT-MD
3
simulations are superior to classical force-field simulations when modeling hydration shells of polar
molecules; DFT-MD provided more structured solvation shells and NMR calculations based on the
DFT-MD simulations were in very good agreement with experiment.20, 29-30 The combination of NMR
experiments with theoretical calculations makes it possible to connect experimental observations
with structural and dynamic characteristics of the studied systems.
Figure 1. Structure of the studied nucleotides with atom numbering.
Figure 2. Left: Crystal structure of UMP (SURIPH10 structure28) – water molecules and sodium ions
are disordered in the chanel formed by the nucleotide molecules; Right: crystal structure of GMP
determined in this work.
Methods
The samples of GMP and UMP were obtained from Sigma-Aldrich and recrystallized from
H2O and D2O mixtures with methanol, ethanol or acetone. The content of crystal water molecules
was determined by elemental analysis (SI) and it differed only slightly, in the range 6.5–7 water
molecules per nucleotide, depending on the crystallisation conditions. 13C CP MAS spectra of the
UMP samples recrystallized from different solvent mixtures were virtually identical.
Crystal data for GMP were collected at 120 K on an Agilent Gemini S-Ultra diffractometer (-
scan, 0.5°/frame) yielding 9320 independent reflections (Rmerg = 0.1005). The structure was solved by
direct method and refined by full-matrix least squares on F2 for all data using SHELXTL31 and OLEX232
software. The crystal data and experimental details are summarized in the SI. All non-hydrogen
4
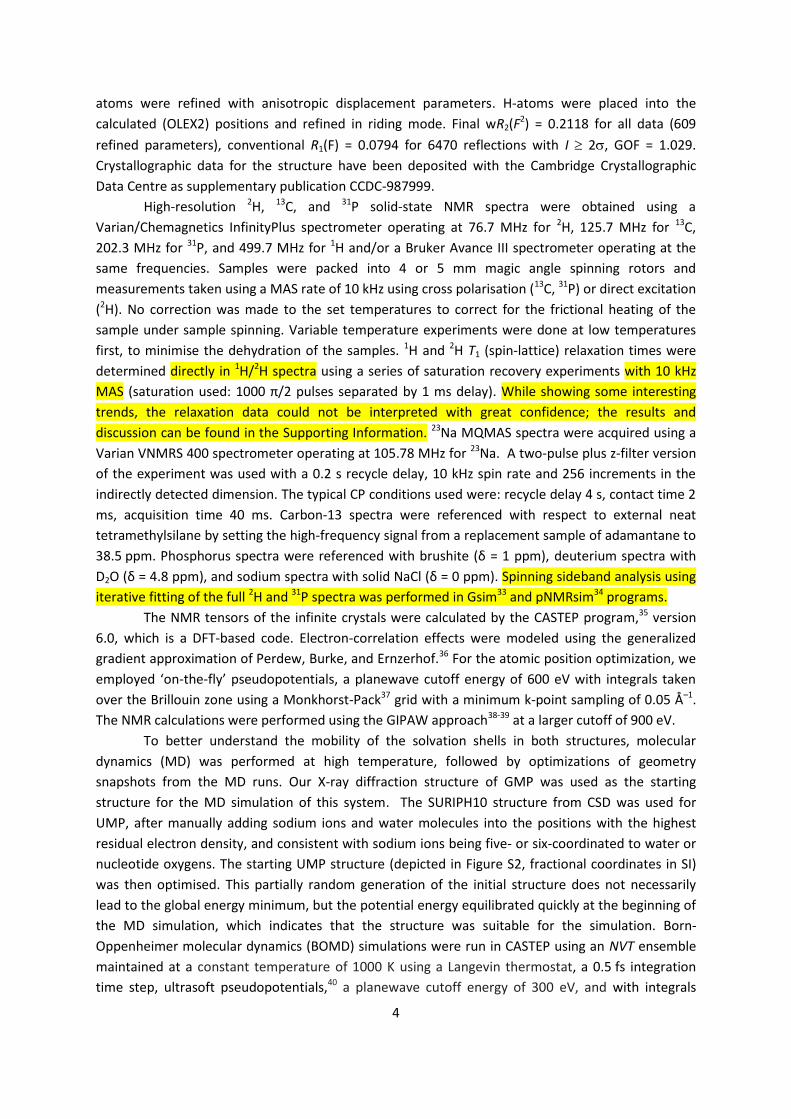
atoms were refined with anisotropic displacement parameters. H-atoms were placed into the
calculated (OLEX2) positions and refined in riding mode. Final wR2(F2) = 0.2118 for all data (609
refined parameters), conventional R1(F) = 0.0794 for 6470 reflections with I 2, GOF = 1.029.
Crystallographic data for the structure have been deposited with the Cambridge Crystallographic
Data Centre as supplementary publication CCDC-987999.
High-resolution 2H, 13C, and 31P solid-state NMR spectra were obtained using a
Varian/Chemagnetics InfinityPlus spectrometer operating at 76.7 MHz for 2H, 125.7 MHz for 13C,
202.3 MHz for 31P, and 499.7 MHz for 1H and/or a Bruker Avance III spectrometer operating at the
same frequencies. Samples were packed into 4 or 5 mm magic angle spinning rotors and
measurements taken using a MAS rate of 10 kHz using cross polarisation (13C, 31P) or direct excitation
(2H). No correction was made to the set temperatures to correct for the frictional heating of the
sample under sample spinning. Variable temperature experiments were done at low temperatures
first, to minimise the dehydration of the samples. 1H and 2H T1 (spin-lattice) relaxation times were
determined directly in 1H/2H spectra using a series of saturation recovery experiments with 10 kHz
MAS (saturation used: 1000 π/2 pulses separated by 1 ms delay). While showing some interesting
trends, the relaxation data could not be interpreted with great confidence; the results and
discussion can be found in the Supporting Information. 23Na MQMAS spectra were acquired using a
Varian VNMRS 400 spectrometer operating at 105.78 MHz for 23Na. A two-pulse plus z-filter version
of the experiment was used with a 0.2 s recycle delay, 10 kHz spin rate and 256 increments in the
indirectly detected dimension. The typical CP conditions used were: recycle delay 4 s, contact time 2
ms, acquisition time 40 ms. Carbon-13 spectra were referenced with respect to external neat
tetramethylsilane by setting the high-frequency signal from a replacement sample of adamantane to
38.5 ppm. Phosphorus spectra were referenced with brushite (δ = 1 ppm), deuterium spectra with
D2O (δ = 4.8 ppm), and sodium spectra with solid NaCl (δ = 0 ppm). Spinning sideband analysis using
iterative fitting of the full 2H and 31P spectra was performed in Gsim33 and pNMRsim34 programs.
The NMR tensors of the infinite crystals were calculated by the CASTEP program,35 version
6.0, which is a DFT-based code. Electron-correlation effects were modeled using the generalized
gradient approximation of Perdew, Burke, and Ernzerhof.36 For the atomic position optimization, we
employed ‘on-the-fly’ pseudopotentials, a planewave cutoff energy of 600 eV with integrals taken
over the Brillouin zone using a Monkhorst-Pack37 grid with a minimum k-point sampling of 0.05 Å–1.
The NMR calculations were performed using the GIPAW approach38-39 at a larger cutoff of 900 eV.
To better understand the mobility of the solvation shells in both structures, molecular
dynamics (MD) was performed at high temperature, followed by optimizations of geometry
snapshots from the MD runs. Our X-ray diffraction structure of GMP was used as the starting
structure for the MD simulation of this system. The SURIPH10 structure from CSD was used for
UMP, after manually adding sodium ions and water molecules into the positions with the highest
residual electron density, and consistent with sodium ions being five- or six-coordinated to water or
nucleotide oxygens. The starting UMP structure (depicted in Figure S2, fractional coordinates in SI)
was then optimised. This partially random generation of the initial structure does not necessarily
lead to the global energy minimum, but the potential energy equilibrated quickly at the beginning of
the MD simulation, which indicates that the structure was suitable for the simulation. Born-
Oppenheimer molecular dynamics (BOMD) simulations were run in CASTEP using an NVT ensemble
maintained at a constant temperature of 1000 K using a Langevin thermostat, a 0.5 fs integration
time step, ultrasoft pseudopotentials,40 a planewave cutoff energy of 300 eV, and with integrals
5
taken over the Brillouin zone using a Monkhorst-Pack37 grid of a minimum k-point sampling of 0.1 Å–
1. The MD parameters were tested with respect to the convergence of atomic forces; an increase of
the cutoff energy or k-point sampling led to changes in the calculated forces lower than 0.1 eV/Å.
The lattice parameters and the positions of the nucleotide molecules were fixed to the experimental
values, and so no dispersion corrections were required to maintain cell volumes during the MD
simulations. No symmetry constraints were applied during the runs. Simulation runs of 5 ps were
performed for both compounds. 23 geometries were selected at 0.6, 0.8, 1.0 … 5.0 ps of each run for
geometry optimisation. The five lowest energy optimised UMP structures (differing by less than 1 eV
per unit cell from the lowest energy) were used for NMR calculations (see Figure S3 in the
Supporting Information).
Results
X-ray
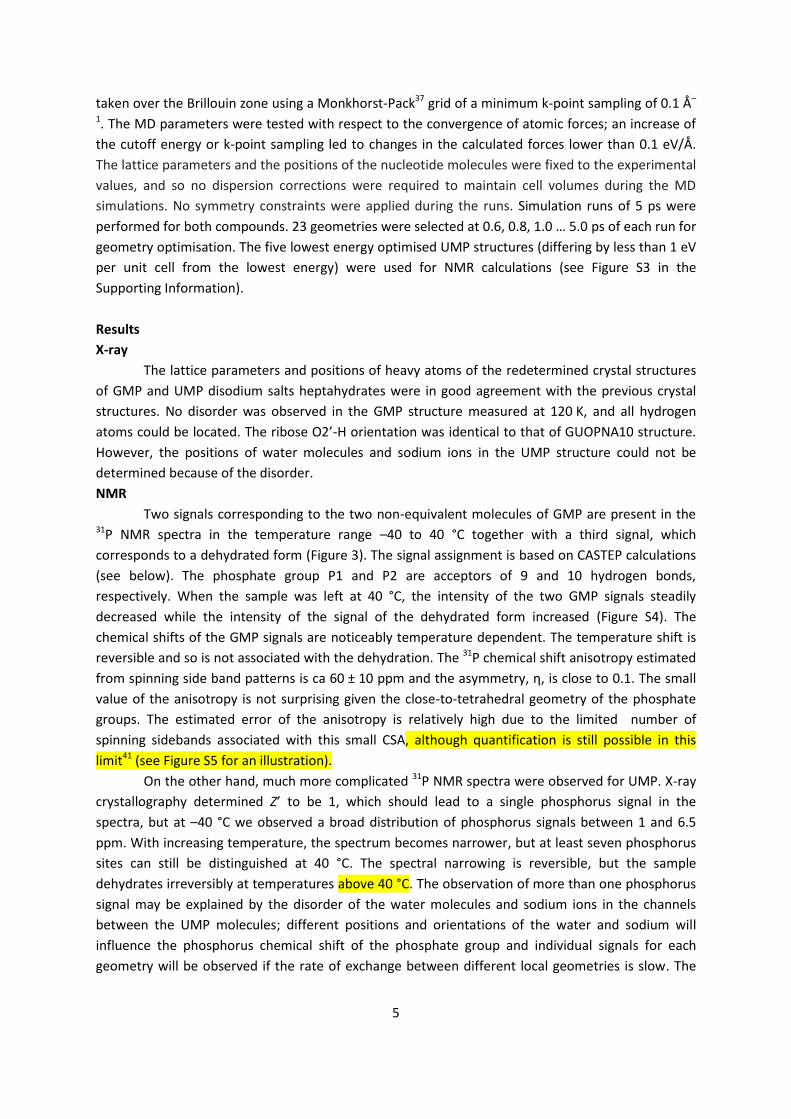
The lattice parameters and positions of heavy atoms of the redetermined crystal structures
of GMP and UMP disodium salts heptahydrates were in good agreement with the previous crystal
structures. No disorder was observed in the GMP structure measured at 120 K, and all hydrogen
atoms could be located. The ribose O2’-H orientation was identical to that of GUOPNA10 structure.
However, the positions of water molecules and sodium ions in the UMP structure could not be
determined because of the disorder.
NMR
Two signals corresponding to the two non-equivalent molecules of GMP are present in the 31P NMR spectra in the temperature range –40 to 40 °C together with a third signal, which
corresponds to a dehydrated form (Figure 3). The signal assignment is based on CASTEP calculations
(see below). The phosphate group P1 and P2 are acceptors of 9 and 10 hydrogen bonds,
respectively. When the sample was left at 40 °C, the intensity of the two GMP signals steadily
decreased while the intensity of the signal of the dehydrated form increased (Figure S4). The
chemical shifts of the GMP signals are noticeably temperature dependent. The temperature shift is
reversible and so is not associated with the dehydration. The 31P chemical shift anisotropy estimated
from spinning side band patterns is ca 60 ± 10 ppm and the asymmetry, η, is close to 0.1. The small
value of the anisotropy is not surprising given the close-to-tetrahedral geometry of the phosphate
groups. The estimated error of the anisotropy is relatively high due to the limited number of
spinning sidebands associated with this small CSA, although quantification is still possible in this
limit41 (see Figure S5 for an illustration).
On the other hand, much more complicated 31P NMR spectra were observed for UMP. X-ray
crystallography determined Z’ to be 1, which should lead to a single phosphorus signal in the
spectra, but at –40 °C we observed a broad distribution of phosphorus signals between 1 and 6.5
ppm. With increasing temperature, the spectrum becomes narrower, but at least seven phosphorus
sites can still be distinguished at 40 °C. The spectral narrowing is reversible, but the sample
dehydrates irreversibly at temperatures above 40 °C. The observation of more than one phosphorus
signal may be explained by the disorder of the water molecules and sodium ions in the channels
between the UMP molecules; different positions and orientations of the water and sodium will
influence the phosphorus chemical shift of the phosphate group and individual signals for each
geometry will be observed if the rate of exchange between different local geometries is slow. The
6
relative intensities of the spinning side bands were similar to those of the GMP crystals, i.e. the
chemical shift anisotropy is similar for all phosphorus sites in both samples. 13C cross-polarization (CP) magic-angle spinning (MAS) NMR is an efficient method for crystal
structure characterization, including determining Z’ by means of comparing the number of observed
resonances with the number of nonequivalent carbon atoms present in the molecule.42-43 Similarly to
the 31P spectra, two sets of signals corresponding to the two non-equivalent GMP molecules
accompanied by one set of signals of the dehydrated form were observed in the 13C NMR spectra of
GMP in a broad temperature range (–80–40 °C), and a distribution of signals was observed in carbon
spectra of UMP (Figure 4 and S7). The UMP signals start to merge into one set of signals at 40 °C, but
dehydration occurs at higher temperatures. It is likely that the spectrum at 40 °C is close to the fast
exchange limit. However, the narrow range of NMR frequencies spanned by a given site (of the order
of 200 Hz) means that the exchange rates are low in absolute terms, and the barriers involved must,
therefore, be relatively high. It is, therefore, unsurprising that the fast-exchange limit is not reached
for all the 31P resonances at 40 °C, Fig. 3(b), since these span a significantly larger range of
frequencies (about 1200 Hz). It is clear from the 31P spectrum, however, that multiple sites and
effective barriers are involved, with the fast exchange regime for different sites being reached at
different temperatures.
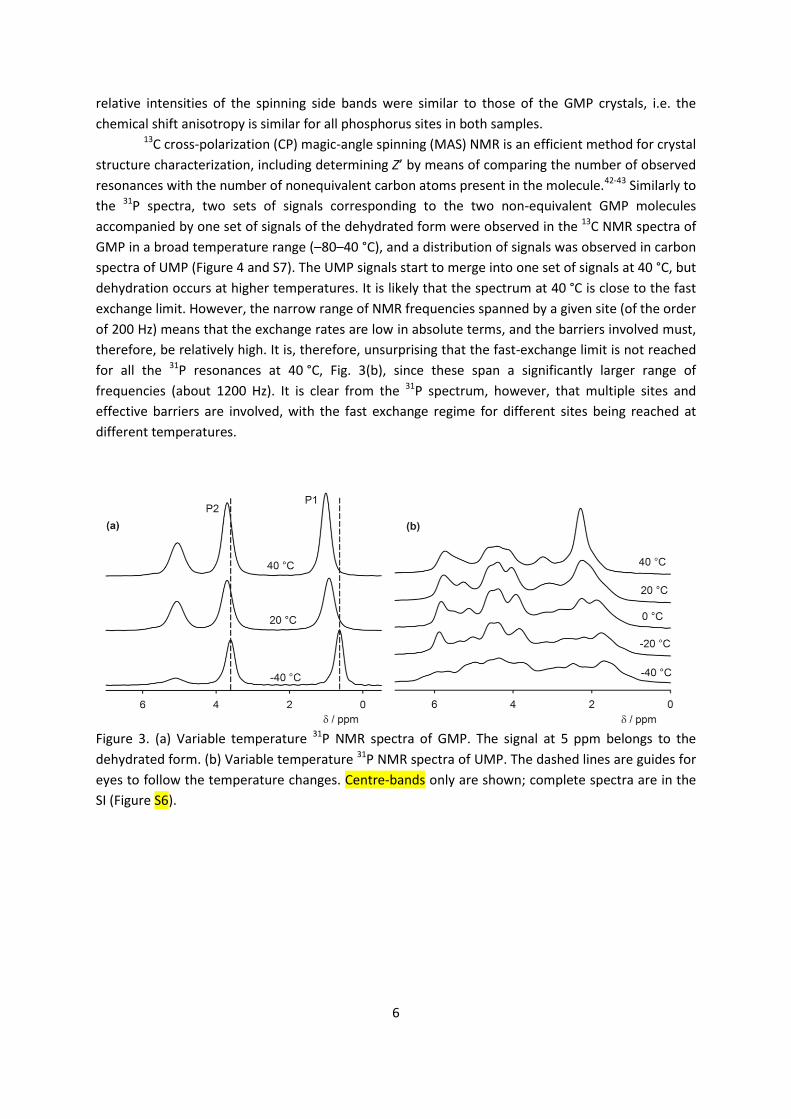
Figure 3. (a) Variable temperature 31P NMR spectra of GMP. The signal at 5 ppm belongs to the
dehydrated form. (b) Variable temperature 31P NMR spectra of UMP. The dashed lines are guides for
eyes to follow the temperature changes. Centre-bands only are shown; complete spectra are in the
SI (Figure S6).
7
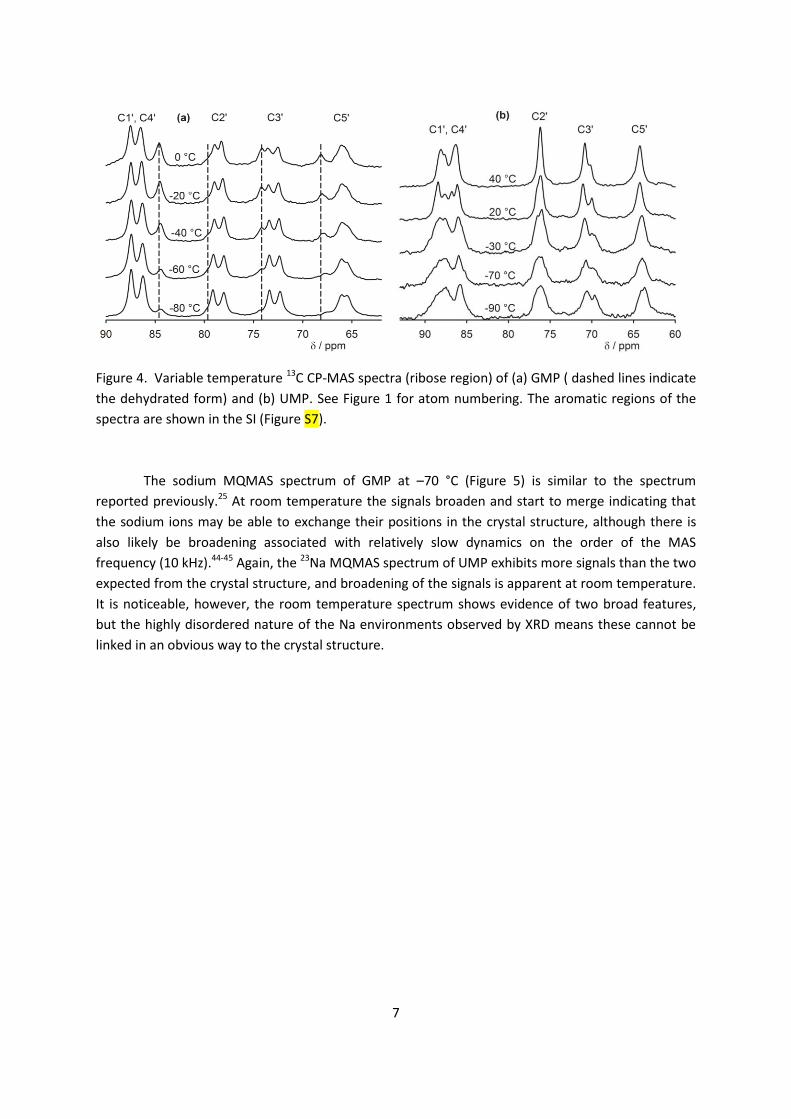
Figure 4. Variable temperature 13C CP-MAS spectra (ribose region) of (a) GMP ( dashed lines indicate
the dehydrated form) and (b) UMP. See Figure 1 for atom numbering. The aromatic regions of the
spectra are shown in the SI (Figure S7).
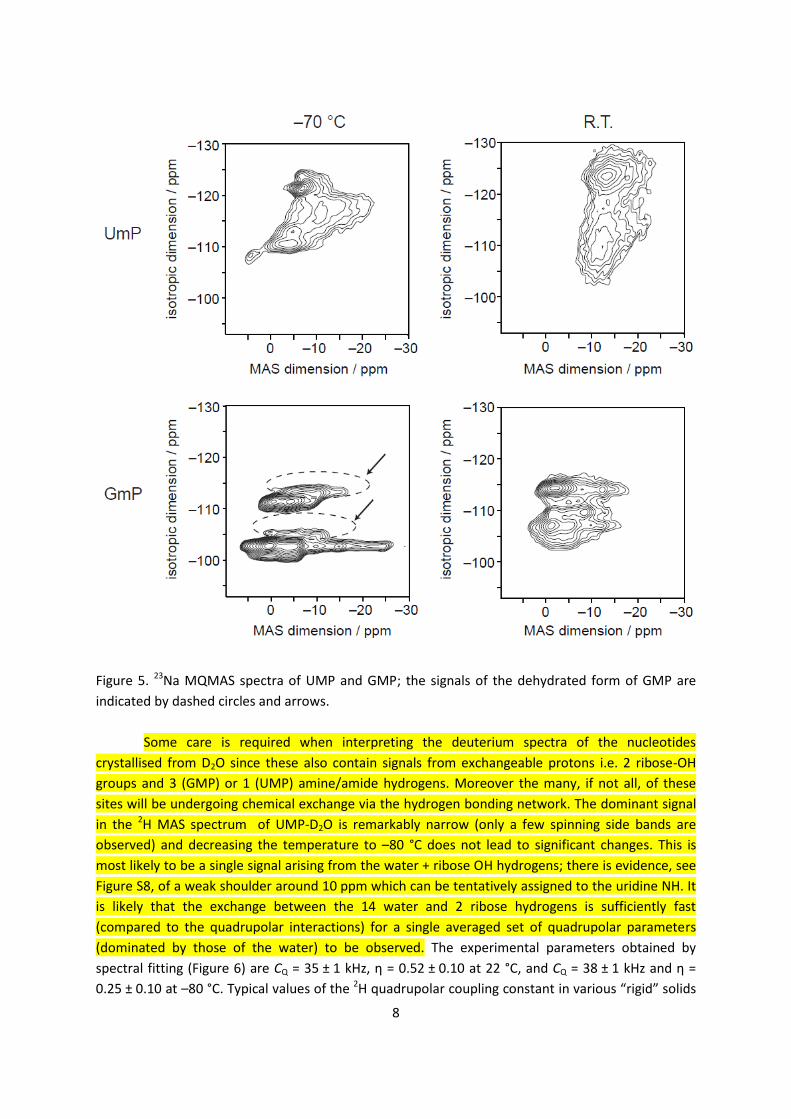
The sodium MQMAS spectrum of GMP at –70 °C (Figure 5) is similar to the spectrum
reported previously.25 At room temperature the signals broaden and start to merge indicating that
the sodium ions may be able to exchange their positions in the crystal structure, although there is
also likely be broadening associated with relatively slow dynamics on the order of the MAS
frequency (10 kHz).44-45 Again, the 23Na MQMAS spectrum of UMP exhibits more signals than the two
expected from the crystal structure, and broadening of the signals is apparent at room temperature.
It is noticeable, however, the room temperature spectrum shows evidence of two broad features,
but the highly disordered nature of the Na environments observed by XRD means these cannot be
linked in an obvious way to the crystal structure.
8
Figure 5. 23Na MQMAS spectra of UMP and GMP; the signals of the dehydrated form of GMP are
indicated by dashed circles and arrows.
Some care is required when interpreting the deuterium spectra of the nucleotides
crystallised from D2O since these also contain signals from exchangeable protons i.e. 2 ribose-OH
groups and 3 (GMP) or 1 (UMP) amine/amide hydrogens. Moreover the many, if not all, of these
sites will be undergoing chemical exchange via the hydrogen bonding network. The dominant signal
in the 2H MAS spectrum of UMP-D2O is remarkably narrow (only a few spinning side bands are
observed) and decreasing the temperature to –80 °C does not lead to significant changes. This is
most likely to be a single signal arising from the water + ribose OH hydrogens; there is evidence, see
Figure S8, of a weak shoulder around 10 ppm which can be tentatively assigned to the uridine NH. It
is likely that the exchange between the 14 water and 2 ribose hydrogens is sufficiently fast
(compared to the quadrupolar interactions) for a single averaged set of quadrupolar parameters
(dominated by those of the water) to be observed. The experimental parameters obtained by
spectral fitting (Figure 6) are CQ = 35 ± 1 kHz, η = 0.52 ± 0.10 at 22 °C, and CQ = 38 ± 1 kHz and η =
0.25 ± 0.10 at –80 °C. Typical values of the 2H quadrupolar coupling constant in various “rigid” solids
9
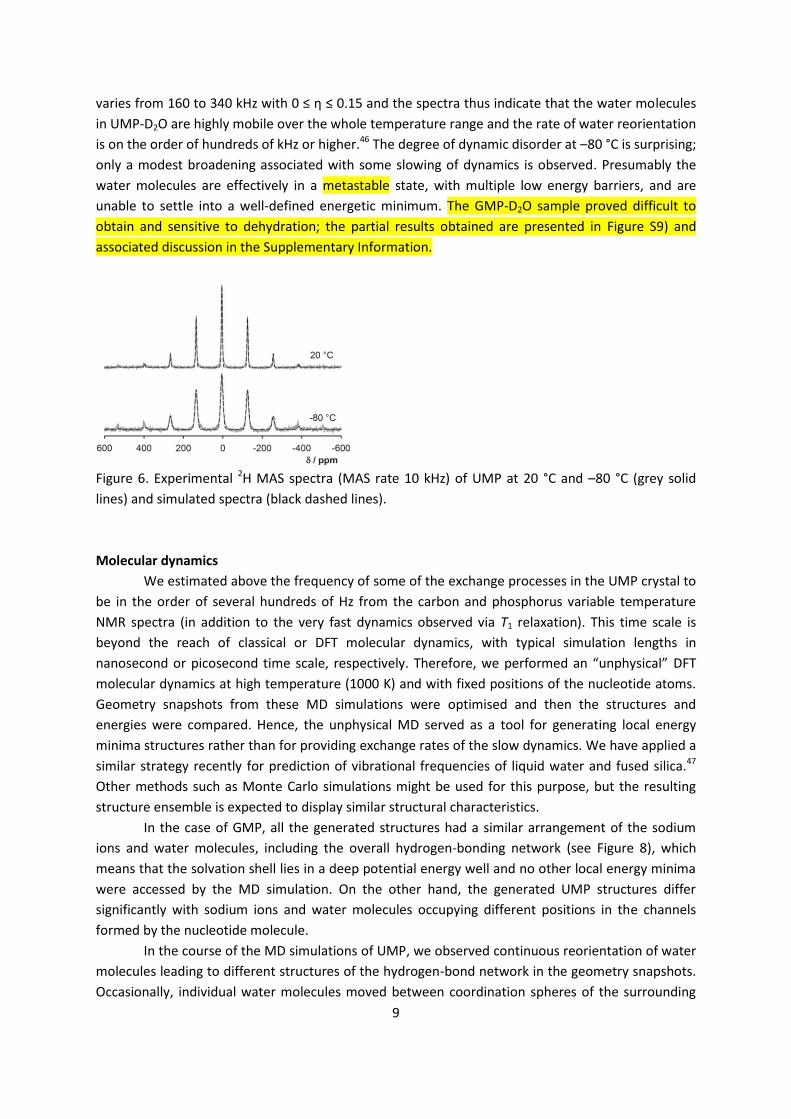
varies from 160 to 340 kHz with 0 ≤ η ≤ 0.15 and the spectra thus indicate that the water molecules
in UMP-D2O are highly mobile over the whole temperature range and the rate of water reorientation
is on the order of hundreds of kHz or higher.46 The degree of dynamic disorder at –80 °C is surprising;
only a modest broadening associated with some slowing of dynamics is observed. Presumably the
water molecules are effectively in a metastable state, with multiple low energy barriers, and are
unable to settle into a well-defined energetic minimum. The GMP-D2O sample proved difficult to
obtain and sensitive to dehydration; the partial results obtained are presented in Figure S9) and
associated discussion in the Supplementary Information.
Figure 6. Experimental 2H MAS spectra (MAS rate 10 kHz) of UMP at 20 °C and –80 °C (grey solid
lines) and simulated spectra (black dashed lines).
Molecular dynamics
We estimated above the frequency of some of the exchange processes in the UMP crystal to
be in the order of several hundreds of Hz from the carbon and phosphorus variable temperature
NMR spectra (in addition to the very fast dynamics observed via T1 relaxation). This time scale is
beyond the reach of classical or DFT molecular dynamics, with typical simulation lengths in
nanosecond or picosecond time scale, respectively. Therefore, we performed an “unphysical” DFT
molecular dynamics at high temperature (1000 K) and with fixed positions of the nucleotide atoms.
Geometry snapshots from these MD simulations were optimised and then the structures and
energies were compared. Hence, the unphysical MD served as a tool for generating local energy
minima structures rather than for providing exchange rates of the slow dynamics. We have applied a
similar strategy recently for prediction of vibrational frequencies of liquid water and fused silica.47
Other methods such as Monte Carlo simulations might be used for this purpose, but the resulting
structure ensemble is expected to display similar structural characteristics.
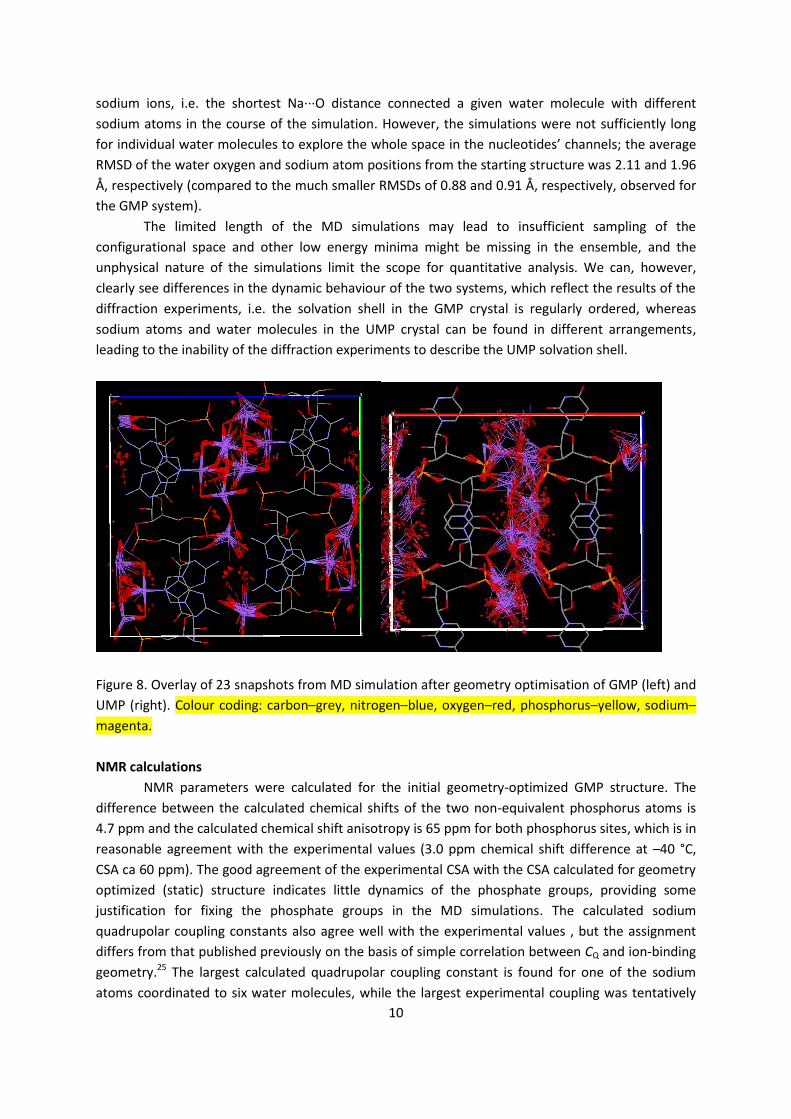
In the case of GMP, all the generated structures had a similar arrangement of the sodium
ions and water molecules, including the overall hydrogen-bonding network (see Figure 8), which
means that the solvation shell lies in a deep potential energy well and no other local energy minima
were accessed by the MD simulation. On the other hand, the generated UMP structures differ
significantly with sodium ions and water molecules occupying different positions in the channels
formed by the nucleotide molecule.
In the course of the MD simulations of UMP, we observed continuous reorientation of water
molecules leading to different structures of the hydrogen-bond network in the geometry snapshots.
Occasionally, individual water molecules moved between coordination spheres of the surrounding
10
sodium ions, i.e. the shortest Na···O distance connected a given water molecule with different
sodium atoms in the course of the simulation. However, the simulations were not sufficiently long
for individual water molecules to explore the whole space in the nucleotides’ channels; the average
RMSD of the water oxygen and sodium atom positions from the starting structure was 2.11 and 1.96
Å, respectively (compared to the much smaller RMSDs of 0.88 and 0.91 Å, respectively, observed for
the GMP system).
The limited length of the MD simulations may lead to insufficient sampling of the
configurational space and other low energy minima might be missing in the ensemble, and the
unphysical nature of the simulations limit the scope for quantitative analysis. We can, however,
clearly see differences in the dynamic behaviour of the two systems, which reflect the results of the
diffraction experiments, i.e. the solvation shell in the GMP crystal is regularly ordered, whereas
sodium atoms and water molecules in the UMP crystal can be found in different arrangements,
leading to the inability of the diffraction experiments to describe the UMP solvation shell.
Figure 8. Overlay of 23 snapshots from MD simulation after geometry optimisation of GMP (left) and
UMP (right). Colour coding: carbon–grey, nitrogen–blue, oxygen–red, phosphorus–yellow, sodium–
magenta.
NMR calculations
NMR parameters were calculated for the initial geometry-optimized GMP structure. The
difference between the calculated chemical shifts of the two non-equivalent phosphorus atoms is
4.7 ppm and the calculated chemical shift anisotropy is 65 ppm for both phosphorus sites, which is in
reasonable agreement with the experimental values (3.0 ppm chemical shift difference at –40 °C,
CSA ca 60 ppm). The good agreement of the experimental CSA with the CSA calculated for geometry
optimized (static) structure indicates little dynamics of the phosphate groups, providing some
justification for fixing the phosphate groups in the MD simulations. The calculated sodium
quadrupolar coupling constants also agree well with the experimental values , but the assignment
differs from that published previously on the basis of simple correlation between CQ and ion-binding
geometry.25 The largest calculated quadrupolar coupling constant is found for one of the sodium
atoms coordinated to six water molecules, while the largest experimental coupling was tentatively
11
assigned to the sodium atom coordinated to four water molecules and two nitrogen atoms (see
Table 1). The experimental 23Na chemical shifts cover too narrow a range (about 4 ppm) for the
calculated Na shieldings to provide useful additional information.
Table 1. Experimental and calculated 23Na quadrupolar coupling constants in GMP.
Sodium site Na coordinationa CQ ,calc / MHz CQ, exp / MHzb
Na1 4W,2OH 1.44 1.30
Na2 6W 1.67 1.85
Na3 6W 2.27 2.30
Na4 4W,2N 1.75 1.85 aW–water molecule; OH–ribose hydroxyl group; N–guanine nitrogen atom N7. bThe experimental
values are from ref.25 (uncertainties not given), but our assignment based on CASTEP calculations
interchanges the quadrupolar couplings of Na3 and Na4.
We also calculated NMR parameters for the five lowest energy optimised geometry
snapshots from the MD simulations of UMP. The limited length of the MD simulation and the
number of NMR calculations is partly compensated by the size of the unit cell (eight nucleotide
molecules, 16 sodium ions, and 56 water molecules). No symmetry constraints were applied during
the simulations, therefore, the structure of the solvation shell of the eight nucleotide molecules
differed and so the nucleotide 31P NMR parameters were averaged for 40 local solvation
arrangements. Importantly, NMR data (span of chemical shifts and averaged quadrupolar couplings)
calculated for the individual optimised snapshot geometries are qualitatively consistent with the
results averaged for the five structures. For example, the calculated phosphorus chemical shifts are
distributed over similar ranges in the five snapshots (see Table S1 in SI), i.e. increasing the number of
structures for NMR calculation is unlikely to change the qualitative picture significantly. We do not
see any clear correlation between the calculated phosphorus chemical shifts and the hydration
pattern (number of hydrogen bonds or number of sodium ions in close vicinity) of the phosphate
group.
The calculated phosphorus chemical shift anisotropy is found in the range of 55–66 ppm and
is almost unaffected by the dynamics, i.e. the shielding tensor of one phosphorus site averaged over
the five optimised structures is very close to the individual CSA tensors. Carbon chemical shifts of
individual sites were distributed over 2.8–9.0 ppm with the narrowest distribution for carbon C4,
which had also the narrowest line in experimental spectra, and the broadest distribution for carbon
atoms C5 and C6, which have also the broadest experimental signal (see Figure S7 in SI). The
convergence of the carbon chemical shift spans with the number of geometry snapshots is
illustrated in Figure S10.
The calculated deuterium quadrupolar couplings of the water hydrogens in the five
optimised UMP structures can be found in a broad range 130–290 kHz, which is much more than the
experimental value of 35–38 kHz. As we have previously demonstrated, fast vibrational/librational
motion in “rigid” solids leads to reduction of chemical shift anisotropy and quadrupolar couplings by
only a few per cent and cannot thus explain this difference between calculated and experimental
deuterium quadrupolar couplings.48 When electric field gradient tensors of the hydrogen atoms in
individual water molecules are averaged (i.e. assuming fast C2 jumps of water), the quadrupolar
couplings of the 56 nonequivalent water molecules are reduced to ca 100–150 kHz. On the other
12
hand, when electric field gradient tensors of all water hydrogen atoms in each of the five individual
optimised structures are averaged, the resulting range of deuterium quadrupolar coupling constants
is 25–31 kHz (η = 0.07–0.47), which agrees much better with the experimental value. This agreement
confirms the high mobility of the water molecules. When EFG tensors of the ribose OH hydrogens
are averaged together with all water protons (assuming that site exchange is fast compared to the
quadrupolar couplings), the calculated quadrupolar couplings are reduced by further ca 10 kHz.
The experimental sodium spectra of UMP are too complex to compare with the calculations
directly, and there was no evidence in the calculation results of two average Na environments that
appear to be observed in the room temperature MQMAS spectrum. It is likely that the CASTEP
calculations are not sufficiently robust for 23Na shifts to try to explain rather subtle features of the
experiment, because the shift range is quite narrow. From the inspection of the MQMAS spectra it
can be expected that the experimental sodium quadrupolar couplings will be of the same order as in
the case of GMP, i.e. a few MHz. When calculated EFG tensors of the individual sodium sites are
averaged for the five UMP structures, the resulting 16 sodium quadrupolar couplings are in the
range 0.9–2.4 MHz, which is in a qualitative agreement with the experiment. On the other hand,
when the EFG tensors of all sodium sites are averaged, the calculated quadrupolar coupling is close
to 0.4 MHz, which would lead to much narrower sodium spectra. This is in agreement with the
distribution of chemical shifts observed experimentally.
Conclusions
Significant differences in the NMR spectra of UMP and GMP systems were observed. The 13C
and 31P spectra of GMP are consistent with the crystal packing found by X-ray diffraction (Z’ = 2) and
deuterium MAS spectrum shows typical features of deuterium atoms without significant mobility
(deuterium quadrupolar couplings of ca 200 kHz). On the other hand, the splitting of carbon,
phosphorus, and sodium spectra of UMP into multiple sets of signals is not consistent with one
nucleotide molecule in the asymmetric cell (Z’ = 1) found by X-ray diffraction experiment.
Furthermore, the overall width of the deuterium MAS spectrum of UMP is significantly narrower
than that of GMP, which can be explained by high water mobility in this system. The narrow
deuterium MAS spectrum was observed even at –80 °C. Deuterium T1 relaxation times in UMP are
very short in a broad temperature range, which suggest the existence of multiple motional processes
in the system.
The presented NMR experiments prove major differences in the dynamics of the solvation
shell in the two studied systems. Water molecules and sodium ions are relatively rigid in the GMP
structure, while they are very mobile in the UMP system even at temperatures far below 0 °C. The
disordered channels in the UMP crystals could be described as a rubbery state, with increasing
thermal energy turning previously static disorder into dynamic disorder. The variable temperature
NMR spectra of the UMP system exhibit continuous changes of the spectral parameters (chemical
shifts, relaxation times, and quadrupolar coupling constants), which confirms the existence of
multiple local arrangements of the UMP solvation with a slow interconversion between them. The
energy barriers involved in the interconversions have probably a broad distribution; different energy
barriers are overcome at different temperatures leading to continuous changes of the spectra.
The differences in the dynamic behaviour of the two systems are further confirmed by the
MD simulations and NMR calculations. The structure of the GMP solvation layer was stable even at
the unphysical MD simulation at 1000 K. On the other hand, the MD simulation of the UMP system
13
led to continuous changes in the hydrogen-bond network and the structure of the solvation shell.
The spans of carbon and phosphorus chemical shifts calculated for the ensemble of structures
exctracted from the UMP simulation were in qualitative agreement with the experiments. The short
time of the simulation did not allow the water molecules to explore the whole configurational space,
but when the calculated deuterium electric field gradient tensors of all water hydrogen atoms were
averaged, the resulting deuterium quadrupolar coupling agreed well with the experimental value.
The method of generation of the ensemble of structures of disordered solvation shell by
molecular dynamics simulation at high temperature within a fixed host structure, is a
straightforward way of finding different local minima on the potential energy hypersurface (similar
to simulated annealing). However, the MD method cannot be used for a quantitative interpretation
of the dynamics of the system, because the simulations were performed at unphysical conditions.
The disordered solvation shell in UMP is probably close to the situation in solution with fast
reorientation of water molecules and fluctuations in the hydrogen-bond network. The combination
of X-ray diffraction and NMR experiments with MD simulations and calculations of NMR parameters
can thus provide detailed information of the solvation shell dynamics on a molecular level.
Acknowledgement
The research leading to these results has received funding from the People Programme
(Marie Curie Actions) of the European Union's Seventh Framework Programme (FP7/2007-2013)
under REA grant agreement n° 299242. The work has been also supported by the Czech Science
Foundation (grant no. 13-24880S). 23Na MQMAS experiments were provided by David C. Apperley
through the EPSRC UK National Solid-state NMR Service at Durham, and the X-ray diffraction
experiments were done by Dmitry S. Yufit.
References
1. Otwinowski, Z.; Schevitz, R. W.; Zhang, R. G.; Lawson, C. L.; Joachimiak, A.; Marmorstein, R. Q.; Luisi, B. F.; Sigler, P. B., Nature, 1988, 335, 321-329. 2. Spyrakis, F.; Cozzini, P.; Bertoli, C.; Marabotti, A.; Kellogg, G. E.; Mozzarelli, A., BMC Struct. Biol., 2007, 7. 3. Furmanchuk, A.; Isayev, O.; Shishkin, O. V.; Gorb, L.; Leszczynski, J., Phys. Chem. Chem. Phys., 2010, 12, 3363-3375. 4. Robinson, C. R.; Sligar, S. G., Proc. Nat. Acad. Sci. USA, 1998, 95, 2186-2191. 5. Jayaram, B.; Jain, T., Annu. Rev. Biophys. Biomol. Struct., 2004, 33, 343-361. 6. Walter, N. G., Molecular Cell, 2007, 28, 923-929. 7. Auffinger, P.; Hashem, Y., Curr. Opin. Struc. Biol., 2007, 17, 325-333. 8. Westhof, E., Annu. Rev. Biophys. Biophys. Chem., 1988, 17, 125-144. 9. Saenger, W., Annu. Rev. Biophys. Biophys. Chem., 1987, 16, 93-114. 10. Drew, H. R.; Dickerson, R. E., J. Mol. Biol., 1981, 151, 535-556. 11. Nucleic Acid-Metal Ion Interactions. Royal Society of Chemistry: Cambridge, 2009. 12. Howard, J. J.; Lynch, G. C.; Pettitt, B. M., J. Phys. Chem. B, 2011, 115, 547-556. 13. Müller, J., Metallomics, 2010, 2, 318-327. 14. Marcus, Y., Chem. Rev., 2009, 109, 1346-1370. 15. Oleinikova, A.; Sasisanker, P.; Weingartner, H., J. Phys. Chem. B, 2004, 108, 8467-8474. 16. Ebbinghaus, S.; Kim, S. J.; Heyden, M.; Yu, X.; Heugen, U.; Gruebele, M.; Leitner, D. M.; Havenith, M., Proc. Nat. Acad. Sci. USA, 2007, 104, 20749-20752. 17. Summerer, D.; Chen, S.; Wu, N.; Deiters, A.; Chin, J. W.; Schultz, P. G., Proc. Nat. Acad. Sci. USA, 2006, 103, 9785-9789.
14
18. Hopmann, K. H.; Ruud, K.; Pecul, M.; Kudelski, A.; Dračínský, M.; Bouř, P., J. Phys. Chem. B, 2011, 115, 4128-4137. 19. Kapitán, J.; Dračínský, M.; Kaminský, J.; Benda, L.; Bouř, P., J. Phys. Chem. B, 2010, 114, 3574-3582. 20. Dračínský, M.; Kaminský, J.; Bouř, P., J. Phys. Chem. B, 2009, 113, 14698-14707. 21. Blakeley, M. P.; Langan, P.; Niimura, N.; Podjarny, A., Curr. Opin. Struc. Biol., 2008, 18, 593-600. 22. Tereshko, V.; Wilds, C. J.; Minasov, G.; Prakash, T. P.; Maier, M. A.; Howard, A.; Wawrzak, Z.; Manoharan, M.; Egli, M., Nucleic Acids Research, 2001, 29, 1208-1215. 23. Barnes, C. L.; Hawkinson, S. W., Acta Cryst. B, 1982, 38, 812-817. 24. Katti, S. K.; Seshadri, T. P.; Viswamitra, M. A., Acta Cryst. B, 1981, 37, 1825-1831. 25. Wu, G.; Wong, A., Solid-state nuclear magnetic resonance studies of alkali metal ions in nucleic acids and related systems. In NMR Spectroscopy of Biological Solids, Ramamoorthy, A., Ed. CRC Press: Boca Raton, 2006. 26. Wu, G.; Zhu, J. F., Prog. Nucl. Magn. Reson. Spectrosc., 2012, 61, 1-70. 27. Perras, F. A.; Bryce, D. L., J. Phys. Chem. C, 2012, 116, 19472-19482. 28. Seshadri, T. P.; Viswamitra, M. A.; Kartha, G., Acta Cryst. B, 1980, 36, 925-927. 29. Dračínský, M.; Möller, H. M.; Exner, T. E., J. Chem. Theor. Comput., 2013, 9, 3806-3815. 30. Liang, T.; Walsh, T. R., Phys. Chem. Chem. Phys., 2006, 8, 4410-4419. 31. Sheldrick, G. M., Acta Cryst., Sect. A, 2008, 64, 112-122. 32. Dolomanov, O. V.; Bourhis, L. J.; Gildea, R. J.; Howard, J. A. K.; Puschmann, H., J. Appl. Cryst., 2009, 42, 339-341. 33. Zorin, V. Gsim – a visualisation and processing program for solid-state NMR, URL: http://gsim.sourceforge.net, 2014. 34. Hodgkinson, P. pNMRsim: a general simulation program for large problems in solid-state NMR, URL: http://www.dur.ac.uk/paul.hodgkinson/pNMRsim, 2014. 35. Clark, S. J.; Segall, M. D.; Pickard, C. J.; Hasnip, P. J.; Probert, M. J.; Refson, K.; Payne, M. C., Z. Kristallogr., 2005, 220, 567-570. 36. Perdew, J. P.; Burke, K.; Ernzerhof, M., Phys. Rev. Lett., 1996, 77, 3865-3868. 37. Monkhorst, H. J.; Pack, J. D., Phys. Rev. B, 1976, 13, 5188-5192. 38. Pickard, C. J.; Mauri, F., Phys. Rev. B, 2001, 6324, 245101. 39. Yates, J. R.; Pickard, C. J.; Mauri, F., Phys. Rev. B, 2007, 76, 024401. 40. Vanderbilt, D., Phys. Rev. B, 1990, 41, 7892-7895. 41. Hodgkinson, P.; Emsley, L., J. Chem. Phys., 1997, 107, 4808-4816. 42. Harris, R. K., Analyst, 2006, 131, 351-373. 43. Apperley, D. C.; Harris, R. K.; Hodgkinson, P., Solid-State NMR: Basic Principles & Practice. Momentum Press: New York, 2012. 44. Antonijevic, S.; Ashbrook, S. E.; Biedasek, S.; Walton, R. I.; Wimperis, S.; Yang, H. X., J. Am. Chem. Soc., 2006, 128, 8054-8062. 45. Ashbrook, S. E., Phys. Chem. Chem. Phys., 2009, 11, 6892-6905. 46. O'Hare, B.; Grutzeck, M. W.; Kim, S. H.; Asay, D. B.; Benesi, A. J., J. Magn. Reson., 2008, 195, 85-102. 47. Dračínský, M.; Benda, L.; Bouř, P., Chem. Phys. Lett., 2011, 512, 54-59. 48. Dračínský, M.; Hodgkinson, P., Crystengcomm, 2013, 15, 8705-8712.


![Durham Research Online - Durham Universitydro.dur.ac.uk/13992/1/13992.pdf · synthetic molecular systems [6–9], in which charges or excitons (molecular excitations) migrate from](https://img.pdfslide.net/doc/110x75/5fb9d8c8f3f13d2306390fd6/durham-research-online-durham-synthetic-molecular-systems-6a9-in-which-charges.jpg)


![Durham Research Online - Durham Universitydro.dur.ac.uk/18570/1/18570.pdf · capture human behaviour render pure data analytics inadequate to provide reliable decision support [2][3]](https://img.pdfslide.net/doc/110x75/5ed07f085eaa90553a7caf9a/durham-research-online-durham-capture-human-behaviour-render-pure-data-analytics.jpg)