Embed Size (px)
Citation preview
Geomorphology 123 (2010) 243–256
Contents lists available at ScienceDirect
Geomorphology
j ourna l homepage: www.e lsev ie r.com/ locate /geomorph
Drivers of erosion and suspended sediment transport in three headwater catchmentsof the Mexican Central Highlands
Clément Duvert a,b,⁎, Nicolas Gratiot a, Olivier Evrard c, Oldrich Navratil a, Julien Némery a,Christian Prat a, Michel Esteves a
a Laboratoire d'étude des Transferts en Hydrologie et Environnement (LTHE), Université de Grenoble/IRD, Grenoble, Franceb Centro de Investigaciones en Geografía Ambiental, Universidad Nacional Autónoma de México, Morelia, Mexicoc Laboratoire des Sciences du Climat et de l'Environnement (LSCE/IPSL), Unité Mixte de Recherche 8212, CEA, CNRS, UVSQ, Gif-sur-Yvette, France
⁎ Corresponding author. Laboratoire d'étude desEnvironnement (LTHE), Université de Grenoble/IRD, Gr63 55 39; fax: +33 4 76 82 50 14.
E-mail address: [email protected] (C. Duve
0169-555X/$ – see front matter © 2010 Elsevier B.V. Adoi:10.1016/j.geomorph.2010.07.016
a b s t r a c t
a r t i c l e i n f oArticle history:Received 11 May 2010Received in revised form 20 July 2010Accepted 22 July 2010Available online 3 August 2010
Keywords:Sediment yieldRainy seasonSediment-discharge hysteresisMountainous catchmentsVolcanic soils
Quantifying suspended sediment exports from catchments and understanding suspended sedimentdynamics within river networks is important, especially in areas draining erodible material that contributesto the siltation of downstream reservoirs and to the degradation of water quality. A one-year continuousmonitoring study of water and sediment fluxes was conducted in three upland subcatchments (3.0, 9.3, and12.0 km2) located within the Cointzio basin, in the central volcanic highlands of Mexico (Michoacán state).Two subcatchments generated high sediment exports (i.e., Huertitas, 900–1500 tkm−2 y−1 and Potrerillos,600–800 t km−2 y−1), whereas the third subcatchment was characterized by a much lower sediment yield(i.e., La Cortina, 30 tkm−2 y−1). Such disparities in subcatchment behaviours were associated with thepresence of severely gullied areas in Huertitas and Potrerillos rather than with rainfall erosivity indices. Anadapted classification of hysteretic patterns between suspended sediment concentration (SSC) and dischargewas proposed because 42% of flood events contributing to 70% of sediment export were not discriminated bythe classical clockwise/anticlockwise typology. This new classification allowed the identification ofrelationships in the hydrosedimentary responses of successive floods. A stream transport capacity limitwas also detected during hydrograph recession phases. Overall, hydrosedimentary processes proved to beseasonally dependent: sediment export was repeatedly limited by the stream transport capacity during thefirst part of the rainy season, whereas a channel minimum erosivity threshold was frequently reached at theend of the season.
Transferts en Hydrologie etenoble, France. Tel.: +33 4 76
rt).
ll rights reserved.
© 2010 Elsevier B.V. All rights reserved.
1. Introduction
Accelerated soil erosion and subsequent fine sediment delivery torivers are two major environmental issues that increasingly concernland and water management authorities throughout the world(Ongley, 1996). Soil loss is commonly associated with arable landdepletion and thus with a reduction in crop yields (Pimentel et al.,1995). In addition to on-site effects, fine sediment supply leads tosevere off-site impacts: sediment can accumulate on the riverbed andincrease flooding potential, decrease reservoir storage capacity, anddegrade aquatic ecosystems by increasing water turbidity and bymobilizing associated contaminants (Newcombe and McDonald,1991; Owens et al., 2005).
Upland areas are known to be important contributors to finesediment production and delivery to downstream reaches. Indeed,
they often act as sediment source areas because of their steep anddeeply incised morphology (Dietrich and Dunne, 1978; Walling andWebb, 1996; Sidle et al., 2000). Therefore, understanding theprocesses governing the release of fine sediment from headwatercatchments to lowland water bodies is essential. The analysis alsorequires appreciation of the temporal and spatial variations inupland–lowland linkages, as determined by (i) historic land usechanges that often continue to influence contemporary sedimentdynamics (e.g., Wasson et al., 1998; Kasai et al., 2005), and (ii) by theextent of connectivity between hillslopes and downstream reaches,i.e., significance of sediment storage within channels, floodplains andreservoirs (e.g., Fryirs and Brierley, 1999; Lang et al., 2003).
Various methods have been proposed in recent decades thatinvestigate fine sediment transport. Benefiting from the developmentof automated monitoring stations, numerous studies have describedthe pattern of suspended sediment concentration during singlehydrologic events (e.g., Webb and Walling, 1982; Walling andWebb, 1983; Klein, 1984; Jeje et al., 1991; Mano et al., 2009). Theseworks showed that, in most streams, the bulk of sediment istransported during single floods and that the relationship between
244 C. Duvert et al. / Geomorphology 123 (2010) 243–256
suspended sediment concentration (SSC) and water discharge (Q)during a storm is highly variable. Resulting SSC-Q hysteresis patternshave been widely examined at the event scale in order to interpretgeomorphic processes occurring within catchments and to outline thespatial distribution of sediment sources (e.g., Klein, 1984; Williams,1989; Lenzi and Marchi, 2000; Jansson, 2002). This integrative tool isstill frequently used in recent literature (e.g., Lefrançois et al., 2007;Sadeghi et al., 2008; López-Tarazón et al., 2009; Smith and Dragovich,2009). Another increasingly used approach for the understanding ofmechanisms controlling sediment delivery consists in establishingstatistical correlations between SSC and a set of parameters such as,for instance, rainfall intensity, moisture initial conditions, sedimentload, and peak discharge (Seeger et al., 2004; Zabaleta et al., 2007;Nadal-Romero et al., 2008; Oeurng et al., 2010). Still, such statisticalmethods may be usefully employed together with physically basedapproaches to improve the understanding of sediment dynamics inheadwater catchments.
A large part of the global problems and the unresolved issuesmentioned above are experienced in the Mexican Central Plateau,which concentrates the majority of the country's population (INEGI,2006). This area underwent significant land use changes during thelast decades that induced an intensification of soil erosion (SEMAR-NAT-CP, 2003). This led in turn to the degradation of surface waterbodies and consequently to enhanced water treatment costs (Vidal etal., 1985; Alcocer and Escobar, 1993). This situation is particularlyacute in the volcanic region located around Morelia (capital ofMichoacán state, ca. 1 million inhabitants).
Recent studies conducted in central Mexico provided significantinsights about erosion processes and soil loss at plot, hillslope, orsubcatchment scales (e.g., Servenay and Prat, 2003; Descroix et al.,2008; Viramontes et al., 2008; Bravo-Espinosa et al., 2009; Vásquez-Méndez et al., 2010). However, so far, very few studies have addressedthe question of sediment delivery to rivers and sediment yields inMexican basins (Ramírez-León and Aparicio, 2009). This paper reportsthe results of high frequency monitoring of discharge and suspendedsediment carried out in the Cointzio basin, close to the city of Morelia.Three headwater subcatchments of the basin (i.e., La Cortina, Huertitas,and Potrerillos) with distinct characteristics (soil type, slope gradient,land use) were equipped and surveyed all throughout 2009 to providethe first assessment of the suspended sediment dynamics in volcanicmountainous headwaters of the Mexican plateau.
The objectives of our work were (i) to quantify the fine sedimentloss at the subcatchment scale and compare the sensitivity to erosionof the three study sites, (ii) to point out advantages and disadvantagesof our high frequency monitoring for potential applications in othersimilar conditions, and (iii) to enlarge the scope of our findings byidentifying the dominant processes driving suspended sedimenttransport in 1–10 km2 scale mountainous subcatchments undersubhumid conditions.
2. Materials and methods
2.1. Study area
The Cointzio River basin is located in the southern part of theMexican Central Plateau, where it meets the Trans-Mexican VolcanicBelt (Fig. 1). The region has a temperate subhumid climatecharacterized by two contrasting seasons: the dry season lastingfrom November to May and the wet season between June andOctober. Mean annual rainfall reaches 770 mm in Morelia (period1975–2005). Nearly 80% of the precipitation occurs during the fivemonths of the rainy season (Carlón-Allende et al., 2009). Rainfall isgenerally dominated by high intensity localized storms, although lessintense and more widespread events also repeatedly occur.
The Cointzio River basin drains an area of 630 km2 with altitudesranging from 3440 m at the summit to 1990 m at the outlet. The main
watercourse is the Rio Grande de Morelia river, which originates frommoderate hillslopes in the eastern part of the basin and flows across ituntil reaching the man-made reservoir of Cointzio (4 km2, 65 Mm3)located at the outlet. The reservoir was built in 1940 to providewater for domestic consumption and agricultural needs. Given that itcurrently supplies 25% of the water distributed in Morelia, itsincreasing siltation is a major concern for the region (Susperreguiet al., 2009).
Geology of the upper basin mainly consists of basalt and andesiticrocks produced by Quaternary volcanic activity. The lower part of thearea is underlain by alluvium and lacustrine deposits. The presence ofigneous material led to the formation of fine-textured soils.Schematically, Andisols (i.e., black fertile soils formed in volcanicsilicate-rich ash) are prominent in upland parts of the basin, Acrisols(i.e., red acid soils with high clay content) on the hillslopes andLuvisols (i.e., weathered soils with accumulation of clay in asubsurface horizon) in the lowlands (FAO, 2006). Both Andisols andAcrisols are known to be poorly resistant to water erosion when theyundergo land use changes (Poulenard et al., 2001; Bravo-Espinosaet al., 2009).
Hydrosedimentary fluxes were measured throughout 2009 with ahigh frequency (i.e., 5-min) at the outlet of the three headwatercatchments of the Cointzio basin; i.e., Huertitas (3.0 km2), La Cortina(9.3 km2), and Potrerillos (12.0 km2) (Fig. 1). These three sites arecharacterized by contrasted landforms, morphologies, and soil types,as detailed hereafter:
Huertitas and La Cortina are located in the eastern mountains ofthe basin. La Cortina is underlain by Andisols, rich in organic matterand characterized by an excellent microstructure under wet condi-tions. It constitutes a local reference in terms of good ecological status.Its undulating landscape (mean slope 12%) is mainly covered byforests (52%) and maize/avocado fields (46%; Table 1).
The Huertitas subcatchment (mean slope 18%) covers a lowerrange of altitudes and relies exclusively on Acrisols. The catchmentdisplays a severely gullied landscape on 6% of its area, with sparsevegetation and soils highly sensitive to water erosion (Fig. 2; Table 1).Land use mainly consists of rangeland (65%) and cropland (28%).
Potrerillos is located in the southern part of the Cointzio basin, at thepiedmontof a volcanic formation (meanslope15%), and soils aremainlyAcrisols (60%) and Andisols (40%). Channel incision and gullies areconnected throughout the subcatchment as in Huertitas. Thesedegraded areas affect 1% of the subcatchment. Land use in Potrerillosconsists of a combination of cropland (40%), forests (37%) and grassland(23%; Table 1). The three study sites are therefore representative of thevariety of environments found in upstream areas of Cointzio.
The river draining La Cortina is permanent with a substantial flowthat is even observed during the dry winter months. In Huertitas,waterflow is also perennial but the baseflow contribution is very lowin winter. In Potrerillos, the river is ephemeral and only active duringthe five months of the rainy season.
Grain size of the suspended sediment transported in thesubcatchments varies according to the location and to the type offlood, but it is predominantly clay- and silt-sized.
2.2. Field monitoring
2.2.1. Water discharge and suspended sediment measurementsTwo of the three monitoring sites (i.e., Huertitas and La Cortina)
consist of a stable channel section built of concrete and installed forthis study. The third monitored site (i.e., Potrerillos) was installedunder a bridge. It is made up of a rectangular section underlain bybedrock outcrops, and the local topography leads to phases ofsediment deposition and resuspension. This required careful dataprocessing.
Water level was measured at a 5-min time step with Thalimede®OTT water level gauges. At each station, between 10 and 15 discharge
Fig. 1. Location of the study sites.
245C. Duvert et al. / Geomorphology 123 (2010) 243–256
measurements were carried out using the tracer dilution gaugingmethod. Water discharge time series were determined usingcontinuous water level records and rating curves obtained by thedilution method (see the technical note of Duvert, 2009, for detailsabout the methodology used and its associated uncertainties).
Time series of SSC were calculated using stage-triggered TeledyneISCO® 3700 automatic water samplers containing 24 bottles of 1 leach. At all sites, suspended sediment sampling was performed at adepth of about 10 cm from the streambed and it did not vary withstage. Suspended sediment concentrations under baseflow conditionswere also surveyed by means of manual samples collected dailyaround 6 p.m. by local staff. The use of automatic turbidity sensorswould have been preferable in the three upland subcatchments.However, during the equipment installation phase in 2008, it becameapparent that this option was not feasible because of numerous fieldconstraints. Indeed, sedimentation frequently occurred in riversections at the outlet, and the water depth in the channel was notsufficient during baseflow.
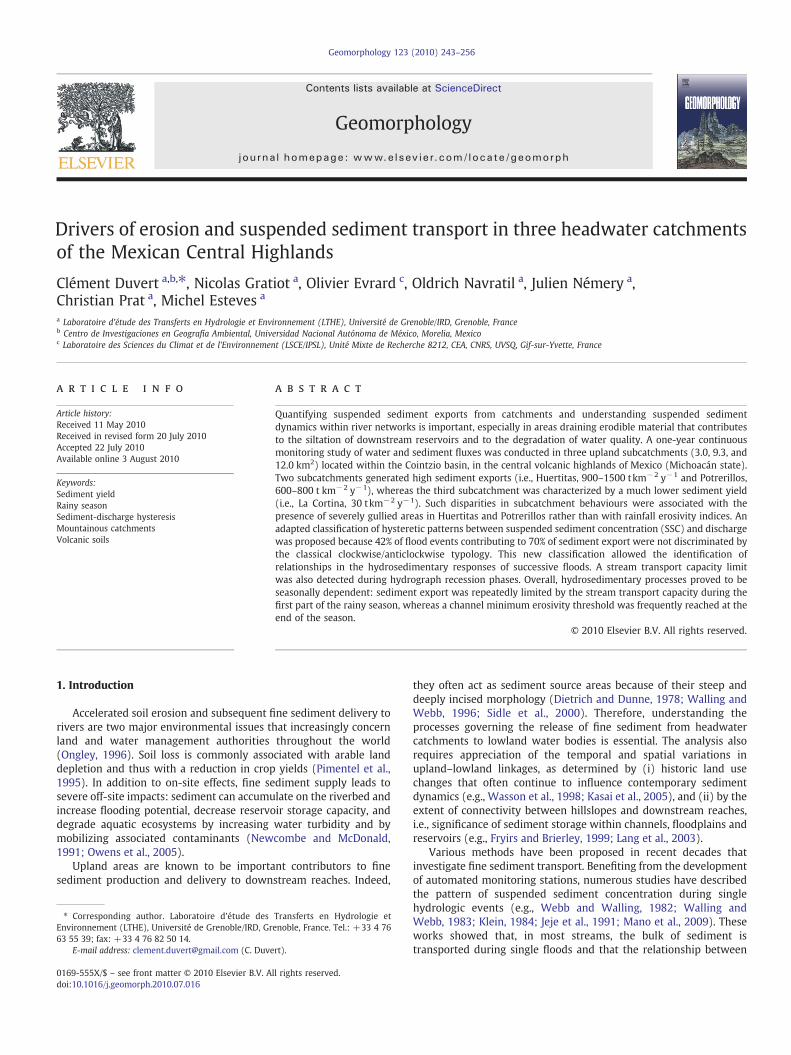
Table 1Main characteristics of the three study sites.a
Area(km2)
Altituderange (m)
Meanslope (%)
Main land uses Main soil types Seve(% o
La Cortina 9.3 2250–2700 12 Forest (52%),cropland (46%)
Andisols (100%) 0
Huertitas 3.0 2150–2450 18 Rangeland (65%),cropland (28%),gullied (6%)
Acrisols (100%) 6
Potrerillos 12.0 2200–2700 15 Cropland (40%),forest (37%),grassland (23%)
Acrisols (60%),Andisols (40%)
1
a Data from the three last columns were collected during monthly surveys carried out inephemeral behaviour of the stream. Measurements could only be conducted immediately a
A Campbell CR800® datalogger was programmed to triggersampling based on a stage-variation threshold and using the followingstrategy: stations were visited every week for collecting samples andreplacing bottles when necessary; given this operational constraint,we followed a trial-and-error process described by Gao (2008). Waterlevel monitoring had also been conducted throughout 2008 at thethree stations (data not reported in this paper); we used these timeseries to simulate an optimized sampling frequency. The aim was toobtain reliable load estimates during small events without over-sampling large events in order to avoid exhausting the samplers'available bottles. At all sites, the most appropriate water depththreshold appeared to be 5 cm for 5-min time step requests. Thealgorithm checked whether water depth variation (either positive ornegative) exceeded 5 cm for each time step. When this condition wasfulfilled, sampling was initiated. The water depth value was thenstored until again reaching variations of ±5 cm in the following timesteps. The sampling conducted in 2009 confirmed the relevance of thissetting: on average, 10 to 15 samples were collected weekly in each
rely eroded areasf catchment surface)
Mean discharge duringthe dry season (l s−1)
Mean discharge duringthe wet season (l s−1)
Mean SSC(mg l−1)
10–30 100–200 5
0.05–1 10–30 30
0 20–50 1000
2007 and 2008. The high mean SSC value in Potrerillos is a direct consequence of thefter storms and before the streams dried out.
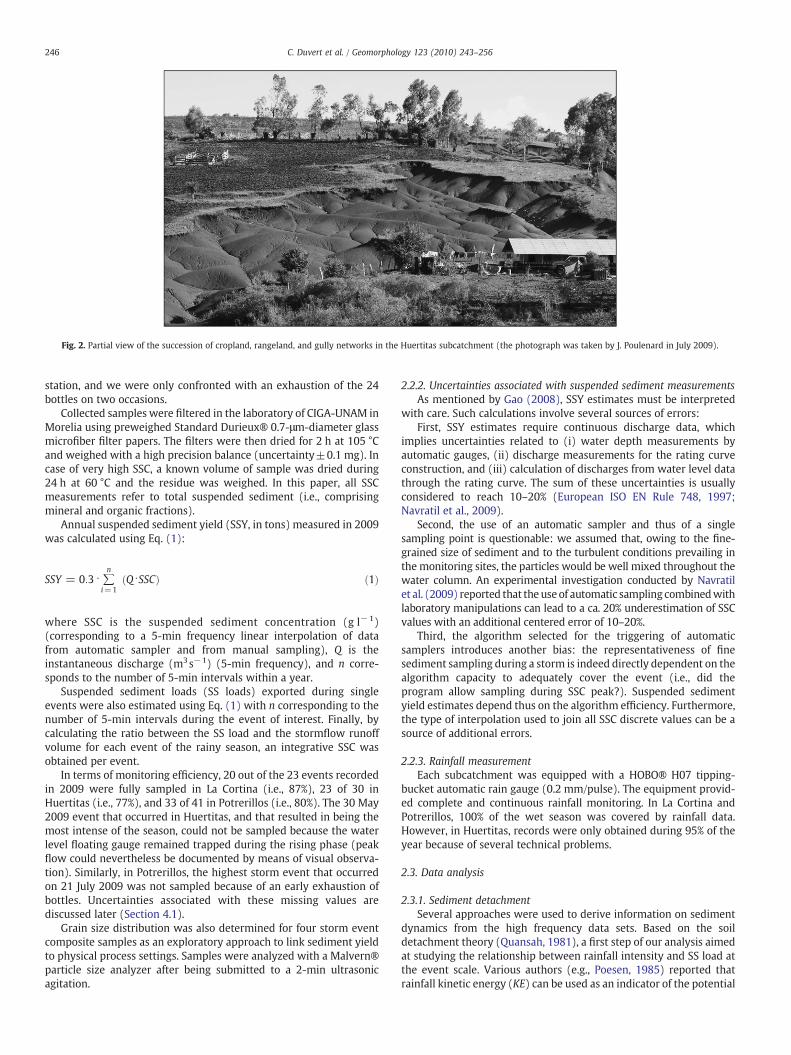
Fig. 2. Partial view of the succession of cropland, rangeland, and gully networks in the Huertitas subcatchment (the photograph was taken by J. Poulenard in July 2009).
246 C. Duvert et al. / Geomorphology 123 (2010) 243–256
station, and we were only confronted with an exhaustion of the 24bottles on two occasions.
Collected samples were filtered in the laboratory of CIGA-UNAM inMorelia using preweighed Standard Durieux® 0.7-μm-diameter glassmicrofiber filter papers. The filters were then dried for 2 h at 105 °Cand weighed with a high precision balance (uncertainty±0.1 mg). Incase of very high SSC, a known volume of sample was dried during24 h at 60 °C and the residue was weighed. In this paper, all SSCmeasurements refer to total suspended sediment (i.e., comprisingmineral and organic fractions).
Annual suspended sediment yield (SSY, in tons) measured in 2009was calculated using Eq. (1):
SSY = 0:3 ⋅∑n
i=1Q⋅SSCð Þ ð1Þ
where SSC is the suspended sediment concentration (g l−1)(corresponding to a 5-min frequency linear interpolation of datafrom automatic sampler and from manual sampling), Q is theinstantaneous discharge (m3s−1) (5-min frequency), and n corre-sponds to the number of 5-min intervals within a year.
Suspended sediment loads (SS loads) exported during singleevents were also estimated using Eq. (1) with n corresponding to thenumber of 5-min intervals during the event of interest. Finally, bycalculating the ratio between the SS load and the stormflow runoffvolume for each event of the rainy season, an integrative SSC wasobtained per event.
In terms of monitoring efficiency, 20 out of the 23 events recordedin 2009 were fully sampled in La Cortina (i.e., 87%), 23 of 30 inHuertitas (i.e., 77%), and 33 of 41 in Potrerillos (i.e., 80%). The 30 May2009 event that occurred in Huertitas, and that resulted in being themost intense of the season, could not be sampled because the waterlevel floating gauge remained trapped during the rising phase (peakflow could nevertheless be documented by means of visual observa-tion). Similarly, in Potrerillos, the highest storm event that occurredon 21 July 2009 was not sampled because of an early exhaustion ofbottles. Uncertainties associated with these missing values arediscussed later (Section 4.1).
Grain size distribution was also determined for four storm eventcomposite samples as an exploratory approach to link sediment yieldto physical process settings. Samples were analyzed with a Malvern®particle size analyzer after being submitted to a 2-min ultrasonicagitation.
2.2.2. Uncertainties associated with suspended sediment measurementsAs mentioned by Gao (2008), SSY estimates must be interpreted
with care. Such calculations involve several sources of errors:First, SSY estimates require continuous discharge data, which
implies uncertainties related to (i) water depth measurements byautomatic gauges, (ii) discharge measurements for the rating curveconstruction, and (iii) calculation of discharges from water level datathrough the rating curve. The sum of these uncertainties is usuallyconsidered to reach 10–20% (European ISO EN Rule 748, 1997;Navratil et al., 2009).
Second, the use of an automatic sampler and thus of a singlesampling point is questionable: we assumed that, owing to the fine-grained size of sediment and to the turbulent conditions prevailing inthe monitoring sites, the particles would be well mixed throughout thewater column. An experimental investigation conducted by Navratilet al. (2009) reported that the useof automatic sampling combinedwithlaboratory manipulations can lead to a ca. 20% underestimation of SSCvalues with an additional centered error of 10–20%.
Third, the algorithm selected for the triggering of automaticsamplers introduces another bias: the representativeness of finesediment sampling during a storm is indeed directly dependent on thealgorithm capacity to adequately cover the event (i.e., did theprogram allow sampling during SSC peak?). Suspended sedimentyield estimates depend thus on the algorithm efficiency. Furthermore,the type of interpolation used to join all SSC discrete values can be asource of additional errors.
2.2.3. Rainfall measurementEach subcatchment was equipped with a HOBO® H07 tipping-
bucket automatic rain gauge (0.2 mm/pulse). The equipment provid-ed complete and continuous rainfall monitoring. In La Cortina andPotrerillos, 100% of the wet season was covered by rainfall data.However, in Huertitas, records were only obtained during 95% of theyear because of several technical problems.
2.3. Data analysis
2.3.1. Sediment detachmentSeveral approaches were used to derive information on sediment
dynamics from the high frequency data sets. Based on the soildetachment theory (Quansah, 1981), a first step of our analysis aimedat studying the relationship between rainfall intensity and SS load atthe event scale. Various authors (e.g., Poesen, 1985) reported thatrainfall kinetic energy (KE) can be used as an indicator of the potential
247C. Duvert et al. / Geomorphology 123 (2010) 243–256
ability of rain drops to detach soil. Rainfall kinetic energy was thencalculated for each event as a proxy of rainfall erosivity (Salles et al.,2002), following the relation described by Brandt (1990):
KEmm = ∑i8:95 + 8:44⋅ log10 Ii ð2Þ
where KEmm is the volume-specific kinetic energy (J m−2 mm−1), andI is the rainfall intensity at the 5-min time step (mm h−1).
To allow detection of correlations between the set of parameters,nine quantitative variables were then derived for each rainfall–runoffevent: (i) cumulative precipitation depth during the event, (ii)maximum rainfall intensity in 5 min, (iii) kinetic energy released bythe rainfall, (iv) discharged volume during the stormflow event, (v)runoff coefficient, (vi) maximum instantaneous discharge, (vii) maxi-mum SSC, (viii) mean SSC during the event, and (ix) SS load exported.Each eventwas also characterized by two semiquantitative parameters:(x) the slope of hydrograph rising limb and (xi) moisture/flood initialconditions (Table 2). Hydrographs were classified visually according tothe velocity of their rising phase (slow/fast). Initial moisture conditionswere classified using both precipitation and discharge data: a classwas assigned to each event, ranging from 0 (dry) to 3 (wet+++),depending on the initial moisture conditions and on the extent of floodgeneration during the previous 24 h (Table 2). Finally, the type of SSC-Qhysteretic pattern was considered (xii).
When testing relationships between parameters, data scatteringrapidly appeared to strongly affect the graphical analysis. Parameterswere therefore plotted using bilogarithmic axes.
2.3.2. Sediment transportIndividual flood events were analyzed in terms of SSC-discharge
hysteretic patterns. Processes contributing to the SS dynamics, i.e.,sediment supply and remobilization of the deposited sediment, occurat very short timescales (Asselman, 1999; Gomi et al., 2005). Thehysteresis between SSC and discharge has been widely reported to bea useful tool providing information on sediment sources and themechanics of sediment delivery (e.g., Jansson, 2002). In small basins,SSC usually presents a higher sensitivity to local sources such as bankcollapse, concentrated sediment inputs from gullies, etc., which maycomplicate interpretations (Chappell et al., 1999; Lefrançois et al.,2007). On the other hand, the more homogeneous precipitation thatusually characterizes small drainage areas could allow a less complexinterpretation of rainfall data and, in turn, of runoff and erosiondynamics.
Floods were classified according to their hysteretic pattern. TheSSC-Q diagrams were drawn with linear axes for both variables. Weused an adapted version of themethodology commonly described andbased on the typology ofWilliams (1989), which discriminates eventsinto clockwise, counterclockwise, simultaneous and figure eightshaped hysteretic loops. This adapted classification is presented inSection 3.2.2.
Table 2Semiquantitative parameters computed for each storm.
Parameter Description Class
Flood characteristic Hydrograph rising phaseN5 min SlowHydrograph rising phaseb5 min Fast
Initial moisture conditions Events without significant rainfallin the last 24 h
1 (dry)
Significant rainfall (N4 mm) withoutflood generation
2 (wet+)
Significant rainfall (N4 mm) withminor flood generation
3 (wet++)
Significant rainfall (N4 mm) withmajor flood generation
4 (wet+++)
2.3.3. Factorial analysisStatistical tools offer an alternative and complementary approach
to assess the relationship between driving parameters and theirconsequences on sediment dynamics. They define objectively thedegree of correlation between variables through a correlation matrix.A factorial analysis was therefore conducted on the sets of variablescompiled in the three subcatchments for each flood event. Our aimwas to apply a technique allowing the comparison of both quan-titative and discrete parameters. The factorial analysis for mixed data(FAMD) (Escoufier, 1979; Pagès, 2004), developed in the R environ-ment by Lê et al. (2008) through the FactomineR package, wasselected. This type of analysis allows the extension of a multiple factoranalysis to mixed sets of variables (Pagès, 2004). The RV coefficient,i.e., a multivariate generalization of the Pearson coefficient (Robertand Escoufier, 1976), was chosen to estimate correlations betweenvariables. When variables were dependent (e.g., discharge peakand discharged volume during a flood event), only one variable wasanalyzed.
3. Results
3.1. Precipitation, runoff and sediment transport
3.1.1. PrecipitationAt the basin scale, precipitations occurred from mid-May 2009
until late October 2009. The months of July and August wereunusually dry, and the end of the rainy season (i.e., September andOctober) provided higher rainfall than usual. Total rainfall depthmeasured in the basin during 2009 reached 805 mm according to theThiessenmethod and using data from nine gauges available across theCointzio basin (Anguiano-Valencia, 2010). This value can be consid-ered as a mean value compared to the long-term rainfall database(400–1100 mm y−1) available at Santiago Undameo (1954–2004),which is a station located just upstream from the Cointzio reservoir(Gratiot et al., 2010).
Significant disparities were observed among the three subcatch-ments: in La Cortina, annual precipitation reached 1230 mm,whereas itonly reached 810 mmin Potrerillos and 678 mminHuertitas. As alreadymentioned, data in Huertitas only covered 95% of the year, which maypartially explain the lower volume recorded in this site. More generally,catchments located at higher elevations received larger precipitationamounts, probably because of orographic effects. The median rainfallintensities I50 recorded in 5 min throughout the rainy season differedamong the sites: I50 amounted to 3.0 mm h−1 in Huertitas and LaCortina, and 4.8 mm h−1 in Potrerillos. In contrast, maximum intensi-ties recorded were higher in Huertitas (118 mm h−1) and La Cortina(113 mm h−1) than in Potrerillos (72 mm h−1). Finally, in terms ofkinetic energy release, La Cortina experienced more intense events(KEmm [min–max]: [92–763] J m−2 mm−1), which was explained bythe generally higher volumes of rainfall characterizing this site. InHuertitas and Potrerillos, KEmm were lower and they remained inthe same order of magnitude (respectively, [58–520] J m−2 mm−1 and[42–463] J m−2 mm−1).
3.1.2. Discharge and suspended sediment fluxThe three subcatchments are characterized by very distinct
hydrological behaviours: La Cortina hydrographs showed a highbaseflow contribution to its total discharge (baseflow ranged between0.01 and 0.1 m3 s−1, i.e., 0.05–0.15 m water depth); whereas inHuertitas, although the stream is perennial, baseflowwas much lower(b1.10−3 m3s−1 during the dry season, i.e., 0.01–0.05 m waterdepth). In Potrerillos, the water flow is ephemeral and characterizedby successive flashflood events followed by fast recession times.According to historical records available at the outlet of the 630-km2
basin, mean annual discharge during the period 1940–2002 was
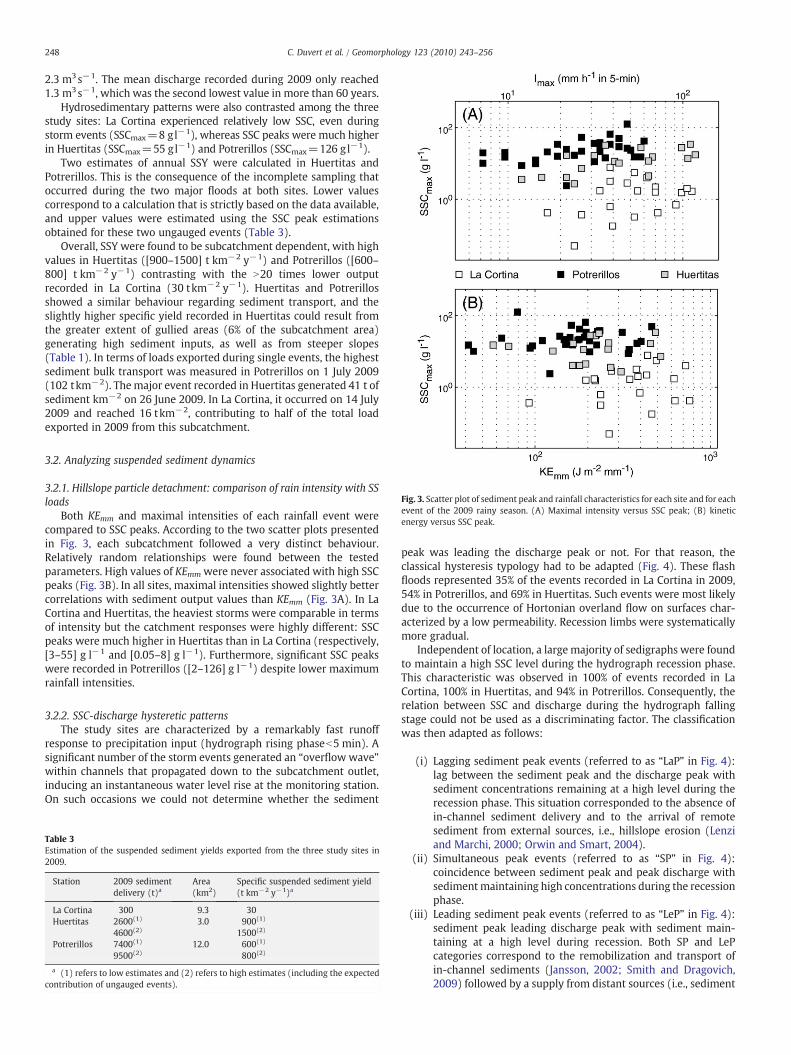
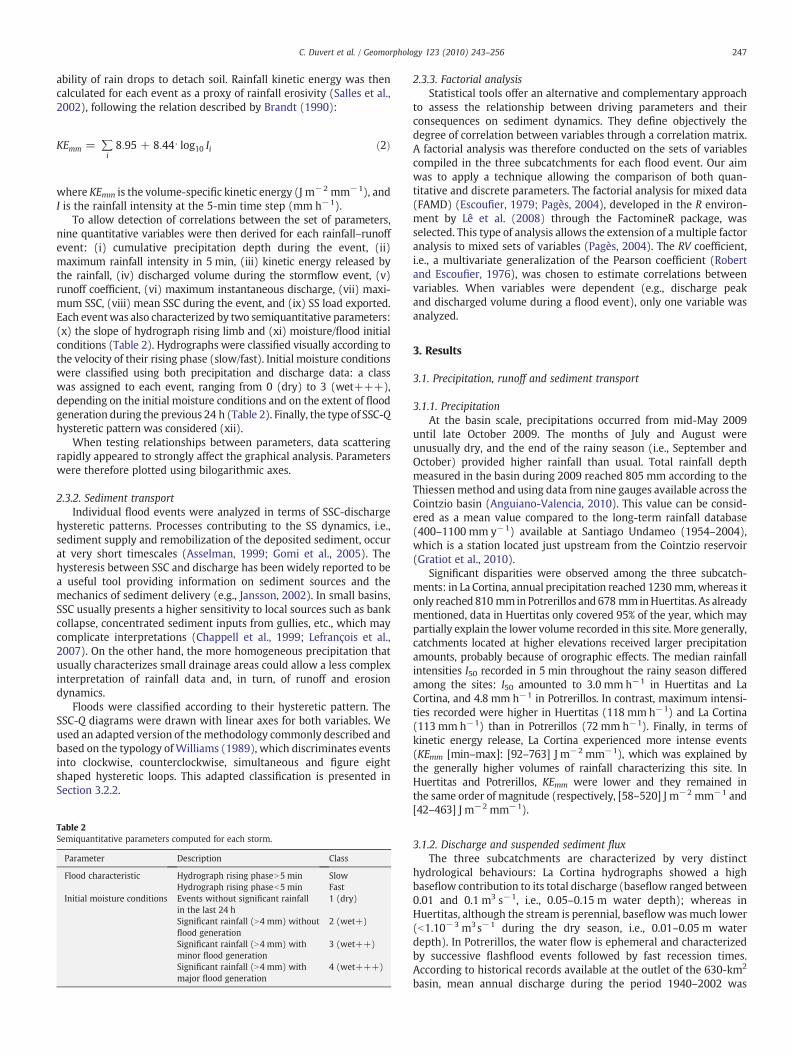
Fig. 3. Scatter plot of sediment peak and rainfall characteristics for each site and for eachevent of the 2009 rainy season. (A) Maximal intensity versus SSC peak; (B) kineticenergy versus SSC peak.
248 C. Duvert et al. / Geomorphology 123 (2010) 243–256
2.3 m3s−1. The mean discharge recorded during 2009 only reached1.3 m3s−1, which was the second lowest value in more than 60 years.
Hydrosedimentary patterns were also contrasted among the threestudy sites: La Cortina experienced relatively low SSC, even duringstorm events (SSCmax=8 gl−1), whereas SSC peaks were much higherin Huertitas (SSCmax=55 gl−1) and Potrerillos (SSCmax=126 gl−1).
Two estimates of annual SSY were calculated in Huertitas andPotrerillos. This is the consequence of the incomplete sampling thatoccurred during the two major floods at both sites. Lower valuescorrespond to a calculation that is strictly based on the data available,and upper values were estimated using the SSC peak estimationsobtained for these two ungauged events (Table 3).
Overall, SSY were found to be subcatchment dependent, with highvalues in Huertitas ([900–1500] t km−2 y−1) and Potrerillos ([600–800] t km−2 y−1) contrasting with the N20 times lower outputrecorded in La Cortina (30 tkm−2 y−1). Huertitas and Potrerillosshowed a similar behaviour regarding sediment transport, and theslightly higher specific yield recorded in Huertitas could result fromthe greater extent of gullied areas (6% of the subcatchment area)generating high sediment inputs, as well as from steeper slopes(Table 1). In terms of loads exported during single events, the highestsediment bulk transport was measured in Potrerillos on 1 July 2009(102 tkm−2). Themajor event recorded in Huertitas generated 41 t ofsediment km−2 on 26 June 2009. In La Cortina, it occurred on 14 July2009 and reached 16 tkm−2, contributing to half of the total loadexported in 2009 from this subcatchment.
3.2. Analyzing suspended sediment dynamics
3.2.1. Hillslope particle detachment: comparison of rain intensity with SSloads
Both KEmm and maximal intensities of each rainfall event werecompared to SSC peaks. According to the two scatter plots presentedin Fig. 3, each subcatchment followed a very distinct behaviour.Relatively random relationships were found between the testedparameters. High values of KEmm were never associated with high SSCpeaks (Fig. 3B). In all sites, maximal intensities showed slightly bettercorrelations with sediment output values than KEmm (Fig. 3A). In LaCortina and Huertitas, the heaviest storms were comparable in termsof intensity but the catchment responses were highly different: SSCpeaks were much higher in Huertitas than in La Cortina (respectively,[3–55] g l−1 and [0.05–8] g l−1). Furthermore, significant SSC peakswere recorded in Potrerillos ([2–126] g l−1) despite lower maximumrainfall intensities.
3.2.2. SSC-discharge hysteretic patternsThe study sites are characterized by a remarkably fast runoff
response to precipitation input (hydrograph rising phaseb5 min). Asignificant number of the storm events generated an “overflowwave”within channels that propagated down to the subcatchment outlet,inducing an instantaneous water level rise at the monitoring station.On such occasions we could not determine whether the sediment
Table 3Estimation of the suspended sediment yields exported from the three study sites in2009.
Station 2009 sedimentdelivery (t)a
Area(km2)
Specific suspended sediment yield(t km−2 y−1)a
La Cortina 300 9.3 30Huertitas 2600(1) 3.0 900(1)
4600(2) 1500(2)
Potrerillos 7400(1) 12.0 600(1)
9500(2) 800(2)
a (1) refers to low estimates and (2) refers to high estimates (including the expectedcontribution of ungauged events).
peak was leading the discharge peak or not. For that reason, theclassical hysteresis typology had to be adapted (Fig. 4). These flashfloods represented 35% of the events recorded in La Cortina in 2009,54% in Potrerillos, and 69% in Huertitas. Such events were most likelydue to the occurrence of Hortonian overland flow on surfaces char-acterized by a low permeability. Recession limbs were systematicallymore gradual.
Independent of location, a large majority of sedigraphs were foundto maintain a high SSC level during the hydrograph recession phase.This characteristic was observed in 100% of events recorded in LaCortina, 100% in Huertitas, and 94% in Potrerillos. Consequently, therelation between SSC and discharge during the hydrograph fallingstage could not be used as a discriminating factor. The classificationwas then adapted as follows:
(i) Lagging sediment peak events (referred to as “LaP” in Fig. 4):lag between the sediment peak and the discharge peak withsediment concentrations remaining at a high level during therecession phase. This situation corresponded to the absence ofin-channel sediment delivery and to the arrival of remotesediment from external sources, i.e., hillslope erosion (Lenziand Marchi, 2000; Orwin and Smart, 2004).
(ii) Simultaneous peak events (referred to as “SP” in Fig. 4):coincidence between sediment peak and peak discharge withsedimentmaintaining high concentrations during the recessionphase.
(iii) Leading sediment peak events (referred to as “LeP” in Fig. 4):sediment peak leading discharge peak with sediment main-taining at a high level during recession. Both SP and LePcategories correspond to the remobilization and transport ofin-channel sediments (Jansson, 2002; Smith and Dragovich,2009) followed by a supply from distant sources (i.e., sediment
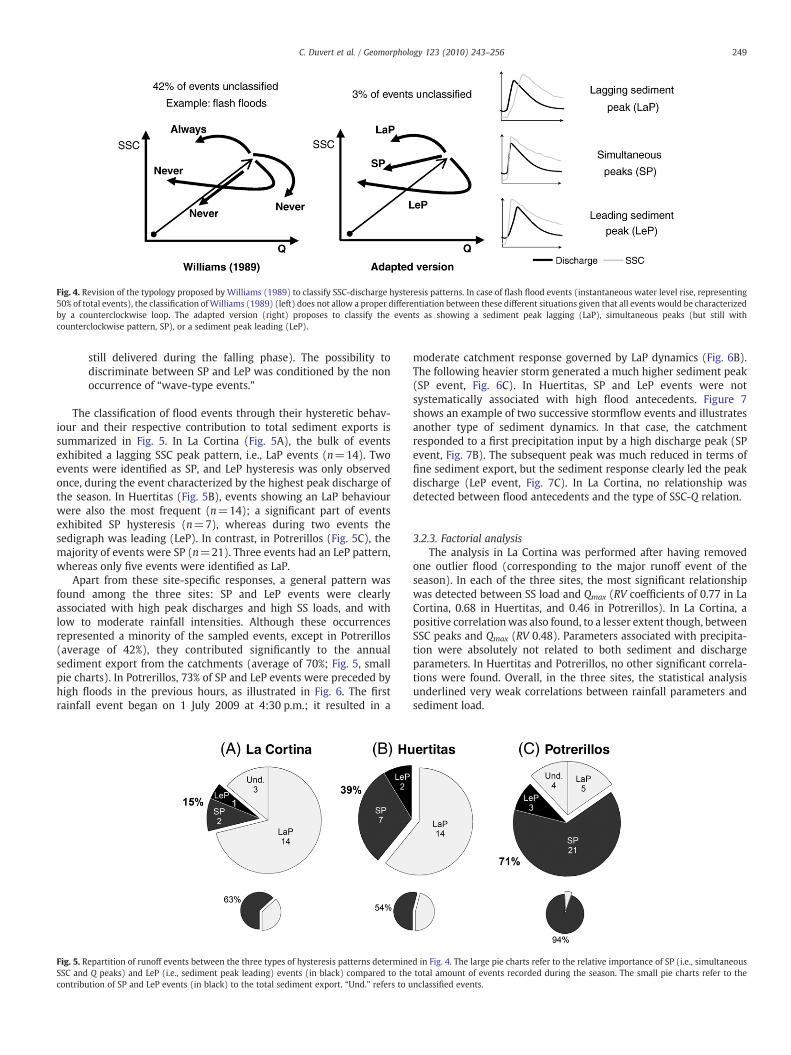
Fig. 4. Revision of the typology proposed by Williams (1989) to classify SSC-discharge hysteresis patterns. In case of flash flood events (instantaneous water level rise, representing50% of total events), the classification ofWilliams (1989) (left) does not allow a proper differentiation between these different situations given that all events would be characterizedby a counterclockwise loop. The adapted version (right) proposes to classify the events as showing a sediment peak lagging (LaP), simultaneous peaks (but still withcounterclockwise pattern, SP), or a sediment peak leading (LeP).
249C. Duvert et al. / Geomorphology 123 (2010) 243–256
still delivered during the falling phase). The possibility todiscriminate between SP and LeP was conditioned by the nonoccurrence of “wave-type events.”
The classification of flood events through their hysteretic behav-iour and their respective contribution to total sediment exports issummarized in Fig. 5. In La Cortina (Fig. 5A), the bulk of eventsexhibited a lagging SSC peak pattern, i.e., LaP events (n=14). Twoevents were identified as SP, and LeP hysteresis was only observedonce, during the event characterized by the highest peak discharge ofthe season. In Huertitas (Fig. 5B), events showing an LaP behaviourwere also the most frequent (n=14); a significant part of eventsexhibited SP hysteresis (n=7), whereas during two events thesedigraph was leading (LeP). In contrast, in Potrerillos (Fig. 5C), themajority of events were SP (n=21). Three events had an LeP pattern,whereas only five events were identified as LaP.
Apart from these site-specific responses, a general pattern wasfound among the three sites: SP and LeP events were clearlyassociated with high peak discharges and high SS loads, and withlow to moderate rainfall intensities. Although these occurrencesrepresented a minority of the sampled events, except in Potrerillos(average of 42%), they contributed significantly to the annualsediment export from the catchments (average of 70%; Fig. 5, smallpie charts). In Potrerillos, 73% of SP and LeP events were preceded byhigh floods in the previous hours, as illustrated in Fig. 6. The firstrainfall event began on 1 July 2009 at 4:30 p.m.; it resulted in a
Fig. 5. Repartition of runoff events between the three types of hysteresis patterns determineSSC and Q peaks) and LeP (i.e., sediment peak leading) events (in black) compared to thecontribution of SP and LeP events (in black) to the total sediment export. “Und.” refers to u
moderate catchment response governed by LaP dynamics (Fig. 6B).The following heavier storm generated a much higher sediment peak(SP event, Fig. 6C). In Huertitas, SP and LeP events were notsystematically associated with high flood antecedents. Figure 7shows an example of two successive stormflow events and illustratesanother type of sediment dynamics. In that case, the catchmentresponded to a first precipitation input by a high discharge peak (SPevent, Fig. 7B). The subsequent peak was much reduced in terms offine sediment export, but the sediment response clearly led the peakdischarge (LeP event, Fig. 7C). In La Cortina, no relationship wasdetected between flood antecedents and the type of SSC-Q relation.
3.2.3. Factorial analysisThe analysis in La Cortina was performed after having removed
one outlier flood (corresponding to the major runoff event of theseason). In each of the three sites, the most significant relationshipwas detected between SS load and Qmax (RV coefficients of 0.77 in LaCortina, 0.68 in Huertitas, and 0.46 in Potrerillos). In La Cortina, apositive correlationwas also found, to a lesser extent though, betweenSSC peaks and Qmax (RV 0.48). Parameters associated with precipita-tion were absolutely not related to both sediment and dischargeparameters. In Huertitas and Potrerillos, no other significant correla-tions were found. Overall, in the three sites, the statistical analysisunderlined very weak correlations between rainfall parameters andsediment load.
d in Fig. 4. The large pie charts refer to the relative importance of SP (i.e., simultaneoustotal amount of events recorded during the season. The small pie charts refer to thenclassified events.

Fig. 6. Multipeak event recorded in Potrerillos on 1 July 2009: (A) series of precipitation, discharge, and SSC; (B) representation of SSC-Q hysteresis of the first flood peak;(C) representation of SSC-Q hysteresis of the second flood peak. Grey bars correspond to a 20% mean-centered error.
Fig. 7. Multipeak event recorded in Huertitas on 4 September 2009: (A) series of precipitation, discharge, and SSC; (B) representation of SSC-Q hysteresis of the first flood peak;(C) representation of SSC-Q hysteresis of the second flood peak. Grey bars correspond to a 20% mean-centered error.
250 C. Duvert et al. / Geomorphology 123 (2010) 243–256
251C. Duvert et al. / Geomorphology 123 (2010) 243–256
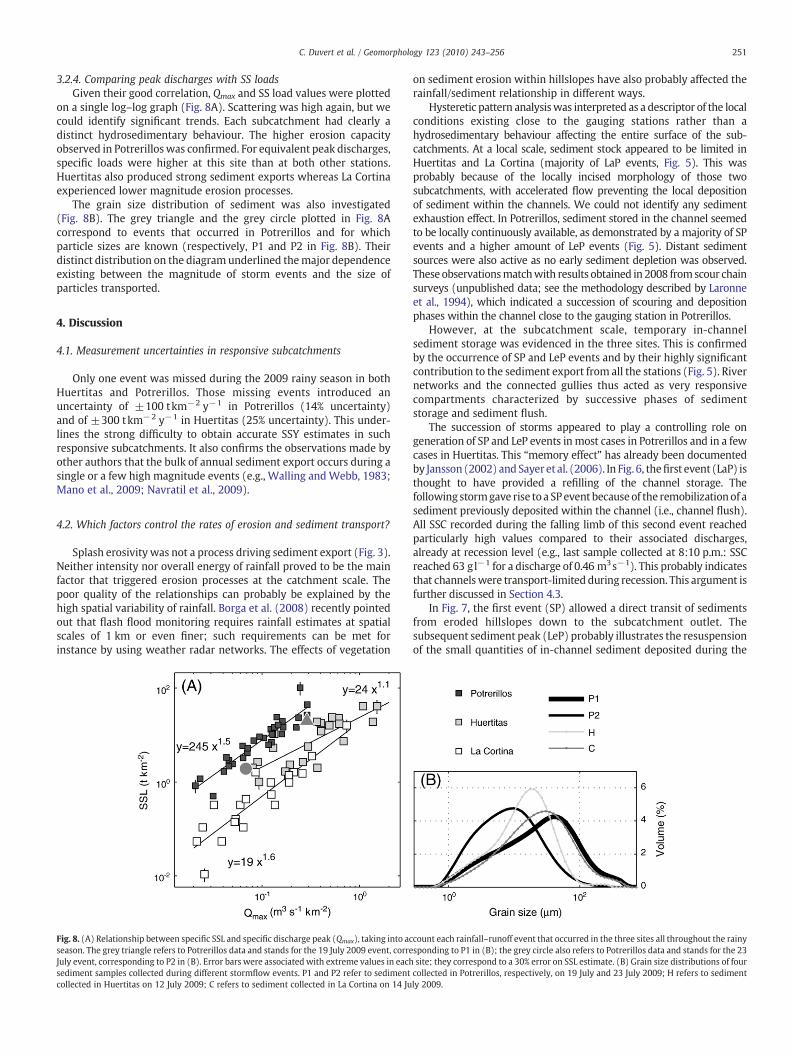
3.2.4. Comparing peak discharges with SS loadsGiven their good correlation, Qmax and SS load values were plotted
on a single log–log graph (Fig. 8A). Scattering was high again, but wecould identify significant trends. Each subcatchment had clearly adistinct hydrosedimentary behaviour. The higher erosion capacityobserved in Potrerilloswas confirmed. For equivalent peak discharges,specific loads were higher at this site than at both other stations.Huertitas also produced strong sediment exports whereas La Cortinaexperienced lower magnitude erosion processes.
The grain size distribution of sediment was also investigated(Fig. 8B). The grey triangle and the grey circle plotted in Fig. 8Acorrespond to events that occurred in Potrerillos and for whichparticle sizes are known (respectively, P1 and P2 in Fig. 8B). Theirdistinct distribution on the diagram underlined themajor dependenceexisting between the magnitude of storm events and the size ofparticles transported.
4. Discussion
4.1. Measurement uncertainties in responsive subcatchments
Only one event was missed during the 2009 rainy season in bothHuertitas and Potrerillos. Those missing events introduced anuncertainty of ±100 tkm−2 y−1 in Potrerillos (14% uncertainty)and of ±300 tkm−2 y−1 in Huertitas (25% uncertainty). This under-lines the strong difficulty to obtain accurate SSY estimates in suchresponsive subcatchments. It also confirms the observations made byother authors that the bulk of annual sediment export occurs during asingle or a few high magnitude events (e.g., Walling andWebb, 1983;Mano et al., 2009; Navratil et al., 2009).
4.2. Which factors control the rates of erosion and sediment transport?
Splash erosivity was not a process driving sediment export (Fig. 3).Neither intensity nor overall energy of rainfall proved to be the mainfactor that triggered erosion processes at the catchment scale. Thepoor quality of the relationships can probably be explained by thehigh spatial variability of rainfall. Borga et al. (2008) recently pointedout that flash flood monitoring requires rainfall estimates at spatialscales of 1 km or even finer; such requirements can be met forinstance by using weather radar networks. The effects of vegetation
Fig. 8. (A) Relationship between specific SSL and specific discharge peak (Qmax), taking into acseason. The grey triangle refers to Potrerillos data and stands for the 19 July 2009 event, correJuly event, corresponding to P2 in (B). Error bars were associated with extreme values in eachsediment samples collected during different stormflow events. P1 and P2 refer to sedimentcollected in Huertitas on 12 July 2009; C refers to sediment collected in La Cortina on 14 Ju
on sediment erosion within hillslopes have also probably affected therainfall/sediment relationship in different ways.
Hysteretic pattern analysiswas interpreted as a descriptor of the localconditions existing close to the gauging stations rather than ahydrosedimentary behaviour affecting the entire surface of the sub-catchments. At a local scale, sediment stock appeared to be limited inHuertitas and La Cortina (majority of LaP events, Fig. 5). This wasprobably because of the locally incised morphology of those twosubcatchments, with accelerated flow preventing the local depositionof sediment within the channels. We could not identify any sedimentexhaustion effect. In Potrerillos, sediment stored in the channel seemedto be locally continuously available, as demonstrated by a majority of SPevents and a higher amount of LeP events (Fig. 5). Distant sedimentsources were also active as no early sediment depletion was observed.These observationsmatchwith results obtained in 2008 fromscour chainsurveys (unpublished data; see the methodology described by Laronneet al., 1994), which indicated a succession of scouring and depositionphases within the channel close to the gauging station in Potrerillos.
However, at the subcatchment scale, temporary in-channelsediment storage was evidenced in the three sites. This is confirmedby the occurrence of SP and LeP events and by their highly significantcontribution to the sediment export from all the stations (Fig. 5). Rivernetworks and the connected gullies thus acted as very responsivecompartments characterized by successive phases of sedimentstorage and sediment flush.
The succession of storms appeared to play a controlling role ongeneration of SP and LeP events inmost cases in Potrerillos and in a fewcases in Huertitas. This “memory effect” has already been documentedby Jansson (2002) and Sayer et al. (2006). In Fig. 6, thefirst event (LaP) isthought to have provided a refilling of the channel storage. Thefollowing stormgave rise to a SPevent becauseof the remobilization of asediment previously deposited within the channel (i.e., channel flush).All SSC recorded during the falling limb of this second event reachedparticularly high values compared to their associated discharges,already at recession level (e.g., last sample collected at 8:10 p.m.: SSCreached 63 gl−1 for a discharge of 0.46 m3s−1). This probably indicatesthat channelswere transport-limited during recession. This argument isfurther discussed in Section 4.3.
In Fig. 7, the first event (SP) allowed a direct transit of sedimentsfrom eroded hillslopes down to the subcatchment outlet. Thesubsequent sediment peak (LeP) probably illustrates the resuspensionof the small quantities of in-channel sediment deposited during the
count each rainfall–runoff event that occurred in the three sites all throughout the rainysponding to P1 in (B); the grey circle also refers to Potrerillos data and stands for the 23site; they correspond to a 30% error on SSL estimate. (B) Grain size distributions of fourcollected in Potrerillos, respectively, on 19 July and 23 July 2009; H refers to sedimently 2009.
252 C. Duvert et al. / Geomorphology 123 (2010) 243–256
preceding event; the lower SSC peak value was attributed to apronounced exhaustion of sediment available in the network (i.e.,because of the high magnitude of the previous event). Again,recession was concomitant with an external sediment contributionfrom hillslopes (transport-limited state). This is consistent withresults reported by Evrard et al. (in press), which indicated that theproportion of new sediment in the river channel decreased from ca.100% to 20% after this event.
Overall, the study of sediment dynamics through hystereticbehaviour allowed explanation, to a certain extent, of the processesoccurring at the subcatchment scale. Our results show that previousfloodshad an influenceon sedimentdelivery,which canbe explainedbyan increase in hillslope–channel connectivitywhenmoisture conditionsincreased and when high quantities of sediment were available.
The study of the relationship between peak discharges and SSloads (Fig. 8A) confirmed that each subcatchment followed a specifichydrosedimentary behaviour. The potential bias implied by thecomparison of some instantaneous values (i.e., Qmax) with integratedones (i.e., SS load) wasmost likely offset by the fact that, in these smallsubcatchments, Qmax acted as a parameter integrating both rainfalland runoff features.
Huertitas and Potrerillos subcatchments experienced a highervulnerability to erosion and a higher reactivity to storms, whereassediment was exported at a lower rate from La Cortina. In Cointzio, thepresence of gullied areas in subcatchments proved to play a significantrole in fine sediment erosion. In the first two subcatchments, historicalgullies provided a constant sediment supply to the river. One of theprimary factors that constrained suspended sedimentdelivery tooutletswas therefore sediment availability. Dense networks of historical gulliescertainly increased the catchment connectivity, as already reported by
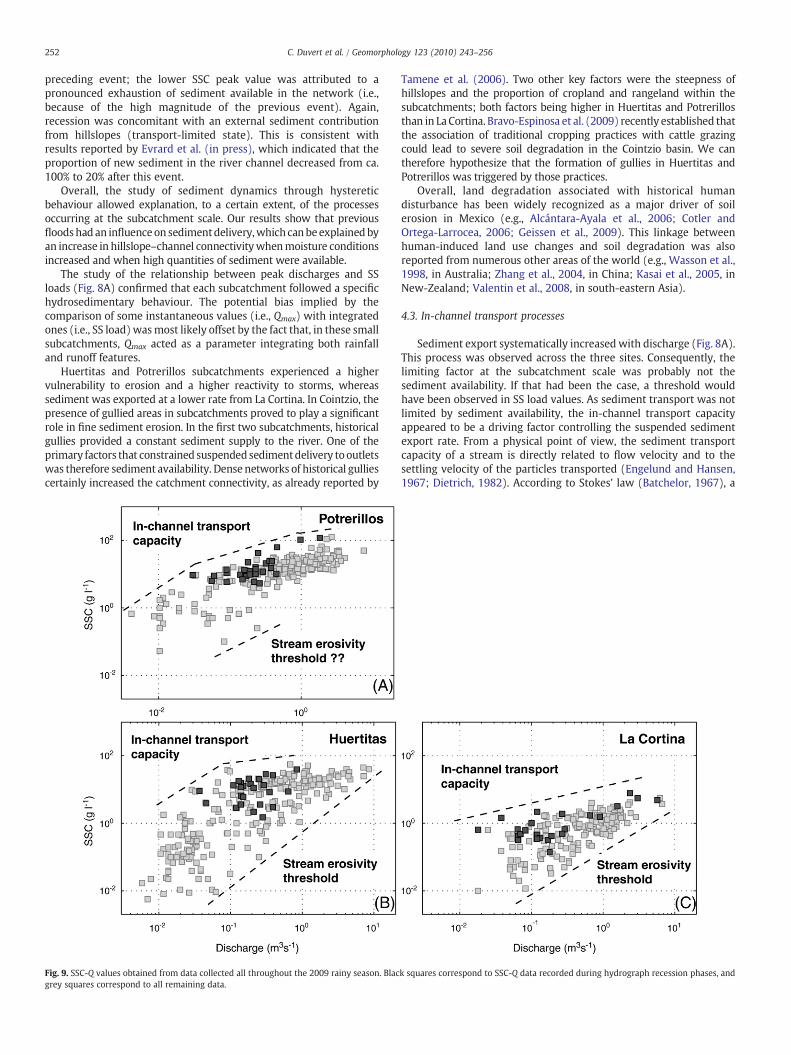
Fig. 9. SSC-Q values obtained from data collected all throughout the 2009 rainy season. Blacgrey squares correspond to all remaining data.
Tamene et al. (2006). Two other key factors were the steepness ofhillslopes and the proportion of cropland and rangeland within thesubcatchments; both factors being higher in Huertitas and Potrerillosthan in La Cortina. Bravo-Espinosa et al. (2009) recently established thatthe association of traditional cropping practices with cattle grazingcould lead to severe soil degradation in the Cointzio basin. We cantherefore hypothesize that the formation of gullies in Huertitas andPotrerillos was triggered by those practices.
Overall, land degradation associated with historical humandisturbance has been widely recognized as a major driver of soilerosion in Mexico (e.g., Alcántara-Ayala et al., 2006; Cotler andOrtega-Larrocea, 2006; Geissen et al., 2009). This linkage betweenhuman-induced land use changes and soil degradation was alsoreported from numerous other areas of the world (e.g., Wasson et al.,1998, in Australia; Zhang et al., 2004, in China; Kasai et al., 2005, inNew-Zealand; Valentin et al., 2008, in south-eastern Asia).
4.3. In-channel transport processes
Sediment export systematically increased with discharge (Fig. 8A).This process was observed across the three sites. Consequently, thelimiting factor at the subcatchment scale was probably not thesediment availability. If that had been the case, a threshold wouldhave been observed in SS load values. As sediment transport was notlimited by sediment availability, the in-channel transport capacityappeared to be a driving factor controlling the suspended sedimentexport rate. From a physical point of view, the sediment transportcapacity of a stream is directly related to flow velocity and to thesettling velocity of the particles transported (Engelund and Hansen,1967; Dietrich, 1982). According to Stokes' law (Batchelor, 1967), a
k squares correspond to SSC-Q data recorded during hydrograph recession phases, and

253C. Duvert et al. / Geomorphology 123 (2010) 243–256
strong relationship exists between the diameter of a particle and itssettling velocity:
ws∝D2 ð3Þ
where ws is the settling velocity of a spherical particle (m s−1), and Dis its diameter (m).
Particle diameter can thus reasonably be considered as a good proxyfor estimating its settling velocity. In an exploratory approach, the studyof grain size distribution of sediment was performed for each site onindividual floods. As shown in Fig. 8B, particle sizes were veryheterogeneous even within a single subcatchment, as suggested bythe values measured during two distinct events in Potrerillos (event 1:median diameter D50=24 μm; event 2: D50=6 μm). Interstorm var-iabilitywas even higher than intersite variability. Grain size estimates ineach subcatchmentwould thus require a complete granulometric studythat is beyond the scope of this paper. Flow discharge was thereforeconserved as an indirect indicator for the upward vertical turbulentvelocity, whereas SSC was considered as a broad indicator for thesediment settling flux (higher SSC requiring higher energy to betransported).
A study of the relationship between SSC and Q was carried out inorder to identify towhat extent the twoparameterswere associated andwhether some subpatterns could be identified from the available timeseries (Fig. 9). Among all SSC-Q data collected in 2009, values derivedfrom the falling stages of the hydrographs were of particular interest.While water flow was decreasing, high SSC values were indeedfrequently measured because of the severe hysteretic pattern generallyobserved. Such behaviour was already deduced from the temporalanalysis presented in Section4.2 and Fig. 6. The limit in stream transport
Fig. 10. Seasonality effects on sediment delivery rates: (A)mean SSC per event throughout thboth La Cortina and Huertitas, corresponding to a sharp decrease in sediment export. Transitioccurred on 3 August 2009; (C) in Huertitas, the transition from white to grey circles occur
capacity should havebeen reached in such circumstances. Fig. 9 displaysall SSC-Q values recorded during the 2009 rainy season. It differentiatesvalues occurring at falling stage from the others.
Independently of the location, the points recorded duringrecession phases were located in the upper part of the scatter plots.In Potrerillos (Fig. 9A), these highest values as well as a few othersclearly defined an upper boundary that very likely corresponds to thelimit of stream transport capacity. The direct consequence of reachingthis physical constraint was the generation of a net sedimentdeposition in the channel (Jansson, 2002). This hypothesis supportsthe visual observations made in the field all throughout the season.Erosive power of the stream was outlined by minimal values ofdetachment capacity (lower boundary). This limit was approximatelydelineated, even though the presence of two outliers can put itsrelevance into question (Fig. 9A).
In Huertitas (Fig. 9B) an upper boundary was also detected. Again,it was associated with the in-channel transport capacity. The streamability to erode and export sediment was also clearly outlined: thelower boundary in Fig. 9B corresponds to theminimum sediment loadthat the stream was able to dislodge from the riverbed. This findingsupports the results of Section 4.2 that outlined that littlematerial wasstored within the channel and that the streambed was preferentiallyeroded.
In La Cortina (Fig. 9C), both boundaries were also outlined, but thetransport capacity was much lower than in the two other sites. Again,this was consistent with findings of Section 4.2 (little sediment storedlocally). Because of the relatively limited sediment supply, thestreambed is probably affected almost permanently by erosiveconditions; the highly incised morphology of the river channel in LaCortina could be a consequence of this situation.
e season for the three subcatchments. A threshold can be identified in values recorded inons are defined by black bars: (B) in La Cortina, the transition fromwhite to grey squaresred on 4 September 2009.
254 C. Duvert et al. / Geomorphology 123 (2010) 243–256
All the values defining the upper and lower limits were associatedwith distinct storm events; it proves that a general behaviour wasidentified rather than transitory conditions prevailing during a specificflood.
4.4. Seasonality in sediment delivery
Fig. 10 shows the evolution of SSC values during the rainy seasoncalculated for each storm event. Despite a strong dispersion, mean SSCtime series exhibited a decreasing trend in all the subcatchments(Fig. 10A). Furthermore, this seasonal effect was neither related to achange in peak discharges nor to a change in rainfall regime. Thisevolution throughout the rainy season was even clearer in La Cortinaand Huertitas. It probably illustrates the progressive increase in thesoil cover by vegetation in these partly cultivated hillslopes (seeTable 1), which is known to protect the soil against the erosive actionof rainfall. Similarly, sediment exported from Huertitas may notexclusively originate from bare gullies (Evrard et al., in press).
In Huertitas, the highest mean SSC values were observed at thebeginning of the wet season (60 kg m−3 on 15 May 2009). InPotrerillos and La Cortina, themost erosive events occurred during thefirst part of the rainy season (respectively, 101 kg m−3 on 1 July 2009and 3 kg m−3 on 14 July 2009). This outlines a progressive flush of thechannel sediment stock at the beginning of the rainy season (Hudson,2003; Evrard et al., in press).
Furthermore, a change was identified in La Cortina and HuertitasSSC records. SSC values experienced a significant decrease even whenassociatedwith high discharge peaks. This change affected all SSC datacollected, as shown in Fig. 10B and C. At both sites, SSC decrease waslinked with an increase in baseflow contribution and occurred from 3August 2009 in La Cortina (Fig. 10B) and from 4 September 2009 inHuertitas (Fig. 10C). Again, this remarkable change of the hydro-sedimentary processes probably illustrates the impact of land coverchange through the rainy season.
4.5. Comparison with other subcatchment sediment yields reported inthe world
We aimed at comparing our results to previous research carriedout in small catchments (1–10 km2). However, most of the referencesfound in the literature report measurements in mesoscale to largebasins (i.e., N100 km2). According to the few data available forcomparison, sediment export in La Cortina appeared to be low tomoderate (Table 4); it roughly corresponds to values measured inlowland areas under temperate climate (Walling et al., 2002;Goodwin et al., 2003; Lefrançois et al., 2007; Smith, 2008). SSYestimates in Huertitas and Potrerillos were much higher, and they canbe compared to the loads exported from amountainous subcatchmentlocated in the northern Ethiopian Highlands (Nyssen et al., 2008).However, sediment exports in Potrerillos and Huertitas remain lowerthan export rates measured by Mathys et al. (2003) in highly erodiblemarly terrains of the French Alps. Nevertheless, we hypothesized that
Table 4Suspended sediment yields measured in other small catchments.
Subcatchment Years ofmonitoring
Area(km2)
SSY(t km−2 y−1)
Reference
Lower Smisby 1997–1999 2.6 80 Walling et al. (2002)Rosemaund 1997–1999 1.5 82 Walling et al. (2002)Stanley Cars 1999–2001 4.6 94 Goodwin et al. (2003)Moulin 1988–2000 0.9 5700 Mathys et al. (2003)Brusquet 1988–2000 1.1 80 Mathys et al. (2003)Moulinet 2002–2003 4.5 25 Lefrançois et al. (2007)Violettes 2002–2003 2.2 36 Lefrançois et al. (2007)May Zegzeg 1998–2001 2.0 560 Nyssen et al. (2008)Flyers Creek 2005–2006 1.6 8 Smith (2008)
the values we found are representative of upstream catchmentslocally undergoing severe erosion processes. Overall, our resultsprovide very useful erosion estimates for small mountainous catch-ments with a subhumid climate, which remain largely undocumentedin the literature.
5. Conclusions
For the first time, suspended sediment yields of three uplandsubcatchments located in theMexican Central Highlandswere estimatedduring a whole year. Each subcatchment exhibited a specific behaviour.Two catchments exported high sediment yields (i.e., Huertitas, [900–1500] t km−2 y−1 and Potrerillos, [600–800] t km−2 y−1). In contrast,the third catchment generated a rather low sediment export (i.e., LaCortina, 30 tkm−2 y−1).
At the scale of the entire 630–km2 basin, we could not derive anydirect relationship between rainfall intensity and sediment concentra-tion. This can be explained by the high spatial variability of rainfall andby the effect of the vegetation growth throughout the season, whichprovided a protection to the soil against erosive rainfall. Erodiblesediment availability on hillslopes was identified as the main factorcontrolling suspended sediment delivery. The occurrences of numerousactive gullies in Huertitas and Potrerillos provided a constant sedimentsource linked to the river network,whichexplains thehigh SSY recordedat both stations. At the subcatchment scale, a combination of variousparameters was responsible for sediment control. Peak dischargesduring floods were found to be significantly associated with exportedloads; discharge proved to be a controlling factor when sediment wasnot lacking. This limit in stream transport capacity preferentiallyoccurred during hydrograph falling limbs. Furthermore, a minimumerosive power was detected in Huertitas and La Cortina, which wasregularly reached during floods. In these subcatchments, the role ofseasonality was particularly clear, with higher sediment export in thefirstmonths of the rainy season. This may be attributed to the growth ofthe vegetation throughout the rainy season. The rapid succession ofseveral storms was also a cause for high sediment exports, andparticularly in Potrerillos. This was associated with a preliminary fillingof the channel storage,without thecompactionordryingout of particles,whichwas rapidly followed by a channel flush; but itmay also be due toa better connectivity between active gullies and stream channels.
Further studies should now concentrate on a better characteriza-tion of fine sediment settling flux within channels in order to improveour physical understanding of deposition/resuspension dynamics atthe subcatchment scale. Furthermore, the study of nested subcatch-ments at the scale of the entire Cointzio basin should be carried out. Itwould provide useful information on suspended sediment behaviouracross mesoscale river basins and contribute to improve hydrosedi-mentary models.
Acknowledgements
This is the LSCE contribution n°4342. This work was supported bythe STREAMS project (Sediment TRansport and Erosion AcrossMountains), funded by the French National Research Agency, as wellas by the DESIRE project (Desertification mitigation and remediation ofland), funded by the European Union. The authors would like toacknowledge the CIEco and CIGA (UNAM-campus Morelia), especiallyKen Oyama, Felipe García-Oliva, Gerardo Bocco, Manuel Mendoza-Cantú, Hilda Rivas-Solórzano, and Rosaura Páez-Bistrain, for kindlygiving us access to their laboratory facilities and for allowing us towork in pleasant conditions. We also wish to thank RobertoAnguiano-Valencia and Arely Vazquez-Ramirez for their assistancewith rainfall data collection and laboratory work, and all the local stafffor their help with field sample collection. Finally, we are grateful toDr. Richard A. Marston and to four anonymous referees whosecomments helped us improve the quality of this manuscript.
255C. Duvert et al. / Geomorphology 123 (2010) 243–256
References
Alcántara-Ayala, I., Esteban-Chávez, O., Parrot, J.F., 2006. Landsliding related to land-cover change: a diachronic analysis of hillslope instability distribution in the SierraNorte, Puebla, Mexico. Catena 65, 152–165.
Alcocer, J., Escobar, E., 1993. Morphometric characteristics of six Mexican coastal-lakesrelated to productivity. Rev. Biol. Trop. 41 (2), 171–179.
Anguiano-Valencia, R., 2010. Informe del monitoreo pluviográfico de la cuenca deCointzio. Universidad Michoacana de San Nicolás de Hidalgo, Institut de Recherchepour le Développement, Morelia, Mexico. 36 pp.
Asselman, N.E.M., 1999. Suspended sediment dynamics in a large drainage basin: theRiver Rhine. Hydrol. Process. 13, 1437–1450.
Batchelor, G.K., 1967. An Introduction to Fluid Dynamics, 1st edition. CambridgeUniversity Press, Cambridge, UK. 615 pp.
Borga, M., Gaume, E., Creutin, J.D., Marchi, L., 2008. Surveying flash flood response:gauging the ungauged extremes. Hydrol. Process. 22 (18), 3883–3885.
Brandt, C.J., 1990. Simulation of the size distribution and erosivity of raindrops andthroughfall drops. Earth Surf. Proc. Land. 15, 687–698.
Bravo-Espinosa, M., Mendoza, M.E., Medina-Orozco, L., Prat, C., García-Oliva, F., López-Granados, E., 2009. Runoff, soil loss, and nutrient depletion under traditional andalternative cropping systems. Land Degrad. Dev. 20 (6), 640–653.
Carlón-Allende, T., Mendoza, M.E., López-Granados, E.M., Morales-Manilla, L.M., 2009.Hydrogeographical regionalization: an approach for evaluating the effects of landcover change in watersheds, a case study in the Cuitzeo lake watershed, centralMexico. Water Resour. Manag. 23 (12), 2587–2603.
Chappell, N.A., McKenna, P., Bidin, K., Douglas, I., Walsh, R.P.D., 1999. Parsimoniousmodelling of water and suspended-sediment flux from nested-catchments affectedby selective tropical forestry. Phil. Trans. Roy. Soc. Lond. 354, 1831–1846.
Cotler, H., Ortega-Larrocea, M.P., 2006. Effects of land use on soil erosion in a tropicaldry forest ecosystem, Chamela watershed, Mexico. Catena 65, 107–117.
Descroix, L., González-Barrios, J.L., Viramontes, D., Poulenard, J., Anaya, E., Esteves, M.,Estrada, J., 2008. Gully and sheet erosion on subtropical mountain slopes: theirrespective roles and the scale effect. Catena 72, 325–339.
Dietrich, W.E., 1982. Settling velocity of natural particles. Water Resour. Res. 18 (6),1615–1626.
Dietrich, W.E., Dunne, T., 1978. Sediment budget for a small catchment in mountainousterrain. Zeits. Geomorph. 29, 191–206.
Duvert, C., 2009. Stage-discharge Rating Curves Construction in Huertitas, La Cortinaand Potrerillos—Associated Uncertainties. Technical report Institut de Recherchepour le Développement, Morelia, Mexico. 6 pp.
Engelund, F., Hansen, E., 1967. AMonograph on Sediment Transport in Alluvial Streams.Teknisk Forlag, Copenhagen, Denmark.
Escoufier, B., 1979. Traitement simultané de variables quantitatives et qualitatives enanalyse factorielle. Cah. Anal. Données 4 (2), 137–146.
European ISO EN Rule 748, 1997. Measurement of Liquid Flow in Open Channels—Velocity-area Methods. Reference number ISO 748:1997 (E) InternationalStandard, International Organization for Standardization, Geneva, Switzerland.
Evrard, O., Némery, J., Gratiot, N., Duvert, C., Ayrault, S., Lefèvre, I., Poulenard, J., Prat, C.,Bonté, P., Esteves, M., in press. Sediment dynamics during the rainy season intropical highland catchments of central Mexico using fallout radionuclides.Geomorphology.
Food and Agriculture Organization of the United Nations (FAO), 2006. World ReferenceBase for Soil Resources 2006, A Framework for International Classification,Correlation and Communication. World Soil Resources Report 103 FAO, Rome, Italy.
Fryirs, K., Brierley, G.J., 1999. Slope-channel decoupling in Wolumla catchment, NewSouth Wales, Australia: the changing nature of sediment sources followingEuropean settlement. Catena 35, 41–63.
Gao, P., 2008. Understanding watershed suspended sediment transport. Prog. Phys.Geog. 32, 243–263.
Geissen, V., Sánchez-Hernández, R., Kampichler, C., Ramos-Reyes, R., Sepulveda-Lozada,A., Ochoa-Goana, S., Jong, B.H.J., Huerta-Lwanga, E., Hernández-Daumas, S., 2009.Effects of land-use change on some properties of tropical soils — an example fromSoutheast Mexico. Geoderma 151, 87–97.
Gomi, T., Moore, R.D., Hassan, M., 2005. Suspended sediment dynamics in small forestedstreams of the Pacific Northwest. J. Am. Water Resour. Assoc. 41 (4), 877–898.
Goodwin, T.H., Young, A.R., Holmes, G.R., Old, G.H., Hewitt, N., Leeks, G.J.L., Packman, J.C.,Smith, B.P.G., 2003. The temporal and spatial variability of sediment transport andyields within the Bradford Beck catchment, West Yorkshire. Sci. Total Environ. 314–316, 475–494.
Gratiot, N., Duvert, C., Collet, L., Vinson, D., Némery, J., Sáenz-Romero, C., 2010. Increasein surface runoff in the central mountains of Mexico: lessons from the past andpredictive scenario for the next century. Hydrol. Earth Syst. Sci. 14, 291–300.
Hudson, P.F., 2003. Event sequence and sediment exhaustion in the lower Panuco basin,Mexico. Catena 52, 57–76.
Instituto Nacional de Estadística y Geografía (INEGI), 2006. Conteo de Población yVivienda 2005, Resultados definitivos. Sistema Nacional de Información Estadísticay Geográfica, Mexico City, Mexico.
Jansson, M.B., 2002. Determining sediment source areas in a tropical river basin, CostaRica. Catena 47, 63–84.
Jeje, L.K., Ogunkoya, O.O., Oluwatimilehin, J.M., 1991. Variation in suspended sedimentconcentration during storm discharges in three small streams in upper Osun Basin,central western Nigeria. Hydrol. Process. 54, 361–369.
Kasai, M., Brierly, G.J., Page, M.J., Marutani, T., Trustrum, N.A., 2005. Impacts of land usechange on patterns of sediment flux in Weraamaia catchment, New Zealand.Catena 64 (1), 27–60.
Klein, M., 1984. Anti clockwise hysteresis in suspended sediment concentration duringindividual storms. Catena 11, 251–257.
Lang, A., Bork, H.R., Mäckel, R., Preston, N., Wunderlich, J., Dikau, R., 2003. Changes insediment flux and storage within a fluvial system—some examples from the Rhinecatchment. Hydrol. Process. 17, 3321–3334.
Laronne, J.B., Outhet, D.N., Carling, P.A., McCabe, T.J., 1994. Scour chain employment ingravel bed rivers. Catena 22, 299–306.
Lê, S., Josse, J., Husson, F., 2008. FactoMineR: an R package for multivariate analysis.J. Stat. Softw. 25 (1), 1–18.
Lefrançois, J., Grimaldi, C., Gascuel-Odoux, C., Gilliet, N., 2007. Suspended sediment anddischarge relationships to identify bank degradation as a main sediment source onsmall agricultural catchments. Hydrol. Process. 21, 2923–2933.
Lenzi, M.A., Marchi, L., 2000. Suspended sediment load during floods in a small streamof the Dolomites (northeastern Italy). Catena 39, 267–282.
López-Tarazón, J.A., Batalla, R.J., Vericat, D., Francke, T., 2009. Suspended sediment in ahighly erodible catchment: the River Isábena (southern Pyrenees). Geomorphology109, 210–221.
Mano, V., Némery, J., Belleudy, P., Poirel, A., 2009. Suspended particle matter dynamicsin four Alpine watersheds (France): influence of climatic regime and optimizationof flux calculation. Hydrol. Process. 23, 777–792.
Mathys, N., Brochot, S., Meunier, M., Richard, D., 2003. Erosion quantification in thesmall marly experimental catchments of Draix (Alpes de Haute Provence, France).Calibration of the ETC rainfall–runoff–erosion model. Catena 50, 527–548.
Nadal-Romero, E., Latron, J., Martí-Bono, C., Regüés, D., 2008. Temporal distribution ofsuspended sediment transport in a humid Mediterranean badland area: theAraguás catchment, central Pyrenees. Geomorphology 97, 601–616.
Navratil, O., Esteves, M., Némery, J., Legout, C., Poirel, A., Gratiot, N., Belleudy, P., 2009.Uncertainties and Spatiotemporal Variations of Suspended Sediment Flux in the BleoneRiver Basin (Southern French Alps). EGU General Assembly 2009, Vienna, Austria.
Newcombe, C.P., McDonald, D.D., 1991. Effects of suspended sediments on aquaticecosystems. N. Am. J. Fish. Manag. 11, 72–82.
Nyssen, J., Poesen, J., Moeyersons, J., Mitiku, H., Deckers, J., 2008. Dynamics of soilerosion rates and controlling factors in the Northern Ethiopian highlands —towards a sediment budget. Earth Surf. Proc. Land. 33 (5), 695–711.
Oeurng, C., Sauvage, S., Sánchez-Pérez, J.M., 2010. Dynamics of suspended sedimenttransport and yield in a large agricultural catchment, southwest France. Earth Surf.Proc. Land. doi:10.1002/esp.1971
Ongley, E.D., 1996. Control of Water Pollution from Agriculture. Irrigation and DrainagePaper 55 FAO, Rome, Italy. 101 pp.
Orwin, J.F., Smart, C.C., 2004. The evidence for paraglacial sedimentation and itstemporal scale in the deglacierizing basin of Small River Glacier, Canada.Geomorphology 58, 175–202.
Owens, P.N., Batalla, R.J., Collins, A.J., Gomez, B., Hicks, D.M., Horowitz, A.J., Kondolf, G.M.,Marden, M., Page, M.J., Peacock, D.H., Petticrew, E.L., Salomons, W., Trustrum, N.A.,2005. Fine-grained sediment in river systems: environmental significance andmanagement issues. River Res. Applic. 21, 693–717.
Pagès, J., 2004. Analyse factorielle de données mixtes. Rev. Stat. Appl. 52 (4), 93–111.Pimentel, D., Harvey, C., Resosudarmo, P., Sinclair, K., Kurz, D., McNair, M., Crist, S.,
Sphpritz, L., Fitton, L., Saffouri, R., Blair, R., 1995. Environmental and economic costsof soil erosion and conservation benefits. Science 267, 1117–1123.
Poesen, J., 1985. An improved splash transport model. Zeits. Geomorph. 29, 193–211.Poulenard, J., Podwojewski, P., Janeau, J.L., Collinet, J., 2001. Runoff and soil erosion
under rainfall simulation of Andisols from the Ecuadorian Páramo: effect of tillageand burning. Catena 45, 185–207.
Quansah, C., 1981. The effect of soil type, slope, rain intensity and their interactions onsplash detachment and transport. J. Soil Sci. 32, 215–224.
Ramírez-León, J.M., Aparicio, J., 2009. Estimation of sediment yield in watersheds.Application to the Apulco River, Mexico. Ing. Hidraul. Mex. 24 (4), 145–157.
Robert, P., Escoufier, Y., 1976. A unifying tool for linear multivariate statistical methods:the RV-coefficient. Appl. Stat. 25 (3), 257–265.
Sadeghi, S.H.R., Mizuyama, T., Miyata, S., Gomi, T., Kosugi, K., Fukushima, T., Mizugaki, S.,Onda, Y., 2008. Determinant factors of sediment graphs and rating loops in areforested watershed. J. Hydrol. 356, 271–282.
Salles, C., Poesen, J., Sempere-Torres, D., 2002. Kinetic energy of rain and its functionalrelationship with intensity. J. Hydrol. 257, 256–270.
Sayer, A.M., Walsh, R.P.D., Bidin, K., 2006. Pipeflow suspended sediment dynamics andtheir contribution to stream sediment budgets in small rainforest catchments,Sabah, Malaysia. Forest Ecol. Manag. 224, 119–130.
Secretaría de Medio Ambiente y Recursos Naturales (SEMARNAT), Colegio dePostgraduados (CP), 2003. Evaluación de la Degradación del Suelo Causada por elHombre en la República Mexicana. Escala 1:250000. Memoria Nacional 2001–2002,Mexico City, Mexico.
Seeger, M., Errea, M.P., Begueria, S., Arnaez, J., Marti, C., García-Ruiz, J.M., 2004.Catchment soil moisture and rainfall characteristics as determinant factors fordischarge/suspended sediment hysteretic loops in a small headwater catchment inthe Spanish Pyrenees. J. Hydrol. 288, 299–311.
Servenay, A., Prat, C., 2003. Erosion extension of indurated volcanic soils of Mexico byaerial photographs and remote sensing analysis. Geoderma 117, 367–375.
Sidle, R.C., Tsuboyama, Y., Noguchi, S., Hosoda, I., Fujieda, M., Shimizu, T., 2000.Stormflow generation in steep forested headwaters: a linked hydrogeomorphicparadigm. Hydrol. Process. 14, 369–385.
Smith, H.G., 2008. Estimation of suspended sediment loads and delivery in an inciseduplandheadwater catchment, south-easternAustralia.Hydrol. Process. 22, 3135–3148.
Smith, H.G., Dragovich, D., 2009. Interpretation of sediment delivery processes usingsuspended sediment-discharge hysteresis patterns from nested upland catch-ments, south-eastern Australia. Hydrol. Process. 23, 2415–2426.

256 C. Duvert et al. / Geomorphology 123 (2010) 243–256
Susperregui, A.S., Gratiot, N., Esteves, M., Prat, C., 2009. A preliminary hydrosedimen-tary view of a highly turbid, tropical, manmade lake: Cointzio Reservoir(Michoacán, Mexico). Lakes Reservoirs Res. Manage. 14 (1), 31–39.
Tamene, L., Park, S.J., Dikau, R., Vlek, P.L.G., 2006. Analysis of factors determiningsediment yield variability in the highlands of northern Ethiopia. Geomorphology76, 76–91.
Valentin, C., Agus, F., Alamban, R., Boosaner, A., Bricquet, J.P., Chaplot, V., de Guzman, T.,de Rouw, A., Janeau, J.L., Orange, D., Phachomphonh, K., Phai, D., Podwojewski, P.,Ribolzi, O., Silvera, N., Subagyono, K., Thiébaux, J.P., Tran, Duc T., Vadari, T., 2008.Runoff and sediment losses from 27 upland catchments in southeast Asia: impact ofrapid land use changes and conservation practices. Agric. Ecosyst. Environ. 128,225–238.
Vásquez-Méndez, R., Ventura-Ramos, E., Oleschko, K., Hernández-Sandoval, L., Parrot, J.F.,Nearing, M.A., 2010. Soil erosion and runoff in different vegetation patches fromsemiarid Central Mexico. Catena 80, 162–169.
Vidal, J., Valero, M., Rangel, R., 1985. Frontera acuícola. Comisión del Plan NacionalHidráulico, Mexico City, Mexico. 216 pp.
Viramontes, D., Esteves, M., Descroix, L., Duwig, C., Rojas-Rojas, F., Gutiérrez, A., deLeón-Mojarro, B., 2008. Quantification of runoff and erosion in an experimentalAndosol watershed in Valle de Bravo. Ing. Hidraul. Mex. 23 (3), 89–103.
Walling, D.E., Webb, B.W., 1983. Patterns of sediment yield. In: Gregory, K.J. (Ed.),Background to Paleohydrology. Wiley, New York, NY, pp. 69–100.
Walling, D.E., Webb, B.W., 1996. Erosion and sediment yield, a global overview. In:Walling, D.E., Webb, B.W. (Eds.), Erosion and Sediment Yield: Global and RegionalPerspectives: Proceedings of the Exeter Symposium, Jul 1996, IAHS Publication 236,Wallingford, UK, pp. 3–19.
Walling, D.E., Russell, M.A., Hodgkinson, R.A., Zhang, Y., 2002. Establishing sedimentbudgets for two small lowland agricultural catchments in the UK. Catena 47,323–353.
Wasson, R.J., Mazari, R.K., Starr, B., Clifton, G., 1998. The recent history of erosion andsedimentation on the Southern Tablelands of southeastern Australia: sediment fluxdominated by channel incision. Geomorphology 24, 291–308.
Webb, B.W., Walling, D.E., 1982. The magnitude and frequency characteristics of fluvialtransport in a Devon drainage basin and some geomorphological implications.Catena 9, 9–23.
Williams, G.P., 1989. Sediment concentration versus water discharge during singlehydrologic events in rivers. J. Hydrol. 111, 89–106.
Zabaleta, A., Martínez, M., Uriarte, J.A., Antigüedad, I., 2007. Factors controllingsuspended sediment yield during runoff events in small headwater catchments ofthe Basque country. Catena 71 (1), 179–190.
Zhang, B., Yang, Y., Zepp, H., 2004. Effect of vegetation restoration on soil and watererosion and nutrient losses of a severely eroded clayey Plinthudult in southeasternChina. Catena 57, 77–90.