Embed Size (px)
Citation preview
Investing in a Fast Transforming World © DW Transformative & Disruptive Innovation Equity Tracker
June 2017
DuraWealth
Meeting future market needs thanks to Innovations
DuraWealth 2 of 12
For qualified investors only
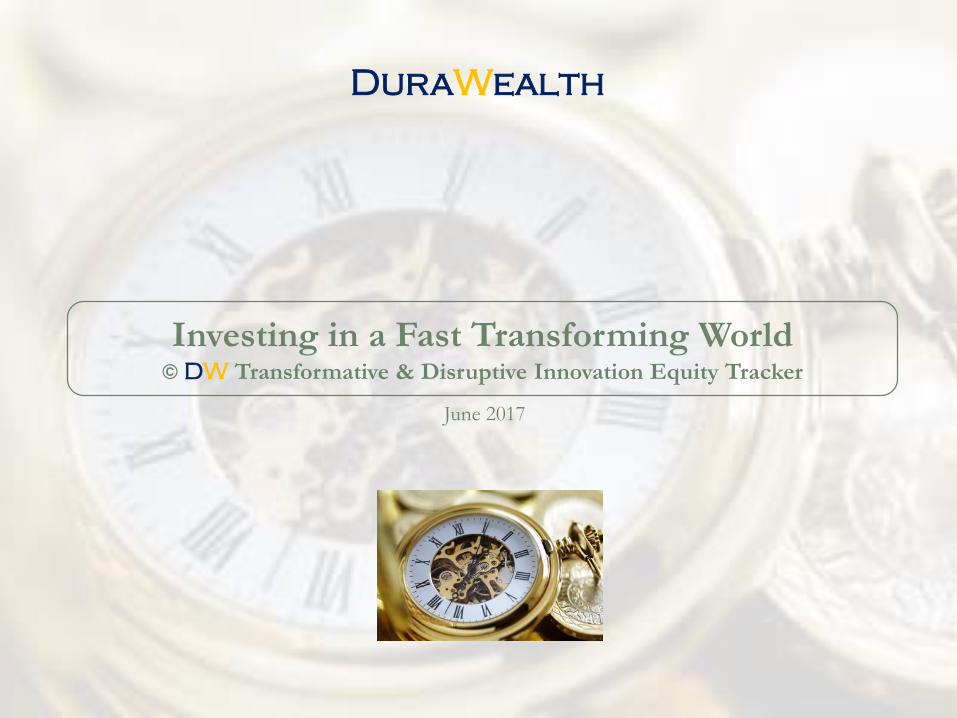
We live in a fast transforming world
Since over 250 years, the 1st, 2nd and 3rd Industrial revolutions lead to the increase of life
quality and wealth creation
Today, the global economy lives a structural transformation linked to the 4th Industrial revolution
Industrial Revolution 4.0 from WEF Video Clip
Meeting future market needs thanks to Innovations
DuraWealth 3 of 12
For qualified investors only
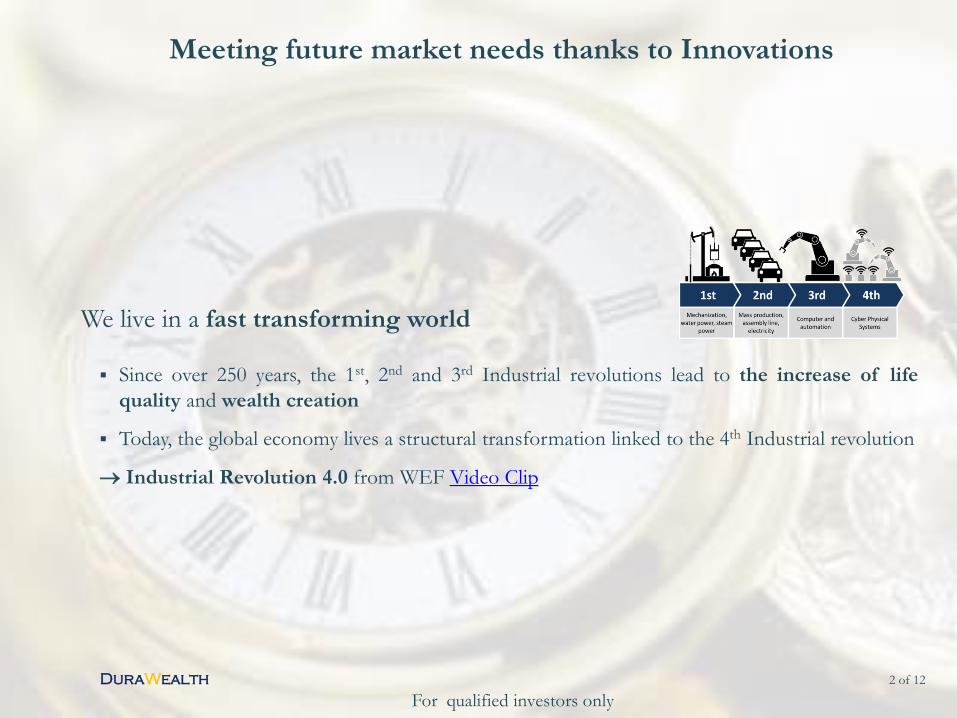
Projected economic impact of Internet of Things i.e. connected physical objects of 2.7 to 6.2 trillion
USD by 2025E and with growth rates of 15%+ p.a.
3-5x higher growth rates than the global economic growth
Selected Industry 4.0 elements
Source: McKinsey, Gartner, IDC, LAM, IoT Analytics, industry data
0.7 0.9 1.0 1.31.5
1.82.2
2.7
0.9 1.1 1.41.6
2.02.4
2.9
3.5
4.3
5.1
6.2
0
1
2
3
4
5
6
2015
2016
E
2017
E
2018
E
2019
E
2020
E
2021
E
2022
E
2023
E
2024
E
20
25
E
McKinsey (low grow scenario) McKinsey (high grow scenario) Gartner CiscoIDC (IoT spending) GDP of Germany at 2% CAGR
Projected economic impact of IoT by 2025 [USD trillion]
Source: 1 SRI denotes Socially Responsible Investing
© DW Global Disruptive Innovation IndexExtracting Value from Global Equities through Innovation and Technology Screening
DuraWealth 4 of 12
For qualified investors only
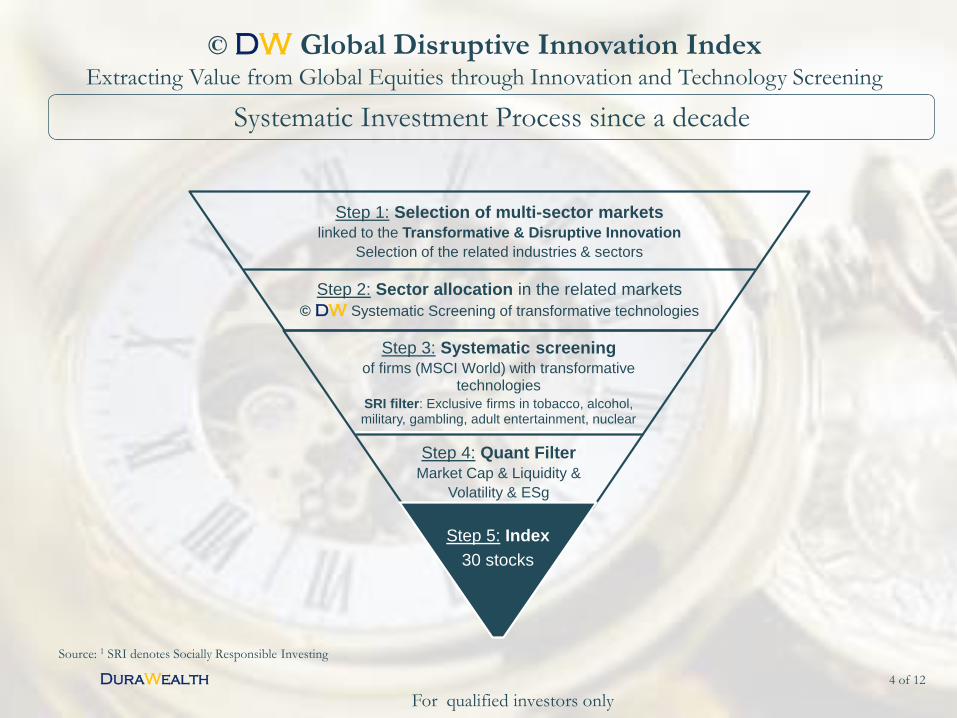
Systematic Investment Process since a decade
Step 1: Selection of multi-sector marketslinked to the Transformative & Disruptive Innovation
Selection of the related industries & sectors
Step 2: Sector allocation in the related markets
© DW Systematic Screening of transformative technologies
Step 3: Systematic screening of firms (MSCI World) with transformative
technologies
SRI filter: Exclusive firms in tobacco, alcohol, military, gambling, adult entertainment, nuclear
Step 4: Quant Filter Market Cap & Liquidity &
Volatility & ESg
Step 5: Index
30 stocks
Meeting Future Needs with DuraWealth equity indexes
DuraWealth 5 of 12
For qualified investors only
Source: UN, OECD, McKinsey, DuraWealth
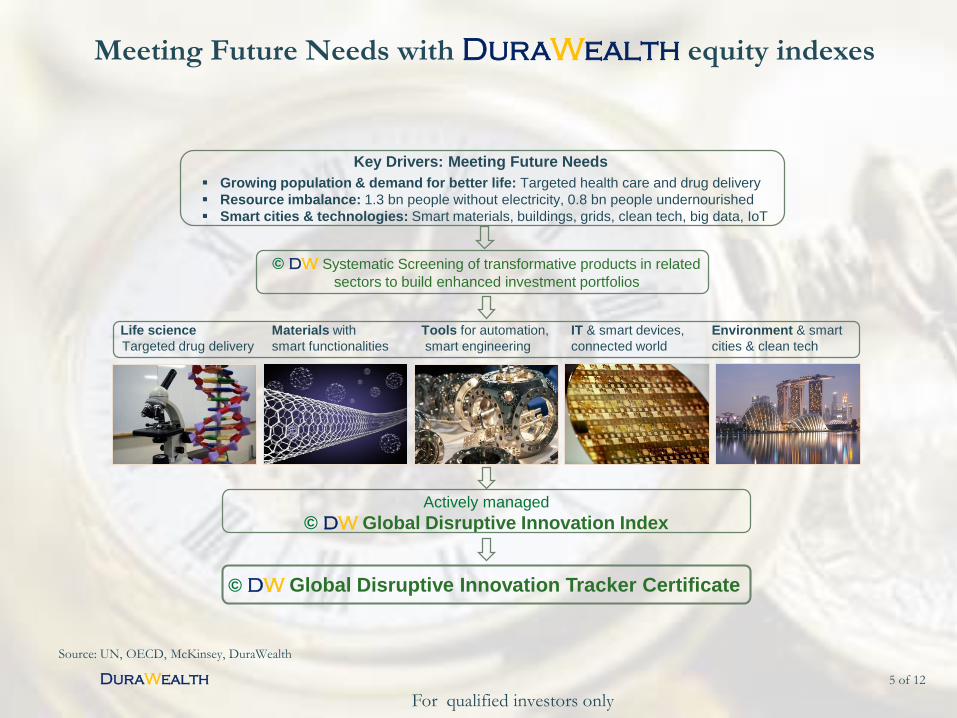
Life science
Targeted drug delivery
Materials with
smart functionalities
Tools for automation,
smart engineering
IT & smart devices,
connected world
Environment & smart
cities & clean tech
Key Drivers: Meeting Future Needs
Growing population & demand for better life: Targeted health care and drug delivery
Resource imbalance: 1.3 bn people without electricity, 0.8 bn people undernourished
Smart cities & technologies: Smart materials, buildings, grids, clean tech, big data, IoT
Actively managed
© DW Global Disruptive Innovation Index
© DW Systematic Screening of transformative products in related
sectors to build enhanced investment portfolios
© DW Global Disruptive Innovation Tracker Certificate
Source: IEA, OECD, IoT Analytics, industry data
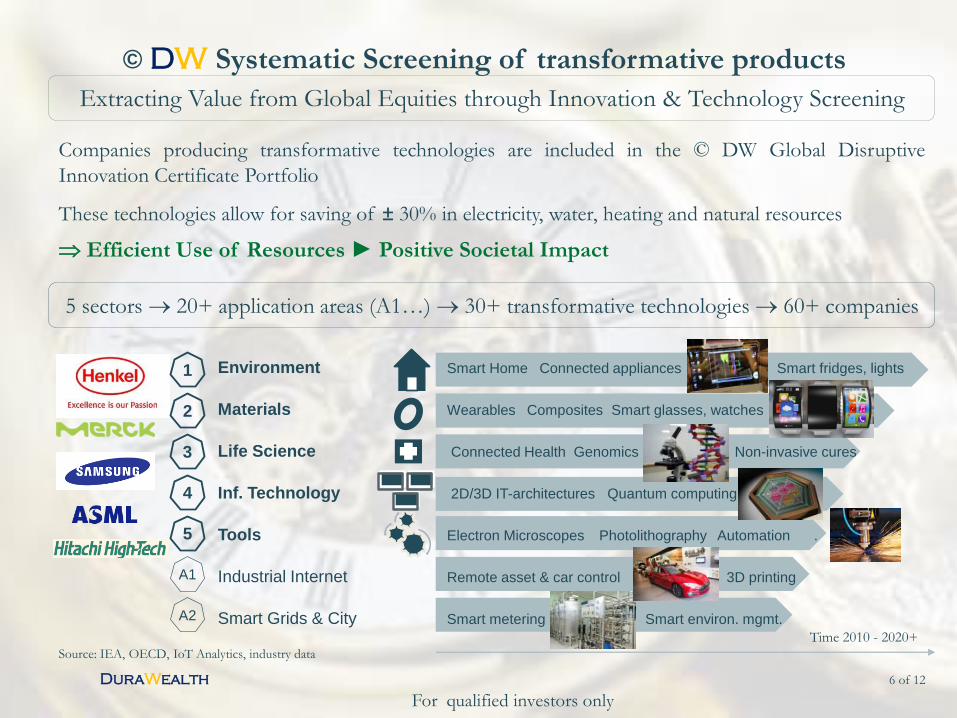
Companies producing transformative technologies are included in the © DW Global Disruptive
Innovation Certificate Portfolio
These technologies allow for saving of ± 30% in electricity, water, heating and natural resources
Efficient Use of Resources ► Positive Societal Impact
© DW Systematic Screening of transformative products
DuraWealth 6 of 12
For qualified investors only
5 sectors 20+ application areas (A1…) 30+ transformative technologies 60+ companies
2
3
1
A1
5
4
A2
Time 2010 - 2020+
Environment Smart Home Connected appliances Smart fridges, lights
Materials Wearables Composites Smart glasses, watches
Life Science Connected Health Genomics Non-invasive cures
Inf. Technology 2D/3D IT-architectures Quantum computing
Tools Electron Microscopes Photolithography Automation .
Industrial Internet Remote asset & car control 3D printing
Smart Grids & City Smart metering Smart environ. mgmt.
Extracting Value from Global Equities through Innovation & Technology Screening
DW Global Disruptive Innovation Tracker (AMC) - Summary
DuraWealth 7 of 12
For qualified investors only
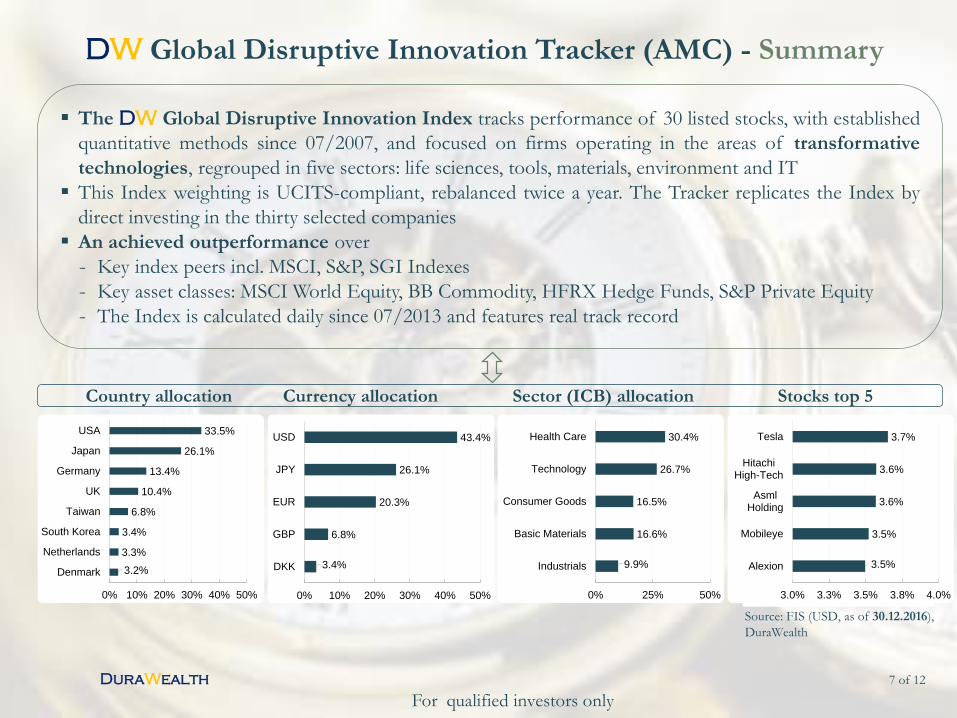
The DW Global Disruptive Innovation Index tracks performance of 30 listed stocks, with established
quantitative methods since 07/2007, and focused on firms operating in the areas of transformative
technologies, regrouped in five sectors: life sciences, tools, materials, environment and IT
This Index weighting is UCITS-compliant, rebalanced twice a year. The Tracker replicates the Index by
direct investing in the thirty selected companies
An achieved outperformance over
- Key index peers incl. MSCI, S&P, SGI Indexes
- Key asset classes: MSCI World Equity, BB Commodity, HFRX Hedge Funds, S&P Private Equity
- The Index is calculated daily since 07/2013 and features real track record
Source: FIS (USD, as of 30.12.2016),
DuraWealth
3.2%
3.3%
3.4%
6.8%
10.4%
13.4%
26.1%
33.5%
0% 10% 20% 30% 40% 50%
Denmark
Netherlands
South Korea
Taiwan
UK
Germany
Japan
USA
3.4%
6.8%
20.3%
26.1%
43.4%
0% 10% 20% 30% 40% 50%
DKK
GBP
EUR
JPY
USD
9.9%
16.6%
16.5%
26.7%
30.4%
0% 25% 50%
Industrials
Basic Materials
Consumer Goods
Technology
Health Care
3.5%
3.5%
3.6%
3.6%
3.7%
3.0% 3.3% 3.5% 3.8% 4.0%
Alexion
Mobileye
AsmlHolding
HitachiHigh-Tech
Tesla
Country allocation Currency allocation Sector (ICB) allocation Stocks top 5
Performance of © DW Global Disruptive Innovation Index
Source: FIS, DuraWealth (daily data, rounded, as of 31.05.2017)
DuraWealth active 8 of 12
For qualified investors only
50
100
150
200
250
300
350
400
01/2
010
05/2
010
09/2
010
01/2
011
05/2
011
09/2
011
01/2
012
05/2
012
09/2
012
01/2
013
05/2
013
09/2
013
01/2
014
05/2
014
09/2
014
01/2
015
05/2
015
09/2
015
01/2
016
05/2
016
09/2
016
01/2
017
DW Global Disruptive Innovation Index (TR) MSCI World Equity AC Index (NTR)
MSCI World AC Nasdaq Comp. 70/30 (TR) MSCI Global Environment Index (P)
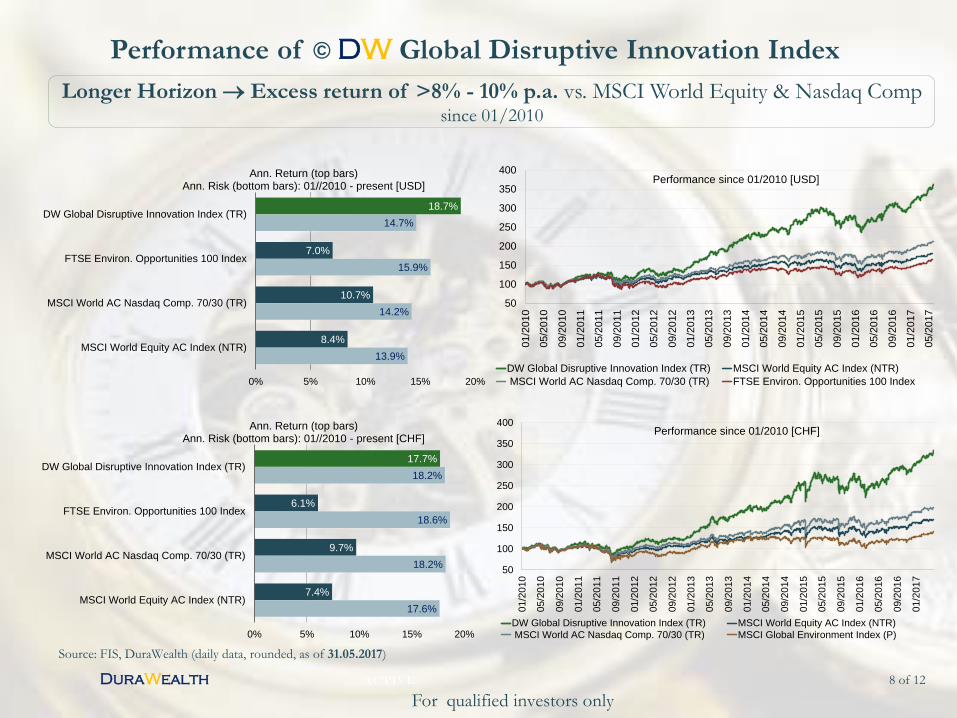
Performance since 01/2010 [CHF]
13.9%
14.2%
15.9%
14.7%
8.4%
10.7%
7.0%
18.7%
0% 5% 10% 15% 20%
MSCI World Equity AC Index (NTR)
MSCI World AC Nasdaq Comp. 70/30 (TR)
FTSE Environ. Opportunities 100 Index
DW Global Disruptive Innovation Index (TR)
Ann. Return (top bars)Ann. Risk (bottom bars): 01//2010 - present [USD]
17.6%
18.2%
18.6%
18.2%
7.4%
9.7%
6.1%
17.7%
0% 5% 10% 15% 20%
MSCI World Equity AC Index (NTR)
MSCI World AC Nasdaq Comp. 70/30 (TR)
FTSE Environ. Opportunities 100 Index
DW Global Disruptive Innovation Index (TR)
Ann. Return (top bars)Ann. Risk (bottom bars): 01//2010 - present [CHF]
50
100
150
200
250
300
350
400
01
/20
10
05
/20
10
09
/20
10
01
/20
11
05
/20
11
09
/20
11
01
/20
12
05
/20
12
09
/20
12
01
/20
13
05
/20
13
09
/20
13
01
/20
14
05
/20
14
09
/20
14
01
/20
15
05
/20
15
09
/20
15
01
/20
16
05
/20
16
09
/20
16
01
/20
17
05
/20
17
DW Global Disruptive Innovation Index (TR) MSCI World Equity AC Index (NTR)
MSCI World AC Nasdaq Comp. 70/30 (TR) FTSE Environ. Opportunities 100 Index
Performance since 01/2010 [USD]
Longer Horizon Excess return of >8% - 10% p.a. vs. MSCI World Equity & Nasdaq Comp since 01/2010
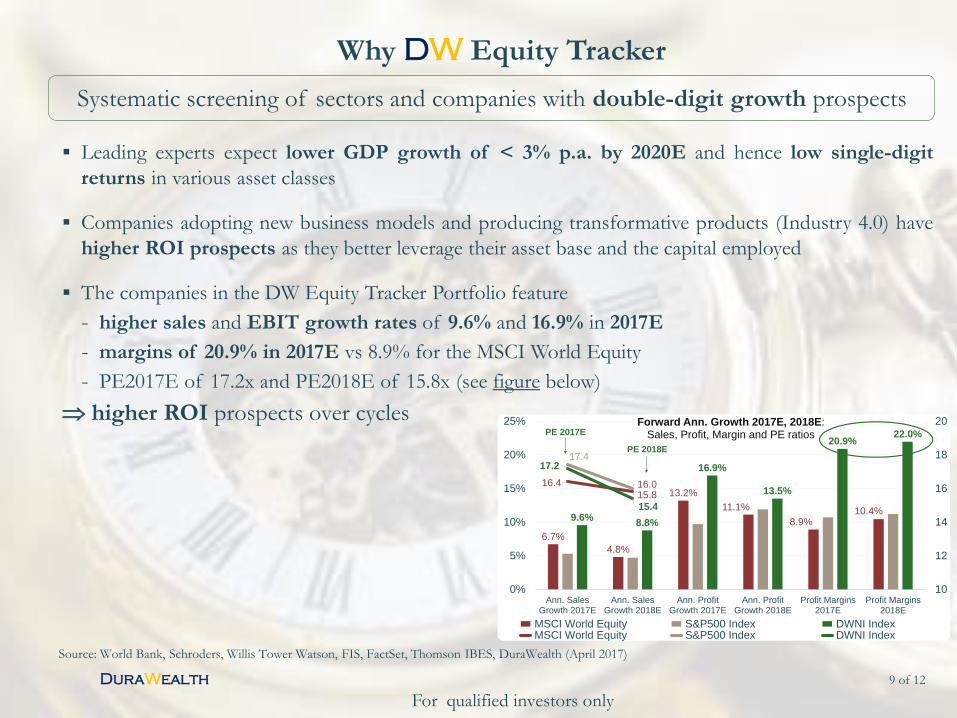
Leading experts expect lower GDP growth of < 3% p.a. by 2020E and hence low single-digit
returns in various asset classes
Companies adopting new business models and producing transformative products (Industry 4.0) have
higher ROI prospects as they better leverage their asset base and the capital employed
The companies in the DW Equity Tracker Portfolio feature
- higher sales and EBIT growth rates of 9.6% and 16.9% in 2017E
- margins of 20.9% in 2017E vs 8.9% for the MSCI World Equity
- PE2017E of 17.2x and PE2018E of 15.8x (see figure below)
higher ROI prospects over cycles
DuraWealth 9 of 12
For qualified investors only
Why DW Equity Tracker
6.7%
4.8%
13.2%
11.1%
8.9%10.4%
9.6%8.8%
16.9%
13.5%
20.9%22.0%
16.4
15.8
17.4
16.0
17.2
15.4
10
12
14
16
18
20
0%
5%
10%
15%
20%
25%
Ann. SalesGrowth 2017E
Ann. SalesGrowth 2018E
Ann. ProfitGrowth 2017E
Ann. ProfitGrowth 2018E
Profit Margins2017E
Profit Margins2018E
Forward Ann. Growth 2017E, 2018E:Sales, Profit, Margin and PE ratios
MSCI World Equity S&P500 Index DWNI Index MSCI World Equity S&P500 Index DWNI Index
PE 2017E
PE 2018E
Source: World Bank, Schroders, Willis Tower Watson, FIS, FactSet, Thomson IBES, DuraWealth (April 2017)
Systematic screening of sectors and companies with double-digit growth prospects
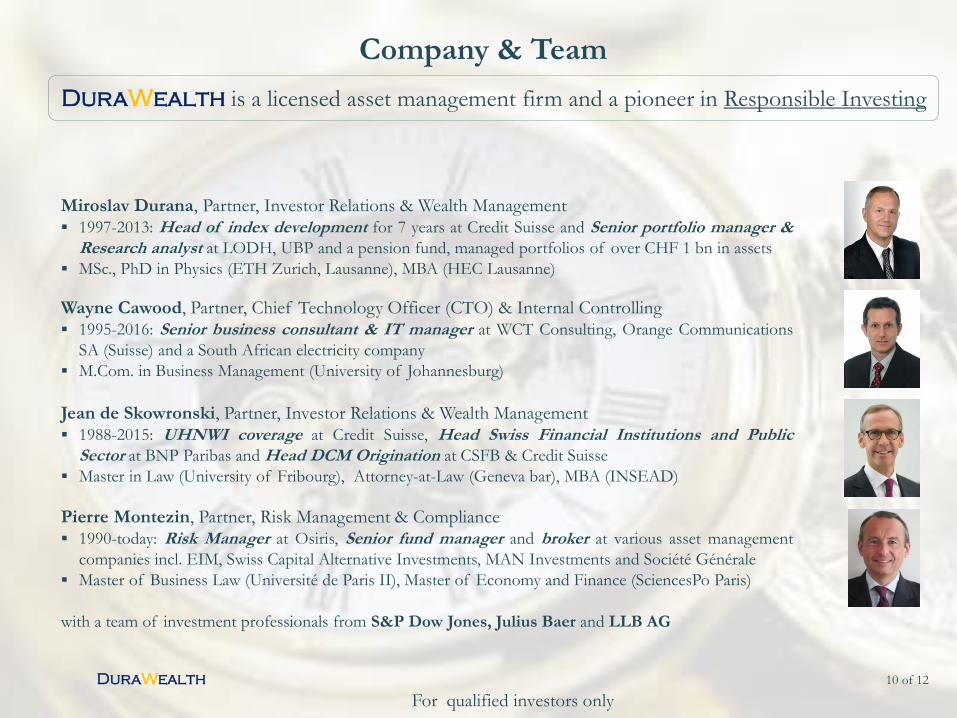
Company & Team
DuraWealth 10 of 12
For qualified investors only
Miroslav Durana, Partner, Investor Relations & Wealth Management 1997-2013: Head of index development for 7 years at Credit Suisse and Senior portfolio manager &
Research analyst at LODH, UBP and a pension fund, managed portfolios of over CHF 1 bn in assets
MSc., PhD in Physics (ETH Zurich, Lausanne), MBA (HEC Lausanne)
Wayne Cawood, Partner, Chief Technology Officer (CTO) & Internal Controlling 1995-2016: Senior business consultant & IT manager at WCT Consulting, Orange Communications
SA (Suisse) and a South African electricity company
M.Com. in Business Management (University of Johannesburg)
Jean de Skowronski, Partner, Investor Relations & Wealth Management 1988-2015: UHNWI coverage at Credit Suisse, Head Swiss Financial Institutions and Public
Sector at BNP Paribas and Head DCM Origination at CSFB & Credit Suisse
Master in Law (University of Fribourg), Attorney-at-Law (Geneva bar), MBA (INSEAD)
Pierre Montezin, Partner, Risk Management & Compliance 1990-today: Risk Manager at Osiris, Senior fund manager and broker at various asset management
companies incl. EIM, Swiss Capital Alternative Investments, MAN Investments and Société Générale
Master of Business Law (Université de Paris II), Master of Economy and Finance (SciencesPo Paris)
with a team of investment professionals from S&P Dow Jones, Julius Baer and LLB AG
DuraWealth is a licensed asset management firm and a pioneer in Responsible Investing
It is a distinct global equity product managed by the DW team with 10+ years experience in
managing proprietary global equity index products
It deploys capital to wisely invest in the listed companies producing transformative i.e. disruptive
technologies with superior ROI prospects and the goal to increase life quality
It uses the scientific skills of the DW team to classify transformative technologies in five sectors
and proprietary index methods developed in 2007 with real track records with superior returns
It is a simple Investment Product, listed at the SIX and managed by the Bank Julius Baer (with
Aa2 Moody’s rating) ► Listing on the Website of the Issuer and Listing on the SIX
It acts as portfolio diversifiers in global portfolios of individual, institutional (pension fund,
treasury, insurance) and responsible investors
DuraWealth 11 of 12
For qualified investors only
Why to invest in the DW Equity Tracker Certificate (AMC)
Equity Tracker
DW Tracker is listed at the SIX, Telekurs, Bloomberg, FIS, Swissquote, the Website of the Issuer
Incorporation data
DuraWealth Ltd. is an asset management company in Schaan (FL), supervised by the FMA
Main office: Fanalwegle 1, FL-9494 Schaan, Contact: [email protected]
Website: www.durawealth.com
DISCLAIMERThis document was produced by DuraWealth and is dedicated for informational purposes only. It is dedicated for internal use only of the receiver and shall not
be partly or fully copied, reproduced or distributed externally conform to Swiss, Liechtenstein and any applicable foreign law. The information in this document
is based on sources considered to be reliable, but its accuracy and completeness is not guaranteed. The information is subject to change at any time and without
obligation to notify the investors. Unless otherwise indicated, some figures are unaudited. Any action derived from this information is always at the investors’
own risk. This document is not an official confirmation of terms. Past performance is no indication of future performance, and some performance data do not
take account of the commissions and costs incurred on the issue and redemption of shares or fund units. The information does not release the recipient from
making his / her own assessment. In particular, the recipient is advised to assess the information, with the assistance of an advisor if necessary, with regard to its
compatibility with his/her own circumstances in view of any legal, regulatory, tax and other implications.
This document is expressly not intended for persons who, due to their nationality / place of residence or their investor’s profile, are not permitted to access to
such information under Swiss, Liechtenstein and any applicable foreign law.