Embed Size (px)
Citation preview

Real-timeLaserTrackerCompensationofa3
AxisPositioningSystem–DynamicAccuracy
Characterization
Zheng Wang University of Bath [email protected]
Paul G Maropoulos University of Bath
ABSTRACT
The concept of integrating metrology systems into production processes has
generated significant interest in industry, due to its potential in reducing
production time and defective parts. One of the most interesting methods of
integrating metrology into production is the usage of external metrology
systems to compensate machine tools and robots in real-time. Continuing the
work described in our previous paper of a prototype laser tracker assisted 3
axis positioning system [1], this paper describes experimental results of the
dynamic path accuracy tests of the machine under real-time laser tracker
compensation. Experiments show that the real-time corrections of the machine
tool’s absolute volumetric error have significantly increased the dynamic path
accuracy of the machine. This result is also validated by a ballbar acting as an
independent measurement instrument, reducing the 95 percentile error from
60µm to less than 10µm, without any prior calibration or error mapping,
showing that the proposed methods are feasible, and can have very wide
applications.
KEYWORDS
Machine Tool, Metrology, Laser Tracker, Real-time Error Compensation, Light
Controlled Factory
1. Introduction
In our previous paper [1], the static accuracy of a 3 axis machine with real-time laser tracker
compensation was analysed, demonstrating dramatic improvements in accuracy and repeatability
compared to the machine without compensation. This paper describes the continuation of the

research project, specifically the effort to study the dynamic path accuracy of the machine under
real-time laser tracker compensation.
Error compensation and accuracy enhancement of machine tools has become a very heavily
researched area, due to the increasing demand on the performance of machine tools for precision
manufacturing. There are two major categories of error compensation: one approach is to attempt
to “calibrate” or construct the error map of the machine before machine operations, which is then
applied for the machining operations [2, 3 and 4]; the other approach is to monitor the error during
the machine operations, which is then used to alter the machining process while the machine is
operating, this is commonly referred to as “real-time compensation”. The majority of the body of
work on real-time error compensation focuses on minimizing or compensating for the intrinsic and
environmental sources of error for each component of the machine tool. Using these traditional
methods, in order to achieve complete compensation of all the possible sources of error, all of the
individual contributors such as geometric (21 errors for a 3-axis machine) [5], kinematic, thermal [6,
7], and cutting forces must be painstakingly modelled [8, 9], and a large array of sensors such as
temperature sensors, load cells, and laser interferometers must be installed to monitor the status of
the machine. The complexity of this method means that it is time consuming to setup, and is
sensitive to the performance and position of the sensors [10].
In this paper, a simpler and more straightforward real-time method of using an external metrology
instrument to directly measure the 3D position of the tool is proposed as an alternative to the
traditional real-time machine tool error compensation methods. Similar concepts have been
explored by Ruiz et al using their own laser tracking system [11]. They have “closed the loop”, but
have not yet published results of the performance of the full system. The focus of this paper will be
the description and analysis of the dynamic path accuracy experiments at different feed rates, and
the validation of the system performance against an independent instrument, a Renishaw ballbar
[12]. For detailed descriptions of the system and the static position accuracy, please refer to our
previous paper [1].
It is worth noting that the system and methodology described herein is not simply a new machine
tool compensation technique, it has greater implications. In such a system, the machine tool
accuracy is controlled by a traceable instrument, so that the parts/features produced are in a sense
already verified. Since the machine tool gets its absolute position from the metrology system, it can
be moved with respect to the part without having to re-datum before starting a new process. This is
important as this system can be used to enhance the accuracy of simple, low cost and low rigidity
machine tools such as robotic manipulators, delivering positioning accuracies that are associated
with the capability of large high precision machine tools.
2. Research Context
The metrology assisted positioning system described in this chapter is now a part of a larger
undertaking in the Light Controlled Factory (LCF) research project at the University of Bath [13].

The hypothesis of LCF is that future factories for high value, complex products will realise their
requirements for flexibility and re-configurability by increasingly adopting and deploying novel and
networked measurement-based techniques; these will provide machines and parts with aspects of
temporal, spatial and dimensional self-awareness, enabling superior machine control and parts
verification.
A part of the LCF project objectives is to develop a flexible, scalable and low cost assembly cell with
integrated manufacturing processes such as machining or material deposition. This technology
demonstrator will demonstrate the integration of metrology systems directly into the manufacturing
and assembly processes for large and complex aerospace components. The integration of metrology
instruments has the potential of reducing the cost of the tooling and of the processing machines,
and because the parts are measured while they are being manufactured, inspection time can be
reduced if not eliminated, and the probability of rejecting parts is also reduced. The LCF
demonstration cell will use metrology instruments and reconfigurable tooling rather than the
traditional heavy and expensive jigs and fixtures to solve the problem of locating the part and the
fixtures. The LCF research is relevant to and will benefit other researchers in the fields of
manufacturing systems design and development, large volume dimensional metrology,
measurement-enabled assembly and in the related fields of composites, industrial applications of
photonics and process automation.
3. Experimental Equipment
3.1. 3 Axis Positioning System
The hardware system consists of 3 THK linear slides, with 20μm positioning repeatability, an
extruded aluminium frame and custom parts for mounting the slides to each other in a bridge
configuration (Figure 1), with a designed payload of 5kg. The machine is assembled by hand,
therefore has high inherent geometric errors. It also does not have any error mapping, or backlash
compensation.
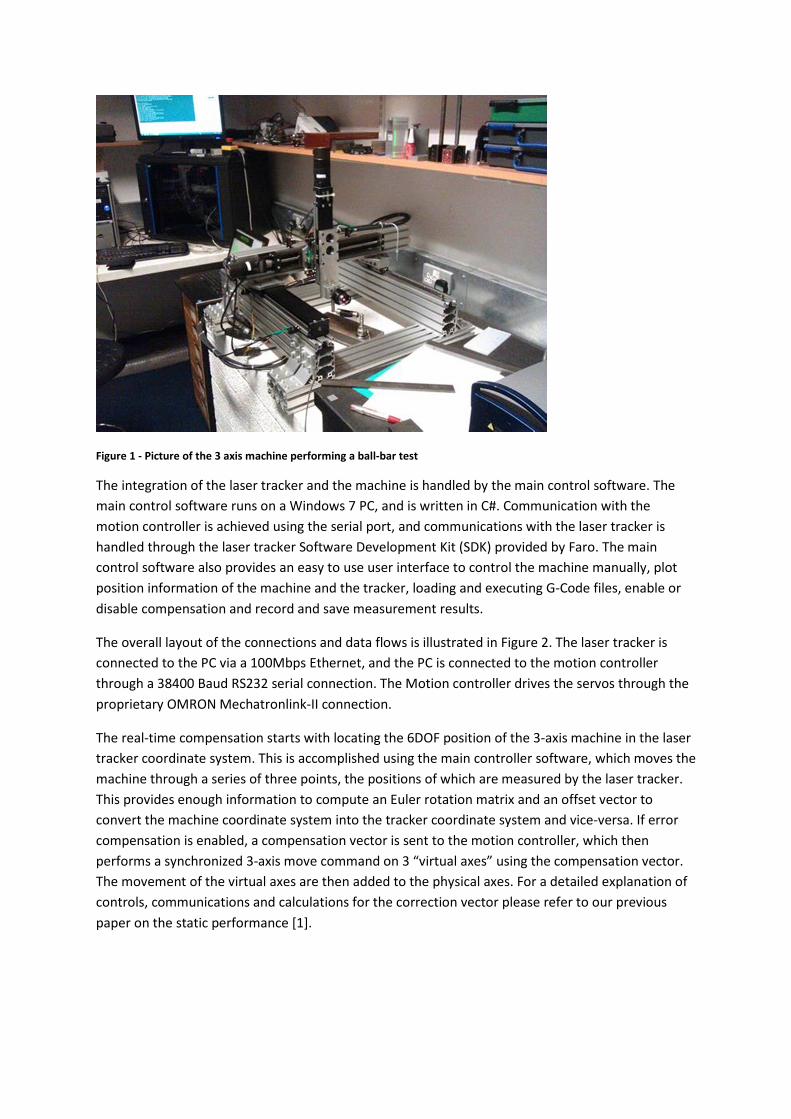
Figure 1 - Picture of the 3 axis machine performing a ball-bar test
The integration of the laser tracker and the machine is handled by the main control software. The
main control software runs on a Windows 7 PC, and is written in C#. Communication with the
motion controller is achieved using the serial port, and communications with the laser tracker is
handled through the laser tracker Software Development Kit (SDK) provided by Faro. The main
control software also provides an easy to use user interface to control the machine manually, plot
position information of the machine and the tracker, loading and executing G-Code files, enable or
disable compensation and record and save measurement results.
The overall layout of the connections and data flows is illustrated in Figure 2. The laser tracker is
connected to the PC via a 100Mbps Ethernet, and the PC is connected to the motion controller
through a 38400 Baud RS232 serial connection. The Motion controller drives the servos through the
proprietary OMRON Mechatronlink-II connection.
The real-time compensation starts with locating the 6DOF position of the 3-axis machine in the laser
tracker coordinate system. This is accomplished using the main controller software, which moves the
machine through a series of three points, the positions of which are measured by the laser tracker.
This provides enough information to compute an Euler rotation matrix and an offset vector to
convert the machine coordinate system into the tracker coordinate system and vice-versa. If error
compensation is enabled, a compensation vector is sent to the motion controller, which then
performs a synchronized 3-axis move command on 3 “virtual axes” using the compensation vector.
The movement of the virtual axes are then added to the physical axes. For a detailed explanation of
controls, communications and calculations for the correction vector please refer to our previous
paper on the static performance [1].

Figure 2 - Layout of physically connections and data flow
3.2. Measurement Equipment
3.2.1. Laser Tracker
The Laser Tracker (LT) is the instrument that provides the absolution coordinate information to the
machine. It utilises interferometry for measuring length and a pair of high resolution angle encoders
to measure the horizontal and vertical angles of the laser beam. (Figure 3) shows a schematic of the
internal components of a typical laser tracker. In the interferometry technique a coherent laser
beam of known wavelength passes through a beam-splitter. One beam is reflected back within the
system while the other is aimed at a Spherical Mirror Reflector (SMR) that is a sphere with an
embedded corner cubed reflector. When the two beams combine, constructive and destructive
interference at the laser wavelength can be observed by the detector. The number of the bright and
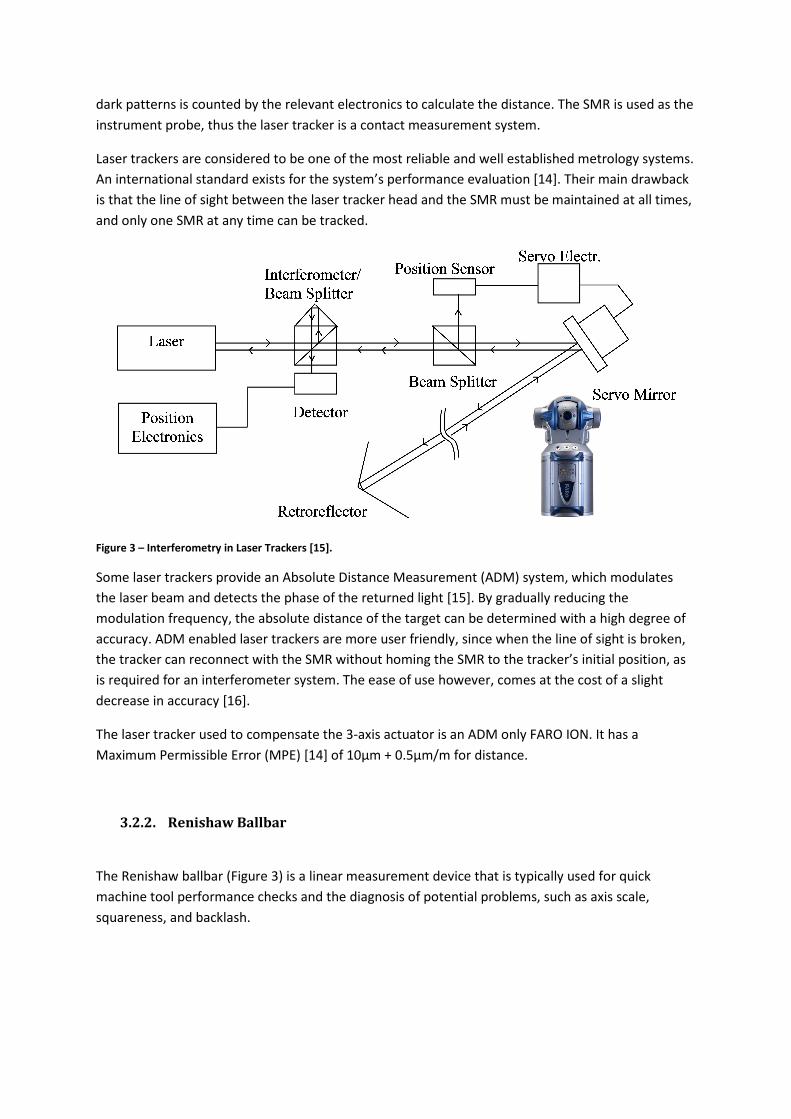
dark patterns is counted by the relevant electronics to calculate the distance. The SMR is used as the
instrument probe, thus the laser tracker is a contact measurement system.
Laser trackers are considered to be one of the most reliable and well established metrology systems.
An international standard exists for the system’s performance evaluation [14]. Their main drawback
is that the line of sight between the laser tracker head and the SMR must be maintained at all times,
and only one SMR at any time can be tracked.
Figure 3 – Interferometry in Laser Trackers [15].
Some laser trackers provide an Absolute Distance Measurement (ADM) system, which modulates
the laser beam and detects the phase of the returned light [15]. By gradually reducing the
modulation frequency, the absolute distance of the target can be determined with a high degree of
accuracy. ADM enabled laser trackers are more user friendly, since when the line of sight is broken,
the tracker can reconnect with the SMR without homing the SMR to the tracker’s initial position, as
is required for an interferometer system. The ease of use however, comes at the cost of a slight
decrease in accuracy [16].
The laser tracker used to compensate the 3-axis actuator is an ADM only FARO ION. It has a
Maximum Permissible Error (MPE) [14] of 10μm + 0.5μm/m for distance.
3.2.2. Renishaw Ballbar
The Renishaw ballbar (Figure 3) is a linear measurement device that is typically used for quick
machine tool performance checks and the diagnosis of potential problems, such as axis scale,
squareness, and backlash.

Figure 3 – Renishaw QC20-W Ballbar and typical test results [12]
It consists of two precision tooling balls attached to a telescoping linear transducer. Two kinematic
mounts, one placed on the machine bed and one attached to the spindle, holds the ballbar in place
as the machine performances a series of programmed circular paths about the centre of one of the
spheres. The distance between the two balls (deviation from the nominal circle) is recorded during
the operation, and can then be used to analyse the accuracy of the machine tool according to ISO
230-4, ASME B5.54 standards or Renishaw’s proprietary diagnostic tools.
The QC20-W ballbar used in the paper has a resolution of 0.1µm and measurement uncertainty of
0.7µm + 0.3% L (i.e. for a 100µm measured circular deviation the uncertainty is 1µm) [12]. Since the
ballbar is able to make dynamic measurements, and is at least an order of magnitude better than a
laser tracker for the purposes of the experiments described in this paper, it is a very useful tool to
independently validate the dynamic performance of the system.
4. Experimental Setup
4.1. Path Accuracy Experiment
To study the dynamic path following performance of the machine at different feed rates with and
without laser tracker feedback, a set of three linear paths is programmed (Figure 4). The machine
comes to a full stop at the end of each linear segment before continuing.
Figure 4 – Programmed path for path accuracy test
280mm
180m
m

The experiment is performed three times at increasing feed rates (2000mm/min, 4000mm/min and
6000mm/min) with real-time feedback enabled, as well as one time at 2000mm/min without
feedback for comparison. The position of the SMR as measured by the laser tracker is recorded for
analysis. The positions of the end of line segments points are also recorded to be used for best fitting
the result to the nominal path.
4.2. Ballbar Test
Since the ballbar’s measurement uncertainty is at least an order of magnitude lower than that of the
laser tracker, it is used as an independent measurement instrument to validate the system
performance. The ballbar also measures from the end of the tool, which is offset from the SMR, such
that it will be able to record any orientation errors which cannot be compensated by the laser
tracker.
Figure 5 – Programmed path for ballbar test
The ballbar test consists of two circular moves 100mm in radius in the X-Y plane, each repeated
twice (Figure 5) at 1000mm/min. The test is performed with and without compensation for
comparison. The Renishaw ballbar software records the result and saves the deviations from the
nominal circle as an .xml file.
5. Experimental Results and Analysis
5.1. Laser Tracker Measurement Uncertainties
Start100mm
x 2
x 2

The measurement uncertainties of the laser tracker can be estimated using a mathematical model of
the instrument. The group at the University of Bath has access to the tracker model developed at the
National Physical Laboratory [17] by Forbes et al, which allows the simulation of tracker
measurements.
Using the NPL model and the manufacturer’s specifications, the measurements in the experiment
are simulated using a single tracker station. The model produces covariance matrices for each of the
measured points, which can be visualized as uncertainty ellipsoids as shown in Figure 6.
Figure 6 - Simulated tracker measurements using NPL code
The simulation shows that the laser tracker measurement uncertainty for the path accuracy
experiment is on the order of 7 to 8µm. Since the ballbar test is within the same volume, the
measurement uncertainty will be similar.
5.2. Path Accuracy Results
The path accuracy experiment is specifically designed to study the effect of feed rate on the machine
path accuracy when laser tracker compensation is enabled. To compute the path deviation, the
recorded path needs to be compared to the nominal path. A transformation matrix is calculated
using a simple least squares best fit of the 4 path vertices of the end of the line segments to the
nominal points. The transformation matrix is then used to move the recorded path measurement.
0100
200300
400500
600700
-200
-100
0
-400
-300
-200
-100
0
Y (mm)X (mm)
Z (
mm
)

Figure 7 - Exaggerated (x1000) deviation from nominal path. A) Without feedback 2000mm/min, B) Without feedback
2000mm/min, C) With feedback 4000mm/min, D) With feedback 6000mm/min
Figure 7 shows a qualitative plot of the deviation vector exaggerated 1000 times, showing large error
in the path in the X-Y plane without error compensation and significant reduction of path error when
real-time compensation is enabled. The differences can be seen more quantitatively in Figure 8,
where the absolute deviation from the nominal path is plotted against distance along the path. It is
clear to see that real-time compensation reduced the path error at all feed rates. With
compensation, the error at 6000mm/min is still much lower than the error at 2000mm/min without
compensation. The discontinuities in the graph are the result of projection of the position error to
the end of the line segments.
Figure 8 - Absolute deviation from nominal path for different feed rates
-1000
100200
300400
-100
0
100
200
300-50
0
50
X (mm)
Without feedback F = 2000mm/min
Y (mm)
Z (
mm
)
-1000
100200
300400
-100
0
100
200
300-50
0
50
X (mm)
With feedback F = 2000mm/min
Y (mm)
Z (
mm
)
-1000
100200
300400
-100
0
100
200
300-50
0
50
X (mm)
With feedback F = 4000mm/min
Y (mm)
Z (
mm
)
-1000
100200
300400
-100
0
100
200
300-50
0
50
X (mm)
With feedback F = 6000mm/min
Y (mm)
Z (
mm
)
A B
C D
0 100 200 300 400 500 600 7000
0.01
0.02
0.03
0.04
0.05
0.06
0.07
0.08Deviation along path
Distance along path (mm)
Dev
iatio
n fr
om n
omin
al p
ath
(mm
)
Without feedback (F2000)
With feedback (F2000)
With feedback (F4000)
With feedback (F6000)

The path deviation can be analysed statistically by comparing the cumulative distributions (Figure 9),
showing that as the feed rate increases, the path accuracy decreases. The 95 percentiles path
deviations with real-time compensation for 2000, 4000, 6000mm/min are 0.009mm, 0.015mm, and
0.022mm respectively, compared to 0.058mm at 2000mm/min with no compensation. The
increasing feed rates reduces the effectiveness of the compensation, since the compensation loop
operates at the same rate regardless of the feed rate, therefore at faster feed rates the system has
less time to respond to detected errors. This results in an apparent change in the slope of the
cumulative distribution.
Figure 9 - Cumulative distribution of path deviation for different feed rates
5.3. Ballbar Test
While the path accuracy test demonstrates the effectiveness of real-time laser tracker compensation,
it is never-the-less based on the measurement from the laser tracker. It is therefore important to
have an independent instrument that can verify the performance of the system without having to
rely on the laser tracker.
While the Renishaw software does not allow direct comparisons between sets of ballbar
measurements, it records the deviation from the nominal circle in an .xml file which can be parsed
extracted and processed. Using these files, the circular deviation comparisons between tests with
and without real-time compensation is plotted in Figure 10 (polar plot) and Figure 11 (linear plot).
0 0.01 0.02 0.03 0.04 0.05 0.06 0.07 0.080
0.1
0.2
0.3
0.4
0.5
0.6
0.7
0.8
0.9
1
X (mm)
Cum
ulat
ive
Pro
babi
lity
Cumulative distribution comparison
With feedback (F2000)
With feedback (F4000)With feedback (F6000)
Without feedback(F2000)

Figure 10 - Ballbar test comparison (polar plot) for 1000mm/min feed rate
Figure 11 - Ballbar test comparison for 1000mm/min feed rate
From the Figure 10, without compensation, it is possible to see that the machine has a large X-Y axis
squareness error, which causes the deviation to be elliptical, and back lash causes offsets between
the clockwise (CW) and counter-clockwise (CCW) deviations. The accuracy of the machine is
significantly better when real-time compensation is enabled. The quantitative difference between
the two tests can be easily seen in Figure 11, in which the squareness error appears as a sinusoidal
deviation.
The comparison in cumulative distribution form is shown in Figure 12. The 95 percentiles path
deviations with real-time compensation is less than 0.01mm, compared to > 0.06mm with no
-0.3
-0.2
-0.1
0
0.1
30
210
60
240
90
270
120
300
150
330
180 0
Ballbar results
Deviation scale: mm
CCW
CWCCW+Feedback
CW+Feedback
0 90 180 270 360 450 540 630 720-0.08
-0.06
-0.04
-0.02
0
0.02
0.04
0.06
0.08
Central angle (deg)
Dev
iatio
n fr
om n
omin
al c
ircle
(m
m)
Ballbar test comparison
CCW
CWCCW+Feedback
CW+Feedback

compensation. The differences in the CW and CCW for the uncompensated experiment show that
there is a hysteresis effect affecting the path accuracy, likely caused by backlash. The result in Figure
12 is very similar to the laser tracker measurements in Figure 9. Therefore it has independently
confirmed the previous results.
Figure 12 - Cumulative distribution of path deviation comparison for 1000mm/min federate
6. Summary and Discussions
This paper has described the working principles and dynamic performance assessment of a
prototype 3-axis machine tool with real-time laser tracker error compensation. This metrology
assisted machine tool can be thought off as an accurate end-effector for use within a Measurement
Assisted Assembly cell, delivering localised, high accuracy tool control within large working
envelopes of tens of meters.
The dynamic path accuracy experiments have demonstrated that the laser tracker real-time
compensation produced extensive improvements in accuracy. This experiment showed that at
6000mm/min feed rate, there is a nearly 3 times lower path deviation when real-time compensation
is enabled, and considerably more when the feed rate is lower. Using a Renishaw ballbar, we have
independently confirmed the dynamic performance of the machine, showing nearly the same results
as the laser tracker measurements in the path accuracy test.
The novel research described in this paper is a significant technical development that demonstrated
the feasibility of the proposed methods, and can have wide scale industrial applications by enabling
low cost and structural integrity machine tools to achieve positional accuracies that were the
preserve of expensive machines. The outcomes of the research and the overarching concept of
0 0.01 0.02 0.03 0.04 0.05 0.06 0.07 0.080
0.1
0.2
0.3
0.4
0.5
0.6
0.7
0.8
0.9
1
X (mm)
Cum
ulat
ive
Pro
babi
lity
Cumulative distribution comparison
CCW
CWCCW+Feedback
CW+Feedback

measurement-enabled production has generated significant interest in industry, due to the potential
to increase process capability and accuracy which in turn reduces production times and defective
parts.
Acknowledgements
The authors would like to gratefully acknowledge the financial support of the EPSRC, grant
EP/K018124/1, “The Light Controlled Factory”. Thanks also go to the industrial collaborators for their
contribution as well as the Department of Mechanical Engineering at the University of Bath.
References
1. Wang, Z. & Maropoulos, P. G. (2013) “Real-time error compensation of a three-axis machine tool
using a laser tracker.” The International Journal of Advanced Manufacturing Technology. 69, 1-4,
p. 919-933 15 p.
2. Sergio Aguado, Jorge Santolaria, David Samper, Juan J Aguilar, (2014) “Study of self-calibration
and multilateration in machine tool volumetric verification for laser tracker error reduction”,
Proceedings of the Institution of Mechanical Engineers, Part B: Journal of Engineering
Manufacture vol. 228 no. 7 659-672
3. Zhenjiu Zhang, Hong Hu, (2014) "Measurement and compensation of geometric errors of three-
axis machine tool by using laser tracker based on a sequential multilateration scheme",
Proceedings of the Institution of Mechanical Engineers, Part B: Journal of Engineering
Manufacture August vol. 228 no. 8 819-831
4. J. Ni, (1987) "Study on Online Identification and Forecasting compensatory control of volumetric
Errors for Multiple Axis Machine Tools", PhD Dissertation, University of Wisconsin-Madison.
5. R. Ramesh, M.A. Mannan, and A.N. Poo, (2000) "Error compensation in machine tools - a review
Part I: geometric, cutting-force induced and fixture-dependent errors", International Journal of
Machine Tools & Manufacture, Vol 40, pp 1235-1256.
6. R. Ramesh, M.A. Mannan, and A.N. Poo, (2000) "Error compensation in machine tools - a review
Part II: thermal errors", International Journal of Machine Tools & Manufacture, Vol 40, pp 1257-
1284.
7. S. Yang, J. Yang, and J. Ni (1996) "The Improvement of Thermal Error Modelling and
Compensation on a Turning Centre", International Journal of Machine Tools & Manufacture, Vol
37, No. 11, pp 527-537.
8. Chih-Hao Lo, Jingxia Yuan, and Jun Ni, (1995) "An Application of Real-Time Error Compensation
on a Turning Center", International Journal of Machine Tools & Manufacture, Vol 35, No. 12, pp
1669-1682.
9. W.T. Lei and Y.Y. Hsu (2003) "Accuracy Enhancement of Five-Axis CNC Machines through Real-
Time Error Compensation", International Journal of Machine Tools & Manufacture, Vol 43, pp
871-877.
10. Jingxia Yuan and Jun Ni (1998) "The Real-Time Error Compensation Technique for CNC Machining
Systems", Mechatronics, Vol 8, pp 359-380.
11. Ruiz, Antonio Ramon J., Rosas, Jorge G., Granja, Fernando S., Honorato, Jose Carlos P., Taboada,
Jose Juan E., Serrano, Vicente M., Jimenez, Teresa M. (2009) "A Real-Time Tool Positioning
Sensor for Machine-Tools." Sensors 9, no. 10: 7622-7647.
12. Renishaw, (2013) "QC20-W wireless ballbar system description and specifications", QC20-W
wireless ballbar system technical brochure,
13. The Engineering and Physical Sciences Research Council (2012) "Details of Grant: The Light
Controlled Factory." Summary on Grant Application Form, Web. 16 Oct. 2014.
http://gow.epsrc.ac.uk/NGBOViewGrant.aspx?GrantRef=EP/K018124/1
14. ASME B89.4.19. (2006) “Performance Evaluation of Laser-Based Spherical Coordinate
Measurement Systems”
15. Estler WT, Edmundson KL, Peggs GN and Parker DH, (2002) “Large Scale Metrology-An Update”,
CIRP Annals, NIST Technipubs

16. FARO EUROPE GmbH & Co. KG. (2010) “Faro Laser Tracker Ion”, Faro UK technical specification
sheet,
17. A. B. Forbes, E. B. Hughes, and W. Sun, (2009) “A reference model for multi-station coordinate
measuring systems”, Technical report, National Physical Laboratory, private communication


![L gende de Novgorode article JES.doc) - Opusopus.bath.ac.uk/24790/1/Parish_J_European_Studies_2012.pdf · C’était du culot. [. . .] ... Maurice Blanchot evokes this powerful relationship](https://img.pdfslide.net/doc/110x75/5ae113fa7f8b9ab4688e2d92/l-gende-de-novgorode-article-jesdoc-tait-du-culot-maurice-blanchot.jpg)