Embed Size (px)
Citation preview
DYNAMIC ANALYSES OF CANADIAN LANDSLIDES Mika McKinnon Earth & Ocean Sciences - University of British Columbia, British Columbia, Canada, [email protected] Oldrich Hungr¹ and Scott McDougall² ¹University of British Columbia, British Columbia, Canada, [email protected] ²BGC Engineering Inc, Vancouver, British Columbia, Canada, [email protected] RÉSUMÉ Les glissements de terrain rapides au Canada présentent des risques majeurs sur les plans humain, des infrastructures et des écosystèmes. La modélisation adéquate des glissements permet de réduire les pertes grâce aux prédictions des vitesses de glissement et des aires de dépôts. Les modèles d'analyse de parcours DAN-W et DAN-3D ont simulé avec succès de nombreux cas de part de le monde. Dans cet article, nous présentons plus particulièrement les résultats d'analyses à rebours de plusieurs glissements rapides au Canada. L'objectif à long terme de cette étude est d'établir un intervalle de paramètres permettant une modélisation rapide du type de glissement considéré. ABSTRACT Rapid destructive landslides in Canada pose a significant risk to lives, infrastructure, and ecosystems. Accurate modeling of landslides can reduce losses by improving predictions of runout velocity and deposit area. The DAN-W and DAN3D runout models for landslides have successfully simulated cases from around the world. In this article, we present the results of the back-analysis of several Canadian landslides. The long-term objective of this work is to establish a range of parameters specific to different types of rapid landslides for use in predictive modeling of potential landslides. 1. INTRODUCTION Landslides pose a serious risk to human lives, infrastructure, and sensitive ecosystems. Accurate prediction of landslide behaviour, including runout area and flow velocity, is essential for effective risk assessment. Computer modeling provides an important tool for forecasting the behaviour of rapidly moving landslides. The DAN-W and DAN3D fluid dynamics models have been used for several years to back-analyse case histories from around the world. Successful back-analyses may be used to calibrate the models and improve forecasting accuracy. This paper is a brief summary of a selection of varied cases of back-analysis involving Canadian landslides. 2. METHODOLOGY DAN-W and DAN3D are dynamic analysis models designed to predict the velocity and extent of motion of rapid landslides such as debris flows and avalanches, flow slides and rock avalanches. DAN-W works on a two-dimensional slope profile and requires input of any changes in flow path width (Hungr 1995), while DAN3D is a three-dimensional extension of the model which requires input of a digital terrain model. (McDougall and Hungr 2004 and 2005) Both models can simulate landslides which entrain path material and have variable rheology. The models typically produce similar results when consistent input parameters are used. The models diverge somewhat when there is significant deflection of the flow. This is likely because the DAN-W model requires the input of a pre-defined path profile and may not accurately simulate the energy losses associated with sharp changes in direction.
2.1 Rheology Both DAN models use simple homogeneous hypothetical materials that simulate the bulk behaviour of complex heterogeneous real landslide materials (Hungr 1995). The properties of the hypothetical materials must be assessed through back-analyses of real cases. For our back-analyses of rapid landslides we use frictional, Voellmy, and Bingham rheologies. 2.1.1 The Frictional rheology In the frictional rheology, the basal shear stress τzx opposing motion is expressed as: τzx = - σz tanφb [1] where σz is the total bed-normal stress at the base of the flow and φb is the bulk basal friction angle (with tan φb = (1-ru) tan φ, where ru is the pore pressure ratio and φ is the dynamic basal friction angle). Overestimation of velocities and often unrealistic forward-tapering deposits are characteristics of the frictional model. (McDougall 2006) 2.1.2 The Voellmy rheology The Voellmy rheology combines frictional and turbulent models such that τzx = σz f + ρgν²/ξ [2] where f is the frictional coefficient, ρ is the material density, g is gravitational acceleration, ν is the depth-averaged flow velocity, and ξ is the turbulence term. In comparison to the
In : J. Locat, D. Perret, D. Turmel, D. Demers et S. Leroueil, (2008). Comptes rendus de la 4e Conférence canadienne sur les géorisques: des causes à la gestion. Proceedings of the 4th Canadian Conference on Geohazards : From Causes to Management. Presse de l’Université Laval, Québec, 594 p.
frictional model, the Voellmy model typically produces better simulations of velocity and deposit distribution. 2.1.3 The Bingham rheology The Bingham resistance model combines plastic and viscous behaviour. The shear resistance is determined by solving the following cubic equation: τzx³ + 3 (τyeild/2 + μBingham νxh) τzx² - τyeild³/2 = 0 [3] where τyeild is the Bingham yield stress and μBingham is the Bingham viscosity. The Bingham model may produce better simulations of events involving clayey or highly plasticity materials. 2.2 Calibration For all case histories, the runout path is based on detailed topographic maps. The material rheologies are determined through empirical calibration. Systematic trial and error back-analyses of similar previous events are used to constrain the rheological relationship and the specific resistance parameter values. Validity of the model is assessed through comparison of calculated and observed landslide characteristics, such as deposit distribution and extent, velocity profiles, and volume. In the December 2007 benchmarking exercises at the International Landslide Risk Management Forum in Hong Kong, the DAN-W and DAN3D models produced results consistent with those of other models from several countries around the world.
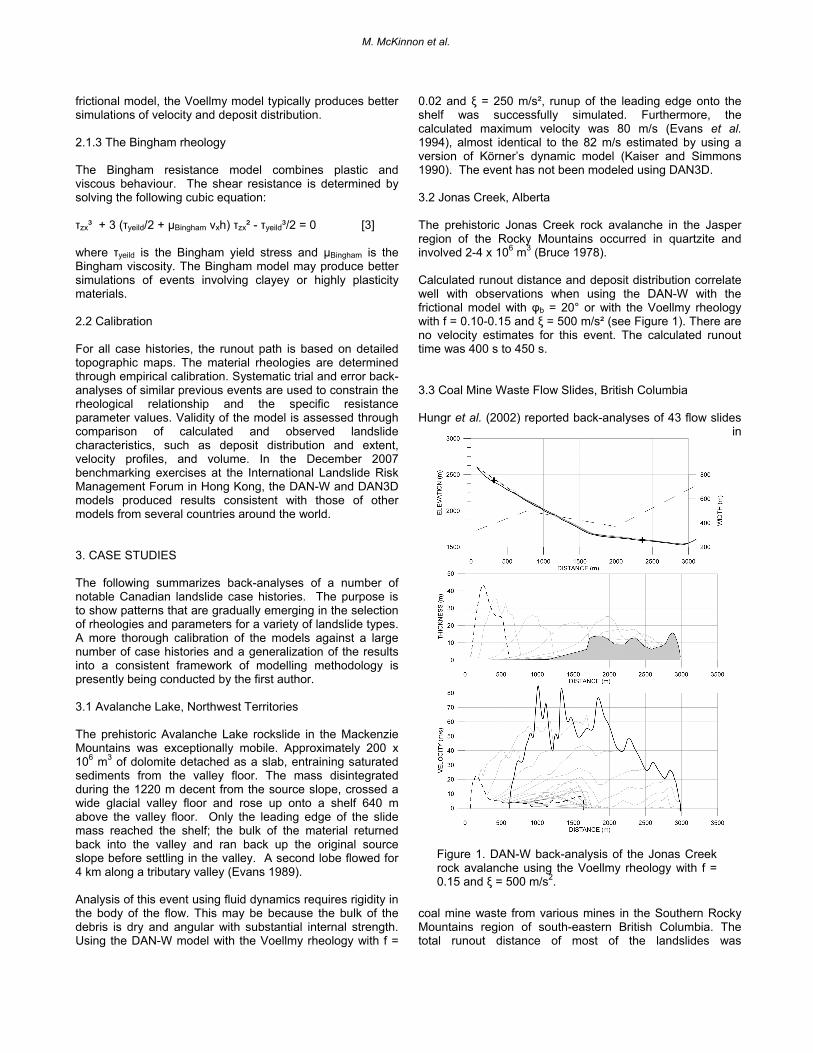
Figure 1. DAN-W back-analysis of the Jonas Creek rock avalanche using the Voellmy rheology with f = 0.15 and ξ = 500 m/s2.
3. CASE STUDIES The following summarizes back-analyses of a number of notable Canadian landslide case histories. The purpose is to show patterns that are gradually emerging in the selection of rheologies and parameters for a variety of landslide types. A more thorough calibration of the models against a large number of case histories and a generalization of the results into a consistent framework of modelling methodology is presently being conducted by the first author. 3.1 Avalanche Lake, Northwest Territories The prehistoric Avalanche Lake rockslide in the Mackenzie Mountains was exceptionally mobile. Approximately 200 x 106 m3 of dolomite detached as a slab, entraining saturated sediments from the valley floor. The mass disintegrated during the 1220 m decent from the source slope, crossed a wide glacial valley floor and rose up onto a shelf 640 m above the valley floor. Only the leading edge of the slide mass reached the shelf; the bulk of the material returned back into the valley and ran back up the original source slope before settling in the valley. A second lobe flowed for 4 km along a tributary valley (Evans 1989). Analysis of this event using fluid dynamics requires rigidity in the body of the flow. This may be because the bulk of the debris is dry and angular with substantial internal strength. Using the DAN-W model with the Voellmy rheology with f =
0.02 and ξ = 250 m/s², runup of the leading edge onto the shelf was successfully simulated. Furthermore, the calculated maximum velocity was 80 m/s (Evans et al. 1994), almost identical to the 82 m/s estimated by using a version of Körner’s dynamic model (Kaiser and Simmons 1990). The event has not been modeled using DAN3D. 3.2 Jonas Creek, Alberta The prehistoric Jonas Creek rock avalanche in the Jasper region of the Rocky Mountains occurred in quartzite and involved 2-4 x 10⁶ m3 (Bruce 1978). Calculated runout distance and deposit distribution correlate well with observations when using the DAN-W with the frictional model with φb = 20° or with the Voellmy rheology with f = 0.10-0.15 and ξ = 500 m/s² (see Figure 1). There are no velocity estimates for this event. The calculated runout time was 400 s to 450 s. 3.3 Coal Mine Waste Flow Slides, British Columbia Hungr et al. (2002) reported back-analyses of 43 flow slides
in
coal mine waste from various mines in the Southern Rocky Mountains region of south-eastern British Columbia. The total runout distance of most of the landslides was
M. McKinnon et al.
successfully modeled using the frictional rheology with φb = 20-25°. In some cases where the flow entered a confined channel and entrained loose, saturated materials, much greater mobility was observed and it was necessary to use the Voellmy model with f = 0.05-0.1 and ξ = 200 m/s². The relatively low friction coefficient required in these cases suggests that entrainment of liquefied saturated material from the flow path is an important mechanism for increasing the mobility of landslides. 3.4 Frank Slide, Alberta in 1903 A 36 x 106 m3 rock avalanche on Turtle Mountain in the Southern Rockies resulted in approximately seventy fatalities. Fragmented limestone entrained saturated alluvium along the valley floor. At present, a potential smaller landslide from the disturbed South Peak of Turtle Mountain is being intensively studied by the Alberta Geological Survey.
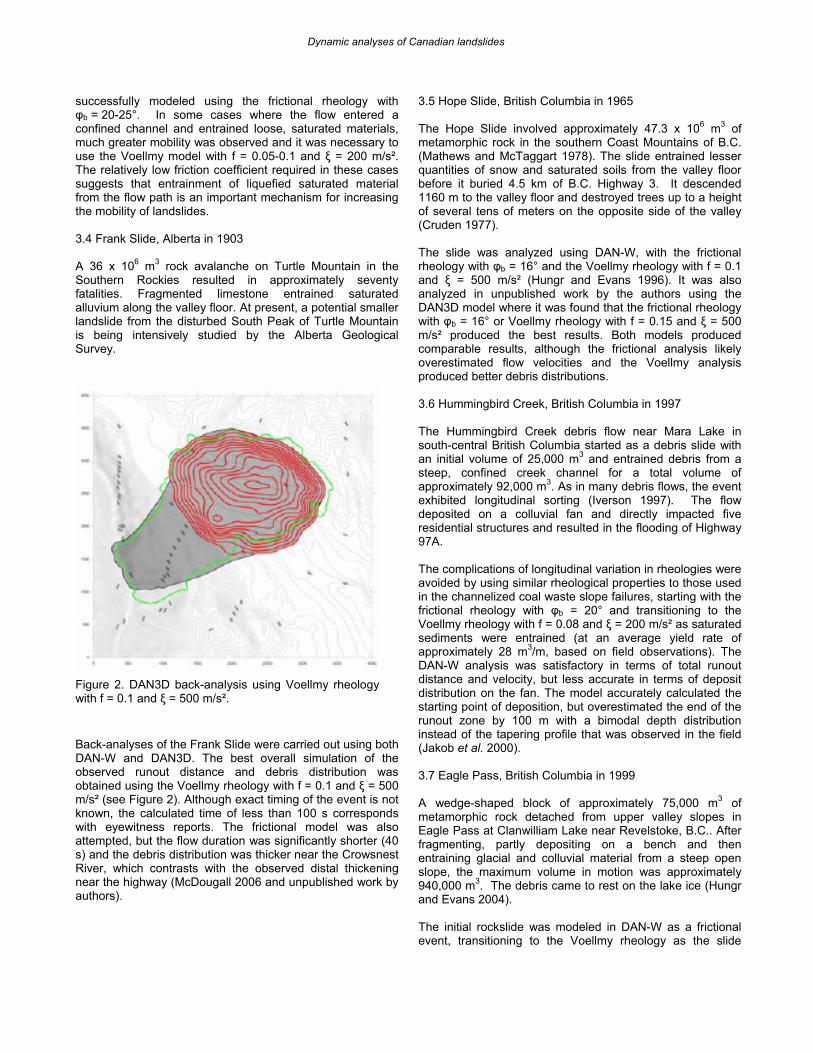
Back-analyses of the Frank Slide were carried out using both DAN-W and DAN3D. The best overall simulation of the observed runout distance and debris distribution was obtained using the Voellmy rheology with f = 0.1 and ξ = 500 m/s² (see Figure 2). Although exact timing of the event is not known, the calculated time of less than 100 s corresponds with eyewitness reports. The frictional model was also attempted, but the flow duration was significantly shorter (40 s) and the debris distribution was thicker near the Crowsnest River, which contrasts with the observed distal thickening near the highway (McDougall 2006 and unpublished work by authors).
3.5 Hope Slide, British Columbia in 1965 The Hope Slide involved approximately 47.3 x 10⁶ m3 of metamorphic rock in the southern Coast Mountains of B.C. (Mathews and McTaggart 1978). The slide entrained lesser quantities of snow and saturated soils from the valley floor before it buried 4.5 km of B.C. Highway 3. It descended 1160 m to the valley floor and destroyed trees up to a height of several tens of meters on the opposite side of the valley (Cruden 1977). The slide was analyzed using DAN-W, with the frictional rheology with φb = 16° and the Voellmy rheology with f = 0.1 and ξ = 500 m/s² (Hungr and Evans 1996). It was also analyzed in unpublished work by the authors using the DAN3D model where it was found that the frictional rheology with φb = 16° or Voellmy rheology with f = 0.15 and ξ = 500 m/s² produced the best results. Both models produced comparable results, although the frictional analysis likely overestimated flow velocities and the Voellmy analysis produced better debris distributions.
Figure 2. DAN3D back-analysis using Voellmy rheologywith f = 0.1 and ξ = 500 m/s².
3.6 Hummingbird Creek, British Columbia in 1997 The Hummingbird Creek debris flow near Mara Lake in south-central British Columbia started as a debris slide with an initial volume of 25,000 m3 and entrained debris from a steep, confined creek channel for a total volume of approximately 92,000 m3. As in many debris flows, the event exhibited longitudinal sorting (Iverson 1997). The flow deposited on a colluvial fan and directly impacted five residential structures and resulted in the flooding of Highway 97A. The complications of longitudinal variation in rheologies were avoided by using similar rheological properties to those used in the channelized coal waste slope failures, starting with the frictional rheology with φb = 20° and transitioning to the Voellmy rheology with f = 0.08 and ξ = 200 m/s² as saturated sediments were entrained (at an average yield rate of approximately 28 m3/m, based on field observations). The DAN-W analysis was satisfactory in terms of total runout distance and velocity, but less accurate in terms of deposit distribution on the fan. The model accurately calculated the starting point of deposition, but overestimated the end of the runout zone by 100 m with a bimodal depth distribution instead of the tapering profile that was observed in the field (Jakob et al. 2000). 3.7 Eagle Pass, British Columbia in 1999 A wedge-shaped block of approximately 75,000 m3 of metamorphic rock detached from upper valley slopes in Eagle Pass at Clanwilliam Lake near Revelstoke, B.C.. After fragmenting, partly depositing on a bench and then entraining glacial and colluvial material from a steep open slope, the maximum volume in motion was approximately 940,000 m3. The debris came to rest on the lake ice (Hungr and Evans 2004). The initial rockslide was modeled in DAN-W as a frictional event, transitioning to the Voellmy rheology as the slide
Dynamic analyses of Canadian landslides
entrained saturated sandy colluvium and till. Good results were produced by selecting parameters within the range established for coal mine waste flows, using the frictional rheology with φb = 30° in the proximal path and the Voellmy rheology with f = 0.05 and ξ = 400 m/s² following entrainment (Hungr et al. 2002, Hungr and Evans 2004). The deposit distribution between the upper part on the bench and the lower part in the lake were reproduced by the model. 3.8 Nomash River Slide, British Columbia in 1999 A landslide started during the spring snow melt on the upper slope of a glacial valley near Zeballos, on the western coast of Vancouver Island. The initial rock slide involved 300,000 m3 of marble and basaltic sills. The resulting rock avalanche then entrained an additional 360,000 m3 of saturated clay, silt, sand, and gravel from the colluvial deposits on the lower slopes (Hungr and Evans 2004) The DAN-W analysis of this event was similar to the Eagle Pass case, with identical rheological parameters. The transition from frictional to Voellmy rheologies was specified where the entrainment of saturated soils initiated. Again, the calculated debris distribution was matched observations (Hungr and Evans 2004). Corresponding analysis in DAN3D yielded good results, although the calculated flow spread slightly faster than the real event, likely because of the inherent assumption that the rock mass fluidizes instantaneously at failure (McDougall 2006) 3.9 Zymoetz River, British Columbia in 2002 The Zymoetz River rock avalanche began as a 720,000 m3 slide in volcanic bedrock above a small, steep tributary of the Skeena River in north-western B.C. The slide entrained snow and saturated glacial till and organics to a total volume of 1.4 x 10⁶ m3. The debris flow traveled down the tributary and broke the Pacific Northern Gas pipeline near Terrance, B.C. (Boultbee et al. 2006). The first surge over snow was modeled in DAN3D with the frictional rheology with φb = 18°. The main detachment was also simulated using the frictional rheology, with φb = 31°, but transitioned to the Voellmy rheology when sufficient saturated material was entrained. Values of f = 0.1 and ξ = 1,000 m/s² in the distal path produced the most satisfactory results in terms of estimated flow velocities and deposit distribution. There is correspondence between observed specific materials that could influence landslide mobility and changes in the calculated flow (McDougall et al. 2006, McDougall 2006). 3.10 Pink Mountain, British Columbia in 2002
The Pink Mountain landslide in the Rocky Mountain foothills of the upper Peace River Valley, north-eastern B.C. initiated with 740,000 m3 of sandstone and shale failing on a relatively gentle open slope. The rock slide grew to 1.04 x 10⁶ m3 by entrainment of clay-rich saturated colluvium from the slope. It buried a forestry road and crossed a creek while covering a vertical distance of 400 m before stopping (Geertsema et al. 2005). The frictional and Voellmy rheological models predict overly-concentrated deposits at the distal end of the deposit area. Using the frictional model with φb = 20° at the head and the Bingham model with yield strength τyeild = 2 kPa and viscosity of μBingham = 5 kPa s below 400 m from the head crown, DAN-W accurately predicted the uniform thickness of the deposited debris sheet, including a thick pocket of blocky debris left behind on the source scar. The calculated velocity distribution – high initial velocity followed by a long period of slow motion – corresponds to an eyewitness account (Geertsema et al. 2005). This is the only case of a large landslide back-analysed so far by our group where the optimal fit requires the Bingham plastic rheology. The reason for this is likely related to the relatively high percentage of clay in the material compared to the other case studies. 3.11 McAuley Creek, British Columbia in 2002 The McAuley Creek landslide 30 km east of Vernon in the southern Interior Plateau was part of the same temporal cluster of events as the Zymoetz River landslide. This event initiated as a slide in gneissic rock that had previously been identified as a potential landslide source area. Most of the debris was deposited at the toe of the source slope, damming McAuley Creek, while 1 x 10⁶ m3 of the debris continued down the valley in a 1.6 km long, thin distal deposit. The total slide volume is estimated at 7.4 x 10⁶ m3, primarily from the source with minimal entrainment. The landslide was modeled in DAN3D using input parameters calibrated through back-analysis of several similar cases (Hungr and Evans 1996). The model used the frictional rheology with φb = 30° for the first part of the flow and, at the point the more mobile lobe extended from the main deposit, transitioned to the Voellmy rheology with f = 0.1 and ξ = 500 m/s². The calculated deposit distribution closely matched observations. There are no velocity estimates for this event, but the calculated velocities fall within the reasonable range for events of this magnitude (McDougall 2006). 4. DISCUSSION
M. McKinnon et al.
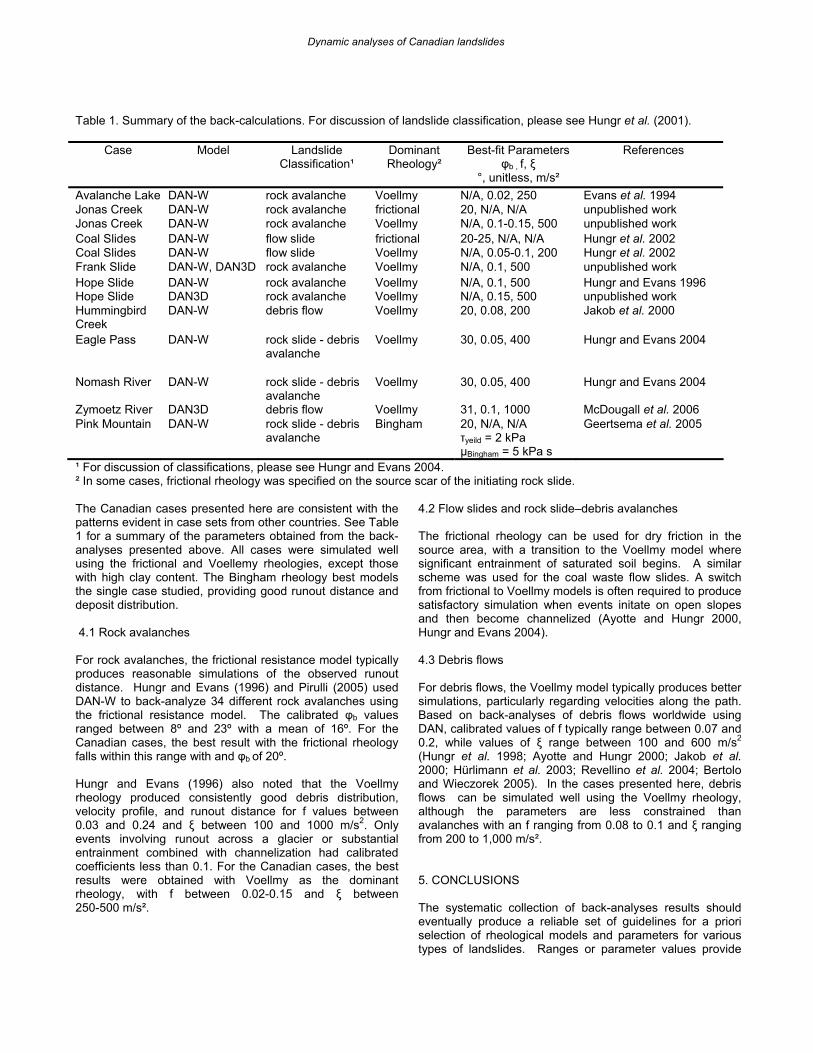
The Canadian cases presented here are consistent with the patterns evident in case sets from other countries. See Table 1 for a summary of the parameters obtained from the back-analyses presented above. All cases were simulated well using the frictional and Voellemy rheologies, except those with high clay content. The Bingham rheology best models the single case studied, providing good runout distance and deposit distribution. 4.1 Rock avalanches For rock avalanches, the frictional resistance model typically produces reasonable simulations of the observed runout distance. Hungr and Evans (1996) and Pirulli (2005) used DAN-W to back-analyze 34 different rock avalanches using the frictional resistance model. The calibrated φb values ranged between 8º and 23º with a mean of 16º. For the Canadian cases, the best result with the frictional rheology falls within this range with and φb of 20º. Hungr and Evans (1996) also noted that the Voellmy rheology produced consistently good debris distribution, velocity profile, and runout distance for f values between 0.03 and 0.24 and ξ between 100 and 1000 m/s2. Only events involving runout across a glacier or substantial entrainment combined with channelization had calibrated coefficients less than 0.1. For the Canadian cases, the best results were obtained with Voellmy as the dominant rheology, with f between 0.02-0.15 and ξ between 250-500 m/s².
4.2 Flow slides and rock slide–debris avalanches
Table 1. Summary of the back-calculations. For discussion of landslide classification, please see Hungr et al. (2001).
Case Model Landslide Classification¹
Dominant Rheology²
Best-fit Parameters φb , f, ξ
°, unitless, m/s²
References
Avalanche Lake DAN-W rock avalanche Voellmy N/A, 0.02, 250 Evans et al. 1994 Jonas Creek DAN-W rock avalanche frictional 20, N/A, N/A unpublished work Jonas Creek DAN-W rock avalanche Voellmy N/A, 0.1-0.15, 500 unpublished work Coal Slides DAN-W flow slide frictional 20-25, N/A, N/A Hungr et al. 2002 Coal Slides DAN-W flow slide Voellmy N/A, 0.05-0.1, 200 Hungr et al. 2002 Frank Slide DAN-W, DAN3D rock avalanche Voellmy N/A, 0.1, 500 unpublished work Hope Slide DAN-W rock avalanche Voellmy N/A, 0.1, 500 Hungr and Evans 1996 Hope Slide DAN3D rock avalanche Voellmy N/A, 0.15, 500 unpublished work Hummingbird Creek
DAN-W debris flow Voellmy 20, 0.08, 200 Jakob et al. 2000
Eagle Pass DAN-W rock slide - debris avalanche
Voellmy 30, 0.05, 400 Hungr and Evans 2004
Nomash River DAN-W rock slide - debris avalanche
Voellmy 30, 0.05, 400 Hungr and Evans 2004
Zymoetz River DAN3D debris flow Voellmy 31, 0.1, 1000 McDougall et al. 2006 Pink Mountain DAN-W rock slide - debris
avalanche Bingham 20, N/A, N/A
τyeild = 2 kPa μBingham = 5 kPa s
Geertsema et al. 2005
¹ For discussion of classifications, please see Hungr and Evans 2004. ² In some cases, frictional rheology was specified on the source scar of the initiating rock slide.
The frictional rheology can be used for dry friction in the source area, with a transition to the Voellmy model where significant entrainment of saturated soil begins. A similar scheme was used for the coal waste flow slides. A switch from frictional to Voellmy models is often required to produce satisfactory simulation when events initate on open slopes and then become channelized (Ayotte and Hungr 2000, Hungr and Evans 2004). 4.3 Debris flows For debris flows, the Voellmy model typically produces better simulations, particularly regarding velocities along the path. Based on back-analyses of debris flows worldwide using DAN, calibrated values of f typically range between 0.07 and 0.2, while values of ξ range between 100 and 600 m/s2 (Hungr et al. 1998; Ayotte and Hungr 2000; Jakob et al. 2000; Hürlimann et al. 2003; Revellino et al. 2004; Bertolo and Wieczorek 2005). In the cases presented here, debris flows can be simulated well using the Voellmy rheology, although the parameters are less constrained than avalanches with an f ranging from 0.08 to 0.1 and ξ ranging from 200 to 1,000 m/s². 5. CONCLUSIONS The systematic collection of back-analyses results should eventually produce a reliable set of guidelines for a priori selection of rheological models and parameters for various types of landslides. Ranges or parameter values provide
Dynamic analyses of Canadian landslides
adequate constraint for forward-prediction modeling in most practical cases. As a result, forward-predictions should be performed as sensitivity analyses over a range of possible parameter values, in order to identify regions of probable landslide runout for use in risk assessment and management. This brief review of back-analyses allows us to present some generalizations regarding the selection of rheologies and parameters required for a variety of landslide types. This work is presently continuing. Development of the existing model will improve quantitative landslide hazard analysis, an essential contribution to landslide risk management. 6. ACKNOWLEDGMENTS The authors gratefully acknowledge both reviewers, D. Chan and M. Jakob for their constructive remarks. We also thank M. Chudek and C. Coakley for their extensive review of early drafts, and P. Barralon and N. Beauchamp for their translation assistance. 7. REFERENCES Ayotte, D. and Hungr, O. 2000. “Calibration of a runout
prediction model for debris-flows and avalanches.” in G.F. Wieczorek and N.D. Naeser (eds.), Proceedings of the 2nd International Conference on Debris-Flow Hazards Mitigation, Taipei, pp. 505-514.
Bertolo, P. and Wieczorek, G.F. 2005. “Calibration of
numerical models for small debris flows in Yosemite Valley, California.” Natural Hazards and Earth System Sciences Vol. 5, pp. 992-1001.
Boultbee, N., Stead, D., Schwab, J., Geertsema, M. 2006.
“The Zymoetz River rock avalanche, June 2002, British Columbia, Canada.” Engineering Geology Vol. 83, pp. 76-99.
Bruce, I. 1978. “The field estimation of shear strength on
rock discontinuities”. Ph.D. Thesis, University of Alberta. Cruden, B. 1977. “The Dynamics of the Hope Slide”. Bulletin
of the International Association of Engineering Geology Vol. 16, pp. 94-98.
Evans, S. G. 1989. “Rock avalanche run-up record”. Nature
(London) Vol. 340, pp. 271. Evans, S.G., Hungr, O., and Enegren, E.G. 1994. “The
Avalanche Lake rock avalanche, Mackenzie Mountains, Northwest Territories, Canada: description, dating, and dynamics”. Canadian Geotechnical Journal Vol. 31 No. 5, pp. 749-768.
Geertsema, M., Hungr, O., Schwab, J.W., Evans, S.G. 2005.
“A large rockslide-debris avalanche in cohesive soil at Pink Mountain, northeastern British Columbia”. Engineering Geology Vol. 83, pp. 64-75.
Hungr, O. 1995. “A model for the runout analysis of rapid
flow slides, debris flows, and avalanches.” Canadian Geotechnical Journal Vol. 32, pp. 610-523.
Hungr, O., Dawson, R., Kent, A., Campbell, D., and
Morgenstern, N.R. 2002. “Rapid flow slides of coal-mine waste in British Columbia, Canada”. GSA Reviews in Engineering Geology Vol. 15.
Hungr, O. and Evans, S.G. 2004. “Entrainment of debris in
rock avalanches: An analysis of a long run-out mechanism”. GSA Bulletin Vol. 116.
Hungr, O., Evans, S.G., Bovis, M., and Hutchinson, J.N.
2001. “Review of the classification of landslides of the flow type”. Environmental and Engineering Geoscience Vol. VII, pp. 221-238.
Hungr, O., Sun, H.W., and Ho, K.K.S. 1998. “Mobility of
Selected landslides in Hong Kong – Pilot back-analysis using a numerical model”. Report of the Geotechnical Engineering Office. Hong Kong SAR Government.
Hürlimann, M., Corominas, J., Moya, J. and Copons, R.
2003. “Debris-flow events in the eastern Pyrenees: preliminary study on initation and propogation”. in D. Rickenmann and C.L. Chen (eds.) Proceedings of the 3rd International Conference on Debris-flow Hazards Mitigation: Mechanics, Prediction, and Assessment, Davos. pp 115-126.
Iverson, R.M. 1997. “The physics of debris flows”. Reviews
in Geophysics Vol. 35, pp. 245-296. Jakob, M., Anderson, D., Fuller, T., Hungr, O., and Ayotte,
D. 2000. “An unusually large debris flow at Hummingbird Creek, Mara Lake, British Columbia”. Canadian Geotechnical Journal Vol. 37, pp. 1109-1125.
Mathews, W.H., and McTaggard, K.C. 1978. “Hope
Rockslides, British Columbia, Canada”. in B. Voight (ed.). Rockslides and Avalanches Vol. 1. Natural Phenomena. New York: Elsevier Scientific Publishing Company, pp. 259-275.
McDougall, S. 2006. “A new continuum dynamic model for
the analysis of extremely rapid landslide motion across complex 3d terrain”. Ph.D. Thesis, University of British Columbia.
McDougall, S., Boultbee, N., Hungr, O., Stead, D., Schwab,
J. 2006. “The Zymoetz River landslide, British Columbia, Canada; description and dynamic analysis of a rock slide-debris flow”. Landslides Vol. 3, pp. 195.
McDougall, S. and Hungr, O. 2004. “A model for the analysis
of rapid landslide runout motion across three-dimensional terrain”. Canadian Geotechnical Journal Vol. 41, pp. 1084-1097.
M. McKinnon et al.
McDougall, S. and Hungr, O. 2005. “Modeling of landslides which entrain material from the path”. Canadian Geotechnical Journal Vol. 42, pp.1437-1448.
Pirulli, M. 2005. “Numerical modeling of landslide runout: A
continuum mechanics approach”. Ph.D. Thesis. Politechnico di Torino, Italy.
Revellino, P., Hungr, O., Guadagno, F.M., and Evans, S.G.
2004. “Velocity and runout simulation of destructive debris flows and debris avalanches in pyroclastic deposits, Campania region, Italy”. Environmental Geology Vol. 45, pp 295-311.
Dynamic analyses of Canadian landslides

M. McKinnon et al.