Embed Size (px)
Citation preview
33
Dynamic Approach of Capital Structure of European Shipping Companies
Stavros H. Arvanitis1, Irakleia S. Tzigkounaki2, Theodoros V. Stamatopoulos3 and Eleftherios I. Thalassinos4
Abstract
The issue of capital structure of companies is one of the most debated problems of financial management. According to economic theory, capital structure determines the stock market value of firms and therefore their viability, while one of the most negative result of the crash of 2008 and the persisting crisis (excess supply in markets of labor and money) is their ongoing steep decline of lending by credit institutions and other sources. In this paper, considering the importance of the issue and motivated by the conflicting results of previous empirical studies, we attempt the analysis of capital structure of the European Maritime Enterprises (oceanic shipping). We focus on shipping companies, because of the large volume of funding that demands their main operation, due to the intensity of the assets held. The objectives of this research are firstly the identification of factors that affect the capital structure of European oceanic shipping and secondly to search for the existence of an ideal - target capital structure ratio. The determinants of capital structure are examined through static (fixed effect method and FGLS) and dynamic (GMM Methods) econometric models, using data from the financial statements of 32 listed European shipping companies for the period 2005-2010. The results suggest the prevalence of pecking order theory in our case, while a positive relationship arises between tangible assets and tax benefits (arising from sources other than borrowing) against leverage. Moreover, we observe a negative relationship between size or profitability and debt. Our findings contribute to a deeper understanding of the decisions taken by European shipping on their capital structure. Keywords: Capital Structure, Trade-off Theory, Pecking Order Theory, Dynamic Panel Data, Shipping companies
JEL Classification: G32, C23, L91
1 T.E.I. of Crete, S.M.E., Dept. of Accounting, MSc Accounting and Auditing. Estavromenos, 71500 Heraklion, Crete, tel. +30 2810-379674, [email protected] 2 Corresponding Author. T.E.I. of Crete, S.M.E., Dept. of Accounting, MSc Accounting and Auditing. Estavromenos, 71500 Heraklion, Crete. Plateia Analipseos square 3, 71306 Heraklion, Crete, Hellas, tel. +30 2810-283502, [email protected] 3 T.E.I. of Crete, S.M.E., Dept. of Accounting, MSc Accounting and Auditing. Estavromenos, 71500 Heraklion, Crete, tel. +30-2810-379601, and University of Piraeus, Hellas (Greece), and D.E.F.I., Mediterranean University-Aix-Marseille II, France, [email protected] University of Piraeus, Dept. of Maritime Studies, and T.E.I. of Crete, S.M.E., Dept. of Accounting, MSc Accounting and Auditing. 21 str. Gr. Lambraki, 18534 Piraeus, Hellas, tel. +30-210-4142543, [email protected]
International Journal of Economic Sciences and Applied Research 5 (3): 33-63
34
Stavros H. Arvanitis, Irakleia S. Tzigkounaki, Theodoros V. Stamatopoulos and Eleftherios I. Thalassinos
1. Introduction
The issue of capital structure of companies consist the core of modern financial management and one of the most important decisions to be taken by the administration of companies. In recent years, theories of capital structure have received attention from many researchers and economists. From the theorem of Modigliani and Miller (1958) until today, there have been various theories on maximizing the value of a stock company through the structural funds. The original theorem of Modigliani and Miller (1958), becomes even more complicated with the introduction of taxes of legal persons (Modigliani and Miller, 1963), taxation of individuals (Miller, 1997), the cost of bankruptcy (Stiglitz, 1969; Titman, 1984), agency theory (Jensen and Meckling, 1976; Myers, 1977) and the issue of information asymmetry (Myers, 1984). Considering these factors and based on the basic theories of trade off and pecking order theory, the researchers have different approaches to the subject, highlighting the main theories. The first basic theory, the trade off theory, states that, every company oscillates between the advantages and disadvantages of borrowing, targeting a level of leverage capable to maximize benefits and minimize its disadvantages. In contrast, according to the pecking order theory, the company follows a series of sourcing capital. Following any of the above theories, entities try to increase their wealth, based on liabilities rather than assets, ignoring their real estate. The issue becomes even more crucial for shipping companies, where the largest part of their assets are tangibles (Apergis and Sorros, 2009) and it is very important the way of financing them. Furthermore, in recent years due to global economic crisis, or better global crash of 2008, financial institutions, make borrowing difficult for any company including shipping ones, forcing them to turn to other ways of borrowing, making harder the current situation. The aim of the paper is to study the capital structure of European shipping companies, through panel data, taking advantage of the opportunity of the analysis in time and the entities, by using static (fixed effect method and GLS) and dynamic (GMM method and GMM system) econometric models. This approach aims at finding the formula used by shipping companies, for their capital structure. Essentially, by focusing our attention in a sample of 32 European shipping companies, traded for the period 2005 to 2010, inquiring if the main financial theories, can explain the financing decisions of the funds of shipping companies. Through panel dataset, will be attempted to determine the factors that affect the capital structure, while the dynamic approach used, aims at finding the ideal target in shipping capital structure and their speed of adjustment. The use of static econometric models will be an indispensable asset for the subsequent comparison of results obtained from the use of dynamic models. The remainder of the paper is organized as follows: Section 2 presents the research questions based upon the key prior literature and provides some basic information about European Maritime companies. Section 3 displays the methodology and the data while the empirical results and the discussion of them, are reported in section 4. Section 5 summarizes the conclusion of the study, the limitations and presents suggestions for further research.

35
Dynamic Approach of Capital Structure of European Shipping Companies
2. Previous Research and Research Questions
2.1 Empirical studies using static econometric models
To date, most empirical studies have focused on determinants of the firms' capital structure in specific countries (for instant, Rajan and Zingales, 1995; Booth et al., 2001; Ozkan, 2001; Deesomsak et al., 2004; Bevan and Danbolt, 2004; Eriotis et al., 2007; Deari and Deari, 2009; Omran and Pointon, 2009; Psilaki and Daskalakis, 2009; Khalid, 2011; Chakraborty, 2010; Noulas and Genimakis, 2011). Their results, most often are conflicting, suggesting the absence of a specific formula for shaping the capital structure of enterprises and the specific characteristics of economic and social environment in which they undertake, (Rajan and Zingales, 1995; Omran and Pointon, 2009; Degryse et al., 2010; Noulas and Genimakis, 2011). On the other hand, several empirical studies examine the application of the trade off theory and pecking order theory, resulting in this case to conflicting conclusions, mainly because of the different approach of the two theories, (Shyam-Sunder et al., 1999; Fama and French, 2002; Frank and Goyal, 2009; Flannery and Rangan, 2006). The first set of empirical studies, using static models1, conducted by Taggart (1977), Marsh (1982), Jalilvand and Harris (1984) and Titman ans Wessels (1988), contributing significantly to identify the factors that affect the capital structure. Titman and Wessels (1988) who studied companies operating in the U.S., identify a negative relationship between enterprise size, uniqueness, profitability and the ratio of short-term leverage. The growth, the industry and tax advantages are considered non-statistical significant variables. Unlike the transaction costs is an important determinant of capital structure. In 1995 we find one of the largest surveys conducted, concerning the capital structure of firms. The Rajan and Zingales (1995), dealt with the G7 member countries and resulted in a positive relationship between size, assets and debt, excluding Germany. In contrast, negative relationship was shown between profitability and leverage ratio for all countries - members, a result that agrees with that of Titman and Wessels (1988). In conclusion, they analyzed the important role of social and economic environment in which each company operates. The results of Rajan and Zingales (1995) are confirmed by Wald (1999), who was influenced by Rajan and Zingales (1995). Its study leads to the diversity of the capital structure of companies, because of different fiscal framework that exists in each country, agency costs and asymmetric information. Sample from different countries, outside the research of Rajan and Zingales (1995), includes the study of Deesomsak et al. (2004). The survey results, showed the positive relationship between growth, size and the leverage ratio. A negative relationship was found between the tax advantages, liquidity, and debt. Furthermore, the authors stressed the
1 The econometric methods that can be applied are either static or dynamic. Depending on this choice, it is determined then, the model to be estimated. The most common static models are the Pooled Models, Fixed-Effects Models and Random Effects Models. The most common dynamic models are the Two Stage Least Squares of Anderson and Hsiao (1982) and the Generalized Methods of Moments (GMM) of Arellano and Bond (1991).
36
Stavros H. Arvanitis, Irakleia S. Tzigkounaki, Theodoros V. Stamatopoulos and Eleftherios I. Thalassinos
importance of the legal framework, of corporate governance and industry characteristics which are surrounding businesses, (Rajan and Zingales, 1995; Wald, 1999). In the same year with Deesomsak et al. (2004), using the same methodology, Bevan and Danbolt (2004), reach the opposite conclusion for the profitability factor. In their research, they found a negative relationship between profitability and debt, while according to their conclusions, the size is positively related with the capital structure. Not statistically significant, appears the variable of growth. Preposterous, the same researchers (Bevan and Danbolt, 2002), through a static model, analyzed the capital structure of English quoted companies of England. The main feature of the investigation is the continuing comparison with the study of Rajan and Zingales (1995). The results for the variable of size are the same as those of Rajan and Zingales (1995) and contrary to the variables of the profitability and structure of assets. Continuing our review, during the last years we see recent surveys, such as Eriotis et al. (2007), who examine 129 Hellenic (Greek) companies listed in Athens Stock Exchange. The factors studied and the results obtained do not differ from previous surveys. Specifically, the leverage ratio was found to correlate positively with the size of the examined companies. Instead, liquidity and growth shows a negative correlation with the leverage of companies, which is consistent with the theories of capital structure. Psilaki and Daskalakis in 2009, dealt with 320 Italian small and medium companies, 52 Portuguese, 1,252 Hellenic and 2,006 companies active in France. The conclusions focus on the positive relationship between size and borrowing, appropriating the results of Eriotis et al. (2007), and on a negative relationship between profitability, risk and leverage by appropriating the results of Deari and Deari (2009). However, the capital structure of firms varies, due to the particular characteristics of each company and not by particular characteristics of each country or each industry. The latter contrasts with the study of Rajan and Zingales (1995), Deesomsak et al. (2004), Omran and Pointon (2009), Degryse et al. (2010), which focus on the characteristics of countries and sectors and not the characteristics of companies. Quoted Athens Hellenic companies, excluding financial institutions were the subject of research of Noulas and Genimakis (2011). According to them, the capital structure of firms varies according to sector of their function while the ownership does not affect their leverage. The pecking order theory seems to dominate the financing decisions of investment entities.
2.2 Empirical studies using dynamic models
At this point we must stress, that the above studies do not take into account the dynamism which contains the decisions on the capital structure of firms. First Fisher et al. (1989), raised the issue of dynamic management behavior on business capital. The results of their research showed that companies do not aim at an ideal leverage ratio but, this indicator can be moved in certain contexts, verifying the pecking order theory in the short term, because of the disadvantages of adaption to a perfect capital structure indicator. The dynamics of capital structure of 104 Swiss firms, examined by Gaud et al. (2005). Specifically, the size and significance of the tangible assets, is positively correlated with
37
Dynamic Approach of Capital Structure of European Shipping Companies
the debt ratio while growth and profitability are negatively related. Simultaneously, the cost that comes from not balancing advantages and disadvantages of borrowing are minimal, thus, the Swiss companies are moving slowly to achieve their goal. The authors validate the trade and pecking order theory. Preposterous, Miguel and Pindado (2001), trying to determine the characteristics of firms that affects their capital structure. Their data consist of, 133 Spanish companies. As in the study of Gaud et al. (2005), the pecking order theory prevails and firms take into account transaction costs in cases of search of funding, turning their interest to internal borrowing sources. In this way, the entities eliminate the problems of asymmetric information. The same research objective with Miguel and Pindado (2001), examined by Heshmati (2001) for 2,261 Swedish SMEs. Its findings highlighted the negative relationship between size, expected growth and leverage. Meanwhile, business decisions are an important factor influencing the capital structure. As for the speed of adjustment to an ideal ratio, it appears to be quite slow for small businesses, while it is faster for large companies. More recent studies, such as the one of Serrasqueiro and Nunes in 2009, analyze the factors influencing the capital structure. This study are examined, 237 Portuguese companies listed in Portugal. The Portuguese companies, target to an ideal capital structure ratio, verifying by this way the trade off theory. Apart from the trade off theory, there is strong evidence that companies follow the pecking order theory. In contrast, no evidence seems to approach the market timing theory. The adjustment to a perfect indicator of capital structure is not fast, if we compare the results of Serrasqueiro and Nunes (2009), with others concerning U.S., Germany, Spain and the United Kingdom. This fact is explained by transaction costs. One of the most recent studies, following the methodology of dynamic capital structure model, is that of Khalid (2011). He showed that the leverage ratio depends on the cost of adjustment, which is needed to achieve an optimal capital structure. The adjustment process of capital structure, as in the study of Serrasqueiro and Nunes (2009), appears slow here too, compared with other developing countries. Earlier, the adjustment process in ideal ratio target leverage, was empirically verified by Flannery and Rangan (2006). Specifically, they verify the conclusions of Heshmati (2001), Gaud et al. (2005), by supporting the existence of specific operational characteristics, responsible for the target ratio of capital structure. In contrast to the results of Khalid (2011) and Serrasqueiro and Nunes (2009), the adjustment to a perfect target ratio takes place fairly quickly, a finding consistent with research findings of Huang and Ritter (2009), which was implemented in companies active in the U.S., during 1963-2001. Dang (2011) is consistent with the rapid adjustment to an ideal target ratio of capital structure of companies operating in Germany, France and the United Kingdom. In his empirical study, he proved the existence of an ideal target ratio of capital structure and the acceptance of trade off theory, from the majority of the companies. Therefore, it was found that firms react strongly in a case of derogation from their target, leading to return quickly to him, but do not react as strongly, to past deviations from the target ratio. In conclusion, the studies which are focused on factors influencing the capital

38
Stavros H. Arvanitis, Irakleia S. Tzigkounaki, Theodoros V. Stamatopoulos and Eleftherios I. Thalassinos
structure of enterprises, using static or dynamic models are numerous. For this reason, the following table presents some empirical studies and the factors which are identified as responsible for the capital business structure.
Table 1: Capital Structure Determinants
Factors Authors
Tax Kim and Sorensen (1986); Titman and Wessels (1988); Fisher et al. (1989); Mackie-Mason (1990); Chanplinsky and Niehaus (1993); Wald (1999); Booth et al. (2001); Ozkan (2001); Miguel and Pindado (2001); Heshmati (2001); Huang and Song (2006); Delcoure (2007); Omran and Pointon (2009); Deari and Deari (2009); Chang et al. (2009); Serrasqueiro (2011)
Size Warner (1977); Ang (1976); Kim and Sorensen (1986); Kester (1986); Titman and Wessels (1988); Friend and Lang (1988); Fisher et al. (1989); Rajan and Zingales (1995); Michaelas et al. (1999); Booth et al. (2001); Ozkan (2001); Heshmati (2001); Voulgari et al. (2002); Fama et French (2002); Bevan and Danbolt (2002); Chen (2004); Bevan and Danbolt (2004); Keshar (2004); Hall et al. (2004); Gaud et al. (2005); Maghyereh (2005); Abor (2005); Huang and Song (2006); Eriotis et al. (2007); Delcoure (2007); Serrasqueiro and Rogao (2009); Omran and Pointon (2009); Psilaki and Daskalaki (2009); Deari and Deari (2009); Chakraborty (2010); Degryse et al. (2010); Khalid (2011); Noulas and Genimakis (2011); Serrasqueiro (2011)
Profitability Kim and Sorensen (1986); Kester (1986); Titman and Wessels (1988); Friend and Lang (1988); Rajan and Zingales (1995); Michaelas et al. (1999); Wald (1999); Booth et al. (2001); Ozkan (2001); Heshmati (2001); Voulgari et al. (2002); Bevan and Danbolt (2002); Chen (2004); Bevan and Danbolt (2004); Keshar (2004); Gaud et al. (2005); Maghyereh (2005); Delcoure (2007); Serrasqueiro and Nunes (2009); Psilaki and Daskalaki (2009); Deari and Deari (2009); Chang et al. (2009); Chakraborty (2010); Degryse et al. (2010); Khalid (2011); Noulas and Genimakis (2011); Serrasquieiro (2011)
Tangible Assets
Marsh, (1982); Rajan and Zingales (1995); Booth et al. (2001); Heshmati (2001); Voulgari et al. (2002); Gaud et al. (2005); Maghyereh (2005); Delcoure (2007); Serrasqueiro and Rogao (2009); Omran and Pointon (2009); Deari and Deari (2009); Chang et al. (2009); Sabiwlsky (2010); Degryse et al. (2010); Khalid (2011); Noulas and Genimakis (2011); Serrasqueiro (2011)
Industry Kim and Sorensen (1986); Titman and Wessels (1988); Miguel and Pindado (2001); Omran and Pointon (2009); Chang et al. (2009); Khalid (2011); Noulas and Genimakis (2011)
39
Dynamic Approach of Capital Structure of European Shipping Companies
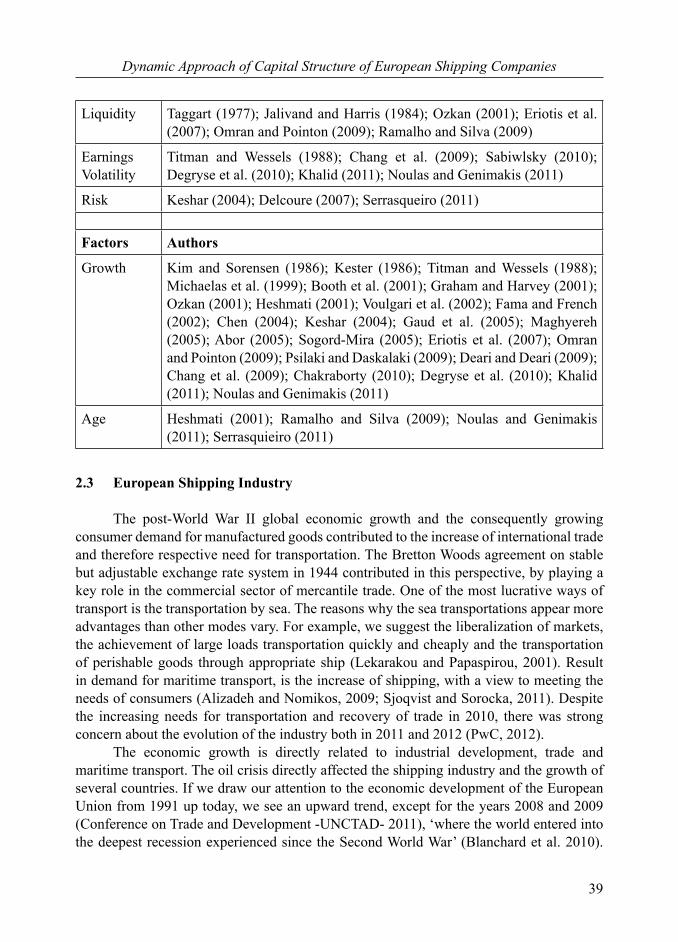
Liquidity Taggart (1977); Jalivand and Harris (1984); Ozkan (2001); Eriotis et al. (2007); Omran and Pointon (2009); Ramalho and Silva (2009)
Earnings Volatility
Titman and Wessels (1988); Chang et al. (2009); Sabiwlsky (2010); Degryse et al. (2010); Khalid (2011); Noulas and Genimakis (2011)
Risk Keshar (2004); Delcoure (2007); Serrasqueiro (2011)
Factors Authors
Growth Kim and Sorensen (1986); Kester (1986); Titman and Wessels (1988); Michaelas et al. (1999); Booth et al. (2001); Graham and Harvey (2001); Ozkan (2001); Heshmati (2001); Voulgari et al. (2002); Fama and French (2002); Chen (2004); Keshar (2004); Gaud et al. (2005); Maghyereh (2005); Abor (2005); Sogord-Mira (2005); Eriotis et al. (2007); Omran and Pointon (2009); Psilaki and Daskalaki (2009); Deari and Deari (2009); Chang et al. (2009); Chakraborty (2010); Degryse et al. (2010); Khalid (2011); Noulas and Genimakis (2011)
Age Heshmati (2001); Ramalho and Silva (2009); Noulas and Genimakis (2011); Serrasquieiro (2011)
2.3 European Shipping Industry
The post-World War II global economic growth and the consequently growing consumer demand for manufactured goods contributed to the increase of international trade and therefore respective need for transportation. The Bretton Woods agreement on stable but adjustable exchange rate system in 1944 contributed in this perspective, by playing a key role in the commercial sector of mercantile trade. One of the most lucrative ways of transport is the transportation by sea. The reasons why the sea transportations appear more advantages than other modes vary. For example, we suggest the liberalization of markets, the achievement of large loads transportation quickly and cheaply and the transportation of perishable goods through appropriate ship (Lekarakou and Papaspirou, 2001). Result in demand for maritime transport, is the increase of shipping, with a view to meeting the needs of consumers (Alizadeh and Nomikos, 2009; Sjoqvist and Sorocka, 2011). Despite the increasing needs for transportation and recovery of trade in 2010, there was strong concern about the evolution of the industry both in 2011 and 2012 (PwC, 2012). The economic growth is directly related to industrial development, trade and maritime transport. The oil crisis directly affected the shipping industry and the growth of several countries. If we draw our attention to the economic development of the European Union from 1991 up today, we see an upward trend, except for the years 2008 and 2009 (Conference on Trade and Development -UNCTAD- 2011), ‘where the world entered into the deepest recession experienced since the Second World War’ (Blanchard et al. 2010).
40
Stavros H. Arvanitis, Irakleia S. Tzigkounaki, Theodoros V. Stamatopoulos and Eleftherios I. Thalassinos
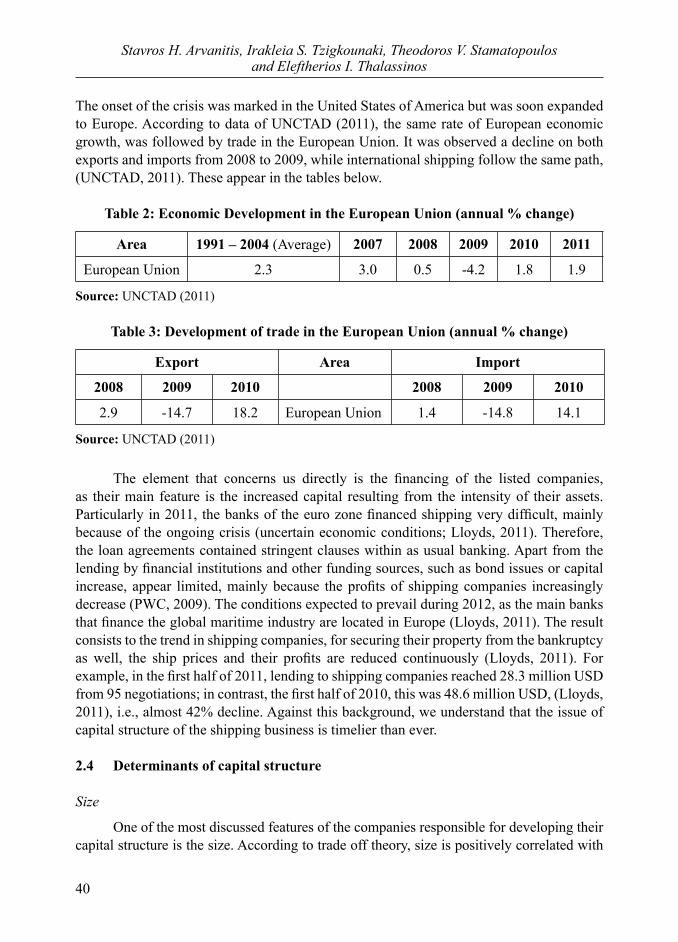
The onset of the crisis was marked in the United States of America but was soon expanded to Europe. According to data of UNCTAD (2011), the same rate of European economic growth, was followed by trade in the European Union. It was observed a decline on both exports and imports from 2008 to 2009, while international shipping follow the same path, (UNCTAD, 2011). These appear in the tables below.
Table 2: Economic Development in the European Union (annual % change)
Area 1991 – 2004 (Average) 2007 2008 2009 2010 2011
European Union 2.3 3.0 0.5 -4.2 1.8 1.9
Source: UNCTAD (2011)
Table 3: Development of trade in the European Union (annual % change)
Export Area Import
2008 2009 2010 2008 2009 2010
2.9 -14.7 18.2 European Union 1.4 -14.8 14.1
Source: UNCTAD (2011)
The element that concerns us directly is the financing of the listed companies, as their main feature is the increased capital resulting from the intensity of their assets. Particularly in 2011, the banks of the euro zone financed shipping very difficult, mainly because of the ongoing crisis (uncertain economic conditions; Lloyds, 2011). Therefore, the loan agreements contained stringent clauses within as usual banking. Apart from the lending by financial institutions and other funding sources, such as bond issues or capital increase, appear limited, mainly because the profits of shipping companies increasingly decrease (PWC, 2009). The conditions expected to prevail during 2012, as the main banks that finance the global maritime industry are located in Europe (Lloyds, 2011). The result consists to the trend in shipping companies, for securing their property from the bankruptcy as well, the ship prices and their profits are reduced continuously (Lloyds, 2011). For example, in the first half of 2011, lending to shipping companies reached 28.3 million USD from 95 negotiations; in contrast, the first half of 2010, this was 48.6 million USD, (Lloyds, 2011), i.e., almost 42% decline. Against this background, we understand that the issue of capital structure of the shipping business is timelier than ever. 2.4 Determinants of capital structure
Size
One of the most discussed features of the companies responsible for developing their capital structure is the size. According to trade off theory, size is positively correlated with

41
Dynamic Approach of Capital Structure of European Shipping Companies
the leverage because larger companies have less chance of bankruptcy, less variation in their profi ts or losses and appear stronger in situations of fi nancial hardship, due to their spreading of investments. Several empirical studies have shown the positive relationship between size and debt (e.g., Warner, 1977; Ang, 1976; Friend and Lang, 1988; Rajan and Zingales, 1995; Michaelas et al., 1999; Ozkan, 2001; Booth et al., 2001; Fama and French, 2002; Bevan and Danbolt, 2002; Hall et al., 2004; Gaud et al., 2005; Maghyeren, 2005; Huang and Song, 2006; Eriotis et al., 2007; Deari and Deari, 2009; Omran and Pointon, 2009; Psilaki and Daskalakis, 2009). On the other hand, large fi rms have lower information asymmetry problems, leading to elect to issue shares as optimal borrowing and not resorting to bonds. This relationship applauds many studies (for instance, Kester, 1986; Kim and Sorensen, 1986; Titman and Wessels, 1988; Heshmati, 2001; Bevan and Danbolt, 2004; Chen et al., 2004; Khalid, 2011). Based on trade off theory and defi ning the variable of size as the natural logarithm of sales as they did many authors like, Titman and Wessels, 1988; Rajan and Zingales, 1995; Ozkan, 2001; Heshmati, 2001; Bevan and Danbolt, 2002; Bauer, 2004; Keshar, 2004; Abor, 2005; Gaud et al., 2005; Eriotis et al., 2007; Deari and Deari, 2009; Psilaki and Daskalakis, 2009; Ahmed et al., 2009; Ramalho and Silva, 2009; Serrasqueiro and Rogao, 2009; Chakraborty, 2010; Noulas and Genimakis, 2011, we assume that:
H1: The firm's size is positively correlated with debt
Assets structure
The structure of assets is the second factor that should concern us. Tangible assets, according to the trade off and pecking order theory, are positively related to borrowing and are offered as collateral to take loan, reducing the cost of representation, the cost of asymmetric information, the risk of bankruptcy and credit risk. The positive relationship between debt and tangible assets has been identified by several researchers (for instance see, Titman and Wessels, 1988; Rajan and Zingales, 1995; Booth et al., 2001; Chen, 2004; Gaud et al., 2005; Maghyeren, 2005; Noulas and Genimakis, 2011; Khalid, 2011). In conclusion, following the studies of, Titman et Wessels (1988), Gaud et al. (2005), Delcoure (2007), Chang et al. (2009) and Ramalho and Silva (2009), we define the asset structure as the ratio between tangible assets plus inventories to total assets and based on trade off and pecking order theories we formulate the following hypothesis:
H2: Tangible assets are positively related to borrowing.
Profitability
According to pecking order theory, firms due to the problems of asymmetric information, they prefer to finance their activities first from retained earnings, then by issuing loans, and finally by the issue of capital (Myers, 1984; Myers and Majluf, 1984). Therefore, profitable business, take care to make loans to their investment decisions from retained earnings, confirming the negative relationship between profitability and leverage ratio. This relationship have been confirmed several times by empirical studies (Kester, 1986; Friend and Lang, 1988; Titman and Wessels, 1988; Rajan and Zingales, 1995;
42
Stavros H. Arvanitis, Irakleia S. Tzigkounaki, Theodoros V. Stamatopoulos and Eleftherios I. Thalassinos
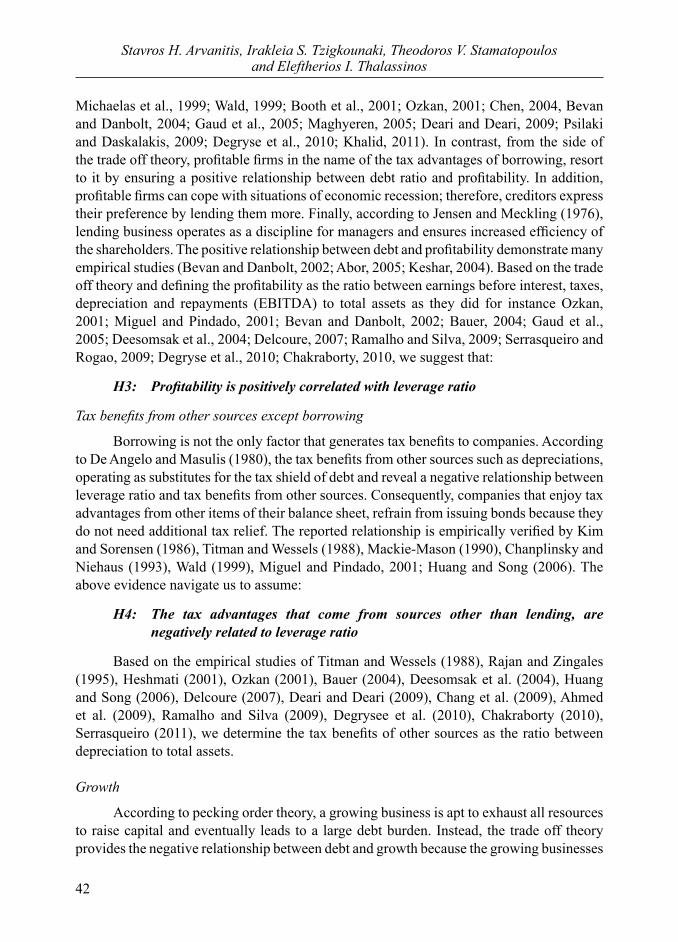
Michaelas et al., 1999; Wald, 1999; Booth et al., 2001; Ozkan, 2001; Chen, 2004, Bevan and Danbolt, 2004; Gaud et al., 2005; Maghyeren, 2005; Deari and Deari, 2009; Psilaki and Daskalakis, 2009; Degryse et al., 2010; Khalid, 2011). In contrast, from the side of the trade off theory, profitable firms in the name of the tax advantages of borrowing, resort to it by ensuring a positive relationship between debt ratio and profitability. In addition, profitable firms can cope with situations of economic recession; therefore, creditors express their preference by lending them more. Finally, according to Jensen and Meckling (1976), lending business operates as a discipline for managers and ensures increased efficiency of the shareholders. The positive relationship between debt and profitability demonstrate many empirical studies (Bevan and Danbolt, 2002; Abor, 2005; Keshar, 2004). Based on the trade off theory and defining the profitability as the ratio between earnings before interest, taxes, depreciation and repayments (EBITDA) to total assets as they did for instance Ozkan, 2001; Miguel and Pindado, 2001; Bevan and Danbolt, 2002; Bauer, 2004; Gaud et al., 2005; Deesomsak et al., 2004; Delcoure, 2007; Ramalho and Silva, 2009; Serrasqueiro and Rogao, 2009; Degryse et al., 2010; Chakraborty, 2010, we suggest that:
H3: Profitability is positively correlated with leverage ratio
Tax benefits from other sources except borrowing
Borrowing is not the only factor that generates tax benefits to companies. According to De Angelo and Masulis (1980), the tax benefits from other sources such as depreciations, operating as substitutes for the tax shield of debt and reveal a negative relationship between leverage ratio and tax benefits from other sources. Consequently, companies that enjoy tax advantages from other items of their balance sheet, refrain from issuing bonds because they do not need additional tax relief. The reported relationship is empirically verified by Kim and Sorensen (1986), Titman and Wessels (1988), Mackie-Mason (1990), Chanplinsky and Niehaus (1993), Wald (1999), Miguel and Pindado, 2001; Huang and Song (2006). The above evidence navigate us to assume:
Η4: The tax advantages that come from sources other than lending, are negatively related to leverage ratio
Based on the empirical studies of Titman and Wessels (1988), Rajan and Zingales (1995), Heshmati (2001), Ozkan (2001), Bauer (2004), Deesomsak et al. (2004), Huang and Song (2006), Delcoure (2007), Deari and Deari (2009), Chang et al. (2009), Ahmed et al. (2009), Ramalho and Silva (2009), Degrysee et al. (2010), Chakraborty (2010), Serrasqueiro (2011), we determine the tax benefits of other sources as the ratio between depreciation to total assets. Growth
According to pecking order theory, a growing business is apt to exhaust all resources to raise capital and eventually leads to a large debt burden. Instead, the trade off theory provides the negative relationship between debt and growth because the growing businesses
43
Dynamic Approach of Capital Structure of European Shipping Companies
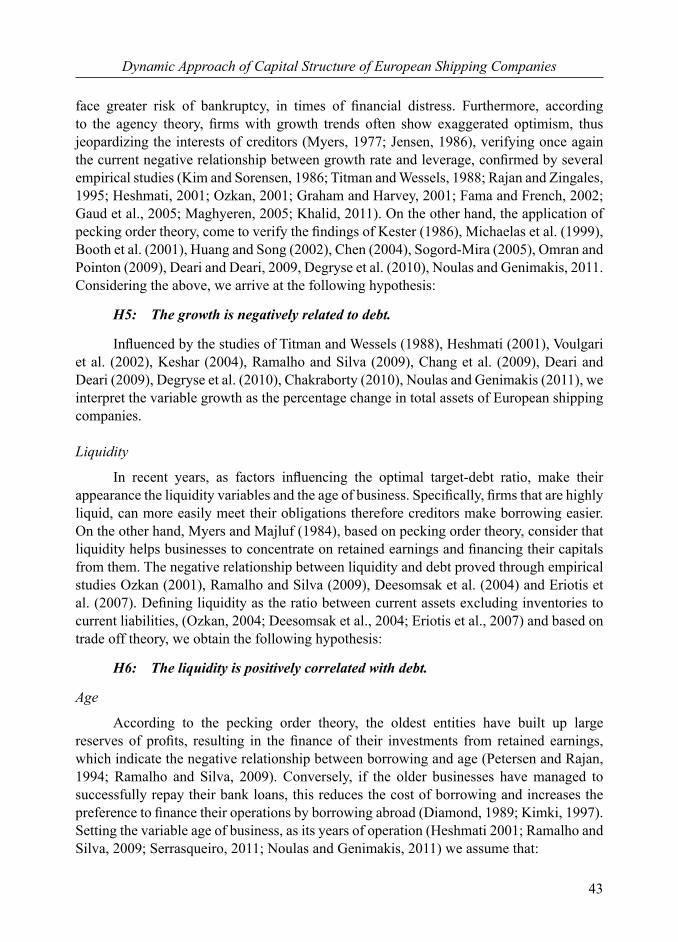
face greater risk of bankruptcy, in times of financial distress. Furthermore, according to the agency theory, firms with growth trends often show exaggerated optimism, thus jeopardizing the interests of creditors (Myers, 1977; Jensen, 1986), verifying once again the current negative relationship between growth rate and leverage, confirmed by several empirical studies (Kim and Sorensen, 1986; Titman and Wessels, 1988; Rajan and Zingales, 1995; Heshmati, 2001; Ozkan, 2001; Graham and Harvey, 2001; Fama and French, 2002; Gaud et al., 2005; Maghyeren, 2005; Khalid, 2011). On the other hand, the application of pecking order theory, come to verify the findings of Kester (1986), Michaelas et al. (1999), Booth et al. (2001), Huang and Song (2002), Chen (2004), Sogord-Mira (2005), Omran and Pointon (2009), Deari and Deari, 2009, Degryse et al. (2010), Noulas and Genimakis, 2011. Considering the above, we arrive at the following hypothesis:
H5: The growth is negatively related to debt.
Influenced by the studies of Titman and Wessels (1988), Heshmati (2001), Voulgari et al. (2002), Keshar (2004), Ramalho and Silva (2009), Chang et al. (2009), Deari and Deari (2009), Degryse et al. (2010), Chakraborty (2010), Noulas and Genimakis (2011), we interpret the variable growth as the percentage change in total assets of European shipping companies.
Liquidity
In recent years, as factors influencing the optimal target-debt ratio, make their appearance the liquidity variables and the age of business. Specifically, firms that are highly liquid, can more easily meet their obligations therefore creditors make borrowing easier. On the other hand, Myers and Majluf (1984), based on pecking order theory, consider that liquidity helps businesses to concentrate on retained earnings and financing their capitals from them. The negative relationship between liquidity and debt proved through empirical studies Ozkan (2001), Ramalho and Silva (2009), Deesomsak et al. (2004) and Eriotis et al. (2007). Defining liquidity as the ratio between current assets excluding inventories to current liabilities, (Ozkan, 2004; Deesomsak et al., 2004; Eriotis et al., 2007) and based on trade off theory, we obtain the following hypothesis:
H6: The liquidity is positively correlated with debt.
Age
According to the pecking order theory, the oldest entities have built up large reserves of profits, resulting in the finance of their investments from retained earnings, which indicate the negative relationship between borrowing and age (Petersen and Rajan, 1994; Ramalho and Silva, 2009). Conversely, if the older businesses have managed to successfully repay their bank loans, this reduces the cost of borrowing and increases the preference to finance their operations by borrowing abroad (Diamond, 1989; Kimki, 1997). Setting the variable age of business, as its years of operation (Heshmati 2001; Ramalho and Silva, 2009; Serrasqueiro, 2011; Noulas and Genimakis, 2011) we assume that:
44
Stavros H. Arvanitis, Irakleia S. Tzigkounaki, Theodoros V. Stamatopoulos and Eleftherios I. Thalassinos
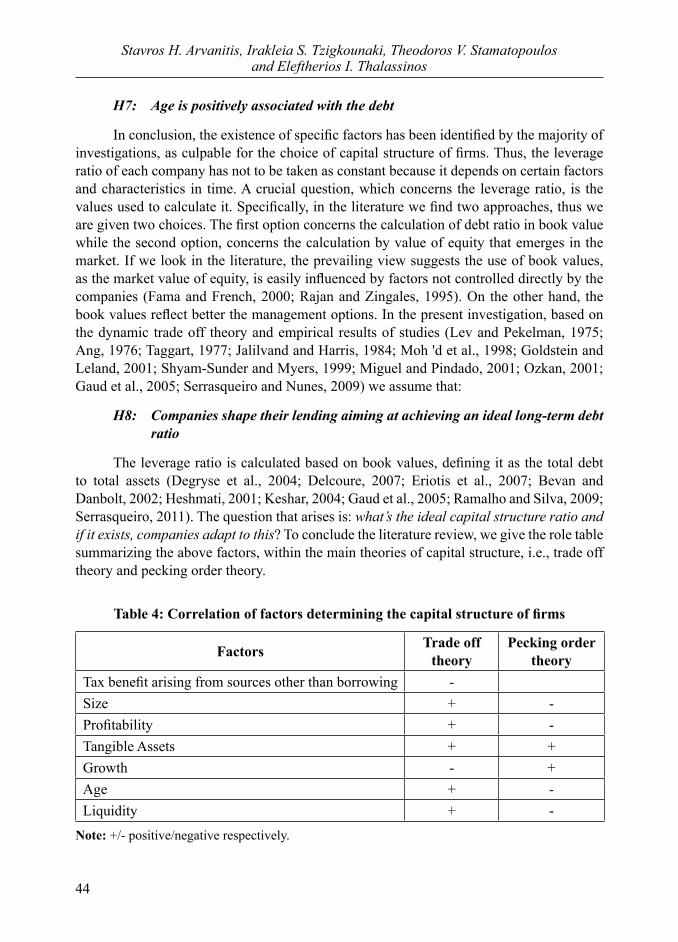
H7: Age is positively associated with the debt
In conclusion, the existence of specific factors has been identified by the majority of investigations, as culpable for the choice of capital structure of firms. Thus, the leverage ratio of each company has not to be taken as constant because it depends on certain factors and characteristics in time. A crucial question, which concerns the leverage ratio, is the values used to calculate it. Specifically, in the literature we find two approaches, thus we are given two choices. The first option concerns the calculation of debt ratio in book value while the second option, concerns the calculation by value of equity that emerges in the market. If we look in the literature, the prevailing view suggests the use of book values, as the market value of equity, is easily influenced by factors not controlled directly by the companies (Fama and French, 2000; Rajan and Zingales, 1995). On the other hand, the book values reflect better the management options. In the present investigation, based on the dynamic trade off theory and empirical results of studies (Lev and Pekelman, 1975; Ang, 1976; Taggart, 1977; Jalilvand and Harris, 1984; Moh 'd et al., 1998; Goldstein and Leland, 2001; Shyam-Sunder and Myers, 1999; Miguel and Pindado, 2001; Ozkan, 2001; Gaud et al., 2005; Serrasqueiro and Nunes, 2009) we assume that:
H8: Companies shape their lending aiming at achieving an ideal long-term debt ratio
The leverage ratio is calculated based on book values , defining it as the total debt to total assets (Degryse et al., 2004; Delcoure, 2007; Eriotis et al., 2007; Bevan and Danbolt, 2002; Heshmati, 2001; Keshar, 2004; Gaud et al., 2005; Ramalho and Silva, 2009; Serrasqueiro, 2011). The question that arises is: what’s the ideal capital structure ratio and if it exists, companies adapt to this? To conclude the literature review, we give the role table summarizing the above factors, within the main theories of capital structure, i.e., trade off theory and pecking order theory.
Table 4: Correlation of factors determining the capital structure of firms
Factors Trade off theory
Pecking order theory
Tax benefit arising from sources other than borrowing -Size + -Profitability + -Tangible Assets + +Growth - +Age + -Liquidity + -
Note: +/- positive/negative respectively.
45
Dynamic Approach of Capital Structure of European Shipping Companies
3. Methodology
3.1 Data and definitions of variables
3.1.1 Data
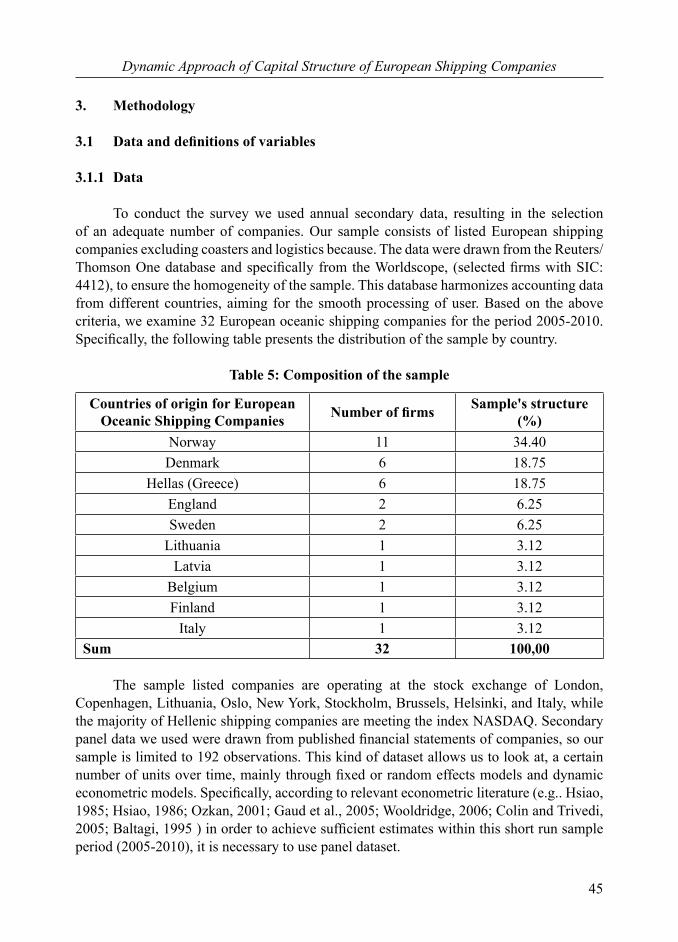
To conduct the survey we used annual secondary data, resulting in the selection of an adequate number of companies. Our sample consists of listed European shipping companies excluding coasters and logistics because. The data were drawn from the Reuters/Thomson One database and specifically from the Worldscope, (selected firms with SIC: 4412), to ensure the homogeneity of the sample. This database harmonizes accounting data from different countries, aiming for the smooth processing of user. Based on the above criteria, we examine 32 European oceanic shipping companies for the period 2005-2010. Specifically, the following table presents the distribution of the sample by country.
Table 5: Composition of the sample
Countries of origin for European Oceanic Shipping Companies Number of firms Sample's structure
(%)Norway 11 34.40Denmark 6 18.75
Hellas (Greece) 6 18.75England 2 6.25Sweden 2 6.25
Lithuania 1 3.12Latvia 1 3.12
Belgium 1 3.12Finland 1 3.12
Italy 1 3.12Sum 32 100,00
The sample listed companies are operating at the stock exchange of London, Copenhagen, Lithuania, Oslo, New York, Stockholm, Brussels, Helsinki, and Italy, while the majority of Hellenic shipping companies are meeting the index NASDAQ. Secondary panel data we used were drawn from published financial statements of companies, so our sample is limited to 192 observations. This kind of dataset allows us to look at, a certain number of units over time, mainly through fixed or random effects models and dynamic econometric models. Specifically, according to relevant econometric literature (e.g.. Hsiao, 1985; Hsiao, 1986; Ozkan, 2001; Gaud et al., 2005; Wooldridge, 2006; Colin and Trivedi, 2005; Baltagi, 1995 ) in order to achieve sufficient estimates within this short run sample period (2005-2010), it is necessary to use panel dataset.
46
Stavros H. Arvanitis, Irakleia S. Tzigkounaki, Theodoros V. Stamatopoulos and Eleftherios I. Thalassinos
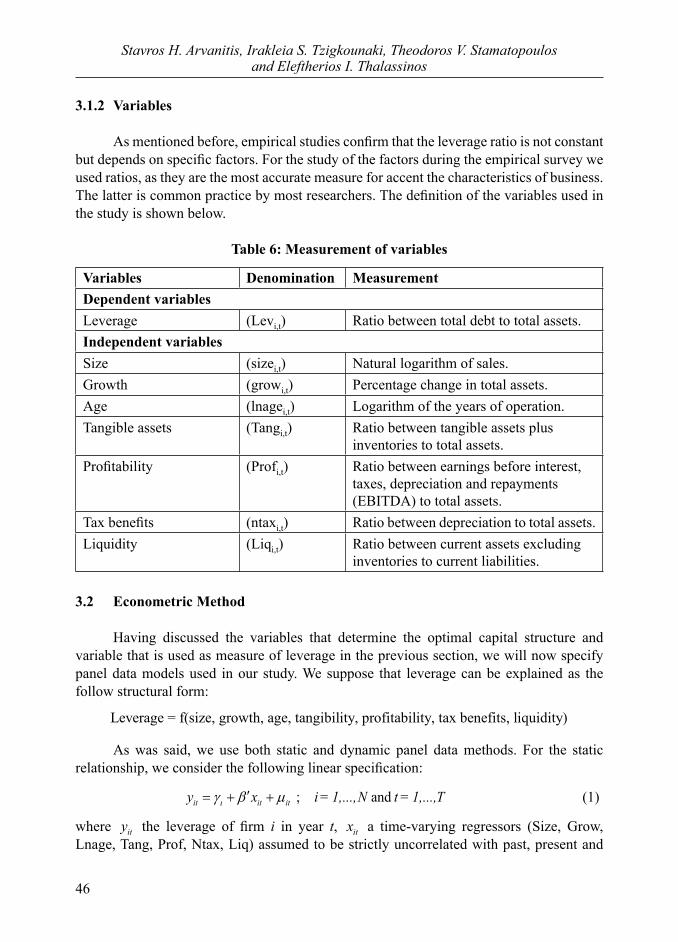
3.1.2 Variables
As mentioned before, empirical studies confirm that the leverage ratio is not constant but depends on specific factors. For the study of the factors during the empirical survey we used ratios, as they are the most accurate measure for accent the characteristics of business. The latter is common practice by most researchers. The definition of the variables used in the study is shown below.
Table 6: Measurement of variables
Variables Denomination MeasurementDependent variablesLeverage (Levi,t) Ratio between total debt to total assets.Independent variablesSize (sizei,t) Natural logarithm of sales.Growth (growi,t) Percentage change in total assets.Age (lnagei,t) Logarithm of the years of operation.Tangible assets (Tangi,t) Ratio between tangible assets plus
inventories to total assets.Profitability (Profi,t) Ratio between earnings before interest,
taxes, depreciation and repayments (EBITDA) to total assets.
Tax benefits (ntaxi,t) Ratio between depreciation to total assets.Liquidity (Liqi,t) Ratio between current assets excluding
inventories to current liabilities.
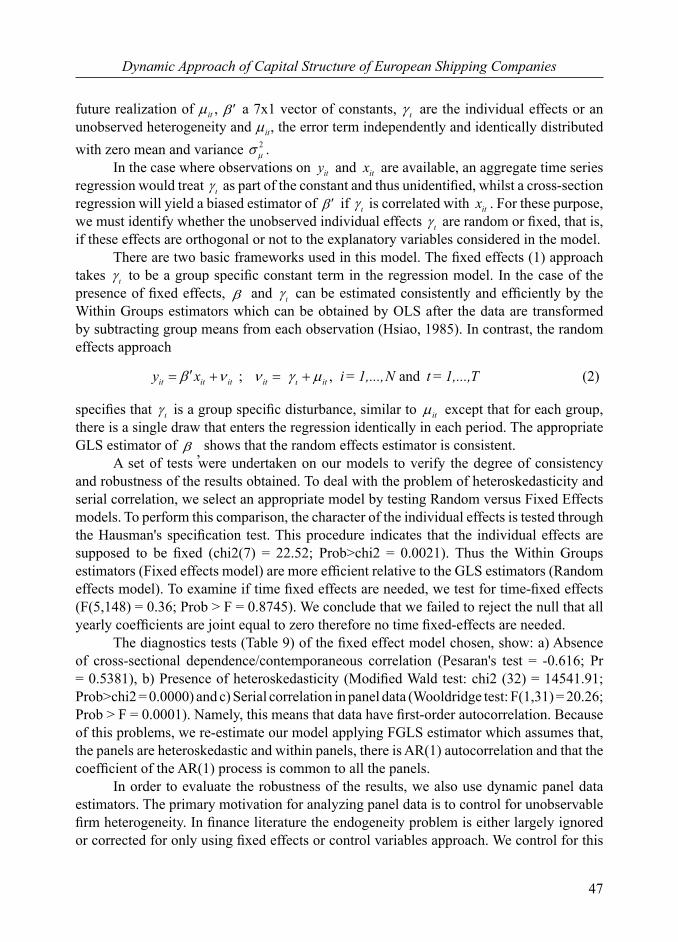
3.2 Econometric Method
Having discussed the variables that determine the optimal capital structure and variable that is used as measure of leverage in the previous section, we will now specify panel data models used in our study. We suppose that leverage can be explained as the follow structural form:
Leverage = f(size, growth, age, tangibility, profitability, tax benefits, liquidity)
As was said, we use both static and dynamic panel data methods. For the static relationship, we consider the following linear specification:
; and it it ity x i = 1,...,N t = 1,...,T (1)
where ity the leverage of firm i in year t, itx a time-varying regressors (Size, Grow, Lnage, Tang, Prof, Ntax, Liq) assumed to be strictly uncorrelated with past, present and
47
Dynamic Approach of Capital Structure of European Shipping Companies
future realization of it , a 7x1 vector of constants, are the individual effects or an unobserved heterogeneity and it , the error term independently and identically distributed with zero mean and variance 2
. In the case where observations on ity and itx are available, an aggregate time series regression would treat as part of the constant and thus unidentified, whilst a cross-section regression will yield a biased estimator of if is correlated with itx . For these purpose, we must identify whether the unobserved individual effects are random or fixed, that is, if these effects are orthogonal or not to the explanatory variables considered in the model. There are two basic frameworks used in this model. The fixed effects (1) approach takes to be a group specific constant term in the regression model. In the case of the presence of fixed effects, and can be estimated consistently and efficiently by the Within Groups estimators which can be obtained by OLS after the data are transformed by subtracting group means from each observation (Hsiao, 1985). In contrast, the random effects approach
; , and it it it it ity x i = 1,...,N t = 1,...,T (2)
specifies that is a group specific disturbance, similar to it except that for each group, there is a single draw that enters the regression identically in each period. The appropriate GLS estimator of , shows that the random effects estimator is consistent. A set of tests were undertaken on our models to verify the degree of consistency and robustness of the results obtained. To deal with the problem of heteroskedasticity and serial correlation, we select an appropriate model by testing Random versus Fixed Effects models. To perform this comparison, the character of the individual effects is tested through the Hausman's specification test. This procedure indicates that the individual effects are supposed to be fixed (chi2(7) = 22.52; Prob>chi2 = 0.0021). Thus the Within Groups estimators (Fixed effects model) are more efficient relative to the GLS estimators (Random effects model). To examine if time fixed effects are needed, we test for time-fixed effects (F(5,148) = 0.36; Prob > F = 0.8745). We conclude that we failed to reject the null that all yearly coefficients are joint equal to zero therefore no time fixed-effects are needed. The diagnostics tests (Table 9) of the fixed effect model chosen, show: a) Absence of cross-sectional dependence/contemporaneous correlation (Pesaran's test = -0.616; Pr = 0.5381), b) Presence of heteroskedasticity (Modified Wald test: chi2 (32) = 14541.91; Prob>chi2 = 0.0000) and c) Serial correlation in panel data (Wooldridge test: F(1,31) = 20.26; Prob > F = 0.0001). Namely, this means that data have first-order autocorrelation. Because of this problems, we re-estimate our model applying FGLS estimator which assumes that, the panels are heteroskedastic and within panels, there is AR(1) autocorrelation and that the coefficient of the AR(1) process is common to all the panels. In order to evaluate the robustness of the results, we also use dynamic panel data estimators. The primary motivation for analyzing panel data is to control for unobservable firm heterogeneity. In finance literature the endogeneity problem is either largely ignored or corrected for only using fixed effects or control variables approach. We control for this
48
Stavros H. Arvanitis, Irakleia S. Tzigkounaki, Theodoros V. Stamatopoulos and Eleftherios I. Thalassinos
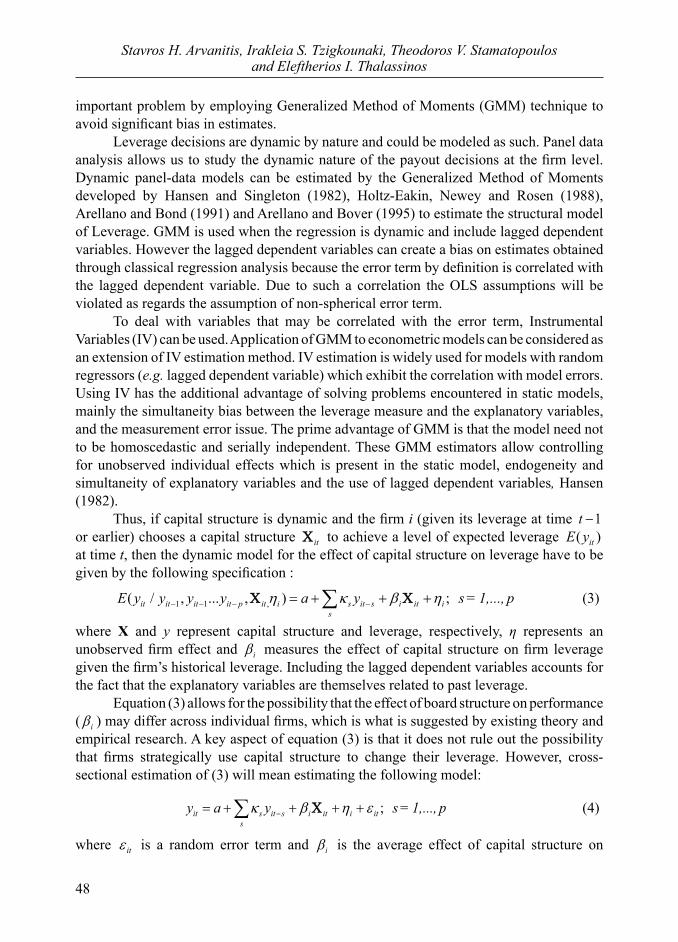
important problem by employing Generalized Method of Moments (GMM) technique to avoid significant bias in estimates. Leverage decisions are dynamic by nature and could be modeled as such. Panel data analysis allows us to study the dynamic nature of the payout decisions at the firm level. Dynamic panel-data models can be estimated by the Generalized Method of Moments developed by Hansen and Singleton (1982), Holtz-Eakin, Newey and Rosen (1988), Arellano and Bond (1991) and Arellano and Bover (1995) to estimate the structural model of Leverage. GMM is used when the regression is dynamic and include lagged dependent variables. However the lagged dependent variables can create a bias on estimates obtained through classical regression analysis because the error term by definition is correlated with the lagged dependent variable. Due to such a correlation the OLS assumptions will be violated as regards the assumption of non-spherical error term. To deal with variables that may be correlated with the error term, Instrumental Variables (IV) can be used. Application of GMM to econometric models can be considered as an extension of IV estimation method. IV estimation is widely used for models with random regressors (e.g. lagged dependent variable) which exhibit the correlation with model errors. Using IV has the additional advantage of solving problems encountered in static models, mainly the simultaneity bias between the leverage measure and the explanatory variables, and the measurement error issue. The prime advantage of GMM is that the model need not to be homoscedastic and serially independent. These GMM estimators allow controlling for unobserved individual effects which is present in the static model, endogeneity and simultaneity of explanatory variables and the use of lagged dependent variables, Hansen (1982). Thus, if capital structure is dynamic and the firm i (given its leverage at time 1tor earlier) chooses a capital structure it to achieve a level of expected leverage ( )itE yat time t, then the dynamic model for the effect of capital structure on leverage have to be given by the following specification :
1 1 ,( / , ... , ) ; it it it it p it i s it s i it is
E y y y y a y s = 1,..., p
(3)
where X and y represent capital structure and leverage, respectively, η represents an unobserved firm effect and i measures the effect of capital structure on firm leverage given the firm’s historical leverage. Including the lagged dependent variables accounts for the fact that the explanatory variables are themselves related to past leverage. Equation (3) allows for the possibility that the effect of board structure on performance ( i ) may differ across individual firms, which is what is suggested by existing theory and empirical research. A key aspect of equation (3) is that it does not rule out the possibility that firms strategically use capital structure to change their leverage. However, cross-sectional estimation of (3) will mean estimating the following model:
; it s it s i it i it
s
y a y s = 1,..., p
(4)
where it is a random error term and i is the average effect of capital structure on
49
Dynamic Approach of Capital Structure of European Shipping Companies
leverage, ( ) iE b . The key economic question here concerns the inference drawn from the estimated ̂ in equation (4). The model in (3) allows ib differing across firms. It is of course possible that 0ib for some firms and 0ib for other firms. Thus, while capital structure may be important in determining firm leverage, if capital structure is completely endogenously determined, then ˆ ( ) 0 iE b . For the selection of suitable dynamic capital structure model, we followed the procedure: First, we examined empirically how many lags of leverage we need to capture all information from the past. This is important for at least two reasons: a) failure to capture all influences of the past on the present could still mean that equation (3) is misspecified (i.e., there might be an omitted variable bias) and b) perhaps more importantly, we argue that all older lags are exogenous with respect to the residuals of the present; thus, they can be used as instruments. This is important for consistent estimation using the dynamic panel GMM estimator. Glen, Lee, and Singh (2001) and Gschwandtner (2005) suggest that two lags are sufficient to capture the persistence of leverage. To see if two lags are sufficient to ensure dynamic completeness, we estimate a regression of current leverage on five lags of past leverage, controlling for other firm-specific variables. Results suggest that including two lags it is sufficient to capture the dynamic endogeneity of the capital structure/leverage relation. Particularly, the first two lags are statistically significant while older lags are insignificant. Then, we drop the older lags and include only the recent ones. In these specifications, the older lags are statistically significant. Thus, while the older lags include relevant information, that information is subsumed by the more recent lags. Second, we examined empirically how strong the present with the past correlation is. Our test, involve OLS regression of current levels of firm specific variables. We find that, size, lnage and liquidity are significantly related to past leverage. The latter also shows that the variables are dynamically endogenous. As we discussed earlier, we include two lags of leverage in the dynamic model. This makes historical leverage and historical firm characteristics, lagged three periods or more, available for use as instruments. We use variables lagged three periods as instruments for all the endogenous variables in the GMM estimates. Our assumption in the GMM regression is that all the regressors except growth, tangibility, profitability and tax benefits are endogenous. Finally, we estimate the following model:
1 1 1 2 2 1 2 3 4
5 6 7
ln
it it it it it it it
it it it i it
Lev a Lev Lev Size Grow Age Tang
Prof Ntax Liq
(5)
To estimate the above dynamic basic model, two versions of the GMM technique are used; First, the GMM in-difference and secondly, the linear GMM estimator in form of GMM in-system (see Table 10). In GMM in-difference technique, the model is estimated in first-differences using level regressors as instruments to control for unobservable firm heterogeneity. The GMM in-system model is estimated in both levels and first-differences, i.e., level-equations are simultaneously regressed using differenced lagged regressors as instruments. As the autocorrelation of order 1 in the dependent variable is high and the
50
Stavros H. Arvanitis, Irakleia S. Tzigkounaki, Theodoros V. Stamatopoulos and Eleftherios I. Thalassinos
number of time-series observation is small (6), the GMM in-system estimator is the most appropriated in comparison with the GMM differenced estimator. The consistency of the coefficient estimates obtained with the panel GMM estimator depends, to a significant extent, on the validity of the instruments (exogeneity of instruments) that we use. Arellano and Bond (1991) suggest two tests for that reason. The first test is a serial correlation test. The biggest concern is whether or not we have in cluded enough lags to control for dynamic endogeneity. For our GMM in-system estimates, if the assumptions of our specification are valid, by construction the residuals in first differences (AR(1)) should be correlated, but there should be no serial correlation in second differences (AR(2)). The re sults of these tests confirm that this is the case: the AR(1) test yields a p-value of 0.334 and the AR(2) test yields a p-value of 0.249 (see Table 10). The second test is a Hansen (or Sargan) test of over-identification. The dynamic panel GMM in-system estimator uses multiple lags as instruments. This means that our system is over-identified and provides us with an opportunity to carry out the test of over-identification. Hansen and Sargan tests (p-value of 0.235 and p-value of 0.0380, respectively) show that our instruments are valid. Finally, to test the exogeneity of the subset of our instruments, use the difference-in-Hansen test. The results show that the additional subset of instruments used in the system GMM estimates is indeed exogenous.
4. Results and Discussion
4.1 Descriptive statistics and correlation
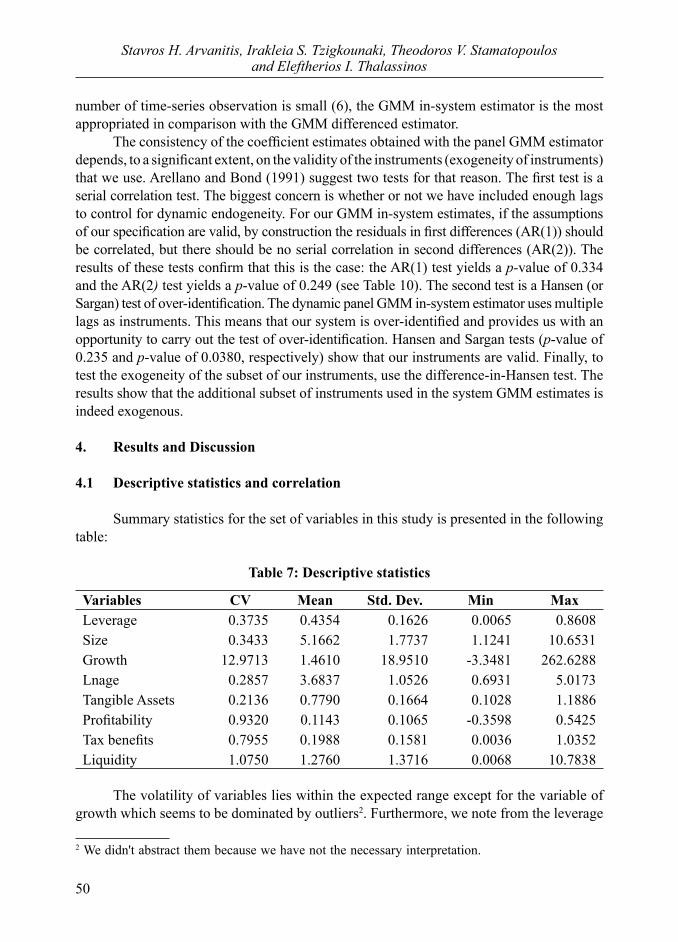
Summary statistics for the set of variables in this study is presented in the following table:
Table 7: Descriptive statistics
Variables CV Mean Std. Dev. Min MaxLeverage 0.3735 0.4354 0.1626 0.0065 0.8608Size 0.3433 5.1662 1.7737 1.1241 10.6531Growth 12.9713 1.4610 18.9510 -3.3481 262.6288Lnage 0.2857 3.6837 1.0526 0.6931 5.0173Tangible Assets 0.2136 0.7790 0.1664 0.1028 1.1886Profitability 0.9320 0.1143 0.1065 -0.3598 0.5425Tax benefits 0.7955 0.1988 0.1581 0.0036 1.0352Liquidity 1.0750 1.2760 1.3716 0.0068 10.7838
The volatility of variables lies within the expected range except for the variable of growth which seems to be dominated by outliers2. Furthermore, we note from the leverage
2 We didn't abstract them because we have not the necessary interpretation.

51
Dynamic Approach of Capital Structure of European Shipping Companies
ratio on average 43.54% of the assets of the shipping companies are financed by borrowing, during the sample period 2005-2010. Simultaneously, the tangible assets consist of 77.90% of total assets of the companies, emphasizing the importance of long term funding for maritime businesses. Although the volume of assets, only 19.88% is subject to depreciation. This percentage is quite small when considering that most of the assets are ships, which have a large life for depreciation. This can be explained by the constant buying and selling ships, conducted by maritime shipping companies, (Apergis and Sorros, 2009). Finally, liquidity has mean 1.27 indicating that companies can handle well their obligations. At the next table it is shown the matrix of correlation coefficients between leverage and the independent variables. From the table it seems that we have no problem of multicollineartiy (Mean VIF=1.47 <10).
Table 8: Correlation matrix
Variables Levi,t Sizei,t Growi,t Lnagei,t Tangi,t Profi,t Ntaxi,t Liqi,t
Levi,t 1Sizei,t -0.1586* 1Growi,t -0.088 0.0083 1Lnagei,t -0.0575 0.5649* 0.066 1Tangi,t 0.2005* -0.2226* 0.0554 -0.3573* 1Profi,t -0.3546* 0.3530* 0.0069 0.2014* -0.1413 1Ntaxi,t 0.118 0.1451* -0.0372 0.1866* 0.088 -0.0624 1Liqi,t -0.3679* 0.0838 0.5052* 0.2685* -0.2468* 0.2774* -0.1415 1
Note: * p < 0.05
4.2 Comparison of the results of static panel models
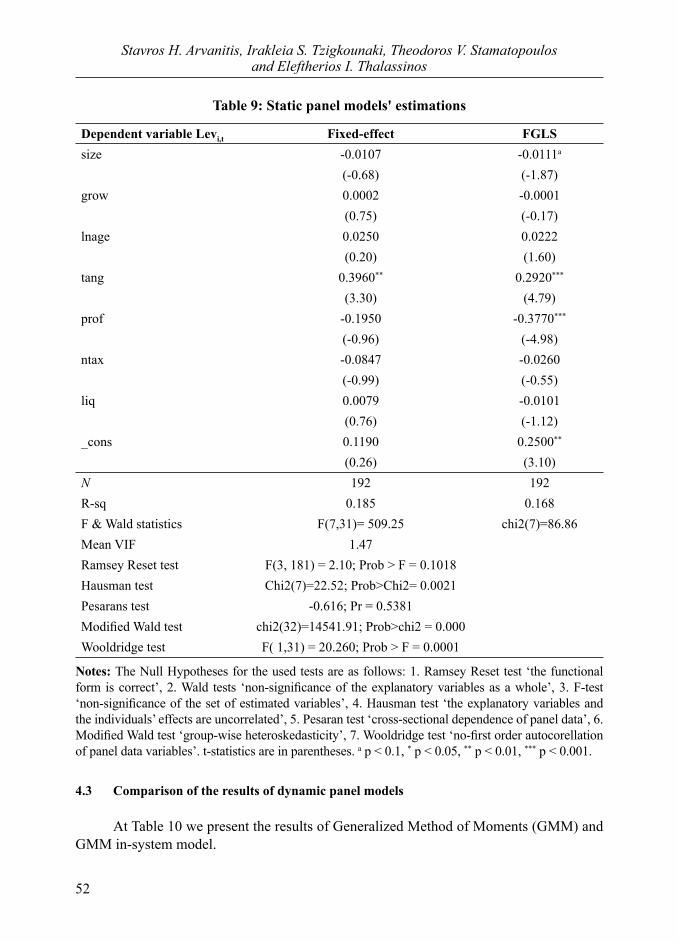
The estimations from the fixed effect model and FGLS estimator are shown at Table 9. In Fixed - effect model, the only statistically significant variable is the structure of assets, showing a positive relationship with the leverage ratio. In the FGLS estimator except of the structure of assets, significant variables are shown the size and profitability, indicating a negative relationship with the leverage ratio. The specific variables show a negative relationship in fixed effects model but they are non-statistically significant. The variable of age appears non-significant in both models, emphasizing the positive dependence on borrowing. While, there is negative relationship between tax advantages resulting from depreciation and borrowing, this is not statistically significant in both models. The variables of growth and liquidity are also not statistically significant. So, observing the results of Table 9, we can conclude that the estimations of the fixed effects model are a little bit different from those of the FGLS one.
52
Stavros H. Arvanitis, Irakleia S. Tzigkounaki, Theodoros V. Stamatopoulos and Eleftherios I. Thalassinos
Table 9: Static panel models' estimations
Dependent variable Levi,t Fixed-effect FGLSsize -0.0107 -0.0111a
(-0.68) (-1.87)grow 0.0002 -0.0001
(0.75) (-0.17)lnage 0.0250 0.0222
(0.20) (1.60)tang 0.3960** 0.2920***
(3.30) (4.79)prof -0.1950 -0.3770***
(-0.96) (-4.98)ntax -0.0847 -0.0260
(-0.99) (-0.55)liq 0.0079 -0.0101
(0.76) (-1.12)_cons 0.1190 0.2500**
(0.26) (3.10)N 192 192R-sq 0.185 0.168F & Wald statistics F(7,31)= 509.25 chi2(7)=86.86Mean VIF 1.47Ramsey Reset test F(3, 181) = 2.10; Prob > F = 0.1018Hausman test Chi2(7)=22.52; Prob>Chi2= 0.0021Pesarans test -0.616; Pr = 0.5381Modified Wald test chi2(32)=14541.91; Prob>chi2 = 0.000Wooldridge test F( 1,31) = 20.260; Prob > F = 0.0001
Notes: The Null Hypotheses for the used tests are as follows: 1. Ramsey Reset test ‘the functional form is correct’, 2. Wald tests ‘non-significance of the explanatory variables as a whole’, 3. F-test ‘non-significance of the set of estimated variables’, 4. Hausman test ‘the explanatory variables and the individuals’ effects are uncorrelated’, 5. Pesaran test ‘cross-sectional dependence of panel data’, 6. Modified Wald test ‘group-wise heteroskedasticity’, 7. Wooldridge test ‘no-first order autocorellation of panel data variables’. t-statistics are in parentheses. a p < 0.1, * p < 0.05, ** p < 0.01, *** p < 0.001.
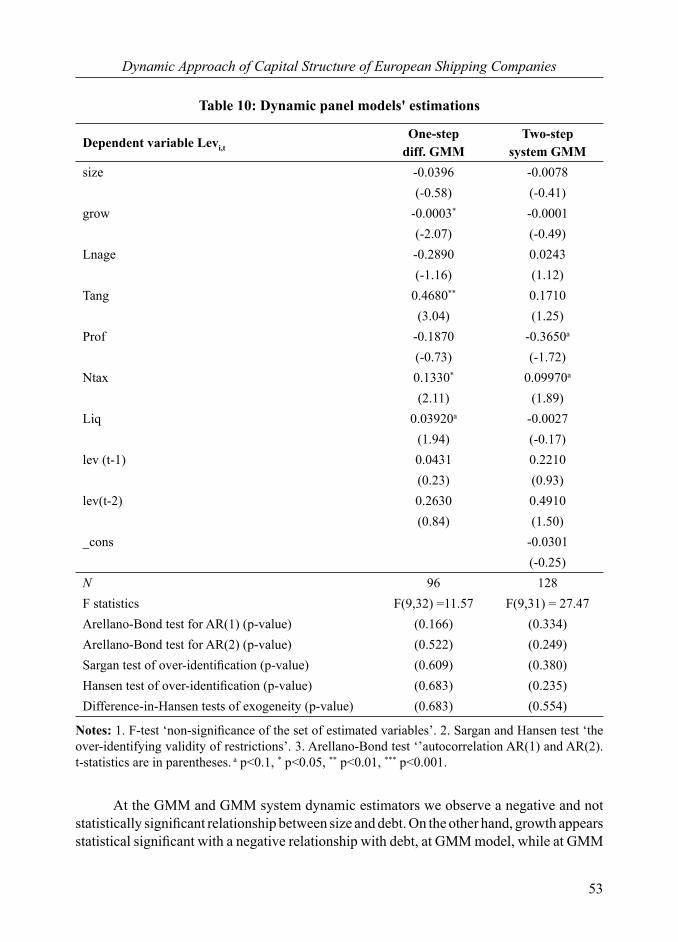
4.3 Comparison of the results of dynamic panel models
At Table 10 we present the results of Generalized Method of Moments (GMM) and GMM in-system model.
53
Dynamic Approach of Capital Structure of European Shipping Companies
Table 10: Dynamic panel models' estimations
Dependent variable Levi,tOne-step
diff. GMMTwo-step
system GMMsize -0.0396 -0.0078
(-0.58) (-0.41)grow -0.0003* -0.0001
(-2.07) (-0.49)Lnage -0.2890 0.0243
(-1.16) (1.12)Tang 0.4680** 0.1710
(3.04) (1.25)Prof -0.1870 -0.3650a
(-0.73) (-1.72)Ntax 0.1330* 0.09970a
(2.11) (1.89)Liq 0.03920a -0.0027
(1.94) (-0.17)lev (t-1) 0.0431 0.2210
(0.23) (0.93)lev(t-2) 0.2630 0.4910
(0.84) (1.50)_cons -0.0301
(-0.25)N 96 128F statistics F(9,32) =11.57 F(9,31) = 27.47Arellano-Bond test for AR(1) (p-value) (0.166) (0.334)Arellano-Bond test for AR(2) (p-value) (0.522) (0.249)Sargan test of over-identification (p-value) (0.609) (0.380) Hansen test of over-identification (p-value) (0.683) (0.235)Difference-in-Hansen tests of exogeneity (p-value) (0.683) (0.554)
Notes: 1. F-test ‘non-significance of the set of estimated variables’. 2. Sargan and Hansen test ‘the over-identifying validity of restrictions’. 3. Arellano-Bond test ‘’autocorrelation AR(1) and AR(2). t-statistics are in parentheses. a p<0.1, * p<0.05, ** p<0.01, *** p<0.001.
At the GMM and GMM system dynamic estimators we observe a negative and not statistically significant relationship between size and debt. On the other hand, growth appears statistical significant with a negative relationship with debt, at GMM model, while at GMM
54
Stavros H. Arvanitis, Irakleia S. Tzigkounaki, Theodoros V. Stamatopoulos and Eleftherios I. Thalassinos
system dynamic estimator is not statistical significant. The variable of age is not statistical significant for both models, although we observe a negative relationship between debt and age, at GMM dynamic estimator and a positive relationship at GMM system dynamic estimator. The structure of assets affects positively debt and it is statistical significant at GMM model. In drawing our attention to the variable of profitability, we see the negative relationship with debt and statistical significant, at GMM system. The tax benefit, resulting from the depreciation, reported statistically significant in both models, indicating a positive relationship with the leverage ratio. The statistically significant variable of liquidity displays a positive relationship with the dependent variable of leverage in GMM model, in contrast to the GMM system where it is shown a non-significant negative dependence on the leverage ratio. At the end, the impact of dept in the previous periods is not statistically significant in both models.
4.4 Discussion
Size
The variable of size is negatively related to the leverage ratio for all models and displayed statistically significant in the FGLS estimator. Therefore, the hypothesis H1 for positive correlation of size and leverage ratio didn't verify by our dataset of European oceanic shipping companies. By this way, the Pecking order theory is confirmed as well larger firms face less information asymmetry problems by selecting the issuance of shares as the best way to finance capital. This is supported in the shipping sector because we are faced with large companies that operate globally by their nature and continuously disclose their financial information, while the most of them are controlled by external and internal auditors. We should also not forget that the period of economic crisis has created a bleak and volatile economic environment, leading financial institutions, firstly on banking solvency crisis making borrowing difficult enough. Although, the sample period comprises the crash of 2008 and the ongoing crisis, which we should take in to account, the negative relationship between size and leverage ratio has been verified by Kester, 1986; Kim and Sorensen, 1986; Titman and Wessels, 1988; Heshmati, 2001; Bevan and Danbolt, 2004; Chen et al., 2004; Khalid, 2011.
Growth
The variable of growth is negatively related to the leverage ratio in all estimated models, except in fixed effect model where we find a positive relationship, but statistically insignificant. So, we accept the hypothesis H5 for negative relationship between growth and leverage ratio. This result serves to confirm the trade off theory, as well developing businesses particularly this crisis period, yield risk for creditors while occupied by over-optimism. Result of reported events is the reduction of loans from credit institutions given the aforementioned banking crisis. The negative relationship between debt ratio and growth come to confirm studies of: Kim and Sorensen, 1986; Titman and Wessels, 1988; Rajan
55
Dynamic Approach of Capital Structure of European Shipping Companies
and Zingales, 1995; Heshmati, 2001; Ozkan, 2001; Graham and Harvey, 2001; Fama and French, 2002; Gaud et al., 2005; Maghyeren, 2005; Khalid, 2011.
Age
The variable of age, statistically insignificant, shows a positive relationship with the leverage ratio for the estimated models, except the GMM where it is reported as a negative one. This could verify both the pecking order theory and the trade off theory. Our dataset support the thesis that the age of shipping companies does not affect their capital structure.
Asset Structure (Tangible Assets)
Structure of assets is appeared as a positive determinant of the leverage ratio as it proved statistically significant (with the exception of the GMM system), verifying the hypothesis H2. Tangible assets, offered as collateral to credit institutions, reducing the cost of asymmetric information and bankruptcy costs. This finding supports both the trade off theory and the pecking order theory and is confirmed empirically by the following researchers: Titman and Wessels, 1988; Rajan and Zingales, 1995; Booth et al., 2001; Chen, 2004; Gaud et al., 2005; Maghyeren, 2005; Noulas and Genimakis, 2011; Khalid, 2011.
Profitability
The variable of profitability is negatively related to the leverage ratio and appears statistically significant in the FGLS estimator and the GMM system model. Our data for European shipping reject the H3 hypothesis. So, we confirm the pecking order theory. Profitable firms are able to retain profits to fund their activities from them, rather than external borrowing. This result verified empirically by: Kester, 1986; Friend and Lang, 1988; Titman and Wessels, 1988; Rajan and Zingales, 1995; Michaelas et al., 1999; Wald, 1999; Booth et al., 2001; Ozkan, 2001 ; Chen, 2004, Bevan and Danbolt, 2004; Gaud et al., 2005; Maghyeren, 2005; Deari and Deari, 2009; Psilaki and Daskalakis, 2009; Degryse et al., 2010; Khalid, 2011.
Tax benefits from other sources except borrowing
The variable of tax benefits from sources other than borrowing appears statistically significant and shows a positive relationship with the leverage ratio (Table 10), which is the opposite case of the static econometric estimations presented in Table 9. This evidence depicted by the dynamic modeling of the GMM, might be explained by the specific tax regulation for/and the nature of the shipping companies, which have a large volume of fixed assets and engage in continuous buying and selling it. As a result, appears the delayed depreciation of capital equipment and essentially exempting income from the cost of depreciation, during the first years of the new asset. This positive relation may have as underlying reason the age of ships, i.e., the greater the tax benefits, the aging ship have
56
Stavros H. Arvanitis, Irakleia S. Tzigkounaki, Theodoros V. Stamatopoulos and Eleftherios I. Thalassinos
to be replaced, ceteris paribus, by new borrowing which give rise to the leverage ratio. The income generated from the years that follow the sale of the asset, is without costs of depreciation, so the companies are turning to loans to obtain tax benefits resulting from it. The specificity of the shipping companies with very high relative variability of tax benefits, appears in the table of descriptive statistics quoted above (Table 7).
Liquidity
The variable of liquidity shows statistically significant in the dynamic model GMM. Furthermore, there is a positive relationship between liquidity and leverage ratio. This fact verifies the trade off theory. Specifically, firms with excess liquidity cope with their obligations, thus predisposing the credit institutions to facilitate loans. If we observe Table 7 which shows the descriptive statistics, we see that on average the shipping companies have good liquidity, but always under the constraint of business cycles in shipping which may be revealed by its high relative variance.
Adjustment to a target ratio
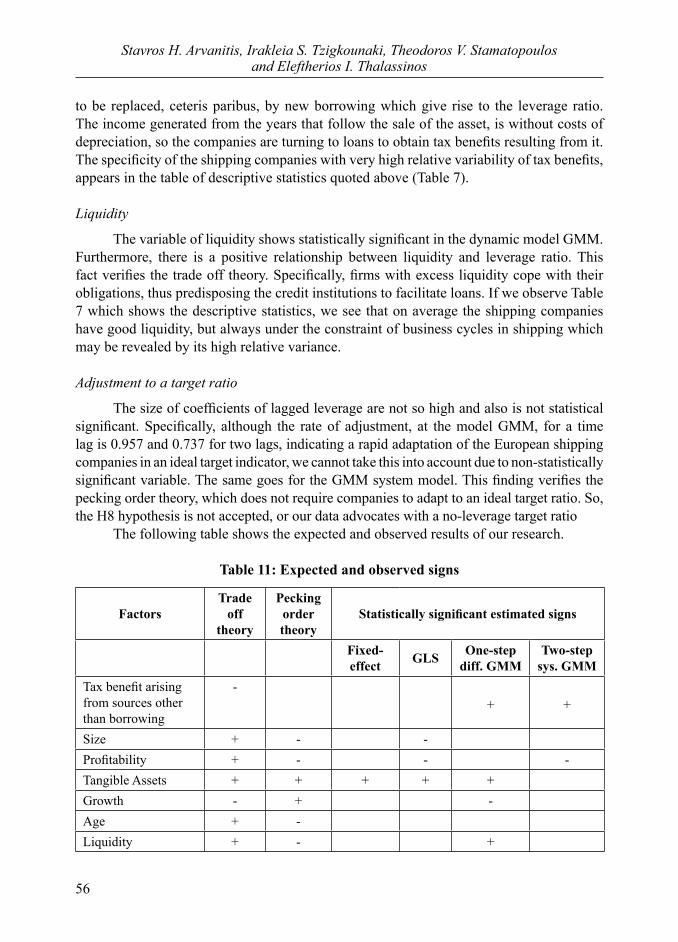
The size of coefficients of lagged leverage are not so high and also is not statistical significant. Specifically, although the rate of adjustment, at the model GMM, for a time lag is 0.957 and 0.737 for two lags, indicating a rapid adaptation of the European shipping companies in an ideal target indicator, we cannot take this into account due to non-statistically significant variable. The same goes for the GMM system model. This finding verifies the pecking order theory, which does not require companies to adapt to an ideal target ratio. So, the H8 hypothesis is not accepted, or our data advocates with a no-leverage target ratio The following table shows the expected and observed results of our research.
Table 11: Expected and observed signs
FactorsTrade
off theory
Pecking order theory
Statistically significant estimated signs
Fixed-effect GLS One-step
diff. GMMTwo-step
sys. GMMTax benefit arising from sources other than borrowing
-+ +
Size + - -Profitability + - - -Tangible Assets + + + + +Growth - + -Age + -Liquidity + - +
57
Dynamic Approach of Capital Structure of European Shipping Companies
Above, we analyzed the determinants of capital structure of enterprises through static and dynamic econometric models. If we observe the results, we will identify the differences arising depending on the model used, without excluding the commonalities among the models. Essentially, static models give us the variables of growth, age, liquidity and tax advantages of depreciation, non-statistically significant. While easily end up in a negative relationship between size, profitability and debt and a positive relationship between physical assets and the leverage ratio. These lead us to conclude to the adoption of pecking order theory of the shipping companies. The static models, due to unobserved effects result in somewhat unreliable results. In that conclusion reached Gow et al. (2007) in their empirical study, by opposing 121 studies, published in prestigious journals such as ‘The Accounting Review’, ‘Journal of Accounting and Economics’ and ‘Journal of Accounting Research’, resulted in the finding of error specification of the statistical results of the investigations, because of the violation of the assumption of independence of the disturbing term with the independent variables. Specifically, many studies employed models which assume either independence or cross section or time series, but not time series and cross section, resulting in a cross sectional or time series correlation, as appropriate. Simultaneously, basic assumptions which must be observed, often violated leading to erroneous conclusions, (Gow et al., 2007). For these reasons, we proceeded to implement dynamic econometric models. The GMM model, suggest us the application of both the trade off theory and the pecking order theory for our dataset of European shipping companies. The variables of size, profitability and age appear not statistically significant. At the same time it is displayed a positive relationship between liquidity, tangible assets, tax benefits from other sources than borrowing, and leverage ratio. On the other hand growth depends negatively on debt. Unlike, the GMM system model gives clearer results. Negative relationship occurs between profitability and debt while a positive relationship occurs between tax benefits arising from the depreciation and the debt ratio. To export our final conclusions, we will take into account the GMM system model which essentially gives us more strong results than the GMM model. Therefore, based on the above, we conclude the implementation of the pecking order theory of the European shipping companies.
5. Conclusion
This research, for the first time as far as we know, examines the capital structure of European shipping companies during the turbulent period 2005-2010, including the crash of 2008 and the ensuing global economic crisis. It was conducted over static (Fixed effects and FGLS estimator) and dynamic (GMM and GMM system methods) models using panel data. The objective of the research has been two-fold: a) to reveal the determinants of the capital structure of European shipping enterprises based on the dominant relative theory and b) to search for the existence of an ideal - target capital structure ratio. If you consider the issue through econometric static models, easily end up in a negative relationship between size and profitability against lending and a positive
58
Stavros H. Arvanitis, Irakleia S. Tzigkounaki, Theodoros V. Stamatopoulos and Eleftherios I. Thalassinos
relationship between tangible assets and the leverage ratio. The variables of growth, age, liquidity and tax advantages of depreciation showed up as not statistically significant. These lead us to conclude that our dataset (shipping companies) is in favor of the pecking order theory. Based on the GMM system model, due to the statistically robust estimations obtained, we reached at the negative relationship between profitability and debt and a positive relationship between tax benefits from depreciation, which might underlie the aging factor of the ships, and the debt ratio. Furthermore, the variable of adjustment in an ideal capital structure ratio appears as not statistically significant, suggesting that European shipping companies verify pecking order theory. This research is limited on European shipping companies, which constraint the global inference of the estimations yield. Moreover, interpreting the leverage ratio we used only book values, while we have not distinguished in the long or short term borrowing. A special limitation, is that we analyzed this issue based only on micro-data during a global crisis period (2005-2010), without macro-elements in our identified models. However, our research may be the trigger for a global one in the maritime sector, taking into account the socio-economic conditions that surround the enterprises and other determinants. Simultaneously, in future studies would be useful to consider the debt leverage of enterprises through market values, or to distinguish in the long and short term borrowing.
References
Abor J., 2005, ‘The effect of capital structure on profitability: An empirical analysis of listed firms in Ghana’, The journal of risk finance, 6, 5, pp. 438-445.
Ahmad F., Juniad H., Rao U.N., Mohsin A. and Wasim U., 2011, ‘Extension of determinants of capital structure: Evidence from the Pakistani non-financial firms’, African Journal of Business Management, 5, 28, pp. 11375-11385.
Ahmed A., Joher H. and Nazrul H., 2009, ‘Revisiting Capital Structure Theory: A test of pecking order and static order trade of model from Malaysian capital market’, International Research Journal of Finance and Economics, 30, pp. 58-65.
Alizadeh A.H. and Nomikos N.K., 2009, Shipping Derivatives and Risk Management, 1st edition, Hampshire: Macmilan Publisher Limited.
Anderson T.W., and Hsiao C., 1982, ‘Formulation and estimation of dynamic models using panel data’, Journal of Econometrics, 18, 1, pp. 47-82.
Ang J., 1976, ‘The intertemporal behavior of corporate debt policy’, Journal of financial and Quantitative analysis, 11, 4 pp. 555-566.
Apergis N. and Sorros J., 2009, ‘The Role of Disaggregated Earnings for Stock Prices: Evidence from Listed Shipping Firms and Panel Tests’, International Advances in Economic Research, 16, 3, pp. 269-281.
Arellano M. and Bond S., 1991, ‘Some tests of specification for panel data: Monte Carlo evidence and an application to employment equations’, Review of Economic studies, 58, 2, pp. 277-297.
59
Dynamic Approach of Capital Structure of European Shipping Companies
Arellanno M. and O. Bover, 1995, ‘Another Look at the Instrumental Variables Estimation for Error Components Models’, Journal of Econometrics, 68, 1, pp. 29-52.
Ba ltagi B.H., 1995, Econometric analysis of panel data. New York: John Wiley & Sons.Bauer P., 2004, ‘Determinants of capital structure: Empirical Evidence from the Czech
Republic’, Czech Journal of Economics and Finance, 54, pp. 2-21. Beattie V., Goodarce A. and Thomson S.J., 2004, ‘Diversity and determinants of corporate financing decisions: Survey Evidence’, Working paper of university of Stirling, http://papers.ssrn.com/sol3/papers.cfm?abstract_id=564602, (accessed 10/11/2011).
Berger P.E., Ofek E. and Yermack D.L., 1997, ‘Managerial entrenchment and capital structure decisions’, The journal of finance, 52, pp. 1411-1438.
Bevan A.A. and Danbolt J., 2002, ‘Capital Structure and Its Determinants in the U.K.- A Decompositional Analysis’, Applied Financial Economics, 12, 3, pp. 159-170.
Bevan A.A. and Danbolt J., 2004, ‘Testing for Inconsistencies in the Estimation of UK Capital Structure Determinants’, Applied Financial Economics, 14, 1, pp. 55-66.
Blanchard O., Amighini A. and Giavazzi F., 2010, Macroeconomics a European perspective, 1st edition, England: Pearson education limited.
Booth L., Aivazian V., Demirguc-Kunt A. and Maksimovic V., 2001, ‘Capital structures in developing countries’, Journal of Finance, 36, 1, pp. 87-130.
Chaplinsky S. and Niehaus G., 1993, ‘Do inside ownership and leverage share common determinants?’, Quarterly Journal of Business Economics, 32, 4, pp. 51-65.
Chakraborty I., 2010, ‘Capital structure in an emerging stock market: The case of India’, Research in international business and finance, 24, 3, pp. 295-314.
Chang C., Lee A.C. and Lee C.F., 2009, ‘Determinants of capital structure choice: A structural equation modeling approach’, The quarterly review of economics and finance, 49, 2, pp. 197-213.
Chen J.J., 2004, ‘Determinants of capital structure of Chinese-listed companies’, The journal of Business Research, 57, 12, pp. 1341-1351.
Chung K.H., 1993, ‘Asset characteristics and corporate debt policy: An empirical Test’, Journal of Business Finance & Accounting, 20, 1, pp. 83-98.
Colin, A.C. and Trivedi P.K., 2005, Microeconometrics methods and applications. Cambridge: Cambridge university Press.
Dang V.A., 2011, ‘Leverage, Debt Maturity and firm Investment: An Empirical Analysis, Journal of Business Finance and Accounting, 38, 1-2. pp. 225-258.
De Angelo H. and Masulis R.W., 1980, ‘Optimal capital structure under corporate and personal taxation’, Journal of Financial Economics, 8, 1, pp. 3-29.
Deari F. and Deari M., 2009, ‘The determinants of Capital structure: Evidence from Macedonian listed and unlisted companies’, Stiinte Economice, 36, pp. 91-102.
Deesomsak R., Paudyal K. and Pescetto G., 2004, ‘The Determinants of Capital Structure: Evidence from the Asia Pacific Region’, Journal of Multinational Financial Management, 14, 4-5, pp. 387-405.
Degryse H., Goeij P. and Kappert P., 2010, ‘The impact of firm and industry characteristics on small firms capital structure’, Small Business Economics, 38, pp. 431-447.
60
Stavros H. Arvanitis, Irakleia S. Tzigkounaki, Theodoros V. Stamatopoulos and Eleftherios I. Thalassinos
Delcoure N., 2007, ‘The determinants of capital structure in transitional economies’, International review of economics and finance, 16, 3, pp. 400-415.
Diamond D.W., 1989, ‘Reputation acquisition in debt market’, Journal Political Economy, Vol. 97, No. 4, pp. 828-862.
Eriotis N., Vasiliou D. and Ventura-Neokosmidi Z., 2007, ‘How firm characteristics affect capital structure: an empirical study’, Managerial Finance, 33, 5, pp. 321-331.
Fama E.F. and French K.R., 2002, ‘Testing trade – off and pecking order predictions about dividends and debt’, The review of financial studies, 15, 1, pp. 1-33.
Fisher E.O., Heinkel R. and Zechner J., 1989, ‘Dynamic capital structure choice: theory and tests, Journal of Finance’, 44, 1, pp. 19-40.
Flannery M.J. and Rangan K.P., 2006, ‘Partial adjustment toward target capital structures’, Journal of Financial Economics, 79, 3, pp. 469-506.
Frank M.Z. and Goyal V.K., 2009, ‘Capital structure Decisions: Which Factors are Reliably Important?’, Financial Management, 38, 1, pp. 1-37.
Friend I. and Lang L.H.P., 1988, ‘An Empirical Test of the Impact of Managerial Self-interest on Corporate Capital Structure’, Journal of Finance, 43, 2 pp. 271-281.
Gaud P., Jani E., Hoesli M. and Bender A., 2005, ‘The Capital Structure of Swiss Companies: an Empirical Analysis Using Dynamic Panel Data’, European Financial management, 11, 1, pp. 51-69.
Glen, J., K. Lee and A. Singh, 2001, ‘Persistence of profitability and competition in emerging markets,’ Economics Letters, 72, pp. 247-253.
Goldstein R., Ju M.N. and Leland H., 2001, ‘An EBIT-based model of dynamic capital structure’, Journal of business, 74, 4, pp. 483-512.
Gow I. D., Ormazabal G. and Taylor D. J., 2007, ‘Correcting for Cross-Sectional and Time-Series Dependence in Accounting Research’, Accounting review, http://papers.ssrn.com/sol3/papers.cfm?abstract_id=1175614, (accesed: 12/11/2011).
Graham J.R. and Harvey C.R., 2001, ‘The theory and practice of corporate finance: Evidence from field’, Journal of Financial Economics, 60, 2-3, pp. 187-243.
Hansen, L. P., 1982, ‘Large Sample Properties of Generalized Method of Moments Estimators’, Econometrica, July, 50, pp. 1029-1054.
Hansen, L. P. and K. J. Singleton, 1982, ‘Generalized Instrumental Variables Estimation of Nonlinear Rational Expectations Models’, Econometrica, 50, 5, pp. 1269-86
Hall G.C., Hutchinson P.J. and Michaelas N., 2004, ‘Determinants of the capital structures of European SMEs’, Journal of Business Finance and Accounting, 31, 5-6, pp. 711-728.
Heshmati A., 2001, ‘The Dynamics of Capital Structure: Evidence from Swedish Micro and Small Firms’, SSE/EFI Working Paper Series in Economics and Finance, 440, pp. 1-35.
Holtz-Eakin, D., W. Newey and H.S. Rosen, 1988, ‘Estimating Vector Autoregressions With Panel Data’, Econometrica, 56, pp. 1371-1396.
Huang G. and Song F.M., 2006, ‘The determinants of capital structure: evidence from China’, China Economics Review, 17, 1, pp. 14-36.
Huang R. and Ritter J.R., 2009, ‘Testing Theories of Capital Structure and Estimating the
61
Dynamic Approach of Capital Structure of European Shipping Companies
Speed of Adjustment’, Journal of Financial and Quantitative Analysis, 44, 2, pp. 237-271.
Hs iao, C., 1985, ‘Benefits and limitations of panel data’, Econometrics Reviews, 4, 1, pp. 121-174.
Hsiao, C., 1986, ‘Analysis of Panel Data, Econometric Society Monographs, New York: Cambridge University Press.
Jalilvand A. and Harris R.S., 1984, ‘Corporate behavior In Adjusting To Capital Structure And Divident Targets: An Econometric Study’, The journal of Finance, 39, 1, pp. 127-145.
Jensen M.C., 1986, ‘Agency costs of free cash flow, corporate finance and takeovers’, The American Economic Review, 76, 2, pp. 323-329.
Jensen M.C. and Meckling W.H., 1976, ‘Theory of the firm: managerial behavior, agency costs and ownership structure’, Journal of financial economics, 3, 4, pp. 305-360.
Keshar J.B., 2004, ‘Determinants of Capital Structure: A case Study of Listed Companies of Nepal, The Journal of Nepalese Business Studies, 1, 1, pp. 1-13.
Kester C.W., 1986, ‘Capital and Ownership Structure: A Comparison of United States and Japanese Manufacturing Corporations’, Financial Management, 15, 1, pp. 5-16.
Khalid S., 2011, ‘Financial Reforms and Dynamics of Capital Structure Choice: A Case of Publically Listed Firms of Pakistan’, Macrothink Institute, 3, 1, pp. 1-16.
Kjelman A. and Staffan H., 1995, ‘Determinants of capital structure: Theory vs practice, Scand. Journal of Management’, 11, 2, pp. 91-102.
Kim W.S. and Sorensen E.H., 1986, ‘Evidence on the impact of the Agency Costs of Debt on Corporate Debt Policy’, Journal of financial and Quantitative Analysis, 21, 2, pp. 131-144.
Kimki A., 1997, ‘Intergenerational succession in small family business: Borrowing constraints and optimal timing of succession’, Small Business Economics, 9, pp. 309-318.
Lekarakou L.N.. and Papaspirou A., 2001, ‘Shipping Accounting, 4th edition, Piraeus: Kleinias.
Lev B. and Pekelman D., 1975, ‘A multiperiod adjustment model for the firms’ capital structure’, Journal of finance, 30, 1, pp. 75-92.
Lloyds, 2011, ‘Squeezed from all sides’, Shipping Economist, http://www.lloydslist.com/ll/sector/markets/lloyds-shipping-economist/lse-pdf/article375745.ece/BINARY/LSE-01_JULY_2011.pdf, (accesed 12/12/2011).
Lloyds, 2011, ‘Steady as she goes’, Shipping Economist, http://www.lloydslist.com/ll/sector/markets/lloyds-shipping-economist/lse-pdf/article387106.ece/BINARY/LSE-01_DECEMBER_2011.pdf, (accesed 12/12/2011).
MacKie Mason J.K., 1990, ‘Do taxes affect corporate financing decisions?’ Journal of Finance, 45, 5, pp. 1417-1493.
Maghyereh A., 2005, ‘Dynamic capital structure: Evidence from the small developing country of Jordan’, Journal of Economics and Management, 13, 1, pp. 1-32.

62
Stavros H. Arvanitis, Irakleia S. Tzigkounaki, Theodoros V. Stamatopoulos and Eleftherios I. Thalassinos
Marsch P., 1982, ‘The choice between equity and debt: an empirical study, Journal of finance, 37, 1, pp. 121-144.
Michaelas N., Chittenden F. and Poutziouris P., 1999, ‘Financial policy and capital structure choice in U.K. SMEs: Empirical evidence from company panel data’, Small Business Economics, 12, 2, pp. 113-130.
Miguel A. and Pindado J., 2001, ‘Determinants of capital structure: new evidence from Spanish panel data’, Journal of Corporate Finance, 7, 1, pp. 77-99.
Modigliani F. and Miller M.H., 1958, ‘The cost of capital, corporate finance and the theory of investment’, The American Economic Review, 48, 3, pp. 261-297.
Modigliani F. and Miller M.H., 1963, ‘Corporate income taxes and the cost of capital: A correction’, The American Economic Review, 53, pp. 433-443.
Moh’d M., Perry L.G. and Rimbey J., 1998, ‘The impact of ownership structure on corporate debt policy: a time – series cross sectional analysis’, Financial Review, 33, 3, pp. 85-98.
Moosa I., Li L. and Naughton T., 2011, ‘Robust and Fragile firm-specific determinants of the capital structure of Chinese firms’, Applied Financial Economics, 21, 18, pp. 1331-1343.
Miller M.H., 1977, ‘Debt and Taxes’, Journal of finance, 43, 2, pp. 261-275. Myers S.C., 1977, ‘Determinants of corporate borrowing’, Journal of Financial Economics,
5, 2, pp. 147-175. Myers S.C., 1984, ‘The Capital structure puzzle’, Journal of finance, 39, 3, pp. 575-592. Myers S.C. and Majluf N.S., 1984, ‘Corporate financing and investment decisions when firms have information that investors do not have’, Journal of financial economics, 13, 2, pp. 187-221.
Myers S.C., 2001, ‘Capital structure’, Journal of Economic Perspectives, 15, 2, pp. 81-102. Noulas A. and Genimakis G., 2011, ‘The determinants of capital structure: Evidence from
Greek listed companies’, Applied Financial economics, 21, 6, pp. 379-387. Omran M. and Pointon J., 2009, ‘Capital structure and firm characteristics: an empirical
analysis from Egypt’, Review of Accounting and Finance, 8, 4, pp. 454-474. Ozkan A., 2001, ‘Determinants of capital structure and adjustment to long run target:
evidence from U.K. company panel data’, Journal of Business Finance and Accounting, 28, 1-2, pp. 175-199.
Petersen M.A. and Rajan R.G., 1994. The benefits of lending relationships evidence from small business data, Journal of finance, 49, 1, pp. 3-37.
Psilaki M. and Daskalakis N., 2009, ‘Are the determinants of capital structurecountry or firm specific?’, Small Business Econ, 33, 3, pp. 319-333.
PwC, 2012, ‘Riding the storm: Global Shipping Benchmarking Analysis 2011’, Transportation and Logistics, http://www.pwc.com/gr/en/surveys/riding-the-storm-global-shipping-benchmarking-analysis2011.jhtml, (accesed 1/10/2011)
PwC, 2009, ‘Opportunities and challenges for the shipping industry’, http://www.pwc.com/gr/en/surveys/opportunities-challenges-for-shipping-industry.jhtml, (accesed 12/11/2011}.
Qui M. and La B., 2010, ‘Firm Characteristics as determinants of Capital Structures in Australia’, International Journal of the Economics of Business, 17, 3, pp. 277-287.
63
Dynamic Approach of Capital Structure of European Shipping Companies
Rajan R. and Zingales L., 1995, ‘What do we know about capital structure? Some evidence from international data’, Journal of Finance, 50, 5, pp. 1421-1460.
Ramalho J.J.S. and Silva J.V., 2009, ‘A two-part fractional regression model for the financial leverage decisions of micro, small, medium and large firms, Quantitative Finance, 9, 5, pp. 621-636.
Sabiwlsky R., 2010, ‘Non-linear modeling of target leverage with latent determinant variables-new evidence on the trade off theory’, Review of financial economics, 9, pp. 137-150.
Serrasqueiro S.M.Z. and Rogao M.C.R., 2009, ‘Capital structure of listed Portuguese companies-Determinants of debt adjustment’, Review of Accounting and Finance, 8, 1, pp. 54-75.
Serrasqueiro Z. and Nunes M., 2009, ‘Determinants of Capital Structure: Comparison of Empirical Evidence from the Use of Different Estimators’, International Journal of Applied Economics, 5, 1, pp. 14-29.
Serrasqueiro Z., 2011. Are capital structure decisions of service SMEs different? Empirical evidence from Portugal, Management research review, 34, 1, pp. 34-57.
Sjoqvist M. and Sorocka F., 2011, ‘The Global Shipping Industry’, unpublished thesis (Msc), Jonkoping International business school.
Shyam-Sunder L. and Myers S.C., 1999, ‘Testing static trade off against pecking order models of capital structure’, Journal of financial economics, 51, 2, pp. 219-244.
Sogord-Mira F., 2005, ‘How SME uniqueness affects capital structure: Evidence from a 1994-1998 Spanish data panel’, Small Business Economics, 25, 5, pp. 447-457.
Stiglitz J.E., 1969, ‘A re-examination of the Modigliani-miller theorem’, The American Economic Review, 59, 5, pp. 784-793.
Taggart R.A., 1977, ‘A model of corporate financing decisions’, Journal of finance, 32, 5, pp. 1467-1484.
Titman S., 1984, ‘The effect of Capital Structure on a Firm’s Liquidation Decision’, Journal of Financial Economics, 13, 1, pp. 137-151.
Titman S. and Wessels R., 1988, ‘The determinants of capital structure choice’, The Journal of finance, 43, 1, pp. 1-19.
UNSTAD, United Nations Conference on Trade and Development, 2011, ‘Review of Maritime Transport’, http://www.unstad.org/Templates/webflyer.asp?docid=15876&intltemlD=2068&lang=1, (accesed 30/10/2011.
Voulgaris F., Asteriou D. and Agiomirgianakis G., 2002, ‘Capital structure, asset utilization, profitability and growth in the Greek manufacturing sector’, Applied economics, 34, 11, pp. 1379-1388.
Wald J.K., 1999, ‘How firm characteristics affect capital structure: An international comparison’, Journal of financial research, 22, pp. 161-187.
Warner J.B., 1977, ‘Bankruptcy costs: Some evidence’, Journal of finance, 32, 2, pp. 337-348. Wooldridge, J.M., 2006, ‘Indroduction to econometrics, Volume Β, Athens: Edition Papazisi