Embed Size (px)
DESCRIPTION
Dynamic Compilation and Modification. CS 671 April 15, 2008. Compiler. High-Level Programming Languages. Machine Code. Error Messages. High-Level Programming Languages. Front End. Back End. Machine Code. So Far… Static Compilation. Digging Deeper…. Compiler. Error Messages. - PowerPoint PPT Presentation
Citation preview
Dynamic Compilation and Modification
CS 671April 15, 2008
2 CS 671 – Spring 2008
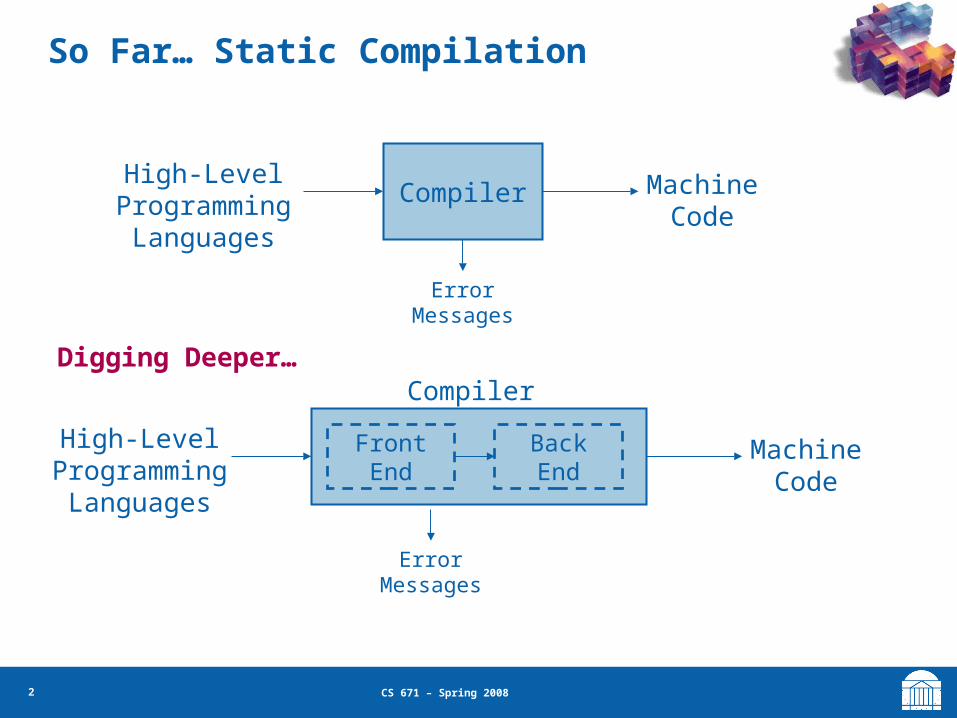
So Far… Static Compilation
CompilerHigh-Level
Programming Languages
Machine Code
Error Messages
High-Level Programming Languages
Machine Code
FrontEnd
BackEnd
Error Messages
CompilerDigging Deeper…

3 CS 671 – Spring 2008
Alternatives to the Traditional Model
Static Compilation
All work is done “ahead-of-time”
Just-in-Time Compilation
Postpone some compilation tasks
Multiversioning and Dynamic Feedback
Include multiple options in binary
Dynamic Binary Optimization
Traditional compilation model
Executables can adapt

4 CS 671 – Spring 2008
Move More of Compilation to Run Time
Execution environment may be quite different from the assumptions made at compile time
•Dynamically loaded libraries
•User inputs
•Hardware configurations
•Dependence on software vendors
•Apps on tap
•Incorporate profiling
5 CS 671 – Spring 2008
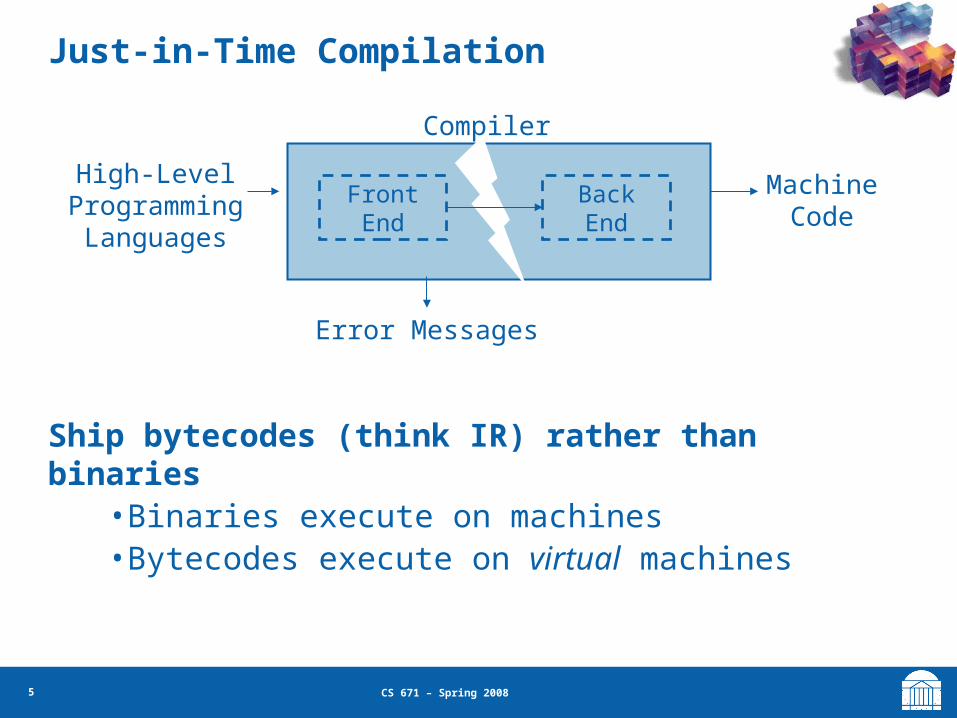
Just-in-Time Compilation
High-Level Programming Languages
Machine Code
FrontEnd
BackEnd
Error Messages
Ship bytecodes (think IR) rather than binaries• Binaries execute on machines• Bytecodes execute on virtual machines
Compiler

6 CS 671 – Spring 2008
Just-in-Time Compilation
javac the Java bytecode compiler
java the Java virtual machine
Bytecode: machine independent, portable
Step One: “Compile” Circle.java% javac Circle.java -> Circle.class
Step Two: “Execute”% java Circle.class
javacsource bytecode
javabytecode execute

7 CS 671 – Spring 2008
Each frame contains local variables and an operand stack
Instruction set• Load/store between locals and operand stack• Arithmetic on operand stack• Object creation and method invocation• Array/field accesses• Control transfers and exceptions
The type of the operand stack at each program point is known at compile time
Bytecodes

8 CS 671 – Spring 2008
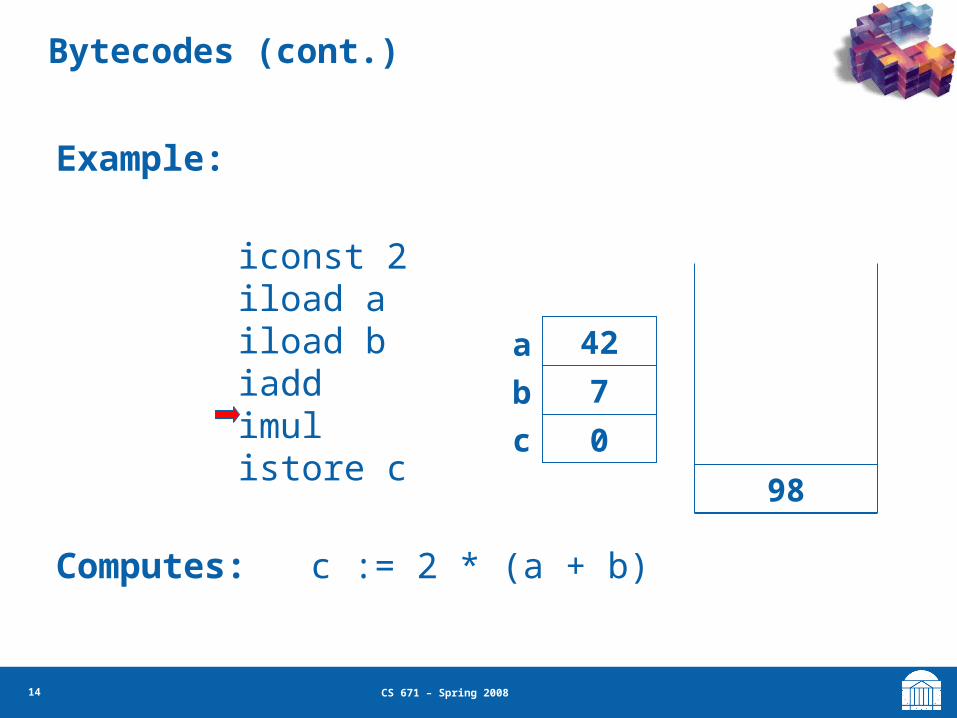
Example:
iconst 2iload aiload biaddimulistore c
Computes: c := 2 * (a + b)
Bytecodes (cont.)

9 CS 671 – Spring 2008
Example:
iconst 2iload aiload biaddimulistore c
Computes: c := 2 * (a + b)
a
b
c
42
7
0
Bytecodes (cont.)

10 CS 671 – Spring 2008
Example:
iconst 2iload aiload biaddimulistore c
Computes: c := 2 * (a + b)
a
b
c
42
7
0
2
Bytecodes (cont.)

11 CS 671 – Spring 2008
Example:
iconst 2iload aiload biaddimulistore c
Computes: c := 2 * (a + b)
a
b
c
42
7
0 42
2
Bytecodes (cont.)

12 CS 671 – Spring 2008
Example:
iconst 2iload aiload biaddimulistore c
Computes: c := 2 * (a + b)
a
b
c
42
7
0
7
42
2
Bytecodes (cont.)

13 CS 671 – Spring 2008
Example:
iconst 2iload aiload biaddimulistore c
Computes: c := 2 * (a + b)
a
b
c
42
7
0 49
2
Bytecodes (cont.)
14 CS 671 – Spring 2008
Example:
iconst 2iload aiload biaddimulistore c
Computes: c := 2 * (a + b)
a
b
c
42
7
0
98
Bytecodes (cont.)

15 CS 671 – Spring 2008
Example:
iconst 2iload aiload biaddimulistore c
Computes: c := 2 * (a + b)
a
b
c
42
7
98
Bytecodes (cont.)

16 CS 671 – Spring 2008
Executing Bytecode
java Circle.class - What happens?
Interpreting
• map each bytecode to a machine code sequence,
• for each bytecode, execute the sequence
Translation to machine code
• map all the bytecodes to machine code (or a higher level intermediate representation)
• massage them (e.g., remove redundancies)
• execute the machine code

17 CS 671 – Spring 2008
Hotspot Compilation
A hybrid approach
• Initially interpret
• Find the “hot” (frequently executed) methods
• Translate only hot methods to machine code
18 CS 671 – Spring 2008
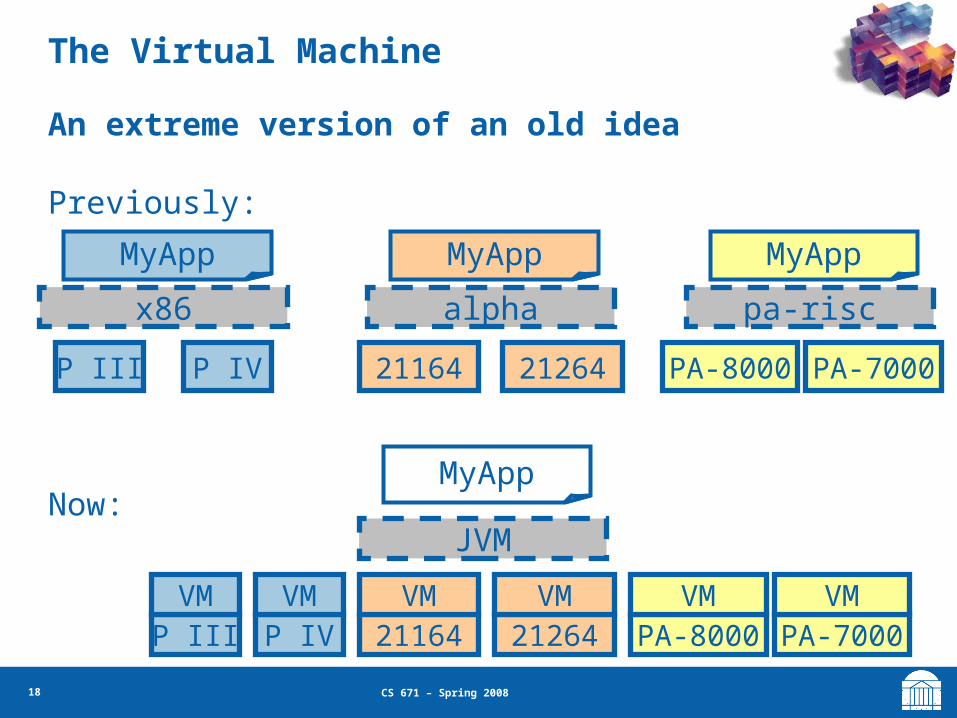
The Virtual Machine
An extreme version of an old idea
Previously:
Now:
MyApp
x86
P III P IV
MyApp
alpha
21164 21264
MyApp
pa-risc
PA-8000 PA-7000
MyApp
JVM
P III P IV 21164 21264 PA-8000 PA-7000VM VM VM VM VM VM
19 CS 671 – Spring 2008
Compile-Time Multiversioning
• Multiple versions of code sections are generated at compile-time
• Most appropriate variant is selected at runtime based upon characteristics of the input data and/or machine environment
• Multiple variants can cause code explosion
– Thus typically only a few versions are created
20 CS 671 – Spring 2008
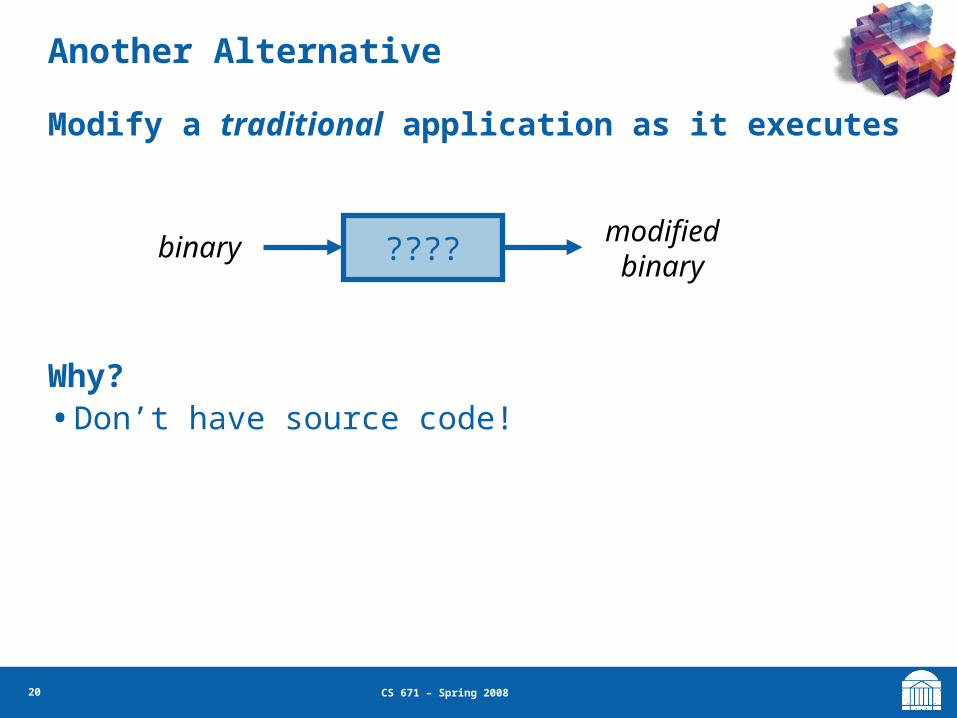
Another Alternative
Modify a traditional application as it executes
Why?• Don’t have source code!
????binary modified binary

21 CS 671 – Spring 2008
A Dynamic Optimization System?
Transforms* an application at run time
* {translate, optimize, extend}
Application
Transform
CodeCache
Execute
Profile

22 CS 671 – Spring 2008
Classification
Dynamic binary optimizers (x86 x86opt)• Complement the static compiler
– User inputs, phases, DLLs, hardware features– Examples: DynamoRIO, Mojo, Strata
Dynamic translators (x86 PPC)• Convert applications to run on a new architecture
– Examples: Rosetta, Transmeta CMS, DAISY
Binary instrumentation (x86 x86instr)• Inspect and/or add features to existing
applications– Examples: Pin, Valgrind
JITs + adaptive systems (Java bytecode x86)

23 CS 671 – Spring 2008
Dynamic Instrumentation Demo
Pin• Four architectures – IA32, EM64T, IPF, XScale• Four OSes – Linux, FreeBSD, MacOS, Windows

24 CS 671 – Spring 2008
What is Instrumentation?
A technique that inserts extra code into a program to collect runtime information
Instrumentation approaches:
• Source instrumentation:
– Instrument source programs
• Binary instrumentation:– Instrument executables directly

25 CS 671 – Spring 2008
No need to recompile or relink Discover code at runtime Handle dynamically-generated code Attach to running processes
Why use Dynamic Instrumentation?

26 CS 671 – Spring 2008
How is Instrumentation used in PL/Compiler Research?
Program analysis– Code coverage– Call-graph generation– Memory-leak detection– Instruction profiling
Thread analysis– Thread profiling– Race detection
27 CS 671 – Spring 2008
•Trace Generation
•Branch Predictor and Cache Modeling
•Fault Tolerance Studies
•Emulating Speculation
•Emulating New Instructions
How is Instrumentation used in Computer Architecture Research?

28 CS 671 – Spring 2008
Pin Features
Dynamic Instrumentation:• Do not need source code, recompilation, post-linking
Programmable Instrumentation:• Provides rich APIs to write in C/C++ your own instrumentation
tools (called Pintools)
Multiplatform:• Supports x86, x86-64, Itanium, Xscale• Supports Linux, Windows, MacOS
Robust:• Instruments real-life applications: Database, web browsers, …• Instruments multithreaded applications• Supports signals
Efficient:• Applies compiler optimizations on instrumentation code

29 CS 671 – Spring 2008
Using Pin
Launch and instrument an application $ pin –t pintool –- application
Instrumentation engine (provided in the kit)
Instrumentation tool
(write your own, or use one provided in the kit)
Attach to and instrument an application $ pin –t pintool –pid 1234
30 CS 671 – Spring 2008
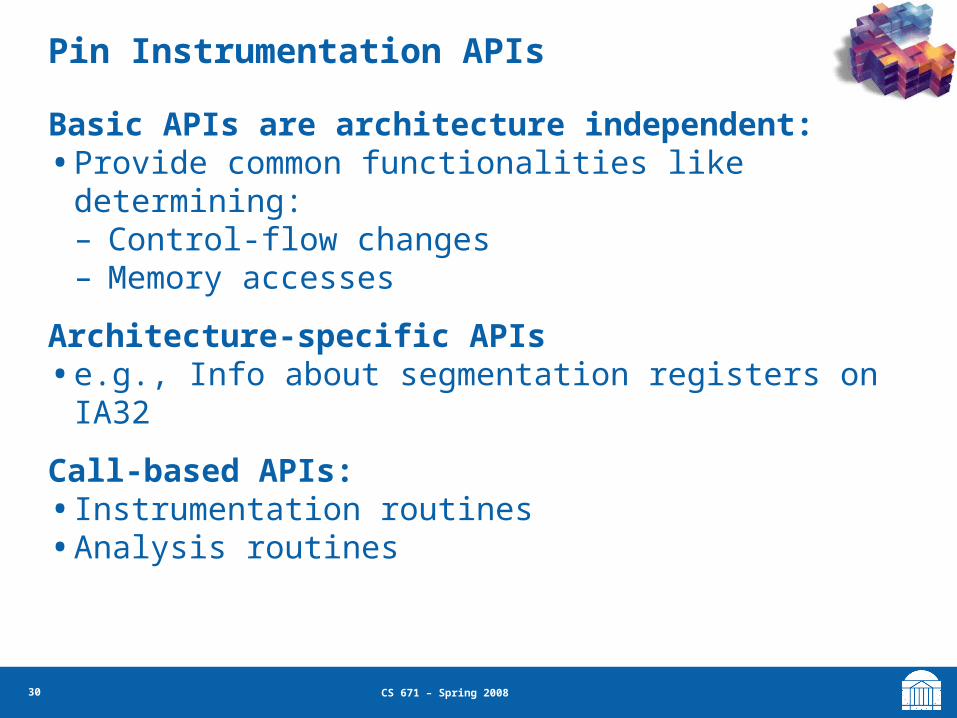
Pin Instrumentation APIs
Basic APIs are architecture independent:• Provide common functionalities like determining:
– Control-flow changes– Memory accesses
Architecture-specific APIs• e.g., Info about segmentation registers on IA32
Call-based APIs:• Instrumentation routines• Analysis routines
31 CS 671 – Spring 2008
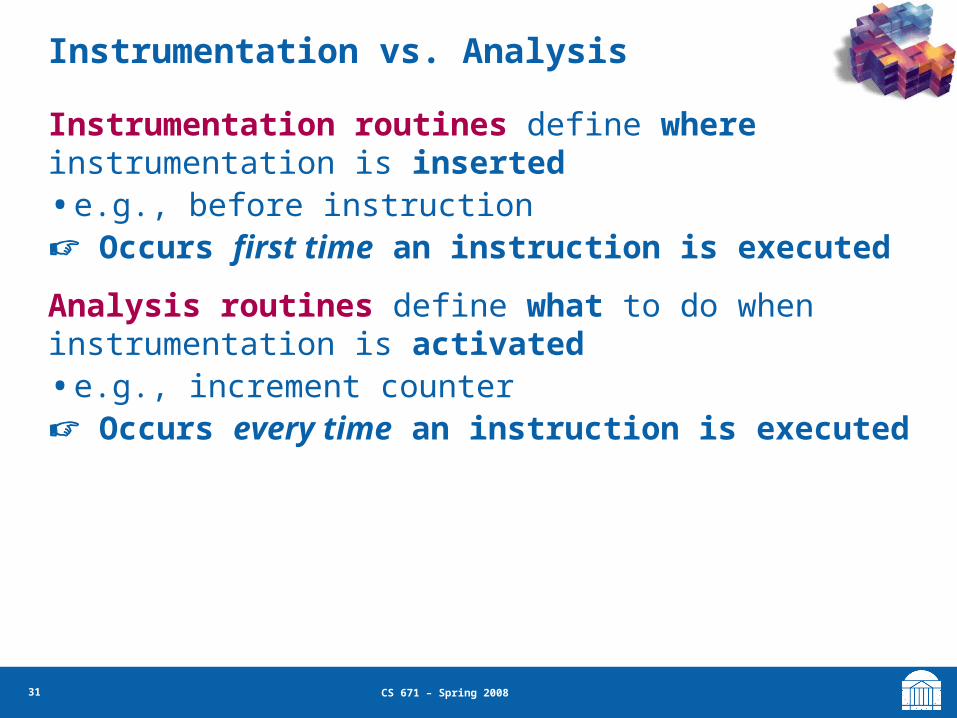
Instrumentation vs. Analysis
Instrumentation routines define where instrumentation is inserted• e.g., before instruction Occurs first time an instruction is executed
Analysis routines define what to do when instrumentation is activated• e.g., increment counter Occurs every time an instruction is executed
32 CS 671 – Spring 2008
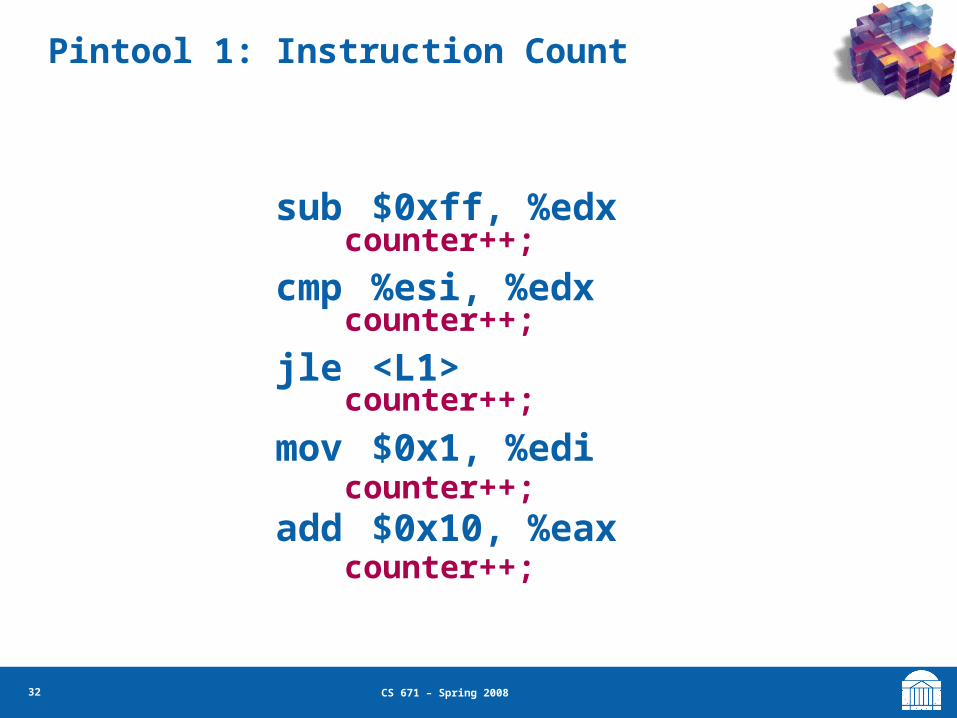
Pintool 1: Instruction Count
sub $0xff, %edx
cmp %esi, %edx
jle <L1>
mov $0x1, %edi
add $0x10, %eax
counter++;
counter++;
counter++;
counter++;
counter++;

33 CS 671 – Spring 2008
Pintool 1: Instruction Count Output
$ /bin/ls Makefile imageload.out itrace proccount imageload inscount0 atrace itrace.out
$ pin -t inscount0.so -- /bin/ls Makefile imageload.out itrace proccount imageload inscount0 atrace itrace.out
Count 422838
34 CS 671 – Spring 2008
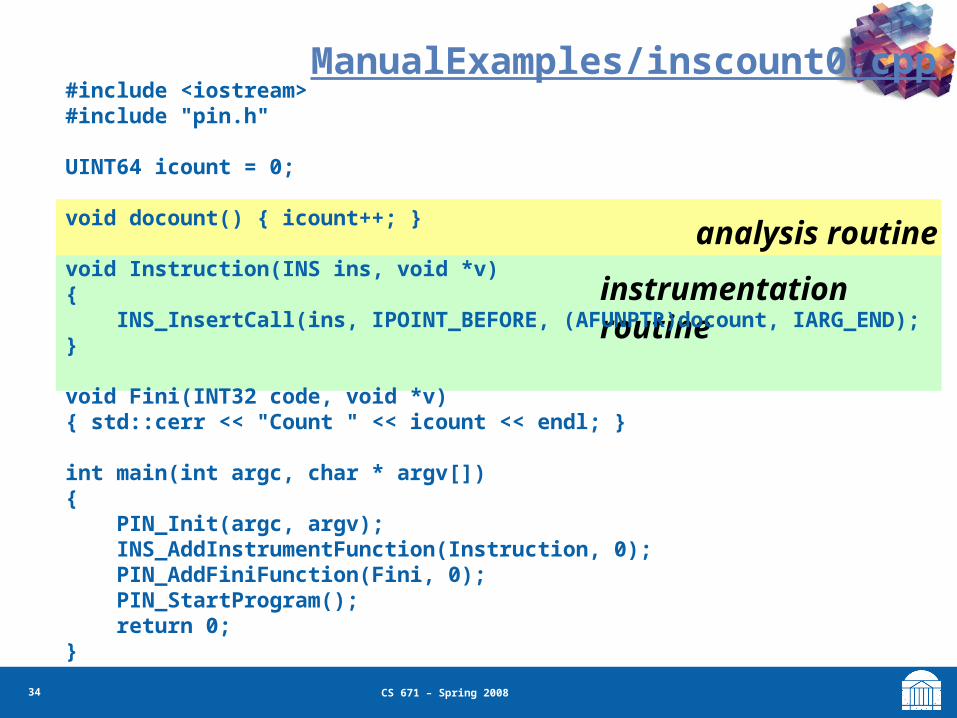
ManualExamples/inscount0.cpp
instrumentation routine
analysis routine
#include <iostream>#include "pin.h"
UINT64 icount = 0;
void docount() { icount++; } void Instruction(INS ins, void *v) { INS_InsertCall(ins, IPOINT_BEFORE, (AFUNPTR)docount, IARG_END);}
void Fini(INT32 code, void *v) { std::cerr << "Count " << icount << endl; }
int main(int argc, char * argv[]){ PIN_Init(argc, argv); INS_AddInstrumentFunction(Instruction, 0); PIN_AddFiniFunction(Fini, 0); PIN_StartProgram(); return 0;}

35 CS 671 – Spring 2008
Pintool 2: Instruction Trace
sub $0xff, %edx
cmp %esi, %edx
jle <L1>
mov $0x1, %edi
add $0x10, %eax
Print(ip);
Print(ip);
Print(ip);
Print(ip);
Print(ip);
Need to pass ip argument to the analysis routine (printip())
36 CS 671 – Spring 2008
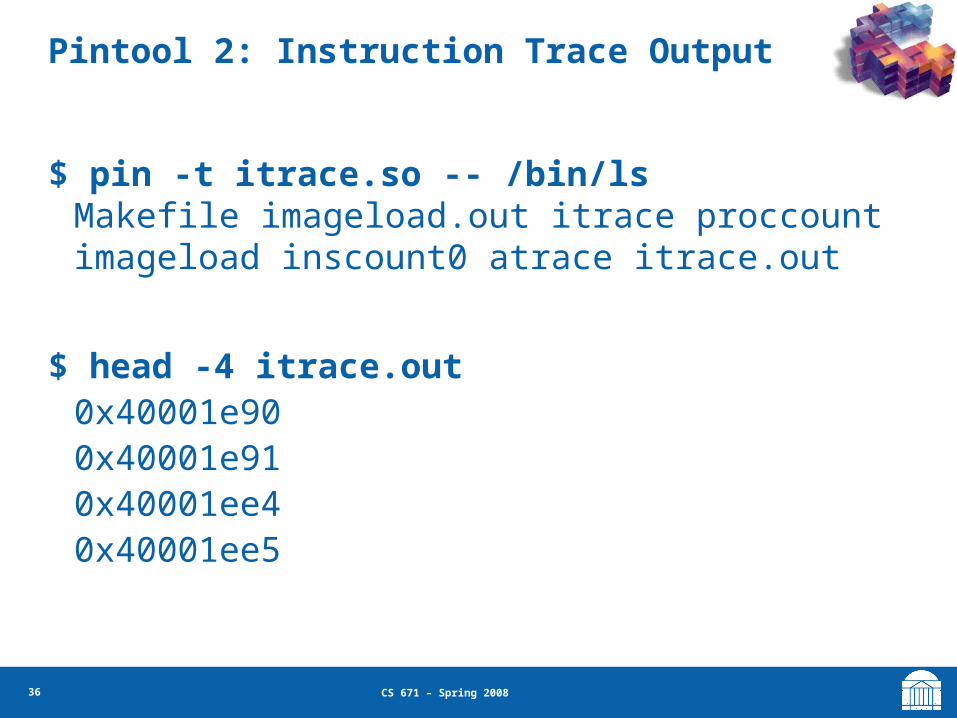
Pintool 2: Instruction Trace Output
$ pin -t itrace.so -- /bin/ls Makefile imageload.out itrace proccount imageload inscount0 atrace itrace.out
$ head -4 itrace.out 0x40001e90 0x40001e91 0x40001ee4 0x40001ee5

37 CS 671 – Spring 2008
ManualExamples/itrace.cpp
argument to analysis routine
analysis routineinstrumentation routine
#include <stdio.h>#include "pin.H"FILE * trace;void printip(void *ip) { fprintf(trace, "%p\n", ip); }
void Instruction(INS ins, void *v) { INS_InsertCall(ins, IPOINT_BEFORE, (AFUNPTR)printip, IARG_INST_PTR, IARG_END);}void Fini(INT32 code, void *v) { fclose(trace); }int main(int argc, char * argv[]) { trace = fopen("itrace.out", "w"); PIN_Init(argc, argv); INS_AddInstrumentFunction(Instruction, 0);
PIN_AddFiniFunction(Fini, 0); PIN_StartProgram(); return 0;}
38 CS 671 – Spring 2008
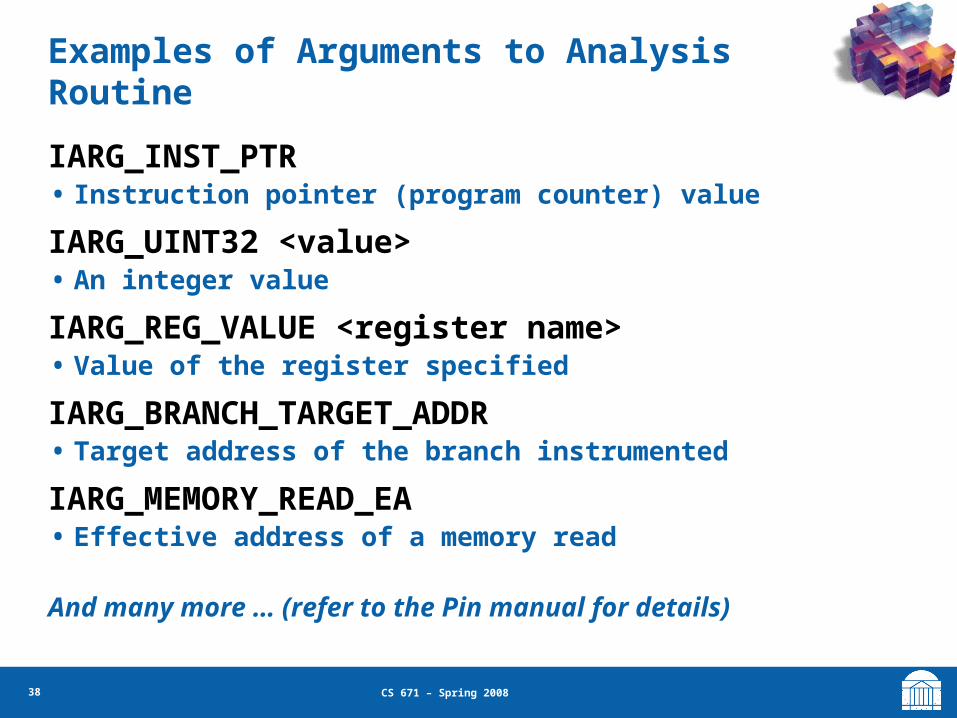
Examples of Arguments to Analysis Routine
IARG_INST_PTR• Instruction pointer (program counter) value
IARG_UINT32 <value>• An integer value
IARG_REG_VALUE <register name>• Value of the register specified
IARG_BRANCH_TARGET_ADDR• Target address of the branch instrumented
IARG_MEMORY_READ_EA• Effective address of a memory read
And many more … (refer to the Pin manual for details)

39 CS 671 – Spring 2008
Instrumentation Points
Instrument points relative to an instruction:
• Before (IPOINT_BEFORE)• After:
– Fall-through edge (IPOINT_AFTER)– Taken edge (IPOINT_TAKEN_BRANCH)
cmp %esi, %edx
jle <L1>
mov $0x1, %edi
<L1>: mov $0x8,%edi
count()
count()
count()

40 CS 671 – Spring 2008
• Instruction• Basic block
– A sequence of instructions terminated at a control-flow changing instruction
– Single entry, single exit• Trace
– A sequence of basic blocks terminated at an unconditional control-flow changing instruction
– Single entry, multiple exits
Instrumentation Granularity
sub $0xff, %edxcmp %esi, %edxjle <L1>
mov $0x1, %ediadd $0x10, %eaxjmp <L2>1 Trace, 2 BBs, 6
insts
Instrumentation can be done at three different granularities:

41 CS 671 – Spring 2008
Pintool 3: Faster Instruction Count
sub $0xff, %edx
cmp %esi, %edx
jle <L1>
mov $0x1, %edi
add $0x10, %eax
counter += 3
counter += 2basic blocks (bbl)

42 CS 671 – Spring 2008
Modifying Program Behavior
Pin allows you not only to observe but also change program behavior
Ways to change program behavior:
• Add/delete instructions
• Change register values
• Change memory values
• Change control flow
Pin Internals
44 CS 671 – Spring 2008
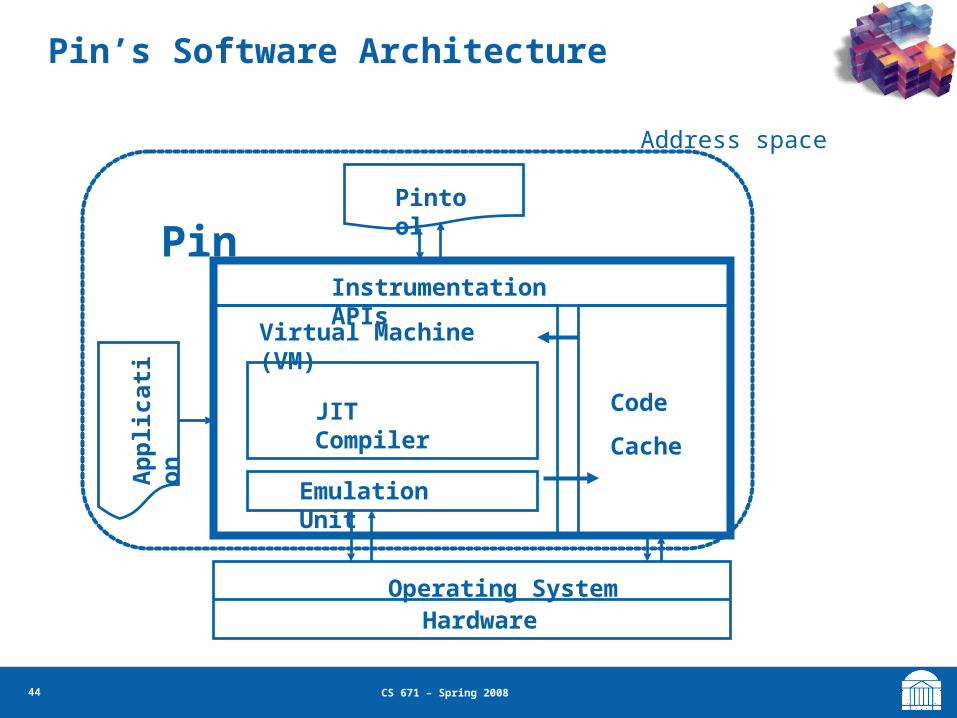
Pin’s Software Architecture
JIT Compiler
Emulation Unit
Virtual Machine (VM)
Code
Cache
Instrumentation APIs
Ap
pli
cati
on
Operating SystemHardware
PinPintool
Address space

45 CS 671 – Spring 2008
Dynamic Instrumentation
Original codeCode cache
Pin fetches trace starting block 1 and start instrumentation
7’
2’
1’
Pin
2 3
1
7
45
6
Exits point back to Pin

46 CS 671 – Spring 2008
Dynamic Instrumentation
Original codeCode cache
Pin transfers control intocode cache (block 1)
2 3
1
7
45
67’
2’
1’
Pin

47 CS 671 – Spring 2008
Dynamic Instrumentation
Original codeCode cache
7’
2’
1’
PinPin fetches and instrument a new trace
6’
5’
3’trace linking
2 3
1
7
45
6

48 CS 671 – Spring 2008
Implementation Challenges
• Linking– Straightforward for direct branches– Tricky for indirects, invalidations
• Re-allocating registers
• Maintaining transparency
• Self-modifying code
• Supporting MT applications…
49 CS 671 – Spring 2008
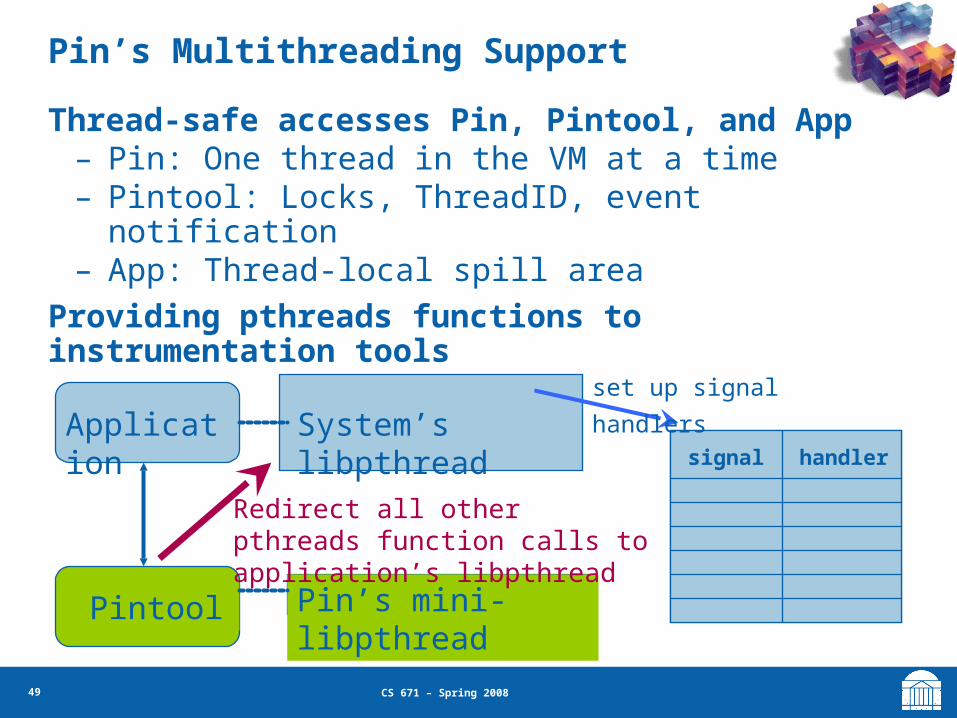
Thread-safe accesses Pin, Pintool, and App– Pin: One thread in the VM at a time– Pintool: Locks, ThreadID, event notification– App: Thread-local spill area
Providing pthreads functions to instrumentation tools
Pin’s Multithreading Support
Pintool
Application
System’s libpthread signal handlersignal handler
set up signal
handlers
Pin’s mini-libpthread
Redirect all other pthreads function calls to application’s libpthread

50 CS 671 – Spring 2008
Pin Overhead
SPEC Integer 2006
100%
120%
140%
160%
180%
200%
perlb
ench
sjen
g
xala
ncbm
k
gobm
k
gcc
h264
ref
omne
tpp
bzip
2
libqu
antu
m mcf
asta
r
hmm
er
Rel
ativ
e to
Nat
ive

51 CS 671 – Spring 2008
Adding User Instrumentation
100%
200%
300%
400%
500%
600%
700%
800%
perlb
ench
sjen
g
xala
ncbm
k
gobm
k
gcc
h264
ref
omne
tpp
bzip
2
libqu
antu
m mcf
asta
r
hmm
er
Rel
ativ
e to
Nat
ive Pin
Pin+icount

52 CS 671 – Spring 2008
Dynamic Optimization Summary
Complement the static compiler• Shouldn’t compete with static compilers• Observe execution pattern• Optimize frequently executed code
– Optimization overhead could degrade performance
Exploits opportunities• Arise only at runtime
– DLLs– Runtime constants– Hardware features, user patterns, etc.
• Too expensive to fully exploit statically– Path-sensitive optimizations