Embed Size (px)
Citation preview
Bell et al., Sci. Adv. 2021; 7 : eabh0894 24 September 2021
S C I E N C E A D V A N C E S | R E S E A R C H A R T I C L E
1 of 9
G E O P H Y S I C S
Dynamic earthquake triggering response tracks evolving unrest at Sierra Negra volcano, Galápagos IslandsAndrew F. Bell1*, Stephen Hernandez2, John McCloskey1, Mario Ruiz2, Peter C. LaFemina3, Christopher J. Bean4, Martin Möllhoff4
The propensity for dynamic earthquake triggering is thought to depend on the local stress state and amplitude of the stress perturbation. However, the nature of this dependency has not been confirmed within a single crustal volume. Here, we show that at Sierra Negra volcano, Galápagos Islands, the intensity of dynamically triggered earthquakes increased as inflation of a magma reservoir elevated the stress state. The perturbation of short-term seismicity within teleseismic surface waves also increased with peak dynamic strain. Following rapid coeruptive subsidence and reduction in stress and background seismicity rates, equivalent dynamic strains no longer trig-gered detectable seismicity. These findings offer direct constraints on the primary controls on dynamic triggering and suggest that the response to dynamic stresses may help constrain the evolution of volcanic unrest.
INTRODUCTIONDynamic stress perturbations result from the radiation of seismic waves from a source rupture (1, 2). Earthquakes triggered by dynamic stress perturbations (3–5) have been observed thousands of kilometers away from the source (6–8), well beyond the reach of static stress perturbations (9, 10). Although the mechanisms underpinning dy-namic triggering remain enigmatic (5), earthquakes are more likely to be triggered on faults already close to failure (5). Therefore, as well as playing an important role in controlling earthquake sequences (3), dynamic triggering also offers a means to probe the stress state of the subsurface (11, 12). To do this, however, it requires knowl-edge of the triggering response as a function of stress state and stress perturbation. Efforts to quantify this behavior have relied on statis-tical studies of the response to many triggering earthquakes in many different crustal volumes (8, 13–15). As it is difficult to measure directly, seismicity rates are commonly used as a proxy for the state of stress, with high seismicity rates corresponding to a large number of faults close to failure (11). However, generally, the background stress state (shear stress or pore fluid pressure) does not change sub-stantially during the observation window. Consequently, it is chal-lenging to undertake a longitudinal study of the same region over an extended period at different stress states.
Dynamic triggering of seismicity at volcanoes is well known (4–6, 16–20). As some volcanoes experience rapid, high-amplitude changes in stress due to magma accumulation and withdrawal, they potentially offer good conditions to study the factors that influence dynamic triggering. However, the non-Poissonian, swarm-like, nature of much volcanic seismicity means that triggering responses can be difficult to detect and quantify. So far, no evidence has been reported for a systematic dependence of the triggering response at volcanoes on either the background earthquake rate or amplitude of the dynamic stress perturbations (4).
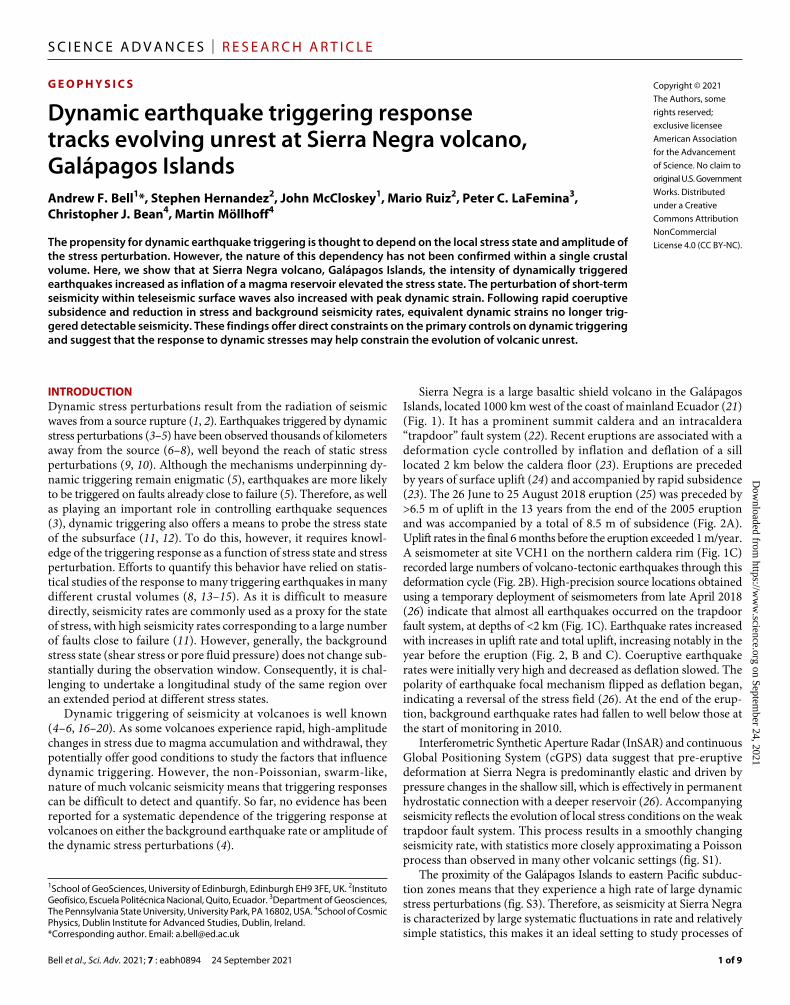
Sierra Negra is a large basaltic shield volcano in the Galápagos Islands, located 1000 km west of the coast of mainland Ecuador (21) (Fig. 1). It has a prominent summit caldera and an intracaldera “trapdoor” fault system (22). Recent eruptions are associated with a deformation cycle controlled by inflation and deflation of a sill located 2 km below the caldera floor (23). Eruptions are preceded by years of surface uplift (24) and accompanied by rapid subsidence (23). The 26 June to 25 August 2018 eruption (25) was preceded by >6.5 m of uplift in the 13 years from the end of the 2005 eruption and was accompanied by a total of 8.5 m of subsidence (Fig. 2A). Uplift rates in the final 6 months before the eruption exceeded 1 m/year. A seismometer at site VCH1 on the northern caldera rim (Fig. 1C) recorded large numbers of volcano-tectonic earthquakes through this deformation cycle (Fig. 2B). High-precision source locations obtained using a temporary deployment of seismometers from late April 2018 (26) indicate that almost all earthquakes occurred on the trapdoor fault system, at depths of <2 km (Fig. 1C). Earthquake rates increased with increases in uplift rate and total uplift, increasing notably in the year before the eruption (Fig. 2, B and C). Coeruptive earthquake rates were initially very high and decreased as deflation slowed. The polarity of earthquake focal mechanism flipped as deflation began, indicating a reversal of the stress field (26). At the end of the erup-tion, background earthquake rates had fallen to well below those at the start of monitoring in 2010.
Interferometric Synthetic Aperture Radar (InSAR) and continuous Global Positioning System (cGPS) data suggest that pre-eruptive deformation at Sierra Negra is predominantly elastic and driven by pressure changes in the shallow sill, which is effectively in permanent hydrostatic connection with a deeper reservoir (26). Accompanying seismicity reflects the evolution of local stress conditions on the weak trapdoor fault system. This process results in a smoothly changing seismicity rate, with statistics more closely approximating a Poisson process than observed in many other volcanic settings (fig. S1).
The proximity of the Galápagos Islands to eastern Pacific subduc-tion zones means that they experience a high rate of large dynamic stress perturbations (fig. S3). Therefore, as seismicity at Sierra Negra is characterized by large systematic fluctuations in rate and relatively simple statistics, this makes it an ideal setting to study processes of
1School of GeoSciences, University of Edinburgh, Edinburgh EH9 3FE, UK. 2Instituto Geofísico, Escuela Politécnica Nacional, Quito, Ecuador. 3Department of Geosciences, The Pennsylvania State University, University Park, PA 16802, USA. 4School of Cosmic Physics, Dublin Institute for Advanced Studies, Dublin, Ireland.*Corresponding author. Email: [email protected]
Copyright © 2021 The Authors, some rights reserved; exclusive licensee American Association for the Advancement of Science. No claim to original U.S. Government Works. Distributed under a Creative Commons Attribution NonCommercial License 4.0 (CC BY-NC).
Dow
nloaded from https://w
ww
.science.org on September 24, 2021
Bell et al., Sci. Adv. 2021; 7 : eabh0894 24 September 2021
S C I E N C E A D V A N C E S | R E S E A R C H A R T I C L E
2 of 9
dynamic earthquake triggering at volcanoes. In this study, we identify episodes of dynamic triggering at Sierra Negra and then seek to quantify the triggering response to different amplitude stress per-turbations at different volcanic unrest states.
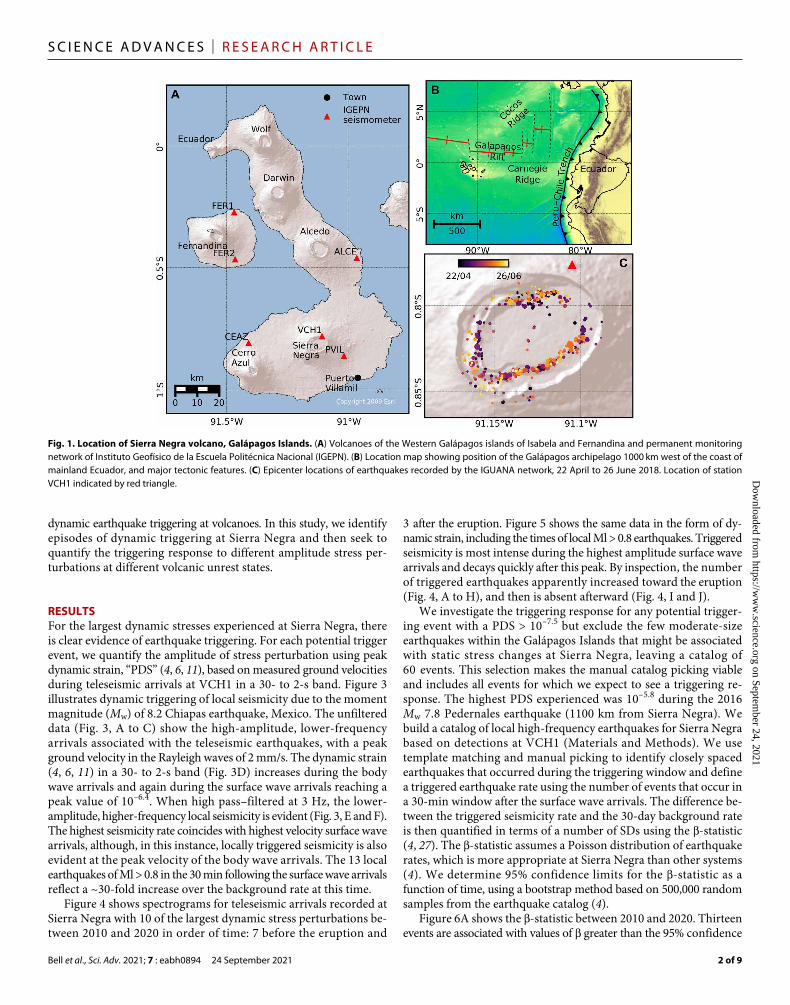
RESULTSFor the largest dynamic stresses experienced at Sierra Negra, there is clear evidence of earthquake triggering. For each potential trigger event, we quantify the amplitude of stress perturbation using peak dynamic strain, “PDS” (4, 6, 11), based on measured ground velocities during teleseismic arrivals at VCH1 in a 30- to 2-s band. Figure 3 illustrates dynamic triggering of local seismicity due to the moment magnitude (Mw) of 8.2 Chiapas earthquake, Mexico. The unfiltered data (Fig. 3, A to C) show the high-amplitude, lower-frequency arrivals associated with the teleseismic earthquakes, with a peak ground velocity in the Rayleigh waves of 2 mm/s. The dynamic strain (4, 6, 11) in a 30- to 2-s band (Fig. 3D) increases during the body wave arrivals and again during the surface wave arrivals reaching a peak value of 10–6.4. When high pass–filtered at 3 Hz, the lower- amplitude, higher-frequency local seismicity is evident (Fig. 3, E and F). The highest seismicity rate coincides with highest velocity surface wave arrivals, although, in this instance, locally triggered seismicity is also evident at the peak velocity of the body wave arrivals. The 13 local earthquakes of Ml > 0.8 in the 30 min following the surface wave arrivals reflect a ~30-fold increase over the background rate at this time.
Figure 4 shows spectrograms for teleseismic arrivals recorded at Sierra Negra with 10 of the largest dynamic stress perturbations be-tween 2010 and 2020 in order of time: 7 before the eruption and
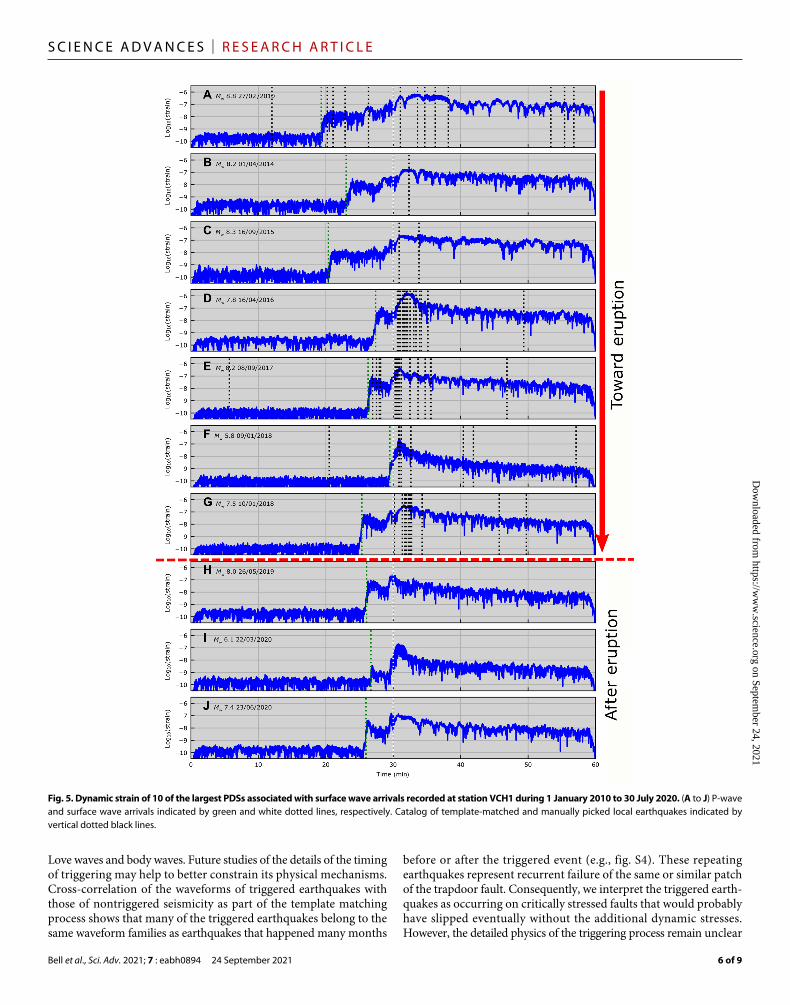
3 after the eruption. Figure 5 shows the same data in the form of dy-namic strain, including the times of local Ml > 0.8 earthquakes. Triggered seismicity is most intense during the highest amplitude surface wave arrivals and decays quickly after this peak. By inspection, the number of triggered earthquakes apparently increased toward the eruption (Fig. 4, A to H), and then is absent afterward (Fig. 4, I and J).
We investigate the triggering response for any potential trigger-ing event with a PDS > 10–7.5 but exclude the few moderate-size earthquakes within the Galápagos Islands that might be associated with static stress changes at Sierra Negra, leaving a catalog of 60 events. This selection makes the manual catalog picking viable and includes all events for which we expect to see a triggering re-sponse. The highest PDS experienced was 10–5.8 during the 2016 Mw 7.8 Pedernales earthquake (1100 km from Sierra Negra). We build a catalog of local high-frequency earthquakes for Sierra Negra based on detections at VCH1 (Materials and Methods). We use template matching and manual picking to identify closely spaced earthquakes that occurred during the triggering window and define a triggered earthquake rate using the number of events that occur in a 30-min window after the surface wave arrivals. The difference be-tween the triggered seismicity rate and the 30-day background rate is then quantified in terms of a number of SDs using the -statistic (4, 27). The -statistic assumes a Poisson distribution of earthquake rates, which is more appropriate at Sierra Negra than other systems (4). We determine 95% confidence limits for the -statistic as a function of time, using a bootstrap method based on 500,000 random samples from the earthquake catalog (4).
Figure 6A shows the -statistic between 2010 and 2020. Thirteen events are associated with values of greater than the 95% confidence
Fig. 1. Location of Sierra Negra volcano, Galápagos Islands. (A) Volcanoes of the Western Galápagos islands of Isabela and Fernandina and permanent monitoring network of Instituto Geofísico de la Escuela Politécnica Nacional (IGEPN). (B) Location map showing position of the Galápagos archipelago 1000 km west of the coast of mainland Ecuador, and major tectonic features. (C) Epicenter locations of earthquakes recorded by the IGUANA network, 22 April to 26 June 2018. Location of station VCH1 indicated by red triangle. D
ownloaded from
https://ww
w.science.org on Septem
ber 24, 2021

Bell et al., Sci. Adv. 2021; 7 : eabh0894 24 September 2021
S C I E N C E A D V A N C E S | R E S E A R C H A R T I C L E
3 of 9
limit, all but one before the onset of the 2018 eruption, although some with low absolute numbers of earthquakes in the triggering window. In Figure 6B, the rate of triggered earthquakes is generally higher for events with larger PDS. In particular, events in later 2017 and early 2018 with PDS ~10–6.5 are associated with higher rates than larger events in 2010 and 2016. Figure 6C illustrates the response in terms of the -statistic, thus accounting for changing background seismicity rate. Above a PDS of ~10–6.8, the -statistic apparently increases linearly with log10PDS. We can see that the higher triggered seismicity rates during the 2017 and 2018 earthquakes are due to the combination of high PDS and the elevated background seismicity rates as the eruption approached. At lower PDS, some events have values of the -statistic above 0 but less than 10. These are associated with single earthquakes during the 30-min triggering window.
At the time of writing, there have been three earthquakes associ-ated with PDS exceeding 10–6.8 since the end of the eruption on 25 August 2018. No triggering is evident for any of these events by inspection (e.g., Figs. 4 and 5, H to J).The largest PDS after the erup-tion was 10–6.5 associated with the 26 May 2019 Mw 8.0 Lagunas earthquake in Peru (Figs. 4 and 5H). The density of data from avail-able observations is not sufficient to confidently constrain any par-ticular relation between PDS and . However, if we assume a linear relation between log10PDS and the -statistic consistent with the available data, then we would predict a -statistic of ~10 for this event. With the low rates of seismicity at that time, this value of would correspond to a predicted 30-min earthquake rate of 1.4 events, and the probability of observing no earthquakes is 25%. Consequently,
our observation of no triggered earthquakes for this event would be consistent with a constant relation between and PDS before and after the eruption.
If we assume this speculative linear relation between log10PDS and the -statistic, then using the observed number of triggered earthquakes for a known PDS, we can make predictions as to what would be a corresponding background rate of earthquakes. This re-lation needs more data points to be sufficiently constrained, but an example prediction of background rates, and the observed values, are shown in Fig. 6D.
DISCUSSIONOur observations suggest that dynamic stress perturbations with larger peak dynamic strains resulted in a larger triggering response in terms of the rate change of volcano-tectonic seismicity, measured by the - statistic. As the -statistic is a measure of rate change relative to the background rate of seismicity, this observation also implies that, for a given dynamic stress perturbation, a greater absolute number of earthquakes are triggered if the background rate of seismicity is high (e.g., immediately before the eruption) than if it is low (e.g., after the eruption). We find no evidence to suggest that the physics of the triggering process changed after the deflation and relaxation accompanying the eruption; the absence of triggering after the eruption is entirely consistent with a drop in the background rate of seismicity, as fewer faults are close to failure. To our knowledge, this is the first time that such a relation has been observed at a volcano.
Fig. 2. Geophysical unrest at Sierra Negra, 2010–2020. (A) Total inflation at the center of the caldera measured by cGPS. Vertical green dashed line indicates time of eruption onset. (B) Magnitudes (blue circles) and total number of M > 0.8 earthquakes (red line) detected at VCH1. (C) Thirty-day “background” rate of earthquakes. Scale is clipped at 1200 to exclude very high rates of earthquakes accompanying the eruption.
Dow
nloaded from https://w
ww
.science.org on September 24, 2021
Bell et al., Sci. Adv. 2021; 7 : eabh0894 24 September 2021
S C I E N C E A D V A N C E S | R E S E A R C H A R T I C L E
4 of 9
In this context, we argue that the triggering response probably tracks the stress state of Sierra Negra. Hence, observations of dynamic triggering at volcanoes could provide additional evidence for ele-vated volcanic unrest, alongside more dependable measures such as the rate of seismicity and deformation at a volcano.
We only observe convincing evidence for dynamic earthquake triggering at Sierra Negra for events with PDS > 10–6.8 and, even then, only when the rates of seismicity are elevated before the eruption.
These are quite large strains. For example, dynamic triggering has been reported at more than two orders of magnitude smaller strains albeit using a statistically aggregated interevent time ratio within a large regional catalog (15). We have no evidence whether 10–6.8 is a real physical threshold below which triggering does not occur at Sierra Negra, or, more likely, a detection limit dependent on the background rate of seismicity. Such evidence will statistically emerge as many more moderate-sized triggering events are documented,
Fig. 3. Seismic data recorded at station VCH1 during arrivals of Mw 8.2 Chiapas earthquake, Mexico, 8 September 2017. (A) Vertical (HHZ), (B) radial (HHR), and (C) tangential (HHT) components. P-wave and surface wave arrivals indicated by green and white dotted lines, respectively. (D) Dynamic strain. (E) Data high pass–filtered at 3 Hz. Dashed vertical light blue lines indicate times of local earthquakes in our template-matched and manually picked catalog (Methods and Materials). (F) Spectrogram of data.
Dow
nloaded from https://w
ww
.science.org on September 24, 2021

Bell et al., Sci. Adv. 2021; 7 : eabh0894 24 September 2021
S C I E N C E A D V A N C E S | R E S E A R C H A R T I C L E
5 of 9
ideally at high seismicity rates during the approach to eruption. Although we suggest a potential logarithmic relation between and PDS, more data are needed to test this model, and alternatives (such as a step function) cannot be excluded from these available data. We await more large earthquakes to test and build on our observa-tions here.
All the evidence for earthquake triggering at Sierra Negra is associated with the highest surface wave (and exceptionally, body wave) amplitudes and their immediate aftermath. We see no evi-dence for delayed triggering in these data. The most intense triggering coincides with the highest velocities recorded during the Rayleigh wave arrivals, but there is evidence for triggered seismicity in the
Fig. 4. Spectrograms of the vertical component of 10 of the largest PDSs associated with surface wave arrivals recorded at station VCH1 during 1 January 2010 to 30 July 2020. (A to J) P-wave and surface wave arrivals indicated by green and white dashed lines, respectively. All spectrograms use the same color scale. Note the prominent T-phases in (B), (C), (E), (I), and (J).
Dow
nloaded from https://w
ww
.science.org on September 24, 2021
Bell et al., Sci. Adv. 2021; 7 : eabh0894 24 September 2021
S C I E N C E A D V A N C E S | R E S E A R C H A R T I C L E
6 of 9
Love waves and body waves. Future studies of the details of the timing of triggering may help to better constrain its physical mechanisms. Cross-correlation of the waveforms of triggered earthquakes with those of nontriggered seismicity as part of the template matching process shows that many of the triggered earthquakes belong to the same waveform families as earthquakes that happened many months
before or after the triggered event (e.g., fig. S4). These repeating earthquakes represent recurrent failure of the same or similar patch of the trapdoor fault. Consequently, we interpret the triggered earth-quakes as occurring on critically stressed faults that would probably have slipped eventually without the additional dynamic stresses. However, the detailed physics of the triggering process remain unclear
Fig. 5. Dynamic strain of 10 of the largest PDSs associated with surface wave arrivals recorded at station VCH1 during 1 January 2010 to 30 July 2020. (A to J) P-wave and surface wave arrivals indicated by green and white dotted lines, respectively. Catalog of template-matched and manually picked local earthquakes indicated by vertical dotted black lines.
Dow
nloaded from https://w
ww
.science.org on September 24, 2021

Bell et al., Sci. Adv. 2021; 7 : eabh0894 24 September 2021
S C I E N C E A D V A N C E S | R E S E A R C H A R T I C L E
7 of 9
and are likely to be more complex than simply a shear stress increase on a fault close to failure.
The prolonged accumulation of magma in the shallow edifice before the 2018 eruption drove predominantly elastic deformation, probably increasing the shear stress on faults within the weak trap-door fault system (28). These elevated shear stresses meant that more faults were close to failure, and seismicity rates were high. Shear stresses relaxed during the eruption, and the posteruption seismicity rate was low (and remains low at the time or writing). Although pore pressure is clearly important in controlling seismicity, there is no indication that the hydrothermal system underwent substantial sys-tematic changes at Sierra Negra before or after the eruption. Therefore, to first order, we believe that changes in shear stress on the trapdoor fault system are controlling the evolving background seismicity rates at Sierra Negra.
It is not clear whether Sierra Negra is particularly sensitive to dynamic triggering, i.e., whether the values of the -statistic are par-ticularly high for a given PDS compared to other volcanoes or tectonic areas. During the same period, no triggering responses were
observed at any of the other Galápagos Island volcanoes. However, at the most likely candidate volcanoes, seismicity rates were generally lower than at Sierra Negra, and the nearest seismometers are located >10 km away from the edge of the caldera (fig. S2), so any triggered earthquakes might not be detectable. We hope that this work moti-vates future systematic studies of dynamic earthquake triggering in volcanic settings, including the deployment of dense monitoring networks to detect and locate low-magnitude seismicity.
MATERIALS AND METHODSSeismic dataBecause of the remote location of Sierra Negra, the extent of seismic monitoring at the volcano has been limited. A permanent regional network operated by the Instituto Geofísico de la Escuela Politécnica Nacional (IGEPN) was installed in late 2012 (25, 29) and used to construct a seismic catalog for the Galapagos. The IGEPN broadband station “VCH1” is located at Volcan Chico on the northeast rim of the caldera and provides an excellent record of seismicity at Sierra Negra (Fig. 1A). The station GS09 of the SIGNET campaign deploy-ment (30) was located at the same site as VCH1, extending the record of seismicity back to early 2010. In late April 2018, a dense campaign network (IGUANA) was installed at Sierra Negra, recording the seismicity associated with final approach to eruption, the eruption and deflation, and renewed inflation. Gaps exist in the data between 2011 and 2012, after the SIGNET campaign deployment and before the IGEPN permanent network was installed. Substantial gaps due to instrument or network failure are present in 2013, 2015, and 2016. The 2018 eruption began on 26 June and finished on 25 August. A continuous GPS network recorded the surface deformation across the caldera through this time (Fig. 2A).
The large distances between stations in the IGEPN seismic net-work means that earthquake locations have substantial uncertainty and the detection threshold is high. Most small earthquakes are only recorded on the nearest station. Since 2010, seismicity in the Galapagos was numerically dominated by events located at Sierra Negra, apart from a small number of short-lived episodes associated with erup-tions at La Cumbre volcano, Fernandina Island (25), and an intru-sion at Cerro Azul volcano in 2017 (fig. S2). Outside these times, high-frequency earthquakes detected at VCH1 are almost all associated with the unrest at Sierra Negra. Therefore, VCH1 provides an excellent record of seismicity at Sierra Negra, even though it is not possible to determine precise locations. Almost all seismicity recorded by the IGUANA deployment is located on the trapdoor fault system within the caldera (Fig. 1C). The characteristics of seismicity recorded at VCH1 from 2010 are similar to those recorded during the IGUANA deployment (frequency content, s-p times, etc.), supporting our contention that most of the seismicity detected at VCH1 from 2010 is also located on the trapdoor fault system.
We initially identify the 500 largest candidate trigger earthquakes at Sierra Negra in the global U.S. Geological Survey catalog using a surface wave amplitude-distance relation (fig. S3). We exclude events within 200 km of the volcano to avoid any potential static stress trig-gering effects. For each candidate event, we then measure the actual peak ground velocities for the surface waves at VCH1 in a 30- to 2-s band. We use these velocities to estimate peak dynamic stress and strain (6) associated with each potential trigger event. During method development, we compare strain estimates based on single compo-nents of the data (radial, transverse, and vertical), root mean square
Fig. 6. Statistics of dynamic triggering at Sierra Negra from 2010 to 2020. (A) -statistic of seismicity associated with large teleseismic earthquakes. Size of circle indicates PDS during surface waves arrivals. Horizontal black lines represent the time- dependent bootstrapped 95% confidence limit for -statistic. Light gray shading indicates seismic data gaps. Color indicates time through the sequences, with red points after the end of the eruption on 25 August 2018. Vertical red dashed line indicates onset of eruption. (B) Earthquake rate and (C) -statistic during sur-face wave window as a function of PDS. Colors correspond to those in top panel. (D) Predicted (circles) and observed (blue line) 30-day background rate.
Dow
nloaded from https://w
ww
.science.org on September 24, 2021
Bell et al., Sci. Adv. 2021; 7 : eabh0894 24 September 2021
S C I E N C E A D V A N C E S | R E S E A R C H A R T I C L E
8 of 9
as opposed to peak values, and measures of displacement, velocity and acceleration. In all cases, we find similar results to PDS and, so for consistency with previous studies (4, 6, 15), use this as our measure of the triggering amplitude. We select the 60 events with the largest PDSs (PDS > 10–7.5).
We use an Short-term Average/Long-term Average (STA/LTA) algorithm, implemented in ObsPy (31), to detect local high-frequency earthquakes over 10 years of data at GS09 and VCH1. We first band-pass the data between 5 and 10 Hz. To define an event, we require a trigger on all three components. We then remove any events with anomalous frequency content and very short trigger durations. We also remove any events with very short interevent times (<10 s), within the typical waveform duration. We have visually verified the high reliability of the algorithm on hundreds of events.
To supplement the STA/LTA detections during high rates of seismicity coincident with high-amplitude surface wave arrivals, we use a template-matching methodology (32, 33) to identify masked or overlapping events. We use ~15,000 10-s duration templates from our detected event catalog (not considering the coeruptive events where the stress field reversed). We cross-correlate each of these events with a 1-hour window encompassing each stressing event (30 min before and 30 min after the surface wave arrivals). We specify a cross-correlation value of >0.6 and an interearthquake separation of >5 s to identify an event. We then manually pick these data, inspecting each STA/LTA and template-matched pick and adding new picks where appropriate. The template-matching method does detect some additional events during the highest rates of seismicity. Manual picking adds more and removes a small number of erroneous picks. Most of the detected events are small and below the magni-tude threshold of 0.8.
For each event, we determine the root mean square amplitude of the vertical component of the velocity in a 10-s window around the peak amplitude, in a 1- to 20-Hz frequency band. We then estimate a magnitude, based on a linear calibration of log10 (amplitude) against the magnitude of located events in the IGUANA catalog, incorpo-rating an empirical relation between amplitude attenuation and epicentral distance.
We estimate a completeness magnitude of 0.8 for our catalog of high-frequency earthquake detections at Sierra Negra (fig. S1, C and D). We apply a range of methods for estimating the completeness mag-nitude, including the b value stability test (34, 35). During the highest rates of seismicity before the eruption, the magnitude-frequency distributions follow a Gutenberg-Richter relation, allowing reliable estimation of an instrumental completeness magnitude. Earlier data are not consistent with a Gutenberg-Richter relation, and so stan-dard methodologies for estimating Mc are not reliable [we note that the apparent reduction in b value before the eruption is consistent with an apparent increase in stress; (36)]. However, as instrumenta-tion is the same, and rates of seismicity are lower, we conclude that 0.8 is a reliable estimate for the duration of our data (excluding the coeruptive period). The value of 0.8 is also consistent with day/night event ratios. We note that we measure the triggering effect using the -statistic—measure of relative rate changes. Conse-quently, small changes in catalog completeness unlikely result in large changes in .
We quantify the triggering response using the absolute rate of triggered earthquakes and the -statistic (4). We use a 30-day win-dow to determine the background rate, although we test shorter and longer time intervals and again find that they have little influence
on our results. The rate of seismicity varies slowly at Sierra Negra during inflation.
The -statistic quantifies the change in rate in terms of the num-ber of SDs and is useful for comparing rates in windows of different durations (4)
β = N a − N T a / T ─ √
_____________ N ( T a _ T ) ( 1 − T a _ T ) (1)
Here, Na is the number of earthquakes recorded in the period of duration Ta after the arrival of the surface waves. We define the surface wave arrival time using a group velocity of 4 km s−1 and confirm this by direct inspection of the data, although results are generally insensitive to small changes in this velocity. N is the number of earthquakes recorded in the time period T, comprising a window before the surface wave arrivals (used to estimate the background rate) plus the time period after the surface wave arrivals. The period T therefore includes the period Ta. In this study, we prefer Ta = 30 min and T = 30 days. These values are shorter than used previously (4) but consistent with the immediate triggering effect observed in our data. We test our results using different values of Ta from 5 min to 1 day and fixed numbers of events rather than time windows. For different combinations of Mc, Ta, and T, we find slightly different numbers of triggered and background earthquakes, but overall patterns of our results are robust and support the qualitative observations in Figs. 4 and 5.
We use a postulated logarithmic relation between and PDS to “predict” a background rate of seismicity from the observed rate of triggered earthquakes and the PDS. We find the value of N that min-imizes the misfit in the relation: = 16 log10 PDS + 120, where is given by Eq. 1.
SUPPLEMENTARY MATERIALSSupplementary material for this article is available at https://science.org/doi/10.1126/sciadv.abh0894
REFERENCES AND NOTES 1. K. R. Felzer, E. E. Brodsky, Decay of aftershock density with distance indicates triggering
by dynamic stress. Nature 441, 735–738 (2006). 2. K. Richards-Dinger, R. S. Stein, S. Toda, Decay of aftershock density with distance does not
indicate triggering by dynamic stress. Nature 467, 583–586 (2010). 3. A. M. Freed, Earthquake triggering by static, dynamic, and postseismic stress transfer.
Annu. Rev. Earth Planet. Sci. 33, 335–367 (2005). 4. S. G. Prejean, D. P. Hill, The influence of tectonic environment on dynamic earthquake
triggering: A review and case study on Alaskan volcanoes. Tectonophysics 745, 293–304 (2018).
5. D. P. Hill, S. G. Prejean, Treatise on Geophysics (Elsevier, 2015), vol. 4, pp. 273–304. 6. D. P. Hill, P. A. Reasenberg, A. Michael, W. J. Arabaz, G. Beroza, D. Brumbaugh, J. N. Brune,
R. Castro, S. Davis, D. DePolo, W. L. Ellsworth, J. Gomberg, S. Harmsen, L. S. House, S. M. Jackson, M. J. S. Johnston, L. Jones, R. Keller, S. Malone, L. Munguia, S. Nava, J. C. Pechmann, A. Sanford, R. W. Simpson, R. B. Smith, M. Stark, M. Stickney, A. Vidal, S. Walter, V. Wong, J. Zollweg, Seismicity remotely triggered by the magnitude 7.3 Landers, California, earthquake. Science 260, 1617–1623 (1993).
7. C. W. Johnson, R. Bürgmann, F. F. Pollitz, Rare dynamic triggering of remote M ≥ 5.5 earthquakes from global catalog analysis. J. Geophys. Res. Solid Earth. 120, 1748–1761 (2015).
8. F. F. Pollitz, R. S. Stein, V. Sevilgen, R. Bürgmann, The 11 April 2012 east Indian Ocean earthquake triggered large aftershocks worldwide. Nature 490, 250–253 (2012).
9. G. C. P. King, R. S. Stein, J. Lin, Static stress changes and the triggering of earthquakes. Bull. Seismol. Soc. Am. 84, 935–953 (1994).
10. R. S. Stein, The role of stress transfer in earthquake occurrence. Nature 402, 605–609 (1999).
11. E. E. Brodsky, N. J. Van Der Elst, The uses of dynamic earthquake triggering. Annu. Rev. Earth Planet. Sci. 42, 317–339 (2014).
Dow
nloaded from https://w
ww
.science.org on September 24, 2021

Bell et al., Sci. Adv. 2021; 7 : eabh0894 24 September 2021
S C I E N C E A D V A N C E S | R E S E A R C H A R T I C L E
9 of 9
12. C. Aiken, X. Meng, J. Hardebeck, Testing for the ‘predictability’ of dynamically triggered earthquakes in The Geysers geothermal field. Earth Planet. Sci. Lett. 486, 129–140 (2018).
13. A. A. Velasco, S. Hernandez, T. Parsons, K. Pankow, Global ubiquity of dynamic earthquake triggering. Nat. Geosci. 1, 375–379 (2008).
14. N. J. van der Elst, H. M. Savage, K. M. Keranen, G. A. Abers, Enhanced remote earthquake triggering at fluid-injection sites in the midwestern United States. Science 341, 164–167 (2013).
15. N. J. van der Elst, E. E. Brodsky, Connecting near-field and far-field earthquake triggering to dynamic strain. J. Geophys. Res. 115, B07311 (2010).
16. D. P. Hill, F. Pollitz, C. Newhall, Earthquake-volcano interactions. Phys. Today. 55, 41–47 (2002).
17. S. G. Prejean, D. P. Hill, E. E. Brodsky, S. E. Hough, M. J. S. Johnston, S. D. Malone, D. H. Oppenheimer, A. M. Pitt, K. B. Richards-Dinger, Remotely triggered seismicity on the United States west coast following the Mw 7.9 Denali fault earthquake. Bull. Seismol. Soc. Am. 94, S348–S359 (2004).
18. F. Brenguier, M. Campillo, T. Takeda, Y. Aoki, N. M. Shapiro, X. Briand, K. Emoto, H. Miyake, Mapping pressurized volcanic fluids from induced crustal seismic velocity drops. Science 345, 80–82 (2014).
19. G. Liu, C. Li, Z. Peng, X. Li, J. Wu, Detecting remotely triggered microseismicity around Changbaishan Volcano following nuclear explosions in North Korea and large distant earthquakes around the world. Geophys. Res. Lett. 44, 4829–4838 (2017).
20. B. Enescu, K. Shimojo, A. Opris, Y. Yagi, Remote triggering of seismicity at Japanese volcanoes following the 2016 M7.3 Kumamoto earthquake. Earth, Planets Sp. 68, 165 (2016).
21. W. W. Chadwick, S. Jónsson, D. J. Geist, M. Poland, D. J. Johnson, S. Batt, K. S. Harpp, A. Ruiz, The May 2005 eruption of Fernandina volcano, Galápagos: The first circumferential dike intrusion observed by GPS and InSAR. Bull. Volcanol. 73, 679–697 (2011).
22. R. W. Reynolds, D. J. Geist, M. D. Kurz, Physical volcanology and structural development of Sierra Negra volcano, Isabela Island, Gal’apagos archipelago. Geol. Soc. Am. Bull. 107, 1398–1410 (1995).
23. W. W. Chadwick, D. J. Geist, S. Jónsson, M. Poland, D. J. Johnson, C. M. Meertens, A volcano bursting at the seams: Inflation, faulting, and eruption at Sierra Negra volcano, Galápagos, Galápagos. Geology 34, 1025 (2006).
24. F. Amelung, S. Jónsson, H. Zebker, P. Segall, Widespread uplift and “trapdoor” faulting on Galápagos volcanoes observed with radar interferometry. Nature 407, 993–996 (2000).
25. F. Vasconez, P. Ramón, S. Hernandez, S. Hidalgo, B. Bernard, M. Ruiz, A. Alvarado, P. La Femina, G. Ruiz, The different characteristics of the recent eruptions of Fernandina and Sierra Negra volcanoes (Galápagos, Ecuador). Volcanica 1, 127–133 (2018).
26. A. F. Bell, P. C. La Femina, M. Ruiz, F. Amelung, M. Bagnardi, C. J. Bean, B. Bernard, C. Ebinger, M. Gleeson, J. Grannell, S. Hernandez, M. Higgins, C. Liorzou, P. Lundgren, N. J. Meier, M. Möllhoff, S. Oliva, A. G. Ruiz, M. J. Stock, Caldera resurgence during the 2018 eruption of Sierra Negra volcano, Galápagos islands. Nat. Commun. 12, 1397 (2021).
27. C. Aiken, Z. Peng, Dynamic triggering of microearthquakes in three geothermal/volcanic regions of California. J. Geophys. Res. Solid Earth. 119, 6992–7009 (2014).
28. P. M. Gregg, H. Le Mével, Y. Zhan, J. Dufek, D. Geist, W. W. Chadwick, Stress triggering of the 2005 eruption of Sierra Negra volcano, Galápagos. Geophys. Res. Lett. 45, 13288–13297 (2018).
29. A. Alvarado, M. Ruiz, P. Mothes, H. Yepes, M. Segovia, M. Vaca, C. Ramos, W. Enríquez, G. Ponce, P. Jarrín, J. Aguilar, W. Acero, S. Vaca, J. C. Singaucho, D. Pacheco, A. Córdova, Seismic, volcanic, and geodetic networks in Ecuador: Building capacity for monitoring and research. Seismol. Res. Lett. 89, 432–439 (2018).
30. G. Tepp, C. J. Ebinger, M. Ruiz, M. Belachew, Imaging rapidly deforming ocean island volcanoes in the western Galápagos archipelago, Ecuador. J. Geophys. Res. Solid Earth. 119, 442–463 (2014).
31. L. Krischer, T. Megies, R. Barsch, M. Beyreuther, T. Lecocq, C. Caudron, J. Wassermann, ObsPy: A bridge for seismology into the scientific Python ecosystem. Comput. Sci. Discov. 8, 014003 (2015).
32. P. Poli, Creep and slip: Seismic precursors to the Nuugaatsiaq landslide (Greenland). Geophys. Res. Lett. 44, 8832–8836 (2017).
33. A. F. Bell, Predictability of landslide timing from quasi-periodic precursory earthquakes. Geophys. Res. Lett. 45, 1860–1869 (2018).
34. A. Mignan, J. Woessner, Theme IV – Understanding seismicity catalogs and their problems: Estimating the magnitude of completeness for earthquake catalogs (2012); www.corssa.org.
35. N. S. Roberts, A. F. Bell, I. G. Main, Are volcanic seismic b -values high, and if so when? J. Volcanol. Geotherm. Res. 308, 127–141 (2015).
36. D. Schorlemmer, S. Wiemer, M. Wyss, Variations in earthquake-size distribution across different stress regimes. Nature 437, 539–542 (2005).
Acknowledgments: We thank the IGEPN for access to seismic data from the Galápagos Islands and the Parque Nacional Galapagos for support during deployment of the IGUANA seismic network. Funding: While writing, A.F.B. was supported by NERC grant NE/S002685/1, and J.M. was supported by NERC GCRF award NE/S009000/1. Author contributions: A.F.B., S.H., J.M., M.R., C.J.B., and M.M. designed the study. A.F.B. analyzed the seismic data. P.C.L. analyzed the GPS data. All authors contributed to writing the manuscript. Competing interests: The authors declare that they have no competing interests. Data and materials availability: Catalogs of STA/LTA detections, template-matched and manually picked events, and trigger events are included as supplemental datasets. Raw seismic data from VCH1 are available from the IGEPN at www.igepn.edu.ec/datos-mseed.
Submitted 15 February 2021Accepted 4 August 2021Published 24 September 202110.1126/sciadv.abh0894
Citation: A. F. Bell, S. Hernandez, J. McCloskey, M. Ruiz, P. C. LaFemina, C. J. Bean, M. Möllhoff, Dynamic earthquake triggering response tracks evolving unrest at Sierra Negra volcano, Galápagos Islands. Sci. Adv. 7, eabh0894 (2021).
Dow
nloaded from https://w
ww
.science.org on September 24, 2021
Use of think article is subject to the Terms of service
Science Advances (ISSN ) is published by the American Association for the Advancement of Science. 1200 New York Avenue NW,Washington, DC 20005. The title Science Advances is a registered trademark of AAAS.Copyright © 2021 The Authors, some rights reserved; exclusive licensee American Association for the Advancement of Science. No claimto original U.S. Government Works. Distributed under a Creative Commons Attribution NonCommercial License 4.0 (CC BY-NC).
Dynamic earthquake triggering response tracks evolving unrest at Sierra Negravolcano, Galápagos IslandsAndrew F. BellStephen HernandezJohn McCloskeyMario RuizPeter C. LaFeminaChristopher J. BeanMartin Möllhoff
Sci. Adv., 7 (39), eabh0894. • DOI: 10.1126/sciadv.abh0894
View the article onlinehttps://www.science.org/doi/10.1126/sciadv.abh0894Permissionshttps://www.science.org/help/reprints-and-permissions
Dow
nloaded from https://w
ww
.science.org on September 24, 2021