Embed Size (px)
Citation preview
Dt
Ba
b
a
ARRAA
KEGDVTT
1
toioe[ainbov
ca
0h
Journal of Chromatography A, 1331 (2014) 38– 43
Contents lists available at ScienceDirect
Journal of Chromatography A
j our nal homep age: www.elsev ier .com/ locate /chroma
ynamic headspace generation and quantitation of triacetoneriperoxide vapor
raden C. Giordanoa,∗, Adam L. Lubranob, Christopher R. Fielda, Greg E. Collinsa
Chemistry Division, U.S. Naval Research Laboratory, Washington, DC 20375, USANova Research, Inc., Alexandria, VA 22308, USA
r t i c l e i n f o
rticle history:eceived 9 October 2013eceived in revised form 14 January 2014ccepted 16 January 2014vailable online 24 January 2014
eywords:xplosivesC/MSynamic headspaceaporriacetone triperoxide
a b s t r a c t
Two methods for quantitation of triacetone triperoxide (TATP) vapor using a programmable tempera-ture vaporization (PTV) inlet coupled to a gas chromatography/mass spectrometer (GC/MS) have beendemonstrated. The dynamic headspace of bulk TATP was mixed with clean humid air to produce a TATPvapor stream. Sampling via a heated transfer line to a PTV inlet with a Tenax-TATM filled liner allowedfor direct injection of the vapor stream to a GC/MS for vapor quantitation. TATP was extracted from thevapor stream and subsequently desorbed from the PTV liner for splitless injection on the GC column.Calibration curves were prepared using solution standards with a standard split/splitless GC inlet forquantitation of the TATP vapor. Alternatively, vapor was sampled onto a Tenax-TATM sample tube andplaced into a thermal desorption system. In this instance, vapor was desorbed from the tube and subse-quently trapped on a liquid nitrogen cooled PTV inlet. Calibration curves for this method were preparedfrom direct liquid injection of standards onto samples tube with the caveat that a vacuum is applied to
ATP the tube during deposition to ensure that the volatile TATP penetrates into the tube. Vapor concentra-tion measurements, as determined by either GC/MS analysis or mass gravimetry of the bulk TATP, werestatistically indistinguishable. Different approaches to broaden the TATP vapor dynamic range, includingdiluent air flow, sample chamber temperature, sample vial orifice size, and sample size are discussed.Vapor concentrations between 50 and 5400 ng L−1 are reported, with stable vapor generation observedfor as long as 60 consecutive hours.
. Introduction
Improvised explosive devices (IEDs) are a difficult problem forhe US military. It is a multifaceted problem with a broad rangef focus areas including issues associated with detection, disarm-ng, remediation and regulation. Vapor detection of trace quantitiesf explosives is one possible method for identifying the pres-nce of IEDs and, thereby, avoiding consequential injury and death1–6]. Due to the incredible variability in IED type and content,
wide-range of technologies for sampling and analysis are beingnvestigated to address the trace chemical vapor detection compo-ent of the IED problem. Regardless of the technologies brought toear on the problem, it is paramount that laboratory-based meth-ds are developed capable of generating and quantifying explosiveapors for the evaluation of these emerging technologies [7,8].
Triacetone triperoxide (TATP) is a high volatility explosiveompound used in IEDs with a saturated vapor concentration ofpproximately 60 ppm (550,000 ng L−1) [9,10]. There are numerous
∗ Corresponding author. Tel.: +1 202 404 6320; fax: +1 202 404 8119.E-mail address: [email protected] (B.C. Giordano).
021-9673/$ – see front matter. Published by Elsevier B.V.ttp://dx.doi.org/10.1016/j.chroma.2014.01.045
Published by Elsevier B.V.
examples associated with the analysis of TATP via GC/MS, includ-ing efforts by Stambouli et al. that looked at the headspace ofpost-explosion debris via direct injection of vapor onto a GCcolumn [11]. Alternatively, Muller et al. used solid phase micro-extraction to extract TATP from the headspace for subsequentdesorption/injection [12]. An extensive review of the analyticalmethods associated with TATP detection is beyond the scope ofthis paper, but the reader is directed to Refs. [13,14] for additionalinformation and background. The methods described above weredeveloped with an eye toward discrete sampling of a finite sam-ple source (i.e. post-blast residue), and, though quantitative, thequalitative result (the presence of TATP) was of primary emphasis[11,12].
Our efforts have focused on using commercially available ther-mal desorption systems (TDS), including a thermal desorption (TD)unit coupled with a programmable temperature vaporization (PTV)inlet referred to as a cooled inlet system (CIS) by the manufacturer,to develop calibration methods for the quantitation of TNT and RDX
vapors [15,16]. This work demonstrated that the direct liquid depo-sition of calibration standards onto Tenax TATM thermal desorptiontubes is a viable option for analytical quantitation, demonstrat-ing a strong similarity between calibration curves acquired using a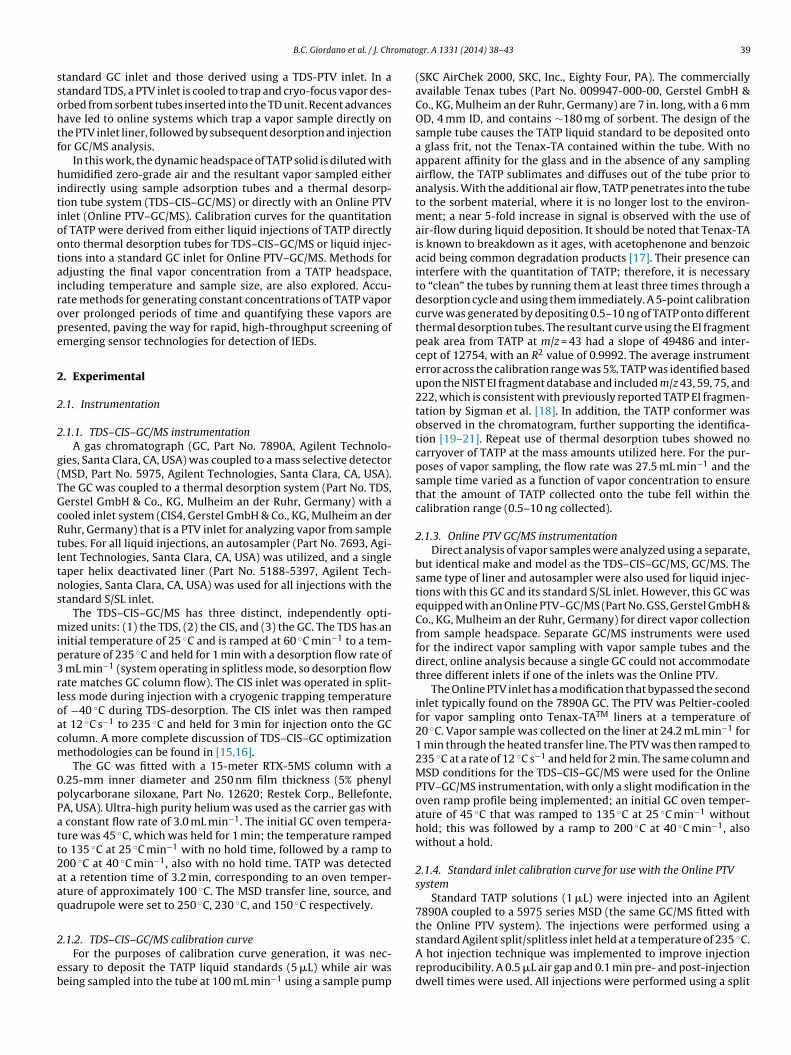
omato
ssohtf
hitiootairope
2
2
2
g(TGcRtltns
mip3rloacm
0pPatt2aaq
2
eb
B.C. Giordano et al. / J. Chr
tandard GC inlet and those derived using a TDS-PTV inlet. In atandard TDS, a PTV inlet is cooled to trap and cryo-focus vapor des-rbed from sorbent tubes inserted into the TD unit. Recent advancesave led to online systems which trap a vapor sample directly onhe PTV inlet liner, followed by subsequent desorption and injectionor GC/MS analysis.
In this work, the dynamic headspace of TATP solid is diluted withumidified zero-grade air and the resultant vapor sampled either
ndirectly using sample adsorption tubes and a thermal desorp-ion tube system (TDS–CIS–GC/MS) or directly with an Online PTVnlet (Online PTV–GC/MS). Calibration curves for the quantitationf TATP were derived from either liquid injections of TATP directlynto thermal desorption tubes for TDS–CIS–GC/MS or liquid injec-ions into a standard GC inlet for Online PTV–GC/MS. Methods fordjusting the final vapor concentration from a TATP headspace,ncluding temperature and sample size, are also explored. Accu-ate methods for generating constant concentrations of TATP vaporver prolonged periods of time and quantifying these vapors areresented, paving the way for rapid, high-throughput screening ofmerging sensor technologies for detection of IEDs.
. Experimental
.1. Instrumentation
.1.1. TDS–CIS–GC/MS instrumentationA gas chromatograph (GC, Part No. 7890A, Agilent Technolo-
ies, Santa Clara, CA, USA) was coupled to a mass selective detectorMSD, Part No. 5975, Agilent Technologies, Santa Clara, CA, USA).he GC was coupled to a thermal desorption system (Part No. TDS,erstel GmbH & Co., KG, Mulheim an der Ruhr, Germany) with aooled inlet system (CIS4, Gerstel GmbH & Co., KG, Mulheim an deruhr, Germany) that is a PTV inlet for analyzing vapor from sampleubes. For all liquid injections, an autosampler (Part No. 7693, Agi-ent Technologies, Santa Clara, CA, USA) was utilized, and a singleaper helix deactivated liner (Part No. 5188-5397, Agilent Tech-ologies, Santa Clara, CA, USA) was used for all injections with thetandard S/SL inlet.
The TDS–CIS–GC/MS has three distinct, independently opti-ized units: (1) the TDS, (2) the CIS, and (3) the GC. The TDS has an
nitial temperature of 25 ◦C and is ramped at 60 ◦C min−1 to a tem-erature of 235 ◦C and held for 1 min with a desorption flow rate of
mL min−1 (system operating in splitless mode, so desorption flowate matches GC column flow). The CIS inlet was operated in split-ess mode during injection with a cryogenic trapping temperaturef −40 ◦C during TDS-desorption. The CIS inlet was then rampedt 12 ◦C s−1 to 235 ◦C and held for 3 min for injection onto the GColumn. A more complete discussion of TDS–CIS–GC optimizationethodologies can be found in [15,16].The GC was fitted with a 15-meter RTX-5MS column with a
.25-mm inner diameter and 250 nm film thickness (5% phenylolycarborane siloxane, Part No. 12620; Restek Corp., Bellefonte,A, USA). Ultra-high purity helium was used as the carrier gas with
constant flow rate of 3.0 mL min−1. The initial GC oven tempera-ure was 45 ◦C, which was held for 1 min; the temperature rampedo 135 ◦C at 25 ◦C min−1 with no hold time, followed by a ramp to00 ◦C at 40 ◦C min−1, also with no hold time. TATP was detectedt a retention time of 3.2 min, corresponding to an oven temper-ture of approximately 100 ◦C. The MSD transfer line, source, anduadrupole were set to 250 ◦C, 230 ◦C, and 150 ◦C respectively.
.1.2. TDS–CIS–GC/MS calibration curveFor the purposes of calibration curve generation, it was nec-
ssary to deposit the TATP liquid standards (5 �L) while air waseing sampled into the tube at 100 mL min−1 using a sample pump
gr. A 1331 (2014) 38– 43 39
(SKC AirChek 2000, SKC, Inc., Eighty Four, PA). The commerciallyavailable Tenax tubes (Part No. 009947-000-00, Gerstel GmbH &Co., KG, Mulheim an der Ruhr, Germany) are 7 in. long, with a 6 mmOD, 4 mm ID, and contains ∼180 mg of sorbent. The design of thesample tube causes the TATP liquid standard to be deposited ontoa glass frit, not the Tenax-TA contained within the tube. With noapparent affinity for the glass and in the absence of any samplingairflow, the TATP sublimates and diffuses out of the tube prior toanalysis. With the additional air flow, TATP penetrates into the tubeto the sorbent material, where it is no longer lost to the environ-ment; a near 5-fold increase in signal is observed with the use ofair-flow during liquid deposition. It should be noted that Tenax-TAis known to breakdown as it ages, with acetophenone and benzoicacid being common degradation products [17]. Their presence caninterfere with the quantitation of TATP; therefore, it is necessaryto “clean” the tubes by running them at least three times through adesorption cycle and using them immediately. A 5-point calibrationcurve was generated by depositing 0.5–10 ng of TATP onto differentthermal desorption tubes. The resultant curve using the EI fragmentpeak area from TATP at m/z = 43 had a slope of 49486 and inter-cept of 12754, with an R2 value of 0.9992. The average instrumenterror across the calibration range was 5%. TATP was identified basedupon the NIST EI fragment database and included m/z 43, 59, 75, and222, which is consistent with previously reported TATP EI fragmen-tation by Sigman et al. [18]. In addition, the TATP conformer wasobserved in the chromatogram, further supporting the identifica-tion [19–21]. Repeat use of thermal desorption tubes showed nocarryover of TATP at the mass amounts utilized here. For the pur-poses of vapor sampling, the flow rate was 27.5 mL min−1 and thesample time varied as a function of vapor concentration to ensurethat the amount of TATP collected onto the tube fell within thecalibration range (0.5–10 ng collected).
2.1.3. Online PTV GC/MS instrumentationDirect analysis of vapor samples were analyzed using a separate,
but identical make and model as the TDS–CIS–GC/MS, GC/MS. Thesame type of liner and autosampler were also used for liquid injec-tions with this GC and its standard S/SL inlet. However, this GC wasequipped with an Online PTV–GC/MS (Part No. GSS, Gerstel GmbH &Co., KG, Mulheim an der Ruhr, Germany) for direct vapor collectionfrom sample headspace. Separate GC/MS instruments were usedfor the indirect vapor sampling with vapor sample tubes and thedirect, online analysis because a single GC could not accommodatethree different inlets if one of the inlets was the Online PTV.
The Online PTV inlet has a modification that bypassed the secondinlet typically found on the 7890A GC. The PTV was Peltier-cooledfor vapor sampling onto Tenax-TATM liners at a temperature of20 ◦C. Vapor sample was collected on the liner at 24.2 mL min−1 for1 min through the heated transfer line. The PTV was then ramped to235 ◦C at a rate of 12 ◦C s−1 and held for 2 min. The same column andMSD conditions for the TDS–CIS–GC/MS were used for the OnlinePTV–GC/MS instrumentation, with only a slight modification in theoven ramp profile being implemented; an initial GC oven temper-ature of 45 ◦C that was ramped to 135 ◦C at 25 ◦C min−1 withouthold; this was followed by a ramp to 200 ◦C at 40 ◦C min−1, alsowithout a hold.
2.1.4. Standard inlet calibration curve for use with the Online PTVsystem
Standard TATP solutions (1 �L) were injected into an Agilent7890A coupled to a 5975 series MSD (the same GC/MS fitted withthe Online PTV system). The injections were performed using a
standard Agilent split/splitless inlet held at a temperature of 235 ◦C.A hot injection technique was implemented to improve injectionreproducibility. A 0.5 �L air gap and 0.1 min pre- and post-injectiondwell times were used. All injections were performed using a split
4 omato
reiu6dpcetotlli
2d
vhbflAbuRmw
BlcENpfwicMtvctopw
2
o(2I
2
cdaces
0 B.C. Giordano et al. / J. Chr
atio of 15:1. A blank acetonitrile injection was performed afterach set of injections to reduce the chance of carryover. The result-ng data were plotted and used to form a calibration curve basedpon the mass of TATP at the detector (accounting for the split). A-point calibration curve ranging from 0.1 to 10 ng of TATP (at theetector) was generated. The resultant curve using the EI fragmenteak area from TATP at m/z = 43 had a slope of 40285 and an inter-ept of −1982, with an R2 value of 0.9995. The average instrumentrror across the calibration range is 7%. This curve was in turn usedo quantify TATP collected on the PTV inlet. Direct liquid depositionnto PTV inlet liners is not advisable, as it would require turning offhe GC helium flow, removing the liner, depositing sample onto theiner, reestablishing flow, and then running the sample; this is bothabor intensive and potentially damaging to the instrumentation,ncluding the GC column and MS source.
.1.5. TATP dynamic headspace sample chamber and vaporelivery system
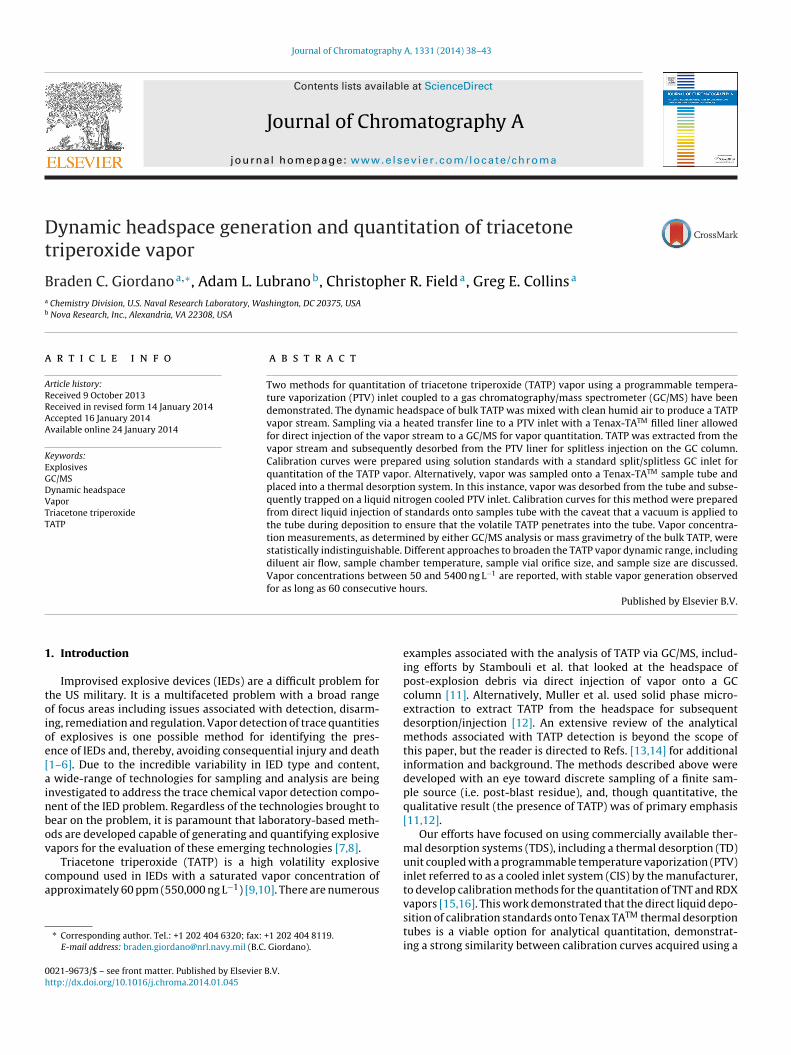
Solid TATP samples in antistatic vials were placed in a passi-ated (SilcoNert®, SilcoTek, Bellefonte, PA) stainless steel dynamiceadspace sample chamber. Photographs of the uncoated cham-er are shown in Fig. 1. The chamber was designed to have the airow inlet at the bottom of the chamber and the outlet at the top.n embedded, serpentine channel was machined into the cham-er to evenly distribute and regulate the chamber temperaturesing a water bath (Part No. 112053027, Thermo-Fisher Scientific,ockville, MD, USA). The evenness of heating was verified with ther-al imaging (data not shown). The flow rate through the chamberas maintained at 250 mL min−1 for all experiments.
The vapor delivery system has been described elsewhere [22].riefly, it consists of a dual manifold (an analyte line and a clean air
ine) constructed from passivated stainless steel (SilcoNert®, Sil-oTek, Bellefonte, PA). A zero air generator (Part No. Model 7000,nvironics, Inc., Tolland, CT, USA) and a humidity control unit (Parto. HCS-401, Miller-Nelson, Livermore, CA, USA) were used torovide zero-grade, humidified diluent air (30–50% RH) at ratesrom 2 to 20 L min−1. Dynamic headspace from the TATP sampleas diluted with carrier air (250 mL min−1) via a T-connector and
ntroduced into the analyte line of the dual manifold. A mass flowontroller (Part No. M100 Smart-Trak 2, Sierra Instruments, Inc.,onterey, CA, USA) was used to regulate the dry air flow rate
hrough the TATP sample chamber and into the manifold. A 3-portalve and actuator were used to switch between the analyte andlean air lines. The dual manifold was housed in a custom oven seto 50 ◦C in order to limit analyte adsorption to the inner surfacesf the manifold. For vapor testing, a heated (120 ◦C), 1/16th in. ODassivated stainless steel tube (Claborn Hot Tube, Truckee, CA, USA)as used to couple the manifold to the Online PTV inlet.
.2. Reagents
Analytical standards for TATP (CAS No. 17088-37-8) werebtained in acetonitrile (10 mg mL−1) from AccuStandard, Inc.New Haven, CT). Solid TATP samples at weights of 10, 25, 100,00, and 1000 mg were provided by the U.S. Federal Bureau of
nvestigation (FBI, Explosives Unit).
.3. Safety and TATP handling
When dealing with high explosives, safety is of paramountoncern. A series of standard operating procedures (SOPs) wereeveloped for handling solid TATP samples for this work. Briefly,
ll samples were maintained in MK663 containers (Camtech Pre-ision Manufacturing, Inc.; Auburn, NY) for safe storage whenxperiments were not being performed. In order to remove a TATPample from the MK663, the handler must wear appropriate safetygr. A 1331 (2014) 38– 43
equipment that includes safety glasses and/or face shield, cottonlab coat, gloves, and a grounding strap. The handler removes theMK663 from storage and places it behind an appropriate ExplosivePersonnel Shield (certified to net explosives weight of 1.5 g). Oncegrounded, the user removes the lid of the MK663 and retrieves theTATP sample vial. Typically, a piece of parafilm is inserted betweenthe vial and the vial cap to minimize the chances of friction inducedexplosions. The cap is removed, followed by the parafilm, and thenthe entire vial is weighed on a balance positioned behind the shield.The weighed sample vial is placed in the dynamic headspace samplechamber and the cover is affixed. Upon completion of all experi-ments, the sample is weighed a second time and the weight loss isrecorded. Additional safety considerations include the requirementthat no experiments shall be conducted when lightning is within30 nautical miles of the laboratory, or has occurred within that 30mile radius in the prior 2 h. Whenever handling occurs, two per-sonnel are present to ensure adherence to the SOP and to provideimmediate assistance should an accident occur.
3. Results and discussion
3.1. Vapor generation and quantitation [17]
3.1.1. 1000 mg TATP sample weightA 1000 mg sample of TATP in an uncapped, antistatic vial
was placed in the dynamic headspace sample chamber with250 mL min−1 dry air flow and 30 ◦C chamber temperature. Thedynamic headspace was mixed with diluent air (10 L min−1) andthe resultant vapor was sampled continuously for approximately60 h using the Online PTV–GC/MS system; the calculated concen-tration of the vapor (ng L−1) is presented in Fig. 2. The TATP vaporconcentration is significantly higher during the initial ∼10 h of theexperiment, but then stabilizes to a constant level for the remaining∼50 h. The figure inset illustrates a close-up of the data between 350and 650 ng L−1. The voids in the data represent overnight periodswhen no samples were taken.
The average TATP vapor concentration over the final 50 h of theexperiment shown in Fig. 2 was 450 ± 30 ng L−1 (mass of TATP asdetermined by the calibration curve divided by the volume of airsampled). Based upon the mass loss of TATP, the average nominalconcentration over the entire experiment was 440 ng L−1. The datasuggest there are no underlying issues associated with irreversibleadsorption onto the manifold or the heated transfer line that mayresult in under reporting the vapor concentration. In other words,any potential losses of TATP with the Online PTV system are withinthe experimental error of the system. The relatively higher initialvapor concentration is attributed to the TATP vial initially beinguncapped, where a saturated headspace is presence inside the sam-ple vial. When the sample is uncapped and placed in the dynamicheadspace sample chamber, over time, the TATP concentrationdecreases and levels off as an equilibrium is established betweenthe vapor pressure of the TATP solid and the rate of air transportthrough the chamber and surrounding the TATP vial. The same1000 mg sample of TATP was used repeatedly under numerous con-ditions throughout this study. At the end of the work associatedwith that sample, only 870 mg of TATP remained. Repeated use ofthe sample over several days under the same conditions (cham-ber temperature, chamber flow rate, diluent air flow rate, and airhumidity) produced the same equilibrium, average TATP vapor con-centration (within the error of the instrumentation). Variations inrelative humidity from 30 to 50% did not result in any changes in
the calculated vapor concentration.In a separate set of experiments, the TDS–CIS–GC/MS, OnlinePTV–GC/MS and the gravimetric quantitation methods were com-pared for the same TATP vapor sample time period following
B.C. Giordano et al. / J. Chromatogr. A 1331 (2014) 38– 43 41
Fig. 1. Images of stainless steel sample chamber for dynamic headspace generation from TATP. (A) Bottom of chamber [12.7 cm (l) × 12.7 cm (w) × 12.7 cm (h)]. (B) Top ofchamber [12.7 cm (l) × 12.7 cm (w) × 5.1 cm (h)]. (C) Insert for placement of an antistatic vial [10.5 cm diameter × 2.5 cm (h)]. (D) Insert for placement of an antistatic vial inthe bottom of the chamber.
Fig. 2. The calculated TATP concentration using the Online PTV inlet as a function of time for a 1000 mg TATP sample (30 ◦C sample chamber temperature, 250 mL min−1
sample chamber flow rate, 10 L min−1 diluent air flow rate). Insert – close up of the calculated concentration from 350 to 650 ng L−1.
42 B.C. Giordano et al. / J. Chromatogr. A 1331 (2014) 38– 43
F ent flc
eftcPt3bqst
3
vwaptae(oaamebtTrlda
3
hpiba
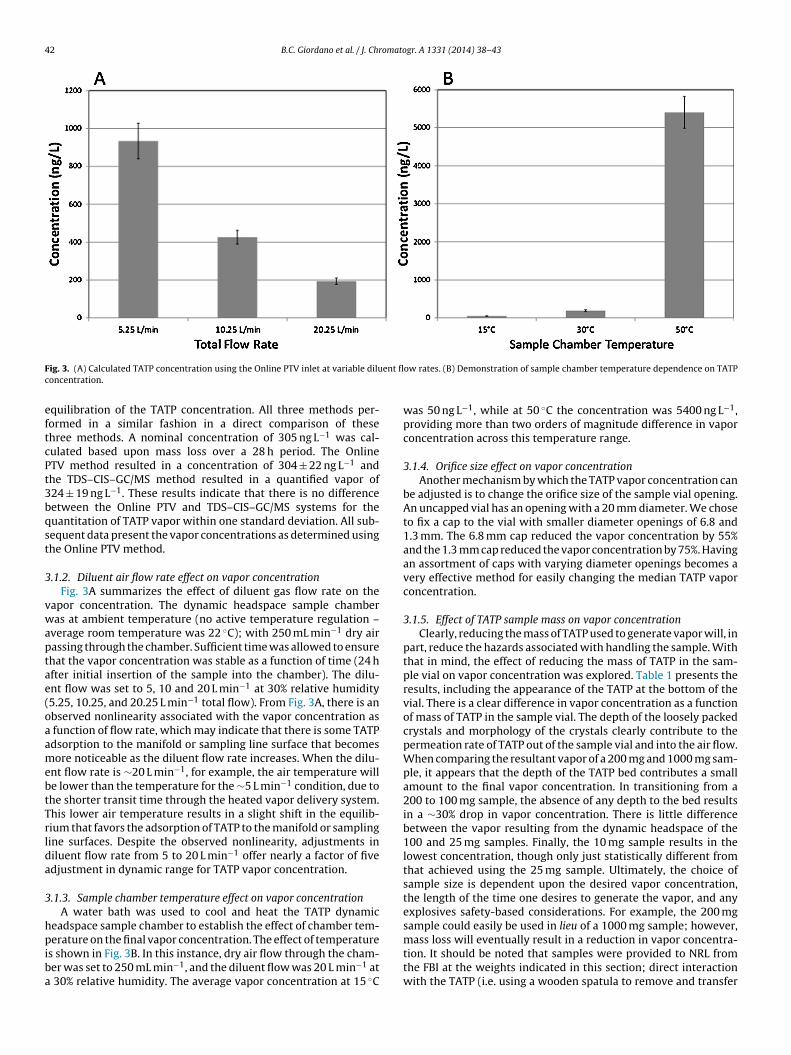
ig. 3. (A) Calculated TATP concentration using the Online PTV inlet at variable diluoncentration.
quilibration of the TATP concentration. All three methods per-ormed in a similar fashion in a direct comparison of thesehree methods. A nominal concentration of 305 ng L−1 was cal-ulated based upon mass loss over a 28 h period. The OnlineTV method resulted in a concentration of 304 ± 22 ng L−1 andhe TDS–CIS–GC/MS method resulted in a quantified vapor of24 ± 19 ng L−1. These results indicate that there is no differenceetween the Online PTV and TDS–CIS–GC/MS systems for theuantitation of TATP vapor within one standard deviation. All sub-equent data present the vapor concentrations as determined usinghe Online PTV method.
.1.2. Diluent air flow rate effect on vapor concentrationFig. 3A summarizes the effect of diluent gas flow rate on the
apor concentration. The dynamic headspace sample chamberas at ambient temperature (no active temperature regulation –
verage room temperature was 22 ◦C); with 250 mL min−1 dry airassing through the chamber. Sufficient time was allowed to ensurehat the vapor concentration was stable as a function of time (24 hfter initial insertion of the sample into the chamber). The dilu-nt flow was set to 5, 10 and 20 L min−1 at 30% relative humidity5.25, 10.25, and 20.25 L min−1 total flow). From Fig. 3A, there is anbserved nonlinearity associated with the vapor concentration as
function of flow rate, which may indicate that there is some TATPdsorption to the manifold or sampling line surface that becomesore noticeable as the diluent flow rate increases. When the dilu-
nt flow rate is ∼20 L min−1, for example, the air temperature wille lower than the temperature for the ∼5 L min−1 condition, due tohe shorter transit time through the heated vapor delivery system.his lower air temperature results in a slight shift in the equilib-ium that favors the adsorption of TATP to the manifold or samplingine surfaces. Despite the observed nonlinearity, adjustments iniluent flow rate from 5 to 20 L min−1 offer nearly a factor of fivedjustment in dynamic range for TATP vapor concentration.
.1.3. Sample chamber temperature effect on vapor concentrationA water bath was used to cool and heat the TATP dynamic
eadspace sample chamber to establish the effect of chamber tem-
erature on the final vapor concentration. The effect of temperatures shown in Fig. 3B. In this instance, dry air flow through the cham-er was set to 250 mL min−1, and the diluent flow was 20 L min−1 at
30% relative humidity. The average vapor concentration at 15 ◦C
ow rates. (B) Demonstration of sample chamber temperature dependence on TATP
was 50 ng L−1, while at 50 ◦C the concentration was 5400 ng L−1,providing more than two orders of magnitude difference in vaporconcentration across this temperature range.
3.1.4. Orifice size effect on vapor concentrationAnother mechanism by which the TATP vapor concentration can
be adjusted is to change the orifice size of the sample vial opening.An uncapped vial has an opening with a 20 mm diameter. We choseto fix a cap to the vial with smaller diameter openings of 6.8 and1.3 mm. The 6.8 mm cap reduced the vapor concentration by 55%and the 1.3 mm cap reduced the vapor concentration by 75%. Havingan assortment of caps with varying diameter openings becomes avery effective method for easily changing the median TATP vaporconcentration.
3.1.5. Effect of TATP sample mass on vapor concentrationClearly, reducing the mass of TATP used to generate vapor will, in
part, reduce the hazards associated with handling the sample. Withthat in mind, the effect of reducing the mass of TATP in the sam-ple vial on vapor concentration was explored. Table 1 presents theresults, including the appearance of the TATP at the bottom of thevial. There is a clear difference in vapor concentration as a functionof mass of TATP in the sample vial. The depth of the loosely packedcrystals and morphology of the crystals clearly contribute to thepermeation rate of TATP out of the sample vial and into the air flow.When comparing the resultant vapor of a 200 mg and 1000 mg sam-ple, it appears that the depth of the TATP bed contributes a smallamount to the final vapor concentration. In transitioning from a200 to 100 mg sample, the absence of any depth to the bed resultsin a ∼30% drop in vapor concentration. There is little differencebetween the vapor resulting from the dynamic headspace of the100 and 25 mg samples. Finally, the 10 mg sample results in thelowest concentration, though only just statistically different fromthat achieved using the 25 mg sample. Ultimately, the choice ofsample size is dependent upon the desired vapor concentration,the length of the time one desires to generate the vapor, and anyexplosives safety-based considerations. For example, the 200 mgsample could easily be used in lieu of a 1000 mg sample; however,
mass loss will eventually result in a reduction in vapor concentra-tion. It should be noted that samples were provided to NRL fromthe FBI at the weights indicated in this section; direct interactionwith the TATP (i.e. using a wooden spatula to remove and transfer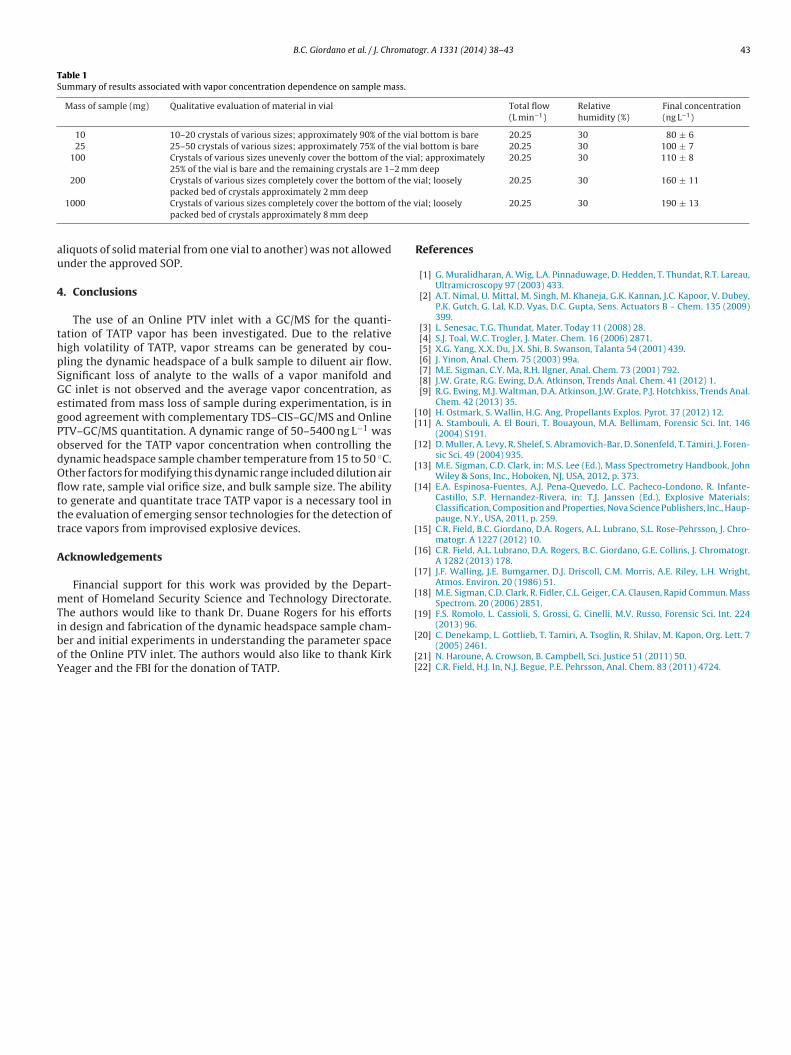
B.C. Giordano et al. / J. Chromatogr. A 1331 (2014) 38– 43 43
Table 1Summary of results associated with vapor concentration dependence on sample mass.
Mass of sample (mg) Qualitative evaluation of material in vial Total flow(L min−1)
Relativehumidity (%)
Final concentration(ng L−1)
10 10–20 crystals of various sizes; approximately 90% of the vial bottom is bare 20.25 30 80 ± 625 25–50 crystals of various sizes; approximately 75% of the vial bottom is bare 20.25 30 100 ± 7
100 Crystals of various sizes unevenly cover the bottom of the vial; approximately25% of the vial is bare and the remaining crystals are 1–2 mm deep
20.25 30 110 ± 8
200 Crystals of various sizes completely cover the bottom of the vial; loosely 20.25 30 160 ± 11
f the v
au
4
thpSGegPodOflttt
A
mTiboY
[[
[
[
[
[
[
[
[
[
packed bed of crystals approximately 2 mm deep1000 Crystals of various sizes completely cover the bottom o
packed bed of crystals approximately 8 mm deep
liquots of solid material from one vial to another) was not allowednder the approved SOP.
. Conclusions
The use of an Online PTV inlet with a GC/MS for the quanti-ation of TATP vapor has been investigated. Due to the relativeigh volatility of TATP, vapor streams can be generated by cou-ling the dynamic headspace of a bulk sample to diluent air flow.ignificant loss of analyte to the walls of a vapor manifold andC inlet is not observed and the average vapor concentration, asstimated from mass loss of sample during experimentation, is inood agreement with complementary TDS–CIS–GC/MS and OnlineTV–GC/MS quantitation. A dynamic range of 50–5400 ng L−1 wasbserved for the TATP vapor concentration when controlling theynamic headspace sample chamber temperature from 15 to 50 ◦C.ther factors for modifying this dynamic range included dilution airow rate, sample vial orifice size, and bulk sample size. The abilityo generate and quantitate trace TATP vapor is a necessary tool inhe evaluation of emerging sensor technologies for the detection ofrace vapors from improvised explosive devices.
cknowledgements
Financial support for this work was provided by the Depart-ent of Homeland Security Science and Technology Directorate.
he authors would like to thank Dr. Duane Rogers for his efforts
n design and fabrication of the dynamic headspace sample cham-er and initial experiments in understanding the parameter spacef the Online PTV inlet. The authors would also like to thank Kirkeager and the FBI for the donation of TATP.[
[[
ial; loosely 20.25 30 190 ± 13
References
[1] G. Muralidharan, A. Wig, L.A. Pinnaduwage, D. Hedden, T. Thundat, R.T. Lareau,Ultramicroscopy 97 (2003) 433.
[2] A.T. Nimal, U. Mittal, M. Singh, M. Khaneja, G.K. Kannan, J.C. Kapoor, V. Dubey,P.K. Gutch, G. Lal, K.D. Vyas, D.C. Gupta, Sens. Actuators B – Chem. 135 (2009)399.
[3] L. Senesac, T.G. Thundat, Mater. Today 11 (2008) 28.[4] S.J. Toal, W.C. Trogler, J. Mater. Chem. 16 (2006) 2871.[5] X.G. Yang, X.X. Du, J.X. Shi, B. Swanson, Talanta 54 (2001) 439.[6] J. Yinon, Anal. Chem. 75 (2003) 99a.[7] M.E. Sigman, C.Y. Ma, R.H. Ilgner, Anal. Chem. 73 (2001) 792.[8] J.W. Grate, R.G. Ewing, D.A. Atkinson, Trends Anal. Chem. 41 (2012) 1.[9] R.G. Ewing, M.J. Waltman, D.A. Atkinson, J.W. Grate, P.J. Hotchkiss, Trends Anal.
Chem. 42 (2013) 35.10] H. Ostmark, S. Wallin, H.G. Ang, Propellants Explos. Pyrot. 37 (2012) 12.11] A. Stambouli, A. El Bouri, T. Bouayoun, M.A. Bellimam, Forensic Sci. Int. 146
(2004) S191.12] D. Muller, A. Levy, R. Shelef, S. Abramovich-Bar, D. Sonenfeld, T. Tamiri, J. Foren-
sic Sci. 49 (2004) 935.13] M.E. Sigman, C.D. Clark, in: M.S. Lee (Ed.), Mass Spectrometry Handbook, John
Wiley & Sons, Inc., Hoboken, NJ, USA, 2012, p. 373.14] E.A. Espinosa-Fuentes, A.J. Pena-Quevedo, L.C. Pacheco-Londono, R. Infante-
Castillo, S.P. Hernandez-Rivera, in: T.J. Janssen (Ed.), Explosive Materials:Classification, Composition and Properties, Nova Science Publishers, Inc., Haup-pauge, N.Y., USA, 2011, p. 259.
15] C.R. Field, B.C. Giordano, D.A. Rogers, A.L. Lubrano, S.L. Rose-Pehrsson, J. Chro-matogr. A 1227 (2012) 10.
16] C.R. Field, A.L. Lubrano, D.A. Rogers, B.C. Giordano, G.E. Collins, J. Chromatogr.A 1282 (2013) 178.
17] J.F. Walling, J.E. Bumgarner, D.J. Driscoll, C.M. Morris, A.E. Riley, L.H. Wright,Atmos. Environ. 20 (1986) 51.
18] M.E. Sigman, C.D. Clark, R. Fidler, C.L. Geiger, C.A. Clausen, Rapid Commun. MassSpectrom. 20 (2006) 2851.
19] F.S. Romolo, L. Cassioli, S. Grossi, G. Cinelli, M.V. Russo, Forensic Sci. Int. 224
(2013) 96.20] C. Denekamp, L. Gottlieb, T. Tamiri, A. Tsoglin, R. Shilav, M. Kapon, Org. Lett. 7(2005) 2461.
21] N. Haroune, A. Crowson, B. Campbell, Sci. Justice 51 (2011) 50.22] C.R. Field, H.J. In, N.J. Begue, P.E. Pehrsson, Anal. Chem. 83 (2011) 4724.