Embed Size (px)
Citation preview

HAL Id: tel-03144060https://tel.archives-ouvertes.fr/tel-03144060v2
Submitted on 19 Feb 2021
HAL is a multi-disciplinary open accessarchive for the deposit and dissemination of sci-entific research documents, whether they are pub-lished or not. The documents may come fromteaching and research institutions in France orabroad, or from public or private research centers.
L’archive ouverte pluridisciplinaire HAL, estdestinée au dépôt et à la diffusion de documentsscientifiques de niveau recherche, publiés ou non,émanant des établissements d’enseignement et derecherche français ou étrangers, des laboratoirespublics ou privés.
Dynamic learning of the environment for eco-citizenbehavior
Davide Guastella
To cite this version:Davide Guastella. Dynamic learning of the environment for eco-citizen behavior. Artificial Intelligence[cs.AI]. Université Paul Sabatier - Toulouse III; Università degli studi (Catane, Italie), 2020. English.NNT : 2020TOU30160. tel-03144060v2
THESETHESEEn vue de l’obtention du
DOCTORAT DE L’UNIVERSITE DE TOULOUSE
Delivre par : l’Universite Toulouse III - Paul Sabatier (UT3 Paul Sabatier)Cotutelle internationale Universita degli Studi di Catania
Presentee et soutenue le 14/12/2020 par :
Davide Andrea GUASTELLA
Dynamic Learning of the Environment for Eco-Citizen Behavior
JURYMARIE-PIERRE GLEIZES Professeur d’Universite Co-DirectriceMASSIMO COSSENTINO Directeur de recherche Co-DirecteurVALERIE CAMPS Maıtre de Conference Co-EncadranteCESARE FABIO VALENTI Maıtre de Conference Co-EncadrantJEAN-PAUL JAMONT Professeur d’Universite RapporteurANDREA OMICINI Professeur d’Universite RapporteurLAURENT VERCOUTER Professeur d’Universite ExaminateurGIANCARLO FORTINO Professeur d’Universite Examinateur
Ecole doctorale et specialite :MITT : Domaine Mathematiques : Mathematiques appliquees
Unite de Recherche :Institut de Recherche en Informatique de Toulouse (IRIT)
Directeur(s)/Encadrant(s) de These :Valerie Camps, Massimo Cossentino, Marie-Pierre Gleizes et Cesare Fabio Valenti
Rapporteurs :Jean-Paul Jamont et Andrea Omicini

II

Davide Andrea Guastella
DYNAMIC AND REAL-TIME LEARNING OF THE ENVIRONMENT FOR
ECO-CITIZEN BEHAVIOR IN SMART CITIES
Thesis Supervisors Marie Pierre Gleizes, Full Professor, Universite Toulouse III Paul SabatierValerie Camps, Associate Professor, Universite Toulouse III Paul SabatierCesare Valenti, Associate Professor, Universita degli Studi di PalermoMassimo Cossentino, Senior Research Scientist, Consiglio Nazionale delleRicerche (CNR)
THE development of sustainable smart cities requires the deployment of Information and Com-munication Technology (ICT) to ensure better services and available information at any time
and everywhere. As IoT devices become more powerful and low-cost, the implementation of anextensive sensor network for an urban context can be expensive. This thesis proposes a techniquefor estimating missing environmental information in large scale environments. Our techniqueenables providing information whereas devices are not available for an area of the environment notcovered by sensing devices [1]. The contribution of our proposal is summarized in the followingpoints:
• limiting the number of sensing devices to be deployed in an urban environment;
• the exploitation of heterogeneous data acquired from intermittent devices;
• real-time processing of information;
• self-calibration of the system.
Our proposal uses the Adaptive Multi-Agent System (AMAS) [53] approach to solve theproblem of information unavailability. In this approach, an exception is considered as a Non-Cooperative Situation (NCS) that has to be solved locally and cooperatively. HybridIoT exploitsboth homogeneous (information of the same type) and heterogeneous information (information ofdifferent types or units) acquired from some available sensing device to provide accurate estimatesin the point of the environment where a sensing device is not available. The proposed techniqueenables estimating accurate environmental information under conditions of uncertainty arising fromthe urban application context in which the project is situated, and which have not been explored bythe state of the art solutions [2]:
• openness: sensors can enter or leave the system at any time without the need for any recon-figuration;

• large scale: the system can be deployed in a large, urban context and ensure correct operationwith a significative number of devices;
• heterogeneity: the system handles different types of information without any a priori configu-ration.
Our proposal does not require any input parameters or reconfiguration. The system can operatein open, dynamic environments such as cities, where a large number of sensing devices can appearor disappear at any time and without any prior notification. We carried out different experiments tocompare the obtained results to various standard techniques to assess the validity of our proposal.We also developed a pipeline of standard techniques to produce baseline results that will becompared to those obtained by our multi-agent proposal [4].

REMERCIEMENTS
Cette aventure qu’est la these s’approche finalement a sa conclusion : une epreuve d’effort, desacrifice, de devouement qui est resumee dans ces pages. Comme je ne suis pas une personne tresbavarde, je me limiterai a remercier dans ces lignes toutes les personnes qui m’ont permis d’arrivera ce resultat.
Tout d’abord, je remercie Andrea Omicini et Jean-Paul Jamont d’avoir accepte d’evaluer cettethese, ainsi que les membres du jury, Giancarlo Fortino et Laurent Vercouter.
Je tiens a remercier mes chers compagnons d’aventure (AKA les SMACkers) : Maxime, Guilhem,Kristell, Augustin, Bruno, Walid, Nicolas, Valerian, et tous les autres, permanents et non, vieux etmoins vieux. Merci a Valerie, pour ta rigueur et l’immense travail de relecture que t’as fait pourles articles ainsi que pour cette these et pour m’avoir soutenu et accompagne (avec beaucoup depatiente de ta part) vers ce resultat. Merci a Pierre et Marie-Pierre, plus que des simples encadrants,votre sourire, votre disponibilite et votre cordialite m’ont rassure et ont tout a fait rendu le travail dela these bien agreable. Je remercie Massimo et Cesare, veritables guides spirituels depuis longtempsdesormais. Je ne pourrai jamais vous remercier suffisamment pour tout ce que vous avez fait pourmoi, pour m’avoir soutenu (et supporte), pour vos precieux conseils. Je ne serais pas ici sans votresoutien.
Un grand remerciement va a ma famille pour son enorme soutien pendant ces annees passeesloin de chez eux.
Pour finir, merci a Giulia : merci de m’avoir toujours soutenu pendant ces annees vecues loinde toi, de m’avoir soutenu dans les moments les plus sombres de ce chemin, de m’avoir toujoursmontre le bon cote des choses, de rendre harmonieux ce monde chaotique. Je ne serai jamais capabled’exprimer tout mon amour pour toi, pour cela je dois m’appuyer sur les mots de quelqu’un autre :
I feel wonderful,Because I see the love light
in your eyes,And the wonder of it all,
Is that you just don’t realizehow much I love you
E. Clapton


Contents
I Context Domain and State of The Art
1 Introduction 1
1.1 Contribution . . . . . . . . . . . . . . . . . . . . . . . . . . . . . . . . . . . . . . . . . . 2
1.2 Manuscript Organization . . . . . . . . . . . . . . . . . . . . . . . . . . . . . . . . . . . 3
2 Introduction to Smart cities 5
2.1 Smart City Application Domains . . . . . . . . . . . . . . . . . . . . . . . . . . . . . . 7
2.1.1 Business-Related Domain . . . . . . . . . . . . . . . . . . . . . . . . . . . . . . 8
2.1.2 Citizens-related Domain . . . . . . . . . . . . . . . . . . . . . . . . . . . . . . . 8
2.1.3 Environment domain . . . . . . . . . . . . . . . . . . . . . . . . . . . . . . . . . 9
2.1.4 Government domain . . . . . . . . . . . . . . . . . . . . . . . . . . . . . . . . . 9
2.1.5 Discussion . . . . . . . . . . . . . . . . . . . . . . . . . . . . . . . . . . . . . . . 10
2.2 Defining the Smart City . . . . . . . . . . . . . . . . . . . . . . . . . . . . . . . . . . . 10
2.3 Smart City Value . . . . . . . . . . . . . . . . . . . . . . . . . . . . . . . . . . . . . . . 12
2.4 Challenges in Smart cities . . . . . . . . . . . . . . . . . . . . . . . . . . . . . . . . . . 14
2.5 Introduction to Artificial Intelligence . . . . . . . . . . . . . . . . . . . . . . . . . . . . 16
2.6 Artificial Intelligence for the Smart City . . . . . . . . . . . . . . . . . . . . . . . . . . 17
2.6.1 Discussion . . . . . . . . . . . . . . . . . . . . . . . . . . . . . . . . . . . . . . . 20
2.7 Conclusion . . . . . . . . . . . . . . . . . . . . . . . . . . . . . . . . . . . . . . . . . . . 21
3 State of the Art 22
3.1 Estimating Missing Information in Smart Cities . . . . . . . . . . . . . . . . . . . . . . 23
3.1.1 Discussion . . . . . . . . . . . . . . . . . . . . . . . . . . . . . . . . . . . . . . . 24
3.2 Bibliographic Study . . . . . . . . . . . . . . . . . . . . . . . . . . . . . . . . . . . . . . 25
3.3 Existing Solutions for Estimating Missing Information . . . . . . . . . . . . . . . . . . 26
3.3.1 Regression Techniques . . . . . . . . . . . . . . . . . . . . . . . . . . . . . . . . 26
3.3.2 Neural Network Techniques . . . . . . . . . . . . . . . . . . . . . . . . . . . . 31
CONTENTS
3.3.3 Gradient Boost Technique . . . . . . . . . . . . . . . . . . . . . . . . . . . . . . 363.3.4 Combined Techniques . . . . . . . . . . . . . . . . . . . . . . . . . . . . . . . . 37
3.4 Discussion . . . . . . . . . . . . . . . . . . . . . . . . . . . . . . . . . . . . . . . . . . . 403.5 Conclusion . . . . . . . . . . . . . . . . . . . . . . . . . . . . . . . . . . . . . . . . . . . 41
4 Multi-Agent Systems 424.1 Multi-Agent Systems . . . . . . . . . . . . . . . . . . . . . . . . . . . . . . . . . . . . . 43
4.1.1 Agents . . . . . . . . . . . . . . . . . . . . . . . . . . . . . . . . . . . . . . . . . 444.1.2 Environment . . . . . . . . . . . . . . . . . . . . . . . . . . . . . . . . . . . . . 464.1.3 Self-Organization . . . . . . . . . . . . . . . . . . . . . . . . . . . . . . . . . . . 47
4.2 Cooperation . . . . . . . . . . . . . . . . . . . . . . . . . . . . . . . . . . . . . . . . . . 484.3 Adaptive Multi-Agent Systems . . . . . . . . . . . . . . . . . . . . . . . . . . . . . . . 49
4.3.1 Non-Cooperative Situations . . . . . . . . . . . . . . . . . . . . . . . . . . . . . 514.3.2 Criticality . . . . . . . . . . . . . . . . . . . . . . . . . . . . . . . . . . . . . . . 52
4.4 Designing an AMAS with ADELFE . . . . . . . . . . . . . . . . . . . . . . . . . . . . . 534.5 Discussion . . . . . . . . . . . . . . . . . . . . . . . . . . . . . . . . . . . . . . . . . . . 544.6 Conclusion . . . . . . . . . . . . . . . . . . . . . . . . . . . . . . . . . . . . . . . . . . . 54
II Contribution 56
5 The HybridIoT Approach 575.1 Problem Statement . . . . . . . . . . . . . . . . . . . . . . . . . . . . . . . . . . . . . . 57
5.1.1 Discussion . . . . . . . . . . . . . . . . . . . . . . . . . . . . . . . . . . . . . . . 595.2 General Functioning of HybridIoT by Example . . . . . . . . . . . . . . . . . . . . . . 60
5.2.1 First case: no other sensor available . . . . . . . . . . . . . . . . . . . . . . . . 605.2.2 Second case: some sensors are present in the proximity of S1 . . . . . . . . . . 615.2.3 Third case: some sensors perceiving information of different types are present 625.2.4 Discussion . . . . . . . . . . . . . . . . . . . . . . . . . . . . . . . . . . . . . . . 63
5.3 System Objective . . . . . . . . . . . . . . . . . . . . . . . . . . . . . . . . . . . . . . . 645.4 System Requirements . . . . . . . . . . . . . . . . . . . . . . . . . . . . . . . . . . . . . 655.5 System Analysis . . . . . . . . . . . . . . . . . . . . . . . . . . . . . . . . . . . . . . . . 66
5.5.1 Global Level Analysis . . . . . . . . . . . . . . . . . . . . . . . . . . . . . . . . 695.5.2 Local Level Analysis . . . . . . . . . . . . . . . . . . . . . . . . . . . . . . . . . 705.5.3 Agents’ Characterization . . . . . . . . . . . . . . . . . . . . . . . . . . . . . . 72
5.6 Environment . . . . . . . . . . . . . . . . . . . . . . . . . . . . . . . . . . . . . . . . . . 765.7 Nominal Behavior . . . . . . . . . . . . . . . . . . . . . . . . . . . . . . . . . . . . . . . 77
5.7.1 Agents Nominal Behavior . . . . . . . . . . . . . . . . . . . . . . . . . . . . . . 785.7.2 Discussion . . . . . . . . . . . . . . . . . . . . . . . . . . . . . . . . . . . . . . . 79
5.8 Cooperative Behavior . . . . . . . . . . . . . . . . . . . . . . . . . . . . . . . . . . . . . 80

CONTENTS
5.8.1 Non-Cooperative Situation . . . . . . . . . . . . . . . . . . . . . . . . . . . . . 80
5.9 Estimation Procedure . . . . . . . . . . . . . . . . . . . . . . . . . . . . . . . . . . . . . 81
5.9.1 Endogenous Estimation by Historical Data . . . . . . . . . . . . . . . . . . . . 83
5.9.2 Endogenous Estimation by Confidence Zone . . . . . . . . . . . . . . . . . . . 89
5.9.3 Exogenous Estimation . . . . . . . . . . . . . . . . . . . . . . . . . . . . . . . . 99
5.10 Dynamic Ambient Context Window Evaluation . . . . . . . . . . . . . . . . . . . . . 107
5.11 Conclusion . . . . . . . . . . . . . . . . . . . . . . . . . . . . . . . . . . . . . . . . . . . 108
III Evaluation 110
6 Experimental Results 111
6.1 Dataset . . . . . . . . . . . . . . . . . . . . . . . . . . . . . . . . . . . . . . . . . . . . . 112
6.2 Comparison Solution . . . . . . . . . . . . . . . . . . . . . . . . . . . . . . . . . . . . . 114
6.2.1 Agglomerative Hierarchical Clustering . . . . . . . . . . . . . . . . . . . . . . 115
6.2.2 Normalized Convolution . . . . . . . . . . . . . . . . . . . . . . . . . . . . . . 116
6.2.3 Analysis of the Results . . . . . . . . . . . . . . . . . . . . . . . . . . . . . . . . 118
6.3 Endogenous Estimation . . . . . . . . . . . . . . . . . . . . . . . . . . . . . . . . . . . 121
6.3.1 Analysis of the Results . . . . . . . . . . . . . . . . . . . . . . . . . . . . . . . . 121
6.3.2 Comparison to the State of the Art . . . . . . . . . . . . . . . . . . . . . . . . . 123
6.4 Endogenous Estimation by Confidence Zone . . . . . . . . . . . . . . . . . . . . . . . 126
6.4.1 Analysis of the Results . . . . . . . . . . . . . . . . . . . . . . . . . . . . . . . . 128
6.5 Exogenous Estimation using Heterogeneous Information . . . . . . . . . . . . . . . . 130
6.5.1 Analysis of the Results . . . . . . . . . . . . . . . . . . . . . . . . . . . . . . . . 132
6.6 Discussion . . . . . . . . . . . . . . . . . . . . . . . . . . . . . . . . . . . . . . . . . . . 134
Conclusions and Future Perspectives 138
IV Appendices 144
A Classical Methods for Estimating Missing Information 145
A.1 Mathematical Techniques . . . . . . . . . . . . . . . . . . . . . . . . . . . . . . . . . . 146
A.1.1 Mean Estimation . . . . . . . . . . . . . . . . . . . . . . . . . . . . . . . . . . . 146
A.1.2 Regression Estimation . . . . . . . . . . . . . . . . . . . . . . . . . . . . . . . . 147
A.1.3 Discussion . . . . . . . . . . . . . . . . . . . . . . . . . . . . . . . . . . . . . . . 149
A.2 Artificial Intelligence Techniques . . . . . . . . . . . . . . . . . . . . . . . . . . . . . . 149
A.2.1 Neural Networks . . . . . . . . . . . . . . . . . . . . . . . . . . . . . . . . . . . 149
A.2.2 Radial Basis Function Networks . . . . . . . . . . . . . . . . . . . . . . . . . . 150
A.2.3 Soft-Sensor . . . . . . . . . . . . . . . . . . . . . . . . . . . . . . . . . . . . . . 150

CONTENTS
A.2.4 Fuzzy Rules . . . . . . . . . . . . . . . . . . . . . . . . . . . . . . . . . . . . . . 151A.2.5 Random Forest Regression . . . . . . . . . . . . . . . . . . . . . . . . . . . . . 151A.2.6 Gradient Boost Decision Trees . . . . . . . . . . . . . . . . . . . . . . . . . . . 153
B The ADELFE Methodology 155B.1 WD1 - Preliminary Requirements . . . . . . . . . . . . . . . . . . . . . . . . . . . . . . 155B.2 WD2 - Final requirements . . . . . . . . . . . . . . . . . . . . . . . . . . . . . . . . . . 156B.3 WD3 - Analysis . . . . . . . . . . . . . . . . . . . . . . . . . . . . . . . . . . . . . . . . 157B.4 WD4 - Design . . . . . . . . . . . . . . . . . . . . . . . . . . . . . . . . . . . . . . . . . 159B.5 WD5 - Implementation . . . . . . . . . . . . . . . . . . . . . . . . . . . . . . . . . . . . 160
Glossary 162
Own Bibliography 162
Bibliography 163

Part I
Context Domain and State of The Art
Chapter 1Introduction
THE increasing diffusion and accessibility of the Internet Of Things (IoT) sensors enabled citiesto become urban sensing platforms [105]. Data acquisition, through these platforms, enables
cities to become ”Smart”, using environmental information collected in a participatory way toimprove services and reduce their ecological footprint [40]. Environmental information includesinformation about air, water, soil, land, flora and fauna, energy, noise, waste and emissions, but alsoinformation about decisions, policies and activities that affect the environment [72].
A wide instrumentation of the environment through sensing devices could help to assessimportant information such as pollution [69], hydrological forecasting [128] or traffic estimation [60].However, in large-scale contexts is difficult to deploy a large number of devices so as to enablesufficient informative coverage through the urban environment; this is due to the high costs ofmaintenance and installation of the network infrastructure [60]. For this reasons, it is necessary toconceive effective solutions that enable leveraging the potential of data perceived through a widerange of sensing devices.
Thanks to their increasing computational power and accessibility, smart devices can be exploitedto make data acquisition in cities a participatory activity. This is the key concept of Mobile CrowdSensing (MCS), which leverages device mobility and sensing capabilities, as well as human col-laboration and intelligence to distributively perform tasks and provide cost-efficient applicationsand services [79]. For example, residents can use MCS for in-building navigation, real-time publictransportation information, for cooperating with local administrators and policy-makers in activitiessuch as reporting damages to public facilities. Moreover, the government departments can use MCSas a useful tool to monitor, manage, and upgrade the city infrastructures efficiently [79]. For that,MCS enables integrating different types of smart devices into a large scale sensing infrastructure.However, smart devices can embed a limited set of sensors: in this case, it is necessary to compensatefor the lack of data through a mechanism for estimating the missing information.
1

Chapter 1. Introduction
1.1 Contribution
This thesis presents the HybridIoT system, based on a Multi-Agent System (MAS), that enablescoping with the lack of environmental information at a large scale. A MAS is a system composed ofmultiple interacting and autonomous entities known as agents, each one acting and sensing within acommon environment. Agents have a partial view of their environment; they act jointly to producea result for a goal that cannot be achieved individually. Due to the distribution of tasks within theagents and the possibility to decentralize control and decision, a MAS is more suitable to modeland simulate complex systems than traditional approaches [99]. It offers a framework to model,study, and control complex systems with a bottom-up approach by focusing on the entities andtheir interactions to solve a wide variety of problems [150].
The novelty of our contribution lies in:
• providing a solution for estimating missing environmental information in local parts of theenvironment not sufficiently covered by sensing devices through the exploitation of historicaldata perceived by sensors;
• limiting the installation of a large number of sensing device thanks to the use of virtualsensors;
• proposing a technique to estimate missing data of a particular type (in terms of unit, scale, andinformation) using the information of the same type and/or information of different types.
The benefits of the HybridIoT compared to the state of the art techniques consist of the followingproperties:
• openness: the system allows the sensors to enter or leave the system at any time withoutcompromising its operation. Current state of the art solutions make use of mathematical orartificial intelligence techniques that prevent real-time operation and do not allow sensors toenter or leave the system;
• heterogeneity: HybridIoT exploits both homogeneous and heterogeneous information comingfrom mobile and intermittent sensors in order to provide accurate estimates whereas sensingdevices are not available. We say a group of information to be homogeneous if it is composedof information of the same type, composed of information of the same nature. Contrarily, agroup of heterogeneous information contains information of different types, not necessarilycorrelated;
• large-scale: the multi-agent approach distributes the computation among several computationalentities (agents) that operate in local parts of the environment. This approach ensures that thesystem can operate independently of the number of sensing devices involved in its operation.
Dynamic Learning of the Environment for Eco-Citizen Behavior 2

Chapter 1. Introduction
• configuration: the system does not require any parameters that depend on the applicationcontext or the information perceived by the sensors. HybridIoT does not require any particularconfiguration;
• cost-effectiveness: the use of virtual sensors, on which the HybridIoT system is based, makesit possible to avoid the installation of a large number of physical sensors. This reduces theinstallation and maintenance costs of the sensor network;
• privacy: it refers to the ability of the system to avoid the diffusion of personal data. Thisis important when using devices such as smartphones, or in general, devices that use per-sonal information. HybridIoT does not make use of any personal data; instead, only theenvironmental information is used for the estimation.
In a large-scale environment, several thousand devices could face unpredictable situations inwhich information has to be estimated and provided to users. Moreover, having a large amountof heterogeneous information is useful in different application contexts: at the urban level, a deepknowledge of environmental dynamics can be useful to governments to provide better servicesto citizens (e.g. by observing air quality, pollution levels); at extra-urban level, observing hetero-geneous environmental information can help to understand and possibly anticipate phenomenasuch as floods or fires. In these contexts, it is required to have an infrastructure composed of a largenumber of reliable sensors to ensure a continuous and effective observation of the environment.The implementation of a system for estimating missing information at large-scale requires highcomputational power and efficient communication infrastructure. Our proposal allows reducing theneed for high computational time through a distributed computation paradigm based on AMAS.
1.2 Manuscript Organization
This manuscript is organized as follows:
• Section I: Context domain and state of the art
– (Chapter 2) This chapter provides an overview of the smart city, discusses its importancein urban and technological development and its different areas of application. Later wefocus on some of the main challenges that concern the domain in which our proposaltakes place. The chapter ends with a theoretical problem statement to formalize theproblem that this thesis address.
– (Chapter 3) This chapter describes the principal methods for estimating missing informa-tion in urban and large scale context. We study these state of the art methods accordingto the properties of openness, large scale, and heterogeneity, addressed by our proposal.
3 Dynamic Learning of the Environment for Eco-Citizen Behavior

Chapter 1. Introduction
– (Chapter 4) This chapter provides an introduction to multi-agent systems and then to theadaptive multi-agent systems which is a pertinent approach to tackle problems such asunexpected behaviors, the integration in open and heterogeneous environments.
• Section II: Contribution
– (Chapter 5) This chapter concerns the contribution of this thesis. Our proposal, calledHybridIoT, is a multi-agent system that implements a technique for estimating missingenvironmental information. The proposed method addresses the properties of largescale, openness and heterogeneity. The definition of our proposal follows the guidelinesof the ADELFE methodology for the development of adaptive multi-agent systems.
• Section III: Evaluation
– (Chapter 6) This chapter describes the real dataset used for the experiments, which isnot pre-processed by the proposed technique. Then the chapter describes the evaluationtechniques used to evaluate our proposal under different experimental conditions andthe obtained results.
Dynamic Learning of the Environment for Eco-Citizen Behavior 4

Chapter 2Introduction to Smart cities
Objectives of this chapter:
• Introduce the smart city as a tool to face the development and needs of modern society
• Identify the application domains of the smart city
• Review the main definitions of the smart city
• Identify the economic and social value created by smart cities
• Identify the current challenges for the development of smart cities
IN the olden and not-so-olden days, technological advances have accompanied the development ofhuman settlements to manage the increasing complexity of society demands. This phenomenon
has intensified considerably during the period of nineteenth-century industrialization, allowingmany cities around the world to become landmarks in technological and social development. At thattime, technological development was strictly linked to the exploitation of resources such as steampower and electricity. The urban expansion was not driven only by new machines that amplifiedour physical might, but also by inventions that multiplied our ability to process information andcommunicate quickly over great distances. For example, the telegraph revolutionized the wayof communicating: it has facilitated communication between private individuals and industry,accelerating social and technological progress and reducing, although virtually, the distancesbetween individuals.
Today communication has gone far beyond these objectives, enabling real-time interactionbetween people in every corner of the world and making telematic means accessible to a largepart of the world’s population. The miniaturization of communication devices, their increasingcomputational power and low-price allow having tools that do more than just communication tasks:
5

Chapter 2. Introduction to Smart cities
understanding the users’ lifestyle to suggest purchases, remind events, meetings, but also observingthe environment, getting the status of traffic. In less than 100 years, communication devices havebecome truly personal assistants.
Communication is just one of the examples of technological advancement that has led to thedevelopment of modern cities. It emerged that the growth of cities and the technological progressare strongly linked [134]. The continuous urban development, the increasingly complex needs ofthe society and ever-increasing urbanization have led today to a need for technological means toguarantee better services to citizens. Governments aim at interacting in a simpler and efficient waywith citizens, police authorities to guarantee greater security and also to exploit energy resources ina responsible and sustainable way. These needs led to the definition of the concept of ”Smart City”.
Smart cities can be seen in two different ways:
• [a smart city] defines how cities can be conceived and developed in order to guarantee a highquality of life and intelligent use of energy resources;
• [a smart city should] integrates new technologies with existing infrastructures to improve thefunctioning of cities by enhancing their efficiency and improving their competitiveness.
In both cases, the smart city allows cities to integrate in a transparent and ubiquitous way theindustrial and technological advances so that cities can face a sustainable development and reducethe environmental impact of human activity while ensuring a good quality of life.
The smart city answers, through technological means, to problems of resource optimization,efficient governance, better interactions with citizens. Briefly, the smart city affects all aspects of theurban society: where there is now waste (in terms of time and/or resources), there will be efficiency.Where there are volatility and risk, there will be predictions and early warnings. Where there arecrime and insecurity, there will be watchful eyes. Where you now stand in line, you will insteadaccess government services online [134].
This technological revolution makes it possible to exploit better governance over cities whosepopulation raised dramatically over the last century. Smart city initiatives have a significant impacton various aspects: governance, people and communities, economy, natural environment, and builtinfrastructure.
Different cities have started implementing their smart projects in different ways. Because theconcept of smart city is not related to any particular project, each city has an enormous set of possibleactions to be carried out, but which to choose? Figure 1 shows the map of cities all over the worldawarded for their smartness by the Intelligent Communities Forum [33].
Developing a smart city is a complex task because it involves several dimensions: technology,citizens, public and private organizations, urban vision, security. Consequently, the possiblescenarios related to the smart city context are particularly wide and in continuous evolution.Moreover, smart initiatives interest cities all over the world, with very deep differences with each
Dynamic Learning of the Environment for Eco-Citizen Behavior 6

Chapter 2. Introduction to Smart cities
Figure 2.1: Intelligent cities in the world [33]
other: cultural, economic, social. Every city wants both to apply a shared smart city idea and topursue its own specific goals [34].
Even if the majority of the urban population lives in metropolises, the main focus of urbanresearch tends to be in medium-sized cities. Medium-sized cities, which have to face the competitionof the larger metropolises on corresponding issues, appear to be less well equipped in terms ofcritical mass, resources and organizing capacity. To enforce the development and achieve a goodposition, cities have to identify their strengths and chances for positioning and ensuring thecomparative advantages in certain key resources against other cities of the same level [83].
The growth of cities leads to a demand for more energy resources and more efficient servicesfor citizens. In this context, smart city initiatives play a major role in the development of urbancontexts that allows to guarantee a high level of quality of life and to use environmental resourcesin a respectful manner.
This chapter provides a brief introduction to the smart city. The rest of this chapter is organizedas follows: section 2.1 presents the main application domains in which the concept of smart city takesplace. Section 2.2 presents some of most common definitions of smart city according to the academicand industrial world. Section 2.3 discusses the importance of the socio-economic return that smartinitiatives should bring to both attract investments and produce value for societies. Section 2.4discusses some of the main challenges in the development of a smart city. Finally, section 2.5 brieflyintroduces the AI, its evolution and its role in assisting human activities. Section 2.6 discusses howAI integrates into smart cities.
2.1 Smart City Application Domains
Smart initiatives focus on exploiting technological means to provide better services to citizens,ensure a good quality of life and drive sustainable urban development. Sanchez-Corcuera etal. [120] separate the application domains of smart city in four categories:
• business-related domain,
7 Dynamic Learning of the Environment for Eco-Citizen Behavior

Chapter 2. Introduction to Smart cities
• citizens-related domain,
• environment domain and
• government domain.
2.1.1 Business-Related Domain
The business-related category includes all the applications that make use of information technolo-gies to promote the development and growth of companies and industries. The most commonapplication is the advertisement, where technological means are used to promote products, servicesand reach a wide range of the population. For example, the diffusion of mobile devices such assmartphones have allowed the spread of advertising through services such as social networks. Theinformation that can be collected from users, such as their habits, searches, purchases, are usedto provide targeted advertising to increase the likelihood that advertisements will be attractive.On the other hand, this constitutes an ethical issue that concerns the invasive use of technologicalmeans to acquire personal data from citizens. Advertising must be carried out in a user-orientedand non-invasive manner while being aware of the privacy of users.
2.1.2 Citizens-related Domain
Citizens-related domain concerns all the aspects of citizens’ lives that can be assisted by techno-logical means. Education, urban services, health, transport are some of the services that concernthis domain. In healthcare service, the use of Information and Communication Technologies (ICT) leadsto the concept of electronic health (e-health), which contributes to reducing costs and increasesthe efficiency of medical treatments. In this domain, the last few years have seen the developmentof integrated systems that allow continuous and precise monitoring of patients’ health remotely,using non-invasive sensors and monitoring devices. In 2020, the advent of the CoVid-19 pandemicenabled an extensive use of this type of technology to avoid overcrowding in hospitals by doingtelematic consultations but also to do contact tracing to identify the persons who may have comeinto contact with an infected person. This is the case of multiple application deployed in differentcountries such as France (StopCovid), Italy (Immuni), Germany (Corona-Warn-App). The use oftechnologies based on sensors and applications integrated with smartphones has made it possibleto calculate more quickly and effectively models of contagion used to prevent the diffusion ofthe virus [112]. Using mobile and ubiquitous devices in healthcare domain has enormous advan-tages such as monitoring capabilities, wide availability and immediacy that contribute to monitorefficiently the health state of patients [126].
In the domain of transport, recent development in ICT enabled the integration of technologicaldevices in urban contexts to avoid delays, bottlenecks, pollution, accidents, and a continuousdecline in the quality of life for citizens in high polluted areas [124]. The integration of ICT
Dynamic Learning of the Environment for Eco-Citizen Behavior 8

Chapter 2. Introduction to Smart cities
with the transportation infrastructure enables a better, safer traveling experience with IntelligentTransportation Systems (ITS) [60], which enables continuous observation of the environment.
2.1.3 Environment domain
Smart environment applications have as objective the minimization of the ecological and energyfootprint of cities. Sanchez-Corcuera et al. [120] identified the following sub categories for thisdomain: building, housing, pollution control, public space, renewable energy, smart grid, wastemanagement, and water management.
Buildings are the place where citizens spend most of their time, to live but also to work.Consequently, buildings are considered as the largest consumers of energy, especially in largecities [48]. Smart building initiatives have as objective the definition of methods and tools to reduceenergy consumption while ensuring a good level of comfort for users. Therefore, buildings areimportant testbeds for the implementation of smart technologies. The use of intelligent systemsallows automating Heating, Ventilation and Air-Conditioning (HVAC) systems to reduce energyconsumption by ensuring a good level of comfort for occupants. HVAC systems run on schedulesthat are meant to address these properties, generally by using IoT sensors that allow observing theenvironment and users’ habits.
Smart grid networks constitute an evolutionary step for power supply networks. A smartgrid is an enhancement of the traditional power grid, used to carry out power from a few centralgenerators to a large number of users or customers [44]. These networks improve efficiency andreliability and provide an uninterrupted energy supply to homes and businesses [82]. The increasein the size of the cities and the subsequent demographic increase requires adequate support for theelectricity grid to meet the needs of citizens. This does not necessarily involve the production of alarge amount of energy, but rather the use of different energy sources as well as the redistributionof the electrical load to ensure good coverage without energy losses.
2.1.4 Government domain
Smart government domain refers to city monitoring, e-government, emergency response, publicsafety, public service, and transparent government services. Academic researches suggest the im-portance of comprehensive governance by both local and central governments, aiming at designingan urban smart strategy [32]. Smart government applications use ICT to better interact with theircitizens, taking advantage of all available data to solve issues involving services and infrastructures.Therefore, governments need to involve citizens to provide them with better services. In recentyears the government domain has driven the spread of public urban databases containing infor-mation on different aspects of the city (mobility, environment, citizens). The technology advances,involving the diffusion of miniaturized devices capable of acquiring data from the environment,is contributing to the production of these databases containing impressive amounts of data that
9 Dynamic Learning of the Environment for Eco-Citizen Behavior

Chapter 2. Introduction to Smart cities
have the potential to help us to better understand complex social problems as well as to improvegovernment relationships with citizens, private organizations, and other governments [94]. On theone hand, these databases allow citizens to have accurate and up-to-date information about thecity. On the other hand, the information is useful for experts to evaluate improvement measuresto make cities attractive. Moreover, governments must establish guiding principles of openness,transparency, participation, and collaboration to manage and facilitate the flow of informationacquired in the urban context to address the development of a smart city [6].
2.1.5 Discussion
From the discussed domains, which are just some of the applications of the smart initiatives, itemerges that ICT plays a key role in the development of smart initiatives. Smart City applicationsrun on top of the ICT infrastructure that puts a bridge between citizens and governance to improvecity services.
The achievement of smartness goals requires extensive use of information acquired by differ-ent, heterogeneous technologies: in the traffic domain through ICT devices for acquiring trafficinformation to improve traffic conditions, in the medical domain to provide accurate diagnoses;in the environmental domain to provide precise indications on the state of the environment, topredict harmful phenomena. Therefore, it is necessary to exploit ICT extensively through the useof sensing devices to acquire a large amount of information. Nevertheless, as sensing devicesoperate independently, it is necessary to provide mechanisms of coordination and integration ofinformation that allows creating an accurate knowledge base that can contribute to the achievementof smartness goals. However, instrumenting a large scale environment with many sensing devicescan be expensive (in terms of both installation and maintenance), therefore it is necessary to con-ceive non-intrusive solutions to provide information without deploying a large number of sensingdevices.
2.2 Defining the Smart City
Defining the smart city is difficult because there is no accepted definition and because of the varietyof application domains in which the concept of ”smart” is applied, as discussed in the previoussection. The same concept can vary from city to city, initiative to initiative. It seems that everycity all over the world, across continents and independently from dimension, culture, economicsituation, considers important to be smart [33].
The difficulty to define a Smart City regards mainly two aspects [27]: (i) the adjective ”smart”depends on the meaning we attribute to this word. This is mainly due to the variety of applicationdomains in which the concept of the smart city takes place, as different typologies of the smartcity exist, (ii) the label ”smart city” is a fuzzy concept and it is used in ways that are not always
Dynamic Learning of the Environment for Eco-Citizen Behavior 10

Chapter 2. Introduction to Smart cities
in accordance each other. There are many cities that define themselves as smart because of sometechnological characteristics, but without referring to a standard meaning.
Townsend [134] defines smart cities as ”places where information technology is combined with infras-tructure, architecture, everyday objects, and even our bodies to address social, economic, and environmentalproblems”. As technology must accompany the urban development of cities, the most importantquestion to answer would be ”what do we expect from a smart city”. The development of thecities passes from different aspects such as mobility, energy, health, environment... therefore theconcept of the smart city is strongly ambiguous; various definitions differentiate between severalapplications areas [2].
Dameri [33] identifies the most common definitions of the smart city according to differentacademic and industrial points of view:
• A city that monitors and integrates conditions of all of its critical infrastructures, including roads,bridges, tunnels, rails, subways, airports, seaports, communications, water, power, even majorbuildings, can better optimize its resources, plan its preventive maintenance activities, andmonitor security aspects while maximizing services to its citizens.
• A city to be smart when investments in human and social capital and traditional (transport)and modern (ICT) communication infrastructure fuel sustainable economic growth and highquality of life, with a wise management of natural resources, through participatory governance.
• The smart city is the use of smart computing technologies to make the critical infrastructurecomponents and services of a city—which include city administration, education, healthcare,public safety, real estate, transportation, and utilities—more intelligent, interconnected, andefficient.
• (Smart cities are about) leveraging interoperability within and across policy domains of the city(e.g. transportation, public safety, energy, education, healthcare and development). SmartCity strategies require innovative ways of interacting with stakeholders, managing resourcesand providing services.
• A city in which it can combine technologies as diverse as water recycling, advanced energy gridsand mobile communications in order to reduce environmental impact and to offer its citizensbetter lives.
• A city where social and technological infrastructures and solutions facilitate and acceleratesustainable economic growth. This improves the quality of life in the city for everyone.
• A city that uses Information and Communication Technology (ICT) to sense, analyze and integratethe key information of core systems in running cities.
Due to the heterogeneity of definitions, a unique definition would not be sufficient to give aglobal meaning to the concept of smart city. On the one hand, the term smart is generic and it is not
11 Dynamic Learning of the Environment for Eco-Citizen Behavior

Chapter 2. Introduction to Smart cities
possible to give a global meaning to what represents a smart city; on the other hand, the initiativesare specific in their domain of application, preventing the formalization of the concept of the smartcity. For this reason, academics and organizations prefer to define the smart city according to thedomain of interest.
Dameri [31] analyzes five macro-areas of interest in which smart initiatives can be grouped. Thiswould avoid looking for a unique definition of a smart city, but rather analyzing five macro-areas ofinterest for multiple domains:
• Intelligent city: it is able to produce knowledge and to translate it into unique and distinctiveabilities; this city is smart because it is able to create intellectual capital and to grounddevelopment and well-being on this intellectual capital;
• Digital city: it is a wired, digitalized city, using ICT both for data processing and for informationsharing, but also to support communication and Web 2.0 democracy;
• Sustainable city: it aims to become a ”green city” by using technology to reduce pollution, toproduce energy and to improve the efficiency of buildings;
• Technocity: it uses the technology to improve the efficiency and effectiveness of its infras-tructures and services: it focuses its smart projects on urban space quality, mobility, publictransports, logistic.
• Well-being city: it uses technology as a mean to improve the quality of life for citizens. Betterservices, climate management, noise reduction in working places are some examples wherewell-being concept takes place.
These concepts do not represent disjoint areas of analysis and still share some common aspects.Therefore, a smart initiative can be identified in one or more of the above definitions; for example, asmart initiative may pursue a goal that concerns both sustainable and well-being city. The previousmacro-areas highlight the possibility of extending smart initiatives to different aspects of the urbancontext. The design and implementation of smart initiatives involve significant investments forcities.
Regardless of their type, smart initiatives must create both economic and social value. Thefollowing section discusses the value created from the use of smart initiatives in urban contexts.
2.3 Smart City Value
The definitions of smart city discussed in the previous section reveal that there is a significant in-crease in smart initiatives in both academic and industrial communities. Smart initiatives attempt tocreate socio-economic value in the context of urban development through technological innovations.Creating value by smart city initiatives is mandatory when applying for funding, especially for the
Dynamic Learning of the Environment for Eco-Citizen Behavior 12

Chapter 2. Introduction to Smart cities
European Union. This is one of the biggest challenges for smart city projects. If these projects are notable to boost economy or even be economically successful to be able to become autonomous, smartcity projects will always have to rely on governmental support and funding [11]. City leaders arestruggling to identify the true sources of value that novel ICT can generate for their municipalities;in fact, it is difficult to transform a high-level concept into actionable, effective solutions that delivermeasurable value to the citizenry. This is in part due to the nature of the city itself, which is anenormously complex and open-ended system, with many force fields simultaneously influencingits form and continuously evolving [28].
To create value through smart city initiatives, technological systems must allow redefiningboth institutions and urban environments in an accessible and transparent way. Generally, the useof smart solutions makes it possible to use the knowledge acquired from observing informationdisseminated on an urban scale to improve the quality of life so that cities become attractive forcitizens and industries. An attractive city generates investments and consequently importantrevenues generated by an increase of population and industries. Because cities must continuouslyadapt to population growth by providing solutions that ensure a good quality of life for its citizens,smart initiatives must solve efficiently problems that directly affect citizens, such as traffic, energy,pollution and water quality. These aspects are also near to the idea of a green city: the environmentaltopic is an important part of the smart city goals [34].
Indeed, it is important to define what does public value means: it interests the economicalaspects of the community and involves different persons or organizations in different ways, eachone with their needs and expectations. Creating public value in a smart city means to put togethera large set of variables and to compose them into a well-defined general framework, able to collectthe needs, the expectations and the perception of citizens respect to the smart city for their dailylife [27].
The use of technology itself is not sufficient to justify the development of a smart city: technologyprovides a means to achieve smartness goals. The development of smart initiatives requiressignificant investment and because of these entities that invest in these initiatives and that aimfor an economic return. To define the smartness objectives of an initiative, especially in an urbancontext, it is important to interact directly with citizens, asking what they expect from a smart city.It follows that citizens are at the center of the development of smart cities and it is necessary toinvolve them in these activities. Modern social media and communication technologies constitutean efficient channel of communication between citizens and institutions. These communicationchannels can also be used to notify citizens about services or possible problems that have arisenin the city. In this way, individuating smartness objectives from citizens’ opinions can be doneefficiently.
Once the smartness objectives are defined, they must be measured. Measuring the public valuecreated and supplied thanks to a smart city program is a complex task. This is primarily becausesmart city benefits are not defined, not measured and not communicated [31].
13 Dynamic Learning of the Environment for Eco-Citizen Behavior

Chapter 2. Introduction to Smart cities
A smart city that creates value for the community must take into account different aspects suchas the effectiveness, the environment and the innovation [27]:
• Effectiveness means the capacity of a city to supply effective public and private services toseveral subjects, such as citizens, companies, not-for-profit organizations;
• Environmental consideration regards the increasing impact that large cities have on the environ-mental quality of urban areas. One of the main pillars of smarter cities is to prevent furtherenvironmental degradation.
• Innovation means that a smart city should use all the new and higher available technologiesto improve the quality of its core components, to deliver better services and to reduce itsenvironmental impacts. Technology is, therefore, a central aspect of a smarter city, used forimplementing smart initiatives for the quality of life in the city.
Different challenges must be undertaken to develop an efficient system that meets the previousgoals and can create not only innovation but also socio-economic value. In general, each smartinitiative differs by application domain, so as the challenges. The following section discusses someof the challenges that must be addressed in smart initiatives that focus on sustainable and intelligentcities.
2.4 Challenges in Smart cities
In recent years, the issue of sustainable development of cities has become of great importance dueto an increase in population and the consequent need to ensure services and good quality of lifewhile exploiting resources in a rational way. According to the World Health Organization (WHO),the proportion of people living in an urban environment will grow significantly by 2050. It ischallenging for cities to accommodate such a large amount of population. They must deal withissues such as congestion and increasing demand for resources including energy, water, educationand health-care services.
In the last decade, the concept of sustainable city became increasingly important. This is pri-marily caused by rapid urbanization processes that must be supported by government institutionsin order to ensure a high-quality level of life for the citizens by also taking care of the environment.In fact, the climate change primarily driven by human-caused greenhouse gas, will yield warmertemperatures than the previous 150 years, and possibly warmer than at any time in the last 2000years [42], making the earth a hostile place in which man can live. A smart city must address asustainable development of urban context to avoid carbon dioxide (CO2) emission, reducing airpollution and improving the quality of life of citizens [100].
The development of smart environments introduces several challenges regarding the integrationof heterogeneous systems and technologies, scalability, reliability and functional extensibility. In
Dynamic Learning of the Environment for Eco-Citizen Behavior 14

Chapter 2. Introduction to Smart cities
particular, functional extensibility refers to the problem of adding new services to the set of existingones already working in a given home environment [26].
One of the most important challenges to consider for addressing sustainable developmentis to integrate technological tools that enable precise and large-scale analysis of environmentalinformation that can be used by experts to manage resources efficiently. It is not just a matterof acquiring data, rather creating useful knowledge from a huge amount of data collected fromdifferent, heterogeneous sources of data. A sustainable city is instrumented with ICT infrastructuresfor optimizing the resource distribution, preventing resource outages, ensure easy and rapidmaintenance actions, and so on. To do this, a large variety of interconnected sensing devices mustbe exploited in cities to acquire information from the urban context.
The increasing diffusion and accessibility of the Internet of Things (IoT) sensors enabled citiesto become urban sensing platforms [105]. The development of IoT systems such as the smartcity, its management as well as its integration in real applications is complex and challenging,thereby requiring suitable models, methods/techniques and technologies. Different solutionshave been developed to face challenges such as physical device virtualization, decentralized entitymanagement, and guideline identification. However, these solutions tend to tackle different specificissues, typically one at a time, without providing a full-fledged methodology to support theentire IoT system development process, from analysis to implementation [47]. Data acquisitionthrough IoT platforms allows cities to become smart, using data collected in a participatory wayto improve services and reduce their ecological footprint [40]. The IoT aims at providing a globalinfrastructure for the information society, enabling advanced services by interconnecting physicaland virtual things based on existing and evolving interoperable information and communicationtechnologies. IoT provides a lower layer made up of the individual devices and their communicationand computing capabilities. The main challenge of the IoT is to achieve full interoperability ofinterconnected devices while guaranteeing the trust, privacy and security of communications [108].The integration of IoT technologies in the urban contexts requires coordination of devices throughintelligent systems known as Ambient Systems, having numerous mechanisms that rule the behaviorof the environment. Ambient Intelligence provides ambient systems with mechanisms necessary tocarry out reasoning activities using a representation of the environment perceived by IoT devices.Ambient systems are designed to provide adapted services that respond to an individual, collective,and social requirement. The term environment refers to a physical space enriched with sensors andcomputational entities that are seamlessly and invisibly interwoven. To be considered as smart orintelligent, an environment needs to be associated with a representative description that can beconstructed from the perceptions of the ambient components. The interactions of ambient componentsenable a smart city to enhance its services such as transports, health, cultural events and so on.Nevertheless, avoiding the installation of new components in an ambient system to provide preciseeverywhere and anytime information on the environment is a difficult task [2].
Ambient systems represent a key solution to integrate different technologies and provide an
15 Dynamic Learning of the Environment for Eco-Citizen Behavior

Chapter 2. Introduction to Smart cities
IoT infrastructure to be aware of the environment, doing pervasive computing and profilingthrough human-centric computer interactions [138]. Today there is a growing interest to supporttechnologies to support not only smart cities but also smart regions. Moreover, the deployment ofapplications in large scale environments is a difficult task due to a variety of constraints (e.g. energy,communication, computing capacities, mobility, autonomy) [4].
The implementation of a sustainable smart city must consider the complexity of the physicalworld: a city is characterized by multiple dynamics, non-linear relations, feedbacks, unpredictability,strong inertia... where the non-linearity leads to the impossibility to plan all the consequences ofa change, even small. Therefore, the smart city is not static, it evolves with citizens, with policies,with its environment, and must be resilient in order to quickly answer to new challenges [55].A single centralized technological solution would be inefficient because of the complexity of thephysical environment; for this reason, it is expected that different technologies are integrated tocreate a solution that can cope with the complexity of the environment and respond effectivelyto the needs of both citizens and experts. Therefore, smart cities become Systems of Systems (SoS)aiming at bringing significative benefits to government, society, economy, and environment, as wellas providing a complete, holistic view of the city. In this vision, each of such constituent systemsmight be SoS themselves, thereby increasing the matters of scale and complexity in the design,engineering, and operation of these systems [23].
2.5 Introduction to Artificial Intelligence
For over two thousand years scientists and philosophers have questioned how the human mindworks. This question is still unanswered today, despite technological advances. Some philosophershave picked up the computational approach originated by computer scientists and accepted theidea that machines can do everything that humans can do [97].
In the scientific community, Alan Turing was one of the first scientists to advance the idea thatmachines could have some sort of ”intelligence”. In his lecture at the London Mathematical Societyon February 20, 1947, Turing outlined the meaning of what today we define as Artificial Intelligence:”What we want is a machine that can learn from experience” [135]. Even then, Turing believed thatcomputers should have some kind of intelligence more than being barely capable of performingcalculations. As a matter of fact, at that time computers have been conceived for supporting usersin doing long and tedious calculations in a short time. This process was pursued by executing aset of ordered instructions specified by the user so that the calculation is done correctly. Moreover,the user was conscious that the calculation has been done by the machine in a mechanical way,without any personal judgment guided by the ”spirit”, so the user knows perfectly the steps thatlead the machine to its result. The user entered in the machine the detailed instructions, designedby himself.
The idea of Turing was that machines could be able not only to simulate human activities but also
Dynamic Learning of the Environment for Eco-Citizen Behavior 16

Chapter 2. Introduction to Smart cities
to learn: he thought that modifying a computer’s instructions was a process close to the learningprocess of human, like a student that learns from the teacher. In this way, machine processes wouldbe no longer deterministic; they would be influenced by past experiences, judgments, and theinstinct that make the human intellect unique. This means the possibility that machines can nolonger perform a calculation in the same way that they were programmed, thus exposing them toerrors. However, it is precisely the ability to err and refute based on failed experiences that allowedman to evolve [68]. The question that openly posed itself was, therefore: what would intelligenceserve?
Since 1950, the industrial revolution aimed at replacing the human workforce with the machineto gain time and produce more in less time. To address this goal, a remarkable effort has been donein AI research. Although the definition of AI is very broad, it can be defined as ”the study of makingcomputers do things that the human needs intelligence to do” [96]. According to this definition, amachine must have intelligence, the capacity to think about what it does. In order to think, someoneor something has to have a brain, or in other words, an organ that enables someone or something tolearn and understand things, to solve problems and to make decisions. Thus, we can further defineintelligence as ”the ability to learn and understand, to solve problems and to make decisions” [97].
The development of AI tries to conceive methods to provide intelligence to machines. Thisconcerns not only the computational ability but the possibility for the machines to carrying outheterogeneous activities by adapting to changes in the surrounding environment, improving theircapabilities according to their own experiences and cooperating with other machines.
Table 2.1 groups some of the main definitions put together according to four approaches to AI.According to these definitions, a human-centered approach must be an empirical science, involvinghypothesis and experimental confirmation, while a rational approach involves a combination ofmathematics and engineering. Each group has both disparaged and helped the other [118]. Theway Turing thought about the IA consists in designing systems that act like humans.
2.6 Artificial Intelligence for the Smart City
The diffusion of smart initiatives is motivated by an increase in population in centers of economicand industrial interest, which makes the management of urban resources challenging to avoid thedeterioration of the environment and ensure a good quality of life for citizens. As cities are becomingdigitized through the installation of sensors, computational cores and different telecommunicationsystems, AI makes it possible to collect real-time data to provide a deeper understanding of howcities evolve, adapt and respond to various conditions [9]. The main objective of AI systems isto create intelligent machines and through this, to understand the principles of intelligence. AIsystem is suitable when a direct mathematical relationship cannot be established between causeand effect. Artificial intelligence system models capture the uncertainty between real-life cause andeffect scenarios by incorporating available knowledge with probabilities and probability inference
17 Dynamic Learning of the Environment for Eco-Citizen Behavior

Chapter 2. Introduction to Smart cities
Table 2.1: Some definitions of artificial intelligence, organized into four categories [118].
Systems that think like humans Systems that think rationally”[The automation of] activities that we associate withhuman thinking, activities such as decision-making,problem solving, learning ...”(Bellman, 1978)
”The study of mental faculties throughthe use of computational models.”(Chamiak and McDermott, 1985)
”The exciting new effort to make computers think...machines with minds, in the full and literal sense.”(Haugeland, 1985)
”The study of the computations thatmake it possible to perceive, reason, and act.”(Winston, 1992)
Systems that act like humans Systems that act rationally”The art of creating machines that performfunctions that require intelligence whenperformed by people.”(Kurzweil, 1990)
”Computational Intelligence is the study ofthe design of intelligent agents.”(Poole et al., 1998)
”The study of how to make computers dothings at which, at the moment, people arebetter.”(Rich and Knight, 1991)
”AI...is concerned with intelligentbehavior in artifacts.”(Nilsson, 1998)
computations [5]. The processing of data through AI can ensure the better provision of liveabilitydimensions; through cleanliness, health and conducive environments for people to live and workwithout the urban challenges of pollution and congestion. It is further believed that, through thistechnology, the built environment can digitally support intelligent and responsive services bothconveniently and in real-time [9].
A smart city exploits synergistically multiple technologies; this is of primary importance inlarge-scale applications where the computation where the achievement of smartness objectivesrequires the use of diverse computational systems that operate according to mutual interactions toproduce a result that depends on the computation of the individual parts. This arising complexitymotivates the distribution of computation among different computing devices, thus focalizingmore on how they interact. These aspects are addressed through models such as ubiquitous andautonomous computing.
• ”The Ubiquitous Computing era will have lots of computers sharing each of us. Some of these computerswill be the hundred we may access in the course of a few minutes of Internet browsing. Others willbe embedded in walls, chairs, clothing, light switches, cars - in everything. Ubiquitous Computing isfundamentally characterized by the connection of things in the world with computation. This will takeplace at a many scales, including the microscopic” [144].
• [Autonomous systems are] ”computing systems that can manage themselves given high-levelobjectives from administrators. These systems manage themselves according to an administrator’sgoals” [76].
The development of smart cities is based on the observation and analysis of data acquired
Dynamic Learning of the Environment for Eco-Citizen Behavior 18

Chapter 2. Introduction to Smart cities
through a large number of IoT devices available in the urban environment. To make sense, the roleof AI is to reason on and to coordinate the data observed by IoT devices while taking into accountdifferent constraints such as processing power, memory, and delay in real-time applications.
The main challenge of IoT is to achieve full interoperability of interconnected devices whileguaranteeing the trust, privacy and security of communications [108]. These interconnected devicesbecome more unobtrusive and thanks to their embedded sensors they can perceive the physicalenvironment in which they are situated. Ambient Intelligence (AmI) provides ambient systemswith the mechanisms necessary to carry out environmental reasoning using a representation ofthe environment perceived by IoT devices. Ambient systems are designed to provide adaptedservices that respond to individual, collective, and social requirements. The term environmentrefers to a physical space enriched with sensors and computational entities that are seamlesslyand invisibly interwoven [109]. To be considered as smart or intelligent, an environment needsto be associated with a representative description that can be constructed from the perceptions ofthe ambient components. The interactions of ambient components enable a smart city to enhanceits services such as transports, health, cultural events and so on. This is possible thanks to theanalysis of data acquired not only from the physical environment but also from the analysis ofcitizens’ behavior. Ambient components perform computation using different information collectedfrom the environment. However, their computation depends on what is done and the informationperceived in a precise moment and in a precise environmental context. The property of adapting todifferent situations is known as context-awareness.
Ambient intelligence involves the following three properties: ubiquity, connectivity and in-telligence [140]. According to ubiquitous computing, computational units are embedded in allsurrounding and everyday devices, functioning invisibly. Human users may not necessarily beaware of the existence of embedded devices and computations occurred behind the scene [141].Connectivity involves the efficient use of networks to support the interoperability of connectedambient devices. As ambient systems are designed to be deployed in large-scale contexts such ascities, ambient devices can be present in a significant quantity. For this reason, it is necessary todispose of an effective infrastructure that ensures connectivity to the services offered by the smartcity and therefore to ambient components.
Software agents offer features that answer to key needs in Ambient Intelligence (AmI). Agentsare characterized primarily by autonomy, proactivity and reasoning mechanisms: autonomy enablesagents to act and take decisions with or without information from other agents, and to easily adaptto changing contexts. Reasoning and proactivity allow agents to act before the user requires itexplicitly, making the AmI system be more useful and appear more intelligent. Especially coupledwith mechanisms of self-organization, using multi-agent systems can be effective to deliver a highlevel of decentralization thanks to the autonomous computation of software agents [101]. Agentscan integrate intelligence mechanisms necessary for the implementation of ambient systems. Theintelligence can be appropriately distributed among agents and allows a punctual and real time
19 Dynamic Learning of the Environment for Eco-Citizen Behavior

Chapter 2. Introduction to Smart cities
analysis of the information collected from the physical environment. Intelligence can be attributedin different ways, according to the application domain, through AI techniques.
Ambient intelligence deals with data acquired in large scale environments. Because smart citiesare increasingly instrumented with sensors capable of acquiring information from the environment,ambient systems must be able to manipulate a large amount of information. Thanks to theirautonomous computation, agents can be employed in the context of smart cities in order to allow adistributed acquisition of information associated with intelligence mechanisms.
2.6.1 Discussion
It is clear from the discussion presented in the previous section that the link between ambientintelligence, AI and software agents is close: the former provides intelligence mechanisms indistributed environments, that is, in contexts where large amounts of data are perceived by devicespresent in the urban environment. These devices, known as ambient components, are heterogeneousand can perceive different types of information.
The ambient systems, therefore, have the role of creating useful knowledge for society byexploiting the large amount of information perceived through perception devices. This is possibletoday also thanks to the low cost of devices able to perceive the environment; on the one hand,this allows ambient systems to have a large amount of information that can be used to build aprecise urban knowledge base, On the other hand, ambient systems need to be able to handle hugeamounts of data efficiently.
In this thesis, ambient intelligence is used to manipulate environmental data in order to estimatemissing information where ad hoc sensors are not available.
We provide a working definition of a smart city for the purposes of this thesis:
The smart city is an urban settlement that uses intelligent systems capable of operating in open, dynamicand heterogeneous environments to leverage the data acquired in a participative way from IoT devices toachieve a sustainable development of the city.
In this thesis, we consider a city as smart because it holds a large quantity of informationperceived by heterogeneous sensing devices whose information can be used to improve the qualityof life of citizens.
This thesis presents the HybridIoT system to cope with the lack of environmental informationin the urban context through an estimation technique that integrates heterogeneous data acquiredfrom different sensors. Our proposal allows reducing the number of physical sensing devices whileensuring that information is available at any time and anywhere. HybridIoT can be deployed inlarge-scale contexts and ensures data accessibility even if devices enter or leave the system at anytime.
The macro-areas of interest in which our proposal takes place are: intelligent city, sustainablecity and well-being city. In the first case, our proposal allows acquiring and integrating information
Dynamic Learning of the Environment for Eco-Citizen Behavior 20

Chapter 2. Introduction to Smart cities
through ICT tools to produce an urban knowledge base; sustainable because the environmentalknowledge enables experts to optimize resource consumption. Moreover, the proposed techniqueallows limiting the number of sensors to be installed, limiting the production costs but also theenergy consumption, installation and maintenance costs related to the sensors network. Finally, weconsider as smart the well-being city because the knowledge produced can be used by experts toimprove both services offered to citizens and their quality of life.
The value determined by the implementation of the proposed technique is mainly economic: ona large scale, a large number of sensors would be needed to ensure a wide information coverage, sothat a large amount of information can be used by government agencies to offer better services tocitizens. Rather than installing a large number of sensors, our proposal allows reducing the mainte-nance and installation costs of sensors by using only those already present in the infrastructure,estimating accurately the information in the points where sensors are not available.
2.7 Conclusion
This chapter provided a general overview of the smart city, its application domains and differentfactors that need to be considered in the implementation of a smart initiative. The socio-economicvalue is the most important factor to address a sustainable development of a urban context: theimplementation of a smart initiative must create benefits not only the scientific community butalso the whole social community, creating attractiveness and moving cities and economic centerstowards sustainable development while ensuring a high quality of life for citizens.
The next chapter introduces the problem of estimating missing values and discusses the prin-cipal solutions present in the literature. These solutions are afterward discussed according tothe properties of openness, heterogeneity, large-scale introduced in the previous chapter; theseproperties constitute the key-advantages of our proposal.
21 Dynamic Learning of the Environment for Eco-Citizen Behavior

Chapter 3Estimating missing information in SmartCities
Objectives of this chapter:
• Discussing the role of big data in the smart city
• Introducing the Artificial Intelligence (AI) as the main tool to analyze and exploit big data forthe implementation of smart cities
• Analyzing the main techniques for estimating missing data
SMART cities play a key role in transforming urban contexts by improving different aspects of thelife of their citizens, such as environment, transportation, health, energy, and education. The
main challenge for the implementation of a smart city is to make extensive use of data acquiredon an urban scale. The amount of data acquired on an urban scale is growing significantly today,mainly because of the accessibility and low cost of devices capable of acquiring data from theenvironment. A large number of sensing devices (devices capable of sensing the environment)disseminated in the urban context generates an enormous volume of data or big data, that is atthe core of the services rendered by the IoT. Big data offers the potential for the city to obtainvaluable insights from a considerable amount of data collected through various sources [65]. Forexample, obtaining information from weather data can be beneficial for agricultural developmentand to inform the people in advance about the possible hazardous conditions. Data acquired fromGlobal Positioning System (GPS) devices can be used to monitor traffic conditions to avoid delays,bottlenecks, and accidents. In buildings, data acquired from both environmental conditions andusers’ habits can be used to control Heating, Ventilation and Air-Conditioning (HVAC) systems tooptimize energy consumption while ensuring a good quality of life for users. The analysis of big
22

Chapter 3. State of the Art
data, therefore, remains the primary activity to ensure that the data obtained on an urban scale canbe used to create social and economic value for the society.
To pursue the objectives of optimizing and improving services and consumption in cities, itis necessary not only to collect a large amount of data but also to extract useful knowledge toachieve the objectives of smartness. In this context, AI is needed to analyze, extract knowledge andreason on big data so that smart city stakeholders can decide on appropriate actions to pursue. Forthis to be possible, IoT and AI must operate jointly to migrate from systems of connected objectstowards systems of connected intelligence. On the one hand, IoT provides means to easily acquireinformation from the urban context; on the other hand, AI provides tools to analyze and extractknowledge from data.
This chapter discusses the application of AI to the estimation of missing information in smartcities.
The remainder of this chapter is organized as follows:
Section 3.1 introduces the problem of estimating missing data in the smart city. Section 3.2 brieflypresents the bibliographic study that we pursued to find the articles presented. Section 3.3 discussesthe main techniques for estimating missing information. Section 3.4 analyzes the presented methodsaccording to different fundamental properties, necessary for the development of efficient systemsfor the smart city.
The next section introduces the problem of estimating missing information in the smart city.
3.1 Estimating Missing Information in Smart Cities
The estimation of missing values in dataset began to develop in the 1970s as a technique to addressdata incompleteness. There are several reasons why it is necessary to perform this task in the smartcity domain: the presence of incorrect data, non-functioning (or not available) sensors and/or theneed to estimate and infer data more accurately using available data [92]. Although the lack of datacan be expected in many applications, addressing the estimation of missing data is a challenge as innumerous domains it must be done in real-time and on-demand.
The estimation of missing information is mainly based on the use of mathematical modelsand AI techniques. Because estimated information can be used in decision-making processes, theestimation techniques must produce accurate results. Therefore, the estimates must be as closeas possible to the real values to be able to make effective decisions. In large-scale contexts whereestimates need to be provided at real-time, the techniques for estimating missing informationneeded to address issues such as accuracy and timing in an efficient manner.
For example, at the city scale, available information can be disseminated in environments withdifferent physical characteristics, the sensors themselves may be inaccurate, subject to environmentalfactors or unpredictable failures. A system for estimating missing information must be able notonly to gather all the available information from such a large context but also to provide an
23 Dynamic Learning of the Environment for Eco-Citizen Behavior

Chapter 3. State of the Art
accurate estimate by considering the characteristics of the environment. This is possible by using AItechniques for reasoning on data and evaluating estimates using only some of the information inthe environment. This is motivated by the fact that in large scale contexts, environmental dynamicscan vary considerably in different points of the environment. This implies that the system must beable to determine a subset of the information present in the environment to calculate the estimates,which may involve high computational costs. On the one hand, using a small amount of informationcould lead to the inability of the system to extract accurate information. On the other hand, usingtoo much information would make the system unable to provide a precise estimate because thedata would differ too much and the system would not be able to extract precise information.
There are numerous reasons why data are missing, including instrument malfunction andincorrect reporting. In order to design an efficient method to handle missing data, it is useful tounderstand why data can be missing [63]. This can be done by observing data distributions in orderto understand whether the missing data occur regularly or not, and whether the missing data havea correlation with the available data. To this end, Rubin [116] classified missing data problems intothree categories:
• Missing Completely At Random (MCAR): in this case, the missing samples are unrelated to theobserved data. Therefore, complexities that arise because data are missing can be ignored.
• Missing At Random (MAR): the probability for a sample of being missing is the same withingroups defined by the observed data.
• Missing Not At Random (MNAR): means that the probability for a sample of being missingvaries for reasons that are unknown to us.
Rubin’s distinction is important for understanding why some methods will not work [136],therefore this classification is relevant to conceive an efficient method to estimate missing informa-tion.
3.1.1 Discussion
This thesis deals with a system called HybridIoT for estimating missing environmental information.The system has been designed to operate according to the following properties:
• data are correlated during consecutive time intervals (for example: events generated fromweather conditions may produce unpredictable variations);
• the sources of information can appear or disappear without any prior notification;
• the lack of data cannot be predicted in any way.
Dynamic Learning of the Environment for Eco-Citizen Behavior 24

Chapter 3. State of the Art
Following Rubin’s classification presented in the previous section, the problem addressed by thisthesis falls into the MNAR category: the probability of an information of being missing varies forreasons that are unknown to us, but during consecutive time intervals the data are correlated.
In the urban context in which the proposed solution is configured, the development of aneffective system for estimating missing information must consider the following difficulties:
• large amount of data: only the data coming from a limited number of sensors should be ana-lyzed when estimating information in a local part of the environment. Moreover, consideringall the available data is not useful and can be computationally expensive;
• data filtering: the information perceived by the sensors may be noisy and should not be takeninto account in the estimation process;
• real-time: analyzing and filtering data is not easy when you consider several thousands ofperceived data at the city level.
The following section presents the bibliographic study used to find the articles presented.
3.2 Bibliographic Study
The concise bibliographic study presented in this section is motivated by the large presence in thescientific literature of articles about the estimation of missing information in smart cities. This studywas carried out to motivate the context of application in which this thesis is situated by showing itswide presence in the scientific literature. Although this chapter describes some of the techniquespresent in the state of the art for the estimation of missing values, this study allows the reader toappreciate the large number of academic papers treating the domain of estimation in the smart cityand in particular in the domain of missing information estimation.
This bibliometric study is carried out by referring to publications for which the main topic isthe smart city. The publications are found in different academic databases: Google Scholar, IEEEXplore, SpringerLink, ScienceDirect. Despite the large number of publications within the smart citycontext, this thesis deals only with those that focus on the estimation or integration of informationat a large scale, these two topics being of central interest.
Figure 3.1 shows the growth during the last 9 years in the number of articles concerning thesmart city and missing information estimation. The online academic engine Dimensions.AI [39] hasbeen used to evaluate this analysis. Different keywords have been used together with ”smart city”:estimation, forecasting and regression.
From Figure 3.1 it can be seen that the trend of the keyword regression and forecasting curvescoincide. This may be due to the presence of both keywords in the papers; regression is frequentlyused as a forecasting technique.
25 Dynamic Learning of the Environment for Eco-Citizen Behavior

Chapter 3. State of the Art
0
1000
2000
3000
4000
5000
6000
7000
8000
9000
10000
2011 2012 2013 2014 2015 2016 2017 2018 2019
Num
ber
of
Pap
ers
Year of Publication
SMART CITY REGRESSION SMART CITY FORECASTING SMART CITY ESTIMATION
Figure 3.1: trend of the number of papers published in the last 9 years on the smart city and about”regression”, ”forecasting” and ”estimation”.
The development of an intelligent ambient system for the smart city must respect several prop-erties that allow the resolution of complex and distributed problems, regardless of the technologyused to develop the system: the use of a large number of heterogeneous sensing devices thatmay enter or leave the system at any time as well as the management of the connections and theexchange of information between sensing devices. Also, in urban contexts, ambient systems mustadapt to the evolving dynamics of the environment so that they can act properly on it.
To allow an ambient system to be context-sensitive and effective for the smart city, the propertiesof openness, heterogeneity, large-scale, configuration, cost-effectiveness and privacy discussed inchapter 1 must be addressed. Moreover, the same properties have been used to evaluate the state ofthe art solutions for estimating missing information described in the following section.
3.3 Existing Solutions for Estimating Missing Information
This section presents the main solutions for the estimation of missing values in the smart city. Thepresented methods are grouped according to the technology used to estimate missing information.
3.3.1 Regression Techniques
This section presents the main state of the art solutions for estimating missing information on a largescale using mathematical regression techniques. Regression methods can be properly calibrated toprovide accurate estimates of missing information. However, using a single regression model hasdisadvantages because the introduction of a new sensing device requires re-calibration of the entire
Dynamic Learning of the Environment for Eco-Citizen Behavior 26

Chapter 3. State of the Art
model. Likewise, significant and unpredictable perturbations on local parts of the environmentwould require appropriate calibration of the global model.
REGRESSION, Spatial distribution of air pollutants in urban environments
Presentation Weather stations are highly reliable and able to accurately measure a wide rangeof air pollutants but their installation and maintenance costs make them an unfeasible choice toraise a sufficient informative covering of the environment. Hasenfratz et al. [64] propose usinga mobile measurement system capable to reduce the need for a huge number of fixed sensors atthe city scale. More precisely, the system consists of ten sensor nodes installed on top of publictransport vehicles, which cover a large urban area on a regular schedule. Throughout more than twoyears, over 50 million ultra-fine particle measurements used to produce accurate pollution mapswith high spatio-temporal resolution. The pollution maps have been produced using a Land-UseRegression (LUR) model. The resulting pollution maps are used to analyze how much the inhabitantsof Zurich (Switzerland) can reduce their exposure to ultra-fine particles by taking a path wherethe concentration of the pollution is limited. This enables citizens to take a healthier route, andorganization to take initiatives to reduce pollution.
The development of high-resolution pollution maps through LUR models is based on two steps:
1. linear regression is used to find dependencies between explanatory variables (e.g., populationdensity, traffic volume, and terrain elevation) and pollution levels;
2. the relationships between the previous variables are used to predict concentration levels atlocations using the available data. A Generalized Additive Model (GAM) is used to constructa LUR model. A GAM is a generalized linear model in which the linear predictor dependslinearly on environmental variables.
Data has been divided into different time scales (yearly, seasonal, monthly, biweekly, weekly,daily, and semi-daily), resulting in 989 temporal models.
Motivation We reported this study as it uses mobile sensors deployed on an urban scale tomonitor environmental information (specifically, the air quality). The regression technique proposedby the authors enables calculating accurate maps of urban pollution that are valuable to the generalpublic as well as to environmental scientists and epidemiologists to shed more light on the adversehealth effects of ultrafine particles [64].
Analysis The combination of regression and accurate data acquired from ad hoc sensing devicesspecifically built for the application gives good results considering the application domain. However,there is no possibility to use any generic device to acquire the data. The openness challenge is notfulfilled as authors do not assume that devices can enter or leave the system at any time, rather theyassume that they are always available. The heterogeneity is partially fulfilled as different typesof information are employed in the regression model. Nevertheless, the type of information is
27 Dynamic Learning of the Environment for Eco-Citizen Behavior

Chapter 3. State of the Art
known in advance, so the learning model knows specifically how each information has to be treatedaccording to its type.
REGRESSION, A Simple Flood Forecasting Scheme Using Wireless Sensor Networks
Presentation Seal et al. propose a model to predict flood in rivers using simple and fast calculationsto provide real-time results [122]. Floods are responsible for the loss of precious lives and thedestruction of large amounts of property every year, especially in the poor and developing countries.
The proposed sensor network system architecture consists of sensor nodes, computationalnodes and a central monitoring office. Sensors nodes collect data from direct perception of theenvironment, computational nodes implement the prediction algorithm and the monitoring officeverifies the results from computational nodes, implements a centralized version of the predictionalgorithm as a redundancy mechanism, issues alerts and initiates evacuation procedures. Differenttypes of sensors are required to sense water discharge from dam, rainfall, humidity, temperature,etc. The data collected by these sensors are used in the flood prediction algorithm performed bycomputational nodes, which have sufficient computational power to implement the predictionmodel in a distributed manner.
A linear regression method and a quadratic fit function are used to predict future values. Thecomputational nodes pursue prediction and communicate the results to the monitoring office, wherea human operator decides to eventually initiate evacuation procedures based on the predictionresults.
Motivation We report this study because the proposed application shows how the real-timeacquisition and processing of information acquired by sensors deployed on a large-scale can predictfloods, this prediction being useful to save the lives of people who may be affected by the flood.
Analysis The solution relies on a network of sensors known in advance and whose operationsand information are handled hierarchically by central nodes. In the proposed solution, nodes havecommunication between themselves for detecting malfunctioning.
The main drawbacks of the proposed solution are the scalability, not treated by the authors, andthe openness: although data is collected and processed online, adding a large number of sensorscould compromise the performance of the proposed solution. Moreover, the solution does not allowthe integration of information whose type is different from those supported, as this would require achange to the proposed prediction procedure.
REGRESSION, Fusing Incomplete Multisensor Heterogeneous Data to Estimate Urban Traffic
Presentation Shan et al. [123] authors propose a robust fusing method to improve the accuracy oftraffic state estimation using incomplete multi-sensor data. Using a Multiple Linear Regression (MLR)model on three road segments, they analyze the historic GPS data detected from taxies on thosesegments and extract the spatio-temporal correlation of traffic states (such as speed).
Dynamic Learning of the Environment for Eco-Citizen Behavior 28

Chapter 3. State of the Art
In the first step, the MLR model extracts the spatio-temporal correlations of traffic states forthe three road segments. The speed correlations of road segments in candidate region scales areextracted from GPS data because the GPS data collected by probe vehicles are the most complete indifferent types of multi-sensor heterogeneous traffic data. Based on the correlations, the missingspeed data of the target road segment can be estimated without deploying a particular type ofsensor using the correlated road segments deploying that type of sensor. This estimated speedis fused with GPS data to achieve a more accurate traffic state. Then, the candidate correlatedroads are chosen according to the number of connected road segments deploying the type of sensor,and their distribution. After determining the candidate region scales, the speed of the target roadsegment can be estimated using the data collected on input and output road segments.
Motivation We reported this study as it constitutes an important advance in estimating missinginformation on an urban scale. More specifically, the most important aspect that we report is theability of the estimation technique proposed by the authors to integrate heterogeneous informationto provide accurate estimates of missing values.
Analysis The authors affirm that the parallel implementation of their solution can facilitatetraffic state estimation on massive incomplete data to achieve real-time performance. Nevertheless,the scalability of the solution is limited, as the time required to calculate an estimate depends onthe number of computational nodes present in the system. For an estimation time of fewer than500 seconds, at least 32 computational nodes are required. Moreover, it does not seem possible toadd new computational nodes in real-time in the system, so that the problem of openness remainsunsolved.
The problem of heterogeneity is partially satisfied because the information used is known apriori.
REGRESSION, Evaluating the Health State of Urban Areas Using Multi-source HeterogeneousData
Presentation Tomaras et al. [133] propose ”HELIoS” (HEalthy LIving Smart), a framework thatcombines multiple heterogeneous sources of data such as urban traffic and pollution data todiagnose the health state of urban areas in a smart city. The developed solution is currently deployedin the City of Dublin and aims at monitoring diverse data coming from city-wide infrastructuresand recognize in real-time abnormal events of interest such as traffic conditions and the air pollutionlevels. In the proposed solution, traffic data are received from various voluminous sources, includingcameras CCTV, static loop sensors and bus sensors that measure the traffic flow, the data are possiblynoisy, with missing values and measurement errors. In Dublin, the air quality is measured city-widethrough 6 stations deployed in the city center and its suburban areas to provide air pollutioninformation to its citizens. The data are acquired each hour from 3402 heterogeneous fixed sensorsdeployed in different urban areas.
The proposed system is based on the use of a regression model that combines different environ-
29 Dynamic Learning of the Environment for Eco-Citizen Behavior

Chapter 3. State of the Art
mental indices such as air quality, road saturation, environmental conditions, defined through aseries of equations, to accurately classify the city area into health levels.
The proposed regression model is divided into three steps:
• Data aggregation: the data measurements for each sensor are aggregated by computing themean value of the degree of saturation metric every hour. In this way, the data are transformedinto a time series with 24 measurements per day.
• Feature selection: three different approaches are used: (i) most correlated, which selects themost similar pollution measurement, (ii) spatially close, which selects the nearest sensors and(iii) all the sensors, which includes all the sensors without any restriction.
• Regression: a machine learning approach has been used to estimate the pollution datausing the available information from sensors and the historical data of observed pollutionmeasurements. During the training process, the goal is to identify the model parameters thatresult in the minimum estimation error. A variety of regression methods has been used and,finally, the one that performs better (in terms of minimization between data and predictedoutcome) is chosen for the pollution estimation task. Three different regression models havebeen used to predict the health state of urban areas:
– Support Vector Regression (SVR): a regression variant of the support vector machineclassifier;
– Random forest: a set of multiple decision trees where each tree is trained using a differentsubset of the training set;
– Gaussian process: a non-linear and non-parametric model that is an extension of themultivariate Gaussian distribution for an infinite collection of real-valued variables.
Motivation We report this study as it highlights the importance of integrating heterogeneousinformation to estimate relevant information in the urban context such as the urban traffic, thepollution and to diagnose the health state of urban areas in a smart city.
Analysis The traffic data are collected in the period between November and December 2015.The pollution data are acquired by sensors deployed in the urban area of Dublin. The system doesnot provide any resilience mechanism that allows sensors to enter or leave the system at any time.Therefore, if any sensor is not available due to an unpredictable cause, such as a malfunction, thesystem has to reconfigure itself. For this reason, the challenge of openness is not addressed.
REGRESSION, A Refinement of Lasso Regression Applied to Temperature Forecasting
Presentation Spencer et al. [129] propose a technique based on regression to predict the temperaturein a smart home equipped with 88 sensors and 49 actuators. Sensors are capable of perceiving everyquarter-hour heterogeneous information such as temperature, wind speed, light, CO2. This solution
Dynamic Learning of the Environment for Eco-Citizen Behavior 30

Chapter 3. State of the Art
uses the R library glmnet, containing a package that fits generalized linear models via penalizedmaximum likelihood.
Authors overcome forecast inaccuracy that arises from the ”one standard error” heuristic (1SE)in lasso regression, a regression analysis that enhances the prediction accuracy through a variableselection and regularization. They propose a refinement of lasso regression called midfel, based onlinear regression. In lasso regression analysis, the relations between variables generate a curve thatbest fits particular data. Unlike lasso regression, the midfel refinement of lasso regression also usesthe shape of the error curve and it is particularly effective when the forecast model is based on alarge amount of data.
Motivation We report this study as the technique proposed by authors enables saving energyin a smart building by controlling heating, ventilation, and air conditioning equipment whileachieving comfort for occupants. The technique proposed by the authors uses historical data (up to24 hours) to forecast accurate temperature information.
Analysis The experiments have been conducted on a fixed number of sensors. The proposedsolution does not foresee the use of sensors that can enter or leave the system, so the challenge ofopenness is not addressed.
The scalability is not satisfied because an implementation on an urban scale would imply thatthe model can process a significant number of variables that derive from a large number of sensingdevices; this does not seem to be possible because a linear regression model would require aconsiderable amount of computational time.
3.3.2 Neural Network Techniques
This section presents the main state of the art solutions for estimating missing information on alarge scale using neural networks.
NN, real time Forest Fire Detection Using Wireless Networks
Presentation Yu et al. [152] propose a real-time forest fire detection method by using wireless sensornetworks and neural networks. The goal of this work is to predict forest fire promptly and accuratelyin order to minimize the loss of forests, wild animals, and people in the forest fire. The proposedsolution makes use of a large number of sensor nodes deployed in the forest and organized intoclusters so that each node has a corresponding cluster header. The clusters are formed accordingto parameters such as the proximity between nodes. The clustering technique has the objectiveof reducing energy consumption and ensure load balancing in network transmission. Figure 3.2shows the proposed sensor network paradigm.
Sensor nodes can measure environment temperature, relative humidity and smoke. Also, theyare equipped with a GPS module so that the position of the sensors is known. Every sensor nodesends measurement data and their location to the corresponding cluster head. The corresponding
31 Dynamic Learning of the Environment for Eco-Citizen Behavior

Chapter 3. State of the Art
Manager
Node
Cluster Header
Sink
Wind Sensor
Figure 3.2: The sensors network for real time fire detection (Yu et al. [152]).
cluster header calculates the weather index F using a neural network method (which structure issimilar to a feed-forward neural network), then it further sends the weather index to the managernode via the sink node. A sink node collects and processes data (Figure 3.2). The weather index iscalculated as follows:
f(Tmax24w1, Tmin24w2, Tavgw3, Hmax24w4, Hmin24w5, Havgw6) =Tmax24w1 + Tmin24w2 + Tavgw3 +Hmax24w4 +Hmin24w5 +Havgw6.
(3.1)
where Tmax24 and Tmin24 denote the highest temperature and the lowest temperature in the past 24hours respectively. Hmax24 and Hmin24 denote the highest relative humidity and the lowest relativehumidity in the past 24 hours respectively. Tavg and Havg denote current average temperature andthe average relative humidity respectively.
The sink is connected to a manager node via a wired network. A few wind sensor nodes aremanually deployed over the forest and connected to the sink via wired networks to detect windspeed. All the cluster headers periodically calculate a weather index F that is sent to the managernode, responsible for evaluating the presence of fire danger using the received weather indexes.
Motivation We report this study because the authors focus on real-time detection of forest fireusing the information acquired at a large-scale. The technique proposed by the authors enablesgrouping sensors according to properties such as their proximity. Grouping the sensors can bebeneficial in providing accurate and local information on the presence of fire.
Analysis In a critical application context such as fire detection, a fault-tolerance mechanismshould be required to enable the system to detect and eventually solve problems that arise fromsensors malfunctions. In the case of the proposed solution, a malfunction of a sensor in thenetwork would require, once the problem has been identified, a reconfiguration of the nodes, their
Dynamic Learning of the Environment for Eco-Citizen Behavior 32

Chapter 3. State of the Art
connections and also a reconfiguration of the neural network used to determine the presence offires. The openness property can overcome this problem, allowing devices to enter or leave thesystem in a transparent way, without compromising its operation.
The scalability is partially satisfied. The proposed method has been validated on fields ofdifferent sizes (from 500m2 to 860m2) using a different number of nodes (from 50 to 150).
NN, Short term traffic flow prediction for a non urban highway using Artificial Neural Network
Presentation Kumar et al. [81] apply an Artificial Neural Network (ANN) for short term predictionof traffic flow using past traffic data. The model incorporates traffic volume, speed, density, timeand day of the week as input variables. The speed of each category of vehicles was consideredseparately as input variables in contrast to previous studies reported in the literature which considerthe average speed of combined traffic flow. The main objective of the proposed model is toinvestigate the stability and efficiency of neural networks for short-term prediction of traffic volumein the case of mixed Indian traffic flow conditions.
A Multilayer Perceptron (MLP) network has been used for prediction of traffic flow data 15minutes in the future using the past 45 minutes data. 160 data sets have been taken for analysis,each of which contains 19 features: day of the week, time of the day, the category of vehicles, thecorresponding average speed of vehicles and traffic density were among these features. The wholedatabase was divided into three parts for training, cross-validation and testing in the ratio 60, 15,25 percent respectively. First, 45 minutes data (extracted in intervals of fifteen minutes) of eachhour were used for the training/validation stage and the last 15 minutes data for testing purposes.Thus 96, 24, 40 data sets were used for training, cross-validation and testing the ANN modelsrespectively.
Motivation We report this article as it shows how neural networks, in particular the multilayerperception networks, can be employed for short term traffic flow prediction up to 15 minutes.
Analysis As stated by the authors themselves, one of the major limitations associated with ANNmodeling is its black box type nature which prevents the system to find the mutual interrelationbetween the variables in ANN modeling.
The proposed model has been validated on a limited set of previously observed data. Moreover,the proposed model does not allow processing large amounts of urban data in real-time and alsoit is not possible to consider the acquisition from intermittent sensing devices that can enter orleave the system at any time, without causing a reconfiguration of the system. Thus, the opennesschallenge has not been addressed.
The heterogeneity is partially satisfied as the solution employs a limited set of informationwhich type is known in advance. Also, the scalability is not addressed as the data are acquired froman area of limited size.
33 Dynamic Learning of the Environment for Eco-Citizen Behavior

Chapter 3. State of the Art
NN, Indoor Air-Temperature Forecast for Energy-Efficient Management in Smart Buildings
Presentation Aliberti et al. [8] present a methodology for indoor air-temperature forecasting ob-tained by exploiting a Non-linear Autoregressive neural network. The authors designed, trainedand validated this neural network with a dataset consisting of six years of indoor air-temperaturevalues.
The autoregressive neural network is basically a multilayer perceptron exploiting a high numberof regressors to predict the temperatures in a time interval of 15 minutes, allowing to study the trendof air-temperatures up to about two hours onwards. The employed neural network architecturecharacterized by (i) one hidden layer of neurons with hyperbolic tangent activation function and (ii)an output layer with a linear activation function. The network is subjected to a training phase thatallows determining a mapping from the set of training data to the set of possible weights. In thisway, the network can produce prediction, to be compared to the true output.
Motivation We report this article as the proposed technique enables predicting (up to 3 hours)accurate temperature values using both historical data and data acquired by IoT sensing deviceusing a multilayer perception network and multiple regressors. This article shows the ability ofstandard techniques to use environmental data to estimate information in different environments ofa building.
Analysis The proposed method does not consider the possibility that the sensors present in thebuilding may encounter problems. In this case, a reconfiguration of the system would be necessaryto ensure its correct functioning. Therefore, the challenge of openness is not met. The heterogeneityis not addressed because in the proposed model only the temperature trend is considered. Moreover,the scalability does not seem to be addressed: the proposed model is specifically designed to workin the application context proposed by the authors. It is therefore not possible, unless of modifyingthe model, to deploy the system on an urban scale.
Soft Sensor, Soft Sensor with Deep Learning for Functional Region Detection in Urban Envi-ronments
Presentation Ma et al. [88] proposed a technique to identify the functional region of subway stationsby combining different types of information. Urban functional regions can be defined by sometypes of activities or spatial interactions that may occur in a region. The contribution is as follows:
• integrated data from the Online to Offline (OTO) e-commerce platform data, Smart Card Data(SCD) and Point Of Interest (POI) data to reduce the impact of a lack of data diversity. OTO isan emerging e-commerce model where consumers are able to search for and buy services orproducts online, and then consume them in an offline store [104]. The combination of multipleinformation enables obtaining more rigorous results.
• constructed a passenger flow feature map that contains specific information of each subwaystation and can reflect their characteristics.
Dynamic Learning of the Environment for Eco-Citizen Behavior 34

Chapter 3. State of the Art
• created a hybrid neural network approach that allows input vectors and maps to simultane-ously consider the features of data and the need for data.
The proposed technique consists of two stages:
1. the SCD feature is extracted and converted to a feature map, and a ResNet model is used toget the output.
2. the POI and OTO features are extracted, and a deep neural network with stacked autoencoders(SAE–DNN) model is used to get the output, identifying functional regions of subway stations.
The outputs of the two stages are connected and a SoftMax function is used to make the finalidentification of the functional region.
Motivation We report this article as the technique proposed by the authors uses the informationacquired on an urban scale to determine functional areas for subway stations (the residential region,the work region, the recreation region, and the transportation region) using a soft-sensor approach.This article shows the variety of fields of application in which the estimation of information can beuseful in the development of smart initiatives.
Analysis The technique makes use of a real dataset known before the execution. The methoddoes not consider data introduced during the system functioning, noisy or missing data. Theopenness property is not addressed: the use of new devices requires a system configuration. Theheterogeneity property is partially satisfied: the technique uses different types of information,although their type is known in advance. A proper configuration of the system is necessary tointroduce new types of information.
ANN-Based Soft Sensor to Predict Effluent Violations in Wastewater Treatment Plants
Presentation Wastewater treatment plants (WWTPs) reduce water’s pollutant products, which areharmful to the environment at high concentrations. Pisa et al. [110] proposed an artificial neuralnetwork (ANN)-based soft sensor in which a Long-Short Term Memory (LSTM) network is usedto generate predictions of nitrogen-derived components, specifically ammonium (SNH ) and totalnitrogen (SNtot). SNtot is a limiting nutrient and can therefore cause eutrophication, while nitrogenin the SNH form is toxic to aquatic life. These parameters are used by control strategies to allowactions to be taken in advance and only when violations are predicted.
The main contributions of this work are:
• design of a soft sensor based on ANNs (LSTM structures) to predict WWTP’s effluent concen-trations.
• treatment of online data as the unique source of information to predict effluent limits in realtime.
35 Dynamic Learning of the Environment for Eco-Citizen Behavior

Chapter 3. State of the Art
• application of a data preprocessing techniques to improve the LSTM predictions.
• development a prediction system able to obtain a low error.
Soft sensors’ input and output data consist of online measurements with the exception of totalnitrogen (SNtot,e). To predict effluent values with a prediction horizon of 4 hours, the authors useddata collected over 10 hours, using data windows containing 4 samples collected for each hour.
Motivation We report this article as it shows how neural networks can be employed in criticaldomains such as the prediction of nitrogen-derived components in wastewater treatment plants.The technique proposed by the authors is an effective tool especially if coupled with measuringinstruments to provide accurate indications in real-time on the status of treated water.
Analysis Due to the application context in which the proposed technique takes place, theinformation must be acquired from devices specifically configured by the expert. Although theopenness property is not respected, this is not particularly beneficial in the application context.The property of heterogeneity is partially satisfied: the information is of different types but theestimation of nitrogen-derived components requires a specific technique to combine informationsuch as ammonium and nitrogen.
3.3.3 Gradient Boost Technique
This section presents a state of the art solution for estimating missing information on a large scaleusing boosting techniques, which combine multiple learning algorithms into a single learner [121].Further details on the gradient boost techniques are reported in Appendix A.
A gradient boosting method to improve travel time prediction
Presentation Zhang et al. [155] propose a Gradient Boosting regression tree Method (GBM) to predicttravel time on a freeway stretch by considering all relevant variables derived from historical traveltime data.
The real-word travel time data used in the proposed solution aggregate traffic data from probevehicles and traditional sensor sources. Probe vehicles utilized include: taxis, airport shuttles,service delivery vans, long-haul trucks, consumer vehicles, and GPS enabled consumer smartphonesand so on. Traffic sensors range from inductive-loop detectors, radar sensors, to toll tag readers.
The data present only a percentage of 1% of missing samples; given the small amount of missingvalues, this study simply replaced the missing values with the mean of its closest surroundingvalues.
The ten variables that are used as input to predict travel time at time step t are as follows: TTt−1,TTt−2, TTt−3 are the three most recent travel time observations at time steps t− 1, t− 2 and t− 3,∆TTt−1 = TTt−1 − TTt−2 is the growth rate over two consecutive time steps t− 1 and t− 2, time ofday is represented by every five minutes time step indexed from 1 to 288, the week is indexed from
Dynamic Learning of the Environment for Eco-Citizen Behavior 36

Chapter 3. State of the Art
0 to 6 to represent from Sunday to Saturday, the day is the day when the observation is detected(from 1 to 31), and the month is the month information for the observation (from 1 to 12).
Motivation We report this article as it shows how the gradient boosting methods can be em-ployed for the travel time prediction. Moreover, this study shows the capability of the gradientboosting model of handling different types of input variables and modeling nonlinear relationshipsbetween variables.
Analysis The authors state that there is also a need to consider the trade-off between predictionaccuracy and computational time. Since a large number of trees are being fitted, model complexityalso increases and requires more computational time. If the number of sensors increases, andconsequently the amount of data, the number of regression trees may increase considerably andconsequently a high computation time can be necessary. Therefore the scalability challenge couldnot be considered as addressed for this solution.
The authors do not consider the possibility of processing data in real-time and they use theinformation on the travel time in the observed road segments. The challenges of heterogeneity andopenness are therefore not addressed.
3.3.4 Combined Techniques
This section presents the main state of the art methods for estimating missing information on a largescale by combining different AI methods.
REGRESSION+NN, Granger-Causality-based air quality estimation with spatio-temporal het-erogeneous big data
Presentation Zhu et al. [156] deal with city-wide air quality estimation with limited availablemonitoring stations that are geographically sparse and discovering Regions Of Interest (ROI) toproduce an accurate air quality map for the city of Shenzhen, China. The idea behind the proposedsolution is to estimate the air quality at locations not covered by monitoring stations. They proposeto analyze the temporal dependency and spatial correlation between urban dynamics data, suchas meteorology and traffic. These dependencies, or causalities, are expressed based on Grangercausality, which represents the causality between two time series in a regression manner anddetermines a ”Granger” cause if one time series can successfully predict another.
The prediction of air quality data is divided into five stages: the first stage interacts with inputdata flows, from both online and historical data; the second stage deals with non-causality detection,which is based on the spatio-temporal extended Granger causality model. Granger causality testanalyzes the causalities between urban dynamics and the air quality. A causality between two timeseries enables to determine if a time series can successfully predict another series. The causalitybetween two time series is calculated as follow:
37 Dynamic Learning of the Environment for Eco-Citizen Behavior

Chapter 3. State of the Art
Y (sy; t; cj) =Lj∑k=1
akY (sy; t− k; cj) +
N∑i=1
Li∑k=0
bikX (sx; t− k; ci) +N∑i=1
Li∑k=0
rkZi,t−k + ξt
(3.2)
where ξt are uncorrelated random variables with zero mean and variance σ2, L is the number oftime-stamps, vectors a = ak and b = bk(k = 1, 2, ..., L) are the correspondent weights for twoprocesses Xt and Yt.
The authors aim to generate an air quality map for the city of Shenzhen to help people under-stand better about urban dynamics. However, processing the massive volume of urban dynamicsdata poses a challenge. To overcome this problem, the authors propose an approach to discover theRegion Of Influence (ROI) by selecting data with the highest causality levels spatially and temporally,thus to process ”part” of the data instead of ”all” the data. ROI are defined as a set of grids thathave the top 10% highest causality considering a precise urban dynamic.
In the third phase of the solution, a causality factor is calculated for each grid. The fourthphase of the solution combines ROI detection with historical air quality estimation, which graduallytrains the parameters of the neural network used for predicting the air quality. After inferring theair quality index in each grid, in the last phase of the solution, a fine-grained air quality map isgenerated.
Motivation We report this article as it shows how it is possible to combine different techniques,precisely the regression and the neural networks, to estimate environmental information on an urbanscale, in parts of the environment not covered by monitoring stations by combining heterogeneousinformation.
Analysis The proposed solution does not take into account the openness, as data are acquiredfrom a limited number of fixed stations. Therefore, it seems to not be possible to employ sensors thatcan enter or leave the system at any time. The problem of heterogeneity is partially satisfied: thepredicted information on air quality derives from the integration of different types of information(air quality, meteorology, traffic). Nevertheless, the authors do not foresee the possibility to estimatetypes of information different from air quality.
REGRESSION+NN, Machine learning methods to forecast temperature in buildings
Presentation Mateo et al. [93] apply different machine learning techniques for predicting thetemperatures in different rooms. The data used have been obtained by simulating, through thesoftware TeKton 3D, a building located in the province of Malaga (Spain). The obtained resultsdemonstrate the validity of these techniques for predicting temperatures and, therefore, for theestablishment of optimal policies of energy consumption.
The authors used the following methods to predict temperature values:
Dynamic Learning of the Environment for Eco-Citizen Behavior 38

Chapter 3. State of the Art
• Autoregressive model: it considers a certain number of past samples to predict a temperaturevalue;
• Multiple Linear Regression (MLR): it fits a data model that is linear in the model coefficients,which are typically estimated by least-squares, and can approximate both lines and polynomi-als, among other linear models.
• Multilayer Perceptron (MLP), which produces a non-linear mapping of a set of input data toone or more outputs in an adaptive way, that is accomplished by learning from examples.Typically, the learning is done by the back-propagation algorithm or one of its variants.
• Extreme learning machines: these are feedforward neural networks that can be used for regres-sion with one or multiple layers, where the parameters of hidden nodes (not just the weightsconnecting inputs to hidden nodes) need not be tuned. The hidden nodes are randomlyassigned, never updated or inherited from the nodes of the previous layer. The weights of theoutput weights are learned once and represent the amount of learning of the model.
The authors also make use of different clustering techniques to help to arrange and combinesamples in the initial population according to their similarities, to remove outliers and to providemore homogeneous datasets. This clustering step, applied before building the prediction model,can improve the overall performance.
Motivation We report this article as it provides an overview of different methods applied in thecontext of the estimation of environmental information in different rooms of a building.
Analysis The heterogeneity challenge is partially satisfied as the information used is of differenttypes. However, the types of information are known in advance and the introduction of a new typeof information would imply a modification in the prediction model.
The performance of the proposed system is based on the processing of the available data, andthe use of data acquired in real-time is not foreseen. Moreover, the used sensing devices are alwaysavailable, so the challenge of openness is not addressed.
The scalability is not addressed because the model has been deployed in a limited applicationcontext. Its application in an urban environment would require significant computational resourcesto ensure that the estimated information is available in a short time.
ALL Machine Learning Algorithms for Short-Term Load Forecast in Residential Buildings Us-ing Smart Meters, Sensors and Big Data Solutions
Presentation Oprea and Bara [103] propose a framework to determine the load profiles and forecastthe electricity consumption for residential buildings for the next 24 hours. The proposed methodol-ogy for Short-Term Load Forecast (STLF) consists of three stages that imply data pre-processing,validation, storing, further processing and analysis with ML algorithms.
39 Dynamic Learning of the Environment for Eco-Citizen Behavior

Chapter 3. State of the Art
In the first stage, data is gathered from smart metering devices, combined with meteorologicaldata that were collected from the weather sensors or web APIs. To validate the readings, an Extract,Transform and Load (ETL) process is applied and then the data is loaded into a NoSQL database.
In the second stage, data analysis is performed to identify the most significant attributes thatinfluence electricity consumption. Also, the k-means clustering method is used to group theelectricity consumers into consumption groups with similar behaviors. Both clusters and the mostsignificant attributes are considered as input for the machine learning algorithms.
In the third stage, the STLF for the next 24 hours is performed. As a novelty, a Feed-ForwardArtificial Neural Network (FF-ANN) algorithm is proposed with an enhanced learning methodby introducing back-tracking for adjusting the learning rate and reducing the computational timeespecially in case of large data-sets. To compare its performance, six other powerful and competitivemachine learning algorithms are implemented, i.e. FF-ANN with enhanced gradient descendmethods.
The training method relies on seven machine learning algorithms (i.e. three FF-ANN algorithms,Non-linear AutoRegressive with eXogenous (NARX), Deep Neural Network (DNN), Gradient TreeBoosting (GTB) and Random Forests (RF)) that simultaneously run to select the best performingalgorithm and estimate the electricity consumption for the next day.
To obtain the best results, in the proposed methodology, all seven ML algorithms are simultane-ously executed and the best performing algorithm in terms of accuracy is automatically selected toforecast the electricity consumption.
Motivation We report this article because it enables estimating the power consumption usingsimultaneously multiple machine learning techniques to obtain accurate estimates.
Analysis The authors used for the training and validation of the proposed method a data setcontaining about 6 millions of information acquired in 2015. Although the sensors were installed theprevious year, the authors did not consider the data from 2014 because some records were missingor inconsistent; to perform correctly, the framework must be given in input with a consistent dataset.The framework, therefore, does not satisfy the openness property because it is not able to handlenew input at any time without the need for any reconfiguration during its operation.
The proposed framework uses different types of information (temperature, wind speed, hu-midity, precipitation, atmospheric pressure) that are used only for estimating the electrical load.The heterogeneity challenge is therefore partially addressed because it is not possible to estimateother types of information beyond the electrical load unless the system is specifically configured(by performing a training phase for the machine learning algorithms).
3.4 Discussion
Table 3.1 lists the described methods along with their strength and weak points according tothe following properties: openness, large-scale, heterogeneity. We used four indicators to depict
Dynamic Learning of the Environment for Eco-Citizen Behavior 40

Chapter 3. State of the Art
strength and weak points of each described method: (++) a challenge has been discussed andauthors describe a precise method to address it, (+) a challenge has been discussed and addressedbut authors did not provide a precise explanation of the solution, (-) the challenge has beenmentioned but not addressed, (– –) the challenge was neither mentioned nor discussed.
Table 3.1: Comparison of state of the art solutions for estimating missing information.
Technology Authors Domain Openness Heterogeneity Large-Scale
Regression
Hasenfratz et al. (2015)Environment
- - ++ +Seal et al. (2012) - - - - +Shan et al. (2016) Urban Traffic - - ++ +
Tomaras et al. (2018)Smart home
- - + +Spencer et al. (2018) - - - - -
NN
Kumar et al. (2013) Urban Traffic - - ++ +Yu et al. (2005)
Environment- - - - -
Ma et al. (2020) - - ++ +Pisa et al. (2019) - - ++ - -
Aliberti et al. (2018)Smart Homeand Building
- - - - - -
Regression+NN
Zhu et al. (2015) Environment - - ++ +
Mateo et al. (2013)Smart Homeand Building
- - - - -
GradientBoost
Zhang et al. (2015) Urban Traffic - - - - - -
Combined Oprea and Bara (2019)Smart Homeand Building
- - ++ - -
We do not report the properties of privacy, proactivity and economy in table 3.1 because thediscussed methods do not address these properties.
3.5 Conclusion
This chapter provided a general overview of the problem of estimating missing information. Thestate of the art solutions were presented and discussed according to the properties of openness,heterogeneity, scalability. We have reviewed that the systems discussed do not allow to satisfy theproperty of openness, and therefore the ability to manage intermittent sensors, i.e. that can enteror leave the system at any time. The heterogeneity is partially satisfied by some solutions, as theymanage heterogeneous information but whose type is known in advance.
The proposed HybridIoT system in this thesis addresses these properties to be met, which makesour proposal a significant technological advance over the state of the art solutions. HybridIoT isbased on the multi-agent paradigm, which is introduced in the next chapter.
41 Dynamic Learning of the Environment for Eco-Citizen Behavior

Chapter 4Multi-Agent Systems
Objectives of this chapter:
• Introducing multi-agent systems
• Presenting the properties of self-organization and cooperation for agent-based methods
• Presenting the adaptive multi-agent systems for solving complex problems in smart cities
CITIES are truly complex systems because of their evolving dynamics, unpredictability andnon-linear relations between urban and environmental phenomena. A technological means
that allows cities to be ”smart” must satisfy these properties. Ambient systems are capable ofresponding to the dynamic evolution of the environment. In this context, citizens themselvesbecome part of the systems, as they are capable of providing information about their activitiesthrough mobile devices such as smartphones.
Engaging the user into the ambient system has an important drawback: ambient systemsmust face the challenge of the diffusion of sensing devices and consequently the huge amount ofinformation that can be collected and analyzed. A centralized system for collecting and analyzingdata would require considerable computing power given the amount of information that can becollected on a city scale. Furthermore, due to a large number of sensing devices present on an urbanscale, it is difficult for a centralized system to respond adequately to the continuous evolution of theenvironment and be resilient, anticipating all possible malfunctioning situations.
In the context of missing information estimation, mobile and intermittent IoT devices can be usedjointly with ad hoc sensing devices to ensure a large informative coverage in the urban environment.But how mobile, intermittent sensors can be integrated into an efficient infrastructure for providingenvironmental information at large-scale, reducing the overhead due to centralized computingand providing sufficient information coverage in cities? Using mobile sensing devices implies an
42

Chapter 4. Multi-Agent Systems
ambient system for estimating missing information to be resilient, to be capable of considering themobility of sensors, their openness (intended as the capacity of managing sensing devices that canenter or leave the system at any time) and ensuring that information is available even in case ofsensors unavailability. Therefore, it is difficult to conceive a system that responds adequately tosuch complex dynamics. Anticipating all possible system functionalities is difficult, especially whensuch a system has to be deployed into cities. Moreover, in such a context, the lack of transparencyof machine learning-based solutions is an unacceptable condition: understanding the outcome orthe behaviour of machine learning technique can be difficult [25].
A relevant approach to address such complex behavior is the Multi-Agent Systems (MAS),that allows IoT devices to become ”intelligent” agents, capable of perceiving the environment, toanalyze data and to respond adequately to unpredictable situations that could potentially preventthe sensing devices to provide information.
This chapter presents multi-agent systems, and in particular the adaptive multi-agent systems.After the presentation of this approach, its relevance will be argued with respect to the propertiesrequired for the development of the smart city described in the previous chapter.
This chapter is organized as follows: section 4.1 introduces the multi-agent systems for de-veloping distributed applications to handle the complexity of open and evolving environments.Section 4.2 discusses the concept of cooperation in multi-agent systems. Section 4.3 introduces theAdaptive Multi-Agent System (AMAS) approach. This approach allows designing multi-agentsystems able to solve complex problems in a bottom-up way thanks to a cooperative behaviorbetween agents. Section 4.4 shortly introduces the ADELFE methodology, which contains usefulguidelines for designing AMAS and verifying their pertinence concerning a problem.
4.1 Multi-Agent Systems
In traditional information systems, programs are developed to respond deterministically to allpossible anomalous situations that the system may encounter. This implies that the designer candetermine the entire set of anomalous situations for the system. If, however, the system runs intoan unpredicted anomalous operation, the system may crash, which can also lead to the loss ofrelevant data. For an increasing number of applications, such malfunctions cannot be allowed. Onthe one hand, today’s applications are becoming more and more complex, which makes it difficultto identify all possible anomalous situations that a system may encounter. On the other hand, foran increasingly large number of applications, we require systems that can decide by themselveswhat they need to do to satisfy their design objectives. Such computer systems are known assoftware agents or simply agents. Agents that operate in rapidly changing, unpredictable, or openenvironments, where there is a significant possibility that actions can fail are known as intelligentagents, or sometimes autonomous agents [145].
The MAS paradigm offers an intuitive and natural way to solve a complex problem through
43 Dynamic Learning of the Environment for Eco-Citizen Behavior
Chapter 4. Multi-Agent Systems
a distributed computation between interacting autonomous agents that have specific and limitedtasks. Agents operate jointly to achieve a global objective that cannot be pursued individually.Agents have different skills and social behaviors to interact with other agents. When interacting,agents can autonomously constitute organizations in which they operate jointly to contribute to acommon goal that cannot be achieved individually.
The MAS paradigm defines a model for software systems composed of two components: a setof agents and an environment.
4.1.1 Agents
Although there are different definitions of agent in the literature, we report the one provided byWeiss [145]:
Definition 1. An agent is a computer system that is situated in some environment, and that is capable ofautonomous action in this environment to meet its design objectives.
In this thesis we define agents as autonomous computational entities located in an environment,they have operational and social capabilities. The set of actions available to an agent allows itto modify autonomously the environment in which it is situated. Agents generally have limitedcapacity, that is, an agent cannot solve the goal alone and can work with other agents to do so.Agents are able to create social relationships with other agents which results in a coordinated, jointactivity that allows a group of agents to contribute to a common goal.
Agents have a partial view of the environment in which they are situated (the context in whichthe agents act; can be either virtual or physical). As a result, they have limited control, they canonly influence a part of the environment (including agents) through their actions. Agents are alsocapable of interacting with other agents by engaging in a social activity that we all engage in everyday of our lives: cooperation, coordination, negotiation, etc. [150].
From this definition we deduce some fundamental characteristics of the agents:
• agents are autonomous, there is no need for external interventions to decide their behavior;
• agents can be situated into an environment: situatedness is the property of being potentiallyinfluenced and, in turn, potentially capable of affecting someone or something [52];
– we make a distinction between physical and social environment: the first is the realenvironment from which agents perceive data through sensing devices, while the secondis the ”virtual” environment constituted of agents and where interactions between agentstake place.
• agents can evolve in their environment, adapting and acting in it according to environmentalconditions;
Dynamic Learning of the Environment for Eco-Citizen Behavior 44

Chapter 4. Multi-Agent Systems
• agents have social skills, can communicate, form organizations and act jointly. Generally,agents do not own all the skills necessary to pursue the goal the multi-agent system is designedfor, but rather they have a limited set of skills and knowledge;
• agents have a partial view of the environment, consequently, their action affects a limited partof the environment. This implies that a modification of a part of the environment could not beperceived by all the other agents.
Perception
(acquire information from
the environment)
Decision
(select the action to
perform)
Action
(act on the environment
using the selected action)
Environment
1 2 3
Figure 4.1: An agent’s lifecyle.
Each agent has one or more objectives that can be expressed in different ways, such as mathe-matical functions or through predicates. The first case is useful when agents deal with numericalinformation, as in the case of estimating missing information. The second case is widely used in theintelligent management of services that cannot be expressed through mathematical models, such asweb or urban services [119]. Goals can also be distinguished into hard goals and soft goals: hardgoals describe services the MAS is expected to deliver whereas soft goals refer to nonfunctionalproperties such as performance or excellence issues [18].
An agent performs a continuous life cycle that can be divided into three parts [118] (Figure 4.1):
• perception (step ¶), in which an agent acquires information about a limited part of theenvironment through sensors;
• decision (step ·), in which an agent decides the action to be taken according to its perceptionof the environment. Agents have a variable number of actions that can be carried out;
• action (step ¸), in which the agent acts and modifies the local part of the environment inwhich it is situated.
A multi-agent system is then composed of a set of agents interacting with each other, each agenthaving its own objective and its own knowledge and skills. The behavior of the multi-agent systemresults from the local behaviours of each of its agents and their interactions.
45 Dynamic Learning of the Environment for Eco-Citizen Behavior

Chapter 4. Multi-Agent Systems
4.1.2 Environment
Weyns et al. [147] defined the environment as ”a first-class abstraction that provides the surroundingconditions for agents to exist and that mediates both the interaction among agents and the access to re-sources”. By stating that the environment is a first-class abstraction, authors stress the fact that theenvironment is an independent entity in MAS systems. The environment is the part of the worldwith which the agents interact, in which the effects of the agents will be observed and evaluated.The environment provides a medium for sharing information and mediating coordination amongagents. As a mediator, the environment not only enables interaction, it also constrains it. [147].
Agents must face the problem of deciding which of their actions should be performed to bestsatisfy their goals. The complexity of the decision-making process can be affected by several differentenvironmental properties [145]. Russell and Norvig [118] discuss five fundamental characteristicsthat designers should consider when modeling an environment for an agent:
• accessible/inaccessible: in an accessible environment, agents can access all information regardingthe state of the environment at any time. Complex environments (including, for example, thephysical world and the Internet) are inaccessible. The more accessible an environment is, thesimpler it is to build the agent to operate in it;
• discrete/continuous: an environment is discrete if a limited set of actions can be performedin it. A typical example of a discrete environment is the chess table: at a given time instant,only a limited set of actions can be performed in a cell. On the contrary, the physical world iscontinuous;
• deterministic/non-deterministic: in a deterministic environment, the result of an operation hasa precise result that can be predicted in advance. On the contrary, in a non-deterministicenvironment, the same operation can produce diverse results in different contexts. Thephysical world can be regarded as non-deterministic. Modeling a physical world, consideringonly a subset of its properties, is a challenging task for agent designers;
• static/dynamic: A static environment does not change over time unless it is subject to theexternal actions of an agent. A dynamic environment evolves independently of the actions ofthe agents present in the system. The physical world is a highly dynamic environment.
• episodic/non-episodic: the result of the execution of a set of actions is independent of theexecution of the same actions at an earlier time instant. In other words, an agent choosesthe set of tasks to execute at a specific time not considering the effects they will have on theexecution of future tasks.
Dynamic Learning of the Environment for Eco-Citizen Behavior 46

Chapter 4. Multi-Agent Systems
4.1.3 Self-Organization
There are two primary ways to approach problem-solving: top-down and bottom-up. In the firstcase, the problem is well formalized, we can define a function to minimize or maximize to solvea problem, an objective function, or a goal to achieve. In this case, it is possible to decomposethe problem into many sub-problems, each of which is delegated to different sub-components ofa system. The solutions produced by the sub-components are combined so that the final resultexpected by the system is reordered. Not all problems can be formalized precisely, so the top-downapproach is not pertinent. For instance, it is possible to define the tasks of the sub-systems but not aglobal function that defines the global behavior of the system. Therefore, it is preferable to adopta reverse strategy, i.e. the bottom-up strategy, by attributing to the various sub-systems a localbehavior that ensures that the overall functionality emerged is satisfactory to address the problem.The bottom-up strategy is particularly suitable for solving complex problems, whose functionalobjectives cannot be expressed formally. Some of these problems are present in nature, for examplein flocks of birds or schools of fish. In these cases, individuals have limited capabilities but theirinteraction enables the emergence of complex patterns. Therefore, what are the rules that governthe dynamics between individuals, and how their interaction leads to an emergent behavior? Abroad answer to these questions resides in a phenomenon known as self-organization.
Self-organization depicts an artificial or natural phenomenon that allows the spontaneouscreation of patterns in space and/or time through the interaction between individuals in a group.Self-organization is closely related to the concept of ”emergence”, that is the creation of patterns thatindividuals can only determine through interaction with other individuals [37, 38]. Self-organizationhas brought attention to researchers during the mid-twentieth century in different fields of studies,notably biology and computer science. During the l970s and l980s, the increasing computing powermade it possible to initiate a new research field that attempted to create artificial life through theuse of computer systems to demonstrate self-organization in ecological and evolutionary contexts.Only during the 1990s, it was stressed the role of self-organization in computer systems as well asin biology and ecology [58].
Self-organization enables complex patterns to appear without any explicit control or constraintsimposed from outside the system. In other words, the organization of individuals is based onlocal interactions between its components, often indirect, and are carried out through the environ-ment [38].
In computer science, self-organization has been used for solving complex computational prob-lems. In particular, self-organization finds its practical application in smart cities [98], complexsystems in continuous evolution, where it is not possible to specify a priori the functional objectivesof the system and to take into account parameters regarding, for example, information coming fromcitizens. A top-down approach would not result suitable unless the application domain is stronglyconstrained and patterns are known in advance. In a smart city context, it is preferable to adopt abottom-up strategy, through the self-organization of intelligent devices so that the objectives of the
47 Dynamic Learning of the Environment for Eco-Citizen Behavior

Chapter 4. Multi-Agent Systems
smart city can emerge autonomously. Two questions derive from this statement: how to implementself-organization? How is it possible to specify the interaction protocols between individuals in asystem?
4.2 Cooperation
A way to design a multi-agent system to solve complex problem through a bottom-up approach isto use cooperative agents. For that, it is pertinent to attribute to agents local behaviors that ensurethat the global functionality of the system (intended as the orchestration of the local activities ofthe agents) satisfies the definition of the problem. Ferber [46] provides the following definition ofcooperative agents: several agents will be said to be cooperating, or to be in a situation of cooperation, if oneof the two conditions is verified:
1. adding a new agent enables increasing the performance of the group;
2. agents act to avoid or resolve potential conflicts.
The performance of a group reflects the ability of agents to perform the task that must beaccomplished by the group.
The use of the cooperative approach requires the analysis of the interactions that may occurbetween agents. In general, the interactions between agents can be analyzed at the macro and microlevel [46]: at the macro level, we find the interactions that interweave the activity of a collectiveof agents, while at the micro level we analyze the individual interactions between agents. Therelationship between micro-situations and macro-situations is expressed as the relationship of theparts to the whole: the macro-situation, being the result of the interactions at level micro, introducesa set of problems whose resolution depends on the production of several micro-situations that arethemselves problem-bearing [46].
For reasons regarding technological limits, nowadays, multi-agent systems are developed insuch a way to address a given problem, thus agents cannot overcome the limits of the problemitself. This implies that the interactions are constrained by the defined problem. When problems arecomplex, it is not possible to specify a formal objective function: this implies that it is not possible toanalyze the interactions at the macro level to define a global way to solve the problem through thejoint actions of a group of agents. For this reason, the cooperation enables addressing this challengethrough a resolution process that considers the individual relationships of the agents (at the microlevel) that lead to the emergence of an organization able to solve the defined problem; therefore,also a global behavior emerges from this process [53]. To realize cooperation, agents act altruisticallyto contribute, through their knowledge and skills, to the resolution of a complex goal that cannot bepursued individually by agents.
Dynamic Learning of the Environment for Eco-Citizen Behavior 48

Chapter 4. Multi-Agent Systems
4.3 Adaptive Multi-Agent Systems
The development of a computational system requires the designer to properly implement functionsthat realize its nominal behavior and mechanisms to deal with any exceptions that may occurduring the system’s operation. By specifying a priori a model for a system that will have to dealwith unexpected events, the space of possibilities can be constrained [22]. Unexpected behaviorsof the system not considered in the design phase can compromise the system during its operationand potentially the data it manipulates. This may arise not only from human design errors but alsofrom the complex nature of the software. For example, consider the design of a software systemwith the following specifications [22]:
• The environment of the system is dynamic, making it ineffective to enumerate exhaustivelyall the situations the system may encounter.
• The system is open and therefore dynamic because it is constituted of a shifting number ofcomponents.
• The task the system has to achieve is so complex that we cannot guarantee a perfect design.
• The way by which the system may achieve the task it has been assigned is difficult or evenimpossible to apprehend globally by the designer.
Anticipating all possible exceptions is extremely complex, especially because of the properties ofopenness and dynamic environment. Therefore it is necessary to have a methodological approachthat can guide towards the realization of systems able not only to operate autonomously but alsoto adapt to changes in the environment and to evolve with it, ensuring that the functioning of thesystem converges towards the desired result. This challenge has been encompassed by the AdaptiveMulti-Agent Systems (AMAS) theory as well as the ADELFE methodology, which enable the designof systems to perform complex tasks through mechanisms of cooperation between software agents.
The AMAS approach allows the design of multi-agent systems through a bottom-up resolutionprocess where the agents collectively solve a problem. All the agents participate in solving complexproblems without deliberately lying or being malicious [53]. Although this statement may resultobvious, as the system designer does not intentionally create behaviors that could compromisethe proper functioning of the agents. In fact, as explained below, it is the interactions between theagents that can lead to anomalous behaviors.
If every agent has the capability to locally rearrange its interactions with others, this ability ofself-organization at the lowest level permits changes in the global function without coding thismodification at the upper level of the system. In this way, self-organization allows the systemto solve complex problems, whose global function is impossible to describe in a formal way.Consequently, this function has then to emerge at the macro level (the system level) from the
49 Dynamic Learning of the Environment for Eco-Citizen Behavior

Chapter 4. Multi-Agent Systems
interactions at the micro level (component level). Moreover, this global function cannot be knownat agent level, and agents just needs some local criteria to rearrange their interactions [13].
Using the AMAS approach to solve complex problems means that, as mentioned earlier, thedesigner cannot specify a global objective function for the MAS, thus it is not possible to specify afunction shared among agents that defines the goal to pursue. A theoretical foundation to answerthis issue is the functional adequacy: a system is said to be functionally adequate if it executes thefunction which it has been designed to [22].
The evaluation of the functional adequacy of a system is delegated to an external entity thatobserves the behavior of the components. In MAS, this evaluation has to be addressed by agentson their own activities, as they do not have any knowledge about the global goal to be achieved.Therefore, the observation of the components of the system cannot be delegated to an externalobserver, but rather it is the agents that individually, based on their observations and feedback fromthe environment evaluate their behavior according to a local criterion.
The AMAS approach enables to guarantee the convergence towards a desired global function.This is obtained by the following theorem [22]: For any functionally adequate system in a givenenvironment there is a system having a co-operative internal medium which realizes an equivalent function.A cooperative internal medium system is a system composed of parts which are always in aninteractive way with its own environment [56]. A system with cooperative internal medium hasonly cooperative exchanges with its environment because these exchanges are a subset of its partsinteractions. Systems with cooperative internal medium have these properties [22]:
• A cooperative system in the environment is functionally adequate, which implies that thesystem has only beneficial activities for its environment.
• There is no need to formally specify a global goal for the system. Agents act so as to keep theirbehavior cooperative according to their skills, representations of themselves, other agents andenvironment.
• The feedback concept is not constraining in this theory because the system must only evaluateif the changes taking place in the medium are cooperative from its point of view withoutknowing if these changes are dependent on its own past actions.
An AMAS system is characterized by the following points [54]:
• the system is plunged into a dynamical environment;
• the system realizes a function;
• the system is composed of interacting autonomous agents;
• each agent of the system realizes a partial function. The global function is the result of thecomposition of the partial functions of the agents and of their interactions;
Dynamic Learning of the Environment for Eco-Citizen Behavior 50

Chapter 4. Multi-Agent Systems
• the organization of the system determines the result of the system. The composition of partialfunctions is determined by relations that link agents i.e. the organization.
4.3.1 Non-Cooperative Situations
Cooperation is the key mechanism through which AMAS can be implemented to solve complexproblems. The functional adequacy ensures that for a calculable problem there exists a MAS whoseagents cooperatively find a solution. The non-adequacy of the system comes from the existenceof non-cooperative interactions within the system. In open systems, it is not possible to anticipatecooperative behaviors that do not contribute to the global functioning of the system, either actionsthat could be deleterious. To reach a functionally adequate state, agents need to locally detect thefailures in cooperation by changing their behaviors.
An AMAS has to be conceived so that agents can do the best they can when they encounterdifficulties. These difficulties can be viewed as exceptions in traditional programming. From anagent point of view, we call them Non-Cooperative Situations (NCS) or cooperation failures. ANCS is defined as follows [53]:
Definition 2. An agent is in a Non-Cooperative Situation (NCS) when:
• a perception (either from the environment or other agents) is not understood or is ambiguous;
• perceived information does not produce any new decision;
• the consequences of its actions are not useful to others.
Given the previous definition, seven generic types of NCS that an agent may encounter have beenidentified. These NCS can be triggered by the interaction of an agent either with another agent orwith the environment:
• Perceive:
– incomprehension: the agent cannot extract the semantic contents of a received stimulus;
– ambiguity: the agent extracts several interpretations from a same stimulus;
– incompetency: the agent cannot benefits from the current knowledge state during thedecision;
• Decide:
– unproductiveness: the agent cannot propose an action to do during the decision;
• Act:
– concurrency: the agent perceives another agent which is acting to reach the same worldstate;
51 Dynamic Learning of the Environment for Eco-Citizen Behavior

Chapter 4. Multi-Agent Systems
– conflict: the agent believes that the transformation it is going to operate on the world isincompatible with the activity of another agent;
– uselessness: the agent believes that its action cannot change the world state or it believesthat the results for its action are not interesting for the other agents.
NCSs must be identified during system design and solved through specific functions. Acooperative agent has two types of behavior: the nominal behavior, which describes the localfunctionalities of the agents, and cooperative behavior, that consists in a set of actions that enablesthe agent to prevent and solve eventual NCS. The cooperative behaviour of the agents is the basis ofself-adaptation in AMAS: the system tends to reach the functional adequacy as the NCS are solvedor avoided.
To solve NCSs, agents carry out so-called ”cooperative” actions that consist in locally adjusttheir behavior. Three types of cooperative actions have been identified [21]:
• Tuning: the agent adjusts its internal parameters.
• Reorganization: the agent changes the way it interacts with its neighbourhood,i.e it stopsinteracting with a given neighbour, or it starts interacting with a new neighbour, or it updatesthe confidence given to its existing neighbours.
• Openness: the agent creates one or several other agents, or deletes itself.
Identifying the nominal and cooperative behavior of agents is delegated to the system designers,who must propose appropriate mechanisms. To this end, the ADELFE methodology introducedin the following section guides designers in the conception and the development of cooperativeAMAS.
4.3.2 Criticality
When an agent determines a NCS, a criticality value associated with the agent is calculated. Foran agent, criticality represents the distance between its current situation and the its own goal. Itenables an agent to determine the relative difficulty of agents in its neighborhood and improvescooperation. The evaluation methods and calculation of the criticality are specific to each type ofagent [17]. An AMAS agent can determine NCSs and its criticality in several ways [85]:
• according to a priori determined criteria, depending on the agent’s perceptions, that allow theagent to interpret the criticality of NCSs.
• according to the feedback transmitted between agents. An agent can inform other agentsabout the encountered NCS and the criticality associated with the NCS. An issuing agent canpotentially attach the information useful for the resolution of this NCS.
Dynamic Learning of the Environment for Eco-Citizen Behavior 52

Chapter 4. Multi-Agent Systems
• according to service requests transmitted between agents. An agent may need the skills ofanother agent in order to maintain a cooperative activity. The agent then attaches to its requestfor service the criticality of the NCS which it would encounter if it did not obtain satisfaction.
• In order to pursue its local goal, an agent may require the skills of another agent. To this end,the agent associates to its request for cooperation the criticality that would result if it does notget help.
Cooperative agents attempt to reduce their criticality of agents that encountered some NCSwhile avoiding that the process of helping the agent does not cause the criticality of other agents toraise. The criticality is notably employed to determine which NCS to resolve first.
4.4 Designing an AMAS with ADELFE
Today several agent-oriented methodologies exist. Some of the most recognized methodologiesare ASPECS [30], PASSI [29], TROPOS [19], GAIA [153], Prometheus [148] and so on. Differentlyfrom these methodologies, the AMAS approach focuses on the design of cooperative multi-agentsystems. ADELFE is the french acronym for ”Atelier de Developpement de Logiciel a FonctionnaliteEmergente” which can be translated by Toolkit for Designing Software with Emergent Functionalities.
ADELFE is based on the Rational Unified Process (RUP) to guide the designer during the 5 phasesof AMAS design [17]:
• WD1 - Preliminary requirements: this phase represents a description of specifications betweencustomers, users and designers. The result of this phase is a document containing a precisedescription of the problem without using any particular modeling language.
• WD2 - Final requirements: in this work definition, the preliminary requirements are trans-formed to use cases. Also, this work definition characterize the environment of the system, byidentifying the entities that interact with the system and the constraints on these interactions.
• WD3 - Analysis: this involves the identification and the definition of the different entities ofthe system by evaluating their pertinence to the AMAS theory. The result of this phase is acomprehensive description of agents and their interaction.
• WD4 - Design: in this phase are defined the interaction protocols between agents as well astheir behaviors (nominal and cooperative). This activity results in a complete characterizationof the multi-agent system.
• WD5 - Implementation: implementation of the framework and agent behaviours.
ADELFE constitutes a fundamental tool for the design of AMAS. The Appendix B providesfurther details on the ADELFE methodology. A complete description of the ADELFE methodologycan be found in [17].
53 Dynamic Learning of the Environment for Eco-Citizen Behavior

Chapter 4. Multi-Agent Systems
4.5 Discussion
The concept of the smart city arises from the need to find a solution to rapid population growth andthe risks this entails for a city, economic risks such as unemployment, or physical risks such as over-pollution [74]. MAS together with IoT constitutes an effective technological means for addressingthe objective of smartness by enabling the design of networks of intercommunicating devices thatresponds to the needs of citizens both individually and as a whole and also by monitoring withsensors the levels of pollution, traffic, noise, etc [62, 74]. A smart city can be instrumented with alarge amount of sensing devices constantly collecting information about actions that happen in thecity, humidity sensors, temperature sensors, noise, pollution, etc. All these sensors are part of a datacollection system that will be responsible for processing information quickly and intelligently [74].Through the MAS technology, sensing devices embody not only data acquisition capacities but alsomechanisms of coordination and are capable of act jointly. The increasing complexity of the urbansociety and its constantly evolving dynamics makes it necessary for smart cities to set goals that aredifficult to formalize for computer software, even for a MAS. This is because of the nature of thephysical environment in which the MAS is immersed. For example, the learning activity in ambientsystems is a complex activity: the task to learn is not known in advance, can vary over time, newtasks can be introduced, etc. Moreover, their non-linearity (that is, the inability to define throughsimple mathematical rules the behavior of the system), the high number of components and theirinteractions, their unpredictability, make an extremely complex task the specification of a singlecomputation model [137].
The AMAS approach aims at solving problems in dynamic nonlinear environments by a bottom-up design of cooperative agents, where cooperation is the engine of the self-organization process [53].The AMAS approach is a pertinent solution to address the smartness goals of cities by exploitingagents that are delegated with simple tasks; the cooperation allows the agents to solve complexproblems that cannot be pursued individually by the agents.
4.6 Conclusion
This chapter introduced the AMAS as an approach for solving complex problems in dynamic, openenvironments through autonomous agents. AMAS are suitable for solving problems that cannot beprecisely formalized through a bottom-up approach, where agents organize autonomously theiroperation to solve cooperatively a problem that cannot be pursued individually. Autonomousagents have social skills, thanks to which they can operate jointly by cooperating, acting togetherand compensating their local skills so that global patterns can emerge.
Autonomous agents have two behaviors: nominal behavior and cooperative behavior. Thenominal behavior consists of a set of skills that are performed locally by an agent in its environmentto pursue its goal. The cooperative behavior allows agents to perform jointly different operationsthat can contribute to the emergence of patterns that cannot be produced individually. The joint
Dynamic Learning of the Environment for Eco-Citizen Behavior 54

4.6. CONCLUSION 55
execution of different actions leads to the emergence of patterns that cannot be produced byindividual agents.
It is a difficult task to anticipate, at design time, how agents have to interact in case of expectedbehaviors. In this case, the interactions between agents enable the emergence of cooperativebehavior that could correct eventual exceptions. Indeed, there is no global control of the system. Initself, the emergent organization is an observable organization that has not been given first by thedesigner of the system [53]. Therefore, the agents assume a cooperative behavior to resolve anyunpredictable situations (NCS).
When conceiving an AMAS, the designer must define the nominal behaviors of the agents.Besides this, the designer must describe the cooperative behaviors of the agents, based on thepossible malfunctioning that can occur during the nominal behaviors. When an agent encounters aNCS, it solves this exception by acting cooperatively.
Seven NCS have been identified and can be triggered by the interaction between agents. TheseNCS are sufficiently generic to cover a large variety of problems. System designers can use thesegeneric NCS to its problem to define the behavior that agents must assume in case of unpredictablebehavior.

Part II
Contribution
56

Chapter 5Estimating Missing Information in SmartCities: HybridIoT
Objectives of this chapter:
• Introducing the HybridIoT system for estimating missing information in smart cities
• Describing how agents in HybridIoT implements the estimation technique
• Describing how agents adapt to the environmental context to determine how to estimate themissing information
• Describing how agents use historical data to improve the estimation task
THE previous chapter introduced the MAS paradigm and the AMAS approach to solve complexproblems in a bottom-up way through the self-organization of cooperating agents that operate
jointly to solve problems that cannot be solved individually. Also, a brief description has beenreported on the ADELFE methodology, conceived to guide the designers in the conception anddevelopment of complex systems using the AMAS approach.
This chapter discusses the HybridIoT estimation technique for estimating missing environmentalinformation on a large-scale. The description of the system will be characterized by the objective ofthe system, the environment and the behavior of the agents. This description, following the ADELFEapproach described in the previous chapter, enables justifying the use of the AMAS approach.
5.1 Problem Statement
This section presents the formal problem statement concerning the application of this thesis. Theformulation presented is taken from Lehmann and Casella [84].
57

58 CHAPTER 5. THE HybridIoT APPROACH
The statistical problem addressed in this thesis concerns the theory of estimation, one of themost common forms of statistical inference. Given:
• x[t] is the observation at time t,
• x = (x[1], x[2], ..., x[T ]) is a vector of T observation samples,
• θ is the parameter vector of interest belonging to a sample sub-space Ω, and
• p(x; θ) is the mathematical model (i.e. a probability density function) parametrized by θ.
Suppose that g is a real-valued function defined over the parameter vector θ ⊂ Ω and that wewould like to know the value of g(θ). Unfortunately, θ, and hence g(θ), is unknown. However, thedata can be used to obtain an estimate of g(θ), a value that one hopes will be close to g(θ). Theproblem is to find a function of the N -point data set which provides an estimate of θ, that is:
θ = g(x = x[1], x[2], ..., x[T ]) (5.1)
We are interested in finding an estimator function that calculates estimates punctually, that is,using a collection of sample data to calculate a single value at a given time instant. In this case, wesay that the problem concerns the point estimation theory.
The problem is, therefore, the determination of a suitable estimator, which can be defined asfollow:
Definition 3. An estimator is a real-valued function δ defined over the sample space. It is used to estimatean estimand g(θ), a real-valued function of the parameter θ.
It is hoped that δ(X) will tend to be close to the unknown g(θ), but such a requirement is notpart of the formal definition of an estimator. The value δ(x) taken on by δ(X) for the observedvalue x of X is the estimate of g(θ), which corresponds to the ”correct” value for the unknownvalue. Because δ(X) is a random variable, we shall interpret this to mean that it will be close onthe average. To make this requirement precise, it is necessary to specify a measure of the averagecloseness of (or distance from) an estimator to g(θ). Examples of such measures are
P (|δ(X)− g(θ)| < c) for some c > 0 (5.2)
and
E|δ(X)− g(θ)|p for some p > 0. (5.3)
Consequently, estimating an information causes δ(X) to generate a loss of information that canbe measured as follows:
L(θ, d) ≥ 0 for all θ, d (5.4)

5.1. PROBLEM STATEMENT 59
and
L[θ, g(θ)] = 0 for all θ, (5.5)
so that the loss is zero when the correct value is estimated. The accuracy, or rather inaccuracy, of anestimator δ is then measured by the risk function
R(θ, δ) = EθL[θ, δ(X)] (5.6)
where X is a vector of observations stochastically drawn from a population, Eθ is the expectationover all population values of X .
This problem has no exact solution. It is possible to reduce the risk at any given point θ0 to zeroby making δ(x) equal to g(θ0) for all x. There exists no best estimator that minimizes the risk forall values of θ. To avoid this difficulty, the class of estimator can be restricted by excluding theestimators that too strongly favor one or more values of θ at the cost of neglecting other possiblevalues. In this ways, only the estimators that behave in a ”generic” manner are kept. This can beachieved by requiring the estimator to satisfy some condition which enforces a certain degree ofimpartiality. One such condition requires that the bias Eθ[δ(X)] − g(θ), also called the systematicerror, of the estimator δ be zero, that is, that
Eθ[δ(X)] = g(θ) for all θ ∈ Ω (5.7)
This condition of unbiasedness ensures that, in the long run, the estimator provides correctanswers ”on the average”.
5.1.1 Discussion
In the context of this thesis, we suppose that one or more observations at time instant t maybe unavailable. Based on the samples previously observed by sensing devices, we propose anestimation technique that is deployable at a large-scale and addresses the properties of opennessand heterogeneity. Sensing devices are defined as follows:
Definition 4 (Sensing Device). A sensing device is any physical instrumentation that embeds sensorscapable of detecting events and changes in its environment. Sensing devices can be either fixed or mobile:fixed sensing devices are installed in specific positions and enable continuous monitoring of the environment.They acquire information continuously and store these in dedicated databases. Mobile sensing devices canembed a variable number of sensors: the information can be acquired on-demand by the user (the owner of thedevice) or using a fixed schedule.
The developed approach is based on the AMAS approach presented in the previous chapter; thisapproach allows the sensing devices to perform autonomous computation in their environment (lo-cally), without being influenced in any way by other sensing devices. Moreover, the software agents

60 CHAPTER 5. THE HybridIoT APPROACH
composing the designed AMAS improve their estimation function according to the informationthey perceived; this allows calculating accurate estimates at any time.
The scientific contribution of the proposed approach lies in an estimation technique for environ-mental information according to three different schemas:
• using the historical data [1];
• using the information acquired by nearby, homogeneous sensing devices [2];
• using heterogeneous information (that is, information of different types and/or units) [3].
5.2 General Functioning of HybridIoT by Example
This section describes a representative case study that will be used to present the general functioningof the HybridIoT estimation technique and how it works under different conditions. In the rest ofthe chapter, we assume that there is no difference between sensors and sensing devices. Moreover,we assume that sensing devices are agentified, thus are associated with agents that can estimatedata in case of temporary unavailability of the sensing device and to learn the dynamics of theenvironment in which the device is situated.
In the scenario, illustrated in Figure 5.1, there are two rooms including three sensing devices:two temperature sensors, one for each room (S1 and S3) and a humidity sensor in the corridor (S2).All three sensors installed are supposed to be fixed at a given position and their functioning isautonomous. The rooms are separated by walls that are not known by the agents, nor manuallyspecified by any configuration. In case a sensor is unable to provide any information by directobservation of the environment, the associated agent cooperates with the other agents using theirperceived information.
Each agent is able to learn environmental dynamics from information obtained by direct obser-vation. In some cases, agents use the learned information to estimate missing information.
In the following examples, we suppose that sensing devices are capable of perceiving theirenvironment and that each one is associated each one with an AMAS agent capable of processingthe environmental information and estimating missing information when needed.
5.2.1 First case: no other sensor available
Let S1 be an agentified sensing device. Its associated agent learns the dynamics of the local part ofthe environment. Suppose that S1 encounters a problem and that it is no longer able to providetemperature values (Figure 5.2). Because there is no other agent in the proximity of S1 (the agents areaware of the local environment in which they operate), then the agent associated with S1 must finda way to provide the information to the user despite its unavailability. The agent associated with S1
uses the information previously observed (during S1 functioning) to provide an estimate for the
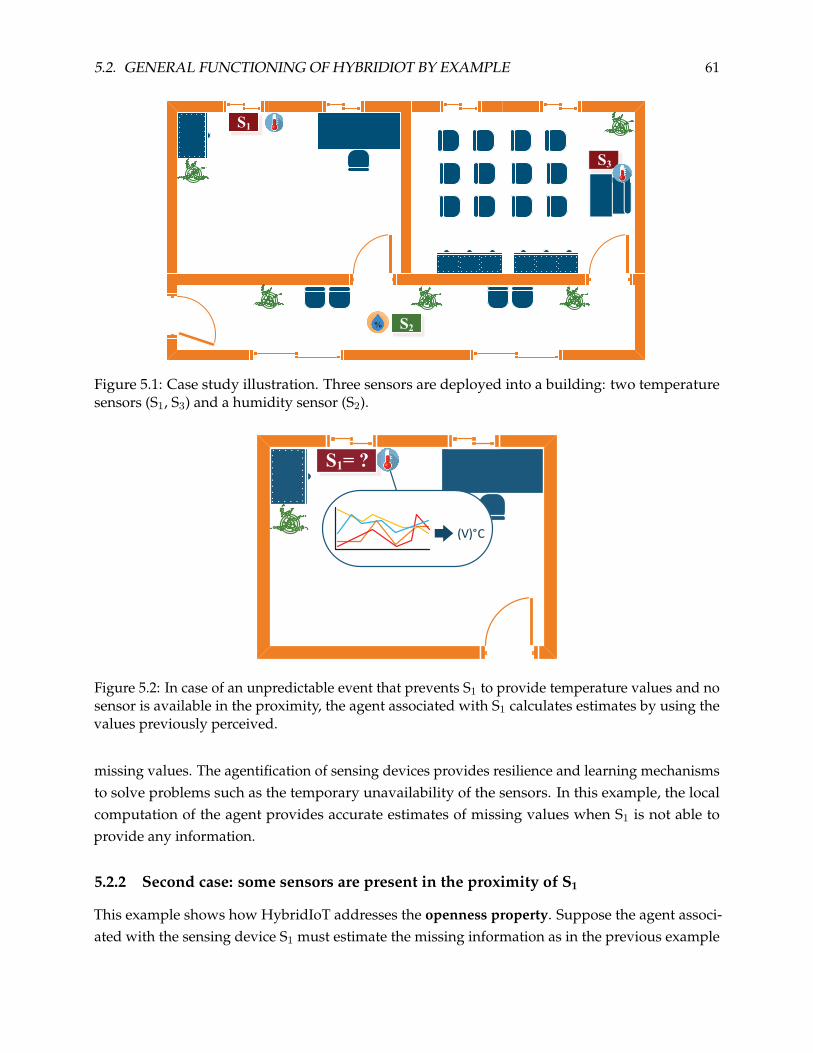
5.2. GENERAL FUNCTIONING OF HYBRIDIOT BY EXAMPLE 61
%
S1
S3
S2
Figure 5.1: Case study illustration. Three sensors are deployed into a building: two temperaturesensors (S1, S3) and a humidity sensor (S2).
S1= ?
Text
(V)°C
Figure 5.2: In case of an unpredictable event that prevents S1 to provide temperature values and nosensor is available in the proximity, the agent associated with S1 calculates estimates by using thevalues previously perceived.
missing values. The agentification of sensing devices provides resilience and learning mechanismsto solve problems such as the temporary unavailability of the sensors. In this example, the localcomputation of the agent provides accurate estimates of missing values when S1 is not able toprovide any information.
5.2.2 Second case: some sensors are present in the proximity of S1
This example shows how HybridIoT addresses the openness property. Suppose the agent associ-ated with the sensing device S1 must estimate the missing information as in the previous example

62 CHAPTER 5. THE HybridIoT APPROACH
and it estimates the missing information using the information previously observed (Figure 5.3).During this operation, some sensing devices perceiving the same type of information as S1 aresupposed to be in the proximity of S1. In this case, S1 adapts its behavior (therefore how it estimatesthe missing information) to the environmental context and calculates an estimate for the missinginformation by cooperating with the agents associated with the sensing devices of the same type(that is, perceiving the same type of information).
The agents address the openness property as they can process new inputs from sensing devicesthat enter the system at any time. Therefore, the functioning of each agent is independent of eachother. When cooperating with other agents, S1 gives more importance to the real informationperceived by the nearby sensing devices (as they are likely to perceive similar information) than theinformation observed previously (because the current environmental dynamics may be significantlydifferent from the one previously observed).
In this example, multiple agentified sensing devices are considered. Each agent operateslocally in its part of the environment and operates independently from the other agents. The localand autonomous computation of the agents enables the technique to be scalable.
T6= 20°
S1= ?T4= 20°
T5= 21°
T7= 19°
Figure 5.3: Agent S1 uses the information obtained cooperatively from the agents available in itslocal part of the environment to estimate the missing values.
5.2.3 Third case: some sensors perceiving information of different types are present
This example shows how HybridIoT is able to estimate missing information by integrating het-erogeneous information. Suppose the agent associated with the sensing device S2, perceivinghumidity values, must estimate missing information (Figure 5.4). If there is no agent in its envi-ronment, the agent associated with S2 can rely on its knowledge1 to calculate the estimates for themissing value.
1Here we refer to knowledge as the set of information perceived by sensing devices, then collected and processed bythe associated agents.

5.2. GENERAL FUNCTIONING OF HYBRIDIOT BY EXAMPLE 63
Figure 5.4: Agent S2 estimates missing humidity values by cooperating with agents perceivingheterogeneous information.
If some sensing devices are available in the environment but not in the local part observed by S2,this one can cooperate with other agents, that perceive different types of information, to estimate themissing information. In this way, the agents overcome the lack of homogeneous sensors. Therefore,S2 estimates the missing information through a cooperative resolution process that is based onthe exploitation of the environmental information observed by agents perceiving heterogeneousinformation.
As in the previous example, the agents associated with the sensing devices operate autonomouslyin their local part of the environment. Even if the estimation process is pursued between agentsassociated with sensing devices perceiving different types of information, the same technique canbe deployed at large-scale as do not make any assumption on the scale or the type of environmentin which sensors are installed.
5.2.4 Discussion
The illustrated example shows how the estimation technique implemented by the HybridIoT systemenables addressing the properties of openness, heterogeneity and large-scale. The instantaneousadaptation of agents in case new devices entering the system does not affect the functionalityof the available agents. The agents can use new inputs to calculate any missing value estimateswithout any reconfiguration. The agents use heterogeneous information whose type is not knownin advance to ensure that the information is provided even in case of a lack of homogeneous sensors.The multi-agent approach used to implement the proposed estimation technique allows the agentsto pursue autonomous computation so that the estimation technique can be used in large-scalecontexts.

64 CHAPTER 5. THE HybridIoT APPROACH
5.3 System Objective
The novelty of the proposed approach lies in:
• estimate missing information in points in the environment where few sensing devices arepresent. In this case, the advantage proposed technique is twofold:
– to provide a resilience mechanism to allow the information to be available in case ofsudden malfunctioning of sensing devices and
– to reduce the number of sensing devices to deploy in an environment;
• learn from raw data without feedback from the end-user;
• exploiting environmental information from available devices to avoid the installation of alarge number of ad hoc sensors;
• integrating heterogeneous environmental data.
HybridIoT leverages on two types of estimation:
• endogenous estimation, relying on information of the same type, same scale and unit as thesensor that must estimate an information. The endogenous estimation consists of two furthertypes of estimation:
– using historical data: the estimation is done by exploiting the information previouslyacquired by sensors;
– using nearby sensors data: the estimation is done by exploiting the information of thesame type (and same unit) acquired by nearby sensors’;
• exogenous estimation, estimating missing information by integrating heterogeneous infor-mation perceived from different data sources.
To motivate the use of exogenous estimation, consider an urban sensing platform used tomonitor the environment. In such a context, sensors can be of different types, they can acquireheterogeneous information or data of the same type using different units. We hypothesize thatthe abundance of different information is crucial for both AI as well as data analysis techniques toextract useful knowledge from the urban environment to achieve the smartness goal of a city. Theexogenous estimation is beneficial in the smart city context for three aspects:
• enables integrating heterogeneous information to estimate missing values and to overcomethe lack of sensors of the same type;
• the integration of heterogeneous information enables defining a coherent representation ofthe environment to monitor and to understand its evolution;

5.4. SYSTEM REQUIREMENTS 65
• the integration of heterogeneous information enables extracting correlations between semanti-cally different information.
Exogenous estimation enables leveraging the large amount of information perceived by hetero-geneous devices to provide wide information coverage. This ensures that users can access accurateand timely information on the state of the environment, so that experts can use the information toimprove services offered to citizens.
In the context of the development of a framework to support smart city initiatives, Hybrid-IoT aims at improving the economic and sustainable aspects. The installation, maintenance andoperation of ad hoc sensing devices are the main costs for the deployment of an urban sensinginfrastructure. That’s why the proposed estimation technique enables reducing the number ofsensors in a large-scale context by exploiting the information acquired from some sensing devicesand providing accurate estimates whereas sensing devices are momentarily not available (due tounpredictable malfunctioning or not present).
5.4 System Requirements
The requirement steps of the ADELFE methodology are devoted to the establishment of require-ments and are usual in software development methodology. The steps consist in a description ofthe problem domain to be solved, as well as a specification of the final user needs, the functionaland non-functional requirements [115]. Therefore the environment and the entities situated in it areidentified. This phase results in an identification of the functionalities required by the user and acomplete definition of the elements that make up the system to be done, so that it can be analyzedlater to verify the adequacy of the AMAS approach to the problem posed.
Functional requirements refer to the constraints related to the function of the system [20]:
• HybridIoT must adapt to unexpected and unpredictable changes in the environment relatedto the changes in environmental conditions but also to the changes in the configuration of thedevices (such as their location or their availability);
• HybridIoT must be able to learn the evolutionary dynamics of the environment by observingthe information acquired directly from the environment;
• HybridIoT must provide estimates in a short amount of time (from seconds to minutes).
Non-functional requirements are constraints on the operation of the system that are not relateddirectly to its functioning [20]. We identified the non-functional requirements as the propertiesaddressed by HybridIoT that arise from the complexity of the environment in which the systemoperates. These properties have not been simultaneously explored by the state of the art solutions:
• Openness: refers to the capacity to handle new input at any time without the need for anyreconfiguration while ensuring its operation;
66 CHAPTER 5. THE HybridIoT APPROACH
• Large-scale: refers to the capacity to be deployed in large, urban contexts where thousands ofdevices can be present;
• Heterogeneity: refers to the capacity of handling different types of information without any apriori configuration.
HybridIoT satisfies these properties, making it a significant advance in the state of the art forestimating missing information. Heterogeneity enables integrating different types of devices thatcould perceive several types of environmental information. HybridIoT is capable to reason on thesesensing devices to accurately estimate missing information. Openness enables sensing devices toenter or leave the system without the need for any re-configuration.
The system requirement phase also establishes the limits of the systems to be designed. Thisincludes identifying the entities involved in the system operation, defining the environment, theentities situated within it and its properties.
The actors involved in the functioning are solely the users, without any difference in role orresponsibility. A user’s objective consists of interacting with the system to request environmentalinformation; the requests can occur at any time and everywhere. The interactions between theuser and the system only include the requests for particular types of information, and the relatedresponses by the system, which in turn consist of environmental data.
Due to the constantly evolving and unpredictable dynamics of the urban contexts, sensorsare not always available to provide the information to the user. This is why the sensors must beendowed with adaptation capabilities so that they are capable of facing unpredictable events thatprevent them from providing information.
We identify the following failure situations:
• the user has requested information from a device that cannot provide the desired information;
• there is no sensor at the point where information was requested;
• sensors in the proximity provide information different from that required.
Besides, according to Russel and Norvig’s definition, the environment in which sensors areplunged is:
• inaccessible because knowing all about the environmental information is difficult;
• discrete because the number of distinct perceptions and actions is limited;
5.5 System Analysis
The analysis phase of the ADELFE methodology aims at identifying the system structure andjustifying the AMAS adequacy. This phase enables analyzing the domain characteristics, determine

5.5. SYSTEM ANALYSIS 67
the agents and validate an AMAS approach at the global and local levels [17]. The AMAS adequacyprocess consists of dealing with the AMAS principles; this concerns the identification of cooperativeagents, how they determine the cooperation failures that can occur between entities, and then todefine the agents regarding the results of previous steps. The verification of the adequacy of theAMAS is crucial for the ADELFE methodology. Indeed not all the applications require the AMASapproach for their realization. Figure 5.5 shows the flow of tasks necessary to verify the MASadequacy according to the ADELFE methodology.
Figure 5.5: Flow of tasks necessary to verify the MAS adequacy according to the ADELFE method-ology.
The entities of an AMAS are differentiated into two categories [17]:
• Active entity: an active entity is given behavioral autonomy, allowing it to change statewithout necessarily interacting with another entity. An active entity can interact with otherentities, possibly through communication mediums;
• Passive entity: passive entities are associated with resources or data. Passive entities haveno behavior, they can only be perceived and eventually modified by active entities. A statetransition can only be the result of an interaction with another system component.
In HybridIoT, we identify three types of entities: information, sensors and ambient devices. Theinformation, which can be real or estimated, is the result that must be presented to the end-user. Itdoes not contain any indication of whether it has been estimated or not. The sensors are responsiblefor acquiring the information. The ambient devices are any device that contains sensors and can bequeried by the end-users.
We consider sensors and ambient devices as active entities. The former because they perceive in-formation autonomously, they need interaction and negotiation capabilities to ensure that estimatescan be calculated when information is not available. Ambient devices, to which we can associateIoT devices, smartphones, connected cars, in general, all devices associated with environmental

68 CHAPTER 5. THE HybridIoT APPROACH
sensors, are considered as active because they are linked to users, who may change their mindwhich implies a change in the state of the related entities.
The ADELFE methodology provides a tool based on a questionnaire to assess the adequacy ofthe AMAS approach to our problem (Figure 5.6). This adequacy is studied both at the system leveland the local level (the level of the different parts composing the system) [12].
Figure 5.6: ADELFE tool used to assess the pertinence of the AMAS approach for the HybridIoTsystem.
The two main activities of the analysis phase consist in verifying the adequacy of AMAS atglobal and local levels [17]:
• Global level: In this activity, the adequacy at the global level is studied to answer the question”is an AMAS required to implement the system?”. This is done through several simple questionsrelated to the global functioning of the group of agents in HybridIoT [13]:
1. Is the global task incompletely specified? Is an algorithm a priori unknown?
2. Is the correlated activity of several entities needed to solve the problem?
3. Is the solution generally obtained by repetitive tests? Are different attempts requiredbefore finding a solution?
4. Can the system environment evolve? Is it dynamic?

5.5. SYSTEM ANALYSIS 69
5. Is the system functionally or physically distributed? Are several physically distributedcomponents needed to solve the global task? Or is a conceptual distribution needed?
6. Does a great number of components needed?
7. Is the studied system non-linear?
8. Finally, is the system evolutionary or open? Can new components appear or disappeardynamically?
• Local level: In this activity, the AMAS adequacy is studied at the local level to determine theagents that need to be implemented as an AMAS. At the component level, three more criteriaare used [13]:
1. Does a component have only a limited rationality?
2. Is a component “big” or not? Is it able to do many actions, to reason a lot? Does it needsignificant abilities to perform its own task?
3. Can the behavior of a component evolve? Does it need to adapt to the changes of itsenvironment?
The following subsection discusses both global and local levels analysis, then the identifiedagents involved in HybridIoT operation.
5.5.1 Global Level Analysis
Is the global task incompletely specified? Is an algorithm a priori unknown? The objective ofthe proposed method is to estimate environmental information in local parts of the environment notsufficiently covered by sensing devices using heterogeneous information which type is not knownin advance; the information is acquired from a set of sensors not known in advance. HybridIoTcan be effectively considered as an ambient complex system. The following points clarify why theaddressed problem is complex:
• the physical environment in which the system operates respects the given definition ofcomplexity: it is heterogeneous, its evolution is non-linear (that is, its evolution cannot bedetermined only by its current state and it is not proportional to the data input), and non-deterministic (the consequences of performed actions in the physical environment could notbe determined in advance with certainty).
• the dynamism of IoT devices involved in the system operation process makes it complex toachieve the system global goal. The dynamism is linked to the nature of the connected objects,not always available, some of them are mobile and heterogeneous. These factors make theinteroperability of IoT devices difficult to realize in an ambient system.

70 CHAPTER 5. THE HybridIoT APPROACH
• The system has to make decisions in a dynamic, constantly evolving environment, so it isdifficult to foresee all the possible behaviors that the system has to take in every possiblesituations. Ambient systems, therefore, have a certain form of rationality or intelligence,which enables them to learn from environmental observations, to observe the dynamics, andto respond accordingly to situations that cannot be predicted in advance.
The requirements of the proposed technique make it impossible to specify a global, formallydefined objective that can be used for the development of the proposed approach in a top-downmanner.
Is the correlated activity of several entities needed to solve the problem? The unavailabilityof a device in providing the information requested by the user requires a mechanism of interactionbetween a group of sensors to provide an estimate of the information requested, calculated throughthe information acquired by a collective of available sensors.
Is the solution generally obtained by repetitive tests? Are different attempts required beforefinding a solution? The estimate of missing information is calculated in almost instantaneous timebased on the available information, no repetitive tests are required.
Is the system functionally or physically distributed? Are several physically distributed com-ponents needed to solve the global task? Or is a conceptual distribution needed?
The system is functionally and physically distributed, composed of different agents each oneassociated with a physical device that perceives environmental information. Thanks to the propertiesof the AMAS approach, the proposed estimation technique is deployable in a physically distributedenvironment where sensing devices are coupled with intelligent agents providing estimates in caseof missing information.
Does a great number of components needed? The proposed technique enables operatingdespite the number of devices present that may vary during the operation. There is no need for alarge number of components as the proposed estimation technique relies on the available sensors tocalculate the estimates for missing information.
Finally, is the system evolutionary or open? Can new components appear or disappear dy-namically? To address the openness property, it is necessary to calculate estimates through theinformation coming from devices that can enter or leave the system at any time. HybridIoT enablesaddressing the openness property.
5.5.2 Local Level Analysis
In the second iteration of analysis we examine the local level to know if some components will needto be recursively viewed as AMAS. If some components need to evolve or adapt themselves, it israther sure that they will be implemented as AMAS. We have therefore repeated the analysis phaseof ADELFE to determine the agents composing an AMAS sensing device: the agents need data toensure its proper operation, therefore, we define the data agent associated with each observation

5.5. SYSTEM ANALYSIS 71
coming from the environment at a precise moment in a discrete-time interval. Data perceivedin consecutive time instants are aggregated to determine windows that accurately describe theenvironmental evolution in a discrete time interval. We then identify the Ambient Context Agent(ACA) as responsible for providing environmental information at any time from either directobservation or estimation and learning the environment dynamics by grouping information intodata windows known as Ambient Context Windows (ACWs), each one composed of multipleContext Entries. We report the definitions of both ACW, context entry and ACA respectively:
Definition 5 (Ambient Context Window). An Ambient Context Window (ACW) Ct contains homoge-neous environmental information perceived in a discrete time interval T = [t− δ, t], t− δ < t. An ACWhas |Ct| = |T | homogeneous context entries, one for each time instant. Each ACW Ct is associated with anindex t that corresponds to the time instant in which the information at time t has been perceived.
Definition 6 (Context Entry). A Context Entry Eit ∈ R is a numerical information perceived at timet ∈ T , where T is the time window of the Ci. The value of a context entry can be any type of environmentalinformation such as temperature, humidity, lightness etc.
Definition 7 (Ambient Context Agent). An Ambient Context Agent (ACA) can be associated with asensing device; its goal is to provide environmental information in a local part of the environment. Thanks tocooperative behavior, ACAs are capable of providing estimates even if ad hoc sensors are unavailable. EachACA is characterized by a knowledge base containing ACWs. Each ACW belongs to a unique ACA.
We also define a second type of agent, called Real Sensor Agent (RSA). Each RSA is associatedwith a unique sensing device and is defined as follows:
Definition 8 (Real Sensor Agent). A Real Sensor Agent (RSA) is any physical instrumentation that canprovide accurate environmental information value (such as a temperature). A RSA is not associated with anyconfidence zone2. Its goal is to provide environmental information to ACAs. RSAs have also the capacity oflearning from the environment by creating ACWs related to the observed information.
The difference between ACA and RSA is that the former can exist without being associated withsensing devices; the RSAs cannot exist unless they are associated with the sensing devices. The ideabehind the use of ACAs and RSAs is that we suppose that the environment is instrumented withsome sensors. Without sensors, ACAs cannot provide an estimate, therefore these would be useless.For this reason, we suppose that some sensors are available in the environment and are associatedwith RSAs. The choice to use ACAs or RSAs depends on the context in which HybridIoT is used.Because ACAs can be used as virtual sensors (that is, not agentifying sensing devices), they mustrely on the information acquired from reliable sensing devices associated with RSAs. For that, it isnot possible to use only ACAs.
Having defined both ACA and RSA, from this point we will refer to agent without any differencebetween ACA or RSA.
2A confidence zone defines the neighborhood in which the agent bases its reasoning. See Definition 9.

72 CHAPTER 5. THE HybridIoT APPROACH
Does a component have only a limited rationality? Agents operate in the local part of theenvironment in which they are situated and observe the evolutionary dynamics of the environment.Their rationality is limited because the environmental dynamics observed by some agents aredifferent from those observed by other agents.
Is a component “big” or not? Is it able to do many actions, to reason a lot? Does it needsignificant abilities to perform its own task? Yes, the ACAs have to perceive data each onethrough a sensing device, adjust their neighborhood according to the information they perceive,and estimate data in case of an unpredictable NCS. These tasks can be more or less complexdepending on the amount of knowledge acquired by the agents. Moreover, the previous tasks aredone differently depending on the type of information perceived.
Can the behaviour of a component evolve? Does it need to adapt to the changes of its envi-ronment? ACAs adapt to the environmental context in which they are situated by determiningthe strategy for estimating missing information. Both ACAs and RSAs adapt to the environmentalcontext in order to learn the evolving dynamics of the perceived information.
5.5.3 Agents’ Characterization
The agents in HybridIoT provide a means to observe the environment, learn its dynamics andestimate missing information where ad hoc sensors are not available (for ACAs). Agents can beassociated with sensing devices or placed in points of the environment where sensors are notavailable, thus acting as virtual sensors. In this way, it is possible to address the lack of sensors inlarge-scale environments to ensure sufficient information coverage.
Agents adapt to the environment in which they are situated by learning from observation andinteracting cooperatively with other agents without any external intervention or configuration. Bylearning from direct observation of the environment, the agents acquire knowledge that can beused to estimate missing information. This knowledge consists of the information observed by thesensors during their operation.
The relevance of the AMAS approach is particularly reflected in the way the agents interact. Anagent may encounter problems during its interactions with other agents or with the environment:the interaction protocol may not be respected or the interaction itself may be a source of errors orfailures that may be the result of unpredictable events, due to the dynamic nature of the environmentor sudden sensing devices’ malfunctions. Such unpredictable events result in exceptions known inthe AMAS theory as Non-Cooperative Situations (or NCS).
To characterize the agents in HybridIoT, the following criteria are discussed for each entity:
• is it autonomous?
• does it pursue a local goal?
• does it have to interact with other entities?

5.5. SYSTEM ANALYSIS 73
• does it possess a partial view of the environment?
• does it possess certain negotiating skills?
• does the entity act in a dynamic environment?
• do the entity carries out a function?
• are the entity likely to face failures in cooperation?
• do the entity deal with Non-Cooperative Situations?
The advantage of the AMAS is based on the cooperation between agents to find an acceptablesolution to a complex problem. In the case of HybridIoT, we are interested in estimating missinginformation of environmental type (representable in numerical form), using information from alarge number of devices. The reasons why the AMAS approach is relevant in the context of theproposed approach can be summarized as follow:
• because we aim at providing a general estimation method for any kind of numerical infor-mation, it is not possible to specify a priori the way agents will estimate information in case areal sensor is not available. Therefore, agents cannot know what information will have to beintegrated to calculate a precise estimate, neither the function used to estimate a value;
• when information is not available, ACAs cooperate to provide an estimate by exploiting theirknowledge, which consists of a set of information describing the evolution of the previouslyobserved environmental values. Because a large number of sensing devices may be availablein a large-scale context, it is not possible to specify the interactions between all sensors todecide with which agents should cooperate: this would lead to a significant computationaloverhead due to the significant amount of information to be processed and the necessarycoordination between sensing devices.
The following subsections describe the ACAs and the RSAs according to the properties previ-ously presented.
Ambient Context Agent (ACA)
ACAs can be associated with sensing devices: in other words, ACAs can agentify physical sensingdevices or not. In the first case, the role of the ACAs is to provide a mechanism of resilience andlearning to sensing devices to provide estimates in a short amount of time whereas the sensingdevices are not able to perceive the physical environment. In the other case, the ACA can provideaccurate estimation in points of the environment where sensing devices are not present throughcooperation with the other agents (either RSAs and ACAs).
The objectives of an ACA are triple:

74 CHAPTER 5. THE HybridIoT APPROACH
1. to provide accurate environmental information through estimation or direct observation ofthe environment;
2. to modify its confidence zone, a region of the physical space centered around the position ofthe ACA and whose devices within it provide information coherent with that perceived bythe ACA. The confidence zone is defined as follows:
Definition 9. [Confidence Zone] a confidence zone is an n-side polygon associated with an ACA.An ACA uses a confidence zone to group sensors whose perceived information follows similar dynamics.The confidence zone is modified in real-time to keep within the region only the devices that providecoherent information.
3. to learn the dynamics of environmental information.
The first two objectives are interdependent and cannot be pursued individually by ACAs. TheACAs cooperate with other agents to provide accurate estimates when sensors are not available.During the cooperation phase, an ACA discriminates the information obtained from other agentsto exclude those providing information that is not relevant for the calculation of the estimate; as amatter of fact, some sensors can provide information that could lead to an imprecise estimate. As aresult of this process, the ACAs dynamically modify their confidence zones to include the agentsthat provide appropriate values for the calculation of the estimate and to exclude agents that do notprovide pertinent information. A confidence zone can be modified only if an information, eitherreal or estimated, is available.
Each ACA operates independently from other entities of the system: this means that the ACAsdo not depend on other components of the system, either internals or externals, to pursue theirgoals. Therefore, the ACAs are autonomous in their decisions. The goal of an ACA is local as itoperates in a limited part of the environment. This suggests that in case of unavailability of sensors,the ACAs cooperate with a limited set of ACAs in their proximity. The ACAs are also responsiblefor learning the evolving dynamics of the environment in which these are situated by assemblingACWs containing data acquired in discrete time intervals.
The proposed approach is able to cope with unpredictable exceptions that may prevent the ACAsfrom perceiving information from the environment. These exceptions, known as Non-CooperativeSituations (NCS), are solved through the joint activity of agents. The interactions between agentsrequire negotiation skills for the agent that has encountered an NCS; it has to be able to establishthe most useful information to achieve its goal. These properties ensure that ACAs address theproperties of the AMAS approach.
Figure 5.7 shows the activity diagram depicting the interactions between the ACAs and theother entities.

5.5. SYSTEM ANALYSIS 75
Figure 5.7: Activity diagram showing the interactions between the ACAs and the other entities.
Real Sensor Agent (RSA)
Unlike ACAs, RSAs are associated with physical sensing devices available in the environment(that is, with devices that can provide real information by direct observation of the surroundingenvironment) but they do not provide any estimation. RSAs operate autonomously, thus indepen-dently from other components of the system, by perceiving information and learning the evolvingdynamics of the environment. The operation of a RSA depends only on the availability of the devicewith which the agent is associated. Therefore, a RSA can exist only if it is associated with a sensing

76 CHAPTER 5. THE HybridIoT APPROACH
device.RSAs pursue two goals:
• perceiving the the local part of environment in which the RSAs are located and learning itsevolving dynamics: to pursue learning in a dynamic environment where RSAs are plunged,each RSA builds ACWs that describe the evolution of perceived information in discrete timeintervals.
• cooperating with ACAs: the RSAs cooperate with the ACAs by providing these with itsperceptions to help the ACAs in pursuing their goal, which consists of providing accurateestimates in case of device unavailability. The RSAs do not have any negotiation skills, astheir cooperative behavior consists solely in helping the ACAs by providing information.
Because RSAs are associated with sensing devices, a malfunction of the latter would conse-quently cause the RSAs to fail to operate properly. This includes problems such as the interruptionof the network connection or insufficient battery level. These problems are not treated in this thesisas we assume that RSAs are only able to operate thanks to the proper functioning of the sensingdevice with which they are associated. For this reason, RSAs are not designed to deal with NCSs;we say that RSAs are autonomous agents, but not AMAS.
Figure 5.8 shows the activity diagram depicting the interactions between the RSAs and the otherentities.
5.6 Environment
Once the objectives of the HybridIoT system has been defined and the use of the AMAS approachfor the problem addressed is justified, we define the environment in which the agents operate. Theenvironment in HybridIoT can be characterized by the following properties [118]:
• The environment is dynamic: the active entities present in HybridIoT environment have theirdynamics. These can be either fixed or mobiles (in case of smartphones), they can interactwith the environment and other entities and modify their behavior according to the evolutionof the environment.
• The environment is discrete: because sensors perceive data at discrete time intervals. The factthat the environment is discrete does not constitute a limitation, but this property reflects theway the devices perceive information from the environment.
• The environment is partially observable: a sensor cannot have a visibility of the entireenvironment. Consequently, actions are performed and have an effect on a local part of theenvironment. Also, actions performed on local parts of the environment do not influence theactivity of other sensors.

5.7. NOMINAL BEHAVIOR 77
RSA ACA
PERCEIVE THE
ENVIRONMENT
PRESENT THE
INFORMATION
COOPERATION
REQUEST
RECEIVE
COOPERATION
REQUEST
ASSEMBLE
RESPONSE
SEND ACWS
TO ACA
RECEIVE
ACWS FROM
RSA
Figure 5.8: Activity diagram showing the interactions between the RSAs and the other entities.
• The environment is episodic: each action of an agent depends on the actions performedpreviously. When an ACA calculates an estimate at time t, the resulting estimate can be usedat time t+ k when a further missing information needs to be calculated, thus influencing thecalculation of the latter estimate.
5.7 Nominal Behavior
The nominal behavior of agents in HybridIoT consists of providing environmental information atany time and everywhere.
During the operation of agents, there is no external control over their functioning, neither theyhave any initial knowledge about the information perceived by sensors.

78 CHAPTER 5. THE HybridIoT APPROACH
5.7.1 Agents Nominal Behavior
This section describes the behavior of an agent in HybridIoT. Agents have two types of behaviorsthat can be separated into nominal and cooperative, according to the AMAS theory. The nominalbehavior consists of a set of skills needed by agents to pursue their goals. The cooperative behaviorenables the agent to self-adapt to abnormal, unpredictable situations [17].
ACAs Nominal Behavior
The nominal behavior of an ACA in HybridIoT consists of four goals:
• perceiving the environment: this activity is carried out through physical sensors, capable ofacquiring information from direct observation of the environment. Sensors have a limitedcapacity range and may be subject to unpredictable events that lead to errors in measurement,or even malfunctioning that avoids sensors to provide information. Agents in HybridIoT donot make any assumption on the hardware, on the information perceived and the eventualmobility of a sensor;
• modifying the confidence zone: the confidence zones define the local part of the environmentobserved by the ACAs and their rough area of relevance. The ACAs modify the shape of theirconfidence zone to group together the agents whose perceived information follows similardynamics. The agents within a confidence zone (either ACAs or RSAs) provide reliable valuesused to estimate missing information in case of unpredictable events. The confidence zoneis defined as a polygon centered in the position where the corresponding agent is situated.When ACAs are created, each one is associated with a new confidence zone; the ACAs modifytheir confidence zones according to the values perceived by the other agents (either ACAs orRSAs) that are situated inside the confidence zones;
• online environment learning: agents are capable of learning the dynamics of the environmentwithout pre-processing data. Each agent exploits data windows containing consecutiveinformation in time to find recurrent dynamics in the historical data. The data windows, orACWs, have a variable quantity of values depending on the variability of the observed data;
• presenting the information to the user: the result of the system is the information presentedto the end-user, who must not be capable of determining whether the information has been per-ceived by an ad hoc sensor or estimated. Therefore, the operation of HybridIoT is transparentto the end-user.
RSAs Nominal Behavior
The nominal behavior of a RSA consists of acquiring information through direct observation ofthe environment; the RSAs are associated with ad hoc sensors and contrarily to ACAs they do not

5.7. NOMINAL BEHAVIOR 79
estimate any information. Because the objective of the RSAs is to provide environmental informationto the ACAs in the system, they do not have confidence zones.
The RSAs learn the dynamics of the environment by determining ACWs; these can be providedto the ACAs in proximity that use the context windows to calculate accurate estimates in case ofunpredictable events that prevent ACAs to provide environmental information.
RSAs have no cooperative behavior as their objective is only to provide information acquired bythe sensors to the ACAs that have to estimate missing information. Moreover, the only consideredfailures of RSAs are related to the sensing devices with which agents are related, such as a lowbattery or network issues. These failures are not considered because RSAs only operate when thesensing devices can perceive the environment and send these to ACAs.
Algorithm 1 describes the behavior of a RSA. At line 2, the RSA perceives the physical environ-ment through an ad hoc sensor. At line 5 the RSA checks if it is situated within the confidence zoneof the ACAi and this ACA has encountered an incompetence NCS (represents the inability of thesensor to provide information, this NCS described in Section 5.8.1): if so, the RSA provides the ACAwith its perception (line 6). Finally, at line 8 the RSA adds the perceived information p to the currentACW. The process of determining ACWs is described in Section 5.10.
Algorithm 1 RealSensorAgent
1: —perceive—2: p← perceiveFromSensor()3: —decide and act—4: if inConfidenceZone(ACAi) ∧ incompetenceNCS(ACAi), ∀ ACAi then5: ACAi ←getACA()6: sendPerception(p, ACAi)7: end if8: addToACW(p)
5.7.2 Discussion
This section discussed the nominal behavior of the agents composing the HybridIoT system. BothRSAs and ACAs act autonomously on the local part of the environment in which they are situated;they can perceive the environment and observe its dynamics. The environment responds to thecharacteristics of a real one: dynamic, constantly evolving, unpredictable. This enables HybridIoTto be employed in a real urban context.
The nominal behavior of both ACAs and RSAs is adequate to provide information in large-scaleenvironments. Nevertheless, the proposed approach must consider unpredictable sensing devicemalfunctions, as well as the possibility for new sensing devices, perceiving information whichtype is not known in advance, to enter or leave the system at any time. The AMAS methodologyprovides the necessary tools to address these challenges and implementing the wished estimationtechnique.

80 CHAPTER 5. THE HybridIoT APPROACH
The next section discusses the cooperation behavior of agents, used to address unpredictable inwhich information is missing.
5.8 Cooperative Behavior
This section discusses the non-cooperative situations, i.e. exceptions that are encountered by ACAsduring their nominal operation, that are solved thanks to the joint activity of the agents. The ideabehind the cooperative behavior is that an ACA cooperates with other agents that could compensate,through their perception, the action of the ACA that encountered an unpredictable event.
5.8.1 Non-Cooperative Situation
Incompetence NCS
NCS description: an ACA cannot provide any environmental information because of an unpre-dictable, unexpected problem;Detection: the ACA attempts to query the associated sensing device to provide information tothe end-user. In case the device is not present or unavailable due to an unexpected malfunction,the ACA states that an incompetence NCS occurred as it is unable to fulfill its goal of providingenvironmental information.Resolution: the resolution of the incompetence NCS requires the adaptation of the ACA to theenvironmental context at the time instant in which it encounters the NCS. The adaptation processenables the ACA to determine the appropriate estimation mechanism to be used to estimate themissing information. The ACAs solves incompetence NCS by pursuing two types of estimationprocesses:
• endogenous estimation by historical data: the ACA exploits the information previouslyobserved and calculates the estimate by exploiting its knowledge, which consists of theinformation previously perceived from the environment;
• endogenous estimation by confidence zone: the ACA cooperates with the agents within theconfidence zone that perceive the same type of information as the ACA that encountered theNCS;
• exogenous estimation: the ACA cooperates with the agents that perceive heterogeneousinformation and are situated beyond its confidence zone.
Uselessness NCS
NCS description: an ACA cannot help the agent that encountered an incompetence NCS becauseits perceived information is significantly different.

5.9. ESTIMATION PROCEDURE 81
Detection: when an ACA is unable to provide information from direct observation of the environ-ment, it cooperates with other available agents to estimate the missing information. The cooperativeresolution process consists in an exchange of information between the agents so that the ACA thatencountered the incompetence NCS can make use of the data provided by agents to calculate theestimate. Because a large number of agents may be present, not all the agents provide useful infor-mation for the ACA that encountered a NCS. This is due to the fact that the agents are situated indifferent physical environments, therefore the observed environmental dynamics are also different.For this reason, the ACA must discriminate the information that has been received cooperativelyfrom the agents to avoid the introduction of noise that could compromise the accuracy of theestimate. Through this process of discrimination, agents are able to determine a level of mutualconfidence: the agents whose information will be discarded will have a lower level of confidencethan those that provide information relevant to the calculation of the estimate.
Resolution: to solve a uselessness NCS, the ACA that encountered an incompetence NCS ignoresthe agents that provide information which, numerically, is significantly different from those per-ceived by the ACA that encountered the NCS. The ACA acts in such a way to cooperate with theagents that perceive similar environmental dynamics.
5.9 Estimation Procedure
This section presents the estimation technique pursued by agents. Figure 5.9 shows the main stepsof the proposed technique, which is pursued by ACAs to provide environmental information andestimates in case of unavailability of physical sensing devices.
COOPERATION
START
NCS?
END
ACTIVE? YES
YES
NO
NO
ENDOGENOUS
ESTIMATION IN
CONFIDENCE ZONE
US
N
4
EXOGENOUS
ESTIMATION
5
ENDOGENOUS
ESTIMATION
US
3
UPDATE ACW Ct
6
EVALUATE ACW Ct C
2PERCEIVE THE
ENVIRONMENT
1
ADAPTATION
Figure 5.9: Main steps of the proposed estimation technique.

82 CHAPTER 5. THE HybridIoT APPROACH
Let ACAi be the i-th ACA available in HybridIoT. If the ACAi agentifies an existing sensingdevice, then it is able to perceive the environment, thus a new information is presented to ACAi
(step ¶). Following, a new ACW is created and associated with the perceived information (step ·).The new ACW is added to the set of ACWs of the ACA. Each ACW contains a variable number ofentries; Section 5.10 describes the process pursued by agents for determining ACWs of dynamicsize.
If the information at time t is not available due to the unavailability of the device or even amissing device, the ACAi is faced to an incompetence NCS as it is not able to provide any information.ACAs try to solve incompetence NCS by adapting to the environment condition and pursuing oneof the three available estimation methods presented afterward (steps ¸, ¹ and º).
We identified three conditions according to which ACAs are able to adapt for estimating missinginformation:
1. ACAs are missing (step ¸): in this case, a unique ACA cannot pursue a cooperative behaviorand must exploit its knowledge to estimate missing information. ACAs embody learningskills: they are aware of the environmental context in which they are situated, perceive itscharacteristics, and learn its evolutionary dynamics. The learning phase, which coincideswith the automatic determination of ACWs, enables agents to determine recurrent and preciseinformation that can be exploited to estimate missing values. When there is no ACA tocooperate with, the ACAs use the ACWs in their knowledge base to estimate the missinginformation.
2. ACAs are available in the local part of the environment observed by the ACA (step ¹): in this case,the ACAs estimate the missing information using the values provided by the other agents,within the confidence zone, that perceive the same type of information. In this case, theagents cooperate to provide the ACA (that encounters an incompetence NCS) with usefulinformation for estimating the missing information.
3. ACAs providing heterogeneous information are available beyond the local part of the environmentobserved by ACAs (step º): to overcome the lack of sensing devices perceiving the same type ofinformation as the ACAs that encounter an incompetence NCS, ACAs exploit heterogeneousinformation to estimate the missing values. Moreover, there are no ACAs available to performa local estimation within the confidence zones. Therefore, in this case, ACAs pursue acooperative behavior with agents perceiving heterogeneous information to estimate themissing values.
The last two estimation methods (steps ¹ and º) involve the cooperation between ACAs tosolve the incompetence NCSs. The idea behind the cooperative behavior is that ACAi cooperateswith other ACAs, regardless of the type of perceived information, that could help ACAi to estimatea missing information. The cooperation requires negotiation skills between ACAs: not all the agents

5.9. ESTIMATION PROCEDURE 83
provide useful information for estimating a missing information, therefore ACAs discriminatebetween those that provide pertinent information from those providing values considered asoutliers. This enables ACAs to provide accurate estimates.
The last step (step ») consists of updating the knowledge base of the agent: the estimate (orreal perception) is used to determine the ACW that represents the information. To do this, ACAsdetermine ACWs of dynamic size, as discussed in section 5.10.
We highlight the advantages of the proposed estimation technique compared to the state of theart methods:
• openness: the ACAs do not need any prior knowledge on the available devices in theenvironment. They can adapt to the environmental context in which they are situated andresolve any unpredictable situations that could lead to the unavailability of the information;
• heterogeneity: the ACAs can perceive environmental information whose types are not definedin advance. This enables using the same estimation technique in environmental contexts wheredifferent types of information are perceived by sensors, without any particular configuration;
• large-scale: the ACAs pursue a local computation. They operate autonomously, therefore thecomputation of an ACA does not affect the others. This enables distributing the estimationtechnique in large-scale environments.
The rest of this section is organized as follows: section 5.9.1 presents the endogenous estimationscheme using the historical data (step ¸). Then, section 5.9.2 presents the estimation scheme thatexploits the information perceived by agents within the confidence zone of the ACA that encoun-tered a NCS of incompetence (step ¹). Finally, section 5.9.3 presents the exogenous estimationscheme that enables ACAs to estimate missing information through the integration of heterogeneousinformation (step º).
5.9.1 Endogenous Estimation by Historical Data
This section describes the endogenous estimation scheme where ACAs rely on homogenous data toprovide estimates for missing information.
The endogenous estimation of missing information is divided into two steps:
1. Cooperative weights evaluation: ACAs evaluate the weights to be used for estimating miss-ing information;
2. Missing information calculation: ACAs estimate missing information using the weightsevaluated previously.
Figure 5.10 shows the main steps of the endogenous estimation performed by ACAs. TheEndogenous Estimation part in this diagram is contained in the step ¸ of Figure 5.9.

84 CHAPTER 5. THE HybridIoT APPROACH
If an incompetence NCS occurs and no other ACAs are available in the proximity of the agent,then the ACA pursues an endogenous estimation by using the information previously perceived.This process includes two steps: the evaluation of the weights that have been calculated using thepreviously perceived information (step ¶) and the calculation of the estimate (step ·).
COOPERATION
START
NCS?
END
ACTIVE? YES
YES
NO
NO
ENDOGENOUS
ESTIMATION IN
CONFIDENCE ZONE
EXOGENOUS
ESTIMATION
ENDOGENOUS
ESTIMATION
UPDATE ACW Ct
EVALUATE ACW Ct
PERCEIVE THE
ENVIRONMENT
ADAPTATION
NOUS
ON IN
CE ZON
OUS
TION
COOPERATION
START
NCS?
END
ACTIVE? SSYES
SSYES
NONO
NONONO
ENDOGENOUS
ESTIMATION IN
CONFIDENCE ONE
EXOGENOU
ESTIMATI
ENDOGENOUS
ESTIMATION
UPDATE ACW Ct
EVALUATE ACW Ct
PERCEIVE THE
ENVIRONMENT
ADAPTATION
ENDOGENOUS
ESTIMATION
2WEIGHT
CALCULATION
1
Figure 5.10: Main steps of the endogenous estimation process performed by ACAs.
Weights Calculation
Let t be the time instant at which the information needs to be estimated by ACAi. For the sake ofsimplicity, we assume that ACAi has assembled the ACWs for the information before t.
The ACAi evaluates a subset ξ(t) containing the ACWs that minimize the distance d(Ct, Ck),∀Ck ∈ξ, k 6= t where Ct is the ACW containing the information to be estimated at time t and Ct /∈ ξ(t).
The ACAi evaluates a weight wt obtained as a weighted average of the difference between thelast two values of each context Ck ∈ ξ(t). The distances between Ct and the ACWs in ξ are used tocalculate the weight wt: the smaller the distance between an ACW Ck ∈ ξ(t) and the ACW Ct, themore likely the missing information at time t will be similar to the last value of the ACW Ck.
The distance d between two ACWs is defined as follows:
Definition 10 (ACW Distance). the distance between two ACWs is defined as the absolute difference

5.9. ESTIMATION PROCEDURE 85
in time between the context entries divided by the number of entries γ of the two ACWs. The smaller thedifference is, the more similar two ACWs are. The context distance between two ACWs Ct and Ck is definedby the following formula:
d (Ct, Ck) =∑l∈[1,γ] |Etl − Ekl |
γ(5.8)
where γ = |Ct| = |Ck|, l is an index in the range [1, γ], Etl and Ekl are the context entries of index l in theACW Ct and Ck respectively.
The calculation (5.8) of the distance d is generic as it does not consider the unit of the information used;therefore it can be used for any type of numerical environmental information.
The distance d satisfies the following properties:
• d(Ct, Ck) ≥ 0,
• d(Ct, Ck) = 0 ⇐⇒ Ct = Ck,
• d(Ct, Ck) = d(Ck, Ct),
• d(Ct, Ck) ≤ d(Ct, Cp) + d(Cp, Ck) where Ct, Ck, Cp are ACWs relative to time instants t, k, prespectively.
The distance d corresponds to the L1-norm. Figure 5.11 shows two ACWs and the surface between them,which area is used as similarity measure.
1
2
3
4
5
6
1 2 3 4 5 6
INFORMATION
TIME
Figure 5.11: Surface between two ACWs (orange and blue) which area is used to compare theirsimilarity.
The calculation of wt is the average of the differences of the last two context entries for eachACW Ck ∈ ξ by using the distance d(Ck, Ct), ∀Ck ∈ ξ. The value wt is calculated in such a way tobe independent from the sampling rate of the data. The weight wt is computed as follow:

86 CHAPTER 5. THE HybridIoT APPROACH
wt =∑Ck∈ξ(t)
(Ek` − Ek`−1
)· d (Ct, Ck)∑
Ck∈ξ(t) d (Ct, Ck)(5.9)
where Ct is the ACW containing the information to be estimated at time t, Ck ∈ ξ(t), |ξ(t)| = 10,is the k-th most similar ACW to Ct and Ek` and Ek`−1 are respectively the `th and (`− 1)th contextentries of the ACW Ck ∈ ξ(t), namely the last two context entries of Ck.
We observed through experiments that HybridIoT is capable of estimating accurate informationeven with a limited number (10) of ACWs. This is why the set ξ(t) contains a maximum of 10 ACWs.Moreover, the use of a limited number of ACWs is advantageous because it enables avoiding noisein the estimation process.
Estimating Missing Information
Let Cj be the ACW of the ACAi containing the information to be estimated at time t. The estimatedcontext entry Ejt is computed as follows:
Ejt = Ejt−1 + wt (5.10)
where Ejt is the estimate for the missing information at time t, Ejt−1 ∈ Cj is the last informationperceived by ACAi, wt the weight obtained through a cooperation behavior between ACAi andthe other available agents. The weight wt is calculated by Equation (5.9). Equation (5.10) considersthe last information acquired because we assume that environmental information perceived inconsecutive temporal instants do not present relevant changes.
If there is no other agent in the neighborhood of the ACA, then Ejt is the estimated value for themissing information at time t. Finally, the ACW Cj is updated by adding the context entry Ejt .
Scenario Example
Consider the scenario in Figure 5.12 where the sensing devices S1, S2 and S3 are agentified; eachone is therefore associated with a unique ACA operating autonomously and locally. Supposethat the sensing device S1 has to estimate the missing information at time t due to a suddendevice malfunction and ACA1 is the agent associated with S1; suppose that ACA1 has previouslycollected a significative quantity of information from the environment; the ACA1 disposes of a setof data windows representative of the environmental dynamics observed in the room where S1
is located. Having this knowledge, ACA1 can then estimate missing information at time t usingthe previously observed information. The estimate is calculated using the previously observedenvironmental dynamics to calculate the difference that the estimated information will have withthe last information perceived by the device.
The estimation process is carried out by ACA1 as follows: ACA1 finds the most similar datawindows to the one containing the information to be estimated. The resulting data windows are
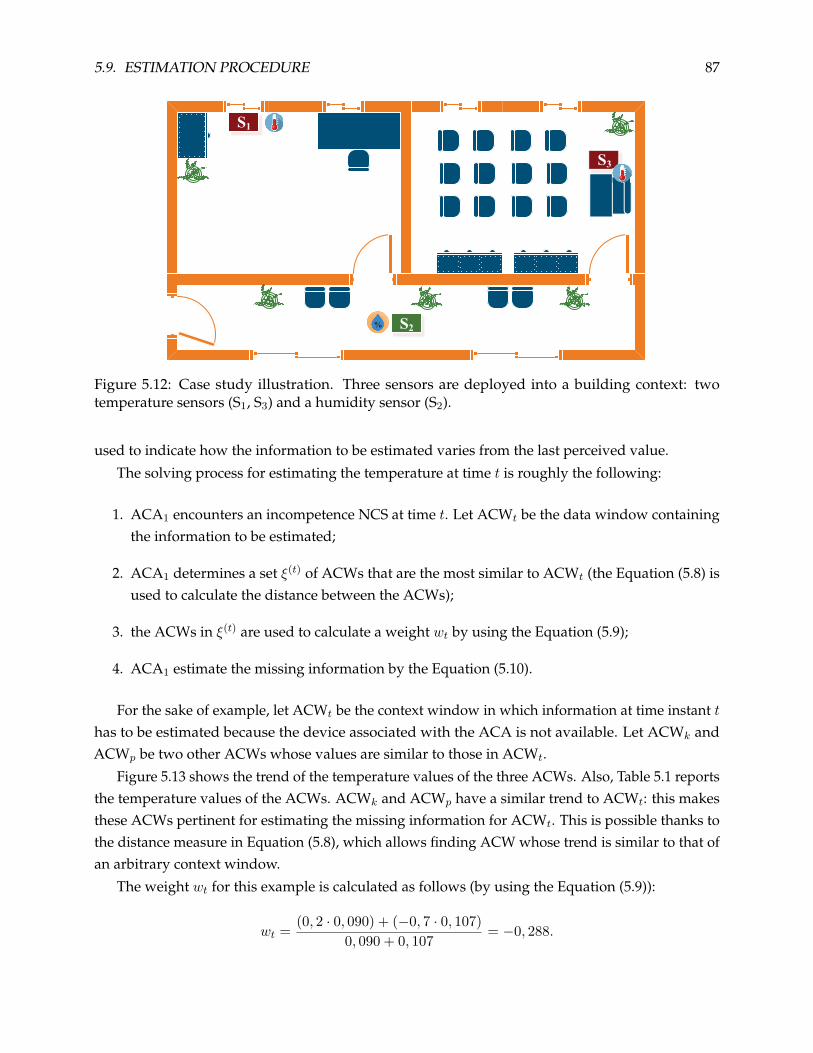
5.9. ESTIMATION PROCEDURE 87
%
S1
S3
S2
Figure 5.12: Case study illustration. Three sensors are deployed into a building context: twotemperature sensors (S1, S3) and a humidity sensor (S2).
used to indicate how the information to be estimated varies from the last perceived value.
The solving process for estimating the temperature at time t is roughly the following:
1. ACA1 encounters an incompetence NCS at time t. Let ACWt be the data window containingthe information to be estimated;
2. ACA1 determines a set ξ(t) of ACWs that are the most similar to ACWt (the Equation (5.8) isused to calculate the distance between the ACWs);
3. the ACWs in ξ(t) are used to calculate a weight wt by using the Equation (5.9);
4. ACA1 estimate the missing information by the Equation (5.10).
For the sake of example, let ACWt be the context window in which information at time instant thas to be estimated because the device associated with the ACA is not available. Let ACWk andACWp be two other ACWs whose values are similar to those in ACWt.
Figure 5.13 shows the trend of the temperature values of the three ACWs. Also, Table 5.1 reportsthe temperature values of the ACWs. ACWk and ACWp have a similar trend to ACWt: this makesthese ACWs pertinent for estimating the missing information for ACWt. This is possible thanks tothe distance measure in Equation (5.8), which allows finding ACW whose trend is similar to that ofan arbitrary context window.
The weight wt for this example is calculated as follows (by using the Equation (5.9)):
wt = (0, 2 · 0, 090) + (−0, 7 · 0, 107)0, 090 + 0, 107 = −0, 288.

88 CHAPTER 5. THE HybridIoT APPROACH
0 1 2 3 4 5 6 7 8 9 10
15.5
16
16.5
17
17.5
18
18.5
19
ACW TACWT ACW KACWK ACW PACWP
TIME
TE
MP
ER
AT
UR
E
(CE
LS
IUS
DE
GR
EE
)
Figure 5.13: Plot of the temperature values in the ACWt, ACWk and ACWp, owned by the ACA1.
Therefore, the estimate for the missing value at time t is calculated as the sum of the informationat time t− 1 and the weight wt:
e = Elt + wt = 18, 4°C
where Elt = 18, 7°C is the last observed context entry in ACWt.
Table 5.1: The temperature values of the ACWs shown in Figure 5.13.
Temperature ValueACWt 17, 3 17 16, 9 16, 4 16 18, 5 18, 7 18 18, 2 18, 7 ?ACWk 16 16, 1 17, 9 17, 1 17 16, 9 17, 5 17, 6 17, 5 17, 7ACWp 15, 5 16, 5 16, 7 16, 9 16, 4 16, 6 16, 1 17 17, 8 17, 1
The endogenous estimation technique enables agents to estimate missing information usingpreviously observed information. We consider the endogenous estimation as a simple resiliencemechanism for sensing devices that enables providing estimates of environmental information in ashort amount of time in case of sudden and unpredictable unavailability of the devices.
In the case study discussed, we assumed that ACA1 has enough information to allow it tocalculate an accurate estimate for the missing information. But what would happen if the ACA1
does not have enough ACWs in its historic? Assuming other devices are present in the immediateproximity of ACA1, is it possible to estimate accurate values through a mechanism of cooperationbetween the agents associated with the sensing devices? This is the idea behind the estimation inthe confidence zone, introduced in the following section.

5.9. ESTIMATION PROCEDURE 89
5.9.2 Endogenous Estimation by Confidence Zone
Suppose an ACAi agentifies the i-th available sensing device in the environment and that attime t the sensing device is unable to perceive the local part of the environment; therefore theACAi encounters an incompetence NCS. If some ACAs are available in the confidence zone ofthe ACAi, then the ACA adapts its behavior to pursue an estimation by cooperating with theagents situated inside the confidence zone (both ACAs and RSAs). This type of estimation can bepursued when the nearby agents perceive the same type of information as the one that encounteredthe incompetence NCS; we assume that unless there are natural or artificial barriers that couldlead to variations in the observed data, near agents perceive similar environmental values. Theconfidence zones enable ACAs to partition the environment according to the similarity of dataperceived by sensors. In this way, the ACAs are able to group the sensors that provide usefulinformation for the calculation of the missing information [2].
Figure 5.14 shows the main steps of the endogenous estimation by the confidence zone per-formed by ACAs.
The ACAi that encountered an incompetence NCS exploits the information provided by theagents within its confidence zone (step ¶). The agents are autonomous and aware of the state of thelocal part of physical environment; they send their perceptions to the ACAi that has encounteredan incompetence NCS (step ·). In this way, the agents cooperate to help the ACAi in the estimationof the missing information.
The ACAi evaluates the pairs of agents that are used to calculate an estimate of the missinginformation (step ¸). For each pair of agents, the ACAi calculates a unique data field, whichrepresents an estimate for the missing value. A data field is defined as follows:
Definition 11 (Data Field). A data field γ between two sensors (either ACAs or RSAs) is a vector field inthe Euclidean space. Each point is associated with a vector that is oriented towards the sensor which providesa higher data value; the magnitude is the value of the gradient between the data perceived by the sensors.Figure 5.15 shows an example of a data field between two sensors Sj and Sk at the point where the sensor Siis situated.
Once the ACAi have calculated a data field for each pair of agents within its confidence zone,it calculates the estimate for the missing value at time t by weighting the data fields provided byagents (step ¹). Finally, the shape of the confidence zone of the ACAi is adjusted to keep insideonly the agents that provide coherent values (step º). The values considered as coherent arecalculated using a thresholding technique that discards the values that are distant from otherobservations.
The described process takes place locally between agents within a specific confidence zone andis independent of the operation of other agents.
This type of estimation enables the agents in HybridIoT to provide information in a short amountof time. Thanks to the ability of ACAs to provide information in a short time, either estimated or

90 CHAPTER 5. THE HybridIoT APPROACH
COOPERATION
START
NCS?
END
ACTIVE? YES
YES
NO
NO
ENDOGENOUS
ESTIMATION IN
CONFIDENCE ZONE
EXOGENOUS
ESTIMATION
ENDOGENOUS
ESTIMATION
UPDATE ACW Ct
EVALUATE ACW Ct
PERCEIVE THE
ENVIRONMENT
ADAPTATION
COOPERATIO
START
NCS?
END
ACTIVE? YES
YES
NO
NONO
ENDOGENOUS
ESTIMATION IN
CONFIDENCE ZONE
EXOGENOUS
ESTIMATION
ENDOGENOUS
ESTIMATION
UPDATE ACW Ct
EVALUATE ACW Ct
PERCEIVE THE
ENVIRONMENT
ADAPTATION
OGENENENENENOGOGOGOGOGENENENENENENENENENEN
MAMAMAMAMAMAMAMATITITITIMAMAMAMAMAMAMAMAMAMAMAMATITITITITI
IOIOIONNATATIOIOIOIOIOIOIOIOIOIOIONNNNNNNNATATATATIOIOIOIOIOIOIOIOIOIOIONNNNNNNN
GET AGENTS IN
CONFIDENCE ZONE
GET AGENTS
PERCEPTIONS
EVALUATE AGENTS
PAIRS
N N N N
1 2NTNTS S S S S S S S NTNTS S S
3
ENDOGENOUS
ESTIMATION
4UPDATE
CONFIDENCE ZONE
5
Figure 5.14: Main steps of the endogenous estimation process performed by cooperation betweenACAs in the same confidence zone.
T=19°
T=21°
Sj
Sk
―
+
γjk(i)
Si
Figure 5.15: The data field γ(i)jk at the point where the sensing device Si is situated is calculated as
the value of the gradient between the values perceived from Sj (the lower value) and Sk (the highervalue).

5.9. ESTIMATION PROCEDURE 91
acquired from the environment, the end-user is unable to perceive the difference between an ACAand a physical sensing device.
Algorithm 2 describes the behavior of the ACAi, precisely when a NCS that is solved by anendogenous estimation between the agents present in the confidence zone.
Algorithm 2 Estimation in Confidence Zone
1: —perceive—2: p← perceiveEnvironment()3: —decide and act—4: if NCS then5: R← getAgentsInConfidenceZone()6: P ← getPerceptionsOfAgents()7: D ← evaluateAgentsPairs(R,P )8: p← calculateEstimation(D)9: updateconfidenceZone(D)
10: end if11: updateACW(p)
The algorithm begins by perceiving the environment (line 2): this includes not only the directobservation of the environment in case a sensing device is available, but also the identification ofthe agents present in the confidence zone.
If the ACAi encounters an incompetence NCS and other sensing devices that perceive the sametype of information as the ACAi are present in its confidence zone, then a cooperative estimationprocess is started (lines 5-9). The first step of the cooperative process consists of retrieving the list Rof agents inside the confidence zone of the ACAi (line 5). The agents within the confidence zonesend their last perceptions to the ACAi. At line 6 the ACAi receives the perceptions of the otheragents in its confidence zone. Then, at line 7 the ACAi determines the pairs of agents accordingto their alignment to the ACAi. For each pair of agents obtained, the ACAi calculates a data fieldusing the received agents’ perceptions.
At line 8 the ACAi calculates the estimate for the missing information at time t by using the datafields in D. Finally, the shape of the confidence zone is modified (enlarged or reduced) accordingto the data fields in D (line 9). A simple thresholding technique allows determining the pairs ofagents to exclude from the confidence zone, thus considered as outliers. The ACAs do not have anyknowledge about the optimal shape of their confidence zone, but rather reason on the perceptionsand the geographical position of the agents to determine if they must be excluded or not from itsconfidence zone.
The last step of the ACAi consists of updating the current ACW by adding the estimatedinformation (line 11). This process is described in detail in Section 5.10.
The next subsections describe the operations carried out during the cooperative processes andthe updating of the confidence zones. For that, we suppose that ACAi is the agent that encounteredan incompetence NCS and must estimate the missing information at a given time instant, and that

92 CHAPTER 5. THE HybridIoT APPROACH
AGj is an arbitrary agent available in HybridIoT (either RSA or ACA).
Determining Agents Pairs
Algorithm 3 determines the pairs of agents involved in the cooperative estimation process. At line 1the algorithm initializes a map C of pairs of agents: for each record, the key is a pair of agents, thevalue is their collinearity to the ACA that must estimate the information. The collinearity is definedas follows:
Definition 12 (Collinearity). Three or more points P1, P2, P3, ... are said to be collinear if they lie on asingle straight line L, as shown in Figure 5.16.
P1
P2
P3L
Figure 5.16: Three points P1, P2, P3 collinear to a line L.
Three points xi = (xi, yi, zi) for i = 1, 2, 3 are collinear if the ratios of distances satisfy
∣∣∣∣∣∣∣∣x1 y1 1x2 y2 1x3 y3 1
∣∣∣∣∣∣∣∣ = 0 (5.11)
or, in expanded form,
x1(y2 − y3) + x2(y3 − y1) + x3(y1 − y2) = 0. (5.12)
In the context of ACAs, we are interested in how much pairs of ACAs are collinear. To do this,we employ a function that calculates the degree of collinearity between three points. This can beeasily interpreted as the distance of a point to the line that passes through the other two points.More precisely, given three points P1 = (x1, y1), P2 = (x2, y2), P3 = (x3, y3), the collinearity value iscalculated by the following function:
f(P1, P2, P3) = x1(y2 − y3) + x2(y3 − y1) + x3(y1 − y2). (5.13)
The value of the function f provides a measure of how collinear the points are to a line L.

5.9. ESTIMATION PROCEDURE 93
At line 2 the algorithm initializes an empty list SP of pairs of agents. At line 3 the algorithmevaluates the list agList of agents that provided a perception to the ACA that encountered the NCS.This list is sorted in increasing order of the distance between the agents (the Euclidean distance hasbeen used). The loop 4-10 is executed until the list agList is not empty. At line 5, the ACA retrievesthe agent AGj , that is its nearest agent, and it is removed from agList. At line 6, the ACA calculatesthe collinearity according to its position, the position of AGj and the remaining agents in agList.The ACA chooses the AGk, that is, the agent that minimizes the collinearity value calculated usingEquation 5.13. The collinearity value obtained is normalized in the range [0, 1], where 0 indicatesthe worst aligned pair regarding the ACA, while 1 the most aligned. If one or more agents arelikely to have the same collinearity, the farthest is chosen. The AGk is then removed from the listagList (line 7) and paired to AGj . The pair (AGj , AGk) is then added to the map C together withthe collinearity value (line 8). At line 9 the pair (AGj ,AGk) is added to the end of the list SP .
Algorithm 3 evaluateRSAPairs
Require: the map P of perceptions received by agents within the confidence zone1: C ← ∅ Map of collinear pairs within the confidence zone. The key is a pair of agents, the value
is the related weight2: SP ← ∅ List of pairs of agents. The list is sorted according to the order of evaluation.3: agList← sort(keySet(P ))4: while |agList| > 0 do5: AGj ← removeFirst(agList)6: AGk ←mostCollinearAG(agList,AGj , ACAi)7: remove(AGk, agList)8: C(AGj ,AGk)← dist(AGjAGk,ACAi)9: add(SP, (AGj ,AGk))
10: end while
The next subsection describes how the ACAi calculates a data field for each pair of agents withinits confidence zone.
Determining Data Fields
Algorithm 4 determines the data fields for each pair of agents evaluated by algorithm 3. Thealgorithm starts by initializing an empty map D containing, for each pair of agents, the value of thedata field in the point where the ACA that encountered the NCS is situated. The loop 2-7 is executedfor each pair p of collinear agents in the map C. At lines 3 and 4 two variables are initialized,containing the values va and vb, respectively the last perceptions of agents AGi and AGk. At line 5the data field is calculated at the point where the ACA that encountered the NCS is situated.
A data field γ between two sensors is a vector field in the Euclidean space; the magnitude is thevalue of the gradient between the data perceived by the sensors. The data field between two agentsAGj and AGk in the point where ACAi is situated is calculated as follows:

94 CHAPTER 5. THE HybridIoT APPROACH
γ(i)jk = vj + (vk − vj) ·
d(AGj ,ACAi)d(AGj ,AGk)
(5.14)
where vj and vk are the last information perceived by AGj and AGk respectively, d(AGj ,ACAi) isthe euclidean distance between AGi and the ACAi, d(AGj ,AGk) is the euclidean distance betweenAGj and AGk. Equation (5.14) calculates the data field at the point where the ACAi is situatedtaking into account the information perceived by the two agents and their distance from the ACAi.
At line 6 the data field value γ(i)jk is added to the map Γ with the pair p = (AGj ,AGk) as key.
Finally, the map Γ containing the data fields is returned as the output of the algorithm (line 8).
Algorithm 4 evaluateDataFields
Require: the map P of perceptions received by agentsRequire: the map C of collinear pairs within the confidence zone; the key is a pair of agents, the
value is their correlation1: Γ ← ∅ map of data fields; the key is a pair of agents, the value is the data field between the
agents in the pair and ACAi
2: for all pair p = (AGj ,AGk) ∈ keySet(C) do3: vj ← P (AGj)4: vk ← P (AGk)5: γ
(i)jk = vj + (vk − vj) · d(AGj ,ACAi)
d(AGj ,AGk)
6: Γ(p)← γ(i)jk
7: end for8: return Γ
Once the ACAi calculated the data fields for the pairs of agents inside its confidence, it calculatesthe estimates by combining the data fields using the algorithm 4. The next subsection describes theprocess of calculation of the estimate.
Calculating the Estimate
Algorithm 5 estimates the missing information using the data fields calculated using Algorithm 4.The algorithm takes as input a map Γ of data fields and a map C of collinearities between the pairsof agents within the confidence zone of ACAi. At line 1, the ACAi calculates the estimate as aweighted sum of the data field values by the collinearity values of the pairs of agents. The estimateis calculated as follows:
est =∑p∈keyset(C) Γ(p) · C(p)∑
p∈keyset(C)C(p) . (5.15)
The Equation (5.15) returns a mean of the data fields weighted by the collinearity of the agentswith respect to ACAi. We suppose that agents with a higher collinearity value provide moreaccurate information as the related gradient provides accurate values if the ACAi is situated in thesame direction of the gradient and near the two sensors.

5.9. ESTIMATION PROCEDURE 95
At line 2 the estimate is added to the list of perceptions of the ACAi.
Algorithm 5 evaluateEstimation
Require: the map Γ of data fieldsRequire: the map C of collinear pairs; the key is a pair p of agents, the value is the collinearity
between the agents in p.
1: est←∑p∈keyset(C) Γ(p) · C(p)∑
p∈keyset(C)C(p)2: addPerception(est)
The last step of the estimation procedure consists of comparing the estimate est to the perceptionof the other agents. The more the estimate is close to the perception of an agent AGk, the more thislast is considered as pertinent for helping the ACAi in estimating missing information.
Confidence Zone Update
Algorithm 6 updates the confidence zone of the ACAi. This operation modifies the shape of thepolygon representing the confidence zone according to the data fields associated with the pairs ofagents previously assembled by the ACAi. The idea behind the algorithm is to exclude progressively(reducing the polygon) the sensors that perceive values not coherent with the majority of the agentswhile trying to explore the environment (enlarging the polygon) to search for new agents capable ofvalues useful for the estimation process. The ACAi updates the confidence zone by small steps ateach iteration; therefore, the polygon is modified incrementally in time.
The algorithm takes as input a list SP of pairs of ACAs and a map Γ of data fields. The objectiveof this algorithm is to discriminate which sensors to exclude or include from the confidence zone.To do this, the algorithm calculates a threshold value using the calculated data fields in Γ.
In the first step, the algorithm sorts the list SP : the pairs of agents in SP are sorted according tothe distance between their data fields and the median data field γ ∈ Γ (line 5). Then, the algorithmcalculates the value δ as the distance between the data fields of the first (Γ(SP1)) and third (Γ(SP3))pairs of sensors in SP (which has been previously sorted) (line 6).
At line 7 two threshold values th+ and th− are calculated. The threshold values are calculatedas the sum (for th+) and difference (for th−) of the first data field Γ(SP1) and the value δ multipliedby a constant ω:
th± ← Γ(SP1)± δ × ω (5.16)
The constant factor ω is equal to 2.5; we verified this value experimentally. The value of ω ischosen according to the application domain: if HybridIoT is used with outdoor sensing deviceswhose information may vary significantly, then ω can be increased accordingly. On the other hand,if HybridIoT is used with indoor sensing devices perceiving values that vary less significantly,it would be appropriate to reduce the parameter ω to avoid including irrelevant values for the
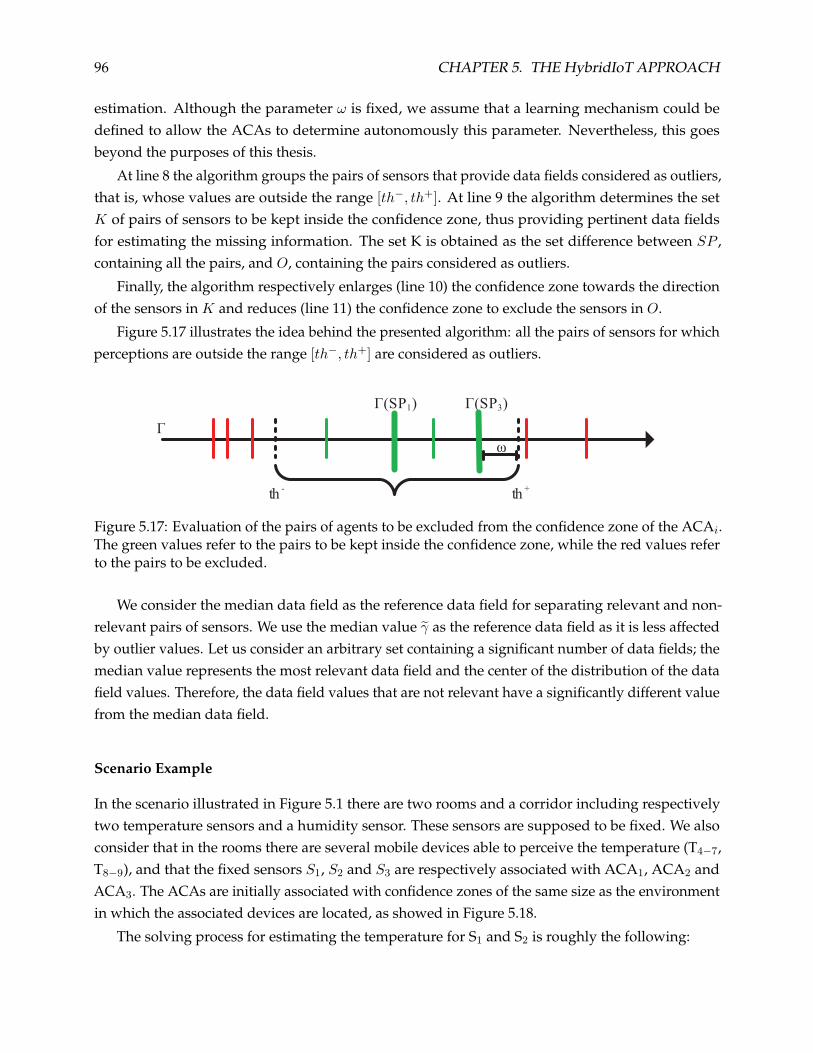
96 CHAPTER 5. THE HybridIoT APPROACH
estimation. Although the parameter ω is fixed, we assume that a learning mechanism could bedefined to allow the ACAs to determine autonomously this parameter. Nevertheless, this goesbeyond the purposes of this thesis.
At line 8 the algorithm groups the pairs of sensors that provide data fields considered as outliers,that is, whose values are outside the range [th−, th+]. At line 9 the algorithm determines the setK of pairs of sensors to be kept inside the confidence zone, thus providing pertinent data fieldsfor estimating the missing information. The set K is obtained as the set difference between SP ,containing all the pairs, and O, containing the pairs considered as outliers.
Finally, the algorithm respectively enlarges (line 10) the confidence zone towards the directionof the sensors in K and reduces (line 11) the confidence zone to exclude the sensors in O.
Figure 5.17 illustrates the idea behind the presented algorithm: all the pairs of sensors for whichperceptions are outside the range [th−, th+] are considered as outliers.
th+
th-
Γ(SP1) Γ(SP3)
Γ
ω
Figure 5.17: Evaluation of the pairs of agents to be excluded from the confidence zone of the ACAi.The green values refer to the pairs to be kept inside the confidence zone, while the red values referto the pairs to be excluded.
We consider the median data field as the reference data field for separating relevant and non-relevant pairs of sensors. We use the median value γ as the reference data field as it is less affectedby outlier values. Let us consider an arbitrary set containing a significant number of data fields; themedian value represents the most relevant data field and the center of the distribution of the datafield values. Therefore, the data field values that are not relevant have a significantly different valuefrom the median data field.
Scenario Example
In the scenario illustrated in Figure 5.1 there are two rooms and a corridor including respectivelytwo temperature sensors and a humidity sensor. These sensors are supposed to be fixed. We alsoconsider that in the rooms there are several mobile devices able to perceive the temperature (T4−7,T8−9), and that the fixed sensors S1, S2 and S3 are respectively associated with ACA1, ACA2 andACA3. The ACAs are initially associated with confidence zones of the same size as the environmentin which the associated devices are located, as showed in Figure 5.18.
The solving process for estimating the temperature for S1 and S2 is roughly the following:
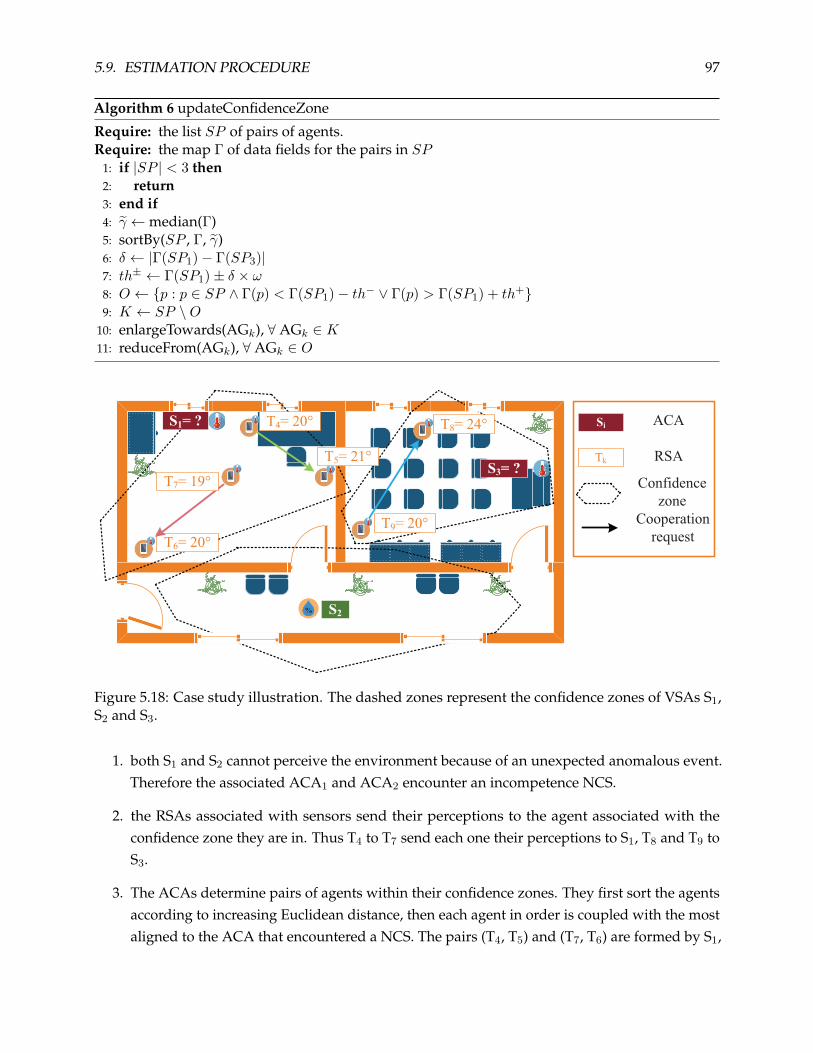
5.9. ESTIMATION PROCEDURE 97
Algorithm 6 updateConfidenceZone
Require: the list SP of pairs of agents.Require: the map Γ of data fields for the pairs in SP
1: if |SP | < 3 then2: return3: end if4: γ ←median(Γ)5: sortBy(SP , Γ, γ)6: δ ← |Γ(SP1)− Γ(SP3)|7: th± ← Γ(SP1)± δ × ω8: O ← p : p ∈ SP ∧ Γ(p) < Γ(SP1)− th− ∨ Γ(p) > Γ(SP1) + th+9: K ← SP \O
10: enlargeTowards(AGk), ∀ AGk ∈ K11: reduceFrom(AGk), ∀ AGk ∈ O
Figure 5.18: Case study illustration. The dashed zones represent the confidence zones of VSAs S1,S2 and S3.
1. both S1 and S2 cannot perceive the environment because of an unexpected anomalous event.Therefore the associated ACA1 and ACA2 encounter an incompetence NCS.
2. the RSAs associated with sensors send their perceptions to the agent associated with theconfidence zone they are in. Thus T4 to T7 send each one their perceptions to S1, T8 and T9 toS3.
3. The ACAs determine pairs of agents within their confidence zones. They first sort the agentsaccording to increasing Euclidean distance, then each agent in order is coupled with the mostaligned to the ACA that encountered a NCS. The pairs (T4, T5) and (T7, T6) are formed by S1,

98 CHAPTER 5. THE HybridIoT APPROACH
the pair (T9, T8) by S3.
4. Each ACA evaluates the data field provided by the determined pairs of agents.
5. The data fields are used to estimate the missing information.
Let us now consider a numerical example using the temperature values shown in Figure 5.18and suppose that the pairs of RSAs are already formed as in the same figure. The calculation of thedata fields γ(1)
6,7 and γ(1)4,5 for the pairs of RSAs (T6,T7) and (T4,T5) respectively, results in two values:
γ(1)6,7 = T6 + (T7 − T6) · d(T6,ACA1)
d(T7,T6) = 18.66°C
for the pair (T6,T7), and
γ(1)4,5 = T4 + (T5 − T4) · d(T4,ACA1)
d(T5,T4) = 20.37°C
for the pair (T4,T5). Once the data fields have been calculated, the estimate for the ACA1
associated with S1 is calculated as follows:
18.66 · 380.23 + 20.37 · 86.81380.23 + 86.81 = 18.97°C
The values 380.23 and 86.81 represent the collinearity between the agents. Finally, the confidencezone is updated by performing the thresholding technique described in Algorithm 6. Because thenumber of pairs in this example is 2, the confidence zone is not updated.
The estimation of missing values through cooperation in the confidence zone is a complexresolution process due to the interdependence of the tasks performed by the ACAs. An ACAestimates missing information through cooperation with agents in the local environment where itis located (that is, the confidence zone): ACAs calculate the missing information as accurately aspossible by differentiating between relevant and irrelevant information. This operation requires acontinuous exploration of the environment in which the ACAs are situated. ACAs modify theirconfidence zones to exclude sensors that provide information not relevant to the calculation ofestimates; contrarily, the confidence zones are enlarged towards the sensors that provide infor-mation relevant to the calculation of estimates: this enables the ACA to continuously explore theenvironment to determine the sensors that can contribute to the estimation process. Nevertheless,modifying the confidence zone requires the values perceived (or estimated) by the agents, eitherreal or estimated. Therefore, the two tasks (estimation and confidence zone modification) contributeto the endogenous estimation goal, but cannot be separated.
The next section presents the exogenous estimation, used to estimate missing information byexploiting heterogeneous information provided by agents that are situated outside the confidencezones of ACAs.

5.9. ESTIMATION PROCEDURE 99
5.9.3 Exogenous Estimation
The exogenous estimation enables addressing the lack of a sufficient number of sensing devicesproviding homogeneous information by integrating heterogeneous data for calculating the estimatesfor missing values. The idea behind the exogenous estimation is that the values perceived bydifferent sensing devices can follow similar dynamics under the same environmental condition.The exogenous estimation enables ACAs to overcome the lack of homogeneous agents, that is,perceiving the same type of information. Therefore, thanks to exogenous estimation agents arecapable of exploiting a large amount of information from heterogeneous sensing devices to estimateaccurately the missing information [3].
The exogenous estimation method is divided into three steps:
1. Evaluation of the set of cooperating agents: the ACAs determine the set of agents withwhich cooperate to estimate missing information;
2. Cooperative evaluation of the set of weights: the ACAs cooperatively evaluate the weightsto be used for estimating the missing information. A weight is a numerical quantity, calculatedcooperatively by the agents, that is added to the last information perceived by the ACA thathas encountered an incompetence NCS;
3. Evaluation of the estimate: the ACAs calculate the missing information by weighting the re-sult of the estimate (calculated using the historical data) by the weights obtained cooperativelyfrom the other ACAs.
Figure 5.19 shows the main step of the exogenous estimation performed by ACAs.If the information at time t is not available due to the unavailability of the sensing device, the
ACAi that agentifies the sensing device encounters an incompetence NCS as it is not able to provideany information. The ACAi pursues the exogenous estimation if (i) there is no agent inside theconfidence zone of ACAi and (ii) some agents perceiving heterogeneous information are availablebeyond the confidence zone of the ACAi. The ACAi solves the incompetence NCS by calculatingan estimate using the historical data of ACAi (step ¶), then cooperating with agents (if any) thatperceive heterogeneous information and are situated beyond the confidence zone of ACAi (step ·).
The exogenous estimation of the missing information considers the last perceived information attime t−1, weighted by a valuewt obtained from a cooperative process among ACAs. The valuewt isadded to the information perceived at time t−1 because we consider that consecutive environmentalinformation does not vary significantly unless there is noise or unpredictable environmental factors.The weight wt, therefore, represents the variation that the estimated information at time t assumeswith respect to the last information perceived at time t− 1.
Figure 5.20 shows an example of how cooperation takes place between ACA ¬ and other ACAsperceiving different types of information. The ACA ¬ has encountered an incompetence NCS as itis not able to provide information. The ACA ¬ performs an endogenous estimation by cooperating

100 CHAPTER 5. THE HybridIoT APPROACH
COOPERATION
START
NCS?
END
ACTIVE? YES
YES
NO
NO
ENDOGENOUS
ESTIMATION IN
CONFIDENCE ZONE
EXOGENOUS
ESTIMATION
ENDOGENOUS
ESTIMATION
UPDATE ACW Ct
EVALUATE ACW Ct
PERCEIVE THE
ENVIRONMENT
ADAPTATION
COOOOPPEERRAATTIIOONN
START
NCS?
END
ACTIVE? SSYES
SSYES
NONO
NONONONONONONO
ENDOGENOUS
ESTIMATION IN
CONFIDENCE ZONE
EXOGENOUS
ESTIMATION
ENDOGENOUS
ESTIMATION
UPDATE ACW Ct
EVALUATE ACW Ct
PERCEIVE THE
ENVIRONMENT
ADAPTATION
ENDOGENOUS
ESTIMATION AT t
EXOGENOUS
ESTIMATION AT t
1 2ANY NEAR
ACA?
YES
NO
Figure 5.19: Main steps of the exogenous estimation process performed by ACAs.
with ACAs and ® (step ¶). Following, an exogenous estimation is performed by cooperatingwith ACAs ¯, °, ± and ² (step ·), that perceive information of different types with respect toACA ¬. Once the ACA ¬ obtained the weights through cooperation, some ACAs can encountera uselessness NCS as their cooperation is not helpful to provide an estimate. This is because theACA ¬ discriminates the obtained weights to be used in order to calculate an accurate estimate.
Evaluation of the Set of Cooperating Agents
The exogenous estimation is based on a cooperative process between different ACAs. However,a large number of agents can be present in the environment, some of which are not relevant forthe calculation of the estimate. The ACAi uses one of the following criteria to choose the ACAs tocooperate with:
• Nearest ACAs: the ACAi cooperates with the nearest ones in the environment (the Euclideandistance is used). The Nearest ACAs criterion enables to choose ACAs that are in the immedi-ate proximity of the ACAi that has encountered a NCS. The use of this criterion can be very

5.9. ESTIMATION PROCEDURE 101
4
5
6
7
2
3
NCS
w6
2
w3
w7
w1
w2
w4
1
1
CO2
CO2
Figure 5.20: ACA ¬ cooperates with other agents by performing both endogenous and exogenousestimations. The weights obtained cooperatively are used to provide an estimate of the missingvalue. Steps ¶ and · are the same as in Figure 5.19.
efficient in open environments where no barriers are present (such as weather stations). Forexample, this criterion enables to choose ACAs both inside and outside a building because oftheir proximity, even if they could perceive information that differs significantly.
• Most confident ACAs: the ACAi cooperates with the agents that have the highest degree ofconfidence. The most confident criterion enables selecting a set of agents that do not neces-sarily have to be in the immediate proximity: agents are chosen according to the similaritybetween the perceived information.
Cooperative Evaluation of the Set of Weights
Let t be the time instant at which the ACAi, associated with the i-th sensing device, has to estimatethe information, and Υ(t) be the set of agents the ACAi cooperates with, evaluated according to oneof the previous criteria.
Let ξ(t) be the set of ACWs chosen by the ACAi to estimate the missing information at time t,Σ(t) = σ1, σ2, ..., σk with k = |ξ(t)| the indexes of the ACWs chosen by ACAi, where σi ∈ Σ(t) is

102 CHAPTER 5. THE HybridIoT APPROACH
the index of the σith ACW in ξ(t). In the exogenous estimation process, the set Σ(t) is communicatedto the other agents in Υ(t). In this way, the ACAi provides each agent in Υ(t) with an indicationof which are the temporal instants associated with ACWs that are similar to the ACW Ct, that is,the ACW containing the information to estimate at time t. Each agent in Υ(t), therefore, evaluatesthe distance between the ACW observed at the time instant t and the ACWs whose indices areindicated by the set Σ(t). Each agent calculates a weight by using the Equation (5.9).
The cooperation between agents, therefore, yields a set W of weights, one for each agent in Υ(t).The weights in W are calculated by agents that perceive both homogeneous and heterogeneousinformation.
Calculation of the Estimate
Once the ACAi obtains a set W of weights through cooperation with the other agents, it evaluatesone estimate for each weight w ∈W , resulting in a set of estimates. To avoid taking into accountinformation that is not relevant to the output estimate, the ACAi evaluates a histogram H obtainedfrom an empirical cumulative distribution of the estimates. The histogram H includes the estimatesobtained from both endogenous and exogenous estimations. The ACAi selects the bin whichaverage value is closest to the estimate obtained by the endogenous process, then it calculates theaverage value of the elements within the bin. The result of the average operation is returned as theestimate for the missing information at time t.
Let Eend be the estimate obtained by ACAi through the endogenous estimation process (calcu-lated using Equation (5.10)). Let f be a function that returns the mean of the values contained in abin Hk of the histogram H such that the difference between Hk and the endogenous estimate Eendis minimized:
f(Hk) = |Hk − Eend| (5.17)
where Hk is the average of the values in the k-th bin of the histogram of frequencies H . The ACAi
evaluates the estimate Eexo as follow:
Eexo = argmink f(Hk) + Eend2 . (5.18)
The average operator in (5.18) enables to weigh equally the results obtained from endogenousand heterogeneous estimations.
Figure 5.21 resumes the cooperative estimation between ACAi and the other agents. For thesake of simplicity, we show one lane for all the agents with which the ACAi cooperates, as thecooperative behavior is identical among the agents.

5.9. ESTIMATION PROCEDURE 103
Scenario Example
In the scenario illustrated in Figure 5.1 there are two rooms and a corridor including respectivelytwo temperature sensors and a humidity sensor. These sensors are supposed to be fixed.
In the first scenario described in Section 5.9.1, we supposed that the available sensing devices arecapable of calculating estimates, through their associated ACAs, by using the information perceivedpreviously. In the scenario described in Section 5.9.2, we used the information perceived by thesensing devices within the confidence zone of each ACA that encounters an incompetence NCS. Inboth cases, ACAs perform an endogenous estimation as we supposed that agents perceive the sametype of information.
In a real context, the available sensing devices can perceive heterogeneous information. More-over, the sensing devices can perceive information of the same type but using different units andscales. The HybridIoT system allows to exploit a multitude of sensing devices in the environmentindependently of the type of information perceived and factors such as unit or scale.
Consider the scenario in Figure 5.22 (previously described in Section 5.9.2). Here we supposethat two sensors face an unpredictable event that avoid them to provide the information. In this
ACA56ACA41ACA33ACAi ACAk
1: ncs = detectNCS()
3: cooperate(ξ)
2: ξ = detectSimilarContexts()
3.1: wk = calculateWeights(ξ)3.2: w1,…,wn
4: E = evaluateEstimations(w1,…,wn)
6: e = estimate(E')
alt
ncs = false
ncs = true
5: E' = getRelevantEstimations(E)
Figure 5.21: Steps of the cooperation between the ACA that detected a NCS and the subset ofneighbors agents with which the ACA cooperates.

104 CHAPTER 5. THE HybridIoT APPROACH
case, the ACAs associated with the sensing devices encounter an incompetence NCS that is solvedby a cooperative process between agents of the same type within the confidence zones of agents.However, if S2 encounters an incompetence NCS it is not able to provide any estimation for thefollowing reasons:
• there is no sensor of the same type as S2, that is, perceiving information of the same type,
• there is no sensor within the confidence zone of S2.
Figure 5.22: Case study illustration. The sensors S2 is unable to provide any information, thus it hasto cooperate with the other agents.
In this scenario, we suppose that S2 has to estimate the missing information by means of exogenousestimation thanks to a cooperative resolution process between agents situated outside the confidencezone of S2. Because no agents are within the confidence zone of S2, the ACA that agentifies S2
cooperates with the other agents, independently from the type of the perceived information (asdepicted by the arrows in Figure 5.22). Moreover, in this scenario, we suppose that the sensingdevices perceive not only different information (temperature and humidity) but also the same typeof information using different units (Fahrenheit and Celsius degree).
To estimate the missing value at time t, the ACA2 (related to S2) searches in its history for ACWsthat are similar to the last observed ACWt containing the information to be estimated (Table 5.2).
Following, ACA2 cooperates with the other ACAs to estimate the missing value. The othersensing devices perceive temperature information in Fahrenheit and Celsius degree. Although theinformation perceived by these devices cannot be used directly to estimate a humidity value forACA2, they act cooperatively to allow ACA2 to estimate the missing information.
The cooperative estimation process starts from the ACA2, which encountered an incompetenceNCS at time t. The ACA2 evaluates the agents to cooperate with according to one of the criteriadescribed in Section 5.9.3 (nearest or most confident agents). In this scenario, we assume that all the
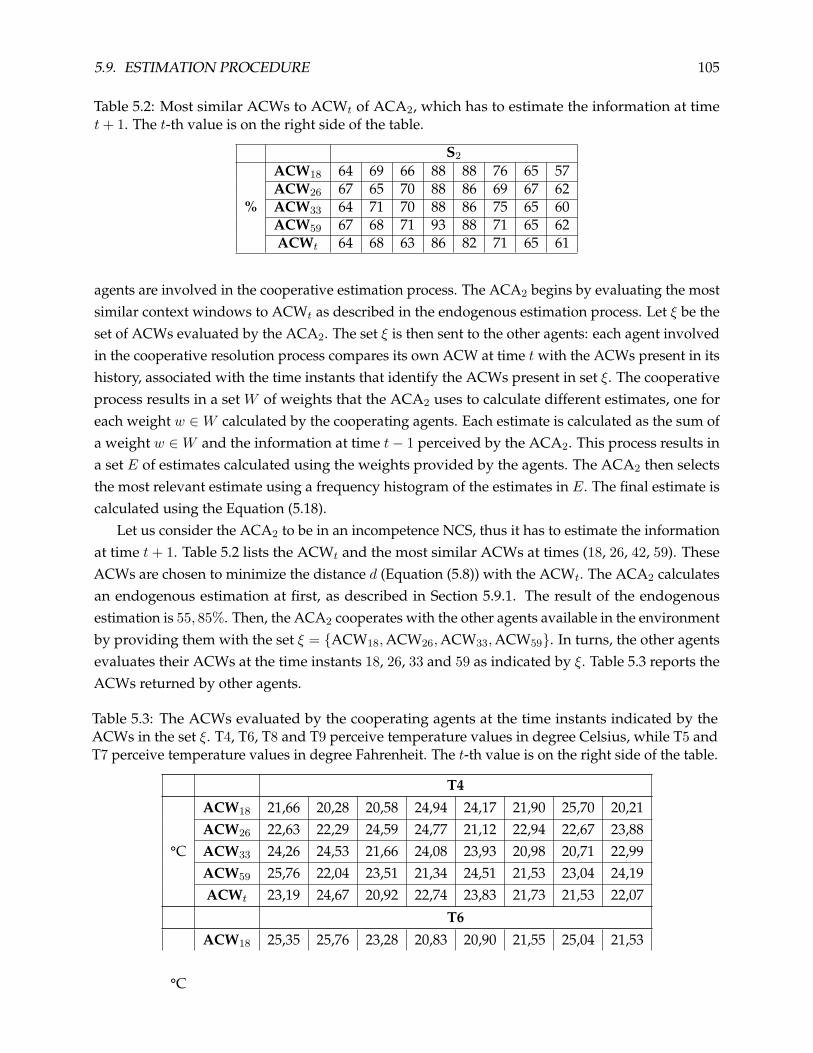
5.9. ESTIMATION PROCEDURE 105
Table 5.2: Most similar ACWs to ACWt of ACA2, which has to estimate the information at timet+ 1. The t-th value is on the right side of the table.
S2
%
ACW18 64 69 66 88 88 76 65 57ACW26 67 65 70 88 86 69 67 62ACW33 64 71 70 88 86 75 65 60ACW59 67 68 71 93 88 71 65 62ACWt 64 68 63 86 82 71 65 61
agents are involved in the cooperative estimation process. The ACA2 begins by evaluating the mostsimilar context windows to ACWt as described in the endogenous estimation process. Let ξ be theset of ACWs evaluated by the ACA2. The set ξ is then sent to the other agents: each agent involvedin the cooperative resolution process compares its own ACW at time t with the ACWs present in itshistory, associated with the time instants that identify the ACWs present in set ξ. The cooperativeprocess results in a set W of weights that the ACA2 uses to calculate different estimates, one foreach weight w ∈W calculated by the cooperating agents. Each estimate is calculated as the sum ofa weight w ∈W and the information at time t− 1 perceived by the ACA2. This process results ina set E of estimates calculated using the weights provided by the agents. The ACA2 then selectsthe most relevant estimate using a frequency histogram of the estimates in E. The final estimate iscalculated using the Equation (5.18).
Let us consider the ACA2 to be in an incompetence NCS, thus it has to estimate the informationat time t+ 1. Table 5.2 lists the ACWt and the most similar ACWs at times (18, 26, 42, 59). TheseACWs are chosen to minimize the distance d (Equation (5.8)) with the ACWt. The ACA2 calculatesan endogenous estimation at first, as described in Section 5.9.1. The result of the endogenousestimation is 55, 85%. Then, the ACA2 cooperates with the other agents available in the environmentby providing them with the set ξ = ACW18,ACW26,ACW33,ACW59. In turns, the other agentsevaluates their ACWs at the time instants 18, 26, 33 and 59 as indicated by ξ. Table 5.3 reports theACWs returned by other agents.
Table 5.3: The ACWs evaluated by the cooperating agents at the time instants indicated by theACWs in the set ξ. T4, T6, T8 and T9 perceive temperature values in degree Celsius, while T5 andT7 perceive temperature values in degree Fahrenheit. The t-th value is on the right side of the table.
T4
°C
ACW18 21,66 20,28 20,58 24,94 24,17 21,90 25,70 20,21ACW26 22,63 22,29 24,59 24,77 21,12 22,94 22,67 23,88ACW33 24,26 24,53 21,66 24,08 23,93 20,98 20,71 22,99ACW59 25,76 22,04 23,51 21,34 24,51 21,53 23,04 24,19ACWt 23,19 24,67 20,92 22,74 23,83 21,73 21,53 22,07
T6
°C
ACW18 25,35 25,76 23,28 20,83 20,90 21,55 25,04 21,53

106 CHAPTER 5. THE HybridIoT APPROACH
ACW26 24,89 21,46 25,58 22,10 21,18 21,51 23,70 22,84ACW33 22,11 24,98 23,51 23,30 25,50 21,72 24,54 24,52ACW59 22,28 23,41 20,46 20,32 23,18 24,68 25,60 20,78ACWt 21,95 22,54 21,69 25,25 25,75 24,03 21,34 24,68
T8
°C
ACW18 23,41 22,82 20,07 22,02 20,97 24,77 21,87 23,17ACW26 20,99 23,61 21,58 23,92 24,14 24,49 22,70 20,50ACW33 21,37 25,48 20,91 24,95 23,23 25,98 20,47 22,66ACW59 20,64 25,77 20,03 24,65 24,90 25,21 20,51 22,40ACWt 20,63 20,54 22,64 23,11 21,44 24,17 24,01 24,05
T9
°C
ACW18 21,56 24,80 22,59 25,46 21,09 21,58 20,87 20,82ACW26 25,22 23,48 23,30 20,87 25,12 23,73 22,11 23,08ACW33 22,41 20,46 21,44 20,74 21,10 21,44 22,50 20,30ACW59 25,42 25,67 22,95 22,94 22,03 25,40 22,22 20,67ACWt 22,05 23,64 21,15 24,43 21,46 25,50 21,61 24,59
T5
°F
ACW18 77,77 78,58 72,74 69,20 70,79 72,41 74,42 70,83ACW26 74,51 75,68 70,39 69,27 71,20 71,44 72,58 73,48ACW33 68,92 70,83 76,65 68,32 78,03 75,89 73,28 74,25ACW59 70,56 72,96 78,40 73,91 73,63 70,50 73,28 74,74ACWt 74,50 77,89 72,99 72,98 71,48 73,09 69,90 73,11
T7
°F
ACW18 75,33 72,27 71,97 78,67 68,41 77,56 77,86 76,60ACW26 69,07 70,83 71,62 75,34 69,47 75,79 69,15 75,06ACW33 73,34 76,41 75,72 77,76 77,62 71,61 75,55 70,14ACW59 68,33 76,04 73,40 73,18 77,77 74,59 74,67 77,28ACWt 72,18 68,01 72,58 76,32 76,48 68,39 75,79 69,65
Once evaluated the ACWs at the time instants indicated by the context windows in ξ, eachcooperating agent evaluates a weight w as indicated by Equation (5.9). Then, the weights are usedby ACA2 to calculate one estimate for each weight. Table 5.4 lists the weights evaluated by thecooperating agents and the estimate calculated by ACA2 using the weights. The error columnrefers to the absolute difference between the estimate calculated by each cooperating agent and theestimate calculated by ACA2 through the endogenous estimation process.
The ACA2 Finally chooses the estimates provided by T7 as the most confident, as it providesan estimate that is the closest to the value obtained through the endogenous estimation process.Finally, ACA2 evaluates the exogenous estimation as in Equation (5.18):

5.10. DYNAMIC AMBIENT CONTEXT WINDOW EVALUATION 107
Table 5.4: Weights calculated by cooperating agents. Column E contains the estimation calculatedby the ACA2 by using the weights obtained cooperatively with other agents. The error columnrefers to the absolute difference between the estimation in E and the estimate obtained by theendogenous estimation process of ACA2.
Weights E Absolute Error
%
T4 -0,69 61,31 5,45T6 2,51 64,51 8,65T8 1,82 63,82 7,96T9 3,34 65,34 9,48T5 -0,54 61,46 5,60T7 -5,68 56,32 0,46
Eexo = 56, 32 + 55, 852 = 56, 08% (5.19)
where 56, 32 is the result of the exogenous estimation, 55, 85% is the result of the endogenousestimation calculated by ACA2.
5.10 Dynamic Ambient Context Window Evaluation
This section describes how agents determine ACWs with a variable number of entries, which hasan impact on the calculation of estimates [1].
HybridIoT determines ACWs of variable size to capture data fluctuations and automaticallydetermine ACW without specifying either their length or the frequency of data acquisition fromsensing devices. This allows the system to integrate sensing devices that have different acquisitionfrequencies without any configuration.
Consider two temperature datasets, one containing daily data and the other data perceived every30 seconds. In the first case, data perceived daily could vary significantly from sample to sample,so it is necessary that the ACWs have a limited size so that the variance does not assume highvalues. In this case, windows containing a considerable amount of information would not identifythe information associated with a precise time instant due to the high number of fluctuations inthe data. On the contrary, in the second case, it is necessary to have ACWs containing a significantamount of information: the information does not vary significantly from sample to sample, so thevariance would be too low if an ACW contains few samples. Therefore, in both cases, it wouldbe necessary to specify a size for ACWs that reflect the information and the acquisition frequencyof the sensing device. In a large-scale environment such as a city, using an open system such asHybridIoT where an unspecified number of sensing devices can enter or leave the system at anytime, it is not possible to specify an ACW size for each ACA associated with a sensing device. Itis therefore necessary for the ACAs to determine autonomously the size of each ACW dependingon the information perceived.
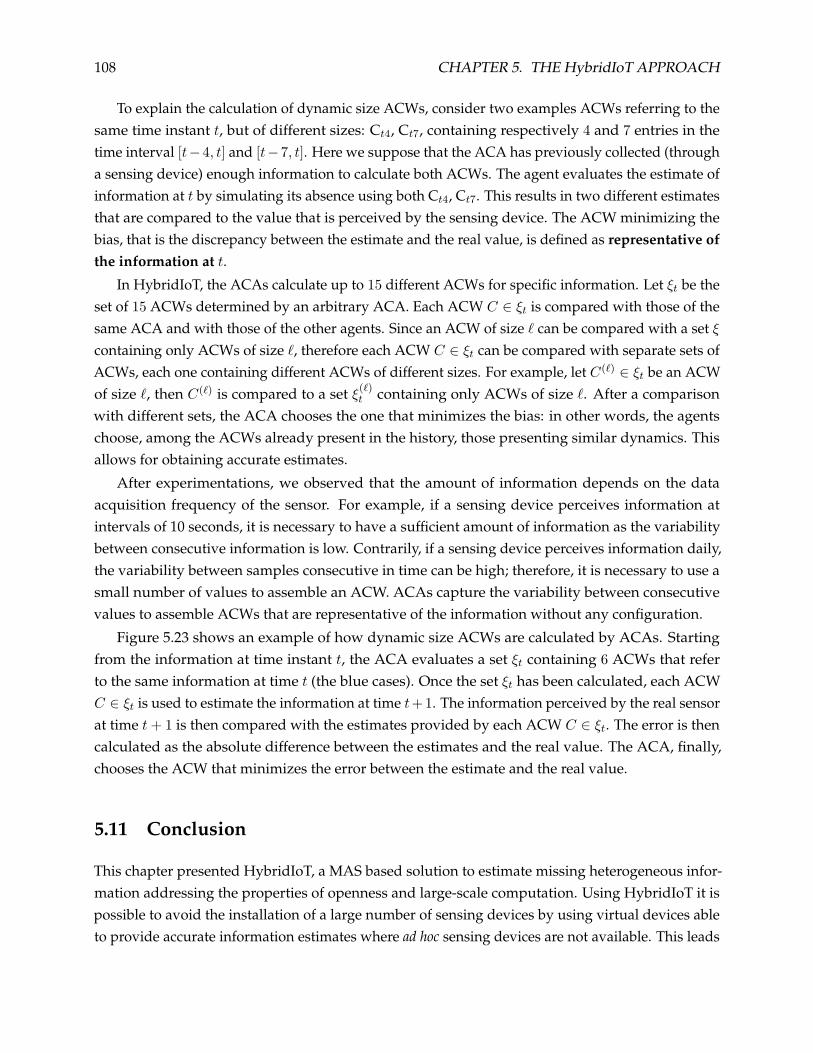
108 CHAPTER 5. THE HybridIoT APPROACH
To explain the calculation of dynamic size ACWs, consider two examples ACWs referring to thesame time instant t, but of different sizes: Ct4, Ct7, containing respectively 4 and 7 entries in thetime interval [t−4, t] and [t−7, t]. Here we suppose that the ACA has previously collected (througha sensing device) enough information to calculate both ACWs. The agent evaluates the estimate ofinformation at t by simulating its absence using both Ct4, Ct7. This results in two different estimatesthat are compared to the value that is perceived by the sensing device. The ACW minimizing thebias, that is the discrepancy between the estimate and the real value, is defined as representative ofthe information at t.
In HybridIoT, the ACAs calculate up to 15 different ACWs for specific information. Let ξt be theset of 15 ACWs determined by an arbitrary ACA. Each ACW C ∈ ξt is compared with those of thesame ACA and with those of the other agents. Since an ACW of size ` can be compared with a set ξcontaining only ACWs of size `, therefore each ACW C ∈ ξt can be compared with separate sets ofACWs, each one containing different ACWs of different sizes. For example, let C(`) ∈ ξt be an ACWof size `, then C(`) is compared to a set ξ(`)
t containing only ACWs of size `. After a comparisonwith different sets, the ACA chooses the one that minimizes the bias: in other words, the agentschoose, among the ACWs already present in the history, those presenting similar dynamics. Thisallows for obtaining accurate estimates.
After experimentations, we observed that the amount of information depends on the dataacquisition frequency of the sensor. For example, if a sensing device perceives information atintervals of 10 seconds, it is necessary to have a sufficient amount of information as the variabilitybetween consecutive information is low. Contrarily, if a sensing device perceives information daily,the variability between samples consecutive in time can be high; therefore, it is necessary to use asmall number of values to assemble an ACW. ACAs capture the variability between consecutivevalues to assemble ACWs that are representative of the information without any configuration.
Figure 5.23 shows an example of how dynamic size ACWs are calculated by ACAs. Startingfrom the information at time instant t, the ACA evaluates a set ξt containing 6 ACWs that referto the same information at time t (the blue cases). Once the set ξt has been calculated, each ACWC ∈ ξt is used to estimate the information at time t+ 1. The information perceived by the real sensorat time t+ 1 is then compared with the estimates provided by each ACW C ∈ ξt. The error is thencalculated as the absolute difference between the estimates and the real value. The ACA, finally,chooses the ACW that minimizes the error between the estimate and the real value.
5.11 Conclusion
This chapter presented HybridIoT, a MAS based solution to estimate missing heterogeneous infor-mation addressing the properties of openness and large-scale computation. Using HybridIoT it ispossible to avoid the installation of a large number of sensing devices by using virtual devices ableto provide accurate information estimates where ad hoc sensing devices are not available. This leads

5.11. CONCLUSION 109
Estimation at t+1 Error
19 20 21,5 22 22,3 22 21 E(7) 1,9
20 21,5 22 22,3 22 21 E(6)
3,9
21,5 22 22,3 22 21 E(5) 1,5
22 22,3 22 21 E(4)
2,1
22,3 22 21 E(3) 0,8
22 21 E(2) 2
ξt
t-6 t-5 t-4 t-3 t-2 t-1 t
19
19 20
19 20 21,5
19 20 21,5 22
19 20 21,5 22 22,3
Figure 5.23: The ACW of size 3 is chosen as representative of the information at time t as it enablesproviding an estimate E(3) at t+ 1 whose difference from the real value (0.8) is minimized.
to relevant cost savings due to the low number of sensors to be installed and the management costsrelated to the sensing devices network. In this way, it is possible to reach a significant compromisebetween an extensive instrumentation of cities and the availability of information at any time andeverywhere.
The advantages of HybridIoT over the state of the art are heterogeneity, openness and scalability.Heterogeneity enables to integrate different types of devices that could perceive different types ofinformation. Openness enables sensing devices to enter or leave the system without the need forany re-configuration. Cooperation enables agents to exploit the data acquired from a multitude ofdevices to estimate missing information.
HybridIoT is generic as it does not require any input parameters or configuration. The systemcan operate in open, dynamic environments such as cities, where devices can appear or disappearwithout any prior notification. Agents are able to provide estimates in almost instantaneous time.The state of the art techniques used to compare the proposed approach are among the most commonand powerful methods to carry out regression over time series. However, these techniques donot appear to be able to operate in open environments where devices may appear or disappearunexpectedly and do not make use of heterogeneous information which type is not known a priori.

Part III
Evaluation
110

Chapter 6Experimental Results
Objectives of this chapter:
• Describing the real dataset used for the experiments
• Describing the evaluation methods and the state of the art solution used to compare theproposed approach
• Discussing the results obtained by HybridIoT
AFTER discussing HybridIoT and the estimation technique, this chapter presents the validationof HybridIoT on a real weather dataset. Figure 6.1 shows the order in which the experiments
will be presented in this chapter. Section 6.2 presents a pipeline of standard techniques for estimatingmissing values on a large scale. The results obtained from this pipeline will be analyzed and usedto compare the results obtained by HybridIoT. Afterwards, the results obtained by HybridIoT willbe analyzed on the presented dataset. The results obtained from endogenous estimation will becompared with those obtained by standard techniques available in the KNIME platform and withthe results obtained from the pipeline of standard techniques. Finally, section 6.5 presents theresults obtained from exogenous estimation, that is, obtained from the integration of heterogeneousinformation. The results of the exogenous estimation will be analyzed and compared with thoseobtained from the endogenous estimation in order to show the validity of the proposed methodand the benefits compared to endogenous estimation.
The following section 6.1 presents the real dataset used to evaluate the proposed approach. Wedescribe the type of information, its size, the frequency of acquisition and where data have beenacquired; the k-fold validation technique is therefore described. This evaluation technique is usedto validate the obtained results. Then, we provide some details of the machine used to validate theproposed solution.
111

112 CHAPTER 6. EXPERIMENTAL RESULTS
Start
End
Baseline results
(Voronoi+Clustering)
Endogenous Estimation
Endogenous Estimation
(confidence zone)
Exogenous
Estimation
Analysis of the
results
Analysis of the
results
Analysis and
comparison of
the results
Analysis of the
results
Comparison to
state of the art
KNIME
techniques
Baseline results
Benefits over
endogenous
estimation
KNIME
techniques
Baseline results
Figure 6.1: The order according to which the experiments are presented in this chapter.
6.1 Dataset
The dataset used to validate the proposed method contains real environmental information acquiredin the Emilia Romagna region in Italy [4]. In Emilia Romagna region, the prevailing climate istemperate subcontinental, with hot and humid summers followed by cold and harsh winters.Orographically the region is divided almost symmetrically between the Po Valley and the hills andmountains of the northern Apennines.
We considered the average daily air temperatures at 2 meters of altitude, the average daily solarirradiance, the average daily wind speed at 10 meters of altitude and the average daily air humidityat 2 meters of altitude. Data have been collected in 196 days from September 8 2017 to April 252018.The days when some stations were not operational are not considered. We used two versions ofthis dataset for the experimentations: (i) a version containing all the types of information previouslylisted, that consists in an array of 8112 numerical values acquired from 9 weather stations; (ii) aversion containing only temperature values, which results in an array of 15680 numerical valuesacquired from 80 weather stations. This difference in terms of the number of samples and stations,between the two datasets versions, is because for different days not all the information has beenacquired correctly by each station.
Figure 6.2 shows the distribution of mean temperature values for the first version of the dataset,
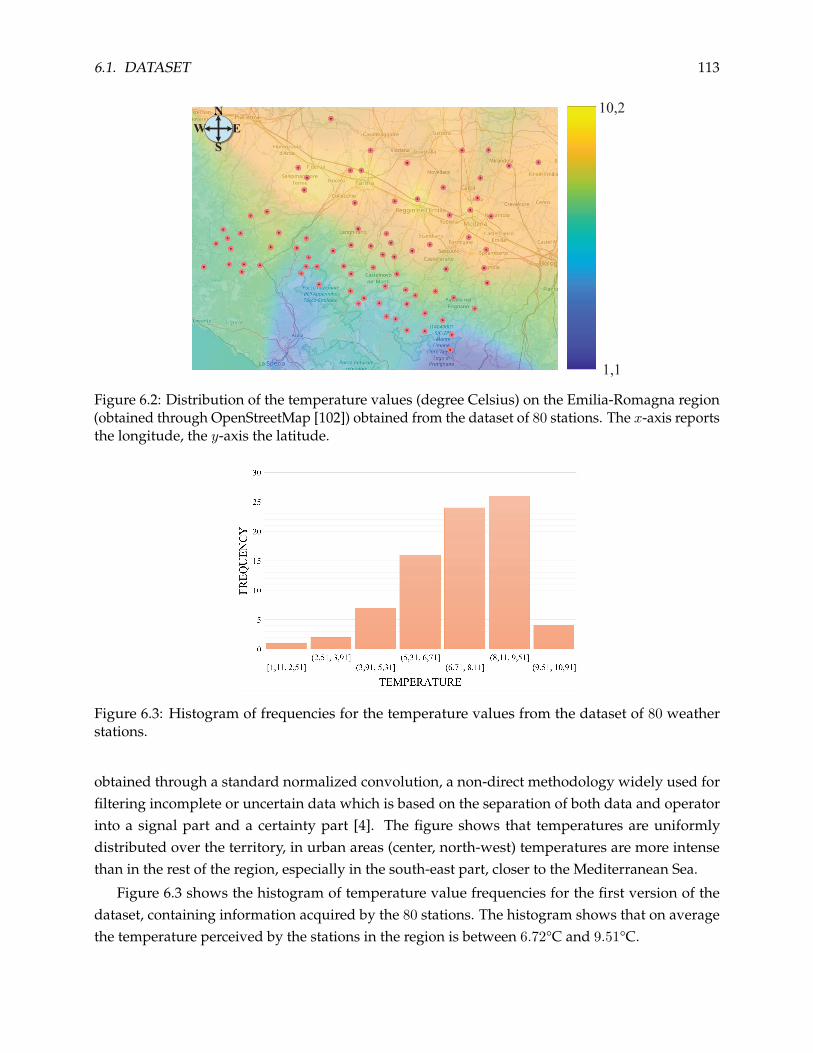
6.1. DATASET 113
1,1
10,2N
EW
S
Figure 6.2: Distribution of the temperature values (degree Celsius) on the Emilia-Romagna region(obtained through OpenStreetMap [102]) obtained from the dataset of 80 stations. The x-axis reportsthe longitude, the y-axis the latitude.
Figure 6.3: Histogram of frequencies for the temperature values from the dataset of 80 weatherstations.
obtained through a standard normalized convolution, a non-direct methodology widely used forfiltering incomplete or uncertain data which is based on the separation of both data and operatorinto a signal part and a certainty part [4]. The figure shows that temperatures are uniformlydistributed over the territory, in urban areas (center, north-west) temperatures are more intensethan in the rest of the region, especially in the south-east part, closer to the Mediterranean Sea.
Figure 6.3 shows the histogram of temperature value frequencies for the first version of thedataset, containing information acquired by the 80 stations. The histogram shows that on averagethe temperature perceived by the stations in the region is between 6.72°C and 9.51°C.

114 CHAPTER 6. EXPERIMENTAL RESULTS
Figure 6.4 shows the distribution of radiation, relative humidity, wind speed, and temperaturefor the dataset obtained from 9 weather stations. Here can be observed that the wind speed is moreintense in the south-east part of the region, which is closer to the Mediterranean sea, and as inFigure 6.2, the temperatures are higher in urban areas.
75,5
119,1N
EW
S
(a) Radiation (W/m2)
68,9
83,1N
EW
S
(b) Humidity (%)
1,3
2,3N
EW
S
(c) Wind speed (m/s)
8,06
9,66N
EW
S
(d) Temperature (°C)
Figure 6.4: Distribution of radiation, humidity, wind speed and temperature values in the Emilia-Romagnaregion (obtained through OpenStreetMap [102]). The red markers represent the position of the weatherstations. The x-axis reports the longitude, the y-axis the latitude.
We do not report the histograms of the values for the dataset obtained from the 9 stationsbecause the information content is limited and the graphs would be superfluous.
6.2 Comparison Solution - Voronoi Tessellation and Hierarchical Clus-tering
This section describes a simple yet effective methodology to estimate missing environmentalinformation by cluster analysis and normalized convolution (see Figure 6.5) [4].
We have developed a pipeline of standard techniques for estimating missing values that usesstandard methods such as hierarchical clustering and Voronoi tessellation [4]. The use of thistechnique allows obtaining results that we use as a baseline to validate the results obtained by

6.2. COMPARISON SOLUTION 115
HybridIoT. The developed pipeline has been evaluated on the regional dataset described in theprevious section, using temperature information.
Input DataHierarchical
Clustering
Voronoi
Tessellation
Normalized
Convolution
Estimated
Data
Figure 6.5: Sketch of the main steps of the methodology based on Voronoi tessellation and hierarchi-cal clustering.
6.2.1 Agglomerative Hierarchical Clustering
In a clustering problem we are given a dataset of “points” and the goal is to partition this datasetinto a finite set of disjoint subsets (i.e. clusters) such that the union of all subsets covers the wholedataset. A high quality clustering is one in which the points in any particular subset are moresimilar to each other than the points in other subsets [78].
One common technique for clustering is known as agglomerative hierarchical clustering; thisapproach starts considering each single point into a single cluster and then it iteratively merges theclosest pair of clusters according to some similarity criteria until all points belong to one cluster.The main drawbacks of this approach are that the points that have been incorrectly grouped at anearly stage cannot be reallocated subsequently and different similarity measures among the clusterscan lead to completely different results [51].
The hierarchical methods group training points into a typical tree structure known as dendrogramwhich represents a sequence of nested clusters constructed top-down or bottom-up. The root of thetree represents the cluster that includes the whole dataset of points while each leave has one point.By cutting the tree at a certain level we obtain a clustering into disjoint groups (Figure 6.6) [113].
1 2 3 4 5 6 7 8 9 10
0,9
0,8
0,7
0,6
0,5
0,4
0,3
0,2
0,1
Figure 6.6: Colors represents the clusters obtained by thresholding the dendrogram at 0.6 (thedashed line).
A major challenge in cluster analysis is determining the optimal number of clusters. Thereare two principal approaches to face this problem. One common technique depends on plotting

116 CHAPTER 6. EXPERIMENTAL RESULTS
an optimization parameter against a number of clusters and on choosing the number whichcorresponds to a large change in the parameter value. A second method seeks large changes ininter-group fusions where fusion distances are generally determined with the aid of the dendrogram.Both these techniques depend on the determination of relatively large changes in an index ratherthan its minimization or maximization and therefore require human interpretation and subjectiveanalysis of what should be considered a “large change” [35]. In the gap statistic method [132] wesuppose that we clustered the set of points into k clusters C1, C2, . . . , Ck. Let
Dr =∑
i,j∈Cn
dij
be the sum of pairwise distances for all points in the cluster r where |Cr| = nr and let
Wk =k∑r=1
Dr
2||Cr||
be the variance that represents the dispersion of the points within the k clusters. The idea of gapstatistic is to compare the dispersion of the points within each of the k clusters to its expectationunder an appropriate null reference distribution [132].
6.2.2 Normalized Convolution
Dealing with irregularly sampled data due to the presence, for example, of noise or instrumentalerror is quite common in many scientific fields, such as astrophysics, geoscience, oceanography,telecommunications, remote sensing and medical imaging. In general, performing operationson incomplete or irregularly sampled data is a non-trivial task and therefore it is often requiredto reconstruct the irregularly sampled data or resample it onto a regular grid. These operationscan be carried out through direct methods, which can involve the computation of irregularlysampled data in the frequency domain and the inverse transform to obtain a regularly spacedsignal [91, 59, 24]. Normalized convolution is a non-direct methodology widely used for filteringincomplete or uncertain data which is based on the separation of both data and operator into asignal part and a certainty part. A map indicates the presence degree of a sample in a given positionand, in particular, a binary map would indicate just the absence or presence of the signal. Thisapproach was described for the first time by Knutsson and Westin for digital image analysis with asimple and fast implementation [77].
Let S be the positive map that represents certain samples of bi-dimensional data I . If we indicateby S · I the pointwise product of S and I and by K ∗ I the usual convolution with a kernel K,then normalized convolution is defined by
NC(I, S,K) = K ∗ S · I / K ∗ S

6.2. COMPARISON SOLUTION 117
In other words, to reconstruct the data I from its samples specified in S, we just have to weightK ∗ S · I by the confidence K ∗ S of the results generated.
The kernel, centered in the origin, have the original and general form
Kx,y =r−α cosβ
(πr2R)
if r<R0 otherwise
where r=√
(x2 + y2) denotes the distance from the neighbourhood center, R denotes the maximumdistance from the neighbourhood center, α and β are positive integers. Usually, the parametersα = 0 and β = 2 are used, thus obtaining the bi-dimensional raised cosine depicted in figure 6.7.
To avoid over-smoothing the output signal, K should be big enough to contain just some pixelsof the input signal. Vice versa, if the distance between the nearest samples in S is greater than thesize R of K, then the reconstructed image will contain gaps. Without a priori information, R isautomatically set to the minimal distance among the available samples to reduce artifact effectsalong discontinuities: at least one point lies always within the radius [7].
Figure 6.7: Graphic representation of the typical smoothing kernel, as described in [77].
It is noteworthy that the normalized convolution can be calculated through efficient lookuptables if we accumulate the contribution of the few known samples according to the reflectedkernel’s values about its center (Figure 6.8), instead of directly calculating the scalar product at eachunknown point. Instead, this latter approach is preferable if we are interested in a single missingpoint, without considering the rest of the signal (Figure 6.9).
A variant of this algorithm is known as adaptive normalized convolution and it modulates boththe size and the shape of the kernel K, according to the position of certain samples [106, 107]. In thiscase, implementing an optimized and efficient custom convolution routine can be quite difficult: adifferent filter should be arranged for each point of the output image and an estimate of the gradientof the whole signal is used to determine this proper kernel. Obviously, this gradient itself is justan approximation since it has to be computed from available samples specified by S. Actually, wepreferred not to use this approach because it requires a considerable amount of computational timeand usually its performances do not justify the enhancement of the final result due to the very fewknown samples.

118 CHAPTER 6. EXPERIMENTAL RESULTS
Figure 6.8: If very few sensors (marked in red) are available, it is convenient to calculate the valuesin all remaining points by indirect contributions of the actual temperatures: their precalculatedproducts by the kernel are simply added to accumulation arrays.
Figure 6.9: If we are interested in estimating the temperature in just one point (marked in green),the straightforward implementation of the convolution remains the fastest solution.
6.2.3 Analysis of the Results
The hierarchical clustering technique groups together these stations and therefore their correspond-ing tiles. The hierarchical clustering tree is created starting from the information I of the datasetand then the optimal number k of clusters is computed by using the gap statistic method. Stationsbelonging to the same cluster and in adjacent Voronoi tiles are grouped together: this refines theoriginal clustering by separating eventual stations which act in the same manner though are toofar one from each other (Figure 6.10). These new tiles are no more convex in general and containstations with a similar behavior, normally due to the local orography.
The certainty map S needed by the normalized convolution stores just the positions of thestations. In order to estimate the temperature value in a missing position, it is sufficient to apply thenormalized convolution on the information map I from the dataset and on the certainty map S,limited to the cluster containing the position (Figure 6.11).
The algorithm was coded in Matlab language without particular optimizations; nonetheless ittakes about a second to cluster the whole dataset and it is practically instantaneous in computingthe normalized convolution. It should be noted that the clusters should be computed from timeto time and while it is appropriate for a server to update the cluster periodically, the normalizedconvolution can be efficiently calculated even by low-end mobile devices. That is, the certainty mapS can vary not only according to the response provided by the fixed stations, but it can be refined

6.2. COMPARISON SOLUTION 119
(a) (b)
Figure 6.10: Superimposition of the Voronoi diagram (Figure 6.10a) and subsequent clusters (Fig-ure 6.10b) on the map of Emilia-Romagna (obtained through OpenStreetMap [102]). The red dotsindicate the weather stations.
Figure 6.11: Only the stations within the same cluster (in detail) contribute to the normalizedconvolution, similarly to figure 6.9.
also through extemporaneous surveys.To verify the correctness of the results we considered a leave-one-out cross validation: for each
experiment a precise station has been removed at a time, in order to evaluate the estimation fromthe remaining stations. Figure 6.12 shows the average absolute error (in Celsius degree) of eachstation during the considered 196 days. The absolute average overall error is just 0.03°C.
The same normalized convolution can be effectively applied to determine the reliability of theproposed method on the entire lattice: it is sufficient to propagate the average error of each weatherstation to measure the correctness of the extrapolated measurements in any point without a real

120 CHAPTER 6. EXPERIMENTAL RESULTS
-4
-3
-2
-1
0
1
2
3
1 5 9 13 17 21 25 29 33 37 41 45 49 53 57 61 65 69 73 77
AV
ER
AG
E A
BS
OL
UT
E E
RR
OR
(DE
GR
EE
CE
LS
IUS
)
SENSOR ID
Figure 6.12: Error bar of deduced temperatures (degree Celsius) for each station, computed throughthe leave-one-out process.
station (figure 6.13).
0°C +1,9°C-3,3°C
Figure 6.13: Expected error through normalized convolution. Most stations do not introduce anyerror (green); some stations report warmer values than the real temperatures (yellow); only onestation indicates a lower temperature (blue). We highlight that this colder station (circled in red, #79in Figure 6.12) is due to the absence of neighboring stations for a correct evaluation.

6.3. ENDOGENOUS ESTIMATION 121
6.3 Endogenous Estimation
We carried out both cooperative and non cooperative evaluation: in the first case, the ACAs estimatemissing information by cooperating with the other agents, while in the second case the agents useonly their ACWs to estimate missing information. When using cooperation, the ACAs choose theACAs with which it cooperates according to two criteria:
• Nearest Agents: ACAs cooperate with the nearest with respect to their position;
• Most Confident Agents: ACAs cooperate with those that have a high confidence value.
In order to assess the effectiveness of the cooperation, three evaluations have been carriedout using different percentages of ACAs involved in the cooperative process: 25%, 50% and 75%respectively. The results for the cooperative scheme are calculated as the mean of the resultsobtained by these three evaluations.
6.3.1 Analysis of the Results
Figure 6.14 shows the average error, in degree Celsius, obtained by estimating temperature valuesthrough non cooperative and cooperative cases using both agents selection criteria described. Forthe non-cooperative case, the average error among the considered sensors is 0.074°C, the standarddeviation is 1.865°C. For the cooperative case, the average error is 0.060°C, the standard deviation is1.970°C using the most confident agents criterion. By using the nearest agents criteria, the averageerror is 0.081°C, the standard deviation is 1.968°C. Figure 6.14 shows that the results obtained by thecooperative method are comparable to those obtained by the endogenous (individual) estimation;this proves that the joint operation of a collective of autonomous agents can accurately estimatemissing information. Moreover, the most confident criterion gives better results than the nearestcriterion: cooperation between agents observing similar environmental dynamics enable agentsto provide accurate estimates compared to the use of physically close sensors. This result provesthat the proposed technique constitutes a step forward towards the development of large-scaleubiquitous systems for the estimation of missing values, where the distributed computation andthe mutual interaction between devices allow obtaining significant results and addressing thechallenges of openness and highly dynamic environment.
We evaluated the endogenous estimation scheme separately on different types of informationto prove that the proposed technique is able to estimate information of different types withoutany configuration. Figure 6.15 shows the absolute error obtained from estimating solar radiation,average daily wind speed, and relative humidity. The error obtained is fairly similar among thedifferent information because of the limited amount of information available and the limited numberof variations in the observed data.
Table 6.1 summarizes the average absolute error obtained by using endogenous estimation onsolar radiation, wind speed, and relative humidity.

122 CHAPTER 6. EXPERIMENTAL RESULTS
0
0,1
0,2
0,3
0,4
0,5
0,6
0,7
0,8
0,9
1
1 5 9 13 17 21 25 29 33 37 41 45 49 53 57 61 65 69 73 77
AV
ER
AG
E A
BS
OL
UT
E E
RR
OR
(CE
LS
IUS
DE
GR
EE
)
SENSOR ID
COOPERATIVE NON COOPERATIVE
(a) Nearest neighbors criterion case.
0
0,2
0,4
0,6
0,8
1
1,2
1 5 9 13 17 21 25 29 33 37 41 45 49 53 57 61 65 69 73 77
AV
ER
AG
E A
BS
OL
UT
E E
RR
OR
(CE
LS
IUS
DE
GR
EE
)
SENSOR ID
COOPERATIVE NON COOPERATIVE
(b) Most confident neighbors criterion case.
Figure 6.14: Average absolute error (in degree Celsius) obtained from endogenous estimation, forboth cooperative and non-cooperative cases. For the cooperative case, both nearest neighborscriterion (Figure 6.14a) and most confident neighbors criterion (Figure 6.14b) are used to evaluatethe agents with which cooperate.
0.08
0.16
0.24
0.32
RADIATION MOST CONFIDENT COOPERATIVERARR DIATAA ION MOST CONFIDENT COOPERARR TAA IVE
RADIATION MOST CONFIDENT NON-COOPERATIVERARR DIATAA ION MOST CONFIDENT NON-COOPERARR TAA IVE
RADIATION NEAREST COOPERATIVERARR DIATAA ION NEAREST COOPERARR TAA IVE
RADIATION NEAREST NON-COOPERATIVERARR DIATAA ION NEAREST NON-COOPERARR TAA IVE
AB
SO
LU
TE
ER
RO
R
(WA
TT
PE
R S
QU
AR
E M
ET
RE
)
(a) Radiation
0.08
0.16
0.24
0.32
WINDSPEED MOST CONFIDENT COOPERATIVEWINDSPEED MOST CONFIDENT COOPERARR TAA IVE
WINDSPEED MOST CONFIDENT NON-COOPERATIVEWINDSPEED MOST CONFIDENT NON-COOPERARR TAA IVE
WINDSPEED NEAREST COOPERATIVEWINDSPEED NEAREST COOPERARR TAA IVE
WINDSPEED NEAREST NON-COOPERATIVEWINDSPEED NEAREST NON-COOPERARR TAA IVE
AB
SO
LU
TE
ER
RO
R
(ME
TE
RS
PE
R S
EC
ON
D)
(b) Wind Speed
0
0.08
0.16
0.24
0.32
HUMIDITY MOST CONFIDENT COOPERATIVEHUMIDITY MOST CONFIDENT COOPERARR TAA IVE
HUMIDITY MOST CONFIDENT NON-COOPERATIVEHUMIDITY MOST CONFIDENT NON-COOPERARR TAA IVE
HUMIDITY NEAREST COOPERATIVEHUMIDITY NEAREST COOPERARR TAA IVE
HUMIDITY NEAREST NON-COOPERATIVEHUMIDITY NEAREST NON-COOPERARR TAA IVE
AB
SO
LU
TE
ER
RO
R
(PE
RC
EN
TA
GE
%)
(c) Humidity
Figure 6.15: Box plot of absolute error obtained through the endogenous estimation, for bothcooperative and non cooperative cases, using solar radiation, wind speed, and relative humidity.We used both the nearest neighbor criterion and most confident criterion.

6.3. ENDOGENOUS ESTIMATION 123
Table 6.1: Average absolute error obtained by endogenous estimation.
Average Absolute ErrorMost confidentagent strategy
Nearestagent strategy
Humidity (%) 0.16320 0.16240Solar radiation (W/m2) 0.15851 0.16265
Wind speed (m/s) 0.15888 0.16141
Although the information used is of a different type, with different ranges of values and differentdistributions, HybridIoT enables obtaining a low error without any configuration: it can interceptand learn the environmental dynamics to accurately estimate missing information, independentlyfrom its type. Two main consequences can be discerned from the obtained results: the technique (i)makes it possible to obtain precise estimates for different types of environmental information, and (ii)allows estimating of environmental information using information which type is not known a priori;this suggests that the user does not have to provide, in advance, any estimation or configurationmechanism depending on the type of data and new types of information can be introduced withoutany particular modification.
6.3.2 Comparison to the State of the Art
This section compares the results obtained by the endogenous estimation in HybridIoT withdifferent standard techniques for estimating missing information. The section is structured asfollows: Section 6.3.2 presents the KNIME platform used to evaluate different techniques forestimating missing information on the presented regional dataset. The results obtained by thetechniques available in this platform are subsequently analysed in section 6.3.2.
Comparison Solution - KNIME Platform
The KNIME analytic platform is a free software that provides a graphical drag-and-drop environ-ment where pipelines can be assembled by connecting nodes that perform data analysis tasks [15].In KNIME, nodes are components represented as boxes having input and output ports. Each nodetransforms and processes data according to specific functionalities. Input/output connections portsallow data to flow through the pipeline. Figure 6.16 shows an example of workflow in KNIME.
The KNIME platform was chosen for the experiments because of its availability, ease of use andeasy reproducibility of experiments that do not require any programming languages. Moreover, KN-IME provides a large number of regression techniques, which allows a more exhaustive comparisonwith the proposed approach. The following regression techniques have been used for estimatingmissing information, the nodes being available on KNIME: linear regression, polynomial regression,random forest regression [67], fuzzy rules [16], gradient boost trees regression [50], AutoregressiveIntegrated Moving Average (ARIMA) [75], Pace regression [142], Radial Basis Function (RBF) [139]and isotonic regression [151]. Pace regression, RBF and isotonic regression nodes are available

124 CHAPTER 6. EXPERIMENTAL RESULTS
Figure 6.16: An example of workflow in KNIME
Table 6.2: Configuration of state-of-art techniques nodes available in KNIME.
Technique PropertiesLinear Regression No propertiesPolynomial Regression Maximum polynomial degree: 3Random Forest Regression No propertiesFuzzy Rules Missing Values: Best GuessGradient Boost Trees Regression Missing Value Handling: XGBoost
Alpha: 1.0ARIMA AR/I/MA order: 1
Estimation method: conditional likelihood [61]Pace Regression Estimator: ordinary least squares
Threshold value: 2RBF Number of Gaussian basis functions: 2
Ridge factor for quadratic penalty on output weights: 0.01Tolerance parameter for delta values: 1.0e-6Scale optimization option: one scale per unitUse conjugate gradient descent: trueUse normalized basis functions: trueSize of the thread pool: 1Number of threads to use: 1Use random number seed: true
Gaussian Processes Level of Gaussian Noise with respect to transformed target: 1Kernel used: polynomial
Isotonic Regression No properties
through the Weka data mining framework [149], which can be integrated with KNIME. The com-parison with the state of the art does consider the solutions described in chapter 3 as authors do notprovide any tool that allow a comparison with the data used in this thesis.
The evaluation using the state of the art techniques has been carried out using the defaultconfiguration for each node. Table 6.2 summarizes the default parameters used to configure thenodes in KNIME.
The k-fold cross-validation and an auto-regressive model are used to evaluate the accuracy ofthe state of the art techniques; the required nodes are available in KNIME, using a k value of 5, 10and 15. An auto-regressive model assumes that the previously observed samples can be used topredict accurately the value at the next time step. For instance, we used 4 samples to implement theauto-regressive model using KNIME.
There is no formal rule for choosing the value of k to use for cross-validation. However, as kgets larger, the difference in size between the training set and the resampling subsets gets smaller.

6.3. ENDOGENOUS ESTIMATION 125
Consequently, the difference between the estimated and real values becomes smaller [80].The results obtained by the endogenous estimation have been compared to state of the art
techniques using the KNIME analytic platform. This free software provides a graphical drag-and-drop environment where pipelines can be assembled by connecting nodes that perform dataanalysis tasks [15]. In KNIME, nodes are components represented as boxes having input and outputports. Each node transforms and processes data according to specific functionalities. Input/outputconnections ports allow data to flow through the pipeline.
The evaluation using the state of art techniques has been carried out using the default configura-tion for each node, which parameters are listed in Table 6.2.
Analysis of the Results
We used the 15 sensors that gave the worst results using the endogenous estimation in HybridIoTto evaluate the state of the art techniques. Figure 6.17 shows the box plots that depict the absoluteerror obtained by the state of art techniques, calculated as the average among the considered folds(5, 10 and 15).
0.8
1.6
2.4
3.2
4
HybridIoTHybridIoT
LINEAR REGRESSIONLINEAR REGRESSION
POLYNOMIAL REGRESSIONPOLYLL NOMIAL REGRESSION
RANDOM FOREST REGRESSIONRARR NAA DOM FOREST REGRESSION
FUZZY RULESFUZZY RURR LES
GRADIENT BOOST TREES REGRESSIONGRARR DIENT BOOST TREES REGRESSION
ARIMAARIMA
PACE REGRESSIONPAPP CE REGRESSION
RBFRBF
GAUSSIAN PROCESSESGAUSSIANAA PROCESSES
ISOTONIC REGRESSIONISOTONIC REGRESSION
AB
SO
LU
TE
ER
RO
R
(CE
LS
IUS
DE
GR
EE
)
(a) Nearest agents criterion case
0.8
1.6
2.4
3.2
4
4.8
HybridIoTHybridIoT
LINEAR REGRESSIONLINEAR REGRESSION
POLYNOMIAL REGRESSIONPOLYLL NOMIAL REGRESSION
RANDOM FOREST REGRESSIONRARR NAA DOM FOREST REGRESSION
FUZZY RULESFUZZY RURR LES
GRADIENT BOOST TREES REGRESSIONGRARR DIENT BOOST TREES REGRESSION
ARIMAARIMA
PACE REGRESSIONPAPP CE REGRESSION
RBFRBF
GAUSSIAN PROCESSESGAUSSIANAA PROCESSES
ISOTONIC REGRESSIONISOTONIC REGRESSION
AB
SO
LU
TE
ER
RO
R
(CE
LS
IUS
DE
GR
EE
)
(b) Most confident agents criterion case
Figure 6.17: Box plot of absolute error (in degree Celsius) obtained by the state of the art techniqueson the 15 sensors that gave the worst results using the proposed solution. Figure 6.17a comparesthe results of the proposed approach using the nearest agents criterion, Figure 6.17b compares theresults of the proposed approach using the most confident agents criterion.
The results in Figure 6.17 are obtained from the dataset containing only temperature values.Although the average error obtained for each sensor is less than 1°C, the proposed cooperativeapproach outperforms the state of the art techniques. In fact, cooperation enables ACAs to use notonly information in their historic, but also information coming from the other available agents.

126 CHAPTER 6. EXPERIMENTAL RESULTS
Figure 6.18 shows the comparison of results obtained by the pipeline of standard techniques(Voronoi tessellation and hierarchical clustering) and HybridIoT using respectively the nearestagents and most confident agents criteria for the cooperative case. HybridIoT shows better resultswith respect to the pipeline using both agents’ selection criteria (near agents and most confidentagents). Moreover, we outline some fundamental differences from HybridIoT:
• HybridIoT can learn environmental dynamics and estimate missing information instanta-neously in areas of the environment not sufficiently covered by sensors;
• HybridIoT enables introducing new sensing devices at any time;
• using the pipeline, a device that needs to estimate missing information must be located in aregion where at least one working sensor must be present. In HybridIoT, an ACA can estimatemissing information through cooperation but also using previously perceived values, thusovercoming the lack of sensors in the proximity of the ACA.
0
0,5
1
1,5
2
2,5
3
3,5
4
1 5 9 13 17 21 25 29 33 37 41 45 49 53 57 61 65 69 73 77
AV
ER
AG
E A
BS
OL
UT
E E
RR
OR
(CE
LS
IUS
DE
GR
EE
)
SENSOR ID
NEAREST AGENT CRITERION PIPELINE (VORONOI+CLUSTERING)
(a) Nearest neighbors criterion case.
0
0,5
1
1,5
2
2,5
3
3,5
4
1 5 9 13 17 21 25 29 33 37 41 45 49 53 57 61 65 69 73 77
AV
ER
AG
E A
BS
OL
UT
E E
RR
OR
(CE
LS
IUS
DE
GR
EE
)
SENSOR ID
MOST CONFIDENT CRITERION PIPELINE (VORONOI+CLUSTERING)
(b) Most confident neighbors criterion case.
Figure 6.18: Average absolute error (in degree Celsius) obtained from the pipeline that uses Voronoitessellation and Hierarchical clustering and HybridIoT, using nearest agent (Figure 6.18a) and mostconfident criterion (Figure 6.18b).
We presented the results obtained by the endogenous estimation scheme. We compared theresults to those obtained by state of the art regression techniques to assess the accuracy of the resultsobtained. Also, we carried out a comparison using a pipeline of standard techniques includingVoronoi tessellation and hierarchical clustering, on the same dataset. In this case, HybridIoToutperforms the results obtained by the pipeline.
6.4 Endogenous Estimation by Confidence Zone
As in the previous experimentations, the evaluation of the cooperative endogenous estimationtechnique by the confidence zone is pursued by using the leave-one-out validation: each real sensor
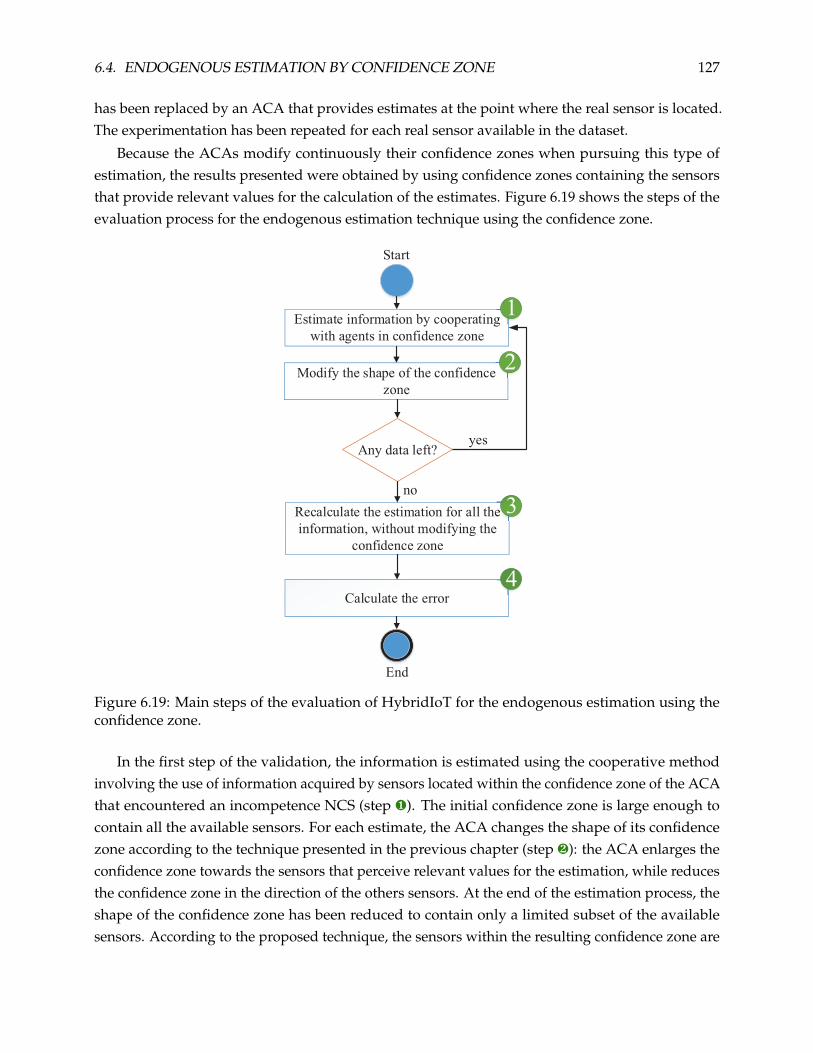
6.4. ENDOGENOUS ESTIMATION BY CONFIDENCE ZONE 127
has been replaced by an ACA that provides estimates at the point where the real sensor is located.The experimentation has been repeated for each real sensor available in the dataset.
Because the ACAs modify continuously their confidence zones when pursuing this type ofestimation, the results presented were obtained by using confidence zones containing the sensorsthat provide relevant values for the calculation of the estimates. Figure 6.19 shows the steps of theevaluation process for the endogenous estimation technique using the confidence zone.
Start
End
Estimate information by cooperating
with agents in confidence zone
g 1
Calculate the error
yesAny data left?
Modify the shape of the confidence
zone
2
no
Recalculate the estimation for all the
information, without modifying the
confidence zone
ee 3
4
Figure 6.19: Main steps of the evaluation of HybridIoT for the endogenous estimation using theconfidence zone.
In the first step of the validation, the information is estimated using the cooperative methodinvolving the use of information acquired by sensors located within the confidence zone of the ACAthat encountered an incompetence NCS (step ¶). The initial confidence zone is large enough tocontain all the available sensors. For each estimate, the ACA changes the shape of its confidencezone according to the technique presented in the previous chapter (step ·): the ACA enlarges theconfidence zone towards the sensors that perceive relevant values for the estimation, while reducesthe confidence zone in the direction of the others sensors. At the end of the estimation process, theshape of the confidence zone has been reduced to contain only a limited subset of the availablesensors. According to the proposed technique, the sensors within the resulting confidence zone are

128 CHAPTER 6. EXPERIMENTAL RESULTS
the most pertinent for the estimation of information at the location of the ACA that encountered anincompetence NCS. Figure 6.20 shows some examples of confidence zones containing the sensorsrelevant to the estimate calculation for ACAs that have encountered an incompetence NCS.
Figure 6.20: When estimating by cooperation with nearby agents, the ACA that encounters anincompetence NCS (the yellow marker) cooperates with the other agents (the green markers) andmodifies its confidence zone according to the perceived values. Only the agents perceiving pertinentinformation are kept inside the confidence zone.
The information is then estimated once again, this time using the information acquired by thesensors within the reduced confidence zone (step ¸); in this step, the shape of the confidence zoneremains unmodified. The last step of the validation is to evaluate the error related to the calculatedestimated values (step ¹): for each sensor, this is calculated as the average of the differences inabsolute value between the real information (the information perceived by the replaced sensor) andthe estimated information (the information estimated by the ACA).
We applied the same estimation technique using both regional dataset containing:
• 80 stations and temperature values,
• 9 stations and heterogeneous information (temperature, humidity, solar radiation and windspeed).
6.4.1 Analysis of the Results
Figure 6.21 shows the absolute error obtained by the proposed approach, compared to the pipelineof standard techniques (Voronoi tessellation and hierarchical clustering). For the endogenous

6.4. ENDOGENOUS ESTIMATION BY CONFIDENCE ZONE 129
estimation technique, the average absolute error is 1.17°C.
0
1
2
3
4
5
6
EST. BY CONFIDENCE ZONE (sensors 1 to 20)EST. BY CONFIDENCE ZONE (sensors 1 to 20) EST. BY CONFIDENCE ZONE (sensors 20 to 40)EST. BY CONFIDENCE ZONE (sensors 20 to 40)
EST. BY CONFIDENCE ZONE (sensors 40 to 60)EST. BY CONFIDENCE ZONE (sensors 40 to 60) EST. BY CONFIDENCE ZONE (sensors 60 to 80)EST. BY CONFIDENCE ZONE (sensors 60 to 80)
VORONOI+CLUSTERING (sensors 1 to 20)VORONOI+CLUSTERING (sensors 1 to 20) VORONOI+CLUSTERING (sensors 20 to 40)VORONOI+CLUSTERING (sensors 20 to 40)
VORONOI+CLUSTERING (sensors 40 to 60)VORONOI+CLUSTERING (sensors 40 to 60) VORONOI+CLUSTERING (sensors 60 to 80)VORONOI+CLUSTERING (sensors 60 to 80)
AB
SO
LU
TE
ER
RO
R
(CE
LS
IUS
DE
GR
EE
)
Figure 6.21: Results obtained by the proposed estimation technique using the confidence zone andthe baseline results produced by the pipeline of standard methods (Voronoi+hierarchical clustering).
Compared to the pipeline of standard techniques, HybridIoT enables calculating estimatesconsidering devices that can enter or leave the system at any time. Moreover, thanks to the localcomputation of ACAs, HybridIoT can be deployed in large scale contexts.
The estimation technique enables estimating missing information instantaneously using valuesacquired from devices that can enter the system at any time. The confidence zone is instantaneouslymodified by ACAs and evolves constantly: its shape changes according to the information and theposition of the sensors inside it. The modification of the confidence zone can be also influenced bythe mobility of the sensors present in the environment: the estimation technique enables to calculatemissing values even using sensors whose position is not fixed.
The same estimation technique has been evaluated on the dataset containing heterogeneousinformation. Figure 6.22 shows the results obtained from the proposed approach by comparingtemperature, humidity, wind speed and solar radiation on a limited number of sensors. We obtainedan average absolute error of 0.2 (m/s) using wind speed data, 3.77 (%) using humidity data, 0.82(°C) using temperature data and 5.36 (W/m2) using solar radiation data.
The proposed technique enables to estimate missing information through a mechanism ofcooperation addressing the properties of openness and heterogeneity: the openness is addressedbecause some sensors that provide information that is not relevant to the calculation of estimatesare excluded from the confidence zone. ACAs instantaneously adapt to the environmental contextin which they are located to determine the set of agents with which to cooperate for estimatingmissing information. Heterogeneity is addressed because the same estimation technique has beenapplied using different types of information without any particular configuration.
Figure 6.23 shows the results obtained from endogenous estimation by the confidence zone andthe techniques available in KNIME. We remark that the box plots have, especially for temperature

130 CHAPTER 6. EXPERIMENTAL RESULTS
and humidity, a wide interquartile range due to the variability of the information perceived bythe agents involved in the estimation process. The resolution process through which the resultshave been obtained is cooperative, therefore multiple agents that perceive different environmentaldynamics are involved in the estimation process. For this reason, the variability is high. Despitethis, the median error is lower than the other techniques. The results show that the cooperativeestimation approach allows obtaining significative results through the integration of multipleinformation.
6.5 Exogenous Estimation using Heterogeneous Information
We used the k-fold cross-validation to evaluate the accuracy of the obtained results. This validationtechnique partitions the original sample in k subsamples. Among the k subsamples, the k-th one isretained as the validation data, for which estimated data is compared to the real information; theremaining k−1 subsamples are used as training data. During the training phase, the ACAs assemblethe ACWs for the available data. During the test phase, the information from the k-th partition isestimated, thus simulating the unavailability of the sensor. The test phase is then repeated k times,
0
0,5
1
1,5
2
2,5
3
2 12 9 16 29 8 11 10 75
AV
ER
AG
E A
BS
OL
UT
E
ER
RO
R (
DE
GR
EE
CE
LS
IUS
)
SENSOR ID
(a) Temperature
0
1
2
3
4
5
6
7
8
2 12 9 16 29 8 11 10 75
AV
ER
AG
E A
BS
OL
UT
E
ER
RO
R (
PE
RC
EN
TA
GE
%)
SENSOR ID
(b) Humidity
0
2
4
6
8
10
12
14
16
2 12 9 16 29 8 11 10 75
AV
ER
AG
E A
BS
. E
RR
OR
(WA
TT
PE
R S
QU
AR
E M
ET
RE
)
SENSOR ID
(c) Solar Radiation
0
0,1
0,2
0,3
0,4
0,5
0,6
2 12 9 16 29 8 11 10 75
AV
ER
AG
E A
BS
. E
RR
OR
(ME
TE
RS
PE
R S
EC
ON
D)
SENSOR ID
(d) Wind Speed
Figure 6.22: Average absolute error obtained by applying the cooperative estimation techniqueby the confidence zone on a dataset of heterogeneous information. The four graphs show theerror obtained by applying the technique on four datasets containing respectively temperature(Figure 6.22a), humidity (Figure 6.22b), solar radiation (Figure 6.22c), wind speed (Figure 6.22d).

6.5. EXOGENOUS ESTIMATION USING HETEROGENEOUS INFORMATION 131
00.5
11.5
22.5
33.5
44.5
AB
SO
LU
TE
ER
RO
R
(CE
LS
IUS
DE
GR
EE
)
(a) Temperature
2
4
6
8
10
12
14
AB
SO
LU
TE
ER
RO
R
(PE
RC
EN
TA
GE
%)
(b) Humidity
0
7
14
21
28
35
42
49
56
AB
SO
LU
TE
ER
RO
R
(WA
TT
PE
R S
QU
AR
E M
ET
ER
)
(c) Solar Radiation
0
0.2
0.4
0.6
0.8
1
AB
SO
LU
TE
ER
RO
R
(ME
TE
RS
PE
R S
EC
ON
D)
(d) Wind Speed
HybridIoTHybridIoT LINEAR REGRESSIONLINEAR REGRESSION
POLYNOMIAL REGRESSIONPOLYLL NOMIAL REGRESSION RANDOM FOREST REGRESSIONRARR NAA DOM FOREST REGRESSION
FUZZY RULESFUZZY RURR LES GRADIENT BOOST TREES REGRESSIONGRARR DIENT BOOST TREES REGRESSION
ARIMAARIMA PACE REGRESSIONPAPP CE REGRESSION
RBFRBF GAUSSIAN PROCESSESGAUSSIANAA PROCESSES
ISOTONIC REGRESSIONISOTONIC REGRESSION
Figure 6.23: Results obtained by comparing the proposed endogenous technique by confidencezone and the estimation techniques available in KNIME.
with each of the k subsamples used exactly once as the test data.
Figure 6.24 shows the pipeline used to evaluate the results obtained by HybridIoT. The firststep of the validation consists in using the training partitions to define the ACWs to be usedfor estimating the missing data (step ¶). The k-th partition is being validated by estimating itsdata (step ·) to simulate the unavailability of the sensor. During this step, the agent pursuesan endogenous estimation. Then, the ACA determines the set of the other agents with which itcan cooperate to provide an accurate estimate (step ¸). Finally, the ACA pursues an exogenousestimation by cooperating with the available agents (step ¹). The steps ¶ to ¹ are repeated for each

132 CHAPTER 6. EXPERIMENTAL RESULTS
ACWs definition using training partitions
Estimate missing data in partition k
(endogenous scheme)
Determine ACAs with which cooperate
Estimate cooperatively missing data in partition k
(exogenous scheme)
Tra
inin
gT
est
ing
Merge estimation results
Any partition left?
1
2
3
n kkkkkkkk4
5
Evaluate error
6
no
yes
Start
End
Figure 6.24: Main steps of the pipeline used to evaluate the proposed solution.
partition. The estimates provided for all the partitions are merged to compare the results to the realvalues (step º). The average error is calculated by comparing the estimated and the real values foreach sensor of the dataset (step »). In the experiments, we used a k value of 5, 10 and 15. For thedataset containing only homogeneous information, the values of k chosen (5, 10, 15) yield to testpartitions containing respectively 20%, 9% and 6% of data with respect to the size of the dataset.No significant differences in terms of error were observed using different values of k.
6.5.1 Analysis of the Results
As far as we know, nowadays no solution is available to estimate missing information by integratingheterogeneous information from different data sources. However, although the experiments werecarried out on one type of information, the same technique can be applied for estimating missing

6.5. EXOGENOUS ESTIMATION USING HETEROGENEOUS INFORMATION 133
information of different types. Because we cannot compare the results obtained through theheterogeneous estimations to any specific technique, we show that the results obtained by theheterogeneous estimation are on a par with those obtained in the homogeneous case.
Exogenous estimation is addressed through cooperation between agents that perceive differenttypes of information. In the experiments, we estimated temperature values using context windowscontaining solar irradiance, humidity and wind speed.
As described in the previous paragraph, an ACA that encountered a NCS evaluates differentestimations for each weight obtained from a cooperative process with the other agents. The agentthen evaluates a histogram of the estimation values to exclude those that are not relevant. Inthe experiments the number of bins has been set to 10: this value was obtained by using theFreedman-Diaconis rule [49], which allows calculating the size of the classes of a histogram. Thenumber of bins was calculated as the median of the number of bins obtained by applying theFreedman-Diaconis rule for all the stations.
Figure 6.25 shows the average error for the regional temperature data set using heterogeneousACWs. The results show that ACAs can provide accurate estimates through heterogeneous informa-tion without using any specific data fusion technique. As for endogenous estimation, the estimationof a missing value using the exogenous technique is almost instantaneous.
0
0.1
0.2
0.3
0.4
HUMIDITY, NEAREST AGENTSHUMIDITY,YY NEAREST AGENTS
HUMIDITY, MOST CONFIDENT AGENTSHUMIDITY,YY MOST CONFIDENT AGENTS
RADIATION, NEAREST AGENTSRARR DIATAA ION, NEAREST AGENTS
RADIATION, MOST CONFIDENT AGENTSRARR DIATAA ION, MOST CONFIDENT AGENTS
WINDSPEED, NEAREST AGENTSWINDSPEED, NEAREST AGENTS
WINDSPEED, MOST CONFIDENT AGENTSWINDSPEED, MOST CONFIDENT AGENTS
ALL INFO, NEAREST AGENTSALL INFO, NEAREST AGENTS
ALL INFO, MOST CONFIDENT AGENTSALL INFO, MOST CONFIDENT AGENTS
AV
ER
AG
E A
BS
OL
UT
E E
RR
OR
(CE
LS
IUS
DE
GR
EE
)
Figure 6.25: Results obtained from exogenous estimation. Each column represents the average errorobtained by estimating temperature values using context windows containing the correspondinginformation. The two neighborhood criteria described were used.
Table 6.3 summarizes the average error and the standard deviation obtained by estimating

134 CHAPTER 6. EXPERIMENTAL RESULTS
the temperature from heterogeneous contexts. The results show that ACAs can provide accurateestimates through heterogeneous information without using any specific data fusion technique. Theerror resulting from exogenous estimation is low despite the used ACWs contains values that aresemantically different from the temperature values. The information used in this estimation schemedoes not have significant variation compared to the temperature values. Despite the differencesin the variations and information between ACWs, the results in Table 6.3 show that the proposedmethod can accurately estimate missing information through heterogeneous values.
Table 6.3: Average absolute error and standard deviation (in degree Celsius) obtained by exogenousestimation.
Average Absolute ErrorMost Confident Nearestagent strategy agent strategy
Temp. from solar radiation 0.02716 0.03796Temp. from humidity 0.02654 0.03679
Temp. from wind speed 0.02531 0.03914Temp. from all info 0.07 0.05935
Standard DeviationMost Confident Nearestagent strategy agent strategy
Temp. from solar radiation 1.639136 1.645494Temp. from humidity 1.646173 1.647901
Temp. from wind speed 1.64716 1.651358Temp. from all info 1.65435 1.62805
This section presented the exogenous estimation scheme carried out by HybridIoT on theheterogeneous dataset. In the following, we discuss HybridIoT with respect to the results obtainedby both endogenous and exogenous estimation schemes. Moreover, we show that the resultsobtained by exogenous estimation are on a par with those obtained by the endogenous estimation.
6.6 Discussion
The obtained results assess the validity of HybridIoT for estimating missing heterogeneous infor-mation. With respect to the state of the art techniques, the proposed approach does not require anya priori configuration and the estimation of missing value is almost instantaneous.
To prove the effectiveness of the exogenous estimation, we show that the related results areon a par with those obtained by the endogenous estimation, using the same dataset. Figure 6.26shows the box plots of error, in degree Celsius, obtained by comparing the real temperature valueswith the estimates calculated through both endogenous and exogenous estimations, this last usingradiation, humidity and wind speed. Figure 6.26a shows the results obtained by using the mostconfident agents criterion, Figure 6.26b the results obtained by using the nearest agents criterion.

6.6. DISCUSSION 135
The sensors used for this experiment are those that acquired correctly all the available information(temperature, humidity, wind speed, solar radiation) within the considered temporal period. Weused both the nearest agents and most confident criteria for the cooperative scheme: in the twocases, the results show that the exogenous estimation outperforms the endogenous one.
0
0.08
0.16
0.24
0.32
0.4
TEMPERATURETEMPERARR TAA URE RADIATIONRARR DIATAA ION
HUMIDITYHUMIDITY WIND SPEEDWIND SPEED
ALL INFORMATIONALL INFORMATAA ION
AV
ER
AG
E A
BS
OL
UT
E E
RR
OR
(CE
LS
IUS
DE
GR
EE
)
(a) Nearest neighbors criterion case
0
0.08
0.16
0.24
0.32
0.4
TEMPERATURETEMPERARR TAA URE RADIATIONRARR DIATAA ION
HUMIDITYHUMIDITY WIND SPEEDWIND SPEED
ALL INFORMATIONALL INFORMATAA IONA
VE
RA
GE
AB
SO
LU
TE
ER
RO
R
(CE
LS
IUS
DE
GR
EE
)(b) Most confident neighbors criterion case
Figure 6.26: Box plot of absolute error (in degree Celsius) obtained by comparing the results ofendogenous and exogenous estimations. Figure 6.26a shows the results obtained by using the mostconfident agents criterion, Figure 6.26b the results obtained by using the nearest agents criterion.
When estimating a missing value using different types of information that do not vary signifi-cantly in time, the weights generated by the estimation process can lead to a negligible variationof the last perceived value. Despite the two selection criteria, the estimation process may includeACWs containing environmental dynamics significantly different from the one containing theinformation to be estimated. Therefore, some estimates can be considered as outliers because theyare significantly different from the real value.
The presence of outliers can be caused by the presence of ACWs whose distance from the onecontaining the information to estimate is significantly high. This implies that the ACWs containinformation following different dynamics. For that, ACAs can estimate information that is notaccurate.
Consider Table 6.4, which shows the distances between the ACWs of fixed size (11 and 17). Wehave chosen the size of the ACWs, for each sensor, of equal length (11 and 17 are divisors of 187).Each value represents the average of the distances between the ACWs observed by each sensor.Each distance value is calculated using Equation 5.8. Each distance value is reported according tothe respective units of measurement (°C for temperature, % for humidity, etc.).
The distances between temperature and wind speed, for example, are significantly different.In particular, although this information is considerably subject to variations, the average distancebetween ACWs containing wind speed is less than the temperature information. This is due to thepresence of ACWs that follow similar dynamics over time. Contrarily, the temperature observed in
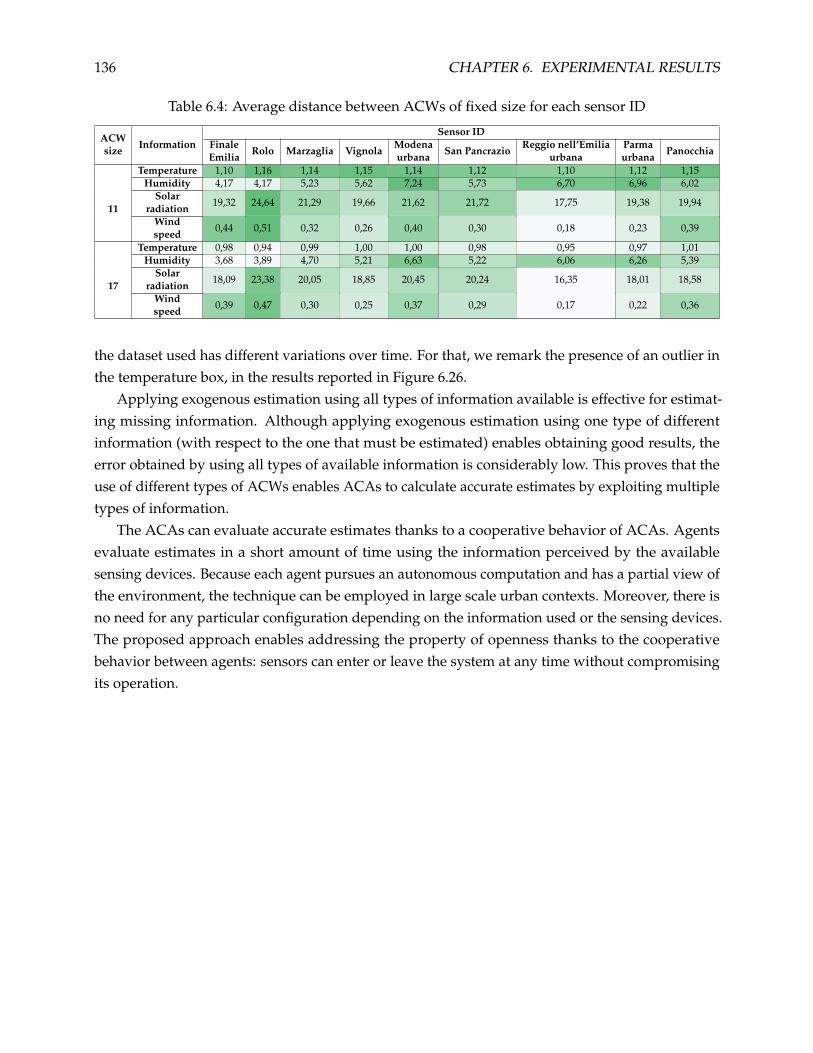
136 CHAPTER 6. EXPERIMENTAL RESULTS
Table 6.4: Average distance between ACWs of fixed size for each sensor ID
Sensor IDACWsize
Information FinaleEmilia
Rolo Marzaglia VignolaModenaurbana
San PancrazioReggio nell’Emilia
urbanaParmaurbana
Panocchia
Temperature 1,10 1,16 1,14 1,15 1,14 1,12 1,10 1,12 1,15Humidity 4,17 4,17 5,23 5,62 7,24 5,73 6,70 6,96 6,02
Solarradiation
19,32 24,64 21,29 19,66 21,62 21,72 17,75 19,38 19,9411
Windspeed
0,44 0,51 0,32 0,26 0,40 0,30 0,18 0,23 0,39
Temperature 0,98 0,94 0,99 1,00 1,00 0,98 0,95 0,97 1,01Humidity 3,68 3,89 4,70 5,21 6,63 5,22 6,06 6,26 5,39
Solarradiation
18,09 23,38 20,05 18,85 20,45 20,24 16,35 18,01 18,5817
Windspeed
0,39 0,47 0,30 0,25 0,37 0,29 0,17 0,22 0,36
the dataset used has different variations over time. For that, we remark the presence of an outlier inthe temperature box, in the results reported in Figure 6.26.
Applying exogenous estimation using all types of information available is effective for estimat-ing missing information. Although applying exogenous estimation using one type of differentinformation (with respect to the one that must be estimated) enables obtaining good results, theerror obtained by using all types of available information is considerably low. This proves that theuse of different types of ACWs enables ACAs to calculate accurate estimates by exploiting multipletypes of information.
The ACAs can evaluate accurate estimates thanks to a cooperative behavior of ACAs. Agentsevaluate estimates in a short amount of time using the information perceived by the availablesensing devices. Because each agent pursues an autonomous computation and has a partial view ofthe environment, the technique can be employed in large scale urban contexts. Moreover, there isno need for any particular configuration depending on the information used or the sensing devices.The proposed approach enables addressing the property of openness thanks to the cooperativebehavior between agents: sensors can enter or leave the system at any time without compromisingits operation.

Conclusion
137

Conclusions and Future Perspectives
General Conclusion
The problem addressed in this thesis can be summarized by this question:
in an open, continuously evolving environment, how can we estimate information in parts of theenvironment not sufficiently covered by sensing devices?
In the state of the art, this question has found multiple answers by applying standard techniquesfor estimating missing information. Nevertheless, the state of the art techniques do not allow toaddress properties such as openness, large scale and heterogeneity that the proposed solution does.
The thesis has been developed starting from a solution based on standard techniques includingVoronoi tesselation and hierarchical clustering. This solution showed that it is possible to group,through a spatial criterion, sensors that perceive information whose evolutionary dynamics aresimilar and that can be used to estimate missing information in parts of the environment wherephysical sensors are not present.
Then we defined a technique to estimate missing information based on a multi-agent approach:through this approach, sensing devices are coupled with agents that perform autonomous com-putation in a limited part of the environment so that the technique can be deployed on large scaleenvironments. In this solution, we have introduced the concept of confidence zones, which identifythe local part where agents operate. Confidence zones are similar to the regions of Voronoi devel-oped in the first technique; unlike the latter, the confidence zones are modified by the agents in sucha way as to include only the sensors that contribute in a pertinent way to the estimation of missingvalues (that is, avoiding outliers). Agents continuously influence the shape of the confidence zonesthrough their perceptions; this causes the confidence zones to change their shape at each estimation.We say that the confidence zones are permanently dynamic because they are also modified in case (i)agents whose position is not fixed and (ii) agents entering and leaving the system at any time. Also,
138

CONCLUSIONS
the confidence zones can overlap and are calculated autonomously by the agents. We comparedthe results of this proposal to those obtained by the method based on Voronoi and hierarchicalclustering, but also to other standard techniques available in the KNIME software. What we haveemphasized in this comparison is both the quality of the results and the capability of the proposedsolution to calculate estimates addressing the properties of large scale and openness. The operationof sensing devices, therefore the operation of the coupled agents, does not affect the other agents.Consequently, the system can be deployed on a large scale without any particular configuration.Moreover, agents can enter or leave the system without any particular configuration.
The second estimation scheme responds to a different case:
how can we estimate missing information in case sensing devices are not available in theproximity of an agent involved in a cooperative resolution process?
In this case, we developed a simple learning mechanism related to agents. Agents observethe environment and assemble Ambient Context Windows (ACW) that describe the evolution of theenvironment in discrete time intervals. The agents that must estimate missing information reasonon the ACWs related to the information perceived previously and deduce what is the numericaldifference that the last perceived information has with respect to the information to estimate.
The last contribution goes beyond the estimation using sensors perceiving the same type ofinformation:
how can we estimate a certain type of information (for example temperature) if there are noagents nearby that provide information of the same type? Assuming that there are agents thatperceive information of different types or different units, is it possible to design a mechanism ofcooperation through which the use of heterogeneous information can contribute to the estimation
of missing values?
The proposed solution, based on a multi-agent approach, answer this question through theintegration of heterogeneous ACWs assembled by agents involved in a cooperative resolutionprocess. If an agent must estimate missing information and there are no agents that perceiveinformation of the same type in the confidence zone, the agent cooperates with agents that arebeyond the confidence zone. Each agent involved in the cooperative process compares its ACWsand the variations of its information to provide the agent that must estimate the information withan indication of how much the estimated information varies from the last perceived information.
Agents adapt instantly to the environmental context in which they are situated so as to choosethe most pertinent estimation strategy:
• if there are no agents in their proximity, the estimates are calculated using the information inthe available ACWs in the history of the agents;
• if there are agents who perceive homogeneous information within the confidence zone, thecooperation between agents allows estimating the missing information;
139 Dynamic Learning of the Environment for Eco-Citizen Behavior

CONCLUSIONS
• if there are no agents in the confidence zone, a cooperative resolution process takes placebetween agents perceiving heterogeneous information.
Deployment in Urban Context
Today smart devices capable of sensing the surrounding environment are becoming more and moreaffordable; low prices lead to an increasing diffusion of these devices and consequently to a rise intheir production. The diffusion of harmful gases for both the environment and citizens arises fromthe massive production of these devices [131]. Using already available devices such as smartphonesor connected vehicles could limit the number of sensors to deploy in an urban context, lowering thedemand for new devices and thus their production. The use of these available devices should notreplace existing sensors; sensing infrastructure should be capable of integrating smartphones andconnected vehicles with existing sensors to make the urban sensing participatory. This integrationis advantageous for the sustainable development of cities: sensing infrastructures integrate a largenumber of devices capable of perceiving geo-localized information on a large-scale that allow for alocal and precise description of the environmental dynamics.
Integrating heterogeneous information can be beneficial to experts for defining new services forcitizens or improving existing ones to achieve the smartness objective of a city. Nevertheless, despitethe limited number of devices capable of sensing the environment available on the market, weassume that the low cost and miniaturization can lead to the integration of sensors into devices suchas smartphones or connected vehicles. However, the deployment of HybridIoT in a real context,considering data acquired from existing sensors and mobile devices such as smartphones, has noconsequence on the nominal operation of the system:
• it operates regardless of the number of devices, these can enter or leave the system withoutany external intervention;
• delays in the transmission of information between devices do not affect the functioning ofHybridIoT: agents evaluate estimates using the available information which is geo-localizedand provided with time-stamps;
• mobility does not affect the functioning of HybridIoT: agents perform a local computation inthe part of the environment where they are situated.
In the experiments conducted, the intermittence of sensors enables simulating both opennessand mobility properties. Each ACA has a boolean variable which value is 1 if the associated sensoris turned on, 0 otherwise. By controlling this variable during the agent’s operation is possible tosimulate the intermittence of the associated sensor, not affecting the functioning of the entire system.In cross-validation, the value is set to 0 when evaluating the estimates for a given test partition. In
Dynamic Learning of the Environment for Eco-Citizen Behavior 140

CONCLUSIONS
using this variable, it is possible to simulate the malfunctioning of devices, therefore assessing thatthe system addresses the property of openness as agents cooperate only with available ACAs.
Currently, we plan to deploy the proposed system on the campus of the University of ToulouseIII – Paul Sabatier and to use devices and smartphones for collecting information. The followingfactors are crucial for a reliable implementation of the system in a real context:
• developing an application for mobile devices. Different operating systems must be consideredand therefore the effort could be considerable. The mobile application must ensure the privacyof users when gathering and treating information perceived by personal devices. Users shouldalso agree to use the designed application and to take part in the experiments;
• implementing a communication protocol between devices. In a personal device, severalapplications can degrade the device performance. This can be overcome by using lightweightapplication protocols that improve smartphone performance in terms of bandwidth consump-tion, battery lifetime, and communication latency [36];
• managing communication delays due to the transmission of remote information: the com-munication on smartphones is bandwidth-limited and relatively expensive, especially whenaccess to the network is achieved via cellular connection [43];
• verifying that the data acquired by the devices are correct and that there are no anomaliesthat could prevent the proper functioning of the system. In this way, having data beenperceived from devices functioning properly, it is possible to validate the results obtained bythe proposed technique;
• building a consistent database for evaluating the results obtained from the system deployedin a real context: this requires continuous monitoring of the environment from both ad hocdevices and smartphones. However, smartphones functioning depends on the will of itsowner: the device is turned on/off according to non-controllable patterns, therefore it is notpossible to exert strict control [43].
These factors are independent of the functioning of the system, have no direct consequences inits operation and parameters.
Contribution
Contribution to IoT
The IoT is an indispensable component in the development of sustainable and technological ad-vances. The development of smart objects having sensing, communication and actuating capabilitieshave seen an accelerated growth. Such network-enabled smart objects have numerous applicationsin the areas such as environment monitoring [125].
141 Dynamic Learning of the Environment for Eco-Citizen Behavior

CONCLUSIONS
Our contribution is an important advance in IoT technology: it is possible to couple IoT deviceswith cooperation mechanisms that allow them to operate no longer independently but jointly, thuscontributing to the achievement of smartness and sustainable development goals.
The cooperation mechanism discussed in this thesis allows compensating the action of a sensorthat is temporarily not available or malfunctioning. The advantage of cooperation in IoT devices istwofold: (i) it can be implemented as a resilience technique for devices that can encounter unpre-dictable malfunctions and (ii) it is possible to reduce the number of sensors to deploy in the urbanenvironment, thus reducing the maintenance and installation costs necessary for implementingsensors networks.
Contribution to AMAS
This thesis proved that the AMAS approach is relevant for the development of distributed systemsin the urban environment able to manage its complexity, continuous and unpredictable evolution.
Although the state of the art is rich in innovative and heterogeneous techniques that can beintegrated into the urban environments, these solutions often have limitations in functionalityor ability to adapt to the environmental context. The AMAS approach enabled us to develop asystem for the estimation of missing environmental information by addressing the properties ofopenness, large scale and heterogeneity through a mechanism of cooperation between agents. Theseproperties have not been addressed simultaneously by the state of the art methods.
The most relevant contribution to AMAS concerns the openness property. Until now theproperty of openness has not been treated accurately. In the proposed approach, the intermittenceof sensing devices enables simulating the openness property. Moreover, the openness propertyallows including multiple sensing devices in the estimation process. This thesis has shown, througha concrete application, that it is possible to define AMAS in which the boundaries of the system arenot specified a priori and in which sensing devices (opportunely agentified) can easily enter or leavethe system without any particular configuration.
Weyns et al. [146] state the following (about openness): ”Living in an environment, perceiving it,and being affected by it intrinsically imply openness. Software systems are no longer isolated but becomepermeable subsystems, whose boundaries permit reciprocal side effects. The reciprocal influence betweensystem and environment is often extreme and complex, making it difficult to identify clear boundaries betweenthe system and its environment.” In the same article, the authors show interest in the challenge ofopenness as this ”enables a system to adjust itself dynamically to uncertainty in the environment, tasks,and availability of resources.”. This thesis has shown, through the design of HybridIoT, that it ispossible to design an AMAS to addresses the property of openness, therefore integrating itself inenvironments with a high degree of uncertainty and continuously evolving.
Dynamic Learning of the Environment for Eco-Citizen Behavior 142

6.6. DISCUSSION 143
Perspectives
HybridIoT opens a wide range of opportunities in different applications.An emerging challenge in Intelligent Transport Systems (ITSs) is the exploitation of data collected
from a large amount of mobile and fixed devices. In large-scale environments, it is necessary touse technological means to identify patterns in mobility, how individuals interact between themand with the environment. The continuous development of cities must face today issues related tocongestions and high rates of accidents. Through the integration of sensors, vehicles can collecta large quantity of Floating Car Data (FCD) which refers to the collection of vehicle position andkinematics data (e.g., speed, direction of travel). These data are used to get traffic informationthrough ITS applications [71]. To monitor the environment, urban sensing approaches can beapplied to a fleet of connected vehicles [10, 90] using them as mobile sensors. The proposed methoduses a method based on HybridIoT to map the environment through FCD. At the time this thesis iswritten, a paper discussing a proposition of a solution to address this challenge is under review inan international journal.
Another application of HybridIoT takes place in the smart building context. Smart buildings, likesmart cities, are truly complex systems [98]. Common applications of smart buildings involve energymanagement, modelling of occupant behaviour, and user comfort [130]. HybridIoT can be usedto measure the correlations between sensors to provide experts with automatic information aboutthe building state. Studying how sensors are correlated or uncorrelated allows to detect variationsof behaviour in the building that might be indicative of an anomaly such as a malfunctioningair conditioning system, or a window that remained open during the night [70]. Because thoseanomalies can occur unexpectedly, the correlations must be processed in real-time (i.e. within fixedtime constraints). At the time this thesis is written, a paper discussing a solution to address thischallenge has been submitted to an international conference.
The work carried out in this thesis aimed at defining a technique for estimating missing infor-mation by integrating heterogeneous information. The perspectives in the context of explicabilityare the following:
• (short term) to deduce (or better, explain) the state of environmental resources (doors, win-dows, etc.) without using a priori semantic knowledge, based only on information perceivedand eventually estimated by agents.
• (long term) use the information deduced by the agents about the state of environmentalresources to recommend ”eco-friendly” behaviors and gestures to users, to optimize theconsumption of environmental resources.

Part IV
Appendices
144

Appendix AClassical Methods for Estimating MissingInformation
THE estimation of missing information has undergone constant evolution over the years due tothe development of mathematical techniques and AI. The use of both mathematical tools and
AI enables the design of effective systems for the estimation of missing information.
When designing a system for estimating missing information, it is important to choose the rightestimation technique: each one has its advantages and disadvantages: neural networks are powerfultools with learning capabilities, they need reconfiguration and a variable number of parameters thatdepend on the application context; regression techniques are fast but have no learning capabilities.Moreover, for the design of such systems on a large scale, it is necessary to choose the techniquebased on several factors: the devices and information, the mobility of the sensors, the possibilityof the system reconfiguration. There is no ”best” technique to use, no technique is better than theothers. The system designer must eventually choose according to the needs that arise from theapplication context.
The estimation techniques are usually classified as univariate and multivariate: the first typemanipulates datasets where only one variable is present, using only non-missing values in theavailable dimension; multivariate analysis uses multiple variables in the feature dimensions to esti-mate the missing values. The solution proposed in this thesis is multivariate, therefore capableof using variables, in different dimensions, to estimate a missing value of a certain type.
This appendix presents the main techniques for estimating missing information. These tech-niques are divided in two categories: mathematical and AI techniques. The rest of the chapter isorganized as follows: section A.1 introduces the main mathematical tools for estimating missinginformation. Section A.2 presents the main AI-based tools for estimating missing information.
145

146 APPENDIX A. CLASSICAL METHODS FOR ESTIMATING MISSING INFORMATION
A.1 Mathematical Techniques
A.1.1 Mean Estimation
Mean estimation is the most simple approach to estimate missing data. Given a dataset of informa-tion, missing data are estimated by calculating the mean of the existing values. Estimating values atthe center of the distribution reduces the variability of the data, therefore the standard deviationand the variance of the resulting dataset are attenuated [41].
Mean imputation is a fast and simple fix for the missing data. However, it will underestimate thevariance and disturb the relations between variables: correlations and covariances are attenuatedby mean estimation because the data is enriched with information that is uncorrelated with othervariables in the dataset [41]. Therefore, the mean estimation technique should be used only as arapid fix when a handful of values are missing, and it should be avoided in general [136].
Figure A.1 shows the plot of a sequence of values and the estimated sequence using the mean.
14
16
18
20
22
24
26
28
1 6 11 16 21 26 31 36 41 46
REAL ESTIMATED
Figure A.1: A series of data and its estimate. The latter have been obtained by estimating the 50% ofpoints by a moving average with a window size of 10 samples.
Calculating a missing value by averaging does not consider all the available information, butonly the data close to the missing value to provide a more accurate estimate as close as possible tothe real one. In Figure A.1, a window containing 10 information is used to estimate the missingvalues using a limited number of samples. This technique is known as moving average and considersa subset of information to estimate a missing sample.

A.1. MATHEMATICAL TECHNIQUES 147
A.1.2 Regression Estimation
Regression analysis is a mathematical tool used to describes the relationship between independentand dependent variables. Regression analysis allows to estimate missing data by using modelsconstructed from the available information. With respect to the mean imputation, the regressionimputation has the advantage of preserving the shape of data distribution.
Usually, performing regression analysis consists of two steps: the first step involves building amodel from the observed data. Estimates for the incomplete or missing information are calculatedunder the fitted model [136]; the second step is to calculate estimates for the missing variablesusing the regression models. The estimates for the missing information are calculated under thefitted model. The variable with missing data is used as the dependent variable, whereas the bestpredictors are selected as independent variables.
14
16
18
20
22
24
26
28
1 6 11 16 21 26 31 36 41 46
ESTIMATED REAL
Figure A.2: The line describing the trend of the sample points have been obtained through a linearregression model.
Consider the set of points shown in Figure A.2. A regression model is defined as linear if it ispossible to define a line such that the distance between the points and the line is minimized. Alinear regression model is defined as follows:
Yi = β0 + β1Xi + ui (A.1)
where:
• i is the index of observations, i = 1, . . . , n
• Yi is the dependent variable;
• Xi is the independent variable (or regressor);
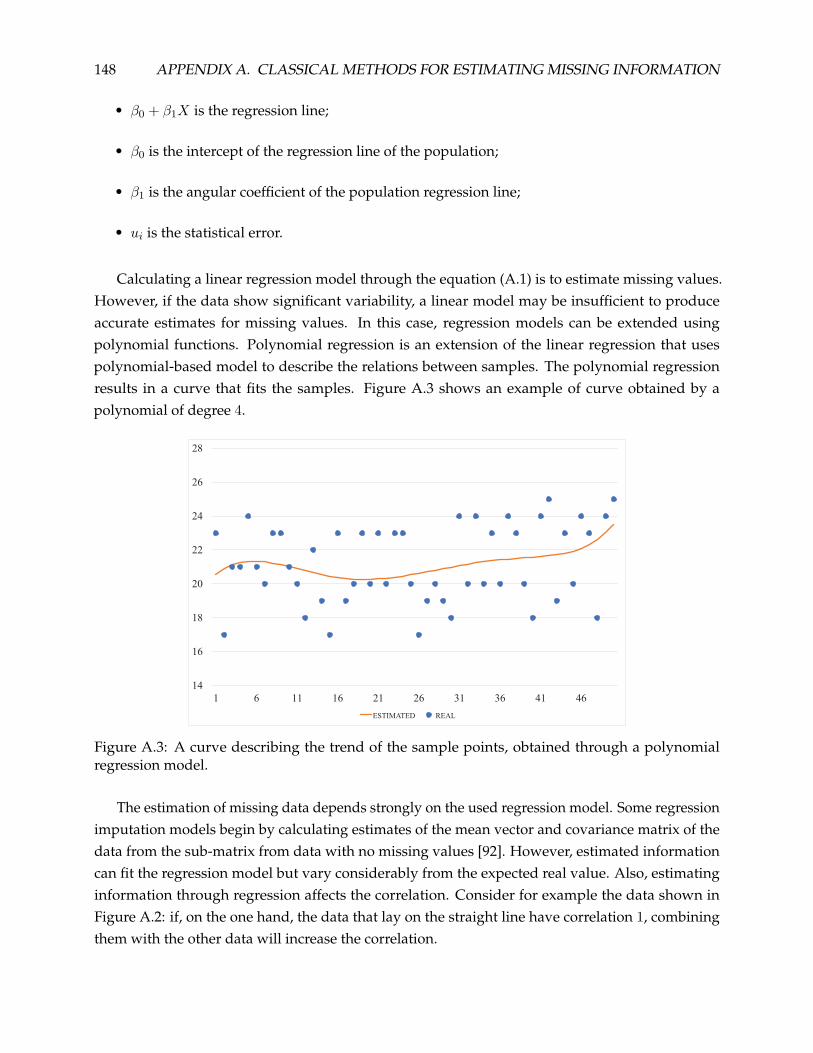
148 APPENDIX A. CLASSICAL METHODS FOR ESTIMATING MISSING INFORMATION
• β0 + β1X is the regression line;
• β0 is the intercept of the regression line of the population;
• β1 is the angular coefficient of the population regression line;
• ui is the statistical error.
Calculating a linear regression model through the equation (A.1) is to estimate missing values.However, if the data show significant variability, a linear model may be insufficient to produceaccurate estimates for missing values. In this case, regression models can be extended usingpolynomial functions. Polynomial regression is an extension of the linear regression that usespolynomial-based model to describe the relations between samples. The polynomial regressionresults in a curve that fits the samples. Figure A.3 shows an example of curve obtained by apolynomial of degree 4.
14
16
18
20
22
24
26
28
1 6 11 16 21 26 31 36 41 46
ESTIMATED REAL
Figure A.3: A curve describing the trend of the sample points, obtained through a polynomialregression model.
The estimation of missing data depends strongly on the used regression model. Some regressionimputation models begin by calculating estimates of the mean vector and covariance matrix of thedata from the sub-matrix from data with no missing values [92]. However, estimated informationcan fit the regression model but vary considerably from the expected real value. Also, estimatinginformation through regression affects the correlation. Consider for example the data shown inFigure A.2: if, on the one hand, the data that lay on the straight line have correlation 1, combiningthem with the other data will increase the correlation.

A.2. ARTIFICIAL INTELLIGENCE TECHNIQUES 149
A.1.3 Discussion
The mean estimation and the regression analysis presented in the previous section are two ofthe simplest methods for estimating missing values. Their description, although simplistic andnot exhaustive, introduces the reader to concrete solutions to solve the problem of estimatingmissing values. Nevertheless, it is beyond the objectives of this thesis to discuss exhaustively all thedevelopments concerning, above all, regression analysis. However, it is necessary to underline thatover the last few years several models based on regression analysis have been proposed that allowpredicting accurately missing values [143, 89, 86].
The next section introduces some AI-based techniques that can be used for estimating missinginformation.
A.2 Artificial Intelligence Techniques
A.2.1 Neural Networks
McCulloch and Pitts described a model of the neural activity that could be carried out by machines.This model is based on the use of a simple thresholding function which influences a ”fire” activityof the neuron [95]. Let f(·) be the function that represents a neuron’s behavior (expressed as amathematical function) and β the ”activity level” of the neuron; the activation function of a neuroncan be formalized as follows:
f(·) =
1 if β ≥ 00 if β < 0
A multitude of neurons can be grouped to form a properly connected network. Neural networksare particularly useful for solving problems that cannot be expressed as a series of steps, such asrecognizing patterns, classification, series prediction, and data mining [66]. Therefore, neural net-works are usually employed in application domains where are required computational mechanismsthat are as similar as possible to the activity of the human brain.
In a neural network, the input of a neuron is the result of the weighted sum of the outputactivities passed along from other neurons. Each neuron is connected to other neurons by ”synapses”that can amplify or diminish the signal that is being forwarded [95].
In real applications, neural networks can be made up of hundreds of neurons, grouped by”levels” or ”layers”, each one containing a certain number of neurons connected to the neuronsof the next level. Levels are generally grouped into three categories: input level, output level andhidden level. Each level contains a collection of neurons collected to the next level in the networkand uses a mathematical function to transform the input values and pass the output to the nextlevel.
The learning ability of neural networks was introduced in 1986 by Rumelhart et al. [117], who

150 APPENDIX A. CLASSICAL METHODS FOR ESTIMATING MISSING INFORMATION
introduced the back-propagation learning procedure. The idea behind the back-propagation is thatthe network automatically adjusts the weights of the connections between neurons so that thedifference between the expected result and the output result of the network is minimized. Thanksto the back-propagation algorithm, a network composed of multiple levels can perform complextasks that require learning capacities. Each layer in a network applies a given function of the outputof the previous layer to perform a specific task. For example, a neural network for the recognitionof human faces could have one level for edges recognition, one level for identifying the eyes, thenext one for identifying the shape of the lips, etc. The idea of having multiple layers consists ofdividing a complex task into several sub-problems, each of which is performed by a given layer ofthe network.
Different types of neural networks have been proposed in the last years, each one with uniquefeatures that make them effective in different application domains. The next section presents aparticular architecture of neural networks known as Radial Basis Function neural Network (RBFN),which can be applied for the estimation of missing information.
A.2.2 Radial Basis Function Networks
Radial Basis Function Networks (RBFNs) are a particular family of neural networks composed of twolevels of neurons. The main feature of RBFNs is the neurons’ activation function. The input of aneuron in the hidden level is the sum of the distance between the input pattern and the ”center”of the basis function, usually a Gaussian function. The output of a RBFN is a scalar function ofthe input vector [154]. Figure A.4 shows the basic structure of a RBFN. The input vector is ann-dimensional vector that the network has to classify, and the relative weights are presented to theRBF neurons. The second is a hidden layer consisting of several RBF non-linear activation units,which functions are conventionally implemented as Gaussian functions [45]. The output scoresgiven by the output nodes are computed by calculating a weighted sum of the activation values ofthe RBF neurons.
RBFN are effective for regression and function approximation [87]. In particular, RBFNs can beused to determine the underlying trend of an environmental series of information and accuratelyestimate missing values.
A.2.3 Soft-Sensor
Soft-sensor or virtual sensor is a common name for a software where several measurements areprocessed together. The interaction of the signals can be used for calculating or to estimate newquantities that cannot be measured. A virtual sensor is a conceptual device whose output or inferredvariable can be modeled in terms of other parameters that are relevant to the same process [57].
Soft-sensor is often used to overcome the problem of on-line estimation of process variables byintegrating AI techniques such as Artificial Neural Networks (ANN). ANNs have been shown to

A.2. ARTIFICIAL INTELLIGENCE TECHNIQUES 151
Input
Radial Basis Functions
Weights
Output (sum)
Linear weights
Figure A.4: The structure of a RBFN.
be an adequate choice because they can receive real-time readings of several process variables aswell as feedback signals of downstream on-line analyzers for the target property. Once trained, thisvirtual sensor uses real time measurements of the selected process variables to infer the missingvalue [57].
A.2.4 Fuzzy Rules
Fuzzy rules define hyper-rectangles that act as intervals in high dimensional spaces, used to definea degree of membership of input data. For each new pattern, a learning algorithm checks if the datais covered by existing hyper-rectangles, conversely a new fuzzy rule is created to define the classcontaining the given data. If a new data is incorrectly covered by an existing fuzzy rule, the fuzzypoint’s support-region is reduced so that the conflict is avoided. [127]. Then a fuzzy classificationprocess computes a degree of matching for each sample and a corresponding input pattern by usingthe fuzzy rules. Different membership functions can be employed when dealing with numericaldatasets [14].
Different prediction models based on fuzzy logic have been made for predicting environmentalinformation [114, 111]. In these solutions each observation is analyzed subsequently and a set offuzzy rules is inserted or modified accordingly.
A.2.5 Random Forest Regression
Regression trees are a popular class of machine learning algorithms. They are robust against outliersand are flexible enough to fit interactions and non linear relations between data [136]. Regressiontrees consist of a series of data splitting rules, starting at the top of the tree. The construction of aregression tree involves two steps:
1. divide the set of valuesX1, X2, ..., Xp into J distinct and non-overlapping regionsR1, R2, ..., RJ ,

152 APPENDIX A. CLASSICAL METHODS FOR ESTIMATING MISSING INFORMATION
that could have any shape;
2. a new estimate is calculated for every observation that falls into the region Rj . The estimate iscalculated as the mean of the observations in the j-th region Rj .
Considering every possible partition of the feature space in J regions is computationally expen-sive. For this reason, a top-down, greedy approach is usually used, which splits each region intotwo separate regions, starting from the one containing all the observation [73]. The criterion used toseparate a region is based on the minimization of RSS (Residual Sum of Squares), a measure of thedifference between the data and an estimation model, defined as follow:
RSS =J∑j=1
∑i∈Rj
(yi − yRj )2 (A.2)
where yRj is the mean response for the training observations within the j-th box. The processcontinues until a stopping criterion is reached (for example, the algorithm stops until no regioncontains more than five samples). Once all the regions R1, ..., RJ have been created, the responsefor missing data is calculated using the mean of the training observations in the region to whichthat test observation belongs [73].
Figure A.5 shows an example of subdivision of a set of observations. At first, a tree is created bysplitting the data according to their features. Then, the regions are created according to the branchesof the regression tree.
X2<0.3
X1<0.8X1<0.8
X1<0.48 X1<0.9
X2<0.46
0.8 0.5
0.41.00.1
0.8 0.3
(a)
0
0,2
0,4
0,6
0,8
1,0
0 0,2 0,4 0,6 0,8 1,0
X1
X2
(b)
Figure A.5: A regression tree (Figure A.5a) and the corresponding regions (Figure A.5b).

A.2. ARTIFICIAL INTELLIGENCE TECHNIQUES 153
A.2.6 Gradient Boost Decision Trees
Boosting assumes the availability of a base or weak learning algorithm which, given labeled trainingexamples, produces a base or weak classifier. The goal of boosting is to improve the performance ofthe weak learning algorithm while treating it as a ”black box” which can be called repeatedly, like asubroutine, but whose inner learning algorithms cannot be observed or manipulated [121].
A boosting algorithm takes as input a set of training examples (x1, y1), ..., (xm, ym) where eachxi is an instance from X , and each yi is the associated label or class. In the simplest case there areonly two classes, −1 and +1.
A boosting algorithm learns from the data by calling multiple time the base learning algorithm.However, if the base learner is simply called repeatedly with the same set of training data, wecannot expect anything interesting to happen; instead, we expect the same, or nearly the same,base classifier to be produced over and over again, so that little is gained over running the baselearner just once. Therefore, to improve the base learning, the boosting algorithm must in someway manipulate the data that it feeds to it [121].
The key idea behind boosting is to choose training sets for the base learner in such a fashion asto force it to infer something new about the data each time it is called. This can be accomplished bychoosing training sets on which we can reasonably expect poor performance using the base learningalgorithm. If this can be accomplished, then we can expect the base learner to output a new baseclassifier which is significantly different from its predecessors. This is because, although we thinkof the base learner as a weak and mediocre learning algorithm, we nevertheless expect it to outputclassifiers that make nontrivial predictions [121].
Boosting algorithms thus train different models in a sequential manner which result in a decisiontree, each one modified sequentially to best fit the input data. Figure A.6 shows an illustrationpresenting the idea behind the boosting algorithm.
Gradient boosting is a particular version of the boosting techniques that uses the gradient of theloss function to calculate the weights to be given as input to each weak learner when building eachnew model. Gradient boosting is particularly suitable for regression and classification problems: inthis context, we want to predict values so to minimize a loss or error function. By using gradientdescent and updating our predictions based on a learning rate, we can find the values where erroris minimum.
The gradient boosting technique allows to avoid misclassification and obtain accurate results.The gradient boosting allows to improve the machine learning algorithm by running it sequentiallyon the observations and modifying the weights in an appropriate way to improve the performance.In other words, at each trial the predictor learns from the mistake of the previous predictors.

154 APPENDIX A. CLASSICAL METHODS FOR ESTIMATING MISSING INFORMATION
Figure A.6: The boosting technique trains many weak models in a gradual and sequential manner,which result in a strong learner, capable of providing precise classification results.

Appendix BThe ADELFE Methodology
TODAY several agent-oriented methodologies exist. Some of the most recognized methodolo-gies are ASPECS [30], PASSI [29], TROPOS [19], GAIA [153], Prometheus [148] and so on.
However, these methodologies are not suited to handle complexity, dynamics, openness, or soft-ware adaptation. To respect these properties, specifics to the development of AMAS, the ADELFEmethodology has been proposed. ADELFE is the french acronym for ”Atelier de Developpement deLogiciel a Fonctionnalite Emergente” which can be translated by Toolkit for Designing Software withEmergent Functionalities.
ADELFE is based on the Rational Unified Process (RUP) and includes five Work Definitions(WD) [17]:
• WD1 - Preliminary requirements;
• WD2 - Final requirements;
• WD3 - Analysis;
• WD4 - Design;
• WD5 - Implementation.
B.1 WD1 - Preliminary Requirements
This phase represents a description of specifications between customers, users and designers. Theresult of this phase is a document containing a precise description of the problem without usingany particular modeling language. In this phase no specific modelling language is used. Four rolesare involved at this stage [17]:
155

156 APPENDIX B. THE ADELFE METHODOLOGY
• Final User: he is responsible for defining both functional and non-functional requirements list,used to define the system and its environment;
• Client: his main role is to validate product documents drawn up by experts approving therequirements;
• Software Analyst: his role consists in giving a definition for the main concepts used to describethe system and its environment;
• Business Analyst: his role consists in defining the business concept and the relationshipsbetween them. He also describes formally what are the business activities, what are theproducts provided or required and who are the responsible persons of these activities.
The Preliminary Requirements Phase generates five work products (text document includingtextual description and/or diagrams) which are listed in Table B.1.
Table B.1: The five kind of work products from WD1 phase [17].
Name Description Work Product Kind
Users Requirements SetTextual description of the functional and non functionalrequirements
Free Text
ConsensualRequirement Set
Textual description composed of consensual requirements Free Text
Business ModelA document composed of: 1) a diagram modelling thedomain-specific data structure; 2) a diagram showingthe workflow of activities performed by thebusiness actors
Composite (Structuraland Behavioural)
Glossary A glossary of terms Free Text
Constraints SetTextual description composed of the limits and constraintsof the system
Free Text
B.2 WD2 - Final requirements
In this work definition, the preliminary requirements are transformed to use cases. Also, thiswork definition characterize the environment of the system, by identifying the entities that interactwith the system and the constraints on these interactions. The Business Analyst gives a detaileddescription of the system environment: he is responsible of use cases identification drawingdiagrams that represent the interactions between actors and the system. After identifying the usecases, the client is responsible for validate product documents and approving the use cases. Then,MAS specialist verify the pursues three activities that consist in (1) the characterization of the systemenvironment according to Russel and Norvig definition [118], (2) the identification of the possible”bad” interactions between the actors and the system, (3) the analysis of the previous results tojustify the MAS use [17].
The verification of the adequacy of MAS is crucial for the ADELFE methodology: becausenot all the applications require the MAS approach for their realization, it is necessary to answer

B.3. WD3 - ANALYSIS 157
the question ”a traditional (Object-Oriented) approach sufficient to solve the problem or has the problemsome characteristics which implies MAS approach for the solving?”. Figure B.1 shows the flow of tasksnecessary to verify the MAS adequacy.
Figure B.1: Flow of tasks necessary to verify the MAS adequacy according to the ADELFE method-ology.
Table B.2 reports the five types of work products resulting from phase WD2.
Table B.2: The four kind of work products from WD2 phase [17].
Name Description Work Product Kind
System EnvironmentStructure
A textual description describing the actors which interact with thesystem and the possible constraints. Moreover, this documentcontains a brief text of actors description.
Free Text
System EnvironmentBehavior
A document composed of: 1) a use case diagram representing actorsand the functionalities assigned to them; 2) a structured text descriptionof the actors; 3) diagrams representing the interactions between theactors and the system
Composite (Structuraland Behavioural andFree text)
MAS qualification
A text document composed by the description of the environment accordingthe Russel and Norvig definition, the description of ”bad” interactionbetween actors and system and the justification of animplementation that using a MAS is needed
Free Text
UI PrototypeThis document is composed by the GUIs description through which theuser(s) interact with the system and the links between the GUIs.
Free Text
B.3 WD3 - Analysis
The Analysis phase aims at identifying the system structure and justifying the AMAS adequacy.This phase enables to analyse the domain characteristics, determine the agents and validate anAMAS approach at the global and local level. Two roles are involved in the Analysis Phase [17]:
• MAS Analyst: his role consists in identifying the entities of the system and identifying theirinteractions. Also, his role consists in identifying the agents, their autonomy, goals andnegotiation abilities.

158 APPENDIX B. THE ADELFE METHODOLOGY
• AMAS Analyst: his role consists in dealing with the AMAS principles; this concerns theidentification of (cooperative) agents, how they determine the cooperation failures that canoccur between entities and then to define the agents regarding the results of previous steps.
The entities of an AMAS are differentiated into two categories [17]:
• Active entity: an active entity is given behavioural autonomy, allowing it to change statewithout necessarily interacting with another entity. An active entity can interact with otherentities, possibly through communication mediums;
• Passive entity: passive entities are associated to resources or data. Passive entities have nobehaviors, they can only be perceived and eventually modified by active entities. A statetransition can only be the result of an interaction with another system component.
The two main activities of this phase consist in veryfing the adequacy of AMAS at global andlocal level [17]:
• Global level: In this activity, the adequacy at the global level is studied to answer the question”is an AMAS required to implement the system?”. This is done throw several simple questionsrelated the global level. The ADELFE method provides a tool based on a questionnaire toassess the adequacy of the AMAS approach to our problem (Figure B.2). This adequacy isstudied both at the system and local level (the level of the different parts composing thesystem) [12].
At global level, the following criteria are used to verify the adequecy of AMAS [13]:
1. Is the global task incompletely specified? Is an algorithm a priori unknown?
2. Is the correlated activity of several entities needed to solve the problem?
3. Is the solution generally obtained by repetitive tests? Are different attempts requiredbefore finding a solution?
4. Can the system environment evolve? Is it dynamic?
5. Is the system functionally or physically distributed? Are several physically distributedcomponents needed to solve the global task? Or is a conceptual distribution needed?
6. Does a great number of components needed?
7. Is the studied system non-linear?
8. Finally, is the system evolutionary or open? Can new components appear or disappeardynamically?
• Local level: In this activity, the AMAS adequacy is studied at the local level to determinethe agents that need to be implemented as AMAS. And at the component level, three morecriteria are used [13]:

B.4. WD4 - DESIGN 159
Figure B.2: ADELFE’s tool used to assess the pertinence of the AMAS approach for the HybridIoTsystem.
1. Does a component have only a limited rationality?
2. Is a component “big” or not? Is it able to do many actions, to reason a lot? Does it needsignificant abilities to perform its own task?
3. Can the behaviour of a component evolve? Does it need to adapt to the changes of itsenvironment?
Table B.3 reports the four work products generated from the Analysis phase.
B.4 WD4 - Design
In this phase are defined the interaction protocols between agents as well as their behaviors (nominaland cooperative). This activity results in a complete characterization of the MAS. Three roles areinvolved in the Design Phase [17]:
• Architectural Designer: his role consists in defining a precise architecture of the systems interms of modules

160 APPENDIX B. THE ADELFE METHODOLOGY
Table B.3: The four kind of work products from WD3 phase [17].
Name Description Work Product Kind
System AnalysisA document composed of: 1) a textual description of theentities described as active or passive; 2) diagramsdepicting the interactions between entities.
Composite (Free Text andBehavioural)
Global AMASAdequacy Synthesis
This document stores the answers to the questionsregarding the global level about an implementationusing an AMAS.
Structured Text
Agent Extraction
This document supplements the System Analysis documentwith: 1) the definition of the goal, the study of autonomyand the negotiation abilities for each active entity; 2) thelist of the cooperation failure interactions between entitiesor between entity and its environment; 3) the definition ofthe cooperative agent and the AMAS system diagramwhich represents them.
Composite (Free Text andBehavioural)
Local AMASAdequacy Synthesis
This document completes the Global AMAS adequacysynthesis with the answers to the questions regardingthe local level about an implementation using an AMAS.
Structured Text
• MAS Designer: his role consists in defining how the entities and the agents interact togetheror with their own environment.
• AMAS Designer: his role consists in defining the cooperative behavior of entities, defin-ing skills, aptitudes, an interaction language, a world representation, a criticality and thecharacteristics of the agents. Also, his goal consists in testing the behavior of the agents.
Table B.4 reports the six work products generated from the Design phase.
B.5 WD5 - Implementation
This phase aims at providing the designed system. Two roles are involved in the ImplementationPhase [17]:
• AMAS Framework Developer: his goal consists in describing the system architecture andimplementing everything that is not an agent.
• AMAS Developer: his goal consists in implementing the agents’ behavior, their nominal andcooperative behaviors.
Table B.5 reports the six work products generated from the Design phase.
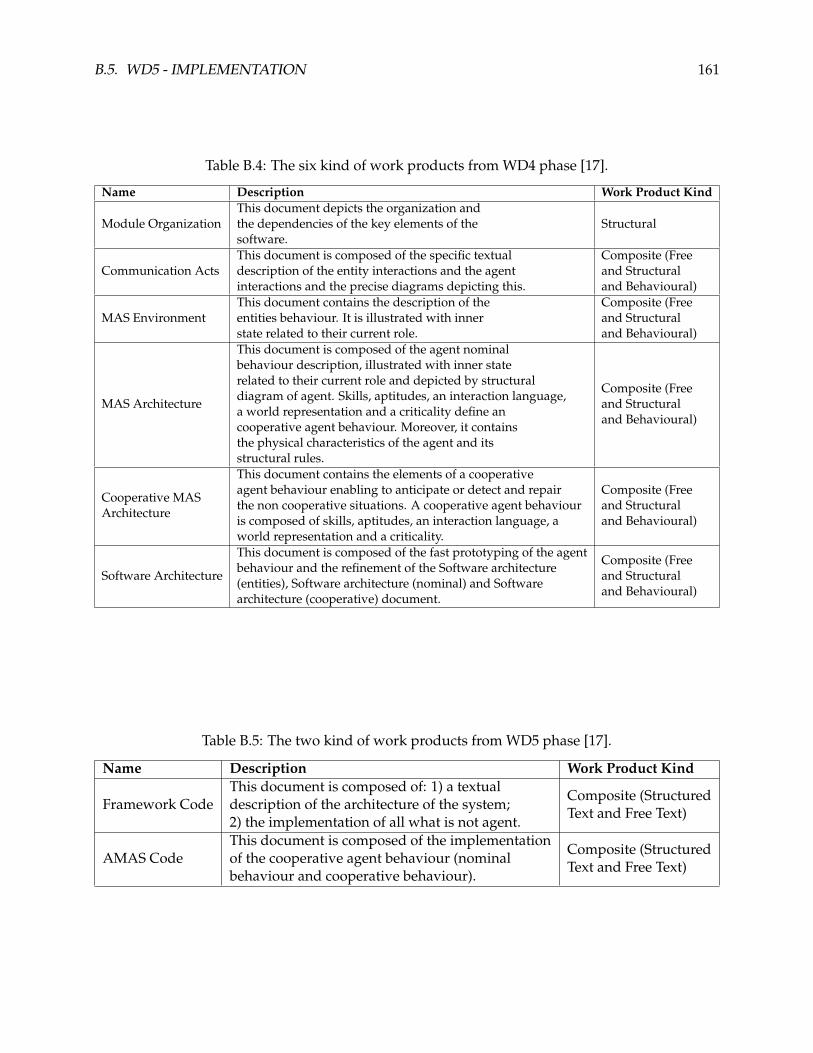
B.5. WD5 - IMPLEMENTATION 161
Table B.4: The six kind of work products from WD4 phase [17].
Name Description Work Product Kind
Module OrganizationThis document depicts the organization andthe dependencies of the key elements of thesoftware.
Structural
Communication ActsThis document is composed of the specific textualdescription of the entity interactions and the agentinteractions and the precise diagrams depicting this.
Composite (Freeand Structuraland Behavioural)
MAS EnvironmentThis document contains the description of theentities behaviour. It is illustrated with innerstate related to their current role.
Composite (Freeand Structuraland Behavioural)
MAS Architecture
This document is composed of the agent nominalbehaviour description, illustrated with inner staterelated to their current role and depicted by structuraldiagram of agent. Skills, aptitudes, an interaction language,a world representation and a criticality define ancooperative agent behaviour. Moreover, it containsthe physical characteristics of the agent and itsstructural rules.
Composite (Freeand Structuraland Behavioural)
Cooperative MASArchitecture
This document contains the elements of a cooperativeagent behaviour enabling to anticipate or detect and repairthe non cooperative situations. A cooperative agent behaviouris composed of skills, aptitudes, an interaction language, aworld representation and a criticality.
Composite (Freeand Structuraland Behavioural)
Software Architecture
This document is composed of the fast prototyping of the agentbehaviour and the refinement of the Software architecture(entities), Software architecture (nominal) and Softwarearchitecture (cooperative) document.
Composite (Freeand Structuraland Behavioural)
Table B.5: The two kind of work products from WD5 phase [17].
Name Description Work Product Kind
Framework CodeThis document is composed of: 1) a textualdescription of the architecture of the system;2) the implementation of all what is not agent.
Composite (StructuredText and Free Text)
AMAS CodeThis document is composed of the implementationof the cooperative agent behaviour (nominalbehaviour and cooperative behaviour).
Composite (StructuredText and Free Text)

Glossary
• MCS – Mobile Crowd Sensing
• IoT – Internet Of Things
• ICT – Information and Communication Technology
• GPS – Global Positioning System
• HVAC – Heating, Ventilation and Air-Conditioning
• AI – Artificial Intelligence
• AmI – Ambient Intelligence
• NCS – Non Cooperative Situation
• MAS – Multi-Agent System
• ADELFE – Atelier de Developpement de Logiciels a Fonctionnalite Emergente (toolkit to
develop software with emergent functionality)
• AMAS – Adaptive Multi-Agent System
• ROI – Region Of Interest
• ACA Ambient Context Agent
• RSA Real Sensor Agent
• ACW Ambient Context Window
162

Own Bibliography
[1] D. A. Guastella, V. Camps, and M.-P. Gleizes. Estimating Missing Environmental Informa-tion by Contextual Data Cooperation. In M. Baldoni, M. Dastani, B. Liao, Y. Sakurai, andR. Zalila Wenkstern, editors, PRIMA 2019: Principles and Practice of Multi-Agent Systems, pages523–531. Springer, 2019. doi: 10.1007/978-3-030-33792-6 37.
[2] D. A. Guastella, V. Camps, and M.-P. Gleizes. Multi-agent Systems for Estimating Missing Infor-mation in Smart Cities. In Proceedings of the 11th International Conference on Agents and ArtificialIntelligence - Volume 2: ICAART, pages 214–223. SciTePress, 2019. doi: 10.5220/0007381902140223.
[3] D. A. Guastella, V. Camps, and M.-P. Gleizes. A Cooperative Multi-Agent System for CrowdSensing Based Estimation in Smart Cities. IEEE Access, 8:183051–183070, 2020. doi: 10.1109/AC-CESS.2020.3028967.
[4] D. A. Guastella and C. Valenti. Estimating Missing Information by Cluster Analysis andNormalized Convolution. In 2018 IEEE 4th International Forum on Research and Technology forSociety and Industry (RTSI), pages 1–6, 2018. doi: 10.1109/RTSI.2018.8548454.
163
Bibliography
[5] P. K. Agarwal, J. Gurjar, A. K. Agarwal, and R. Birla. Application of artificial intelligence for de-velopment of intelligent transport system in smart cities. International Journal of TransportationEngineering and Traffic System, 1(2):20–30, 2015.
[6] E. Al Nuaimi, H. Al Neyadi, N. Mohamed, and J. Al-Jaroodi. Applications of big data tosmart cities. Journal of Internet Services and Applications, 6(1):25, 2015.
[7] G. Albanese, M. Cipolla, and C. Valenti. Genetic Normalized Convolution. In InternationalConference on Image Analysis and Processing, volume 6978 of Lecture Notes in Computer Science,pages 670–679. Springer, 2011.
[8] A. Aliberti, F. M. Ugliotti, L. Bottaccioli, G. Cirrincione, A. Osello, E. Macii, E. Patti, andA. Acquaviva. Indoor air-temperature forecast for energy-efficient management in smartbuildings. In 2018 IEEE International Conference on Environment and Electrical Engineering and2018 IEEE Industrial and Commercial Power Systems Europe (EEEIC / I CPS Europe), pages 1–6,2018.
[9] Z. Allam and Z. A. Dhunny. On big data, artificial intelligence and smart cities. Cities, 89:80 –91, 2019.
[10] A. Anjomshoaa, S. Mora, P. Schmitt, and C. Ratti. Challenges of drive-by IoT sensing for smartcities: City scanner case study. In Proceedings of the 2018 ACM International Joint Conference and2018 International Symposium on Pervasive and Ubiquitous Computing and Wearable Computers -UbiComp ’18, pages 1112–1120. ACM, 2018.
[11] B. Baccarne, P. Mechant, and D. Schuurman. Empowered cities? an analysis of the structureand generated value of the smart city ghent. In R. P. Dameri and C. Rosenthal-Sabroux,editors, Smart City: How to Create Public and Economic Value with High Technology in UrbanSpace, pages 157–182. Springer, 2014.
164

BIBLIOGRAPHY 165
[12] C. Bernon, V. Camps, M.-P. Gleizes, and G. Picard. Tools for self-organizing applicationsengineering. In G. Di Marzo Serugendo, A. Karageorgos, Omer F. Rana, and F. Zambonelli,editors, Engineering Self-Organising Systems, pages 283–298. Springer, 2004.
[13] C. Bernon, V. Camps, M.-P. Gleizes, and G. Picard. Engineering adaptive multi-agent systems.In Agent-Oriented Methodologies, pages 172–202. IGI Global, 2005.
[14] M. R. Berthold. Mixed fuzzy rule formation. International Journal of Approximate Reasoning(Elsevier), 32(2):67–84, 2003.
[15] M. R. Berthold, N. Cebron, F. Dill, T. R. Gabriel, T. Kotter, T. Meinl, P. Ohl, K. Thiel, andB. Wiswedel. KNIME - the konstanz information miner: Version 2.0 and beyond. ACMSIGKDD Explorations Newsletter, 11(1):26–31, 2009. doi: 10.1145/1656274.1656280.
[16] M. R. Berthold and K.-P. Huber. Missing values and learning of fuzzy rules. Interna-tional Journal of Uncertainty, Fuzziness and Knowledge-Based Systems, 06(2):171–178, 1998. doi:10.1142/S021848859800015X.
[17] N. Bonjean, W. Mefteh, M. P. Gleizes, C. Maurel, and F. Migeon. ADELFE 2.0. In M. Cossentino,V. Hilaire, A. Molesini, and V. Seidita, editors, Handbook on Agent-Oriented Design Processes,pages 19–63. Springer, 2014.
[18] L. Braubach, A. Pokahr, D. Moldt, and W. Lamersdorf. Goal Representation for BDI Agent Sys-tems. In R.H. Bordini, M. Dastani, J. Dix, and A. El Fallah Seghrouchni, editors, ProgrammingMulti-Agent Systems. ProMAS 2004, pages 44–65. Springer, 2005.
[19] P. Bresciani, A. Perini, P. Giorgini, F. Giunchiglia, and J. Mylopoulos. Tropos: An agent-oriented software development methodology. Autonomous Agents and Multi-Agent Systems,8(3):203–236, 2004.
[20] B. Bruegge and A. H. Dutoit. Object-Oriented Software Engineering Using UML, Patterns, andJava. Prentice Hall, 3rd edition, 2010.
[21] D. Capera. Systemes multi-agents adaptatifs pour la resolution de problemes: Application a laconception de mecanismes. These de doctorat, Universite Paul Sabatier, Toulouse, France, juin2005.
[22] D. Capera, J.-P. George, M.-P. Gleizes, and P. Glize. The AMAS theory for complex problemsolving based on self-organizing cooperative agents. In WET ICE 2003. Proceedings. TwelfthIEEE International Workshops on Enabling Technologies: Infrastructure for Collaborative Enterprises,2003., pages 383–388, 2003. ISSN: 1080-1383.
[23] E. Cavalcante, N. Cacho, F. Lopes, T. Batista, and F. Oquendo. Thinking smart cities assystems-of-systems: A perspective study. In Proceedings of the 2nd International Workshop onSmart, SmartCities ’16, New York, NY, USA, 2016. ACM.

166 BIBLIOGRAPHY
[24] X. Chen, J.-H. Jung, and A. Gelb. Finite Fourier Frame Approximation Using the InversePolynomial Reconstruction Method. Journal of Scientific Computing, pages 1–21, 2018.
[25] Giovanni Ciatto, M. I. Schumacher, A. Omicini, and D. Calvaresi. Agent-based explanations inAI: Towards an abstract framework. In D. Calvaresi, A. Najjar, M. Winikoff, and K. Framling,editors, Explainable, Transparent Autonomous Agents and Multi-Agent Systems, volume 12175,pages 3–20. Springer, 2020.
[26] F. Cicirelli, G. Fortino, A. Giordano, A. Guerrieri, G. Spezzano, and A. Vinci. On the design ofsmart homes: A framework for activity recognition in home environment. Journal of MedicalSystems, 40(9):200, 2016.
[27] A. Cocchia. Smart and digital city: A systematic literature review. In R. P. Dameri andC. Rosenthal-Sabroux, editors, Smart City: How to Create Public and Economic Value with HighTechnology in Urban Space, pages 13–43. Springer, 2014.
[28] E. Cosgrave, T. Tryfonas, and T. Crick. The smart city from a public value perspective. In ICTfor Sustainability 2014 (ICT4S-14), pages 369–377. Atlantis Press, 2014.
[29] M. Cossentino. From requirements to code with PASSI methodology. In Agent-OrientedMethodologies, pages 79–106. IGI Global, 2012.
[30] M. Cossentino, N. Gaud, V. Hilaire, S. Galland, and A. Koukam. ASPECS: an agent-orientedsoftware process for engineering complex systems: How to design agent societies under aholonic perspective. Autonomous Agents and Multi-Agent Systems, 20(2):260–304, 2010.
[31] R. P. Dameri. Searching for smart city definition: a comprehensive proposal. InternationalJournal of Computers & Technology, 11(5):2544–2551, 2013.
[32] R. P. Dameri. The Conceptual Idea of Smart City: University, Industry, and Government Vision,pages 23–43. Springer, 2017.
[33] R. P. Dameri. Smart city definition, goals and performance. In Smart City Implementation:Creating Economic and Public Value in Innovative Urban Systems, pages 1–22. Springer, 2017.
[34] R. P. Dameri and C. Rosenthal-Sabroux. Smart city and value creation. In R. P. Dameri andC. Rosenthal-Sabroux, editors, Smart City: How to Create Public and Economic Value with HighTechnology in Urban Space, pages 1–12. Springer, 2014.
[35] D. Davies and D. Bouldin. A Cluster Separation Measure. IEEE Trans. Pattern Anal. Mach.Intell., 1(2):224–227, 1979.
[36] N. De Caro, W. Colitti, K. Steenhaut, G. Mangino, and G. Reali. Comparison of two lightweightprotocols for smartphone-based sensing. In 2013 IEEE 20th Symposium on Communications andVehicular Technology in the Benelux (SCVT), pages 1–6, 2013. ISSN: 2373-0854.

BIBLIOGRAPHY 167
[37] R. Der and G. Martius. Self-Organization in Nature and Machines, pages 9–21. Springer, 2012.
[38] G. Di Marzo Serugendo, M.-P. Gleizes, and A. Karageorgos. Self-organising systems. InG. Di Marzo Serugendo, M.-P. Gleizes, and A. Karageorgos, editors, Self-organising Software,pages 7–32. Springer, 2011.
[39] Dimensions. Dimensions.AI. Available at https://app.dimensions.ai/discover/publication (2020/06/22).
[40] J. Dutta, C. Chowdhury, S. Roy, A. I. Middya, and F. Gazi. Towards smart city: Sensing airquality in city based on opportunistic crowd-sensing. In Proceedings of the 18th InternationalConference on Distributed Computing and Networking, ICDCN ’17, New York, NY, USA, 2017.ACM. doi: 10.1145/3007748.3018286.
[41] C. K. Enders. Applied Missing Data Analysis. Guildford Press, 2010.
[42] A. K. Ettinger, I. Chuine, B. I. Cook, J. S. Dukes, A. M. Ellison, M. R. Johnston, A. M. Panetta,C. R. Rollinson, Y. Vitasse, and E. M. Wolkovich. How do climate change experiments alterplot-scale climate? Ecology Letters, 22(4):748–763, 2019.
[43] A. Faggiani, E. Gregori, L. Lenzini, V. Luconi, and A. Vecchio. Smartphone-based crowdsourc-ing for network monitoring: Opportunities, challenges, and a case study. IEEE CommunicationsMagazine, 52(1):106–113, 2014.
[44] X. Fang, S. Misra, G. Xue, and D. Yang. Smart grid — the new and improved power grid: Asurvey. IEEE Communications Surveys Tutorials, 14(4):944–980, 2012.
[45] H. Faris, I. Aljarah, and S. Mirjalili. Evolving radial basis function networks using moth–flameoptimizer. In P. Samui, S. Sekhar, and V. E. Balas, editors, Handbook of Neural Computation,pages 537 – 550. Academic Press, 2017.
[46] J. Ferber. Multi-agent systems: an introduction to distributed artificial intelligence, volume 1.Addison-Wesley, 1999.
[47] G. Fortino, W. Russo, C. Savaglio, W. Shen, and M. Zhou. Agent-oriented cooperative smartobjects: From IoT system design to implementation. IEEE Transactions on Systems, Man, andCybernetics: Systems, 48(11):1939–1956, 2018.
[48] A. Foucquier, S. Robert, F. Suard, L. Stephan, and A. Jay. State of the art in building modellingand energy performances prediction: A review. Renewable and Sustainable Energy Reviews,23:272–288, 2013.
[49] D. Freedman and P. Diaconis. On the histogram as a density estimator:l2 theory. Zeitschriftfur Wahrscheinlichkeitstheorie und Verwandte Gebiete (Springer), 57(4):453–476, 1981. doi:10.1007/BF01025868.

168 BIBLIOGRAPHY
[50] J. H. Friedman. Greedy function approximation: A gradient boosting machine. The Annals ofStatistics, 29(5):1189–1232, 2001. doi: 10.1214/aos/1013203451.
[51] G. Gan, C. Ma, and J. Wu. Data Clustering: Theory, Algorithms and Applications. Statistics andApplied Probability. SIAM, 2007.
[52] A. Garro, M. Muhlhauser, A. Tundis, S. Mariani, A. Omicini, and G. Vizzari. Intelligent agentsand environment. In Encyclopedia of Bioinformatics and Computational Biology, pages 309–314.Elsevier, 2019.
[53] J.-P. George, M.-P. Gleizes, and V. Camps. Cooperation. In G. Di Marzo Serugendo, M.-P. Gleizes, and A. Karageorgos, editors, Self-organising Software: From Natural to ArtificialAdaptation, pages 193–226. Springer, 2011.
[54] J.-P. George, M.-P. Gleizes, P. Glize, and C. Regis. Real-time Simulation for Flood Forecast:an Adaptive Multi-Agent System STAFF. In Symposium on Adaptive Agents and Multi-AgentSystems (AISB 2003), University of Wales, Aberystwyth, 07/04/03-11/04/03, pages 109–114. Societyfor the Study of Artificial Intelligence and the Simulation of Behaviour, 2003.
[55] M.-P. Gleizes, J. Boes, B. Lartigue, and F. Thiebolt. neOCampus: A demonstrator of connected,innovative, intelligent and sustainable campus. In G. De Pietro, L. Gallo, R. J. Howlett, andL. C. Jain, editors, Intelligent Interactive Multimedia Systems and Services 2017, volume 76, pages482–491. Springer, 2018.
[56] M.-P. Gleizes, V. Camps, and P. Glize. A Theory of Emergent Computation based on Coopera-tive Self-organization for Adaptive Artificial Systems. In Fourth European Congress of SystemsScience, Valencia Spain, 20/09/99-24/09/99, 1999.
[57] J.C.B. Gonzaga, L.A.C Meleiro, C. Kiang, and R. Maciel Filho. ANN-based soft-sensor forreal-time process monitoring and control of an industrial polymerization process. Computers& Chemical Engineering, 33(1):43–49, 2009.
[58] D.G. Green, S. Sadedin, and T.G. Leishman. Self-organization. In Encyclopedia of Ecology,pages 3195–3203. Elsevier, 2008.
[59] L. Greengard and J.-Y. Lee. Accelerating the Nonuniform Fast Fourier Transform. SIAMReview, 46(3):443–454, 2004.
[60] J. Guerrero-Ibanez, S. Zeadally, and J. Contreras-Castillo. Sensor technologies for intelligenttransportation systems. Sensors, 18(4):1212, 2018.
[61] J. D. Hamilton. Time Series Analysis. Princeton University Press, 1994.
[62] A. Hamzi, M. Koudil, J.-P. Jamont, and M. Occello. Multi-agent architecture for the design ofWSN applications. Wireless Sensor Network, 05(2):14–25, 2013.
BIBLIOGRAPHY 169
[63] G. Hanrahan. Artificial Neural Networks in Biological and Environmental Analysis. AnalyticalChemistry. CRC Press, 1 edition, 2017.
[64] D. Hasenfratz, O. Saukh, C. Walser, C. Hueglin, M. Fierz, T. Arn, J. Beutel, and L. Thiele.Deriving high-resolution urban air pollution maps using mobile sensor nodes. Pervasive andMobile Computing, 16:268–285, 2015.
[65] I. A. T. Hashem, V. Chang, N. B. Anuar, K. Adewole, I. Yaqoob, A. Gani, E. Ahmed, andH. Chiroma. The role of big data in smart city. International Journal of Information Management,36(5):748–758, 2016.
[66] J. Heaton. Introduction to Neural Networks with Java. Heaton Research, Inc., 2 edition, 2008.
[67] T. K. Ho. Random decision forests. In Proceedings of 3rd International Conference on Doc-ument Analysis and Recognition, volume 1, pages 278–282 vol.1, 1995. doi: 10.1109/IC-DAR.1995.598994.
[68] A. Hodges. Alan Turing: The Enigma. Princeton University Press, 2014.
[69] A. R. Honarvar and A. Sami. Towards sustainable smart city by particulate matter predictionusing urban big data, excluding expensive air pollution infrastructures. Big Data Research,17:56 – 65, 2019. doi: 10.1016/j.bdr.2018.05.006.
[70] M. Houssin, S. Combettes, M.-P. Gleizes, and B. Lartigue. SANDMAN: a Self-Adapted Systemfor Anomaly Detection in Smart Buildings Data Streams. In (to appear in) Proceedings of the18th Adaptive Computing (and Agents) for Enhanced Collaboration (ACEC) at WETICE 2020, 2020.
[71] W. Huber, M. Ladke, and R. Ogger. Extended floating-car data for the acquisition of trafficinformation. In Proceedings Of 6th World Congress On Intelligent Transport Systems (ITS), HeldToronto, Canada, November 8-12, 1999, 1999.
[72] Information Commissioner’s Office (ICO). Guide to the environmental infor-mation regulations. Available at https://ico.org.uk/for-organisations/
guide-to-the-environmental-information-regulations/ (2020-10-7), 2017.
[73] G. James, D. Witten, T. Hastie, and R. Tibshirani. An Introduction to Statistical Learning, volume103 of Springer Texts in Statistics. Springer, 2013.
[74] V. Julian and V. Botti. Multi-agent systems. Applied Sciences, 9(7):1402, 2019.
[75] J. Junttila. Structural breaks, ARIMA model and finnish inflation forecasts. InternationalJournal of Forecasting, 17(2):203 – 230, 2001. doi: 10.1016/S0169-2070(00)00080-7.
[76] J.O. Kephart and D.M. Chess. The vision of autonomic computing. Computer, 36(1):41–50,2003.
170 BIBLIOGRAPHY
[77] H. Knutsson and C.-F. Westin. Normalized and differential convolution. In Computer Visionand Pattern Recognition, pages 515–523. IEEE, 1993.
[78] A. Kobren, N. Monath, A. Krishnamurthy, and A. McCallum. A hierarchical algorithm forextreme clustering. In International Conference on Knowledge Discovery and Data Mining, pages255–264. ACM, 2017.
[79] X. Kong, X. Liu, B. Jedari, M. Li, L. Wan, and F. Xia. Mobile crowdsourcing in smart cities:Technologies, applications, and future challenges. IEEE Internet of Things Journal, 6(5):8095–8113, 2019.
[80] M. Kuhn and K. Johnson. Applied Predictive Modeling. Springer, 2013. doi: 10.1007/978-1-4614-6849-3.
[81] K. Kumar, M. Parida, and V.K. Katiyar. Short term traffic flow prediction for a non urbanhighway using artificial neural network. Procedia - Social and Behavioral Sciences, 104:755 – 764,2013. 2nd Conference of Transportation Research Group of India (2nd CTRG).
[82] P. Kumar, Y. Lin, G. Bai, A. Paverd, J. S. Dong, and A. Martin. Smart grid metering networks:A survey on security, privacy and open research issues. IEEE Communications Surveys Tutorials,21(3):2886–2927, 2019.
[83] G. C. Lazaroiu and M. Roscia. Definition methodology for the smart cities model. Energy(Elsevier), 47(1):326 – 332, 2012.
[84] E. L. Lehmann and G. Casella. Theory of Point Estimation. Springer Texts in Statistics. Springer,1998.
[85] S. Lemouzy. Systemes interactifs auto-adaptatifs par systemes multi-agents auto-organisateurs :application a la personnalisation de l’acces a l’information. Phd thesis, Universite Toulouse III -Paul Sabatier, 2011.
[86] T. Liu, H. Wei, and K. Zhang. Wind power prediction with missing data using gaussianprocess regression and multiple imputation. Applied Soft Computing, 71:905 – 916, 2018.
[87] J. Luengo, S. Garcıa, and F. Herrera. A study on the use of imputation methods for experi-mentation with radial basis function network classifiers handling missing attribute values:The good synergy between rbfns and eventcovering method. Neural Networks, 23(3):406 – 418,2010.
[88] Y. Ma, S. Liu, G. Xue, and D. Gong. Soft sensor with deep learning for functional regiondetection in urban environments. Sensors, 20(12):3348, 2020.
[89] S. Maldonado, A. Gonzalez, and S. Crone. Automatic time series analysis for electric loadforecasting via support vector regression. Applied Soft Computing, 83:105616, 2019.

BIBLIOGRAPHY 171
[90] G. Marcillaud, V. Camps, S. Combettes, M.-P. Gleizes, and E. Kaddoum. Management ofintelligent vehicles: Comparison and analysis. In A. P. Rocha, L. Steels, and H. J. van denHerik, editors, Proceedings of the 12th International Conference on Agents and Artificial Intelligence,ICAART 2020, Volume 1, Valletta, Malta, February 22-24, 2020, pages 258–265. SCITEPRESS,2020.
[91] F. Marvasti. Nonuniform Sampling. Theory and Practice. Information Technology: Transmission,Processing and Storage. Kluwer Academic/Plenum Publishers, 2001.
[92] T. Marwala. Computational Intelligence for Missing Data Imputation, Estimation, and Management:Knowledge Optimization Techniques. IGI Global, 2009.
[93] F. Mateo, J. J. Carrasco, A. Sellami, M. Millan-Giraldo, M. Domınguez, and E. Soria-Olivas. Ma-chine learning methods to forecast temperature in buildings. Expert Systems with Applications,40(4):1061 – 1068, 2013.
[94] S. Mellouli, L. Luna-Reyes, and J. Zhang. Smart government, citizen participation and opendata. Information Polity (IOS press), 19:1–4, 2014.
[95] Z. Michalewicz and D. B. Fogel. How to Solve It: Modern Heuristics. Springer.
[96] T. Munakata. Fundamentals of the New Artificial Intelligence: Neural, Evolutionary, Fuzzy andMore. Texts in Computer Science. Springer, 2 edition, 2008.
[97] M. Negnevitsky. Artificial Intelligence: A Guide to Intelligent Systems. Addison-Wesley, 1stedition, 2001.
[98] J. Nigon, N. Verstaevel, J. Boes, F. Migeon, and M.-P. Gleizes. Smart is a matter of context.In International and Interdisciplinary Conference on Modeling and Using Context, pages 189–202.Springer, 2017.
[99] V. Noel and F. Zambonelli. Following the problem organisation: A design strategy forengineering emergence. In D. Camacho, L. Braubach, S. Venticinque, and C. Badica, editors,Intelligent Distributed Computing VIII, pages 311–317. Springer, 2015.
[100] Tomoaki O. A smart city based on ambient intelligence. IEICE Transactions on Communications,E100.B(9):1547–1553, 2017.
[101] A. Olaru, A. M. Florea, and A. El Fallah Seghrouchni. A context-aware multi-agent system asa middleware for ambient intelligence. Mobile Networks and Applications, 18(3):429–443, 2013.
[102] OpenStreetMap contributors. Planet dump retrieved from https://planet.osm.org. Availableat https://www.openstreetmap.org (2020-10-7), 2017.

172 BIBLIOGRAPHY
[103] S.-V. Oprea and A. Bara. Machine learning algorithms for short-term load forecast in resi-dential buildings using smart meters, sensors and big data solutions. IEEE Access, 7:177874–177889, 2019.
[104] Y. Pan, D. Wu, and D. L. Olson. Online to offline (o2o) service recommendation method basedon multi-dimensional similarity measurement. Decision Support Systems, 103:1–8, 2017.
[105] C. Perera, A. Zaslavsky, P. Christen, and D. Georgakopoulos. Sensing as a service modelfor smart cities supported by internet of things. Transactions on Emerging TelecommunicationsTechnologies, 25(1):81–93, 2014. 10.1002/ett.2704.
[106] T. Pham and L. van Vliet. Normalized Averaging Using Adaptive Applicability Functionswith Applications in Image Reconstruction from Sparsely and Randomly Sampled Data. InImage Analysis, pages 485–492. Springer, 2003.
[107] T. Pham, L. van Vliet, and K Schutte. Robust Fusion of Irregularly Sampled Data UsingAdaptive Normalized Convolution. Journal on Advances in Signal Processing, pages 1–12, 2006.
[108] F. Piette, C. Caval, C. Dinont, A. El Fallah-Seghrouchni, and P. Tailliert. A Multi-agentSolution for the Deployment of Distributed Applications in Ambient Systems. In EngineeringMulti-Agent Systems, pages 156–175. Springer, 2016.
[109] S. Pirttikangas, Y. Tobe, and N. Thepvilojanapong. Smart environments for occupancy sensingand services. In H. Nakashima, H. Aghajan, and J. C. Augusto, editors, Handbook of AmbientIntelligence and Smart Environments, pages 825–849. Springer, 2010.
[110] I. Pisa, I. Santın, J. Vicario, A. Morell, and R. Vilanova. ANN-based soft sensor to predicteffluent violations in wastewater treatment plants. Sensors, 19(6):1280, 2019.
[111] J. Plouffe. The fuzzy logic method for simpler forecasting. International Journal of EngineeringBusiness Management, 3, 08 2011.
[112] Singh R. P., Javaid M., Haleem A., and Suman R. Internet of things (IoT) applications tofight against COVID-19 pandemic. Diabetes & Metabolic Syndrome: Clinical Research & Reviews,14(4):521 – 524, 2020.
[113] M. Rafsanjani, Z. Varzaneh, and N. Chukanlo. A Survey Of Hierarchical Clustering Algo-rithms. Journal of Mathematics and Computer Science, 5(3):229–240, 2012.
[114] S. Revathi and N. Sivakumaran. Fuzzy based temperature control of greenhouse. IFAC-PapersOnLine, 49(1):549 – 554, 2016. 4th IFAC Conference on Advances in Control andOptimization of Dynamical Systems ACODS 2016.

BIBLIOGRAPHY 173
[115] S. Rougemaille, J.-P. Arcangeli, M.-P. Gleizes, and F. Migeon. ADELFE design, AMAS-ML inaction. In A. Artikis, G. Picard, and L. Vercouter, editors, Engineering Societies in the AgentsWorld IX: 9th International Workshop, ESAW 2008, Saint-Etienne, France, September 24-26, 2008,Revised Selected Papers, pages 105–120. Springer, 2009.
[116] D. B. Rubin. Inference and missing data. Biometrika, 63(3):581–592, 1976.
[117] D. E. Rumelhart, G. E. Hinton, and R. J. Williams. Learning representations by back-propagating errors. Nature, 323(6088):533–536, 1986.
[118] S. Russell and P. Norvig. Artificial Intelligence: A Modern Approach. Prentice Hall, 3 edition,2010.
[119] L. Sabatucci and M. Cossentino. Supporting dynamic workflows with automatic extraction ofgoals from BPMN. ACM Transactions on Autonomous and Adaptive Systems, 14(2):1–38, 2019.
[120] R. Sanchez-Corcuera, A. Nunez Marcos, J. Sesma-Solance, A. Bilbao-Jayo, R. Mulero, U. Zu-laika, G. Azkune, and A. Almeida. Smart cities survey: Technologies, application domainsand challenges for the cities of the future. International Journal of Distributed Sensor Networks,15(6), 2019.
[121] R. E. Schapire and Y. Freund. Boosting: Foundations and Algorithms. Adaptive Computationand Machine Learning. The MIT Press, 2012.
[122] V. Seal, A. Raha, S. Maity, S. Kumar Mitra, A. Mukherjee, and M. K. Naskar. A Simple FloodForecasting Scheme Using Wireless Sensor Networks. International Journal of Ad hoc, Sensor &Ubiquitous Computing (AIRCC), 3(1), feb 2012.
[123] Z. Shan, Y. Xia, P. Hou, and J. He. Fusing incomplete multisensor heterogeneous data toestimate urban traffic. IEEE MultiMedia, 23(3):56–63, 2016-07.
[124] A. Sharif, J. P. Li, and M. A. Saleem. Internet of things enabled vehicular and ad hoc networksfor smart city traffic monitoring and controlling: a review. International Journal of AdvancedNetworking and Applications, 10(3):3833–3842, 2018.
[125] A. Sinha, P. Kumar, N. P. Rana, R. Islam, and Y. K. Dwivedi. Impact of internet of things(IoT) in disaster management: a task-technology fit perspective. Annals of Operations Research,283(1):759–794, 2019.
[126] A. Solanas, C. Patsakis, M. Conti, I. S. Vlachos, V. Ramos, F. Falcone, O. Postolache, P. A. Perez-martinez, R. D. Pietro, D. N. Perrea, and A. Martinez-Balleste. Smart health: A context-awarehealth paradigm within smart cities. IEEE Communications Magazine, 52(8):74–81, 2014.

174 BIBLIOGRAPHY
[127] V. Soler, J. Cerquides, J. Sabria, J. Roig, and M. Prim. A method to classify data by fuzzyrule extraction from imbalanced datasets. In Proceedings of the 2006 conference on ArtificialIntelligence Research and Development, pages 55–62. IOS Press, 2006.
[128] S. K. Sood, R. Sandhu, K. Singla, and V. Chang. IoT, big data and HPC based smart floodmanagement framework. Sustainable Computing: Informatics and Systems, 20:102 – 117, 2018.doi: 10.1016/j.suscom.2017.12.001.
[129] B. Spencer, O. Alfandi, and F. Al-Obeidat. A refinement of lasso regression applied totemperature forecasting. Procedia Computer Science, 130:728–735, 2018.
[130] B. L. R. Stojkoska and K. V. Trivodaliev. A review of internet of things for smart home:Challenges and solutions. Journal of Cleaner Production, 140:1454 – 1464, 2017.
[131] The Shift Project. Lean ICT: Towards Digital Sobriety. Available at https:
//theshiftproject.org/wp-content/uploads/2019/03/Lean-ICT-Report_
The-Shift-Project_2019.pdf (2020/10/09).
[132] R. Tibshirani, G. Walther, and T. Hastie. Estimating the number of clusters in a data setvia the gap statistic. Journal of the Royal Statistical Society: Series B (Statistical Methodology),63(2):411–423, 2001.
[133] D. Tomaras, V. Kalogeraki, N. Zvgouras, N. Panagiotou, and D. Gunopulos. Evaluatingthe health state of urban areas using multi-source heterogeneous data. In 2018 IEEE 19thInternational Symposium on ”A World of Wireless, Mobile and Multimedia Networks”, pages 14–22,2018. doi: 10.1109/WoWMoM.2018.8449761.
[134] A. M. Townsend. Smart Cities: Big Data, Civic Hackers, and the Quest for a New Utopia. W. W.Norton & Company, 2013.
[135] A Turing. Lecture to the london mathematical society on 20 february 1947. published inamturing’s ace report of 1946 and other papers’, 1947.
[136] S. van Buuren. Flexible Imputation of Missing Data. Chapman and Hall/CRC, 2012.
[137] N. Verstaevel, J. Boes, J. Nigon, D. d’Amico, and M.-P. Gleizes. Lifelong machine learningwith adaptive multi-agent systems. In 9th Conference on Agents and Artificial Intelligence, pages275–286. SciTePress, 2017.
[138] J. Viterbo, L. Mazuel, Y. Charif, M. Endler, N. Sabouret, K. Breitman, A. El Fallah-Seghrouchni,and J. Briot. Ambient intelligence: Management of distributed and heterogeneous contextknowledge. CRC Studies in Informatics Series. Chapman & Hall, pages 1–44, 2008.

BIBLIOGRAPHY 175
[139] B. Walczak and D.L. Massart. The radial basis functions - partial least squares approach as aflexible non-linear regression technique. Analytica Chimica Acta, 331(3):177–185, 1996. doi:10.1016/0003-2670(96)00202-4.
[140] J.-B. Waldner. Nanocomputers and swarm intelligence. Wiley, 2013.
[141] K. I.-K. Wang, W. H. Abdulla, and Z. Salcic. Ambient intelligence platform using multi-agentsystem and mobile ubiquitous hardware. Pervasive and Mobile Computing, 5(5):558–573, 2009.
[142] Y. Wang and I. H. Witten. Modeling for optimal probability prediction. In Proceedings of theNineteenth International Conference on Machine Learning, pages 650–657. Morgan Kaufmann,2002.
[143] Y. Wang, Z. Xie, Q. Hu, and S. Xiong. Correlation aware multi-step ahead wind speedforecasting with heteroscedastic multi-kernel learning. Energy Conversion and Management,163:384 – 406, 2018.
[144] M. Weiser and J. S. Brown. Designing calm technology. Powergrid Journal, 1, 1996.
[145] G. Weiss. Multiagent Systems: A Modern Approach to Distributed Artificial Intelligence. The MITPress, 2000.
[146] D. Weyns and F. Michel. Agent environments for multi-agent systems – a research roadmap.In D. Weyns and F. Michel, editors, Agent Environments for Multi-Agent Systems IV, pages 3–21.Springer, 2015.
[147] D. Weyns, A. Omicini, and J. Odell. Environment as a first class abstraction in multiagentsystems. Autonomous Agents and Multi-Agent Systems, 14(1):5–30, 2006.
[148] M. Winikoff and L. Padgham. The prometheus methodology. In F. Bergenti, M.-P. Gleizes, andF. Zambonelli, editors, Methodologies and Software Engineering for Agent Systems, volume 11,pages 217–234. Kluwer Academic Publishers, 2004.
[149] I. H. Witten, F. Eibe, and M. A. Hall. Data Mining: Practical Machine Learning Tools andTechniques. Elsevier, 2011. doi: 10.1016/C2009-0-19715-5.
[150] M. Wooldridge. An Introduction to MultiAgent Systems. Wiley, 2 edition, 2009.
[151] W. B. Wu, M. Woodroofe, and G. Mentz. Isotonic regression: Another look at the changepointproblem. Biometrika, 88(3):793–804, 10 2001. doi: 10.1093/biomet/88.3.793.
[152] L. Yu, N. Wang, and X. Meng. Real-time forest fire detection with wireless sensor networks.In Proceedings. 2005 International Conference on Wireless Communications, Networking and MobileComputing, 2005., volume 2, pages 1214–1217, 2005.

176 BIBLIOGRAPHY
[153] F. Zambonelli, N. R. Jennings, and M. Wooldridge. Developing multiagent systems: The gaiamethodology. ACM Transactions on Software Engineering and Methodology, 12(3):317–370, 2003.
[154] L. Zhang and P.N. Suganthan. A survey of randomized algorithms for training neuralnetworks. Information Sciences, 364-365:146–155, 2016.
[155] Y. Zhang and A. Haghani. A gradient boosting method to improve travel time prediction.Transportation Research Part C: Emerging Technologies, 58:308 – 324, 2015. Big Data in Trans-portation and Traffic Engineering.
[156] J. Y. Zhu, C. Sun, and V. O. K. Li. Granger-causality-based air quality estimation with spatio-temporal (s-t) heterogeneous big data. In 2015 IEEE Conference on Computer CommunicationsWorkshops, pages 612–617, 2015. doi: 10.1109/INFCOMW.2015.7179453.