Embed Size (px)
Citation preview

Page 2 Source: Company, www.dynamiclevels.com
JK Tyre & Industries Limited - India’s First and Only Tyre Superbrand
Company Overview 3
Product 4
Comapany Financial 5
Balance sheet 6
Cash Flow 7
Shareholding Pattern 8
Peer Comparison 9
Indian Tyre Industry 10
Investment Rationale 11

Page 3 Source: Company, www.dynamiclevels.com
JK Tyre & Industries Limited
JK Tyre is a part of the century-old JK Organisation, one of India’s leading private sector conglomerates with a multi product, multi location and multi business operations. The company’s manufacturing operations comprise 12 modern plants strategically located across the country – Mysuru, Banmore, Kankroli, Chennai and Haridwar. The company has 141 JK Tyre selling points pan-India which service the growing needs of more than 4000 dealers.
It is one of the India’s leading tyre companies present in all tyre segments. The company enjoys the highest market share in truck/bus radials in India. It is amongst the largest players in India’s truck bias and passenger car segments as well. The company is a proffered supplier to all leading Original Equipment Manufacturers like Maruti Suzuki, Tata Motors, Honda, Hyundai, Ashok Leyland, Mahindra and Mahindra, Volvo Eicher, General Motors, Volkswagen, Fiet, Nissan, TAFE, BEML and Caterpillar India, among others.
JK Tyre has also enhanced its global reach recently by taking over Tornel, a renowned Mexican company, which has 3 plants in Mexico. All of these plants are equipped with the world’s most advanced manufacturing and testing machines.
Tata Coffee Share Price Performance
EXCHANGE SYMBOL JKTYRE
Current Price * (Rs.) 152.75
Face Value (Rs.) 2.00
52 Week High (Rs.) 161.40(06-Oct-16)
52 Week Low (Rs.) 73.80(29-Feb-16)
Life Time high (Rs.) 163.00(19-Dec-14)
Life Time low (Rs.) 5.12(12-Mar-09)
Average Daily Movement [ADM]
5.24
Average Volume [20 days]
3682516
1 Month Return (%) 7.33
P/E Ratio (x) 7.11
Book Value 77.09
Market Cap 3551.90(Cr) % of Promoter holding pledged
NIL
COMPANY PROFILE OF JK TYRE
Date of Incorporation 14-Feb-51
Date of Listing 3-Nov-94
Management
Name Designation
Raghupati Singhania Chairman & Managing Director
Vimal Bhandari Director
Shreekant Somany Director
Kalpataru Tripathy Director
Bakul Jain Director
Arvind Singh Mewar Director
Wolfgang Holzbach Director
Sunanda Singhania Director
Bharat Hari Singhania Managing Director
Arun K Bajoria President & Director
Anshuman Singhania Whole Time Director
Registered Office Address
JayKaygram, PO – Tyre Factory,313342 Kankroli, Rajasthan, India
Website
http://www.jktyre.com

Page 4 Source: Company, www.dynamiclevels.com
Product
Passenger Car Tyres
JK Tyre is the pioneer of Radial Technology in India. It was the first company to launch radials in the passenger car segment way back in 1977. With a vast experience and understanding of operating conditions in India, JK Tyre brings you the best technology for your cars & SUVs.
Two Three Wheeler Tyres
JK Tyre, is a brand known for its excellence in the field of technology & customer acceptance, and with the recent acquisition of Cavendish Industries Ltd., it is the only company in India to have 9 manufacturing facilities all over India & 3 overseas.
Farm Tyres Farmers are very important assets for a country like India, where 73% of the population is still living in villages, and agriculture contributes 17% to the national GDP.JK Tyre has always yearned to produce the best products for their customers, keeping in view the demand of Indian farmers and Indian agricultural conditions. They help the farmers get more from tyres so that they can contribute more to national growth. That’s why JK Tyre is the first choice of some of the largest tractor manufacturers of India like Mahindra & Mahindra, John Deere and TAFE.
Off the road Tyres As is known, JK Tyre is a leading manufacturer of Ultra Large Off the Road tyres (OTRs), and has pioneered the manufacture of India’s largest tyre size – 40.00-57 , 12 ft in diameter, weighing approximately 3700 kg’s, for high end rear dump trucks of 240 TONS capacity.
Commercial Tyres Every JK Truck Bus Bias (TBB) Tyre that is rolled out furthers the legacy of JK Tyre being a dominant player in the Indian Commercial Vehicle Tyres segment. JK Tyre is the pioneer in introducing Truck Radial technology in India in the Commercial Tyre segment way back in 1999. Since then, JK Tyre has been a leader in the domestic market and is a dominant player in the O.E. segment with approval of supplies to almost all OEMs including Tata Motors, Ashok Leyland, Eicher, Bharat Benz, AMW, Volvo, etc.
JK Yyre increased its tyre
manufacturing capacity across
select categories.
JK Tyre accelerated cost
rationalization to enhance
competitiveness.
JK Tyre retained its leadership
in the truck and bus radial
(TBR) segment.
The company is increasing its
sales volume single year –
across the last four years.
The company’s credit rating
has been progressively
upgraded by leading credit
rating agencies.
Long term facilities: CARE AA-
(earlier CARE A+).
Short-term facilities: CARE A1+(earlier CARE A1).
Page 5 Source: Company, www.dynamiclevels.com
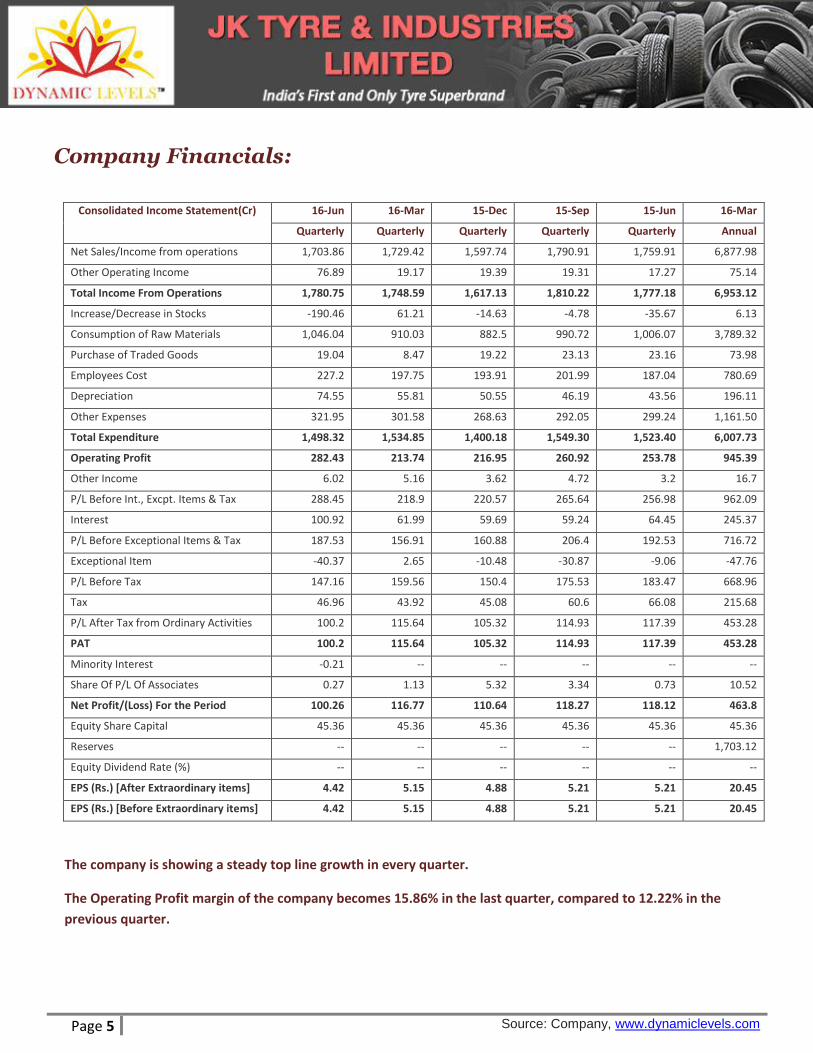
Company Financials:
Consolidated Income Statement(Cr) 16-Jun 16-Mar 15-Dec 15-Sep 15-Jun 16-Mar
Quarterly Quarterly Quarterly Quarterly Quarterly Annual
Net Sales/Income from operations 1,703.86 1,729.42 1,597.74 1,790.91 1,759.91 6,877.98
Other Operating Income 76.89 19.17 19.39 19.31 17.27 75.14
Total Income From Operations 1,780.75 1,748.59 1,617.13 1,810.22 1,777.18 6,953.12
Increase/Decrease in Stocks -190.46 61.21 -14.63 -4.78 -35.67 6.13
Consumption of Raw Materials 1,046.04 910.03 882.5 990.72 1,006.07 3,789.32
Purchase of Traded Goods 19.04 8.47 19.22 23.13 23.16 73.98
Employees Cost 227.2 197.75 193.91 201.99 187.04 780.69
Depreciation 74.55 55.81 50.55 46.19 43.56 196.11
Other Expenses 321.95 301.58 268.63 292.05 299.24 1,161.50
Total Expenditure 1,498.32 1,534.85 1,400.18 1,549.30 1,523.40 6,007.73
Operating Profit 282.43 213.74 216.95 260.92 253.78 945.39
Other Income 6.02 5.16 3.62 4.72 3.2 16.7
P/L Before Int., Excpt. Items & Tax 288.45 218.9 220.57 265.64 256.98 962.09
Interest 100.92 61.99 59.69 59.24 64.45 245.37
P/L Before Exceptional Items & Tax 187.53 156.91 160.88 206.4 192.53 716.72
Exceptional Item -40.37 2.65 -10.48 -30.87 -9.06 -47.76
P/L Before Tax 147.16 159.56 150.4 175.53 183.47 668.96
Tax 46.96 43.92 45.08 60.6 66.08 215.68
P/L After Tax from Ordinary Activities 100.2 115.64 105.32 114.93 117.39 453.28
PAT 100.2 115.64 105.32 114.93 117.39 453.28
Minority Interest -0.21 -- -- -- -- --
Share Of P/L Of Associates 0.27 1.13 5.32 3.34 0.73 10.52
Net Profit/(Loss) For the Period 100.26 116.77 110.64 118.27 118.12 463.8
Equity Share Capital 45.36 45.36 45.36 45.36 45.36 45.36
Reserves -- -- -- -- -- 1,703.12
Equity Dividend Rate (%) -- -- -- -- -- --
EPS (Rs.) [After Extraordinary items] 4.42 5.15 4.88 5.21 5.21 20.45
EPS (Rs.) [Before Extraordinary items] 4.42 5.15 4.88 5.21 5.21 20.45
The company is showing a steady top line growth in every quarter.
The Operating Profit margin of the company becomes 15.86% in the last quarter, compared to 12.22% in the
previous quarter.

Page 6 Source: Company, www.dynamiclevels.com
Balance Sheet
Consolidated Balance Sheet (Cr) 16-Mar 15-Mar 14-Mar 13-Mar 12-Mar EQUITIES AND LIABILITIES
SHAREHOLDERS FUNDS
Equity Share Capital 45.36 45.36 41.06 41.06 41.06
Total Share Capital 45.36 45.36 41.06 41.06 41.06
Reserves and Surplus 1,703.12 1,355.65 1,043.69 865.39 714.26
Total Reserves and Surplus 1,703.12 1,355.65 1,043.69 865.39 714.26
Money Received Against Share Warrants 0 0 12.37 0 0
Total Shareholder’s Funds 1,748.48 1,401.01 1,097.12 906.45 755.32
NON-CURRENT LIABILITIES
Long Term Borrowings 1,558.43 1,503.60 1,230.77 1,241.82 1,120.42
Deferred Tax Liabilities [Net] 435.51 319.82 252.42 192.05 147.56
Other Long Term Liabilities 306.54 330.11 341.98 342.95 344.02
Long Term Provisions 78.69 80.57 92.58 71.02 49.75
Total Non-Current Liabilities 2,379.17 2,234.10 1,917.75 1,847.84 1,661.75
CURRENT LIABILITIES
Short Term Borrowings 1,111.27 1,205.82 1,275.22 1,292.88 901.75
Trade Payables 955.37 1,054.53 1,053.23 899.92 1,284.52
Other Current Liabilities 744.27 751.53 531.72 431.5 412.91
Short Term Provisions 406 256.83 167.57 183.96 124.25
Total Current Liabilities 3,216.91 3,268.71 3,027.74 2,808.26 2,723.43
Total Capital And Liabilities 7,344.56 6,903.82 6,042.61 5,562.55 5,140.50
ASSETS
NON-CURRENT ASSETS
Tangible Assets 3,753.01 2,701.30 2,690.10 2,713.31 1,866.46
Intangible Assets 0.04 0 0.23 1.12 3.1
Capital Work-In-Progress 105.72 830.32 177.1 76.2 765.15
Fixed Assets 3,858.77 3,531.62 2,867.43 2,790.63 2,634.71
Non-Current Investments 139.76 131.25 102.82 103.87 100.69
Long Term Loans And Advances 204.6 186.52 136.51 186.56 74.44
Other Non-Current Assets 75.79 84.86 93.39 0 0
Total Non-Current Assets 4,278.92 3,934.25 3,200.15 3,081.06 2,809.84
CURRENT ASSETS
Current Investments 15.02 9.01 12.62 0 0
Inventories 872.52 875.03 936.79 933.75 781.85
Trade Receivables 1,402.71 1,434.58 1,335.08 1,049.94 1,008.54
Cash And Cash Equivalents 139.43 190.58 236.25 140.1 104.93
Short Term Loans And Advances 625.8 451.44 313.27 357.26 347.16
Other Current Assets 10.16 8.93 8.45 0.44 88.18
Total Current Assets 3,065.64 2,969.57 2,842.46 2,481.49 2,330.66
Total Assets 7,344.56 6,903.82 6,042.61 5,562.55 5,140.50

Page 7 Source: Company, www.dynamiclevels.com
Cash Flow
Cash Flow(Cr) 16-Mar 15-Mar 14-Mar 13-Mar 12-Mar
Net Profit/Loss Before Extraordinary Items And Tax 668.96 485.55 374.44 264.29 -23.00
Net Cash Flow From Operating Activities 903.00 734.15 654.81 -15.47 360.81
Net Cash Used In Investing Activities -506.04 -799.93 -227.62 -203.38 -611.53
Net Cash Used From Financing Activities -422.38 -1.22 -335.19 251.75 239.53
Foreign Exchange Gains / Losses -5.24 -5.77 4.08 2.27 1.65
Adjustments on Amalgamation / Merger / Demerger / Others 0 0 0 0 0
Net Inc/Dec In Cash And Cash Equivalents -30.66 -72.77 96.08 35.17 -9.54
Cash And Cash Equivalents Begin of Year 162.83 235.60 139.52 104.35 114.47
Cash And Cash Equivalents End Of Year 132.17 162.83 235.60 139.52 104.93
Revenue of JK Tyre by Geography
Revenue of JK Tyre by Product

Page 8 Source: Company, www.dynamiclevels.com
Shareholding Pattern
Shareholding Pattern 16-Jun 16-Mar 16-Dec
Promoter and Promoter Group (%) 52.34 52.34 1.93
Indian 52.34 52.34 1.93
Foreign NIL NIL NIL
Public Shareholding
Institutions (%) 9.88 10.67 12.2
Mutual Funds 0.05 0.02 0.71
Foreign Portfolio Investors 8.85 9.53 10.5
Financial Institutions/Banks (%) NIL NIL NIL
Insurance 0.87 0.87 0.87
Others NIL NIL NIL
Non Institutions (%) 37.15 36.36 34.83
Overseas Depositories (holding DRs) (balancing figure) NIL NIL NIL
Others NIL NIL NIL
Total no. of shares (cr.) 22.68 22.68 22.68
Promoter Holding Pledged (%) NIL NIL NIL
Category & Name of the Shareholders No. of
shareholder No. of fully paid up equity shares held Total no. shares held
Institutions 93 22417031 22417031
Mutual Funds 8 117577 117577
Financial Institutions/ Banks 26 239699 239699
Insurance Companies 4 1982010 1982010
Foreign Portfolio Investors 55 20077745 20077745
LSV EMERGING MARKETS EQUITY FUND LP 1 2540900 2540900
A number of Institutions, Mutual Funds and FPIs have their investment in JK Tyre.

Page 9 Source: Company, www.dynamiclevels.com
Peer Comparison
Peer Comparison
INSTRUMENT Price MKT CAP P/E Ratio PAT JUN' 16 PAT MAR' 16 PAT DEC' 15 PAT SEP' 15
JK TYRE 153.55 3551.9 7.66 100.26 116.77 110.64 118.27
BALKRISHNA INDUSTRIES 1131.2 1132 19.24 149.05 154.99 135.9 125.01
APOLLO TYRES 226.75 226.95 10.59 314.69 249.91 279.52 278.74
CEAT 1389.95 1390.9 12.64 104.06 104.69 113.39 107.4
Jk Tyre is trading at a low P/E of 7.66, where the average industry P/E is around 15. So there is a huge scope
for the share price to go up.
INSTRUMENT PRICE 1 WEEK 1 MONTH 3 MONTHS 6 MONTHS 1 YEAR
JK TYRE 154.1 5.49 7.78 68.66 88.67 49.21
BALKRISHNA INDUSTRIES 1132 13.08 28.86 70.1 87.03 73.67
APOLLO TYRES 226.95 3.43 10.44 51.26 35.01 16.94
CEAT 1390.9 5.16 37.3 63.42 28.19 8.25
From the above table it is clear that the stock has outperformed the Tyre industry in last 3months,6
months and 1 year time frame.

Page 10 Source: Company, www.dynamiclevels.com
Indian Tyre Industry
Overall domestic demand for tyres has grown by 6%. However in the truck bias segment, demand continued to decline at a rate of 7%. The shift to radials continued in the OEM and replacement segments. The level of radialisation reached 44% with the OEM segment at 72% and replacement at 33%. There was a healthy growth in the demand for TBR tyres by over 47%. However, domestic manufacturers were impacted by the unabated growth in imported truck radials which grew by 65%. Imports from China, which accounted for 90% of the truck radial imports, more than doubled over the previous year. The inverted duty structure favouring inputs of finished goods over raw materials and non-levying of anti-dumping duty accelerated rampant increase in dumping of tyres from China. The demand for LCV tyres declined by 6% while the SCV segment witnessed a growth of 2%. Radialisation in the segment reached a level of 28%. In the passenger tyre segment, there was steady growth of over 7% driven by replacement and OE demand. Imported tyres impacted the economy segment, like used cars and taxis. In line with a drop in tractor sales and muted demand from the agricultural sector, tractor tyre demand fell 13%. Having touched new lows in FY 16, the mining sector is expected to rebound in the current year. A stable raw material scenario enabled the tyre industry to counter threats posed by the challenging economic scenario. The industry reported an overall drop in prices in the wake of market pressures resulting in stagnation in top line growth.
JK Tyre grew by 9% vis-à-vis a domestic industry growth of 6%.
Capacity expansions at the all radial
TBR and PCR plants at Chennai were successfully completed. The current year will see tangible benefits of enhanced capacities emerging.
Expansion of the PCR capacity at
Tornel (Mexico) was completed in
last financial year.

Page 11 Source: Company, www.dynamiclevels.com
Rubber – a major raw material in
Tyre Industry
Rubber increased 0.3 JPY/kg or 0.17% to 174.80 on Friday October 7 from 174.50 in the previous trading session.
Rubber changed +7.04% during the last week, +11.98% during the last month and +2.88% during the last year.
Historically, Rubber reached an all time high of 526.40 in February of 2011 and a record low of 146.40 in January of
2016.
Since rubber is a major raw material in Tyre manufacturing, the earnings of the company will automatically increase
by decreasing prices of rubber. So there is an inverse correlation between rubber price and share prices of tyre
industry.

Page 12 Source: Company, www.dynamiclevels.com
Investment Rationale
The company had started the expansion project in Chennai which is one of the most state-of-the-art plants in
India today to make radial tyres; both truck as well as PCR. This expansion project was to the tune of 1430
Crores which has been completed taking. They now have passenger radial capacity of almost 10 million tyres
per annum and TBR capacity at Chennai specifically at 12 lakh tyres per annum.
The company has TBR capacity in erstwhile plant in Mysore taking their overall TBR capacity to close to 35 lakh
tyres per annum. So this brings them to the one of the largest players in the state in trucks.
The company have adopted both IT as well as the latest thinking in supply chain to deliver tyres to right up to
the doorstep of thier key consumers both fleets as well as dealerships across the country. This network of 4000
dealers and approximately 1000 direct fleets now is serviced in almost real time across the country.
The export markets obviously saw some resistance, some headwinds. China played a huge role in the world
market, depressed prices. The Company also saw some key economies where the Company took a little bit of
beating particularly South America and the Middle-East particularly in the middle of the year, which affected
exports to an extent but the company is recovering.
Ranked 25th largest tyre manufacturing company
In 2016: Acquired Cavendish Industries Ltd. (CIL)
Leadership - No.1 position in Truck/Bus Truck Bus Radial Radials
Planned in 2016-17 • 100 New Steel wheels targeting top cities • 100 New Xpress wheels targeting small towns
• 100 New multibrand outlets
India’s First and Only Tyre Superbrand
Ranked No. 1 in Customer Satisfaction by JD Power Asia Pacific Study 2015
JK Tornel, Mexico – a Strategic Acquisition
Low cost acquisition of additional capacity
Free access to NAFTA & other trade blocks
Enlarge JK Tyre’s global footprint
North America and emerging Latin America markets
Present Market Share: • Truck Bias: 88% • LCV Bias: 85% • Passenger Line Radials: 8% • LTR: 6%
We initiate coverage JK TYRE & INDUSTRIES LIMITED as a BUY @150 with an immediate target of Rs 165
representing a potential upside of 10% from the buy price.

Page 13 Source: Company, www.dynamiclevels.com
Disclaimer: Research Disclaimer and Disclosure inter-alia as required under Securities and Exchange Board of India (Research Analysts) Regulations, 2014. Dynamic Equities Pvt. Ltd. is a member of National Stock Exchange of India Ltd. (NSEIL), Bombay Stock Exchange Ltd (BSE), Multi Stock Exchange of India Ltd (MCX-SX) and also a depository participant with National Securities Depository Ltd (NSDL) and Central Depository Services Ltd. (CDSL). Dynamic is engaged in the business of Stock Broking, Depository Services, Investment Advisory Services and Portfolio Management Services. Dynamic Equities Pvt. Ltd. is holding company of Dynamic Commodities Pvt. Ltd., a member of Multi Commodities Exchange (MCX) & National Commodity & Derivatives Exchange Ltd.(NCDEX). We hereby declare that our activities were neither suspended nor we have defaulted with any stock exchange authority with whom we are registered. SEBI, Exchanges and Depositories have conducted the routine inspection and based on their observations have issued advise letters or levied minor penalty on for certain operational deviations. Answers to the Best of the knowledge and belief of Dynamic/ its Associates/ Research Analyst who prepared this report
DYANMIC/its Associates/ Research Analyst/ his Relative have any financial interest in the subject company? No
DYANMIC/its Associates/ Research Analyst/ his Relative have actual/beneficial ownership of one per cent or more securities of the subject company? No
DYANMIC/its Associates/ Research Analyst/ his Relative have any other material conflict of interest at the time of publication of the research report or at the time of public appearance? No
DYANMIC/its Associates/ Research Analyst/ his Relative have received any compensation from the subject company in the past twelve months? No
DYANMIC/its Associates/ Research Analyst/ his Relative have managed or co-managed public offering of securities for the subject company in the past twelve months? No
DYANMIC/its Associates/ Research Analyst/ his Relative have received any compensation for investment banking or merchant banking or brokerage services from the subject company in the past twelve months? No
DYANMIC/its Associates/ Research Analyst/ his Relative have received any compensation for products or services other than investment banking or merchant banking or brokerage services from the subject company in the past twelve months? No
DYANMIC/its Associates/ Research Analyst/ his Relative have received any compensation or other benefits from the Subject Company or third party in connection with the research report? No
DYANMIC/its Associates/ Research Analyst/ his Relative have served as an officer, director or employee of the subject company? No
DYANMIC/its Associates/ Research Analyst/ his Relative have been engaged in market making activity for the subject company? No
General Disclaimer: - This Research Report (hereinafter called “Report”) is meant solely for use by the recipient and is not for circulation. This Report does not constitute a personal recommendation or take into account the particular investment objectives, financial situations, or needs of individual clients. The recommendations, if any, made herein are expression of views and/or opinions and should not be deemed or construed to be neither advice for the purpose of purchase or sale of any security, derivatives or any other security through Dynamic nor any solicitation or offering of any investment /trading opportunity on behalf of the issuer(s) of the respective security (ies) referred to herein. These information / opinions / views are not meant to serve as a professional investment guide for the readers. No action is solicited based upon the information provided herein. Recipients of this Report should rely on information/data arising out of their own investigations. Readers are advised to seek independent professional advice and arrive at an informed trading/investment decision before executing any trades or making any investments. This Report has been prepared on the basis of publicly available information, internally developed data and other sources believed by Dynamic to be reliable. Dynamic or its directors, employees, affiliates or representatives do not assume any responsibility for, or warrant the accuracy, completeness, adequacy and reliability of such information / opinions / views. While due care has been taken to ensure that the disclosures and opinions given are fair and reasonable, none of the directors, employees, affiliates or representatives of Dynamic shall be liable for any direct, indirect, special, incidental, consequential, punitive or exemplary damages, including loss profits arising in any way whatsoever from the information / opinions / views contained in this Report. The price and value of the investments referred to in this Report and the income from them may go down as well as up, and investors may realize losses on any investments. Past performance is not a guide for future performance. Dynamic levels do not provide tax advice to its clients, and all investors are strongly advised to consult with their tax advisers regarding taxation aspects of any potential investment. Opinions expressed are our current opinions as of the date appearing on this Research only. We do not undertake to advise you as to any change of our views expressed in this Report. User should keep this risk in mind and not hold dynamic levels, its employees and associates responsible for any losses, damages of any type whatsoever. Dynamic and its associates or employees may; (a) from time to time, have long or short positions in, and buy or sell the investments in/ security of company (ies) mentioned herein and it may not be construed as potential conflict of interest with respect to any recommendation and related information and opinions. Without limiting any of the foregoing, in no event shall Dynamic and its associates or employees or any third party involved in, or related to computing or compiling the information have any liability for any damages of any kind. We and our affiliates/associates, officers, directors, and employees, Research Analyst(including relatives) worldwide may: (a) from time to time, have long or short positions in, and buy or sell the securities thereof, of company (ies) mentioned herein or (b) be engaged in any other transaction involving such securities and earn brokerage or other compensation or act as a market maker in the financial instruments of the subject company/company (ies) discussed herein or act as advisor to such company (ies) or have other potential/material conflict of interest with respect to any recommendation and related information and opinions at the time of publication of Research Report. Dynamic may have proprietary long/short position in the above mentioned scrip(s) and therefore may be considered as interested. The views provided herein are general in nature and does not consider risk appetite or investment objective of particular investor; readers are requested to take independent professional advice before investing. This should not be construed as invitation or solicitation to do business with Dynamic. Dynamic Equities Pvt. Ltd. are also engaged in Proprietary Trading apart from Client Business.
https://www.dynamiclevels.com/en/disclaimer